studies on iron biofortified maize
TRANSCRIPT

STUDIES ON IRON BIOFORTIFIED MAIZE
by Mercy Gloria Lung'aho
This thesis/dissertation document has been electronically approved by the following individuals:
Glahn,Raymond P. (Chairperson)
Haas,Jere Douglas (Minor Member)
Hoekenga,Owen (Additional Member)
Miller,Dennis D. (Field Appointed Minor Member)

STUDIES ON IRON BIOFORTIFIED MAIZE
A Dissertation
Presented to the Faculty of the Graduate School
of Cornell University
In Partial Fulfillment of the Requirements for the Degree of
Doctor of Philosophy
by
Mercy Gloria Lung’aho
August 2010

© 2010 Mercy Gloria Lung’aho

STUDIES ON IRON BIOFORTIFIED MAIZE
Mercy Gloria Lung’aho, Ph. D.
Cornell University 2010
Iron deficiency is an important public health problem that is estimated to affect
over one-half the world population. Improving the nutritional quality of staple food
crops such as maize, by developing varieties with high bioavailable iron represents a
sustainable and cost effective approach to alleviating iron malnutrition. The aim of our
study was to use a Caco-2 cell / quantitative trait loci (QTL) / and poultry approach to
discover the genes that influence maize grain iron concentration and amount of
bioavailable iron. After several breeding cycles guided by measurements of iron
bioavailability with the Caco-2 cell model, we identified two maize lines with
identical grain iron concentration (20 µg/g), but one line contained double the amount
of bioavailable iron (p < 0.001). Three QTL were found to influence the
bioavailability of iron in the two maize lines. Measurement of iron status in a poultry
model confirmed the results of the Caco-2 cell model. Some of the lines screened
using the Caco-2 cell / QTL / and poultry approach have been grown at multiple
locations and data show a strong genotype × environment (GxE) interaction. We
conclude that conventional breeding can significantly improve iron bioavailability in
maize grain and that the GxE effect plays a major role in iron bioavailability. Human
feeding trials should be conducted to determine the efficacy of consuming the high
bioavailable iron maize.

iii
BIOGRAPHICAL SKETCH
Mercy Gloria Lung’aho was born and raised in Kenya. Mercy attended Jomo
Kenyatta University of Agriculture and Technology and graduated with her Bachelor
of Science in Food Science in April 2003. She joined Cornell University for her
Master of Science in Food Science in August 2005. In August 2007, she began her
Ph.D. program in Food Science at Cornell University under the supervision of Dr.
Raymond P. Glahn.

iv
Dedicated to my precious son, Preston.
With Jehovah’s blessing,
may all your dreams come true.

v
ACKNOWLEDGMENTS
This dissertation would not have been possible without the constant help,
support, encouragement and guidance of my academic committee, mentors, members
of my lab, the Cornell University Statistical Unit, my dedicated friends and family.
I owe my deepest gratitude to my advisor Dr. Raymond P. Glahn. Thank you
for the guidance, support, funding and encouragement you gave me throughout my
graduate research in your lab. You allowed me the freedom to find myself, realize my
potential and grow as a scientist, and I am very grateful.
It has been an honor to work with two world renowned scientists – Dr. Dennis
Miller and Dr. Jere Haas. Dr Miller, above academic training, you have taught me so
much about being humble, approachable and collegiate in my manner and interactions.
I hope to draw from your exceptional legacy. Dr Haas, I admire your brilliance,
insight, and foresight in your area of research. Your very presence in my committee
motivated me to exert myself vigorously and better both my understanding of broader
nutrition issues and the depth my research work. You have set a high standard for
excellence, from which I hope to learn and better myself.
I would also like to thank Dr. Owen Hoekenga for his support and help in the
maize project. You have taught me a great deal and I could not have achieved this
without your help.
It would like to thank my mentors and professors at Cornell University who
have had a major impact on my life. I would like to especially mention Dr. Charles
McCormick, Dr Richard Kiely and Prof Per Pinstrup-Andersen. I am grateful to Dr.
McCormick for teaching me all I know about micronutrients and how to enjoy
imparting knowledge in the classroom, Dr. Kiely for helping me find my professional
identity, and Prof. Pinstrup-Andersen for helping me find the courage to face daunting
challenges with courage.

vi
I would like to thank all members of the Glahn and Hoekenga research groups.
I would like to particularly thank Dr. Mike Rutzke for keeping up with my tight
schedule and going the extra mile to get my ICP data ready on time. I would like to
thank Larry Heller for his help with phytate analysis. I would like to thank Dr.
Zhiqiang Cheng who was also my office mate for his support and encouragement
especially when the going got tough. I am forever indebted to Yongpei Chang (Pei
Pei) who has been my guardian angel throughout my research. Pei Pei was there to
encourage me, help me out with experiments and was a sure shoulder to lean on when
I needed one. Pei Pei, you made my crazy schedules of coming into the lab at 5am or
staying late till 2am so manageable and normal, I cannot thank you enough.
I would like to thank Dr. Bill Barnett of WordCraft, Ithaca for editing my work
and helping me stay on track with my ambitious schedule. I would also like to thank
Françoise Vermeylen for her help with statistical analysis. Françoise, thank you for
being so patient; I would not have made it without your constant help and support.
Finally, I would like to thank all my loving family and friends. I would like to
especially mention the following friends who made the cold winter months so
bearable: Millie and Bill Latham for making sure I was warm and well fed, Pat and
Bob Wilkins for empathizing with and being there for me, and Dela Kusi-Appouh for
being my pillar of support. To my husband Paswel, my mom Dr. Shigali, my sister
Faith and my brothers Antony and Blessing; thank you for your love, faith, and
support. Thank you for taking this journey with me, and for being there when I needed
you the most.
Life on the hill has been memorable, challenging but rewarding. I will miss
Ithaca for the subtle beauty of its wintery snow, the early blossom of spring, the long
days of summer, and the fascinating colors of fall foliage but Cornell will always be
close to my heart. Thank you for the experience. Thanks for everything.

vii
TABLE OF CONTENTS
Biographical Sketch iii
Dedication iv
Acknowledgements v
Table of Contents vii
List of Figures viii
List of Tables x
List of Abbreviations xii
Chapter 1. Introduction 1
Chapter 2. Enhancing iron bioavailability of maize using a Caco-2 cell /
quantitative trait loci model 34
Chapter 3. Assessment of genotype x environment interaction in iron
biofortified maize 57
Chapter 4. Assessment of iron bioavailability from iron biofortified maize 85
Chapter 5. A conceptual framework for biofortification 112

viii
LIST OF FIGURES
Figure 1.1. Depletion of body iron resulting in iron deficiency and anemia 2
Figure 1.2. Schematic diagram of nonheme iron uptake at the enterocyte 10
Figure 1.3. Schematic diagram of in vitro digestion/Caco-2 cell iron model 18
Figure 1.4. Schematic diagram of the production of recombinant inbred lines
(RIL) and near isogenic lines (NIL) 20
Figure 1.5. Schematic diagram of homologous chromosome 22
Figure 1.6. Tenets for biofortification success 24
Figure 2.1. Caco-2 cell ferritin formation. The amount of bioavailable iron in the
Mo17 lines assessed using the Caco-2 cell model 45
Figure 2.2. Caco-2 cell ferritin formation. The amount of bioavailable iron in the
B73 lines assessed using the Caco-2 cell model 46
Figure 2.3. Caco-2 cell ferritin formation. The amount of bioavailable iron in the
hybrid lines assessed using the Caco-2 cell model 47
Figure 2.4. Caco-2 cell ferritin formation. The amount of bioavailable iron in the
Mo17 lines (2008 harvest) assessed using the Caco-2 cell model 49
Figure 2.5. Caco-2 cell ferritin formation. The amount of bioavailable iron in the
B73 lines (2008 harvest) assessed using the Caco-2 cell model 50
Figure 3.1. Caco-2 cell ferritin formation. The amount of bioavailable iron in
G×E maize lines assessed with the use of the Caco-2 cell model 71
Figure 3.2. One-way analysis of variance (ANOVA) for iron extracted soil by
location 79
Figure 3.3. One-way ANOVA for total soil iron by location 80
ix
Figure 4.1. One way analysis of bioavailable iron in inbred parents of hybrids
tested in the poultry feeding trial 90
Figure 4.2. Overview of the study design 94
Figure 4.3. Caco-2 cell ferritin formation. The amount of bioavailable iron in
maize hybrids (daughter lines) assessed with the use of the Caco-2 cell model 98
Figure 4.4. Hemoglobin trend during the poultry feeding trial 101
Figure 4.5. Liver iron concentration 102
Figure 4.6. Hemoglobin maintenance efficiency values 104
Figure 5.1. Conceptual framework for biofortification 114
Figure 5.2. Grain iron concentration of maize grown in New York and North
Carolina 119

x
LIST OF TABLES
Table 1.1. Historical & current methods used to assess aspects of iron
bioavailability 17
Table 2.1. Grain iron concentration of maize lines grown in Aurora, NY in 2007 42
Table 2.2. Grain iron concentration of maize lines grown in Aurora, NY in 2008 44
Table 2.3. Grain iron concentration and bioavailable iron from inbreeds 96 and
103 48
Table 3.1. Genotype description of the maize varieties 61
Table 3.2. Brief description of selected locations where trials were planted 63
Table 3.3. Grain iron concentration of maize varieties grown in five diverse
locations 68
Table 3.4. Fixed-effects tests for grain iron concentration (JMP v7) 69
Table 3.5. Comparison of grain iron concentration across environments
(JMP v7) 69
Table 3.6. Comparison of grain iron concentration between genotypes (JMP v7) 70
Table 3.7. Fixed-effects tests for grain iron bioavailability (JMP v7) 72
Table 3.8. Comparison of grain iron bioavailability across environments
(JMP v7) 72
Table 3.9. Comparison of grain iron bioavailability among genotypes (JMP v7) 72
Table 3.10. Least square means differences in grain iron bioavailability (Iowa) 74
Table 3.11. Least square means differences in grain iron bioavailability
(Missouri) 75
Table 3.12. Least square means differences in grain iron bioavailability
(North Carolina) 76

xi
Table 3.13. Least square means differences in grain iron bioavailability
(New York)
77
Table 3.14. Least square means differences in grain iron bioavailability
(Pennsylvania) 77
Table 3.15. Highlights of soil data collected from locations where trials were
planted 78
Table 3.16. Pairwise correlations for grain iron concentration, grain iron
bioavailability, soil extracted iron, total soil iron and soil pH 81
Table 4.1. Diet composition and iron concentration data for poultry trial 96
Table 4.2. Cumulative feed intake, daily iron intake, and body weight of the
chicks 99
Table 4.3. Total body hemoglobin iron 103
Table 5.1. Summary of the research conducted and lessons learned 116

xii
LIST OF ABBREVIATIONS
Dcytb Duodenal cytochrome b
DMT1 Divalent metal transporter 1
DNA Deoxyribonucleic acid
DW Dry weight
Fe, Fe2+,
Fe3+
Iron, ferrous iron, ferric iron
Fp Ferroportin
G×E Genotype by Environment interaction
HFE Human hemochromatosis protein
HIV Human immunodeficiency virus
Hp Hephaestin
IBM Intermated B73 × Mo17
ID, IDA Iron Deficiency, Iron Deficiency Anemia
IREs, IRPs Iron regulatory elements, Iron regulatory proteins
mRNA Messenger ribonucleic acid
NIL Near isogenic lines
ppm Parts per million
QTL Quantitative trait loci
RIL Recombinant inbred lines
SEM Standard error of mean
Tf, TfR Transferrin, Transferrin receptor
UN United Nations
UTR Untranslated region
WHO World Health Organization

1
CHAPTER 1
INTRODUCTION
The problem
Iron deficiency (ID), which affects more than two billion people globally, is by
far the most widespread micronutrient deficiency in the world. Its prevalence in
women of childbearing age and young children, especially those in developing
countries, is high and often due to multifactorial causation (Zimmermann & Hurrell,
2007; World Health Organization [WHO], 2001). Iron deficiency develops after iron
stores in the liver, bone marrow, and spleen are depleted and erythropoiesis is
compromised or diminished. If not corrected, the resulting depletion of storage iron
and reduction in transport iron typically lead to a reduction in hemoglobin
concentration, which is an indicator of iron deficiency anemia (IDA; see Figure 1.1,
Beard, Dawson & Piñero, 1996).
Nutritional IDA often results when an individual‘s dietary iron supply cannot
meet the physiological requirements for the synthesis of functional iron compounds
such as hemoglobin. Such a condition can be caused by either low levels of iron intake
or poor bioavailability of dietary iron, particularly in populations that consume
monotonous plant-based diets with little or no intake of iron-rich foods such as liver,
pork, or other meat products. Non-nutritional factors such as malaria, HIV infection,
and other chronic diseases are also associated with anemia. Helminth infections also
contribute to anemia, principally by increasing iron losses and further exacerbating
any existing iron deficiency (Underwood, 2001; Allen & Casterline-Sabel, 2001).
The major consequences of IDA include impaired growth, retarded
psychomotor development and poor cognitive development in children, a damaged
immune mechanism associated with increased morbidity and mortality rates in all age

2
groups, and reduced work capacity in adults (WHO, 2001; Neumann, Gewa & Bwibo,
2004).
Figure 1.1: Depletion of body iron resulting in iron deficiency and anemia
This overview chapter will briefly discuss the main strategies for correcting
ID, focus attention on why biofortification is needed, highlight aspects of iron
homeostasis in the plant and animal kingdom, and lastly consider our research
interests and objectives.
Strategies for addressing nutritional iron deficiency
Traditionally, three main strategies for correcting ID have been employed in
various populations. These include:

3
1. Dietary diversification and modification: The monotonous plant diet, and
low iron absorption from such diets have been identified as a major cause of
nutritional iron deficiency in many populations. The goal of dietary diversification and
modification is thus to improve dietary iron intake and bioavailability. This strategy
promotes intake of foods low in iron inhibitors and the use of iron-rich foods like
meats in conjunction with other foods such as orange juice or lime juice that are rich
in ascorbic acid, which is known to enhance iron bioavailability. Properly designed
dietary modification also encourages reduced consumption during meals of phenolic-
rich foods or beverages such as teas and coffee that are known to inhibit iron
bioavailability (Ruel & Levin, 2002; Hallberg & Rossander, 1982a, 1984). Although
dietary diversification and modification is an ideal approach, it is difficult to achieve
the desired results without a strong educational component. It is difficult, that is, to
change traditional dietary behaviors or preferences and doing so may be costly in
many poor resource areas where meat is expensive (Zimmermann & Hurrell, 2007).
2. Iron supplementation: Iron supplementation is a public health intervention
targeted at groups at high risk of developing IDA, providing high doses of iron in the
form of tablets for adults or drops for children. Supplementation programs can be cost
effective, but constraints such poor infrastructure, poor public health management
policies, and ineffective institutions may diminish their effectiveness and outreach
success, particularly in developing countries. Poor compliance at the individual level
(as a result of side effects such as nausea and stomach pain) may also limit the success
of supplementation programs. In addition, recent studies show that untargeted iron
supplementation in children living in malaria-endemic regions may carry increased
risk of morbidity and mortality (Zimmermann & Hurrell, 2007; Sazawal et al., 2006).
3. Iron fortification: Iron fortification - adding iron to foods - is a prophylactic
approach that is probably the most practical and cost-effective long-term solution to

4
IDA, but its effectiveness depends on the quality of the iron fortificant and the
frequency of intake of the fortified food. The quality of an iron fortificant depends on
its bioavailability and compatibility with the food vehicle of choice. Iron salts such as
NaFeEDTA, ferrous sulphate, and ferrous fumarate have been shown to exhibit
reasonable bioavailability. These salts have also been shown to retain the taste and
appearance characteristics of food vehicles by not causing off-flavors or color changes
when used in appropriate concentrations (United Nations [UN], 2001). As for
frequency of use, in many developing countries the use of fortified foods depends
mainly on socioeconomic status. Resource-poor households that are most frequently
afflicted by IDA lack both market and economic access to fortified products. More
importantly, in these countries the major constraint on the success of food fortification
is the need for central processing facilities, as poor populations seldom purchase
processed foodstuffs, instead growing and consuming their own food (Zimmermann &
Hurrell, 2007).
Based on this overview of the conventional approaches to addressing iron
deficiency, it is clear that a new and complementary strategy that provides more iron
at an affordable cost and does so principally via the agricultural system is needed to
further reduce and better address nutritional ID among resource-poor populations
worldwide.
Biofortification of staple foods
Because agriculture is the principal source of most micronutrients, it has been
postulated that micronutrient malnutrition as it exists today is the consequence of
malfunctioning food systems that fall short of delivering sufficient nutrients to meet
human requirements. Thus efforts are now being dedicated to addressing these

5
deficiencies via agricultural interventions aimed at improving the micronutrient
quality of foods (Graham et al., 2007).
Biofortification of staple foods as lead by HarvestPlus® focuses on increasing
the pro-vitamin A, iron, and zinc content of crops using plant breeding strategies
(Nestel et al., 2006). Research has shown that the enrichment traits available for iron
and zinc within the genomes of staple crops allow for sizeable increases in the
micronutrient content of these foods without diminishing yields. Moreover,
micronutrient-dense seeds can increase crop yields even when planted in
micronutrient-poor soils. And if the enrichment traits appear to be relatively stable
across various soil types and climatic environments, it is possible for biofortification
to target resource-poor populations around the globe while complementing and
enhancing other nutrition interventions (Welch & Graham, 2002).
The advantage of biofortification lies in its ability to target both the root causes
of nutritional deficiencies (dysfunctional food systems) and at-risk populations (rural
poor who grow and consume their own foods). In the case of iron deficiency, iron
biofortification of staple foods that dominate the diets of resource-poor households can
help increase dietary iron intake and/or absorption in such households, whose
members form the bulk of those suffering from nutritional iron deficiency and its
consequences (Nestel et al., 2006). The success of biofortification as an agricultural
intervention will depend on the extent to which such iron-biofortified lines can
maintain or improve the iron status of iron deficient populations. Its effectiveness will
be influenced by: i) iron concentration of staple food, ii) iron bioavailability, iii)
amount of staple food consumed, and iv) potential of biofortified food to increase iron
status. Hence, our goal is to determine explicitly whether nutritionally enhanced crop
lines significantly improve the amount of dietary iron absorbed from iron-biofortified
foods.

6
Iron Nutrition
Iron is an abundant mineral element in the earth‘s crust that is vital to both
plants and animals. In plants, iron is involved in redox reactions, it facilitates carbon,
sulfur, and nitrogen assimilation, and it is critical for cholorphyll formation,
photosynthesis, and respiration (Taiz & Zeiger, 2006). Iron uptake is therefore tightly
regulated to prevent iron toxicity and, yet provide sufficient iron to enable proper
function (Theil & Briat, 2004). We cannot over-emphasize the importance of iron in
the human diet. It is an essential mineral for life, largely because of its fundamental
role in oxygen transport and energy metabolism. As a result of the role iron plays in
human health and disease, intestinal iron absorption and its regulation have been the
focus of intense research for several decades (Yip, 2001).
Plant iron homeostasis
Iron homeostasis in plants is a dynamic process resulting from the coordinated
regulation of a series of processes beginning with iron uptake from the rhizosphere
and proceeding through iron storage in various vegetative organs. This process
depends on a plant‘s genotype and nutritional status as well as on other environmental
conditions such as soil pH and soil inorganic matter concentration (Theil & Briat,
2004; Grusak, 2001).
A plant‘s ability to absorb iron from the soil will often be limited by its
availability at the surface of the root. In response to deficiencies, plant roots solubilize
and absorb iron using one of two strategies (Hirsch & Sussman, 1999):
Iron uptake in strategy-I: Strategy-I, which is characterized by an increase in
the reducing capacity of roots, is evident in dicotyledonous plants such as beans and
non-graminaceous monocotyledonous plants such as coconut (Hirsch & Sussman,
1999). The first step in strategy-I is soil acidification. Roots first solubilize Fe3+
by

7
acidifying the rhizosphere with protons and small organic acids in particular citric and
malic acids, which increases ferric iron solubility and availability (Taiz & Zeiger,
2006). The next step is the reduction of ferric iron to the more soluble ferrous form.
Root plasma membranes contain iron-chelating reductase enzymes that have the
capacity to alter the redox state of iron prior to membrane influx (Taiz & Zeiger,
2006). For example, in Arabidopsis, ID induces the synthesis of FRO2, a ferric-chelate
reductase that reduces ferric iron to ferrous iron (Robinson et al., 1999). The last step
in strategy-I is iron uptake, in which Fe2+
is absorbed from the rhizosphere into the
cytoplasm via a transporter. In Arabidopsis, for example, an iron-regulated transporter
1 (IRT1) transports Fe2+
into the cytoplasm.
Iron uptake in strategy-II: Strategy-II, which is present in grasses, is
characterized by the secretion of ferric chelating compounds like mugeneic acids
(MA). These compounds are also known as phytosiderophores (Hirsch & Sussman,
1999). The first step in strategy-II involves the biosynthesis of MA from
nicotianamine in the roots. The second step is the secretion of MA into the
rhizosphere. This is followed by the chelation of Fe3+
by MA (Sugiura & Nomoto,
1984), and the resulting MA–Fe3+
complex is then taken up into the cytoplasm via a
plasma-membrane transporter (Hirsch & Sussman, 1999; Römheld & Marschner,
1986).
Roots can also excrete iron chelators such as malic acid, citric acid, or
phenolics to form complexes with Fe3+
, which are then absorbed by the plant. For
example, in grasses such as corn or barley, roots secrete a siderophore, which forms
highly stable complexes with Fe3+
that are then taken up by the root via the Fe3+
-
siderophore transport system (Taiz & Zeiger, 2006).
In addition to physiological adaptation, plants can undergo root morphology
changes so as to increase the root surface area and thus absorb more iron. In

8
Arabidopsis, for example, iron deficiency induces the formation and elongation of root
hairs; in red clover (Trifolium pretense L.) it increases lateral root length; and in
sunflowers it results in swelling at the root tips (Jin et al., 2008; Schmidt, 1999;
Landsberg 1996).
A study of iron uptake in plants, focusing in particular on the presence of ID,
shows complex, highly regulated interactions between plant roots and the rhizosphere
(Schmidt, 1999), revealing the formidable challenges involved in breeding for
increased iron in food crops. More information is required to further comprehend iron
homeostasis in plants. Fortunately, ongoing research on various crops such as
Arabidopsis, maize and rice continues to reveal the molecular mechanisms governing
iron homeostasis in plants (Krämer, Talke & Hanikenne, 2007). This new found
knowledge will be instrumental in guiding plant breeding strategies for iron-
biofortified staple foods.
Human iron homeostasis
Iron Function: Iron-containing compounds in the body can be classified into
two groups: functional iron in the form of hemoglobin, myoglobin, and cytochromes;
and storage iron in the form of ferritin and hemosiderin - a water insoluble degradation
product of ferritin (Stipanuk 2000; Yip, 2001; Institute of medicine [IOM] 2001).
About two-thirds of the iron in the body is present in the erythrocytes as
hemoglobin, a molecule composed of four units each containing one heme group and
one protein chain. In hemoglobin iron serves as a carrier of oxygen from the lungs to
the tissues. Myoglobin is an oxygen storage protein located in the cytoplasm of muscle
cells with a structure similar to that of hemoglobin, but it has only one heme unit and
one globin chain. In myoglobin, iron controls the rate of oxygen diffusion from
capillary red blood cells to the cytoplasm and mitochondria of muscle cells.

9
Cytochromes include several iron-containing enzymes that have one heme group and
one globin protein chain. These enzymes act as electron carriers within the cell. Their
role in oxidative metabolism is to transfer energy within the cell and, more
specifically, in the mitochondria. Other key functions of iron-containing enzymes
include the synthesis of steroid hormones and bile acids; detoxification of foreign
substances in the liver; and signal controlling in some neurotransmitters, such as the
dopamine and serotonin systems in the brain (Stipanuk 2000; Yip, 2001; IOM 2001).
Storage iron comprises 20-30% of total body iron and is especially important
in young children and women of childbearing age as a reservoir during emergency
blood loss. Ferritin and hemosiderin are stored mainly in the liver, spleen, and bone
marrow and are used primarily for the production of hemoglobin as well as for
meeting other cellular iron needs (Stipanuk 2000; Yip, 2001; IOM 2001).
Iron Absorption: The capacity of iron to either accept or donate electrons and
readily interchange between Fe2+
and Fe3+
makes it an essential micronutrient for life,
as it plays a crucial role in a number of processes (Yip, 2001). Nevertheless, this redox
activity can also result in the production of oxygen-free radicals, which can damage
various cellular components. Thus iron levels must be tightly controlled so as to
provide for cellular needs without developing the toxicity caused by an excess of iron.
Since the body lacks a discrete mechanism for the active excretion of iron, its levels
are regulated at the point of absorption, primarily in the proximal small intestine
(Frazer & Anderson, 2005).
There are two pathways for the absorption of iron in humans. One supports the
uptake of heme iron derived from hemoglobin and myoglobin in meats, while the
other mediates the absorption of non-heme iron (Yip, 2001). This discussion will
focus mainly on the absorption of non-heme iron.
10
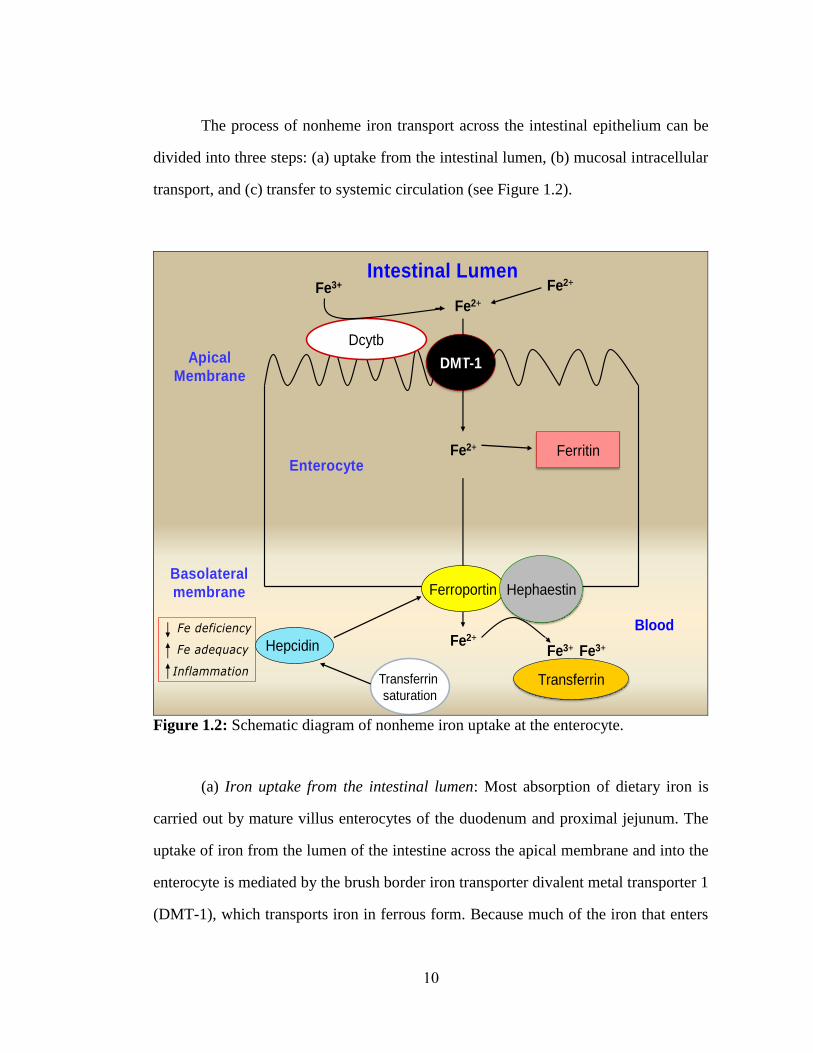
The process of nonheme iron transport across the intestinal epithelium can be
divided into three steps: (a) uptake from the intestinal lumen, (b) mucosal intracellular
transport, and (c) transfer to systemic circulation (see Figure 1.2).
DMT-1
Dcytb
Fe3+
Fe2+
Fe2+
Fe2+ Ferritin
Fe2+
Ferroportin
Intestinal Lumen
Blood
Transferrin
Fe3+ Fe3+
Hephaestin
Enterocyte
Apical
Membrane
Basolateral
membrane
HepcidinFe adequacy
InflammationTransferrin
saturation
Fe deficiency
Figure 1.2: Schematic diagram of nonheme iron uptake at the enterocyte.
(a) Iron uptake from the intestinal lumen: Most absorption of dietary iron is
carried out by mature villus enterocytes of the duodenum and proximal jejunum. The
uptake of iron from the lumen of the intestine across the apical membrane and into the
enterocyte is mediated by the brush border iron transporter divalent metal transporter 1
(DMT-1), which transports iron in ferrous form. Because much of the iron that enters

11
the lumen of the duodenum is in ferric form it is reduced, likely enzymatically, by a
brush border ferric reductase known as duodenal cytochrome b (Dcytb; see Frazer &
Anderson, 2005).
(b) Mucosal intracellular iron transport: The intracellular movement of iron
from the brush border membrane to the basolateral membrane is not completely
understood. Some suggest that intracellular iron may be bound to chaperone molecules
to maintain its solubility, but to date none have been identified—although DMT-1 has
been proposed as one of the potential carrier proteins (Ma et al., 2002, Yeh et al.,
2008). Iron not transferred to the body is incorporated into the iron storage molecule
ferritin and is lost in the feces when the cell is ultimately sloughed at the villus tip
(Frazer & Anderson, 2005).
(c) Iron transfer to systemic circulation: The transfer of iron across the
basolateral membrane and into systemic circulation is believed to be mediated by the
iron transport proteins ferroportin and hephaestin. Ferroportin (Fp) is the only known
cellular iron exporter in vertebrates that is not only necessary for the release of iron
from the enterocyte, but is also known to be involved in the export and recycling of
iron from other cell types, including macrophages (Domenico et al., 2008). Hephaestin
(Hp), a ceruloplasmin homologue, is thought to interact with ferroportin to facilitate
the movement of iron across the membrane. Its role as a ferroxidase is to re-oxidize
ferrous iron to form ferric iron, thus facilitating Fe3+
binding to transferrin (Tf), a
circulating iron carrier in the blood (Vulpe et al., 1999).
Iron Transportation in the body: Once in circulation (bound to transferrin in
the plasma), iron is transported to specific peripheral body tissue sites, where the
transferrin-iron complex is sequestered by transferrin receptor proteins and, after
undergoing receptor-mediated endocytosis, which internalizes the entire complex into
clathrin-coated vesicles, the iron is eventually released from transferrin into the cell
12
cytoplasm and the transferrin is recycled back to the blood stream (Goswami, Rolfs &
Hediger, 2002). In the absence of bleeding, iron is fairly well conserved by the body
and only about 1mg iron/day may be lost through excretion (Bothwell et al., 1979).
Regulation of iron absorption in the body: Early models of iron absorption
regulation were based on the programming of crypt cells. As previously mentioned,
mature absorptive enterocyte cells constitute the major site of iron absorption. These
villus enterocytes differentiate from crypt cells during migration from the crypts to the
apex of the villus. The early models of the regulation of iron absorption suggested that
in normal, healthy individuals the sensing of bodily iron status by duodenal crypt cells
might effect a change in the iron absorptive activity of daughter enterocytes. These
models propose that the crypt cells of the distal duodenum sense bodily iron status
through the uptake of Tf-bound iron. The human hemochromatosis protein (HFE)
associates with transferrin receptor (TfR) proteins on the basolateral surface, resulting
in the internalization of Tf-bound iron into the crypt cells. When Tf saturation is low,
less iron is transferred via DMT1 into the cytosol, resulting in a relatively iron-
deficient state in the crypt cells. Consequently, binding of iron-regulatory proteins
(IRPs) to the 3' untranslated region (UTR) of iron-regulatory elements (IREs)
increases, resulting in increased mRNA stability for iron transport genes—DMT1,
Dcytb, Fp and Hp—expressed on differentiation of these cells to villus absorptive
enterocytes. On the other hand, when Tf saturation is high, IRPs bind to the 5' UTR of
IREs, blocking mRNA translation for these iron transport genes and thus reducing
their abundance in the resulting mature villus absorptive enterocytes (Fleming &
Britton, 2006; Pietrangelo, 2002; Philpott 2002). The crypt cell hypothesis is
supported by results from a mouse study conducted to test the hypothesis that the HFE
gene is involved in the regulation of iron homeostasis (Zhou et al., 1998). In this
study, researchers studied the effects of a targeted disruption of the murine homologue

13
of the HFE gene on iron homeostasis. Even on a standard diet, the HFE-deficient mice
showed profound increases in transferrin saturation and hepatic iron compared with
what occurs in the wild type, suggesting that, in crypt cell programming, HFE is the
main protein involved in the regulation of iron transfer into the blood.
With the discovery of hepcidin, however, a new model for the regulation of
iron absorption emerged. Hepcidin, a hepatic bactericidal protein, has been shown to
affect the function, distribution, and concentration of ferroportin and is thought to
regulate iron efflux from enterocytes and macrophages by binding to Fp and inducing
its internalization and degradation (Nemeth et al., 2004). Thus reduced levels of
hepcidin may lead to tissue iron overload, while overproduction of hepcidin could
result in hypoferremia and the anemia of inflammation. Hepcidin production is
regulated by high iron levels, inflammatory stimuli, and demand for erythropoiesis
(Beutler, 2004; Hentze, Muckenthaler, & Andrews, 2004). On this contemporary
model of iron absorption, hepcidin controls plasma iron by modulating iron absorption
in the gut, the release of recycled hemoglobin iron by macrophages, and the movement
of stored iron from hepatocytes. Evidence from a rat study conducted by Frazer et al.
(2002) supports the role of hepcidin over crypt cell programming as the process of
regulation of iron absorption in the epithelial cell. In their study adult rats were
switched from an iron-replete to an iron-deficient diet and the expression of Dcytb,
DMT1, Fp, and Hp in their duodena, as well as hepcidin in their livers, was studied
over a 14-day period. The researchers also analyzed the effect of the ID diet on iron
absorption and iron status. The switch from an iron-replete to an ID diet resulted in a
rapid change in gene expression in both the duodenum and liver. Increases in Dcytb,
DMT1, and Fp expression in the duodenum were observed, but not of Hp. On the
other hand, hepcidin expression in the liver decreased almost simultaneously. Crypt
cell migration is thought to take about three to five days, so the rapid nature of these

14
changes (within one day) is thought to support the proposed role of hepcidin in
signaling the bodily iron requirements to the epithelial cells. Frazer et al. also noted
that the changes in gene expression occurred before changes in both hematologic and
storage iron were evident, but were correlated precisely with a change in transferrin
saturation, which suggests that Tf saturation may be a regulatory factor for hepcidin
regulation and iron absorption.
Iron Bioavailability
Iron absorption in humans is influenced by many factors, including dietary iron
content, iron bioavailability, and bodily storage iron status (Yip, 2001). In human
nutrition terms, bioavailability is commonly defined as the proportion of a nutrient in a
food or meal that is absorbable and utilizable by the person eating the food or meal. In
the case of iron, it is characterized as the percentage of dietary iron that is absorbed
and utilized by an individual (Benito & Miller, 1998). Thus the total concentration of a
nutrient in a food or diet does not necessarily reflect the consumer-available nutrient
supply within a food system, and this is especially true with regard to micronutrients
such as iron. Therefore in the case of iron biofortified foods it is essential to determine
if the amount of bioavailable iron in the enriched lines can improve the iron status of
the targeted populations (King, 2002; Welch & Graham 2002).
Dietary iron occurs in two forms: heme iron and non-heme iron. In the human
diet the primary sources of heme iron are hemoglobin and myoglobin from meat,
poultry, and fish. Non-heme iron is obtained from cereals, pulses, legumes, fruits, and
vegetables. It occurs in plants in various forms in differing proportions with varied
chemical properties according to food source (Hallberg, 1981). Bioavailability of
heme iron averages about 25 percent, compared with 2-8 percent from non-heme iron
in plant foods. This difference between non-heme and heme iron in terms of

15
bioavailability may be explained by the fact that heme iron is thought to be absorbed
intact by receptor mediated endocytosis and its absorption is only slightly influenced
by other constituents of the diet. As for non-heme iron, its chemical form significantly
affects its absorption, independently of other dietary compounds that could further
alter dietary iron absorption (West & Oates, 2008; Hallberg, 1981).
Iron bioavailability in plant foods is influenced by dynamic factors and the
interactions that make iron bioavailability complex. Some factors increase the
absorption and utilization of iron and these are referred to as enhancers or promoters
of iron bioavailability. On the other hand, other factors inhibit iron absorption and
utilization and these are known as inhibitors of iron bioavailability or antinutrients.
Some of these factors are dietary while others are non-dietary.
Non-dietary factors that influence iron density/content in crops include genetic
selection, certain agronomical practices, soil pH, and fertility, while characteristics
such as age, sex, ethnicity, nutritional status, or the disease status of an individual can
influence iron absorption and utilization in the body. In addition, food processing or
preparation methods may increase iron bioavailability; milling, fermentation, and
cooking are but a few such processes known to improve iron bioavailability in plant
foods (Ruel & Levin, 2002; Graham, Welch & Bouis, 2001; Benito & Miller, 1998;
Hallberg, 1981).
In the case of dietary factors that influence iron bioavailability, it is difficult to
cite a unifying concept to account for the many factors that may inhibit or promote the
efficiency with which dietary iron is incorporated into the body. There are multiple
interactions that occur between iron and other macronutrients, micronutrients, or plant
substances in a single-meal or whole diet that may enhance or inhibit iron absorption
by the gut. Studies show that phytate and polyphenols are the major compounds that
inhibit iron bioavailability, especially from plant-based diets (Hu et al., 2006;

16
Davidsson, 2003; Hallberg, Brune & Rossander, 1989; Morck, Lynch & Cook, 1983;
Hallberg & Rossander, 1982b; Disler & others, 1975). On the other hand, ascorbic
acid, organic acids such as tartaric acid, malic acid, succinic acid, and fumaric acid,
and meats are said to enhance iron bioavailability (Hurrell et al., 2006; Salovaara,
Sandberg & Andlid, 2002; Yip, 2001; Hallberg, Brune & Rossander-Hulthén, 1987).
Measurement of iron bioavailability
As already mentioned, iron bioavailability is defined as the proportion of iron
in the meal that is digested, absorbed, and ultimately utilized for normal body
functions (Fairweather-Tait et al., 2007). This definition recognizes and encompasses
the concept that iron bioavailability involves the entire process of iron transfer from
food into the body—iron digestibility, uptake, efflux, retention, utilization, and
storage. Historical and current methods have been developed over time to assess these
different aspects of iron bioavailability in foods (Table 1.1).
In vivo iron models (human and animal studies) and in vitro iron models (for
example, the Caco-2 cell assay) are used to assess iron bioavailability. Human and
animal studies may be categorized as isotopic or non-isotopic, depending on whether
iron isotope tracers are used. Iron isotopes- 54
Fe, 57
Fe, 58
Fe, are commonly used in
stable isotope studies while 55
Fe, 59
Fe are generally used in radioisotope studies to
determine iron bioavailability of foods in in vivo iron models (Wienk, Marx &
Beynen, 1999).

17
Table 1.1: Historical & current methods used to assess aspects of iron bioavailability.
Assay/Technique Assessment
Solubility
Dialyzability Assess iron release from food
Duodenal loops Assess iron absorbed into the blood
Caco-2 cell assay
Assess iron availability from foods
Ferritin formation by Caco-2 cells is used as an indicator of
iron uptake
Isotope techniques Assess quantity of absorbed iron retained in the body
Hemoglobin
incorporation /
repletion
Assess iron utilization for normal body functions
In vitro methods have also been used extensively to study food-based iron
bioavailability. Until recently, solubility and dialyzability were measured to estimate
iron bioavailability by determining the amount of iron dissolved from food by dilute
acids or the extractability of ionizable iron from food by chelating agents. More recent
in vitro methods are based on simulated digestion of food or test meals with pepsin,
hydrochloric acid, and sometimes other digestive enzymes, followed by determination
of the dialyzable or soluble iron released (Wienk, Marx & Beynen, 1999; Fairweather-
Tait et al., 2007). A good example of this method is the in vitro digestion/Caco-2 cell
model that has been adapted to assess iron availability from foods (Figure 1.3). The
model employs the Caco-2 cell line in conjunction with in vitro digestion, whereby
foods undergo simulated peptic digestion followed by pancreatic-bile digestion in the
presence of Caco-2 cell monolayers. These cells exhibit remarkable morphological

18
and biochemical similarity to the small intestinal cells, the primary site for iron
absorption in the human gastrointestinal tract. For example, the Caco-2 cells form
monolayers when cultured and contain brush border microvilli, enzymes, and transport
proteins. They also maintain distinct apical and basolateral membranes (Pinto et al.,
1983). The Caco-2 cell model is a very useful screening tool that has shown enormous
potential in addressing iron bioavailability issues (Glahn et al., 1998; Yun et al.,
2004).
Figure 1.3: Schematic diagram of in vitro digestion/Caco-2 cell iron model.
Arithmetic models and algorithms have also been used to estimate food-based
iron bioavailability. These models are based on existing data from iron bioavailability
studies and are used to predict iron bioavailability from the diet (Wienk, Marx &
Beynen, 1999; Au & Reddy, 2000). An analysis of six iron absorption prediction
equations conducted by Beard et al. (2007) revealed, however, that these equations
Food Preparation (1g DW)
Pepsin Digestion
pH 2, 1 h, 37 C (50 mL tube)
Pancreatin-Bile Digestion
pH 6.8 – 7.0, 2 h, 37 C (1.5mL)
Soluble iron
Insert ring
Culture well
Dialysis membrane
15K MWCO
Caco-2 cells
Harvest cells for ferritin and cell protein
determination 24 h post start of Pancreatin-
Bile digestion

19
exhibit a lack of agreement with each other and with the change in iron status as
estimated by serum ferritin. Thus their validity in estimating iron bioavailability from
foods remains questionable. A recent study by Rickard et al. (2009) has developed an
algorithm used to assess intestinal iron availability for use in dietary surveys. The
proposed algorithm is to be used to predict available iron in the gut and not iron
absorption from the meal or diet. And although this algorithm by Rickard et al. seems
to be an improvement from previous algorithms, further research is needed to evaluate
its application beyond the population-level.
Study design, goals and objectives
The first step in breeding for improved nutrient density in crops is to identify
the nutrient and the staple crop of interest. After this has been achieved, the goal of
plant breeding in biofortification is to use available breeding methods to exploit the
natural genetic diversity in the crop of interest so as to improve the nutritional quality
of that crop. Previous iron biofortification efforts using conventional breeding have
proved successful in rice (Haas et al., 2005) and iron biofortified beans have been
tested in piglets with positive effects (Tako et al., 2009). The focus of our study was
iron biofortification of maize using conventional breeding methods with the aid of a
quantitative trait loci (QTL) model.
Experimental population: In genetic research programs, recombinant inbred
lines (RIL) or near isogenic lines (NIL) are commonly used as experimental
populations. RIL are produced by continually selfing or sib-mating the progeny of
individual members of an F2 population until homozygosity is achieved (see Figure
1.4). NIL can be developed by backcrossing an RIL to the original parent (see Figure
1.4). There are some advantages to using NIL in research. Because the backcross
derived lines are highly related to each other except for a small number of key

20
differences, the differences due to chance are relatively small or infrequent such that
any detected differences are likely significant and related to the selected trait
(Keurentjes et al., 2007).
F1
RIL#1 RIL#2 RIL#3 RIL#4 RIL#N….
Parent A Parent B
F2 F2 F2 F2 F2
X
X
Cross 2 varieties
F1 is heterozygous for all
genes
Self/sib
mate until
new
varieties
are
fixed for
all genes
Parent A Parent B
XX
or
NIL #1.1 NIL #1.2 NIL #21.1 NIL #21.2
RIL as parent
Figure 1.4: Schematic diagram of the production of recombinant inbred lines (RIL)
and near isogenic lines (NIL).

21
RIL and NIL from the Intermated B73 x Mo17 recombinant inbred (IBM RI)
population formed the experimental population in our study. IBM RI population was
made from B73 (a temperate, stiff stalk) inbred and Mo17 (a temperate, non-stiff
stalk) inbred, and is the best characterized mapping population in maize. IBM is a
powerful resource for the analysis of quantitative traits and genetic mapping in maize
(Lee et al. 2002; Sharopova et al. 2002; Falque et al. 2005)
Analysis of quantitative traits in iron biofortified maize: Many important
agricultural traits, such as crop yield, are referred to as quantitative traits. Such traits
exhibit a continuous distribution that can be measured and given a quantitative value.
Quantitative traits are often affected by multiple genes and environmental factors. The
quantitative traits of interest in our study were iron concentration and the amount of
bioavailable iron in the IBM RI maize population.
Analysis of quantitative trait loci in iron biofortified maize: The alleles that
control for quantitative traits occur in pairs and are located in loci on homologous
chromosomes. The loci are therefore referred to as quantitative trait loci (QTL). The
form of the gene that can exist at a single locus is determined by its DNA sequence
and is referred to as an allele. Alleles can be either dominant or recessive. When
different forms of an allele occur at a locus, it is heterozygous. When the alleles are
the same it is homozygous, and can be either dominant or recessive (see Figure 1.5).
QTL analysis is a statistical method in plant research that allows breeders to
link two types of information - phenotypic data (such as grain iron concentration or
grain iron bioavailability) and genotypic data (usually molecular markers) - in an
attempt to explain the genetic basis of variation in quantitative traits. In our study,
QTL in the IBM RI maize population were analyzed to determine chromosomal
regions that contain QTL that may influence grain iron concentration and the amount
of bioavailable iron in our maize population.

22
Figure 1.5: Schematic diagram of homologous chromosome
QTL model for iron biofortified maize: The main goal of characterizing
quantitative trait loci in a segregating population is to determine how many genes are
involved in the genetic control of the quantitative trait of interest and to estimate their
location within the genome. The QTL model summarizes the genetic factors that
contribute to the trait of interest, explaining where each of them are in the genome,
and their relative contribution to the total phenotypic variance explained. The model is
based on the fact that phenotypic differences for the trait of interest can be traced back
to genetic markers located at specific positions on the chromosome (Koornneef,
Alonso-Blanco & Peeters, 1997). The model can often be deduced from the statistical
analysis of several segregating populations, and it helps researchers understand
inheritance, variation in quantitative traits of interest, and predict future outcomes
(Koornneef, Alonso-Blanco & Peeters, 1997; Gai & Wang, 1998). In our study a QTL
model was employed to locate loci in the IBM RI maize population that influence iron
concentration and iron bioavailability in the maize grain.
Gene loci
A b cRecessiveallele
Genotype:
A b C
Dominantallele
AA bb Cc
Homozygousfor the
dominant allele
Homozygousfor the
recessive allele
Heterozygous

23
Analysis of iron content in iron biofortified maize: Mineral analysis was
conducted using inductively coupled plasma-emission spectroscopy (ICAP; ICAP
model 61E Trace Analyzer; Thermo Jarrell Ash Corporation, Waltham MA)
Analysis of iron bioavailability in iron biofortified maize: Analysis of the
amount of bioavailable iron was done in vitro using the Caco-2 cell iron model and in
vivo using a poultry model.
By targeting principally poor populations at risk of suffering micronutrient
deficiencies, biofortification has the potential, as an agricultural intervention, to
complement other approaches aimed at reducing or preventing micronutrient
malnutrition. However, for biofortification to be successful the biofortified crops must
prove to be beneficial to the populations that adopt and consume them. In the case of
iron biofortified maize, (1) breeding efforts must improve iron density or
bioavailability in maize, (2) the trait should be relatively stable across locations, soils
and climatic regions it is adapted for, and (3) the nutritionally improved crop lines
must improve the iron status of at-risk populations (Welch & Graham, 2002, see figure
1.6).
The overall goal of this research was to make a significant contribution toward
breeding efforts for iron in maize. The specific objectives of the study were to (a)
determine the quantitative trait loci that influence iron content and iron bioavailability
in the maize grain, (b) examine environmental factors that may influence iron nutrition
in maize, and (c) assess iron bioavailability from biofortified maize. To achieve these
objectives, this research work was divided into three main studies that addressed
specific research questions as listed:

24
Figure 1.6: Tenets for biofortification success
Study 1: Enhancing iron bioavailability in maize using a Caco-2 cell/ QTL model.
Is iron concentration in maize a genetically tractable trait?
Is iron bioavailability in maize a genetically tractable trait?
Study 2: Evaluating Genotype x Environment interaction in biofortified maize.
Does growing biofortified maize in different locations affect iron
concentration and/or iron bioavailability in the maize lines?
Study 3: Assessment of iron bioavailability from iron biofortified maize.
Are significant differences in iron bioavailability as measured by the
Caco-2 cell in vitro model reflected in an in vivo model?
Breeding for high
nutrient content or
quality must be
feasible
The biofortification
genotype traits must
be relatively stable
across environments
Farmer adoption
and consumer
acceptance are vital
Micronutrients in
improved lines must
be bioavailable

25
REFERENCES
Allen, L., & Casterline-Sabel, J. (2000). Prevalence and Causes of Nutritional
Anemias. In U. Ramakrishnan (Ed.), Nutritional Anemias (pp. 7-21). Boca
Raton, FL: CRC Press.
Au, A. P., & Reddy, M. B. (2000). Caco-2 Cells Can Be Used to Assess Human Iron
Bioavailability from a Semipurified Meal. Journal of Nutrition, 130(5), 1329-
1334.
Beard, J. L., Dawson, H., & Pinero, D. J. (1996). Iron metabolism: a comprehensive
review. Nutrition Reviews, 54(10), 295-317.
Beard, J. L., Murray-Kolb, L. E., Haas, J. D. & Lawrence, F. (2007). Iron absorption
prediction equations lack agreement and underestimate iron absorption.
Journal of Nutrition, 137(7), 1741-6.
Benito, P., & Miller, D. (1998). Iron absorption and bioavailability: an updated
review. Nutrition Research, 18(3), 581-603.
Beutler, E. (2004). " Pumping" iron: the proteins. Science, 306(5704), 2051-2053.
Bothwell, T. H., Charlton, R. W., Cook, J. D., & Finch, C. A. (1979). Iron metabolism
in man. St. Louis: Distributors USA, Blackwell Mosby Book Distributors.
Burr, B., & Burr, F. A. (1991). Recombinant inbreds for molecular mapping in maize:
theoretical and practical considerations. Trends in genetics, 7(2), 55.
Davidsson, L. (2003). Approaches to improve iron bioavailability from
complementary foods. Journal of Nutrition, 133(5 Suppl), S1560-1152.
De Domenico, I., Ward, D. M. V., Nemeth, E., Vaughn, M. B., Musci, G., Ganz, T., et
al. (2005). The molecular basis of ferroportin-linked hemochromatosis.
Proceedings of the National Academy of Sciences, 102(25), 8955-8960.
Disler, P. B., Lynch, S. R., Charlton, R. W., Torrance, J. D., Bothwell, T. H., Walker,
R. B., et al. (1975). The effect of tea on iron absorption. Gut, 16(3), 193.

26
Fairweather-Tait, S., Phillips, I., Wortley, G., Harvey, L., & Glahn, R. (2007). The use
of solubility, dialyzability, and Caco-2 cell methods to predict iron
bioavailability. International journal for vitamin and nutrition research, 77(3),
158.
Falque, M., Decousset, L., Dervins, D., Jacob, A. M., Joets, J., Martinant, J. P., et al.
(2005). Linkage mapping of 1454 new maize candidate gene loci. Genetics,
170(4), 1957-1966.
Fleming, R. E., & Britton, R. S. (2006). Iron Imports. VI. HFE and regulation of
intestinal iron absorption. American journal of physiology. Gastrointestinal
and liver physiology, 290(4), G590.
Frazer, D. M., & Anderson, G. J. (2005). Iron Imports. I. intestinal iron absorption and
its regulation. American journal of physiology. Gastrointestinal and liver
physiology, 52(4), 631-635.
Frazer, D. M., Wilkins, S. J., Becker, E. M., Vulpe, C. D., McKie, A. T., Trinder, D. &
Anderson, G. J. (2002). Hepcidin expression inversely correlates with the
expression of duodenal iron transporters and iron absorption in rats.
Gastroenterology, 123(3), 835-844.
Gai, J. Y., & Wang, J. K. (1998). Identification and estimation of a QTL model and its
effects. Theoretical and Applied Genetics, 97(7) 1162-1168.
Glahn, R. P., Lee, O. A., Yeung, A., Goldman, M. I., & Miller, D. D. (1998). Caco-2
Cell Ferritin Formation Predicts Nonradiolabeled Food Iron Availability in an
In Vitro Digestion/Caco-2 Cell Culture Model. Journal of Nutrition, 128(9),
1555-1561.
Goswami, T., Rolfs, A., & Hediger, M. A. (2002). Iron transport: emerging roles in
health and disease. Biochemistry and Cell Biology, 80(5), 679-689.

27
Graham, R. D., Welch, R. M., & Bouis, H. E. (2001). Addressing micronutrient
malnutrition through enhancing the nutritional quality of staple foods:
principles, perspectives and knowledge gaps. Advances in Agronomy, 70, 77-
142.
Graham, R. D., Welch R. M., Saunders D.A. et al. (2007). Nutritious subsistence food
systems. Advances in Agronomy, Academic Press. Volume 92, 1-74.
Grusak, M. A. (2001). Homeostasis and the regulation of micronutrient stress
responses in roots. In K. Singh, S. Mori, & R. M. Welch (Eds.), Perspectives
on the micronutrient nutrition of crops (pp. 71–90). Jodhpur, India: Scientific
Publishers.
Haas, J. D., Beard, J. L., Murray-Kolb, L. E., del Mundo, A. M., Felix, A., &
Gregorio, G. B. (2005). Iron-biofortified rice improves the iron stores of
nonanemic Filipino women. Journal of nutrition, 135(12), 2823.
Hallberg, L. (1981). Bioavailability of dietary iron in man. Annual Review of
Nutrition, 1(1), 123-147.
Hallberg, L., Brune, M., & Rossander-Hulthén, L. (1987). Is there a physiological role
of vitamin C in iron absorption? Annals of the New York Academy of Sciences,
498, 324.
Hallberg, L., Brune, M., & Rossander-Hulthén, L. (1989). Iron absorption in man:
ascorbic acid and dose-dependent inhibition by phytate. American Journal of
Clinical Nutrition, 49(1), 140.
Hallberg, L., & Rossander, L. (1982a). Effect of different drinks on the absorption of
non-heme iron from composite meals. Human nutrition. Applied nutrition,
36(2), 116.
Hallberg, L., & Rossander, L. (1982b). Absorption of iron from Western-type lunch
and dinner meals. American journal of clinical nutrition, 35(3), 502.

28
Hallberg, L., & Rossander, L. (1984). Improvement of iron nutrition in developing
countries: comparison of adding meat, soy protein, ascorbic acid, citric acid,
and ferrous sulphate on iron absorption from a simple Latin American-type of
meal. American journal of clinical nutrition, 39(4), 577.
Hentze, M. W., Muckenthaler, M. U., & Andrews, N. C. (2004). Balancing acts:
molecular control of mammalian iron metabolism. Cell, 117(3), 285.
Hirsch, R. E., & Sussman, M. R. (1999). Improving nutrient capture from soil by the
genetic manipulation of crop plants. Trends in biotechnology, 17(9), 356.
Hoekenga, O. A., Mwaniki, A. M., Szalma S. S., Glahn, R. P., & Kochian, L. V.
(2010). Genetic and physiological analysis of iron biofortification in maize
kernels. Manuscript submitted for publication.
Hu, Y., Cheng, Z., Heller, L. I., Krasnoff, S. B., Glahn, R. P., & Welch, R. M. (2006).
Kaempferol in red and pinto bean seed (Phaseolus vulgaris L.) coats inhibits
iron bioavailability using an in vitro digestion/human Caco-2 cell model.
Journal of Agriculture and Food Chemistry. 54(24), 9254-61.
Hurrell, R. F., Reddy, M. B., Juillerat, M., & Cook, J. D. (2006). Meat protein
fractions enhance nonheme iron absorption in humans. Journal of nutrition,
136(11), 2808.
Institute of medicine (IOM). (2001). Dietary Reference Intakes for Vitamin A, Vitamin
K, Arsenic, Boron, Chromium, Copper, Iodine, Iron, Manganese,
Molybdenum, Nickel, Silicon, Vanadium, and Zinc: Washington DC: National
Academy Press.
Jin, C. W., Chen, W. W., Meng, Z. B., & Zheng, S. J. (2008). Iron deficiency-induced
increase of root branching contributes to the enhanced root ferric chelate
reductase activity. Journal of integrative plant biology, 50(12), 1557.

29
Krämer, U., Talke I. N., & Hanikenne M. (2007). Transition metal transport. FEBS
letters, 581(12): 2263-2272.
Keurentjes, J. J., Bentsink, L., Alonso-Blanco, C., & Hanhart, C. J. (2007).
Development of a near-isogenic line population of Arabidopsis thaliana and
comparison of mapping power with a recombinant inbred line population.
Genetics, 175(2), 891-905.
King, J. C. (2002). Evaluating the impact of plant biofortification on human nutrition.
Journal of nutrition, 132(3), 511S.
Koornneef, M., Alonso-Blanco, C., & Peeters, A. J. M. (1997). Genetic approaches in
plant physiology. New Phytologist, 137(1), 1-8.
Landsberg, E. C. (1996). Hormonal regulation of iron-stress response in sunflower
roots: a morphological and cytological investigation. Protoplasma, 194(1), 69-
80.
Lee, M., Sharopova, N., Beavis, W. D., Grant, D., Katt, M., Blair, D., Hallauer, A.
(2002) Expanding the genetic map of maize with the intermated B73 x Mo17
(IBM) population. Plant Molecular Biology, 48(5-6): 453-461
Ma, Y., Specian, R. D., Yeh, K. Y., Yeh, M., Rodriguez-Paris, J., & Glass, J. (2002).
The transcytosis of divalent metal transporter 1 and apo-transferrin during iron
uptake in intestinal epithelium. American journal of physiology.
Gastrointestinal and liver physiology, 283(4), G965.
Morck, T. A., Lynch, S. R., & Cook, J. D. (1983). Inhibition of food iron absorption
by coffee. American journal of clinical nutrition, 37(3), 416.
Nemeth, E., Tuttle, M. S., Powelson, J., Vaughn, M. B., Donovan, A., Ward, D. M.
V., et al. (2004). Hepcidin Regulates Cellular Iron Efflux by Binding to
Ferroportin and Inducing Its Internalization. Science, 306(5704), 2090-2093.

30
Nestel, P., Bouis, H. E., Meenakshi, J. V., & Pfeiffer, W. (2006). Biofortification of
staple food crops. Journal of nutrition, 136(4), 1064.
Neumann, C. G., Gewa, C., & Bwibo, N. O. (2004). Child nutrition in developing
countries. Pediatric annals, 33(10), 658-674.
Philpott, C. C., & Iron, D. (2002). Molecular aspects of iron absorption: Insights into
the role of HFE in hemochromatosis. Hepatology, 35(5), 993-1001.
Pietrangelo, A. (2006). Hereditary hemochromatosis. BBA-Molecular Cell Research,
1763(7), 700-710.
Rickard, A. P., M. D. Chatfield, et al. (2009). An algorithm to assess intestinal iron
availability for use in dietary surveys. British Journal of Nutrition, 102, 1678-
1685.
Robinson, N. J., Procter, C. M., Connolly, E. L., & Guerinot, M. L. (1999). A ferric-
chelate reductase for iron uptake from soils. Nature, 397(6721), 694-697.
Römheld, V., & Marschner, H. (1986). Evidence for a Specific Uptake System for
Iron Phytosiderophores in Roots of Grasses. Plant physiology, 80(1), 175.
Ruel, M. T. & Levin, C. E. (2002). Assessing the potential for food-based strategies to
reduce vitamin A and iron deficiencies: a review of recent evidence
(Discussion Paper 92). Washington D.C: International Food Policy Research
Institute (IFPRI).
Salovaara, S., Sandberg, A. S., & Andlid, T. (2002). Organic acids influence iron
uptake in the human epithelial cell line Caco-2. Journal of Agriculture & Food
Chemistry, 50(21), 6233-6238.
Sazawal, S., Black, R. E., Ramsan, M., Chwaya, H. M., Stoltzfus, R. J., Dutta, A., et
al. (2006). Effects of routine prophylactic supplementation with iron and folic
acid on admission to hospital and mortality in preschool children in a high

31
malaria transmission setting: community-based, randomised, placebo-
controlled trial. Lancet, 367(9505), 133-143.
Schmidt, W. (1999). Review mechanisms and regulation of reduction-based iron
uptake in plants. New phytologist, 141(1), 1-26.
Sharopova, N., McMullen, M. D., Schultz, L., Schroeder, S., Sanchez-Villeda, H.,
Gardiner, J., et al. (2002). Development and mapping of SSR markers for
maize. Plant molecular biology, 48(5), 463-481.
Stipanuk, M. H. (2000). Biochemical and Physiological Aspects of Human Nutrition.
Philadelphia, PA: WB Saunders Company.
Sugiura, Y., & Nomoto, K. (1984). Phytosiderophores: structures and properties of
mugineic acids and their metal complexes. In Structure and Bonding: Vol 58.
Siderophores from Microorganisms and Plants (pp. 107-135). Berlin/
Heidelberg: Springer
Taiz, L., & Zeiger, E. (2006). Plant Physiology (4th
Edition). Sunderland, MA: Sinauer
Associates, Inc.
Tako, E., Laparra, J. M., Glahn, R. P., Welch, R. M., Lei, X. G., Beebe, S., et al.
(2009). Biofortified Black Beans in a Maize and Bean Diet Provide More
Bioavailable Iron to Piglets Than Standard Black Beans. Journal of Nutrition,
139(2), 305.
Theil, E.C. & J.F. Briat. (2004). Plant ferritin and non-heme iron nutrition for humans
(Harvest Plus Technical Monograph 1). Washington, DC and Cali:
International Food Policy Research Institute (IFPRI) and International Centre
for Tropical Agriculture (CIAT).
Underwood, B. (2001). Nutritional anemias worldwide: a historical overview. In U.
Ramakrishnan (Ed.), Nutritional Anemias (pp. 1-6). Boca Raton, FL: CRC
Press.

32
United Nations (UN). (2001). ACC/SCN. What Works? A Review of the Efficacy and
Effectiveness of Nutrition Interventions. Allen LH & Gillespie SR. ACC/SCN:
Geneva in collaboration with the Asian Development Bank, Manila. ISBN
971-561-388-8. Publication Stock No. 070901.
Vulpe, C. D., Kuo, Y. M., Murphy, T. L., Cowley, L., Askwith, C., Libina, N., et al.
(1999). Hephaestin, a ceruloplasmin homologue implicated in intestinal iron
transport, is defective in the sla mouse. Nature genetics, 21(2), 195-199.
Welch, R. M., & Graham, R. D. (2002). Breeding crops for enhanced micronutrient
content. Plant and soil, 245(1), 205-214.
West, A. R., & Oates, P. S. (2008). Mechanisms of heme iron absorption: Current
questions and controversies. World journal of gastroenterology, 14(26), 4101-
4110.
Wienk, K. J. H., Marx, J. J. M., & Beynen, A. C. (1999). The concept of iron
bioavailability and its assessment. European journal of nutrition, 38(2), 51-75.
WHO/UNICEF/UNU. (2001). Iron deficiency anemia. Assessment, prevention and
control. A guide for programme managers. (WHO/NHD/01.3.). Geneva:
Switzerland: WHO.
Yeh, K., Yeh M., et al. (2009). Iron feeding induces ferroportin 1 and hephaestin
migration and interaction in rat duodenal epithelium. Gastrointestinal and
Liver Physiology, 296(1): G55- G65.
Yip, R. (2001). Iron Deficiency and Anemia. In R. Semba, & M. Bloem (Eds.),
Nutrition and Health in Developing Countries (pp. 327-432). Totowa, NJ:
Humana Publications.
Yun, S., Habicht, J. P., Miller, D. D., & Glahn, R. P. (2004). An in vitro
digestion/Caco-2 cell culture system accurately predicts the effects of ascorbic
33
acid and polyphenolic compounds on iron bioavailability in humans. Journal
of nutrition, 134(10), 2717.
Zhou, X. Y., Tomatsu, S., Fleming, R. E. et al. (1998). HFE gene knockout produces
mouse model of hereditary hemochromatosis. Proceedings of the National
Academy of Sciences of the United States of America 95(5), 2492 - 7.
Zimmermann, M. B., & Hurrell, R. F. (2007). Nutritional iron deficiency. Lancet,
370(9586), 511-520.

34
CHAPTER 2
ENHANCING IRON BIOAVAILABILITY OF MAIZE USING A CACO-2
CELL / QUANTITATIVE TRAIT LOCI MODEL
Abstract
The aims of this study were to determine if there is a significant difference in
grain iron concentration and grain iron bioavailability in intermated B73 x Mo17
recombinant inbred maize populations grown in Aurora, New York in 2007 and 2008.
Grain iron concentration was determined using emission spectroscopy and grain iron
bioavailability was assessed using the Caco-2 cell bioassay. Using the Caco-2 cell/
QTL (quantitative trait loci) model, we identified two hybrid maize lines from our
2007 maize population with identical grain iron concentration (20 ppm), but one line
contained double the amount of bioavailable iron (P = 0.0064). In the 2008 maize
population, we found two inbred maize lines with similar grain iron concentration (25
ppm) but one line had 7 times more bioavailable iron than the other one had (P <
.0001). These data can be explained either by the enhanced levels of a promoter or a
suppression of an inhibitor through breeding, or a combination of both. Additional
research is required to profile and identify the compounds. We conclude that
conventional breeding using the QTL approach can significantly improve iron
bioavailability in maize grain. The next step is to assess genotype-by-environment
interaction, a process in which improved lines should be grown at multiple locations.
In vivo bioavailability trials should be conducted to determine the efficacy
of
consuming the high bioavailable iron maize.

35
Introduction
Iron deficiency is an important public health problem that is estimated to affect
over one-third of the world‘s population (Zimmermann & Hurrell, 2007). Improving
the nutritional quality of staple food crops such as maize, by developing varieties with
high bioavailable iron content, represents a sustainable and cost-effective approach to
alleviating iron malnutrition (Welch & Graham, 2004). Biofortification is an
agricultural intervention that seeks to improve human health by improving
micronutrient levels in staple foods (Nestle et al., 2006). For biofortification to
succeed, the first step is to ensure that the enhancement of nutritional quality is
primarily under genetic control.
Rapid developments in maize genetics and genomics coupled with the need to
integrate nutrition goals into agriculture has resulted in extensive interest and research
in breeding for enhanced iron quality in maize varieties. One approach has sought to
improve iron bioavailability in maize varieties by reducing iron inhibitors in maize.
For example, to reduce phytic acid in maize, Raboy (2002) and others isolated low-
phytic-acid mutations of maize and used these to show proof of principal that
conventional breeding can be used to breed first-generation low-phytate maize
varieties. Another approach is the use of transgenic breeding to improve iron nutrition
in maize. For instance, to increase grain bioavailable iron in maize, Drakakaki et al.
(2005) generated transgenic maize plants with endosperm-specific co-expression of
Aspergillus phytase and soybean ferritin. In spite of their potential for success
however, efforts to reduce phytate in crops and transgenic plants are mired in either
scientific or political debate (Shamsuddin, 2008; Wainwright & Mercer, 2009). There
is therefore a need to find a conventional breeding strategy that can improve the iron
nutrition of maize and is ‗perceived as safe‘ to both consumers and the environment.

36
Using conventional breeding, previous studies, such as Hoekenga et al.
(manuscript submitted for publication), have sought to employ an integrated genetic
and physiological analysis of iron nutrition in maize grain to determine the
quantitative trait loci (QTL) that influence grain iron concentration and grain iron
bioavailability in intermated B73 x Mo17 (IBM) recombinant inbred (RI) maize
populations. From their studies, forty-two QTL for grain iron concentration
(explaining 21 – 81% of the variance detected in a given year/location) were detected
from samples collected over three years in Aurora, New York and one year in Clayton,
North Carolina. Six out of the forty-two QTL were repeatedly detected, explaining 7 -
27% of the observed variance in grain iron concentration.
For grain iron bioavailability, loci associated with increased amounts of
bioavailable iron were identified on 6 chromosomes and explained 54% of the
observed variance in samples from a single year/location. Three of the largest iron
bioavailability QTL were successfully isolated in near-isogenic lines (NILs).
However, none of the identified QTL for grain iron content and grain iron
bioavailability were co-located. In addition, grain iron bioavailability was not
correlated with either grain iron concentration or phytate levels.
In regard to grain iron concentration, numerous genes may be involved in
controlling iron absorption in the root-soil interface of the maize grain. These genes
are located in QTL, so locating these QTL can facilitate the breeding process by
providing important information about the location of iron nutrition genes in the maize
genome, the number of genes that affect this nutrition trait, and the distribution of the
genes in the maize genome. This information is essential to breeders because it can
help them to distinguish between linkage and pleiotrophy and major genes and minor
genes, as well as to clarify the mode of gene action. The results of the study by
Hoekenga et al. lay the foundation for the follow-up research presented in this chapter.

37
The objectives of this study were: (i) to determine if there was a significant difference
in grain iron concentration in IBM RI maize populations grown in Aurora, New York
in 2007 and 2008, and (ii) to determine if there was a significant difference in grain
bioavailable iron in these IBM RI maize populations.
Materials and Methods
Chemicals, enzymes, and hormones: Unless otherwise stated, all chemicals,
enzymes, and hormones were purchased from Sigma Chemicals Co. To prepare
reagents for cell culture, 18 MΩ water was used. Glassware and utensils used in the
experiments were soaked in 1.2 M HCl for at least 4 hours and rinsed in deionized
water prior to use.
Plant materials and field site details: The maize varieties tested are derived
from Intermated B73 x Mo17 (IBM) recombinant inbred (RI) maize populations. The
IBM RI population was selected for this study based on ready availability and the
existence of advanced backcross families for rapid development of near-isogenic lines
(NIL). One maize population was grown in Aurora, NY in 2007. It consisted of
seventeen Mo17 background lines, thirty three B73 background lines and two hybrid
lines. A second maize population, some of it derived from the 2007 maize population,
was grown in Aurora NY, in 2008. It consisted of twenty-five Mo17 background lines
and 43 B73 background lines The plots used for this study had a Lima Silt Loam soil,
with average yield for maize of 120 bushels acre-1
and water extractable soil pH of 7.7.
Maize sample preparation: Maize kernels (20g) were sorted to remove any
debris or damaged seeds and then placed in a 50 mL centrifuge tube and covered with
25 mL of 18 MΩ water. Samples were then autoclaved at 121ºC and at a pressure of
115 kPa for 40 min, allowed to cool at room temperature, and then frozen overnight at
–20 C. Samples were then freeze-dried at 100 millTorr and a temperature of –50 C

38
for 7 days, ground to a fine powder with a coffee mill (90 sec), and stored in 50 mL
centrifuge tubes at 25 C. Tamale maize—used as a control in the Caco-2 cell
bioassay—was prepared in an identical manner.
Mineral analysis for maize samples: A 0.3g dry ground maize sample was
weighed into borosilicate glass test tubes and chemically digested using 4 mL of
concentrated nitric acid at 120 C until the residue was light brown to yellow in color.
Exactly 1.0 ml of a 50/50 mixture of concentrated nitric acid and perchloric acid was
then added, and the temperature was increased to 180 C. After 2 hours, the
temperature was further increased to 240 C until the digested samples were dry. After
cooling, 0.25 mL of concentrated hydrochloric acid was added to dissolve the ash.
One hour later, the sample was diluted with 10 mL of 5% nitric acid. The ashed
sample was then mixed and transferred into 15 mL auto sampler tubes and analyzed
on an axially viewed inductively coupled plasma (ICP) trace analyzer emission
spectrometer (model ICAP 61E trace analyzer, Thermo Electron, Waltham, MA; see
Rutzke, 2002).
Caco-2 cell screening: The in vitro digestion Caco-2 cell iron model was used
as a screening tool to estimate the amount of bioavailable iron in the maize samples.
Cell Culture: Caco-2 cells were obtained from the American Type Culture
Collection (Rockville, MD) at passage 17 and used in experiments at passages 25–33.
Cells were seeded at a density of 50,000 cells/cm2 in collagen-treated six-well plates
(Costar Corp., Cambridge, MA). The cells were grown in Dulbecco‘s Modified Eagle
Medium (GIBCO, Grand Island, NY) with 10% v/v fetal calf serum (GIBCO), 25
mmol/L N-(2-Hydroxyethyl) piperazine-N‘-2-ethane sulfonic acid (HEPES), and 1%
antibiotic antimycotic solution (GIBCO). The cells were maintained at 37 C in an
incubator with a 5% CO2/95% air atmosphere at constant humidity, and the medium
39
was changed every 2 days. The cells were used in the iron uptake experiments at 13
days post seeding.
In Vitro Digestion: The preparation of the digestion solutions—pepsin,
pancreatin, and bile extract—and the in vitro digestion was performed as previously
published (Glahn et al., 1998). Briefly, 1.0 g of dry sample was used for each sample
digestion. Ascorbic acid (AA) was added to enhance iron bioavailability using a 20:1
AA: Fe molar ratio. Then 10 ml of a pH 2 140 mM NaCl, 5 mM KCl buffer was added
to the samples, and the mixture was pH re-adjusted to pH 2. Then 0.5 mL of pepsin
solution was added to each of the samples prior to incubation. After a 1-hour
incubation period, the sample pH was adjusted to pH 5.5 to 6.0 with 1.0 M NaHCO3,
and after the addition of 2.5 mL of pancreatin-bile solution, the sample pH was further
adjusted to pH 6.9-7.0 with 1.0 M NaHCO3. Sample volumes were then adjusted (by
weight) to tube weight plus 15 g using the 140 mM NaCl, 5 mM KCl pH 6.7. Finally,
1.5 mL of the sample was transferred to appropriate inserts on the Caco-2 cell plates.
Harvesting: The harvesting of the Caco-2 cell monolayers was performed as
previously published (Glahn et al., 1998). The cells were harvested after a 24-hour
incubation period. First, growth media were carefully aspirated off the cells. The cells
were then rinsed twice with 2 mL of 130mM NaCl, 5 mM PIPES, pH 6.7 buffer. To
harvest the cells, 2 mL of 18.2 M water was added to the cells, and the cells were
placed in a sonicator (Lab-line Instruments, Melrose Park, IL) at 4 C for 15 minutes.
The cells were then scraped off the plates, suspended in the 2 mL of 18.2 M water,
and transferred to pre-labeled 5 ml tubes in anticipation of protein and ferritin assays.
Cell Protein Analysis: Caco-2 cell protein was measured on samples that had
been solubilized in 0.5 mol/L NaOH, using a semimicro adaptation of the Bio-Rad DC
protein assay kit (Bio-Rad Laboratories, Hercules, CA). A 25 µL sample of the

40
sonicated Caco-2 cell monolayer, harvested in 2 mL of water, was used for each
protein measurement expressed in mg.
Ferritin Analysis: A one-stage, two-site immunoradiometric assay was used to
measure Caco-2 cell ferritin content (FER-Iron II Ferritin Assay, RAMCO
Laboratories, Houston, TX). A 10 µL sample of the sonicated Caco-2 cell monolayer,
harvested in 2 mL of water, was used for each ferritin measurement expressed per unit
of cell protein (ng ferritin/mg cell protein).
Statistical Analyses: Statistical analyses of the data were performed using the
GraphPad Prism v4 (GraphPad Software, San Diego, CA) and JMP v7.0 (SAS
Institute Inc., Cary, NC) software packages. In some cases, the data were log-
transformed prior to analysis. Means were considered to be significantly different for
P values ≤ 0.05.
Results
The objectives of this study were to determine if there was a significant
difference in grain iron concentration and grain bioavailable iron in the IBM RI maize
populations grown in Aurora, New York in 2007 and 2008. The maize populations
were analyzed for grain iron concentration using emission spectroscopy and grain
bioavailable iron using the Caco-2 cell bioassay.
(1a) Grain iron concentration – 2007 harvest: Table 2.1 shows a summary
of grain iron concentration data for maize samples from the 2007 harvest. The maize
populations consisted of two hybrid lines and 50 inbred lines. Seventeen of the inbreds
were Mo17 lines, and 33 were B73 lines. The statistical model for grain iron
concentration showed a significant difference in grain iron concentration in this IBM
RI maize population (P = 0.0133). The grain iron concentration in the hybrid lines was

41
significantly different from that in the inbred lines. Grain iron concentration in the
B73 maize lines was not significantly different from grain iron concentration in the
Mo17 maize lines.
There was a significant difference in grain iron concentration across the
samples in the three groups. Grain iron concentration was significantly different
within the Mo17 lines (n = 17, P <.0001) and B73 lines (n = 33, P <.0001),
respectively. However, a t-test revealed no significant difference in grain iron
concentration between the two hybrid lines (P = 0.4407).
(1b) Grain iron concentration – 2008 harvest: Table 2.2 shows a summary
of grain iron concentration data for maize samples from the 2008 harvest. The maize
population consisted of 68 inbred lines. Twenty-five of the inbreds were Mo17 lines,
and 43 were B73 lines. The statistical model for grain iron concentration showed a
significant difference in grain iron concentration in this IBM RI maize population (P
<.0001). Grain iron concentration in the B73 maize lines was significantly different
from grain iron concentration in the Mo17 maize lines.
There was also a significant difference in grain iron concentration between the
samples within the two maize lines. Grain iron concentration was significantly
different within the Mo17 lines (P <.0001) and within the B73 lines (P <.0001),
respectively.
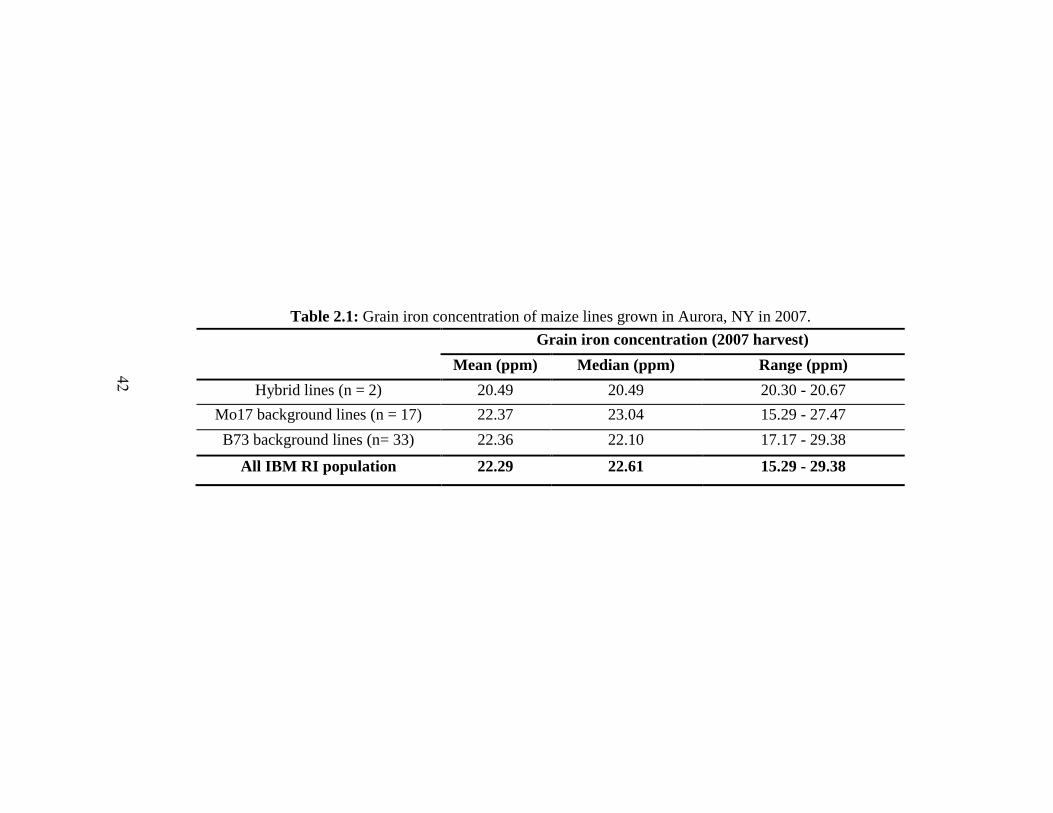
42
Table 2.1: Grain iron concentration of maize lines grown in Aurora, NY in 2007.
Grain iron concentration (2007 harvest)
Mean (ppm) Median (ppm) Range (ppm)
Hybrid lines (n = 2) 20.49 20.49 20.30 - 20.67
Mo17 background lines (n = 17) 22.37 23.04 15.29 - 27.47
B73 background lines (n= 33) 22.36 22.10 17.17 - 29.38
All IBM RI population 22.29 22.61 15.29 - 29.38

43
As previously mentioned, some maize samples harvested in 2008 were derived
from one or two of the maize lines from the 2007 harvest. A comparison of grain iron
concentration between the parental lines (2007 harvest) and daughter lines (2008
harvest) revealed no significant differences in grain iron concentration between the
2008 maize samples and either parent (parent 1, range = 17.17 - 27.47 ppm, P =
0.1635; parent 2, range = 23.12 – 24.81 ppm, P = 0.1726). This suggests that grain
iron content is a genetically tractable trait in the IBM RI maize population.
(2a) Grain bioavailable iron – 2007 harvest: Figures 2.1 – 2.3 show a
summary of grain bioavailable iron (as a percentage of the control) for the Mo17 lines,
the B73 lines, and the two hybrid lines from the 2007 harvest. The statistical model for
grain iron bioavailability showed a significant difference in grain bioavailable iron in
the IBM RI maize population (P <.0001). Grain bioavailable iron in the B73 lines was
significantly different from that in the hybrid and Mo17 lines. Grain bioavailable iron
in the hybrid maize lines was not significantly different from that in the Mo17 maize
lines.
There was a significant difference in grain bioavailable iron across samples
within the three groups (P <.0001). Grain bioavailable iron was significantly different
within the Mo17 lines (P <.0001) and B73 lines (P <.0001), respectively. A t-test also
revealed a significant difference in grain bioavailable iron between the two hybrid
lines (P = 0.0064).

44
Table 2.2: Grain iron concentration of maize lines grown in Aurora, NY in 2008.
Grain iron concentration (2008 harvest)
Mean
(ppm)
Median (ppm) Range (ppm)
Mo17 background lines (n= 17) 23.57 23.71 17.58 - 27.79
B73 background lines (n = 33) 20.32 19.96 15.52 - 26.86
All IBM RI population 21.48 21.79 15.52 - 27.79

45
Caco-2 cell iron uptake
C-0
01
C-0
02
C-0
13
C-0
14
C-0
21
C-0
22
C-0
23
C-0
24
C-0
30
C-0
32
C-0
37
C-0
38
C-0
48
C-0
49
C-0
50
C-0
51
C-0
52
0102030405060708090
100110120130140
Reference sample
Mo17 lines (2007 harvest)
Bio
avail
ab
le i
ron
(%
of
co
ntr
ol)
Figure 2.1: Caco-2 cell ferritin formation. The amount of bioavailable iron
in the Mo17 lines was assessed using the Caco-2 cell model. Ferritin formation in
the cells is an index of iron bioavailability. One gram (dry weight) of each sample
was analyzed in the model. Bar values (mean ± SEM, n = 6).

46
Caco-2 cell iron uptake
C-0
00C
-003
C-0
04C
-005
C-0
06C
-007
C-0
08C
-009
C-0
10C
-011
C-0
12C
-015
C-0
16C
-017
C-0
18C
-019
C-0
20C
-025
C-0
26C
-027
C-0
28C
-029
C-0
31C
-033
C-0
34C
-039
C-0
41C
-042
C-0
43C
-044
C-0
45C
-046
C-0
47
0
10
20
30
40
50
60
70
80
90
100
110
120
Reference sample
B73 lines (2007 harvest)
Bio
avai
labl
e ir
on (
as %
of
cont
rol)
Figure 2.2: Caco-2 cell ferritin formation. The amount of bioavailable iron in the B73 lines was assessed
using the Caco-2 cell model. Ferritin formation in the cells is an index of iron bioavailability. One gram (dry
weight) of each sample was analyzed in the model. Bar values (mean ± SEM, n = 6).

47
Caco-2 cell iron uptake
C-053 C-0540
25
50
75
100
125
0
10
20
30
40
50
60a
b
Hybrid lines (2007 harvest)
Bio
avail
ab
le i
ron
( a
s %
of
co
ntr
ol)
ng
ferritin
/ mg
cell p
rote
in
Figure 2.3: Caco-2 cell ferritin formation. The amount of bioavailable iron in
the hybrid lines was assessed using the Caco-2 cell model. Ferritin formation in the
cells is an index of iron bioavailability. One gram (dry weight) of each sample was
analyzed in the model. Statistical analysis was performed by one-way ANOVA and
student‘s t test. Column values (mean ± SEM, n = 6) with no letters in common are
significantly different (P < 0.05).
(2b) Grain bioavailable iron – 2008 harvest: Figures 2.4 – 2.5 show a
summary of grain bioavailable iron (as a percentage of the control) for the Mo17 and
B73 lines from the 2008 harvest. The statistical model for grain iron bioavailability
showed a significant difference in grain bioavailable iron in this IBM RI maize
population. A student‘s t-test revealed a significant difference in grain bioavailable
iron between the two groups—the Mo17 and B73 lines (P <.0001). There was a
significant difference in grain bioavailable iron across samples within the two groups.

48
Grain bioavailable iron was significantly different within the Mo17 lines (P <.0001)
and the B73 lines (P <.0001), respectively.
As mentioned earlier, maize samples harvested in 2008 were derived from
maize lines from the 2007 harvest. A comparison of grain bioavailable iron between
the parental lines (2007 harvest) and daughter lines (2008 harvest) revealed no
significant differences in grain iron concentration between the 2008 maize samples
and the parent 1 samples (P = 0.5688).
It is worth noting that the Caco-2 cell screening data from the 2007-2008
breeding cycle using the QTL approach isolated two hybrid maize lines from the 2007
maize population with identical grain iron concentration (20 ppm), but one line
contained double the amount of bioavailable iron (P = 0.0064). In the 2008 maize
population, we similarly found two inbred maize lines—sample 96 and sample 103—
with similar grain iron concentration but one line had significantly more bioavailable
iron (P < .0001). Grain iron nutrition details for the two inbred lines are shown in
Table 2.3. These results further enforce our hypothesis that the breeding method
employed is either enhancing levels of an iron bioavailability promoter, suppressing
an iron bioavailability inhibitor, or a combination of both. Additional research is
required to profile and identify the compounds.
Table 2.3: Grain iron concentration and bioavailable iron from inbreeds 96 and 103.
Inbred line (2008 harvest)
96 103
Mean grain iron concentration (ppm) 25.14 24.75
Caco-2 cell ferritin formation (ng/mg; mean ± SEM) 4.0 ± 0.2 29.0 ± 1.2

49
Caco-2 cell iron uptake
91 92 93 94 95 96 98 107
108
109
110
111
112
113
114
157
161
165
169
173
233
240
247
0
25
50
75
100
125
150
Reference sample
Mo17 lines (2008 harvest)
Bio
avai
labl
e ir
on (
% o
f co
ntro
l)
Figure 2.4: Caco-2 cell ferritin formation. The amount of bioavailable iron in the Mo17 lines (2008 harvest)
was assessed using the Caco-2 cell model. Ferritin formation in the cells is an index of iron bioavailability. One
gram (dry weight) of each sample was analyzed in the model. Bar values (mean ± SEM, n = 6).

50
Caco-2 cell iron uptake84
85
86
87
88
89
99
100
101
102
103
104
105
106
122
131
133
135
136
143
152
177
181
183
185
189
191
193
195
197
201
203
206
207
209
211
213
215
217
219
221
227
245
0102030405060708090
100110120130140150160170
Reference sample
B73 lines (2008 harvest)
Bio
avail
ab
le i
ron
(%
of
co
ntr
ol)
Figure 2.5: Caco-2 cell ferritin formation. The amount of bioavailable iron in the B73 lines (2008 harvest)
was assessed using the Caco-2 cell model. Ferritin formation in the cells is an index of iron bioavailability. One
gram (dry weight) of each sample was analyzed in the model. Bar values (mean ± SEM, n = 6).
51
Discussion
Studies on iron bioavailability have shown that simply increasing grain iron
content may not automatically result in improved iron bioavailability in the grain. It is
therefore a challenge when limited resources force breeders to choose between
breeding for iron content and breeding for iron bioavailability. Our breeding work
focused on breeding for iron bioavailability. The Caco-2 cell bioassay was used in this
study as an in vitro screening tool for bioavailable iron. The in vitro iron model allows
for rapid and cost-effective analysis of numerous genotypes and has produced iron
bioavailability results that have been consistent with genetic data obtained through the
QTL model.
The current breeding program that supports this study is based on the QTL
model and has been ongoing for the past seven years. In 2002 - 2003, new genetic
resources were created for a maize breeding program by Hoekenga (Owen Hoekenga,
personal communication). The objective was to create maize lines from the IBM RI
population that could be used for genetic analysis of multiple genetic traits in maize.
The preliminary data indicated breeding for improved iron nutrition in maize was a
complex task. Quantitative trait loci and marker-assisted analyses were carried out
using both single-marker analysis (SMA) and composite interval mapping (CIM). The
SMA that is less conservative identified ten QTL, while the more conservative CIM
identified three QTL that influenced iron bioavailability in maize. The data also
suggested that the iron biofortification breeding program should focus on grain iron
bioavailability relative to grain iron concentration (Hoekenga, manuscript submitted
for publication).
In 2002, the first cross between the B73 and IBM mapping lines was
backcrossed to the original maternal parent (B73). The resulting maize material was
self-pollinated (selfed) in 2005, producing about 600 sister maize lines that exhibited

52
either improved or diminished iron bioavailability potential. Due to limited resources
only 37 of these lines that had the most promise for iron biofortification were
evaluated using the Caco-2 cell assay. Analysis of grain iron concentration and grain
iron bioavailability in these lines confirmed the 3 QTL predicted in the initial study
and showed that iron traits were heritable and thus genetically tractable (Hoekenga et
al., manuscript submitted for publication).
The information derived from the Caco-2 cell bioassay (grain iron
bioavailability data) together with the information obtained from the QTL model (loci
identity) was then used to generate new maize varieties. Improved maize lines
exhibited superior QTL while the diminished lines exhibited inferior QTL (the three
iron bioavailability QTL isolated using CIM). In 2007, new lines were cross-pollinated
(improved vs. improved and diminished vs. diminished) to produce two hybrids with
improved and diminished iron bioavailability potential, respectively. As seen in the
results section, the hybrid pair had the same grain iron concentration but one line
contained double the amount of bioavailable iron (P < 0.001). Based on these results,
two new hybrid lines were created to produce a modest amount of grain that would be
used to test iron bioavailability in a poultry model. The results of this study are
presented in chapter 4 of this dissertation.
Also highlighted in the results section are two inbred maize lines—sample 96
and sample 103—from the 2008 maize population. These maize lines are similar to the
previously highlighted results of the 2007 hybrid maize lines. They showed identical
grain iron concentration (25 ppm) but one line had significantly more bioavailable
iron. These data suggest the following: (1) grain iron concentration in this maize
population is not significantly associated with grain iron bioavailability and (2) the
iron biofortification approach used affects iron bioavailability in maize by either
enhancing or suppressing secondary metabolites that affect iron bioavailability. It is

53
therefore plausible that the QTL approach is breeding for secondary compounds that
enhance iron bioavailability in maize. It could be that the breeding method suppresses
iron inhibitory compounds in the maize. Or that both scenarios play out at the same
time, enhancing iron promoters while suppressing iron inhibitors. It is also possible
that the QTL approach is breeding for secondary compounds that inhibit iron
bioavailability in maize. Metabolic profiling of the hybrids and inbred lines is required
to answer this question conclusively.
This study has yielded additional evidence that QTL information can be
combined with iron bioavailability data from the Caco-2 cell bioassay to
experimentally create or select candidate maize lines with either superior or inferior
iron nutrition qualities. Multi-year breeding studies have shown that the Caco-2
cell/QTL method gives consistent results and can be used to breed for improved iron
nutrition in maize provided that the resulting lines give the expected results in vivo.
Further research is required to search for additional QTL that may influence iron
bioavailability in maize and to determine the mode of gene action in the superior allele
maize lines. The current research work has focused mainly on temperate maize
varieties adopted for iron nutrition research. However, the target populations for iron
biofortification grow and consume mainly tropical maize varieties. Concomitant iron
biofortification efforts should therefore also focus especially on collaborating with
maize breeders in Sub-Saharan Africa to transfer superior alleles into tropical and sub-
tropical elite maize lines, assess bioavailability and genotype-by-environment
interaction, and finally conduct in vivo trials to determine the efficacy of consuming
such high bioavailable iron maize.

54
Conclusion
The IBM RI population selected for this study was based on easy availability
and the existence of advanced backcross families for rapid development of near-
isogenic lines. The alleles present in IBM RI may not represent the best alleles
available for improved iron nutrition quality in maize grain. For optimal effect, the
breeding program should therefore expand to identify any additional alleles that could
be included in the breeding process. And although iron biofortification of maize via
conventional breeding is a complex task, both grain iron content and iron
bioavailability are genetically tractable traits. The Caco-2 cell/ QTL approach, coupled
with in vivo testing can significantly improve iron bioavailability in maize grain. To
make further progress, additional work in molecular genetics as well as metabolite
testing is required. Collaboration with maize breeders in Sub-Saharan countries should
also be pursued.

55
REFERENCES
Drakakaki, G., Marcel, S., Glahn R. P., et al. (2005). Endosperm-specific co-
expression of recombinant soybean ferritin and Aspergillus phytase in maize
results in significant increase in levels of bioavailable iron. Plant molecular
biology, 59: 869- 880.
Glahn, R. P., Lee, O. A., Yeung, A., Goldman, M. I., & Miller, D. D. (1998). Caco-2
Cell ferritin formation predicts nonradiolabeled food iron availability in an in
vitro digestion/Caco-2 Cell culture model. Journal of Nutrition, 128(9), 1555-
1561.
Hoekenga, O. A., Mwaniki, A. M., Szalma S. S., Glahn, R. P., & Kochian, L. V.
(2010). Genetic and physiological analysis of iron biofortification in maize
kernels. Manuscript submitted for publication.
Nestel, P., Bouis, H. E., Meenakshi, J. V., & Pfeiffer, W. (2006). Biofortification of
staple food crops. Journal of Nutrition, 136(4), 1064.
Raboy, V. (2002). Progress in breeding low phytate crops. Journal of Nutrition, 132:
503S -505S.
Rutzke, M.A. (2002) An optical transfer interface system for an axially viewed plasma
improves analysis of biological samples. Ph.D. Dissertation, Cornell
University Libraries, January 2002.
Shamsuddin, A. M. Demonizing phytate. (2008). Nature biotechnology, 26(5):496.
Wainwright, J., & Mercer, K. (2009). The dilemma of decontamination: A Gramscian
analysis of the Mexican transgenic maize dispute. Geoforum, 40: 345-354.
Welch, R. M., & Graham, R. D. (2004). Breeding for micronutrients in staple food
crops from a human nutrition perspective. Journal of Experimental Botany,
55(396), 353-364.

56
Zimmermann, M., & Hurrell R. (2007). Nutritional iron deficiency. Lancet, 370
(9586): 511 – 520.

57
CHAPTER 3
ASSESSMENT OF GENOTYPE X ENVIRONMENT INTERACTION IN
IRON BIOFORTIFIED MAIZE
Abstract
This study was undertaken with two objectives: to evaluate the effects of
interaction between genotype and environment (G×E) and to determine the association
between soil iron status on grain iron concentration and the amount of bioavailable
iron in six maize genotypes grown in five diverse locations. Grain iron concentration
was determined using emission spectroscopy and grain iron bioavailability was
assessed using the Caco-2 cell bioassay. The six maize genotypes tested were derived
from the Intermated B73 x Mo17 recombinant inbred maize population and grown in
selected locations in New York, Missouri, North Carolina, Iowa, and Pennsylvania.
Grain iron concentration ranged from 17.34 ppm – 36.32 ppm. Grain iron
bioavailability ranged from 36.39% below to 75.26% above that of the reference
control sample. The results indicated a significant G×E interaction for both grain iron
concentration and grain iron bioavailability (P <.0001). Correlation data indicated a
highly significant (P<.0001) negative correlation between total soil iron and grain iron
bioavailability but no significant association between either soil extractable iron and
grain iron concentration or grain iron bioavailability. We conclude that (G×E)
interaction has an effect on iron trait expression.

58
Introduction
Maize (Zea mays L.) is one of the most important staple food crops in the
world. In Africa and Latin America, maize kernels are processed into a variety of
traditional food products such as pastes, gruels, porridges, tortillas and polenta. The
rural poor in these geographical regions rely mostly on monotonous cereal-based diets
to meet their nutrient requirements. Improving the nutritional quality of cereals such as
maize can therefore have a significant impact on their nutritional status.
Biofortification is an agricultural intervention that seeks to improve human
health by improving micronutrient levels in staple foods (Nestle et al., 2006). Using
conventional plant breeding, the biofortification strategy can significantly contribute
to alleviating micronutrient deficiencies such as iron deficiency anemia (IDA). To do
so the first step is to ensure that the enhancement of nutritional quality is under genetic
control. Next, possible interaction between genotypes and the environment (G×E)
must be investigated. To succeed, the potential enhancement of iron nutritional quality
in maize must be relatively stable across diverse environments (Welch & Graham,
2004). Recent studies have reported wide variations in grain iron concentration in
maize (Pfeiffer & McClafferty, 2007). One study that evaluated 1,814 maize
germplasms reported grain iron concentration ranging between 9.6 and 63.2 mg/kg.
These variations in concentration were attributed to both genetic and environment
effects (Bänziger & Long, 2000).
The expression of a phenotype of an individual plant is determined by both the
genotype and the environment. However, these two effects are not always additive
because of interaction between the genotype and the environment (G×E).
Equation 3.1: Phenotype = Genotype + Environment + (G×E) interaction

59
G×E interaction is a result of inconsistent genotype performance across environments
caused by variations due to location and/or climatic zone. A significant G×E
interaction results from changes in the magnitude of differences between genotypes in
diverse environments or from changes in the relative ranking of the genotypes
(Fernandez, 1991). To make any substantial progress in biofortification efforts, it is
vital that breeders evaluate and understand factors that contribute to G×E interactions
in their breeding programs, as this will reflect trait heritability, genetic variation, and
potential genetic gains.
An increasing body of evidence suggests that the expression of iron in cereals
such as maize can be subject to G×E interaction (Hoekenga et al., unpublished data).
The goal of our study was to assess the G×E interaction in maize derived from the
Intermated B73×Mo17 (IBM) maize population grown in diverse locations. The
selected lines had been grown in Aurora, New York in 2007 and chosen for further
study including the G×E evaluation study based on their iron bioavailability potential
determined using the Caco-2 cell in vitro iron model. In 2008, the same lines were
again grown in the New York location, and by our collaborators in selected locations
in Missouri, North Carolina, Iowa, and Pennsylvania. The objectives of the study
were: (i) to analyze grain iron concentration and amount of bioavailable iron from
grain samples grown in our selected locations; (ii) to determine the association
between soil iron status and both grain iron concentration and amount of bioavailable
iron from grain samples grown in our selected locations; and (iii) to evaluate grain
iron trait stability by analyzing the effects of genotype, environment and G×E
interaction on grain iron concentration and amount of bioavailable iron.

60
Materials and Methods
Chemicals, enzymes, and hormones: Unless otherwise stated, all chemicals,
enzymes, and hormones were purchased from Sigma Chemicals Co. To prepare
reagents for cell culture, 18 MΩ water was used. Glassware and utensils used in the
experiments were soaked in 1.2 M HCl for at least 4 hours and rinsed in deionized
water prior to use.
Plant materials and field site details: The maize varieties tested are derived
from the Intermated B73 x Mo17 (IBM) recombinant inbred (RI) maize population.
These lines were selected for this study on the basis of their iron bioavailability
potential, as indicated by the Caco-2 cell bioassay. Table 3.1 summarizes the genotype
description of the maize varieties. Four derivatives from the IBM RI population were
created to demonstrate significant differences in grain iron nutritional quality in maize.
Near-isogenic lines were derived from IBM RIL #264 by back-crossing to the B73
parent (high iron nutritional quality B73 or ―HB‖ and low iron nutritional quality B73
or ―LB‖) and from IBM RIL #039 by back-crossing to the Mo17 parent (―HM‖ and
―LM‖). The four near-isogenic varieties (HB, LB, HM, and LM) and their respective
hybrids (see Table 3.1) were initially grown in 2007 in Aurora, New York and
analyzed for iron concentration and amount of bioavailable iron. Based on their iron
bioavailability potential, the maize lines were grown at research farms owned by
Cornell University (Aurora, NY), Iowa State University (Boone, IA), North Carolina
State University (Clayton, NC), The Pennsylvania State University (Fairpoint, PA),
and The University of Missouri (Columbia, MO) in the Summer of 2008.

Table 3.1: Genotype description of the maize varieties.
Maize sample number1 Description
2 Iron bioavailability potential
3 Genotype number
1/ 1a/1b* IBM264 BC2 B73 S3
(LB)
Low (LB) 1
2/2a/2b IBM039 BC2 Mo17 S3
(LM)
Low (LM) 2
3/3a/3b LB×LM hybrid Low 3
4/4a/4b IBM264 BC2 B73 S3
(HB)
High (HB) 4
5/5a/5b 1BM039 BC2 Mo17 S3
(HM)
High (HM) 5
6/6a/6b HB×HM hybrid High 6
1. Maize varieties grown in 2008 in five selected locations; *some locations had replicate plots, hence the reference to a/b. Six
genotypes were grown in each location.
2. BC = Backcross; S = Self.
3. Iron bioavailability potential is based on the Caco-2 cell analysis of maize grown in Aurora, NY in 2007. Low iron nutritional
quality B73 and Mo17 lines are abbreviated LB and LM, respectively. High iron nutritional quality B73 and Mo17 lines are
abbreviated HB and HM, respectively.
61

62
Table 3.2 gives a brief description of the selected locations where the maize
trials were planted. The plots used in Aurora, New York had a Lima Silt Loam soil,
with average yield for maize of 120 bushels acre-1
and water extractable soil pH of 6.7.
The plots used in Boone, Iowa had a Webster Clay Loam soil, with average yield for
maize of 210 bushels acre-1
and water extractable soil pH of 6.1. The plots used in
Clayton, North Carolina had a Norfolk Loamy Sand soil, with average yield for maize
of 106 bushels acre-1
and water extractable soil pH of 6.4. The plots used in Fairpoint,
Pennsylvania had a Hagerstown Silt Loam soil, with average yield for maize of 135
bushels acre-1
and water extractable soil pH of 5.9. The plots used in Columbia,
Missouri had a Leonard Silt Loam soil, with average yield for maize of 176 bushels
acre-1
and water extractable soil pH of 6.3. These descriptions of soil conditions were
obtained from the Web Soils Survey of the National Resource Conservation Service
(http://websoilsurvey.nrcs.usda.gov).

Table 3.2: Brief description of selected locations where trials were planted.
Location1
Ecozones Altitude
(meters)
Annual Min/Max
Temp
( C)
Mean annual
rainfall
(cm)
Ames, IA Temperate grasslands /savanna and shrubland 304.80 3.4 - 16.7 92.20
Columbia, MO Temperate broadleaf /mixed forest 243.84 6.4 - 19.5 102.31
Clayton, NC Temperate broadleaf /mixed forest 106.68 8.3 - 22.2 116.08
Aurora, NY Temperate broadleaf /mixed forest 125.88 3.9 - 14.2 93.93
State College, PA Temperate broadleaf /mixed forest 384.05 4.2 - 15 100.99
63
1. IA = Iowa, MO = Missouri, NC = North Carolina, NY = New York, PA = Pennsylvania.

64
Maize sample preparation: Maize kernels (20g) were sorted to remove any
debris or damaged seeds and then placed in a 50 mL centrifuge tube and covered with
25 mL of 18 MΩ water. Samples were then autoclaved at 121° C and at a pressure of
115 kPa for 40 min, allowed to cool at room temperature, and then frozen overnight at
–20 C. Samples were then freeze-dried at 100 millTorr and a temperature of –50 C
for 7 days, ground to a fine powder with a coffee mill (90 sec), and stored in 50 mL
centrifuge tubes at 25 C. A tamale maize sample, used as a control in the Caco-2 cell
bioassay, was prepared in an identical manner.
Mineral analysis for maize samples: A 0.3g dry ground maize sample was
weighed into borosilicate glass test tubes and chemically digested using 4 mL of
concentrated nitric acid at 120 C until the residue was light brown to yellow in color.
Exactly 1.0 ml of a 50/50 mixture of concentrated nitric acid and perchloric acid was
then added, and the temperature was increased to 180 C. After 2 hours, the
temperature was further increased to 240 C until the digested samples were dry. After
cooling, 0.25 mL of concentrated hydrochloric acid was added to dissolve the ash.
One hour later, the sample was diluted with 10 mL of 5% nitric acid. The ashed
sample was then mixed and transferred into 15 mL auto sampler tubes and analyzed
on an axially viewed inductively coupled plasma (ICP) trace analyzer emission
spectrometer (model ICAP 61E trace analyzer, Thermo Electron, Waltham, MA; see
Rutzke, 2002).
Caco-2 cell screening: The in vitro Caco-2 cell iron model was used as a
screening tool to estimate the amount of bioavailable iron in the maize samples.
Cell Culture: Caco-2 cells were obtained from the American Type Culture
Collection (Rockville, MD) at passage 17 and used in experiments at passages 25–33.
Cells were seeded at a density of 50,000 cells/cm2 in collagen-treated six-well plates
(Costar Corp., Cambridge, MA). The cells were grown in Dulbecco‘s Modified Eagle

65
Medium (GIBCO, Grand Island, NY) with 10% v/v fetal calf serum (GIBCO), 25
mmol/L N-(2-Hydroxyethyl) piperazine-N‘-2-ethane sulfonic acid (HEPES), and 1%
antibiotic antimycotic solution (GIBCO). The cells were maintained at 37 C in an
incubator with a 5% CO2/95% air atmosphere at constant humidity, and the medium
was changed every 2 days. The cells were used in the iron uptake experiments at 13
days post seeding.
In Vitro Digestion: The preparation of the digestion solutions—pepsin,
pancreatin, and bile extract—and the in vitro digestion was performed as previously
published (Glahn et al., 1998). Briefly, a 1.0 g dry sample was used for each sample
digestion. Ascorbic acid (AA) was added to enhance iron bioavailability using a 20:1
AA: Fe molar ratio. Then 10 ml of pH 2 140 mM NaCl, 5 mM KCl buffer was added
to the samples, and the mixture was pH re-adjusted to pH 2. Following this step, 0.5
mL of pepsin solution was added to each of the samples prior to incubation. After a 1-
hour incubation period, the sample pH was adjusted to pH 5.5-6.0 with 1.0 M
NaHCO3, and after the addition of 2.5 mL of pancreatin-bile solution, the sample pH
was further adjusted to pH 6.9-7.0 with 1.0 M NaHCO3. Sample volumes were then
adjusted (by weight) to tube weight plus 15 g using the 140 mM NaCl, 5 mM KCl pH
6.7. Finally, 1.5 mL of the samples was transferred to appropriate inserts on the Caco-
2 cell plates.
Harvesting: The harvesting of the Caco-2 cell monolayers was performed as
previously published (Glahn et al., 1998). The cells were harvested after a 24-hour
incubation period. First, growth media were carefully aspirated off the cells. The cells
were then rinsed twice with 2 mL of 130mM NaCl, 5 mM PIPES, pH 6.7 buffer. To
harvest the cells, 2 mL of 18.2 M water was added to the cells, and the cells were
placed in a sonicator (Lab-line Instruments, Melrose Park, IL) at 4 C for 15 minutes.

66
The cells were then scraped off the plates, suspended in the 2 mL of 18.2 M water,
and transferred to pre-labeled 5 ml tubes in anticipation of protein and ferritin assays.
Cell Protein Analysis: Caco-2 cell protein was measured on samples that had
been solubilized in 0.5 mol/L NaOH, using a semimicro adaptation of the Bio-Rad DC
protein assay kit (Bio-Rad Laboratories, Hercules, CA). A 25 L sample of the
sonicated Caco-2 cell monolayer, harvested in 2 mL of water, was used for each
protein measurement expressed in mg.
Ferritin Analysis: A one-stage, two-site immunoradiometric assay was used to
measure Caco-2 cell ferritin content (FER-Iron II Ferritin Assay, RAMCO
Laboratories, Houston, TX). A 10 L sample of the sonicated Caco-2 cell monolayer,
harvested in 2 mL of water, was used for each ferritin measurement expressed per unit
of cell protein (ng ferritin/mg cell protein).
Soil Analysis: Soil samples from the five growing locations were analyzed for
organic matter and pH. The analyses were conducted by the Cornell Nutrient Analysis
Laboratory (Ithaca, NY). In their tests, lab staff followed methods provided in the Soil
Survey Laboratory Methods Manual developed by the National Soil Survey Center
(National Resources Conservation Service, United States Department of Agriculture).
Statistical Analyses: Statistical analyses of the data were performed using the
GraphPad Prism v4 (GraphPad Software, San Diego, CA) and JMP v7.0 (SAS
Institute Inc., Cary, NC) software packages. In some cases, the data were log-
transformed prior to analysis. Means were considered to be significantly different for
P values 0.05.
Results
The goal of this study was to determine if grain iron concentration and grain
iron bioavailability in the six maize genotypes were expressed consistently across all

67
five diverse locations. This is an important assessment because the success of iron
biofortified maize in addressing iron malnutrition, especially in diverse regions such
as Sub-Saharan Africa, will depend to a large extent on the stability of these iron traits.
(a) Grain iron concentration: The grain iron concentration of the six maize
genotypes grown in diverse environments was analyzed using emission spectroscopy.
Table 3.3 shows the grain iron concentration for each genotype by location. The grain
iron concentration ranged from 17.34 ppm (Genotype 1b, Iowa) – 36.32 ppm
(Genotype 4, New York). The mean grain iron concentration was 26.27 ppm.

68
Table 3.3: Grain iron concentration of maize varieties grown in five diverse locations.
Maize sample number1
Grain iron concentration by location2 (ppm)
IA MO NC NY PA
1/ 1a 17.6 ± 0.4 23.4 ± 4.0 22.4 ± 1.2 19.1 ± 0.1 19.7 ± 0.6
1b* 17.3 ± 0.7 25.3 ± 0.1 25.8 ± 0.4 - -
2/2a 25.2 ± 0.4 21.2 ± 0.2 24.0 ± 0.8 20.8 ± 0.3 21.1 ± 0.3
2b 21.3 ± 0.2 20.5 ± 0.2 23.6 ± 5.3 - -
3/3a 21.3 ± 0.8 22.8 ± 0.7 28.6 ± 0.7 19.9 ± 0.2 19.3 ± 0.1
3b 19.0 ± 0.5 30.4 ± 0.3 19.1 ± 0.4 19.6 ± 0.5 -
4/4a 24.6 ± 0.8 20.8 ± 0.7 19.0 ± 0.4 36.3 ± 0.6 20.8 ± 0.1
4b 25.5 ± 0.2 27.2 ± 6.0 30.1 ± 2.3 - -
5/5a 24.6 ± 0.1 30.1 ± 2.9 24.7 ± 0.6 27.5 ± 1.1 25.4 ± 0.5
5b 21.7 ± 0.6 21.6 ± 0.8 20.7 ± 0.5 - -
6/6a 23.6 ± 0.2 23.5 ± 1.7 21.4 ± 0.4 25.6 ± 1.6 21.5 ±0.1
6b 22.9 ± 0.5 22.2 ± 1.0 23.7 ± 1.0 30.4 ± 0.4 -
1. Maize varieties grown in 2008 in five selected locations; *some locations had replicate plots, hence the reference to a/b.
Six varieties (genotypes) were grown in each location.
2. Mean ± SD for; IA = Iowa, MO = Missouri, NC = North Carolina, NY = New York, PA = Pennsylvania.

69
A statistical analysis model was used to assess the effects of environment,
genotype, and the G×E interaction for grain iron concentration. As seen in Table 3.4,
there was a strong significant interaction term (G×E), and a main effect of genotype.
Table 3.4: Fixed-effects tests for grain iron concentration (JMP v7)
Source of variation DF F Ratio Prob > F
Environment 4 3.9162 0.1266
Genotype 5 12.2342 <.0001
Genotype*Environment 20 6.1573 <.0001
Further analysis of the G×E interaction was performed using contrast testing
across environments (Table 3.5). The data revealed significant differences in grain
iron concentration for genotypes 1, 3, 4, and 6 across the five locations—those in
Iowa, Missouri, North Carolina, New York, and Pennsylvania. The grain iron
concentration for genotypes 2 and 5 was not significantly different across the five
locations.
Table 3.5: Comparison of grain iron concentration across environments (JMP v7)
Source of variation: Environment DF F Ratio Prob > F
Genotype 1 4 8.2328 <.0001
Genotype 2 4 1.3043 0.2875
Genotype 3 4 5.6272 0.0012
Genotype 4 4 11.3467 <.0001
Genotype 5 4 1.5496 0.2095
Genotype 6 4 4.0832 0.0097
Assessment of the G×E interaction based on genotype (Table 3.6) indicated
significant differences in grain iron concentration between the six genotypes in the
Iowa, Missouri, and New York locations. The difference in grain iron concentration

70
between genotypes in the Pennsylvania location was significant after a bonferroni
correction for multiple comparisons. In the North Carolina location, there was no
significant difference in grain iron concentration across the six genotypes.
Table 3.6: Comparison of grain iron concentration between genotypes (JMP v7)
Source of variation: Genotype DF F Ratio Prob > F
IOWA 5 7.5779 <.0001
MISSOURI 5 4.1447 0.0010
NORTH CAROLINA 5 1.1416 0.3425
NEW YORK 5 19.1962 <.0001
PENNSYLVANIA 5 2.3561 0.0445
(b) Grain Iron bioavailability: Because the six maize genotypes were chosen
for the G×E evaluation study based on their iron bioavailability potential we analyzed
the iron bioavailability data in two ways; 1) Group data analysis for all the six growing
locations, and 2) Individual data analysis for the individual growing locations.
(1) Group data analysis: Amount of bioavailable iron was assessed using the
Caco-2 bioassay (Figure 3.1). The mean amount of bioavailable iron ranged from
36.39% below (Genotype 1; Pennsylvania) to 75.26% above (Genotype 5b; Missouri)
that of the reference control sample. The statistical analysis model assessed the effects
of environment, genotype, and the interaction of the two (G×E) for grain iron
bioavailability. As seen in Table 3.7, there was a strong significant interaction term
(G×E; P <.0001) and a significant main effect of both genotype (P <.0001) and
environment (P = 0.0025).

71
Figure 3.1: Caco-2 cell ferritin formation. The amount of bioavailable iron in G×E maize lines was assessed with the
use of the Caco-2 cell model. Ferritin formation in the cells is an index of iron bioavailability. One gram (dry weight) of
each sample was analyzed in the model. Bar values (mean ± SEM, n = 6). G×E = Genotype by Environment.
Caco-2 cell Fe uptake data
IA 1
aIA
1b
IA 2
aIA
2b
IA 3
aIA
3b
IA 4
aIA
4b
IA 5
aIA
5b
IA 6
aIA
6b
MO
1a
MO
1b
MO
2a
MO
2b
MO
3a
MO
3b
MO
4a
MO
4b
MO
5a
MO
5b
MO
6a
MO
6b
NC
1a
NC
1b
NC
2a
NC
2b
NC
3a
NC
3b
NC
4a
NC
4b
NC
5a
NC
5b
NC
6a
NC
6b
NY
1N
Y 2
NY
3a
NY
3b
NY
4N
Y 5
NY
6a
NY
6b
PA
1P
A 2
PA
3P
A 4
PA
5P
A 6
0
50
100
150
200
Reference control
(Tamale corn)
Genotypes
Bio
available
iro
n (
% o
f contr
ol)

72
Table 3.7: Fixed-effects tests for grain iron bioavailability (JMP v7)
Source of variation DF F Ratio Prob > F
Environment 4 72.6915 0.0025
Genotype 5 7.5441 <.0001
Genotype*Environment 20 5.0377 <.0001
Further analysis of the G×E interaction based on environment (Table 3.8)
revealed significant differences in grain iron bioavailability for all six genotypes
across all five locations.
Table 3.8: Comparison of grain iron bioavailability across environments (JMP v7)
Source of variation: Environment DF F Ratio Prob > F
Genotype 1 4 39.5151 <.0001
Genotype 2 4 26.4247 <.0001
Genotype 3 4 12.4183 <.0001
Genotype 4 4 20.8360 <.0001
Genotype 5 4 18.6711 <.0001
Genotype 6 4 8.1758 <.0001
Additionally, the assessment of the G×E interaction for grain iron
bioavailability based on genotype (Table 3.9) showed a strong significant difference in
grain iron bioavailability among the six genotypes in the Iowa, Missouri, New York,
and Pennsylvania locations. There was no significant difference in grain iron
bioavailability among genotypes grown in the North Carolina location.
Table 3.9: Comparison of grain iron bioavailability among genotypes (JMP v7)
Source of variation: Genotype DF F Ratio Prob > F
IOWA 5 9.090 <.0001
MISSOURI 5 5.7933 <.0001
NORTH CAROLINA 5 1.1087 0.3561
NEW YORK 5 6.8874 <.0001
PENNSYLVANIA 5 4.9439 0.0002

73
(2) Individual data analysis: As earlier mentioned, six maize genotypes were
grown in five diverse environments to evaluate the G×E interaction. The objective of
the individual data analysis was to further analyze the six maize genotypes in more
detail, so as to evaluate location-specific changes in the magnitude of differences
between genotypes or changes in the relative ranking of the genotypes. It was
expected, based on genotypic data, that samples 1, 1a, 1b, 2, 2a, 2b, 3, 3a, and 3b
would exhibit low bioavailability potential, while samples 4, 4a, 4b, 5, 5a, 5b, 6, 6a,
and 6b were expected to exhibit high bioavailability potential, with significant
differences between the two groups. The data analysis also compared the B73, Mo17,
and hybrid pair lines- LB vs. LM, HB vs. HM, and low vs. high respectively to
determine which of the two lines showed the expected responses in the individual
locations.
(i) Grain iron bioavailability – Iowa: There was a strong significant difference in
grain iron bioavailability among the six genotypes in the Iowa location (P < .0001).
Table 3.10 shows least square means differences in grain iron bioavailability
determined using Tukey HSD. Iron bioavailability of low bioavailability potential
inbreds and hybrids - 1a, 2a, 2b, 3a and 3b - was to expectation, with no significant
differences between these samples. Only sample 1b was significantly different from
the hybrids. Iron bioavailability of high bioavailability potential inbreds and hybrids –
4a, 4b, 5a, 5b, 6a and 6b - was to expectation, with no significant differences between
these samples. Comparing inbred and hybrid pair lines - samples 1 vs. 4, 2 vs. 5 and 3
vs. 6 - that were expected to have different iron bioavailability potentials, the data
showed significant differences in iron bioavailability in some of the inbreds but not the
hybrids.

74
Table 3.10: Least square means differences in grain iron bioavailability (Iowa)
Sample Iron bioavailability
potential Least Sq Mean
IA 5a High Mo17 A 61.214394
IA 6b High hybrid A B 58.113211
IA 6a High hybrid A B 57.775122
IA 5b High Mo17 A B C 51.418968
IA 3b Low hybrid A B C 48.682535
IA 3a Low hybrid A B C 47.804331
IA 4a High B73 A B C 46.648502
IA 4b High B73 A B C 45.234433
IA 2a Low Mo17 B C D 43.494930
IA 2b Low Mo17 C D 39.508113
IA 1a Low B73 C D 36.003422
IA 1b Low B73 D 27.242046
Levels not connected by same letter are significantly different.
(ii) Grain iron bioavailability – Missouri: There was a strong significant
difference in grain iron bioavailability among the six genotypes in the Missouri
location (P < .0001). Table 3.11 shows least square means differences in grain iron
bioavailability determined using Tukey HSD. Iron bioavailability of low
bioavailability potential inbreds and hybrids - 1a, 1b, 2b, 3a, and 3b was similar but
significantly differently from sample 2a. Iron bioavailability of high bioavailability
potential inbreds and hybrids – 4a, 4b, 5a, 5b, 6a and 6b - was erratic, with significant
differences between sample 5b and samples 4a, 4b, 6a and 6b; and sample 5a and
samples 4b and 6b. Comparing inbred and hybrid pair lines - samples 1 vs. 4, 2 vs. 5
and 3 vs. 6 - that were expected to have different iron bioavailability potentials, the
data showed no significant differences in iron bioavailability of the inbreds or hybrids.

75
Table 3.11: Least square means differences in grain iron bioavailability (Missouri)
Level Iron bioavailability
potential Least Sq Mean
MO 5b High Mo17 A 61.826652
MO 2a Low Mo17 A B 55.229579
MO 5a High Mo17 A B C 53.613752
MO 2b Low Mo17 A B C D 48.195062
MO 6a High hybrid B C D E 43.961985
MO 4a High B73 B C D E 42.068521
MO 3b Low hybrid B C D E 41.608298
MO 3a Low hybrid C D E 39.640411
MO 1b Low B73 D E 39.019928
MO 1a Low B73 D E 38.229385
MO 4b High B73 D E 35.876057
MO 6b High hybrid E 31.276452
Levels not connected by same letter are significantly different.
(iii) Grain iron bioavailability – North Carolina: There was a strong significant
difference in grain iron bioavailability among the six genotypes in the North Carolina
location (P < .0001). Table 3.12 shows least square means differences in grain iron
bioavailability determined using Tukey HSD. Iron bioavailability was significantly
different in some of the low bioavailability potential inbreds and hybrids, and some of
the high bioavailability potential inbreds and hybrids. Comparing inbred and hybrid
pair lines - samples 1 vs. 4, 2 vs. 5 and 3 vs. 6 - that were expected to have different
iron bioavailability potentials, the data showed no significant differences in iron
bioavailability between the pair groups but showed block differences between samples
3a and 3b, and samples 5a and 5b.

76
Table 3.12: Least square means differences in grain iron bioavailability
(North Carolina)
Level Iron bioavailability
potential Least Sq Mean
NC 1a Low B73 A 60.436106
NC 3a Low hybrid A 59.734394
NC 5b High Mo17 A 59.261932
NC 4a High B73 A 56.705525
NC 1b Low B73 A 56.222450
NC 6a High hybrid A 55.375447
NC 2a Low Mo17 A B 53.093886
NC 4b High B73 A B 52.981395
NC 6b High hybrid A B 50.779334
NC 2b Low Mo17 A B 47.491052
NC 5a High Mo17 B 38.570019
NC 3b Low hybrid B 37.541426
Levels not connected by same letter are significantly different.
(iv) Grain iron bioavailability – New York: There was a strong significant
difference in grain iron bioavailability among the six genotypes in the New York
location (P < .0001). Table 3.13 shows least square means differences in grain iron
bioavailability determined using Tukey HSD. Iron bioavailability of low
bioavailability potential inbreds and hybrids - 1, 2, 3a and 3b was similar. Iron
bioavailability of the high bioavailability potential hybrids (sample 6a and 6b) was
significantly different from that of the inbreds (samples 4 and 5). Comparing inbred
and hybrid pair lines - samples 1 vs. 4, 2 vs. 5 and 3 vs. 6 - that were expected to have
different iron bioavailability potentials, the data showed significant differences in iron
bioavailability only in the hybrid pairs – samples 3 vs. 6.

77
Table 3.13: Least square means differences in grain iron bioavailability (New York)
Level Iron bioavailability
potential
Least Sq
Mean
NY 6b High hybrid A 59.430278
NY 6a High hybrid A 55.778394
NY 2 Low Mo17 B 39.701743
NY 3b Low Hybrid B 37.855076
NY 5 High Mo17 B 37.714671
NY 1 Low B73 B 36.388594
NY 4 High B73 B 31.960686
NY 3a Low Hybrid B 29.945763
Levels not connected by same letter are significantly different.
(v) Grain iron bioavailability – Pennsylvania: There was a significant difference
in grain iron bioavailability among the six genotypes in the Pennsylvania location (P <
.0003). Table 3.14 shows least square means differences in grain iron bioavailability
determined using Tukey HSD. Iron bioavailability of low bioavailability potential
inbreds (samples 1 and 2) were similar but significantly different from the hybrid
(sample 3). Iron bioavailability of the high bioavailability potential inbreds and
hybrids (samples 4, 5 and 6) was not significantly different. Comparing inbred and
hybrid pair lines - samples 1 vs. 4, 2 vs. 5 and 3 vs. 6 - that were expected to have
different iron bioavailability potentials, the data showed no significant differences
between samples.
Table 3.14: Least square means differences in grain iron bioavailability
(Pennsylvania)
Level Iron bioavailability
potential Least Sq Mean
PA 3 Low hybrid A 57.838923
PA 5 High Mo17 A B 51.332505
PA 6 High hybrid A B 48.445494
PA 4 High B73 B C 41.599891
PA 2 Low Mo17 B C 39.595536
PA 1 Low B73 C 30.189753
Levels not connected by same letter are significantly different.

78
Overall, analysis of the individual locations showed the expected trend more in
superior allele lines (samples 4, 5 and 6) compared to inferior allele lines (samples 1, 2
and 3). Also, iron bioavailability in Mo17 lines was more to expectation compared to
B73 lines, which may suggest that B73 lines are more subject to G×E interaction.
(c) Soil Analysis: An important goal in this study was to determine the
association between soil iron status and both grain iron concentration and amount of
bioavailable iron from grain samples grown in our selected locations. Table 3.15
highlights some of the soil data collected in this study.
Table 3.15: Highlights of soil data collected from locations where trials were planted
Location Soil depth
(cm)
Row
Number
Extracted Fe
(mg/kg)
Total Fe
(mg/g)
pH
NEW YORK 10 40 19.4 8.0 7.5
NEW YORK 30 40 18.0 8.9 7.9
NEW YORK 10 80 29.5 8.2 7.7
NEW YORK 30 80 36.8 7.4 7.8
NEW YORK 10 120 26.5 7.8 7.5
NEW YORK 30 120 26.2 7.7 7.8
NEW YORK 10 180 19.2 7.8 7.6
NEW YORK 30 180 20.4 7.3 7.7
NEW YORK 10 221 23.6 7.7 7.6
NEW YORK 30 221 26.3 7.9 7.8
NEW YORK 10 261 19.8 7.5 7.6
NEW YORK 30 261 20.5 7.7 7.8
IOWA 10 - 47.3 5.2 6.1
IOWA 30 - 41.5 5.8 6.1
MISSOURI 10 - 66.1 4.9 6.2
MISSOURI 30 - 59.0 4.9 6.4
NCAROLINA 10 - 13.7 1.7 6.3
NCAROLINA 30 - 18.0 2.4 6.4
PENNSYLVANIA 10 - 22.6 7.3 6.1
PENNSYLVANIA 30 - 28.9 7.3 5.7

79
Figure 3.2 shows a one-way analysis of variance (ANOVA) of extracted soil
iron by location. As shown, there was a significant difference in the amount of
extracted iron from the five locations (P < .0001). The mean extracted soil iron was
29.17 mg/kg, and the mean range was 13.7 – 66.1 mg/kg.
One-way ANOVA of soil Extracted iron by Location
10
20
30
40
50
60
70
Extr
acte
d F
e
IOW
A
MIS
SO
UR
I
NC
AR
OLIN
A
NE
W Y
OR
K
PE
NN
Location
All Pairs
Tukey-Kramer
0.05
Figure 3.2: One-way analysis of variance (ANOVA) for iron extracted soil by location.
Analysis of all pairs was done using Tukey-Kramer (JMP v7). NCAROLINA = North
Carolina. PENN = Pennsylvania.
Figure 3.3 shows a one-way ANOVA of total soil iron by location. There was
a significant difference in the amount of total soil iron from the five locations (P <
.0001). The mean total soil iron was 6.67 mg/g, and the range was 1.7 – 8.9 mg/g.

80
One-way ANOVA of Total soil iron by Location
Figure 3.3: One-way ANOVA for total soil iron by location. Analysis of all pairs was
done using Tukey-Kramer (JMP v7). NCAROLINA = North Carolina. PENN = Pennsylvania.
Table 3.16 shows pairwise correlations for grain iron concentration, grain iron
bioavailability, soil extracted iron, total soil iron, and soil pH correlations. The aim of
the analysis was to determine the association between soil Fe status and both grain iron
concentration and amount of bioavailable iron from grain samples grown in our
selected location. The correlation data show a significant but negative correlation
between total soil iron and grain iron bioavailability. The correlation between soil pH
and soil extractable iron was also negative and significant, while the correlation
between soil pH and total soil iron was positive and significant. It is also important to
note that the correlation between grain iron concentration and grain iron
bioavailability was small and not significant, while that between total soil iron and
grain iron concentration was negative though not significant.
1
2
3
4
5
6
7
8
9
Tota
l Fe
IOW
A
MIS
SO
UR
I
NC
AR
OLIN
A
NE
W Y
OR
K
PE
NN
Location
All Pairs
Tukey-Kramer
0.05

81
Table 3.16: Pairwise correlations for grain iron concentration, grain iron
bioavailability, soil extracted iron, total soil iron and soil pH.
Variable by Variable Correlation Prob > F
Grain Fe Bioavailability Grain Fe concentration 0.2187 0.1270
Total soil Fe Grain Fe concentration -0.0264 0.8555
Total soil Fe Grain Fe Bioavailability -0.6517 <.0001
Soil extractable Fe Grain Fe concentration 0.0052 0.9712
Soil extractable Fe Grain Fe Bioavailability 0.1714 0.2339
Soil extractable Fe Total soil Fe 0.1811 0.2081
Soil pH Grain Fe concentration 0.2437 0.0881
Soil pH Grain Fe Bioavailability -0.0548 0.7053
Soil pH Total soil Fe 0.3531 0.0119
Soil pH Soil extractable Fe -0.3127 0.0270
The results presented clearly indicate a significant G×E interaction for both
grain iron concentration and grain iron bioavailability.
Discussion
As mentioned earlier, the G×E interaction is a result of inconsistent genotype
performance across environments. In this study we analyzed the effects of G×E
interaction on grain iron concentration and grain iron bioavailability for six genotypes
grown across five diverse locations. If the iron traits were relatively stable across these
locations, we expected that the expression of iron traits for individual genotypes would
be consistent across the locations, and the magnitude of difference between genotypes
or relative ranking of the genotypes within individual locations would similarly be
consistent. Overall there was a significant effect of G×E interaction for both grain iron
concentration and grain iron bioavailability. However, a further analysis of G×E
interaction for grain iron concentration showed that grain iron concentration for

82
genotypes 2 and 5 was consistently expressed across the five locations. In addition, the
North Carolina location stood out, as there was no significant difference in grain iron
concentration between the six genotypes grown there. A similar analysis for grain iron
bioavailability showed no significant difference in grain iron bioavailability among the
six genotypes grown in the North Carolina location. It is not clear if these results can
be attributed to soil properties or altitude, but it is worth noting that the North Carolina
location had the lowest altitude, mean total soil iron, and mean soil extractable iron.
Another goal of this study was to determine the association between soil iron
status and both grain iron concentration and amount of bioavailable iron from grain
samples grown in our selected locations. The data show no significant association
between soil extractable iron and either grain iron concentration or grain iron
bioavailability. There was however a highly significant (P<.0001) negative correlation
between total soil iron and grain iron bioavailability. This may suggest that our maize
genotypes would express more bioavailable iron if grown in soils that had low or poor
iron status. This is significant because land owned by poor farmers in target locations
such as Sub-Saharan Africa is likely to have mineral-deficient soils.
Conclusion
Micronutrient trait expressions and the extent of G×E interaction across
diverse environments can influence both screening and breeding methods used in an
iron biofortification program (Pfeiffer & McClafferty, 2007). The impact of
biofortified maize on the iron status of those suffering from iron deficiency will
depend to a large extent on the iron bioavailability of the maize genotypes. Our studies
have consistently shown no significant association between grain iron concentration
and grain iron bioavailability (Hoekenga et al, unpublished data). Our screening and
breeding methodologies have thus been based on grain iron bioavailability. Analysis

83
of grain iron bioavailability shows high G×E interaction. Since the major target areas
for biofortified crops are located in developing countries, additional progress in
breeding for iron biofortified maize requires that further breeding and G×E testing be
carried out in these target locations.

84
REFERENCES
Banziger, M., & Long, J. (2000). The potential for increasing the iron and zinc density
of maize through plant-breeding. Food and Nutrition Bulletin, 21(4), 397–400.
Fernandez, G. C. J. (l99l). Analysis of genotype x environment interaction by stability
estimates. HortScience, 26, 947-950.
Glahn, R. P., Lee, O. A., Yeung, A., Goldman, M. I., & Miller, D. D. (1998). Caco-2
Cell ferritin formation predicts nonradiolabeled food iron availability in an in
vitro digestion/Caco-2 Cell culture model. Journal of Nutrition, 128(9), 1555-
1561.
Nestel, P., Bouis, H. E., Meenakshi, J. V., & Pfeiffer, W. (2006). Biofortification of
staple food crops. Journal of Nutrition, 136(4), 1064.
Pfeiffer, W. H., & McClafferty, B. (2007). HarvestPlus: breeding crops for better
nutrition. Crop Science, 47 (Supplement 3).
Rutzke, M.A. (2002) An optical transfer interface system for an axially viewed plasma
improves analysis of biological samples. Ph.D. Dissertation, Cornell
University Libraries, January 2002.
Welch, R. M., & Graham, R. D. (2004). Breeding for micronutrients in staple food
crops from a human nutrition perspective. Journal of Experimental Botany,
55(396), 353-364.

85
CHAPTER 4
ASSESSMENT OF IRON BIOAVAILABILITY FROM
IRON BIOFORTIFIED MAIZE
Abstract
The aim of our study was to use the Caco-2 cell in vitro model and a poultry
model to test iron bioavailability in two select maize hybrid lines. The Caco-2 cell
model was used as an initial screening tool to estimate the amount of bioavailable iron
in the maize hybrid lines. The poultry iron model was used to confirm the in vitro
results and validate the breeding method employed in iron biofortification of the
hybrids. The Caco-2 cell bioassay data showed that the amount of bioavailable iron
differed significantly (P =.0014) in the two hybrid lines. The maize lines were then
used to formulate nutritionally balanced chicken diets (except for iron) that were fed
ad libitum to day-old Cornish Cross broiler chicks for 4 weeks. Feed intakes were
measured daily while weight and hemoglobin (Hb) were monitored weekly. Hb values
were used to estimate iron bioavailability from the diets. Although iron concentrations
in the two diets were similar (high bioavailability maize diet = 24.79±0.70 ppm and
low bioavailability maize diet = 24.39±0.32 ppm), significant differences in blood Hb
concentrations were observed between chicks consuming the two diets (P = .0004).
We conclude that conventional breeding can improve iron nutritional quality in maize
grain, thus providing significantly more bioavailable iron to growing chicks. Human
feeding trials should be conducted to determine the efficacy of consuming the high
bioavailable iron maize.

86
Introduction
Iron deficiency is the most widespread micronutrient deficiency in the world,
affecting approximately two billion people (Zimmermann & Hurrell, 2007). The
causal factors responsible for iron deficiency across the globe are complex and multi-
factorial, but its root cause is thought to be the prevalence of dysfunctional food
systems that fall short of delivering sufficient micronutrients to meet human
requirements (Welch & Graham, 2005). The consequences of iron deficiency anemia
(IDA) include impaired growth, retarded psychomotor and cognitive development in
children, damaged immune mechanisms with increased morbidity and mortality rates
in all age groups, and reduced work capacity in adults (WHO, 2001; Neumann, Gewa,
& Bwibo, 2004).
The traditional strategies that have been employed to address IDA include
dietary diversification, iron supplementation, and food fortification. Dietary
diversification is an ideal approach that aims to improve iron intake and bioavailability
but requires an educational component to achieve the desired changes in dietary
behaviors. Iron supplementation is a therapeutic strategy aimed at groups that are
highly susceptible to IDA. However, logistical constraints such as poor infrastructure
and poor compliance at the individual level can reduce the effectiveness of
supplementation (Zimmermann & Hurrell, 2007). In addition, recent studies show that
untargeted iron supplementation in children living in regions to which malaria is
endemic may result in increased risk of morbidity and mortality (Sazawal et al., 2006).
On the other hand, iron fortification of foods is a practical and cost-effective
prophylactic approach to iron deficiency and anemia. Nevertheless, in populations
with limited access to fortified foods it is less effective (Zimmermann & Hurrell,
2007). These traditional strategies have had some success in reducing the burden of
IDA in some populations.

87
In 1995, the Consultative Group on International Agriculture Research
(CGIAR) initiated a micronutrients project that focused on linking agriculture and
nutrition through ―biofortification‖ of staple food crops (Graham, Welch & Bouis,
2001). Biofortification is defined as the process of breeding improved food crops that
are rich in bioavailable iron, beta carotene and/or zinc. Biofortification of staple foods
is thought to be a potential complementary strategy for alleviating IDA in at-risk
populations, and it presents a number of advantages, especially the potential for
providing more micronutrients at an affordable cost via the agricultural system. Thus,
by targeting resource-poor populations that grow and consume their own food, the
biofortification strategy would more effectively reach populations with limited access
to diet diversification, iron fortification, or supplementation (Nestle et al., 2006;
Mayer, Pfeiffer & Beyer, 2008).
Successful micronutrient biofortification requires, of course, that nutritionally
improved crop lines be efficacious (Welch & Graham, 2004; Nestle et al., 2006).
Simply increasing iron concentration in a staple food like maize does not necessarily
reduce IDA incidence because this does not necessarily enhance bioavailability (Borg
et al., 2009). Because the importance of bioavailability in the uptake of micronutrients
such as iron is widely recognized, bioavailability studies will play a key role in
assessing the biofortification process (Welch et al, 2000). The ideal approach would
be to conduct iron bioavailability studies in humans. Such studies are, however,
extremely expensive and often require refinement of objectives via appropriate in vitro
and in vivo animal iron models in order to ensure success.
A number of in vitro and in vivo animal models are available for determining
iron bioavailability (Wienk, Marx & Beynen, 1999). In vitro methods provide an
attractive, rapid, and low-cost option for initial screening of iron bioavailability.
Solubility and dialyzability are in vitro techniques that have previously been used to

88
predict iron bioavailability. They do not, however, measure iron bioavailability
completely, greatly diminishing their usefulness (Fairweather-Tait et al, 2007; Miller
& Berner 1989). The development of an in vitro iron bioavailability model that
mimics the gastric and intestinal digestion of humans, coupled with cultures of human
Caco-2 cells, has shown great promise in addressing iron bioavailability issues (Yun et
al., 2004; Au & Reddy, 2000; Glahn et al., 1998). The in vitro digestion/Caco-2 cell
iron model has been used in previous studies to predict iron bioavailability, and was
used in this study as a screening tool (Glahn et al., 2002; Pynaert et al., 2006).
In vivo animal models are very useful in studying the mechanism of iron
absorption and understanding iron bioavailability. Rodents and more recently piglets
have been the models of choice for iron bioavailability studies. Although similarities
in gastrointestinal anatomy and physiology between pigs and humans attract
researchers to that model, the large size of pigs makes it an expensive model to
employ. The rat model is relatively less expensive but may not be ideal given that rats
are much more efficient at absorbing iron than are humans (Welch et al., 2000). The
poultry model has been used effectively in some iron bioavailability studies (Wienk,
Marx & Beynen, 1999), and has been proposed as a suitable in vivo model for iron
bioavailability (Tako, Rutzke & Glahn, 2010). The poultry model was thus adopted for
initial screening of biofortified maize in this study because it has been shown to
respond appropriately to differences in iron bioavailability in foods. In addition, a
feeding trial using the poultry model can accommodate modest amounts of sample
material produced by breeders with restricted plot sizes or in the initial stages of a
biofortification project.
The focus of our project has been iron biofortification in maize. This chapter
evaluates two hybrid maize lines that were identified during the genotype screening
process using the Caco-2 cell model, with the expectation that they would have

89
significant differences in iron nutritional quality while being largely similar in other
respects. We present results from the Caco-2 cell assay and a 4-week poultry feeding
trial. The goal of this chapter is to validate the quantitative trait loci (QTL) approach
for iron bioavailability while addressing the following question: Are significant
differences in iron bioavailability between the hybrids as seen in the in vitro
digestion/Caco-2 cell iron model reflected in the in vivo poultry model?
Materials and Methods
Chemicals, enzymes, and hormones: Unless otherwise stated, all chemicals,
enzymes, and hormones were purchased from Sigma Chemicals Co. To prepare
reagents for cell culture, 18 MΩ water was used. Glassware and utensils used in the
experiments were soaked in 1.2 M HCl for at least 4 hours and rinsed in deionized
water prior to use.
Maize samples: The two maize varieties tested in the poultry feeding trial are
derived from the Intermated B73 x Mo17 (IBM) recombinant inbred (RI) maize
population. These lines were selected for the poultry feeding trial based on their
parents‘ Caco-2 cell assay data. The parents are near isogenic line sister pairs (more
that 90% genetically identical to each other) that were isolated from a Caco-2 cell
assay screening of 54 maize lines planted in 2007 on a Cornell University research
farm in Aurora, NY (see Figure 4.1). The parental genotypes that exhibited high
bioavailability potential (high bioavailability B73; C-025 and high bioavailability
Mo17; C-052) were crossed to produce a daughter genotype referred to in the data as
the High×High hybrid. The parental genotypes that exhibited low bioavailability
potential (low bioavailability B73; C-028 and low bioavailability Mo17; C-030) were
crossed to produce a daughter genotype is referred to in the data as the Low×Low
hybrid. For the poultry feeding trial, the High×High hybrid forms the Group H diet—

90
the high bioavailability maize diet— and the Low×Low hybrid forms the Group L
diet—the low bioavailability maize diet. The maize lines were bred via conventional
breeding guided by the Caco-2 cell/ quantitative trait loci (QTL) model.
Oneway Analysis of Bioavailable Fe (% of control) By Sample
Figure 4.1: One way analysis of bioavailable iron in inbred parents of hybrids tested
in the poultry feeding trial. The parental genotypes that exhibited high bioavailability
potential were high bioavailability B73 (HB) C-025 and high bioavailability Mo17
(HM) C-052. The parental genotypes that exhibited low bioavailability potential were
low bioavailability B73 (LB) C-028 and low bioavailability Mo17 (LM) C-030. The
high bioavailability inbreds had significantly more bioavailable iron than the low
bioavailable inbreds (P < .0001). HB and HM were crossed to produce a High×High
hybrid. LB and LM were crossed to produce a Low×Low hybrid.
Maize sample preparation: Maize kernels (20g) were sorted to remove any
debris or damaged seeds and then placed in a 50 mL centrifuge tube and covered with
25 mL of 18 MΩ water. Samples were then autoclaved at 121 C and at a pressure of
115 kPa for 40 min, allowed to cool at room temperature, and then frozen overnight at
–20 C. Samples were then freeze-dried at 100 millTorr and a temperature of –50 C
for 7 days, ground to a fine powder with a coffee mill (90 sec), and stored in 50 mL
50
60
70
80
90
100
110
Bio
availa
ble
Fe
(% o
f contr
ol)
C-025 (HB) C-028 (LB) C-030 (LM) C-052 (HM)
Sample
All Pairs
Tukey-Kramer
0.05
91
centrifuge tubes at 25 C. A tamale maize sample, used as a control in the Caco-2 cell
bioassay, was prepared in an identical manner.
Mineral analysis for maize and liver samples: A 0.3g dry ground maize sample
or a 0.4 g chicken liver tissue sample was weighed into borosilicate glass test tubes
and chemically digested using 4 mL of concentrated nitric acid at 120 C until the
residue was light brown to yellow in color. Exactly 1.0 ml of a 50/50 mixture of
concentrated nitric acid and perchloric acid was then added, and the temperature was
increased to 180 C. After 2 hours, the temperature was further increased to 240 C
until the digested samples were dry. After cooling, 0.25 mL of concentrated
hydrochloric acid was added to dissolve the ash. One hour later, the sample was
diluted with 10 mL of 5% nitric acid. The ashed sample was then mixed and
transferred into 15 mL auto sampler tubes and analyzed on an axially viewed
inductively coupled plasma (ICP) trace analyzer emission spectrometer (model ICAP
61E trace analyzer, Thermo Electron, Waltham, MA; see Rutzke, 2002).
Caco-2 cell screening: The in vitro Caco-2 cell iron model was used as a
screening tool to estimate the amount of bioavailable iron in the maize samples.
Cell Culture: Caco-2 cells were obtained from the American Type Culture
Collection (Rockville, MD) at passage 17 and used in experiments at passages 25–33.
Cells were seeded at a density of 50,000 cells/cm2 in collagen-treated six-well plates
(Costar Corp., Cambridge, MA). The cells were grown in Dulbecco‘s Modified Eagle
Medium (GIBCO, Grand Island, NY) with 10% v/v fetal calf serum (GIBCO), 25
mmol/L N-(2-Hydroxyethyl) piperazine-N‘-2-ethane sulfonic acid (HEPES), and 1%
antibiotic antimycotic solution (GIBCO). The cells were maintained at 37 C in an
incubator with a 5% CO2/95% air atmosphere at constant humidity, and the medium
was changed every 2 days. The cells were used in the iron uptake experiments at 13
days post seeding.

92
In Vitro Digestion: The preparation of the digestion solutions—pepsin,
pancreatin, and bile extract—and the in vitro digestion was performed as previously
published (Glahn et al., 1998). Briefly, 1.0 g of dry samples was used for each sample
digestion. Ascorbic acid (AA) was added to enhance iron bioavailability using a 20:1
AA: Fe molar ratio. Then 10 ml of pH 2 140 mM NaCl, 5 mM KCl buffer was added
to the samples, and the mixture was pH re-adjusted to pH 2. Then 0.5 mL of pepsin
solution was added to each of the samples prior to incubation. After a 1-hour
incubation, the sample pH was adjusted to pH 5.5 to 6.0 with 1.0 M NaHCO3, and
after the addition of 2.5 mL of pancreatin-bile solution, the sample pH was further
adjusted to pH 6.9-7.0 with 1.0 M NaHCO3. Sample volumes were then adjusted (by
weight) to tube weight plus 15 g using the 140 mM NaCl, 5 mM KCl pH 6.7. Finally,
1.5 mL of the samples was transferred to appropriate inserts on the Caco-2 cell plates.
Harvesting: The harvesting of the Caco-2 cell monolayers was performed as
previously published (Glahn et al., 1998). The cells were harvested after a 24-hour
incubation period. First, growth media were carefully aspirated off the cells. The cells
were then rinsed twice with 2 mL of 130mM NaCl, 5 mM PIPES, pH 6.7 buffer. To
harvest the cells, 2 mL of 18.2 M water was added to the cells, and the cells were
placed in a sonicator (Lab-line Instruments, Melrose Park, IL) at 4 C for 15 minutes.
The cells were then scraped off the plates, suspended in the 2 mL of 18.2 M water,
and transferred to pre-labeled 5 ml tubes in anticipation of protein and ferritin assays.
Cell Protein Analysis: Caco-2 cell protein was measured on samples that had
been solubilized in 0.5 mol/L NaOH, using a semimicro adaptation of the Bio-Rad DC
protein assay kit (Bio-Rad Laboratories, Hercules, CA). A 25 L sample of the
sonicated Caco-2 cell monolayer, harvested in 2 mL of water, was used for each
protein measurement expressed in mg.

93
Ferritin Analysis: A one-stage, two-site immunoradiometric assay was used to
measure Caco-2 cell ferritin content (FER-Iron II Ferritin Assay, RAMCO
Laboratories, Houston, TX). A 10 L sample of the sonicated Caco-2 cell monolayer,
harvested in 2 mL of water, was used for each ferritin measurement expressed per unit
cell protein (ng ferritin/mg cell protein).
Poultry Feeding Trial: The in vivo poultry model was used to estimate iron
bioavailability in the two maize samples. The experiment was conducted at the Cornell
University Poultry farm in Ithaca, NY. All animal protocols were approved by the
Cornell University Institutional Animal Care and Use Committee. Figure 4.2 shows an
overview of the study design.
Subjects: Fertile chicken eggs were incubated for 21 days before hatching.
Seventeen day-old Cornish Cross broiler chicks were then randomized based on
weight, into three groups—6 chicks in each of the 2 study groups, and 5 chicks in the
positive-control group. Each group was housed in a temperature-controlled metabolic
cage on a 12-hour light/dark cycle.
Diet and diet administration: The chicks were introduced to the experimental
diet immediately after hatching and allowed ad libitum feed and water intake. Maize
iron and phytate concentration, and diet composition and iron concentration are shown
in Table 4.1.

94
Figure 4.2: Overview of the study design

95
Data and tissue collection: As highlighted in Figure 4.1, feed intake data were
collected daily. Body weight and blood samples were taken at baseline, then weekly
for 4 weeks. At the end of the study, liver tissue was also sampled.
Hemoglobin (Hb) measurements: Blood Hb concentrations were determined
using the cyanmethemoglobin method following the manufacturer‘s kit instructions.
Hb values were used in this study to calculate total body hemoglobin iron and
hemoglobin maintenance efficiency values for the chickens in the feeding trial.

96
Table 4.1: Diet composition and iron concentration data for poultry trial
Ingredient Group H Group L Group C
g/kg diet
Ground maize1 750 750 750
Choline Chloride 0.75 0.75 0.75
Maize oil 30 mL 30 mL 30 mL
Maize starch 46.25 46.25 46.25
DL-Methionine 2.5 2.5 2.5
Dry skim milk 100 100 100
Ferric citrate - - 0.5
Vitamin/Mineral premix (no iron)2 70 70 70
Iron & Phytate concentrations
Iron in maize (ppm)
Mean ± SD, n= 3 21.23±0.23 18.79±0.41 18.07±1.04
Iron in diet (ppm)
Mean ± SD, n= 3 24.79±0.70 24.39±0.32 116.54±2.49
Phytate in maize (µmoles/g)
Mean ± SD, n= 2 10.88±0.08 10.28±0.08 -
1Ground maize—group H: high bioavailability hybrid maize (cooked); group L: low
bioavailability hybrid maize (cooked); group C (Positive-control group): commercially
purchased maize (uncooked).
2A vitamin/mineral premix was purchased from Dyets, Inc (Bethlehem, PA). The
premix provided (per kg diet): retinyl palmitate, 1208 µg; ergocalciferol, 5.5 µg; dl- -
tocopheryl acetate, 10.72 mg; menadione, 0.5 mg; d-biotin, 0.05 mg; choline chloride,
0.5 g; folic acid, 0.3 mg; niacin, 15 mg; Ca-D panthothenate, 10 mg; riboflavin, 3.5
mg; thiamin, 1 mg; pyridoxine, 1.5 mg; cyanocobalamin, 17.5 µg; CuSO4·5H2O, 6
mg; C2H8N2·2HI (ethylene diamine dihydroiodine), 0.14 mg; MnO, 4 mg; Na2SeO3,
0.3 mg; ZnO, 100 mg.

97
Total body hemoglobin iron (Hb Fe): Total body hemoglobin iron for each
chick was calculated from body weight (BW), Hb concentration and estimated blood
volume using the following formula:
Hb Fe = BW (kg) × [0.06 L blood/kg BW] × Hb (g/L blood) × [3.35 mg Fe/g Hb]
Hemoglobin maintenance efficiency (HME): Hemoglobin maintenance
efficiency values were calculated as follows:
HME = Hb Fe, mg (final) – Hb Fe, mg (initial) × 100%
Total Fe intake, mg
Statistical Analyses: Statistical analyses of the data were performed using the
GraphPad Prism v4 (GraphPad Software, San Diego, CA) and JMP v7.0 (SAS
Institute Inc., Cary, NC) software packages. Repeated measures analysis was done for
all repeated measurements. In some cases, the data were log-transformed prior to
analysis. Means were considered to be significantly different for P values 0.05.
Results
The initial screening of the maize hybrid lines using the Caco-2 cell bioassay
showed significant differences between varieties. The goal of our study was to
establish if the differences seen in the in vivo iron model would be evident in the avian
model. In this study we analyzed two near isogenic hybrid lines derived from the IBM
RI maize population. The hybrids were identical essentially everywhere except for the
iron grain bioavailability QTL where they had either all superior or inferior alleles.
Here we present results from the Caco-2 cell bioassay and the poultry feeding trial.

98
(a) Caco-2 cell experiment
Figure 4.3 shows in vitro estimates of the amount of bioavailable iron (ng/mg)
in the daughter hybrid lines. As in the parental lines, the amount of bioavailable iron in
vitro was significantly different between the daughter hybrid lines (P =.0014).
Figure 4.3: Caco-2 cell ferritin formation. The amount of bioavailable iron in maize
hybrids (daughter lines) was assessed with the use of the Caco-2 cell model. Ferritin
formation in the cells is an index of iron bioavailability. One gram (dry weight) of
each sample was analyzed in the model. Statistical analysis was performed by one-
way ANOVA and student‘s t test. Column values (mean ± SEM, n = 6) with no letters
in common are significantly different (P < 0.05).
(b) Poultry Feeding Trial
(i) Feed intake, Daily iron intake, and Body weight: The cumulative feed
intake, mean daily iron intake, and body weight development of the chicks are
summarized in Table 4.2.
Feed intake: Statistical analysis revealed that there was a week-and-diet effect
on feed intake but no interaction (diet × week) effect. Throughout the study, feed
intake was lowest in Group C and this differed significantly from that measured in
Caco-2 cell iron uptake
High X High hybrid Low X Low hybrid 0
102030405060708090
100110
0
10
20
30
40
50a
b
Daughter hydrid lines
Bio
avail
ab
le i
ron
(%
of
co
ntr
ol)
ng
ferritin
/mg
cell p
rote
in

99
Groups H and L (P <.0001). However, feed intake increased consistently in all three
groups during the study, and feed intake for each week was significantly different
from that of every other week (P <.0001).
Table 4.2: Cumulative feed intake, daily iron intake, and body weight of the chicks.
Study week
Week 1 Week 2 Week 3 Week 4
Feed intake (g)
Group
H3
378.3±24.84dα
773.6±16.59cα
1235.8±27.12bα
1732.9±23.40*aα
Group L 402.0±28.28dα
817.4± 11.57cα
1125.9± 20.05bα
1569.5± 24.71aα
Group C 314.1± 9.82dβ
550.2± 8.30cβ
858.2± 20.86bβ
1436.2±34.21aβ
Week 1 Week 2 Week 3 Week 4
Daily iron intake (mg)1
Group H 1.56 ± 0.62dβ
2.74 ± 0.4cβ
4.38 ± 0.67bβ
6.14 ± 0.58aβ
Group L 1.63 ± 0.69dβ
2.85 ± 0.28cβ
3.92 ± 0.49bβ
5.47 ± 0.60aβ
Group C 6.10 ± 1.14dα
9.16 ± 0.97cα
14.29 ± 2.43bα
23.91± 3.99aα
Week 1 Week 2 Week 3 Week 4
Body weight (g)1
Group H 89.65±24.08dα
150.90±55.86cα
256.55±106.81bα
382.24±102.68aα
Group L 91.03± 8.68dα
142.42±44.95cα
223.07± 102.65bα
303.07±166.39aα
Group C 77.02± 5.38dα
119.30±28.13cα
180.66± 72.00bα
237.08±112.17aα
1Mean±SD.
2 Values in same row (English alphabet)/column (Greek alphabet) with different
superscript letters are significantly different; (P < 0.05). 3Group H (n = 6): High bioavailability maize diet, Group L (n = 6): low
bioavailability maize diet, Group C (n = 5): Positive-control maize diet, *1 mortality.
100
Daily iron intake: Daily iron intake values were computed from daily feed
intake and diet iron concentration data. Group C had the highest daily iron intake,
which was significantly different from that of Groups H and L (P <.0001). Daily iron
intake did increase consistently in all three groups during the study and each week‘s
result was significantly different from that of every other week (P <.0001).
Body weight: The chicks grew well over the course of the study. Body weight
was not significantly different by treatment or diet (P = .3250) but was significantly
different by time (P <.0001).
(ii) Hemoglobin, Liver iron concentration, Hemoglobin iron and
Hemoglobin maintenance efficiency: Hemoglobin, liver iron concentration, total
body hemoglobin iron and hemoglobin maintenance efficiency are shown in Figure
4.4, Figure 4.5, Table 4.3 and Figure 4.6 respectively.
Hemoglobin: After an initial dip in hemoglobin (Hb) concentration, from day 8
on, chicks in Groups H and C showed an increase in Hb concentration, which leveled
off by the end of the study. However, chicks in Group L showed a steady decline in
Hb concentration (Figure 4.4). There was a strong diet and week effect on Hb
concentration. Hb concentration in Groups H and C was significantly different from
Group L (P = .0004) and Hb concentration differed significantly across weeks 2, 3 and
4 (P <.0001).

101
Figure 4.4: Hemoglobin trend during the poultry feeding trial. Blood samples were collected at baseline, day 8, day 15, day
22 and day 28, and hemoglobin concentration (Hb) analyzed using the cyanmethemoglobin method. Statistical analysis was
performed by repeated measures ANOVA. Hb concentration in Groups H and C was significantly different from Group L
(P = .0004). Hb concentration for weeks 2, 3 and 4 were significantly different from each other (P <.0001). Hb values
(mean ± SEM). Group H [n = 6 (n = 5 on day 28)]: High bioavailability maize diet, Group L (n = 6): low bioavailability
maize diet, Group C (n = 5): Positive-control maize diet.

102
Liver iron concentration: Liver iron concentration data are shown in Figure
4.5. Chicken livers were harvested at the end of the study and analyzed for iron
concentration by ICP-ES. Liver iron was highest in Group C, and differed
significantly (P <.0001) across all groups.
Figure 4.5: Liver iron concentration. Chicken livers were harvested on day 28 of
study and iron concentration determined using ICP-ES. 0.4 grams (wet weight) of
each sample (n=3) was analyzed. Statistical analysis was performed by Tukeys-HSD.
Bar values (mean ± SEM) with no letters in common are significantly different (p <
0.05). Group H (n=5): High bioavailability maize diet, Group L (n=6): low
bioavailability maize diet, Group C (n=5): Positive-control maize diet.
Total body hemoglobin iron (Hb Fe): As seen in Table 4.3, Group H had relatively
higher body Hb Fe during the study, which was significantly different from Groups L
and C (P =.0023). Body Hb Fe was also significantly different between weeks (P
<.0001) with weeks 3 and 4 being significantly different from week 1 and 2, and week
1 being significantly different from week 2.
Liver iron concentration
Group H Group L Group C0
20
40
60
80
100
120
140
b
c
a
Chicken group
liver
iro
n (
pp
m)

103
Table 4.3: Total body hemoglobin iron
Study day
Baseline Week 1 Week 2 Week 3 Week 4
Hb Fe (mg)
Group H3 - 1.83±0.49cα
3.53± 1.53bα
5.33±2.09aα
7.65 ±1.82aα*
Group L - 1.71± 0.16cβ
2.30±0.61bβ
3.43±1.47aβ
4.30±2.26aβ
Group C - 1.50± 0.10 cβ
2.71±0.90bβ
3.81±1.76aβ
4.76±2.25aβ
1Mean±SD.
2 Values in same row (English alphabet) /column (Greek alphabet) with different
superscript letters are significantly different; (p < 0.05). 3Group H (n=6): High bioavailability maize diet, Group L (n=6): low bioavailability
maize diet, Group C (n=5): Positive-control maize diet. *1 mortality
Hemoglobin maintenance efficiency (HME): HME provides an estimate of the
percentage of ingested iron that is absorbed and utilized to maintain hemoglobin
synthesis and the values were calculated using data collected during week 1, 2, 3 and
4. It is a slight underestimate because some of absorbed iron is incorporated into
myoglobin and other iron containing proteins and some is excreted. HME values for
Group H were significantly different from Group L (P < .0001), and differed across
weeks (P = 0.0147, see Figure 4.6). Because the goal of this study was to compare the
high bioavailable iron maize with the low bioavailable iron maize, only data from
these two groups are presented in Figure 4.6.

104
Figure 4.6: Hemoglobin maintenance efficiency values. HME values for Group H were significantly different from those of
Group L (P < .0001), and differed across weeks (P = 0.0147). Values (mean ± SEM). Group H [n = 6 (n = 5 on day 28)]:
High bioavailability maize diet, Group L (n = 6): low bioavailability maize diet.
Weeks on diet

105
Discussion
This chapter presents results collected on the bioavailability of iron in two
maize hybrids grown under field conditions in Poplar Ridge, New York. The maize
samples were selected for the poultry feeding trial based on the bioavailability
potential of their parents—high bioavailability maize vs. low bioavailability maize.
The daughter lines showed the same pattern in the Caco-2 cell model (Figure 4.3) and
were therefore formulated into nutritionally balanced diets (except for iron) for a
poultry feeding trial.
Our goal with the poultry feeding trial was to confirm the in vitro results and
validate the utility of the Caco-2 cell bioassay as a screening tool for use in maize
improvement programs. The chicken diets were formulated so that for the two
experimental diets—the high bioavailability maize diet and the low bioavailability
maize diet—the maize component would provide most of the iron to the growing
chicks. The control group was a positive control group, which served as an
experimental reference. The control diet was formulated according to National
Research Council (NRC) standards and a 0.5 g ferric citrate/kg diet was added to the
formula to provide additional iron to the chicks.
Although the two experimental diets exhibited similar levels of iron
concentration, as shown in Table 4.1, Hb concentration in blood collected from chicks
in the high bioavailability maize diet (Group H) differed significantly from that of the
chicks in the low bioavailability maize diet (Group L; P = .0004) during the course of
the study (weeks 2, 3, and 4; P <.0001). No significant differences were observed
between the high bioavailability maize diet (Group H) and the positive control group
(Group C) for blood Hb despite the differences in diet iron concentration. Group C
diet had a higher iron concentration (116.54 ppm) compared to the Group H diet

106
(24.79 ppm). This would suggest that absorption of iron citrate is different from the
absorption of native iron.
In addition, liver iron concentration was used to expand the bioavailability
data. As shown in Figure 4.5, liver iron values for the groups were significantly
different (P <.0001). The positive control group (Group C) had the highest liver iron
concentration, which indicates more storage iron compared to the other two groups.
Iron intake was similar between the high bioavailability maize diet (Group H) and the
low bioavailability maize diet (Group L), yet liver iron was significantly different
between the two groups. This would suggest that the high bioavailability maize diet
provided more bioavailable iron to the chicks than the low bioavailability maize diet.
The hemoglobin maintenance efficiency (HME) values were another piece of
data that demonstrated that the iron in the high bioavailability maize diet is more
bioavailable than that in the low bioavailability maize diet. As seen in Figure 4.6,
HME values for Group H were significantly different from Group L (P < .0001). The
two diets - the high bioavailability maize diet (Group H) and the low bioavailability
maize diet (Group L) - had the same iron concentrations, but different amounts of
absorbed iron as shown by the hemoglobin data. The two maize lines were identical in
every respect except for their iron grain bioavailability alleles. The high bioavailability
maize line had superior alleles while the low bioavailability maize line had inferior
alleles. It is plausible that the difference in the amount of bioavailable iron in the two
hybrids lines can be attributed to either the presence of iron promoter compounds in
the high bioavailability maize hybrid line or the presence iron inhibitory compounds in
the low bioavailability maize hybrid line or both. Further research is needed to identify
and isolate the compounds.
As already defined, biofortification is the process of enriching the nutrient
quality of staple food crops via plant breeding or biotechnology. Biofortification as an

107
agricultural intervention has the potential to provide a sustainable solution to
populations who are at high risk of micronutrient malnutrition. The success of such a
strategy requires, however, that the nutrients in food crops be bioavailable. Iron is a
critical nutrient in the diet as it plays a fundamental role in oxygen transport and
energy metabolism. However, the bioavailability of non-heme iron from plant foods is
influenced and hindered by many factors. Thus it is vital that the potential
enhancement of iron nutritional quality in foods include bioavailability testing.
Crop improvement activities in conventional breeding can produce a vast
amount of varieties. The same is true of iron biofortification in maize. Therefore in
order to rank samples, or determine which plant lines have potential or show promise
for enhanced iron content or quality, a screening method is required. The Caco-2 cell
iron model has been used as a screening bioassay for in vitro assessment of the amount
of bioavailable iron in numerous studies and was likewise used in our study to conduct
the initial screening of the maize lines. One objective for the poultry feeding trial was
to confirm the in vitro results. The agreement between the in vivo and in vitro data
therefore validates the Caco-2 cell bioassay as a screening method for iron biofortified
maize.
Another objective of the study was to validate the breeding method employed
in iron biofortification of the hybrids. Genotype data generated from the QTL model
indicated that the two hybrid lines were dissimilar, exhibiting different bioavailability
potentials. This was reflected in both the Caco-2 cell data and the poultry feeding trial
data. All three data sets are in agreement, which validates the QTL model. These
results are a clear indication that iron biofortification of maize is feasible.
Previous iron bioavailability studies on iron biofortified staple foods have been
very successful and have paved the way for subsequent research. A case in point is the
study of iron bioavailability from iron biofortified rice. The initial screening of the

108
enriched lines was done using a rat model (Welch et al., 2000). In their study, Welch
et al. identified a rice genotype—IR68144—developed at the
International Rice
Research Institute (IRRI) to be of special interest. Based on these results, Hass et al.
(2005) conducted a human efficacy trial designed to test the biological effects of
consuming the biofortified rice. The results from a 9-month human feeding trial
provided the first indication that breeding for enhanced micronutrient content can
result in a measurable improvement in nutritional status. Our initial efforts toward
breeding for improved iron quality in maize have been encouraging. However, a
human feeding trial similar to the one conducted by Haas et al. is required to further
validate the QTL breeding strategy and to determine whether iron biofortification in
maize is a practical and sustainable strategy for mitigating iron malnutrition in at-risk
populations.
Conclusion
Iron deficiency is a worldwide, endemic public health problem. Food-system-
based interventions such as biofortification may provide a practical and sustainable
solution for at-risk populations. If biofortification is to succeed, however, enriched
nutrients in foods must be bioavailable. Bioavailability testing is thus an essential
aspect of the biofortification process. The in vivo results presented in this chapter
using two selected maize hybrid genotypes show that conventional breeding can
improve the iron quality in maize, thus providing significantly more bioavailable iron
to growing chicks. These findings support the biofortification strategy for iron in
maize but a human feeding trial is required to confirm the efficacy of the iron
biofortified lines and should thus be prioritized.

109
REFERENCES
Au, A. P., & Reddy, M. B. (2000). Caco-2 Cells Can Be Used to Assess Human Iron
Bioavailability from a Semipurified Meal. Journal of Nutrition, 130(5), 1329-
1334.
Borg, S., Brinch-Pedersen, H., Tauris, B., & Holm, P. B. Iron transport, deposition and
bioavailability in the wheat and barley grain. Plant and Soil, 325(1),15-24.
Fairweather-Tait, S., Phillips, I., Wortley, G., Harvey, L., & Glahn, R. (2007). The use
of solubility, dialyzability, and Caco-2 cell methods to predict iron
bioavailability. International Journal for Vitamin and Nutrition Research,
77(3), 158.
Glahn, R. P., Lee, O. A., Yeung, A., Goldman, M. I., & Miller, D. D. (1998). Caco-2
Cell ferritin formation predicts nonradiolabeled food iron availability in an in
vitro digestion/Caco-2 Cell culture model. Journal of Nutrition, 128(9), 1555-
1561.
Glahn, R. P., Cheng, Z., Welch, R. M., & Gregorio, G. B. (2002). Comparison of iron
bioavailability from 15 rice genotypes: Studies using an in vitro
digestion/Caco-2 cell culture model. Journal of Agriculture & Food Chemistry,
50(12), 3586-3591.
Graham, R. D., Welch, R. M., & Bouis, H. E. (2001). Addressing micronutrient
malnutrition through enhancing the nutritional quality of staple foods:
Principles, perspectives, and knowledge gaps. Advances in Agronomy, 70, 77-
142.
Haas, J. D., Beard, J. L., Murray-Kolb, L. E., del Mundo, A. M., Felix, A., &
Gregorio, G. B. (2005). Iron-biofortified rice improves the iron stores of
nonanemic Filipino women. Journal of Nutrition, 135(12), 2823-2830.

110
Mayer, J. E., Pfeiffer, W. H., & Beyer, P. (2008). Biofortified crops to alleviate
micronutrient malnutrition. Current Opinion in Plant Biology, 11(2), 166-170.
Miller, D. D., & Berner, L. A. (1989). Is solubility in vitro a reliable predictor of iron
bioavailability? Biological Trace Element Research, 19(1), 11-24.
Nestel, P., Bouis, H. E., Meenakshi, J. V., & Pfeiffer, W. (2006). Biofortification of
staple food crops. Journal of Nutrition, 136(4), 1064.
Neumann, C. G., Gewa, C., & Bwibo, N. O. (2004). Child nutrition in developing
countries. Pediatric Annals, 33(10), 658-674.
Pynaert, I., Armah, C., Fairweather-Tait, S., Kolsteren, P., van Camp, J., & Henauw,
S. D. (2007). Iron solubility compared with in vitro digestion–Caco-2 cell
culture method for the assessment of iron bioavailability in a processed and
unprocessed complementary food for Tanzanian infants (6–12 months). British
Journal of Nutrition, 95(04), 721-726.
Rutzke, M.A. (2002). An optical transfer interface system for an axially viewed
plasma improves analysis of biological samples. Ph.D. Dissertation, Cornell
University Libraries, January 2002.
Sazawal, S., Black, R. E., Ramsan, M., Chwaya, H. M., Stoltzfus, R. J., Dutta, A., et
al. (2006). Effects of routine prophylactic supplementation with iron and folic
acid on admission to hospital and mortality in preschool children in a high
malaria transmission setting: Community-based, randomised, placebo-
controlled trial. Lancet, 367(9505), 133-143.
Tako, E., Rutzke, M. A., & Glahn, R. P. (2010). Using the domestic chicken (Gallus
gallus) as an in vivo model for iron bioavailability. Poultry Science, 89(3),
514-521.

111
Welch, R. M., & Graham, R. D. (2004). Breeding for micronutrients in staple food
crops from a human nutrition perspective. Journal of Experimental Botany,
55(396), 353-364.
Welch, R. M., & Graham, R. D. (2005). Agriculture: The real nexus for enhancing
bioavailable micronutrients in food crops. Journal of Trace Elements in
Medicine and Biology, 18(4), 299-307.
Welch, R. M., House, W. A., Beebe, S., Senadhira, D., Gregorio, G., & Cheng, Z.
(2000). Testing iron and zinc bioavailability in genetically enriched beans
(Phaseolus vulgaris L.) and rice (Oryza sativa L.) using a rat model. Food &
Nutrition Bulletin, 21(4), 428-433.
Wienk, K. J. H., Marx, J. J. M., & Beynen, A. C. (1999). The concept of iron
bioavailability and its assessment. European Journal of Nutrition, 38(2), 51-
75.
WHO/UNICEF/UNU. (2001). Iron deficiency anemia. Assessment, prevention and
control. A guide for programme managers. (WHO/NHD/01.3.). Geneva:
Switzerland: WHO.
Yun, S., Habicht, J. P., Miller, D. D., & Glahn, R. P. (2004). An in vitro
digestion/Caco-2 cell culture system accurately predicts the effects of ascorbic
acid and polyphenolic compounds on iron bioavailability in humans. Journal
of Nutrition, 134(10), 2717.
Zimmermann, M. B., & Hurrell, R. F. (2007). Nutritional iron deficiency. Lancet,
370(9586), 511-520.

112
CHAPTER 5
A CONCEPTUAL FRAMEWORK FOR BIOFORTIFICATION
Despite advances in science and medicine, micronutrient deficiencies,
including iron deficiency (ID), still affect over two billion people globally
(Zimmermann & Hurrell, 2007; WHO, 2001). From a purely food policy perspective,
there are three questions that must be answered if we are to understand better why
nutritional iron deficiency persists, especially in developing nations: 1) Who suffers
from iron deficiency? 2) Where are they located? 3) Why are they still suffering? In
many developing countries, populations at risk of developing iron deficiency are
usually economically poor. They comprise predominantly women of child-bearing
age, infants, and children. A majority reside in rural areas, where they grow their own
food and consume mainly what they produce. These populations are forced to rely on
dysfunctional food systems that fail to provide adequate quantities of the nutrients
they need. Under such conditions, nutritional deficiencies are inevitable.
In their quest to address micronutrient deficiencies, including ID, nutritionists
have focused on interventions such as diet diversification, supplementation as well as
food fortification. And although agriculture is the principal source of nutrients that
sustain human life, its role in addressing human nutrition issues, including nutrient
deficiencies, has not been fully exploited until recent years (Pinstrup-Andersen, 2000).
The emergence of biofortification as an agricultural intervention to address
micronutrient deficiencies among the rural poor who grow and consume their own
staple foods has provided the opportunity for a new paradigm for world agriculture
(Welch & Graham, 2000). The main advantage of biofortification is that it is a
sustainable approach that can complement traditional food-based approaches for
addressing micronutrient malnutrition.

113
Traditional interventions—diet diversification, supplementation, and food
fortification—have helped reduced the burden of iron deficiency, especially in
developed countries. The advantage of these interventions is that we have reliable
information about their implementation, efficacy, sustainability, and impact in
different parts of the world. Therefore they are safe and easy options in programs
designed to address micronutrient deficiencies. These interventions have, however,
produced relatively better results in developed countries than in developing countries.
Factors such as poor infrastructure, the need for centralized processing, limited human
resources, lack of financial resources, and lack of political will have resulted in limited
success in developing countries. In developing countries in which these interventions
have had some success, the urban population is usually better placed to benefit from
such intervention programs, leaving the rural poor sidelined with little benefit from
traditional interventions. Biofortification of staple foods can help bridge this gap by
directly targeting the rural poor, especially those who grow and consume their own
foods.
As shown in the conceptual framework (Figure 5.1), biofortification has the
potential to more effectively address iron deficiency among at-risk populations
because it addresses the root cause of the problem. If properly implemented, iron
biofortification of staple foods can result in increased iron intake or bioavailability that
can help increase body iron and maintain iron status for non-anemic individuals (Haas
et al, 2005). On the other hand, when coupled with other interventions such as
supplementation or post-harvest fortification, it is plausible that biofortification can
help improve the iron status of previously anemic individuals and help maintain
normal iron status (Bouis &Welch, 2010).

114
Figure 5.1: Conceptual framework for biofortification.
Biofortification
Outcomes
Improved iron status for
previously anemic subjects
Iron biofortification
Iron fortification
Iron supplementation
Dietary diversification & modification
Efficacious and
effective food
systems Increased iron
intake/
bioavailability
Improve and maintain
normal iron status for non-
anemic subjects
Exposure
Dysfunctional
food systems
Poor iron
intake/
bioavailability
Poor iron
status
Outcome
Nutritional iron
deficiency &
anemia
Physiological factors
Socioeconomic factors
Demographic factors

115
Farmer adoption and consumer acceptance are critical to the success of
biofortification (Welch & Graham, 2004). However, upstream research is equally
important. This research work has focused on three important goals: 1) to determine if
both iron concentration and iron bioavailability in maize are genetically tractable
traits, 2) to evaluate the magnitude of Genotype x Environment interaction in
biofortified maize, and 3) to assess iron bioavailability from iron biofortified maize.
Table 5.1 provides a summary of the research conducted and lessons learned.
The ultimate goal of our biofortification project should be to create elite maize
lines that can be adopted by farmers and accepted by consumers in target regions such
as Sub-Saharan Africa, where iron deficiency and anemia are significant public health
problems. The maize lines produced must therefore have excellent agronomical
qualities and be effective in reducing iron deficiency. Our research work, presented in
three studies (chapters 2–4), has highlighted a conventional breeding method—the
Caco-2 cell/QTL approach—that can be used to breed for enhanced iron
bioavailability in maize. We have also stressed the need to assess Genotype x
Environment interaction and shown proof of concept that conventionally bred iron
biofortified maize provides significantly more bioavailable iron to growing chicks.
The next step in the research work can be similarly study-specific, as shown:
Study 1: Enhancing iron bioavailability in maize using a Caco-2 cell/ QTL
model. As earlier mentioned, the alleles present in the maize population used in this
research work may not represent the best alleles available for iron biofortification.
Thus additional libraries should be screened for enhanced or diminished iron traits. In
addition, studies on the effects of various postharvest treatments, cooking, and storage
on grain iron nutrition retention should also be conducted.

116
Table 5.1: Summary of the research conducted and lessons learned.
Study Research Question(s) Lessons Learned & Recommendations
Study 1:
Enhancing iron
bioavailability in maize
using a Caco-2
cell/QTL model.
Is iron concentration in
maize a genetically tractable
trait?
Is iron bioavailability in
maize a genetically tractable
trait?
Grain iron content and grain iron
bioavailability can be genetically
manipulated and enhanced through
breeding.
The better approach to iron
biofortification in maize requires breeding
for enhanced grain iron bioavailability
relative to grain iron content.
Study 2:
Evaluating Genotype x
Environment
interaction in
biofortified maize.
Does growing biofortified
maize in diverse locations affect
iron concentration and/or iron
bioavailability in the maize
lines?
Genotype x Environment interaction has
an effect on iron trait expression.
Soil properties may also influence iron
trait expression.
Interdisciplinary research that includes
soil scientists and agronomists is needed
to better understand the soil effect.

117
Table 5.1 (Continued).
Study Research Question(s) Lessons Learned & Recommendations
Study 3:
Assessment of iron
bioavailability from
iron biofortified maize.
Are significant differences
in iron bioavailability as
measured by the Caco-2 cell in
vitro iron model reflected in an
in vivo iron model?
The Caco-2 cell bioassay and the poultry
model showed similar results on iron
bioavailability from the maize samples.
Caco-2 cell bioassay is an effective tool
for screening iron biofortified maize.
Conventional breeding can improve iron
nutritional quality in maize grain, thus
providing significantly more bioavailable
iron to growing chicks.
Human feeding trials should be conducted
to determine the efficacy of consuming the
high bioavailable iron maize.

118
Study 2: Evaluating Genotype x Environment interaction in biofortified maize.
This study called attention to the soil effect on iron bioavailability in the grain. Figure
5.2 presents data from a previous study by Hoekenga et al. that presented a similar
point.
As seen in Figure 5.2, maize lines from the IBM RI population were grown
three times in New York (NY; 2001, 2003, 2005) and once in North Carolina (NC;
2005) in replicated trials. What is striking about the data is that the grain iron
concentrations for maize grown in NC was double that grown in NY, as shown by the
median grain iron concentration numbers. The soil type in Aurora, NY was Lima silt
series Loam (alfisol) with pH 6.7, while the soil type in Clayton, NC was Norfolk
loamy series sand (ultisol) with pH 4.8. It is reasonable to assume that the low pH of
the NC soils allowed the plants to assimilate more iron from the rhizosphere, which
was then partly compartmentalized in the grain. The data thus suggest the need to
include soil scientists in iron biofortification projects, with the goal of identifying and
mapping soils in target regions that would be ideal for growing iron biofortified maize.

119
0
20
40
60
80
100
20 40 60
#R
IL p
er
bin
Grain iron concentration (ppm)
NY01-Fe NY03-Fe NY05-Fe NC05-Fe
Median SDRIL (reps)
16.4 2.191 (1)
16.5 3.2232 (1)
18.1 2.3257 (3)
36.3 5.9274 (2)
Figure 5.2: Grain iron concentration of maize grown in New York and North Carolina

120
Study 3: Assessment of iron bioavailability from iron biofortified maize. This
study raises positive prospects for iron biofortified maize. It is clear that human
feeding trials should be conducted to determine the efficacy of consuming high
bioavailable iron maize. Based on the amount of resources available and the research
question raised, single-meal or long-term studies can be used to assess iron
bioavailability in human subjects. This next step however raises two important study
questions:
Question 1. Long-term feeding trials are the definitive test for iron
biofortified foods. These ideally work with mildly anemic or non-anemic subjects.
However, if a long-term feeding trial is carried out in a malaria-endemic region, the
‗iron trap‖ is brought into question. How can this be best addressed?
The iron trap is defined as the interaction between increased intake of non-native
iron (via iron supplementation or food fortification) and susceptibility to infectious
diseases such as malaria (Friedman et al, 2009, Sazawal et al., 2006). The best
approach if working in a malaria-endemic area would be to have procedures in place
with which to closely monitor malaria, morbidity, and mortality and to have
intermittent preventive treatment built into the efficacy trial. If the research goal is
simply to show proof of concept, then an alternative approach would be to conduct the
study in an area that is not classified by the Centers for Disease Control or the World
Health Organization as a malaria-risk region.
Question 2. If on the other hand a single-meal study is selected, does it
matter whether extrinsic or intrinsic labeling is used? To better approximate iron
bioavailability from foods, many assessment techniques have incorporated either
radioisotopes or stable isotopes of iron into a meal. Intrinsic labeling of plants requires
growing plants in nutrient media labeled with an iron isotope. In contrast, extrinsic
labeling would involve adding iron isotope labels during preparation of test meals. The

121
extrinsic labeling technique is based on the assumption that complete isotopic
exchange takes place between an extrinsically added iron isotope label and the native
iron in the food so that the fractional absorption of the extrinsic label by human
subjects predicts total iron absorption. Data presented in a study by Cook et al (1972)
suggested that iron absorption from an intrinsic tag was very similar to that from an
extrinsic tag. Welch et al. (2000) argue, however, that although extrinsic labeling of
foods is easy and relatively inexpensive, poor equilibration of the extrinsic label would
cast the results from such studies into question. Some studies that have compared
intrinsic and extrinsic labeling in foods have questioned the use of extrinsic tags (Jin et
al, 2008; Heaney et al, 2000). Research on the subject in the context of biofortified
maize may be required to conclusively address this research issue.
Last but not least, additional research is required to further refine model
bioavailability systems used for screening iron biofortified crops. The Caco-2 cell in
vitro iron model has been invaluable in screening maize lines in this study. However,
to compare results from one experiment with those of another requires a control
sample to be used in the all experiments so that the sample: control ratios can be
compared. After careful thought, we decided to use Tamale maize grown and
consumed in Mexico as a control sample in our research work. If not wisely selected,
the control sample can be a limiting factor in the study, and this fact raises the issue of
how best to select a control sample. Is it necessary to have a synthetic control sample
in addition to a researcher‘s control sample? Further research should be dedicated to
addressing these questions.
The poultry model has been previously used to understand iron bioavailability,
and shows promise as an initial in vivo screening tool for iron biofortified foods (Tako,
Rutzke & Glahn, 2010). However, data and information about how to optimize the
model for an iron bioavailability trial is limited to a certain extent. This is especially

122
true when we consider the extensive information available on the pig and rat models.
It would thus be useful to devote further research to developing an iron bioavailability
study protocol for the poultry model and establishing hematological indices to guide
researchers as they conduct these studies.

123
REFERENCES
Bouis, H., & Welch R. M. (2010). Biofortification—A sustainable agricultural
strategy for reducing micronutrient malnutrition in the global south. Crop
Science, (50). DOI: 10.2135/cropsci2009.09.053. Published online 22 Jan
2010.
Cook, J. D., Layrisse M., et al. (1972). Food iron absorption measured by an extrinsic
tag. Journal of Clinical Investigation, 51(4): 805–815.
Friedman, J., Kurtis J., et al. (2009). The iron trap: iron, malaria and anemia at the
mother-child interface. Microbes and Infection, 11(4): 460-466.
Haas, J. D., Beard, J. L., Murray-Kolb, L. E., del Mundo, A. M., Felix, A., &
Gregorio, G. B. (2005). Iron-biofortified rice improves the iron stores of
nonanemic Filipino women. Journal of Nutrition, 135(12), 2823-2830.
Heaney, R., M. Dowell, et al. (2000). Bioavailability of the calcium in fortified soy
imitation milk, with some observations on method. American Journal of
Clinical Nutrition, 71(5): 1166.
Jin, F., Z. Cheng, et al. (2008). Extrinsic Labeling Method May Not Accurately
Measure Fe Absorption from Cooked Pinto Beans (Phaseolus vulgaris):
Comparison of Extrinsic and Intrinsic labeling of Beans. Journal of
Agricultural and Food Chemistry, 56(16): 6881-6885.
Pinstrup-Andersen, P. (2000). Improving human nutrition through agricultural
research: Overview and objectives. Food and Nutrition Bulletin, 21(4): 352-
355.
Sazawal, S., Black R. E., et al. (2006). Effects of routine prophylactic supplementation
with iron and folic acid on admission to hospital and mortality in preschool
children in a high malaria transmission setting: community-based, randomized,
placebo-controlled trial. Lancet, 367(9505): 133-143.

124
Tako, E., Rutzke, M. A., & Glahn, R. P. (2010). Using the domestic chicken (Gallus
gallus) as an in vivo model for iron bioavailability. Poultry Science, 89(3),
514-521.
Welch, R. M., House W., et al. (2000). Testing iron and zinc bioavailability in
genetically enriched beans (Phaseolus vulgaris L.) and rice (Oryza sativa L.) in
a rat model. Food and Nutrition Bulletin, 21(4): 428–433.
Welch, R. M., & Graham, R. D. (2002). Breeding crops for enhanced micronutrient
content. Plant and soil, 245(1), 205–214.
Welch, R. M., & Graham, R. D. (2004). Breeding for micronutrients in staple food
crops from a human nutrition perspective. Journal of Experimental Botany,
55(396), 353-364.
WHO/UNICEF/UNU. (2001). Iron deficiency anemia. Assessment, prevention and
control. A guide for programme managers. (WHO/NHD/01.3.). Geneva:
Switzerland: WHO.
Zimmermann, M. B., & Hurrell, R. F. (2007). Nutritional iron deficiency. Lancet,
370(9586), 511–520.