studies of copper-impregnated activated carbon for cyanide...
TRANSCRIPT

STUDIES OF COPPER-IMPREGNATED ACTIVATED CARBON FOR CYANIDE REMOVAL
by
SHAHRIZAM BIN SAAD
Thesis submitted in fulfilment of the requirements for the degree
of Master of Science
JANUARY 2007

ii
ACKNOWLEDGEMENTS
Firstly I would like to express my deepest gratitude to my supervisor, Dr. Norlia
Baharun for her guidance and support. Her fruitful ideas throughout the research
project has helped me accomplished this work successfully.
I would like to thank the Dean, School of Materials & Mineral Resources
Engineering, Institute of Graduate Studies and Universiti Sains Malaysia for giving me
an opportunity to move one step level of my study. Many thanks to all my colleagues,
for their useful assistance and co-operation. I would also like to thank all the technical
staffs of the School of Materials and Mineral Resources Engineering for their support
and guidance. Without their help and contributions from them, this text would not have
been possible.
Above all, I would like to dedicate this thesis to my wonderful and supportive
wife, Ku Salmah Ku Ismail for her understanding and patience during my difficult time
in accomplishing this thesis and for all the happiness she has brought me. My
heartiest appreciation goes to my sisters and brothers, my mother in law and father in
law for their blessings and constant encouragement during my years of academic
achievements.
I have received an abundance of supports and assistance, for which I’m
deeply grateful. All contributions in all aspect are deeply appreciated.
iii
TABLE OF CONTENTS
Page ACKNOWLEDGEMENTS ii
TABLE OF CONTENTS iii
LIST OF TABLES viii
LIST OF FIGURES ix
LIST OF PLATES xi
LIST OF ABBREVIATION xii
LIST OF APPENDICES xiii
LIST OF PUBLICATIONS & SEMINARS xiii
ABSTRACT xiv
ABSTRAK xvi
CHAPTER ONE : INTRODUCTION
1.0 Introduction 1
1.1
1.2
1.3
1.4
Research Background
Significant of Research
Research Objective
Scope of Research
1
4
4
5
CHAPTER TWO : THEORY AND LITERATURE REVIEW
2.1
Adsorption Theory, Concepts, and Models
6
2.2 Adsorption Principles 7
2.1.1 Surface Interactions 7
iv
2.3
2.4
2.5
2.6
2.7
2.8
2.9
2.10
2.11
2.12
2.13
2.14
Adsorbate-Solvent Properties
System Properties
Adsorbent Properties Activated Carbons
2.6.1 Formation and Manufacture of Activated Carbon
2.6.2 Pore Structure and Standard Tests for Activated
Carbon
Influence of the Adsorbate Type
General Adsorption Properties
Surface Chemistry and Its effects on Adsorption
Cyanide
2.10.1 The Chemistry of Free and Complex Cyanide
2.10.2 Chemical Behaviour of Cyanide Solutions
2.10.3 Interaction of Copper and Cyanide Ions 2.10.4 Free Cyanide 2.10.5 Oxidation to Cyanate Cyanide, Activated Carbon and Copper Impregnation
The Adsorption Isotherm
2.12.1 Usefulness of Adsorption Isotherm
2.12.2 Factors Affecting the Isotherms
a) Carbon preparation and dosage
b) pH
c) Temperature
d) Contact time
e) Sample filtration
2.12.3 Adsorption Equilibria
2.12.4 Freundlich Model
Methods of Treating Cyanide Tailings in Gold Plants
Waste Water Treatment
9
12
13
16
18
20
22
23
24
27
27
28
32
36
36
37
40
41
43
43
44
44
44
45
45
47
47
48
v
CHAPTER THREE: RESEARCH METHODOLOGY
3.1 Raw Materials 3.1.1 Activated Carbon
3.2 Reagent and Chemicals
3.3 Experimental Procedure
3.4 AC Preparation
3.5 Copper-impregnation Stage
3.6 Preparation of CN Solution
3.7 Cyanide Removal Experiment (CN adsorption)
3.7.1 Batch Test Studies
3.7.2 Batch Isotherm Studies
3.8 Sample Identification for Cyanide Removal Experiment
3.9 Analytical Method and Procedures
3.9.1 Cyanide Analysis
3.9.2 Cyanide Titration Procedure
3.9.3 Titrimetric Analysis of Copper
3.10 Characterization Studies
3.10.1 SEM studies on samples of impregnated and the non-
impregnated activated carbon
3.10.2 Infrared Spectrophotometry Study of Activated Carbon
(FT-ir)
3.10.3 BET (surface area analysis)
3.10.4 Copper Analysis Using Atomic Absorption
Spectrometer (AAS)
3.11 Column Adsorption Study
3.11.1 Mini-column Set-up
50
50
51
53
54
54
55
55
55
56
58
60
60
61
61
62
62
62
63
64
64
64
vi
4.1
4.2
4.3
4.4
4.5
4.6
CHAPTER FOUR: RESULTS AND DISCUSSION
CN Removal Experiment
4.1.1 Batch Test Studies
4.1.2 CN Removal by Different Type of Cu Salts (1.67% Cu
impregnated from Cu(II)SO4 and Cu(I)Cl2) and Different
of C Types at 15.0 g/L C Dosages
4.1.3 CN Removal by Different Type of AC (1.0% Cu
impregnated from Cu(I)Cl2) and at Different
Concentration of CN at 6.0 g/L C Dosages
Copper Adsorption Isotherm Test
4.1.1 Copper Adsorption isotherm experiment conducted on
different types of virgin AC at 100 ppm concentration of
Copper from CuSO4
CN Adsorption Capacity
4.3.1 Effect of Carbon Dosage
4.3.2 Effect of Copper Impregnation
4.3.3 Effect of AC Particle Size
4.3.4 Effect of Varying CN:Cu Molar Ratio
Characterization Studies
4.4.1 SEM Morphology and EDX
4.4.2 Infrared Spectrophotometry (FT-ir) Study of the
Activated Carbon 4.4.3 BET (Surface Area Analysis)
Optimization of Cyanide Removal
4.5.1 CN Removal by Cu(I)Cl2 Impregnated Carbon for
Different Type of Carbon Particle Size
4.5.2 CN Removal by Cu(II)SO4 Impregnated Carbon For
Different Type of Carbon Particle Size
4.5.3 CN Removal by Using ACVC Impregnated With
Cu(I)Cl2 nd Cu(II)SO4
4.5.4 Effect of pH
4.5.5 Effect of Copper Impregnation
4.5.6 Effect of Activated Carbon Particle Size
4.5.7 Effect of CN:Cu Molar Ratio
Column Adsorption Study
4.6.1 CN removal by a carbon column (copper-impregnated
carbon)
66
66
72
75
78
79
85
85
88
88
89
91
91
94
97
99
99
100
101
101
102
103
103
104
104

vii
CHAPTER FIVE 5.0 Conclusions BIBLIOGRAPHY References APPENDICES
107
112
A) Overall Data of CN Removal Experiment
118
B) FT-ir Results for virgin and impregnated carbon after CN adsorption
130
C) EDX for Activated Carbon Impregnated With Copper from CuCl2 and CuSO4
139
D) Data and Results from Batch Isotherm Study
143
viii
LIST OF TABLES
Page
2.1
2.2
3.1
3.2
3.3
3.4
3.5
3.6
3.7
3.8
3.9
3.10
3.11
4.1
4.2
4.3
4.4
4.5
4.6
4.7
The stability constants of some selected metal cyanide
complexes
Species present in typical gold processing liquors
Main Characteristics of Kekwa Activated Carbon
Main characteristics of Versatec Activated carbon
Chemicals and Reagent
Different sources of copper salts, carbon weight and % of
copper
The CN concentration used in CN removal experiment
Summary of identification of adsorption isotherm experiments
Different types of AC with different cyanide concentrations
Different types of AC with different cyanide concentrations
Different types of AC with different of CN concentration
Different types of AC impregnated with different source of Cu
Different types of AC with different concentration of cyanide
solution
Batch isotherm test results as summarized for Figures 4.15,
4.16, 4.17 and 4.18
Adsorption isotherm experiment conducted on different types
of virgin AC at 100 ppm concentration of Copper from CuCl2
% Cyanide adsorption at varying CN:Cu molar ratio for
ACVC type carbon Infrared spectral data showing the stretching frequencies and
V (C≡N) cm-1 for the various species observed
BET surface area analysis for different type of AC
Specification of activated carbon and % cyanide removal
The conclusion of column adsorption study results of Figure
4.34, 4.35, 4.36 and 4.37 above
31
32
50
51
52
54
55
57
58
58
59
59
60
82
85
89
95
97
101
106
ix
2.1
2.2
2.3
2.4
2.5
2.6
2.7
2.8
2.9
3.1
4.1
4.2
4.3
4.4
4.5
4.6
4.7
4.8
4.9
LIST OF FIGURES
Schematics showing internal structure of AC forms
Pore size distribution for AC, silica gel, activated alumina
Equilibrium adsorption of methane at 25°C on silica gel ,zeolite
5 and AC
Simplified schematic of some acidic surface groups on AC.
These groups are bonded to aromatic rings.
Relationship between HCN and CN- with pH
Eh-pH diagram for the CN-H2O system at 25°C
The Eh-pH diagram of the system Cu-CN-H2O at 298 K
pe-pH stability diagram for the CN-Cu-H2O system at [CN] =
1*10-2 M and [Cu] = 1.0 * 10-3 M
Effect of the ratio of cyanide to copper on the relative
equilibrium loading capacities of copper cyanide and gold
cyanide
Overall flow sheet of the research methodology carried out
CN removal efficiency for ACKK impregnated with CuCl2 and
virgin carbon in 50 and 100 ppm CN
CN removal efficiency for ACKP impregnated with CuCl2 and
virgin carbon in 50 and 100 ppm CN
CN removal efficiency for ACVA impregnated with CuCl2 and
virgin carbon in 50 and 100 ppm CN
CN removal efficiency for ACKK impregnated with CuCl2 and
virgin carbon in 50, 100 and 200 ppm CN
CN removal efficiency for ACKP impregnated with CuCl2 and
virgin carbon in 50, 100 and 200 ppm CN
CN removal efficiency for ACKK impregnated with CuSO4 and
virgin carbon in 50, 100 and 200 ppm CN
CN removal efficiency for ACKP impregnated with CuSO4 and
virgin carbon in 50, 100 and 200 ppm CN
CN removal using ACVA impregnated with Cu(II)SO4 and
Cu(I)Cl2 at higher copper level (1.67 % Cu, 15.0 g/L C) and for
virgin carbon in 100 ppm NaCN
CN removal using ACVC impregnated with Cu(II)SO4 and
Cu(I)Cl2 at higher copper level (1.67 % Cu, 15.0 g/L C) and for
virgin carbon in 100 ppm NaCN
Page
18
26
26
27
30
30
34
34
35
53
57
57
68
69
70
71
72
72
73
x
4.10
4.11
4.12
4.13
4.14
4.15
4.16
4.17
4.18
4.19
4.20
4.21
4.22
4.23
4.24
4.25
4.26
4.27
4.28
CN removal by using ACVH impregnated with Cu(II)SO4 and
Cu(I)Cl2 at higher copper level (1.67 % Cu, 15.0 g/L C) and
non-impregnated carbon (virgin carbon) from concentration of
NaCN solution at 100 ppm.
CN removal by using ACKK impregnated with Cu(I)Cl2 at
medium copper level (1.0 % Cu, 6.0 g/L C) at 50 and 100 ppm
of CN.
CN removal by using ACKP impregnated with Cu(I)Cl2 at
medium copper level (1.0 % Cu, 6.0 g/L C) at 50 and 100 ppm
of CN.
CN removal by using ACVA impregnated with Cu(I)Cl2 at
medium copper level (1.0 % Cu, 6.0 g/L C) at 50 and 100 ppm
of CN.
CN removal by using ACVC impregnated with Cu(I)Cl2 at
medium copper level ( 1.0 % Cu, 6.0 g/L C ) at 50 and 100
ppm of CN.
ACVC at 100 ppm concentration of CuSO4
ACKP at 100 ppm concentration of CuSO4
ACVA at 100 ppm concentration of CuSO4
ACKK at 100 ppm concentration of CuSO4
ACVC at 100 ppm concentration of CuCl2
ACKP at 100 ppm concentration of CuCl2
ACVA at 100 ppm concentration of CuCl2
ACKK at 100 ppm concentration of CuCl2
Cyanide adsorption capacity by Cu(II)SO4 impregnated (1.67%
Cu) carbon at different carbon weight.
Cyanide adsorption capacity by Cu(I)Cl2 (1.67% Cu)
impregnated carbon at different carbon weight.
Cyanide adsorption by using 7.5 g ACVC impregnated with
Cu(I)Cl2 and Cu(II)SO4. Cyanide adsorption and carbon loading impregnated with
CuCl2 and CuSO4
SEM photomicrographs of ACVC non-impregnated and
impregnated with copper
SEM photomicrographs of ACVH and ACVA non-impregnated
and pore diameter
74
75
76
77
78
80
80
81
81
83
83
84
84
85
86
87
89
92
93
xi
4.29
4.30
4.31
4.32
4.33
4.34
4.35
4.36
4.37
4.38
ACVC impregnated with 1.67% CuCl2 after CN adsorption
ACVC impregnated with 1.67% CuSO4 after CN adsorption
Pure NaCN
Cyanide removal by copper chloride impregnated carbon for
different types of carbon particle size
Cyanide removal by copper sulphate impregnated carbon for
different types of carbon particle size
Cyanide removal by using ACVC impregnated with copper
chloride and copper sulphate
ACVC impregnated with 1.67% Cu from CuSO4 with C Dosage
15 g/L at 100 ppm CN Concentration
ACVA impregnated with 1.67% Cu from CuSO4 with C Dosage
15 g/L at 100 ppm CN Concentration
ACKP impregnated with 1.67% Cu from CuSO4 with C Dosage
15 g/L at 100 ppm CN Concentration
ACKK impregnated with 1.67% Cu from CuSO4 with C Dosage
15 g/L at 100 ppm CN Concentration
96
96
97
99
100
101
104
105
105
106
LIST OF PLATES
Page
3.1 Batch test method
56
3.2 Mini-Column Set up
65
xii
LIST OF ABBREVIATION
AC Activated Carbon
ACKK Activated Carbon Kekwa K
ACKP Activated Carbon Kekwa P
ACVA
ACVC
ACVH
ASTM
atm
BET
C
Cu
CN
CIAC
EDX
FT-ir
GAC
MSC
PAC
Activated Carbon Versatec A
Activated Carbon Versatec C
Activated Carbon Versatec H
American Standard Test Method
Atmosphere
Surface Area Analysis (Breneure Emelt Teller)
Carbon
Copper
Cyanide
Copper-Impregnated Activated Carbon
Energy Disperse X-Ray
Fourier Transform Infrared Spectrophotometer
Granular Activated Carbon
Molecular-Sieve Carbon
Powder Activated Carbon
xiii
LIST OF APPENDICES
Page
A Overall Data of CN Removal experiment
118
B FT-ir Results for Virgin and impregnated carbon after CN adsorption
130
C EDX for Activated Carbon Impregnated With Copper from CuCl2 and CuSO4
139
D Data and Results of Batch Isotherm Study
143
LIST OF PUBLICATIONS & SEMINARS
1. Cyanide Adsorption Capacity By Using Copper-Impregnated
Activated Carbon (MAMIP, 2004)
2. Optimization of Metal-Impregnated Activated Carbon For Cyanide Removal (RCYC, 2003)
xiv
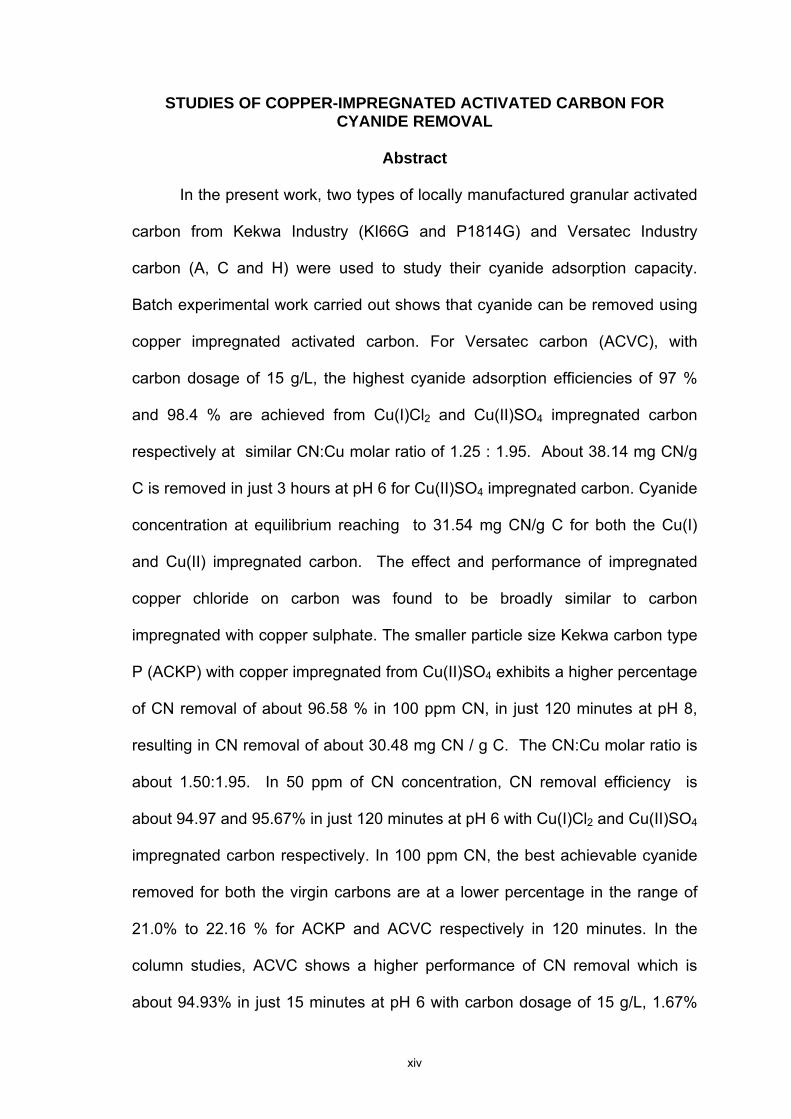
STUDIES OF COPPER-IMPREGNATED ACTIVATED CARBON FOR CYANIDE REMOVAL
Abstract
In the present work, two types of locally manufactured granular activated
carbon from Kekwa Industry (KI66G and P1814G) and Versatec Industry
carbon (A, C and H) were used to study their cyanide adsorption capacity.
Batch experimental work carried out shows that cyanide can be removed using
copper impregnated activated carbon. For Versatec carbon (ACVC), with
carbon dosage of 15 g/L, the highest cyanide adsorption efficiencies of 97 %
and 98.4 % are achieved from Cu(I)Cl2 and Cu(II)SO4 impregnated carbon
respectively at similar CN:Cu molar ratio of 1.25 : 1.95. About 38.14 mg CN/g
C is removed in just 3 hours at pH 6 for Cu(II)SO4 impregnated carbon. Cyanide
concentration at equilibrium reaching to 31.54 mg CN/g C for both the Cu(I)
and Cu(II) impregnated carbon. The effect and performance of impregnated
copper chloride on carbon was found to be broadly similar to carbon
impregnated with copper sulphate. The smaller particle size Kekwa carbon type
P (ACKP) with copper impregnated from Cu(II)SO4 exhibits a higher percentage
of CN removal of about 96.58 % in 100 ppm CN, in just 120 minutes at pH 8,
resulting in CN removal of about 30.48 mg CN / g C. The CN:Cu molar ratio is
about 1.50:1.95. In 50 ppm of CN concentration, CN removal efficiency is
about 94.97 and 95.67% in just 120 minutes at pH 6 with Cu(I)Cl2 and Cu(II)SO4
impregnated carbon respectively. In 100 ppm CN, the best achievable cyanide
removed for both the virgin carbons are at a lower percentage in the range of
21.0% to 22.16 % for ACKP and ACVC respectively in 120 minutes. In the
column studies, ACVC shows a higher performance of CN removal which is
about 94.93% in just 15 minutes at pH 6 with carbon dosage of 15 g/L, 1.67%
xv
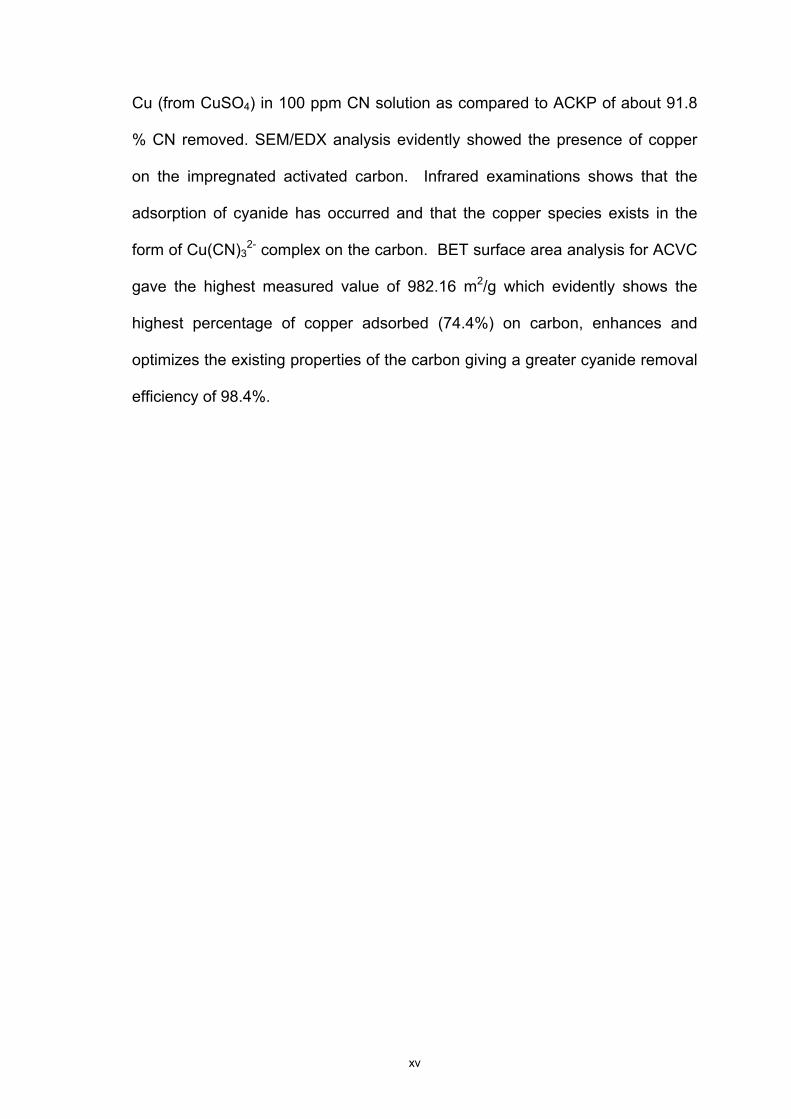
Cu (from CuSO4) in 100 ppm CN solution as compared to ACKP of about 91.8
% CN removed. SEM/EDX analysis evidently showed the presence of copper
on the impregnated activated carbon. Infrared examinations shows that the
adsorption of cyanide has occurred and that the copper species exists in the
form of Cu(CN)32- complex on the carbon. BET surface area analysis for ACVC
gave the highest measured value of 982.16 m2/g which evidently shows the
highest percentage of copper adsorbed (74.4%) on carbon, enhances and
optimizes the existing properties of the carbon giving a greater cyanide removal
efficiency of 98.4%.
xvi
KAJIAN TERHADAP KARBON TERAKTIF TERJERAP-ISI KUPRUM BAGI PENYINGKIRAN SIANIDA
Abstrak
Dalam kajian ini, dua jenis karbon teraktif tempatan jenis granul yang
dihasilkan oleh Kekwa Industri (KI66G and P1814G) dan Versatec Industri (A, C
dan H) telah digunakan untuk mengkaji keupayaan penjerapan sianida. Ujian
kelompok menunjukkan sianida boleh disingkirkan menggunakan karbon
teraktif terjerap isi kuprum. Bagi karbon Versatec (ACVC), dengan dos karbon
sebanyak 15 g/L, kecekapan penjerapan sianida yang tertinggi adalah pada
97% dan 98.4% bagi karbon terjerap isi Cu(I)Cl2 dan Cu(II)SO4 masing-masing
pada nisbah molar CN:Cu yang sama iaitu 1.25 : 1.95. Sebanyak 38.14 mg
CN/g C telah disingkirkan dalam masa 3 jam pada pH 6 bagi karbon terjerap isi
Cu(II)SO4 . Kepekatan sianida pada keseimbangan adalah sebanyak 31.54 mg
CN/g C terjerap bagi kedua-dua jerap isi Cu(I) dan Cu(II). Keberkesanan dan
prestasi karbon teraktif terjerap isi kuprum klorida adalah hampir sama dengan
karbon terjerap isi kuprum sulfat. Karbon Kekwa jenis P (ACKP), bersaiz
partikel lebih kecil dengan terjerap isi Cu(II)SO4 mempamerkan peratus
penyingkiran sianida yang lebih tinggi sebanyak 96.58% dalam 100 ppm CN
dalam masa 120 minit pada pH 8, memberikan penyingkiran sebanyak 30.48
mg CN / g C. Nisbah kemolaran CN:Cu adalah 1.50:1.95. Dalam 50 ppm CN,
peratus penyingkiran adalah sebanyak 94.97 dan 95.67% dalam masa 120
minit pada pH 6 dengan karbon terjerap isi CuCl2 dan CuSO4 masing-masing.
Dalam 100 ppm CN, penyingkiran sianida yang paling baik bagi kedua-dua
jenis karbon tanpa jerap isi (virgin carbon) pula adalah dalam julat yang agak
rendah iaitu dari 21.0% kepada 22.16% bagi ACKP dan ACVC masing-masing
dalam masa 120 minit. Dalam kajian kolum, ACVC menunjukkan prestasi
xvii
penyingkiran CN yang lebih tinggi iaitu sebanyak 94.93% dalam masa 15 minit
pada pH 6 dengan dos karbon sebanyak 15 g/L, 1.67% (Cu terjerapisi dari
CuSO4) dalam 100 ppm CN berbanding dengan ACKP iaitu sebanyak 91.8%
CN telah disingkirkan. Analisis SEM/EDX membuktikan kehadiran kuprum pada
karbon teraktif terjerapisi kuprum. Pemeriksaan infra-merah menunjukkan
berlakunya penjerapan CN ke atas karbon dan spesi kuprum wujud sebagai
kompleks Cu(CN)32- pada karbon. Analisis luas permukaan BET bagi ACVC
memberikan nilai luas permukaan karbon yang tertinggi iaitu sebanyak 982.18
m2/g, dengan peratus penjerapan kuprum tertinggi (74.4%) pada karbon
menambahkan dan mengoptimumkan sifat sedia ada karbon memberikan
keupayaan penyingkiran CN yang lebih baik sebanyak 98.4%.
.
1
CHAPTER 1 INTRODUCTION
1.1 Research Background
Waste water discharged by industrial activities is often contaminated by a
variety of toxic or otherwise harmful substances which have negative effects on
the water environment. For example, of metal finishing industry and
electroplating units is one of the major sources of heavy metals such as (Zn,
Cu, Cr, Pb etc.) and cyanide pollutants which contribute greatly to the pollution
load of the receiving water bodies and therefore increase the environmental risk
( Monser and Adhoum, 2002).
Cyanide present in effluent water of several industries. Cyanidation has
dominated the gold mining industry. In view of the toxicity of cyanide, and the
fact that cyanide is fatal in small dosages, authorities have been forced to
tighten up plant discharge regulations. It is therefore vital to recover as much
cyanide as possible, not only to meet standard requirements, but to strive
towards obtaining lower levels of free cyanide (CN-) in tailing and plant effluent.
(Monser and Adhoum, 2002).
The solubility of gold in cyanide solution was recognized as early as
1783 by Scheel (Sweeden) and was studied in the 1840s and 1850s by
Elkington and Bagration (Russia), Elsner (German) and Faraday (England).
Elkington also had a patent for the use of potassium cyanide solutions for
electroplating of gold and silver.
2
Cyanide is a singly-charged anion containing unimolar amounts of
carbon and nitrogen atoms triply-bounded together. It is a strong ligand,
capable of complexing at low concentrations with virtually any heavy metal.
Because the health and survival of plants and animals are dependent on the
transport of these heavy metals through their tissues, cyanide is very toxic.
Several systems have been adopted for the reduction of cyanide in mill
discharges. There are SO2 assisted oxidation, natural degradation, acidification-
volatilization-reneutralization, oxidation and biological treatment. However, in
the first three processes, cyanide reduction does not appear to meet the strict
regulatory requirements, and as for the fourth process, it is limited to certain
climate conditions. The next best process used, is the oxidation with hydrogen
peroxide where the cyanide concentration is reduced to low enough levels, but
this process requires an expensive reagent which cannot be reused. (Williams
and Petersen, 1996).
Adams, (1994) used activated carbon for the removal of free cyanide
from solution, but observed that copper-impregnated carbon yielded far better
cyanide removal. However, Adams, (1994), did not test other metal
impregnated carbons or different metal loadings on the carbon. The use of a
metal impregnated carbon system would therefore be more effective in reducing
cyanide concentrations in solution.
Due to the problem mentioned above, the study on using activated
carbon in the removal of free cyanide is being done in our laboratory. The
3
adsorption onto activated carbon has found increasing application in the
treatment of wastewater, as well as for the recovery of metals from cyanide
leached pulps. Activated carbon has a great potential for cyanide waste
treatment both in gold extraction plants and effluent from metal finishing plants
and hence, it forms a subject studied in the present work.
Characterization of activated carbon shows that surface area has an
effect although the reactivity of the surface as a result of oxygenated functional
groups, e.g. carboxylate and phenolate is thought to be significant in the
sorption of metal cations. Pore size distribution has been used to describe the
internal structures and adsorption capacities of activated carbons. (Davies et al,
1999). The highly active surface properties of the activated carbon are
attributed to the chemical functional groups and the internal surface areas,
which typically range from 500 to 3000 m2/g. (Tansel and Nagarajan, 2002).
(Adams, 1994) studied the effect of copper in the adsorption of cyanide
onto activated carbon. It was found that the removal capacity was highly
improved by the presence of copper (Monser and Adhoum, 2002). It is the aim
of this research to investigate the use of impregnated activated carbon for the
removal of cyanide for dilute solutions. Furthermore, specific attention will be
paid to factors influencing the performance of the impregnated carbon system,
so as to optimize the system in terms of cyanide removal.
4
1.2 Significant of Research
From the research done, the author would expect the investigation to
give further knowledge and understanding of how activated carbon contribute to
the waste water treatment, according to their good characteristic of large
surface area and hard-dense that can be regenerated and reuse. It is hope that
design will be able to achieve the objectives in order to minimize the heavy
metal concentration in the industrial waste disposal and to achieve optimum
adsorption of activated carbon. This research program is an environmental
friendly project. It emphasizes on the importance of conversation of
environmental surroundings. Thought this, it is hopeful that both research and
industry will reap mutual benefits.
1.3 Research Objective
• To study the characteristic of a locally manufactured granular
activated carbon from Kekwa Industry and Versatec Industry for
cyanide removal.
• To develop a process of copper-impregnation on the local activated
carbon for cyanide removal.
• To study the cyanide adsorption capacity of the copper-impregnated
activated carbon.
• To study the parameters affecting the adsorption capacity of the
copper-impregnated activated carbon ( CIAC ) such as pH, CN : Cu
molar ratio, Cu : C ratio, and varying the concentration of cyanide,
weight and type of carbons, the carbon particle size, copper salts and
percentage of copper impregnated onto the AC (activated carbon).
5
1.4 Scope of Research
This project was done in different set of experiment parameter by using
copper impregnated activated carbon to study the factors affecting the
adsorption of cyanide such as pH, weight and type of carbon, particle size of
carbon, the molar ratio of cyanide to copper and also copper to carbon ratio in
50, 100 and 200 ppm of cyanide solution. This ratio is important to exhibit the
ability of cyanide adsorption within the appropriate ratio to design a simple
operation and to provide a cost effective solution. In addition, activated carbon
is known to have large surface area and hard dense characteristic that can be
regenerated and reuse the carbon. Cyanide also can be recovered by using the
cyanide distillation apparatus.
In this research, two different sources of copper were used for
impregnation on AC i.e. copper (I) chloride and copper (II) sulphate. The
impregnation was done in the three percentage of copper impregnated (0.5, 1.0
and 1.67%). Batch CN adsorption test were done at different set of parameters
as discussed in the research objective above. The tests were carried out to
investigate the CN removal efficiency and the adsorption capacity of CN on the
CIAC.

6
CHAPTER 2 THEORY AND REVIEW
2.1 Adsorption Theory, Concepts, and Models
Adsorption phenomena are operative in most natural physical, biological,
and chemical systems, and adsorption operations employing solid such as
activated carbon and synthetic resins are used widely in industrial applications
and for purification of waters and wastewaters (Walter and Weber, 1985).
The process of adsorption involves separation of a substance from one
phase accompanied by its accumulation or concentration at the surface of
another. The adsorbing phase is the adsorbent, and the material concentrated
or adsorbed at the surface of that face is the adsorbate. Adsorption is thus
different than absorption, a process in which material transferred from one
phase to another interpenetrates the second phase to form a “solution”. The
term sorption is a general expression encompassing both processes.
A quantitative equilibrium distribution between phase concentrations is
defined for each combination of a specific adsorbate, adsorbent, and set of
system conditions. The character of the distribution, which markedly affects the
feasibility of adsorption as a separation process for a particular application, is
influenced by a variety of factors relating to the properties of the adsorbate, the
adsorbent and the system in which adsorption occurs (Walter and Weber,
1985).
7
Factors determining the characteristics of phase partition equilibria and
the rates at which these equilibria are attained in various types of adsorption
operations are rooted in process concepts underlying the adsorption of
substances at surfaces and interfaces, and illustrate how these concepts relate
to the design and operation of adsorption systems.
Although adsorption operations are utilized in the separation of
substances from a variety of gases and liquids at a variety of interfaces and
surfaces, adsorption from liquids at solid surfaces is not only the most common
category of these but also the one which involves the most comprehensive
range of factor.
2.2 Adsorption Principles
2.2.1 Surface Interactions
Adsorption at a surface or interface is largely the result of binding forces
between the individual atoms, ions, or molecules of an adsorbate and the
surface, all of these forces having their origin in electromagnetic interactions
(Weber, 1972; Weber and Vliet, 1980). Four principal types of adsorption –
exchange, physical, chemical, and specific – may be distinguished. Exchange
adsorption, or ion exchange, involves electrostatic attachment of ionic species
to sites of opposite charge at the surface of an adsorbent, with subsequent
displacement of these species by other ionic adsorbates of greater electrostatic
affinity. Physical adsorption results from the action of van der Waals forces,
which are comprised of both London dispersion forces and classical
electrostatic forces. Chemical adsorption involves a reaction between an
8
adsorbate and an adsorbent resulting in a change in the chemical form of the
adsorbate. The resulting chemisorptive bond is usually stronger than that
derived from the physical van der Waals forces. Attachment of adsorbates
molecules at functional groups on adsorbent surfaces can also results from
specific interactions which do not result in adsorbate transformation. (Walter
and Weber, 1985).
These interactions designated “specific adsorption”, exhibit a range of
binding energies ranging from values commonly associated with physical
adsorption to the higher energies involved in chemisorption. The net dispersion,
electrostatic, chemisorptive, and functional-group interactions broadly define the
affinity of an adsorbent for a specific adsorbate.
The extent of adsorption also relates to certain properties of the
adsorbate relative to the solution phase, notably those of surface tension and
solubility (Weber, 1972). For example, many organic compounds can effectively
lower the surface tension of water and the energy balance of aqueous system
of such compounds of favors their partitioning to solid-water and gas-water
interfaces. The extent of adsorption is greatly influenced by the solvophobicity
or lyophobocity of a compound, that is, its “dislike” for, or insolubility in the
solvent phase. The greater its solvophobocity with respect to a given solvent,
the greater is the tendency of an adsorbate to be adsorbed from that solvent at
interfaces with other phases. Bonding between substances and the solvent in
which it is dissolved must be broken before adsorption from the solvent can

9
occur. The greater the solubility of the compound, the stronger the bond, and
the smaller the extent of adsorption (Weber jr ; 1985).
Adsorption from solution onto a solid thus can occur as a result of one or
both of two characteristic properties for a given solvent-adsorbate-adsorbate
system. The primary driving force may relate to the solvophobic or lyophobic
character of the adsorbate or to a particular affinity of the adsorbate for the
surface of the adsorbent. A number of parameters specific to a given system
will therefore affect adsorption. These have been discussed in detail by Mattson
and Mark (1971), Weber (1972), and Van Vliet and Weber (1980), and will be
only briefly summarized here. For the adsorbate they include concentration,
molecular weight, molecular size, molecular structure, molecular polarity, steric
form or configuration, and the nature of background or competitive adsorbates.
For the adsorbents the most important determinants of equilibrium capacity and
rate of approach to this capacity include surface area, the physicochemical
nature of the surface, the availability of that surface to adsorbate molecules or
ions, and the physical size and form of the adsorbent particles. System
parameters such as temperature and pH can also markedly influenced
adsorption to the extent that they effect changes in any one or more of the
aforementioned parameters (Weber, jr; 1985).
2.3 Adsorbate-Solvent Properties
An inverse relationship between extent of adsorption of a substance from
a solvent and its solubility in that solvent can be generally anticipated. For
example, the water solubility of organic compounds within a particular chemical
10
class decreases with increasing molecular size or weight because the
compounds becomes more hydrocarbon like as the number of carbon atoms
becomes greater. Thus adsorption from aqueous solution increases as a
homologous series is ascended, largely because the expulsion of increasingly
large hydrophobic molecules from water permits an increasing number of water-
water bonds to reform (Walter and Weber, 1985).
Molecular size can also affect adsorption rates if this are controlled by
intraparticle diffusive mass transport within porous adsorbents, which generally
is more rapid the smaller the molecule. It must be emphasized that rate
dependence on molecular size can be generalized only within a particular
chemical class or homologous series. Large molecules of one chemical class
may adsorb more rapidly than smaller ones of another if higher energies of
driving forces for adsorption are involved.
Many organic compounds may exist as ionic species. Fatty acids,
phenols, amines, and the variety of pesticides are a few materials which ionize
in water under appropriate conditions pH. Frequently certain physical and
chemical properties of compounds change upon ionization, and this can affect
adsorbability. Most observations for amphoteric substances point to the
generalization that as long as the adsorbing compounds are structurally simple
and electrostatic or exchange reactions is not significant; adsorption from polar
solutes such as water is greater for neutral species than for the corresponding
ionic forms. The effects of ionization decrease as compounds become more
complex.

11
A polar solute will be strongly adsorbed from a nonpolar solvent by a
polar adsorbent, and at the opposite end of the spectrum, will prefer a polar
solvent to a nonpolar adsorbent. Polarity of organic compound is a function of
charge separation within the molecule. Almost any asymmetric compound will
be more or less polar, but several types of functional groups tend to produce
fairly high polarities in compounds. Example of these is hydroxyl, carboxyl, nitro,
nitrile, carbonyl, sulfonate, and amine. Thus ethanol, C2H5OH, is polar, being
incrementally negative at the hydroxyl group and correspondingly positive at the
ethyl group. Salvation by water, for example, involves formation of a hydrogen
bond between the positive hydrogen atoms of water and a negative group on a
solute, along with some bonding in the reverse direction to the water oxygen.
Water solubility is thus expected to increase with increasing polarity, and it
follows that adsorption from aqueous solution generally decreases as polarity
increases.
Adsorption reactions are normally exothermic, with changes in enthalpy
of the order of those for condensation or crystallization reactions. The
equilibrium extent or capacity of adsorption in a given system is thus generally
found to increase with decreasing temperature. Conversely, because adsorption
kinetics is generally controlled by diffusive mass transfer, rates of approach to
equilibrium normally increase with increasing temperature (Walter and Weber,
1985).
.
12
2.4 System Properties
Because hydrogen and hydroxide ions often interact with adsorbents
commonly used in aqueous phase applications, the adsorption of other ions
may thus be influenced by solution pH. Further to the extent to which adsorption
differs between the conjugate forms of acidic or basic compounds; pH affects
adsorption in that it governs degree of protolysis or “ionization” of such
compounds. As noted earlier, neutral species (e.g., acetic acid and phenol
molecules) tend to adsorb more strongly from the aqueous phase than do their
corresponding ionic forms (e.g., acetate and phenolate ions).
The components of a mixture of adsorbates may mutually enhance
adsorption, act relatively independently, or interfere with one another. Mutual
reduction of both adsorption capacities and adsorption rates can be expected if
the affinities of the adsorbates do not differ by orders of magnitude and if there
are no specific interactions among them which enhance adsorption; this
because the adsorption of more than one substance generally reduces the
number of surface sites available to each. For diffusion controlled rates of
adsorption by porous adsorbents, very slowly diffusing species in mixed
adsorbate systems can depress rates of uptake of those which diffuse more
rapidly. The reasons for such effects become more evident in an ensuing
discussion of adsorption kinetics (Walter and Weber, 1985).
13
2.5 Adsorbent Properties
Adsorption is a surface phenomenon and practical commercial
adsorbents are therefore characterized by large surface areas, the majority of
which is comprised of internal surfaces bounding the extensive pores and
capillaries of highly porous solids. Activated carbon is one of the most widely
used porous adsorbents because of its capability for efficiently adsorbing a
broad range of different types of adsorbates. While activated carbon’s wide-
spectrum adsorption capability is unmatched by any other material, certain
synthetic adsorbents may offer distinct advantages in specifically defined cases.
Notable examples are the analytical use of synthetic polymeric adsorbents for
recovery of organics from water for identification and quantification purposes,
the use of synthetic carbonaceous adsorbents derived from polymers for
removal of specific organic substances (i.e., low molecular weight volatile
halogenated hydrocarbons) from waters containing natural background
organics, and the use of polymeric adsorbents for adsorbate recovery in high-
concentration industrial process and waste treatment applications.
The performance characteristics of adsorbents relate in large measure to
their intraparticle properties. Surface area and the distribution of area with
respect to pore size generally are primary determinants of adsorption capacity.
The nature of the intraparticle surface are markedly affects the types of
adsorption interactions that will be operative for an adsorbent, and is a major
distinguishing factor between activated carbons and synthetic adsorbents.
Those properties which are important for adsorption have been discussed and
summarized by Weber and Van Vliet (1980, 1981) for a variety of commercial
14
adsorbents; highlights are presented below. The generic term “activated
carbon” encompasses a broad range of amorphous carbon-based materials
having high degrees of porosity and extensive surface areas. The large surface
areas are associated with near-molecular size pores and capillaries formed with
in the carbon granules by selective burning and oxidation of raw material during
activation. Commercial carbons typically have total surface areas in the range
from 450 to 1500 m2/g as measured by the nitrogen adsorption method.
However the actual surface area available for adsorption is dependent on the
specific nature of the adsorbate, and can be considerably less than the total.
The pore volumes of commercial carbons range from 0.5 to 1.5 cc/g. it is
however, only that fraction of the pore volume contained in pores larger than
about 10 Å which determines the effective capacity of carbons for liquid phase
applications. The effective capacity thus depends on the distribution of area or
volume with pore size, and the distribution of molecular sizes to be adsorbed
The surface chemistry of activated carbon is important in determining its
activity or capacity for adsorption of a specific organic substance. The chemical
properties of the surface depend on the raw material used, the type of activation
process, and the conditions of essentially two different types. The bulk of the
surface is comprised of basal plane areas. These are largely uniform nonpolar
surface which support solvophobic and physical adsorptions. A much smaller
but very important part of the total surface area is comprised of the
heterogeneous edges of carbon planes to which carbon-oxygen functional
groups formed by oxidation in the manufacturing process are attached. These
groups enable activated carbon to undergo halogenation, hydrogenation, and
15
oxidation, and to function as a specific adsorbent and catalyst in a variety of
different reactions. They provide for a range of electrostatic, hydrogen bonding,
functional group, and chemisorption adsorbent-adsorbate interaction which
generally exceed physical or solvophobic interactions in tenacity and greatly
extend the spectrum and degree of adsorbability of adsorbate on activated
carbon. A particular benefit afforded by such interactions in enhanced
adsorption performance at very low adsorbate concentrations in the solution
phase, a significant factor in such application as potable water treatment where
part-per-billion levels of organics are deemed undesirable.
Although it does not directly affect adsorption capacity, hardness, or
durability, of individual adsorbent particles is an important property to be
considered, at least for granular activated carbon (GAC) applications. This
property largely determines the losses which will occur on each adsorption-
regeneration cycle as a result of attrition during handling and burn-off during
reactivation. Petroleum, lignite and bituminous coal-based carbons are typically
used in GAC systems, while softer wood and peat-based materials find more
use as powdered activated carbons (PACs). (Walter and Weber, 1985)
Synthetic adsorbents of various polymer matrix, pore structure and
functional group characteristics are commercially available in the forms of
beads or granules. The matrices commonly comprise insoluble three-
dimensional hydrocarbon polymer networks of either aromatic nature, e.g.,
condensed phenol-formaldehyde or styrene divinyl benzene-or aliphatic nature,
e.g., polymerized acrylic acid or methyl acrylic acid (Paleos, 1969; Snoeyink et
16
al., 1974; Abrams, 1975). Pore size distributions can be controlled during
manufacture by varying the amount of extender used in the polymerization
reaction; this governs the degree of matrix crosslinking and ultimate porous
structure. The macroporous and macroreticular synthetic adsorbents thus form
contain no ion exchange functional groups and are designated polymeric
adsorbents. Ion exchange properties can be imparted to the adsorbents by
incorporation of appropriate functional groups in the polymer matrices. Such
macroporous ion exchange resins have been reported to have some potential
for organics removal in municipal water and waste water treatment, (Rebhun
and Kaufman, 1967; Anderson and Maier, 1979; Snoeyink et al., 1974; Giddey
et al., 1975; Anderson and Maier, 1979; Boening et al., 1980) colour removal in
texile operations, (Kennedy et al., 1673; Snyder and Alspaugh, 1974; Hodges
and Alspaugh, 1975) Kraft paper industry waste decolorization (Sanks, 1973)
and for protecting ion exchange demineralizer resins from organic fouling
(Abrams, 1969; Oehme and Martinola, 1973).
Carbonaceous adsorbents are a recent addition to the inventory of
synthetic adsorbents. These materials are manufactured by partial pyrolysis of
appropriate beaded polymer matrices, yielding black spherical particles of
chemical composition intermediate between those of activated carbon and
polymeric adsorbents (Rohm and Haas Co., 1977). (Walter and Weber, 1985).
17
2.6 Activated Carbons
Activated carbon is a microporous carbonaceous material which is
produced from various raw-materials, such as peat, wood, lignite, anthracite,
fruit pits or shells. The raw materials are converted into activated carbon using
steam (temperature above 900 C) or acid (temperature above 450 C). The
activation process creates pores in the carbon, whose surface area may exceed
1500 m2/g. It is by far the most important adsorptive media due to its wide range
of pore sizes.
Activated carbons are produce with a wide range of properties and
physical forms, which leads to their use in numerous applications. For example,
their high internal surface area and pore volume are pertinent to their being
employed as adsorbents, catalysts, or catalyst supports in gas and liquid phase
processes for purification and chemical recovery (Derbyshire et al., 1978).
Activated carbons are commonly fabricated in the form of fine powders
and larger sized granules, pellets, or extrudates. However, activated carbons
can also be produce as fibres, mesocarbon microbeads, foams and aerogels,
and in the form of flexible or rigid solids. The form, as well as other properties,
helps to determine the suitability for a specific application. Rates of adsorption
or reaction can be orders of magnitude higher for activated carbons with narrow
dimensions (e.g., powders and fibers with diameters in the range 10 to 50 μm)
than for granular carbons (0.5 to 4.0 mm): in the former case, most of the
adsorptive surface is readily accessible, and there is much less dependence on
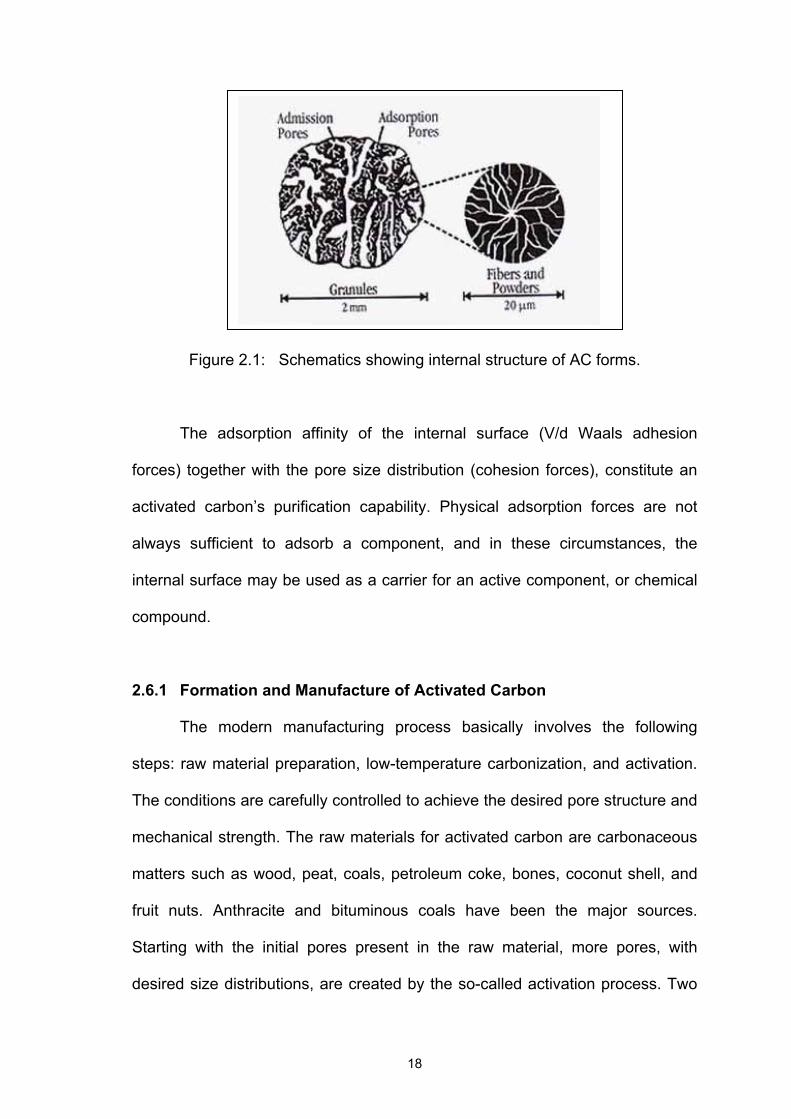
intragranular diffusion (Figure 2.1) (Radovic, 1985).
18
Figure 2.1: Schematics showing internal structure of AC forms.
The adsorption affinity of the internal surface (V/d Waals adhesion
forces) together with the pore size distribution (cohesion forces), constitute an
activated carbon’s purification capability. Physical adsorption forces are not
always sufficient to adsorb a component, and in these circumstances, the
internal surface may be used as a carrier for an active component, or chemical
compound.
2.6.1 Formation and Manufacture of Activated Carbon
The modern manufacturing process basically involves the following
steps: raw material preparation, low-temperature carbonization, and activation.
The conditions are carefully controlled to achieve the desired pore structure and
mechanical strength. The raw materials for activated carbon are carbonaceous
matters such as wood, peat, coals, petroleum coke, bones, coconut shell, and
fruit nuts. Anthracite and bituminous coals have been the major sources.
Starting with the initial pores present in the raw material, more pores, with
desired size distributions, are created by the so-called activation process. Two
19
standard activation methods are used: gas and chemical. After initial treatment
and pelletizing, gas activation first involves carbonization at 400-500 ºC to
eliminate the bulk of the volatile matter, and then partial gasification at 800-1000
ºC to develop the porosity and surface area. A mild oxidizing gas such as CO2
and steam, or flue gas, is used in the gasification step because the intrinsic
surface reaction rate is much slower than the pore diffusion rate, thereby
ensuring the uniform development of pores throughout the pellet. The activation
process is usually performed in fixed beds, but in recent years fluidized beds
have also been used. The activated carbon created by the activation process is
used primarily for gas and vapour adsorption processes. The other activation
process that is also used commercially depends on the action of inorganic
additives to degrade and dehydrate the cellulosic materials and, simultaneously,
to prevent shrinkage during carbonization. This is called chemical activation,
usually used for lignin-based precursors such as sawdust. No pre-carbonization
step is required. Lignin, usually the raw material that is blended with activators
such as phosphoric acid, zinc chloride, potassium sulphide, or potassium
thiocyanate, is carbonized at temperatures between 500 to 900 ºC. The
remaining chemicals are removed from the carbon by acid or water wash. The
product, usually in powder form, is used for aqueous or gas phase purposes.
The inorganic material contained in activated carbon is measured as ash
content, generally in the range between 2 and 10%. Beside granulated
activated carbon (GAC), powdered activated carbon (PAC) is also used
commercially (for example, for dioxin removal from incinerators by injection of
PAC (Yang et al., 2001).
20
Although the process for manufacturing activated carbon has been
largely empirical, a considerable understanding of the fundamental processes is
now available. During carbonization of the precursor raw material, condensation
of polynuclear aromatic compounds and breakage of side-chain groups occur,
resulting in a carbon residue. In the meantime, cross-linking reactions occur that
inhibit the development of a pre-graphite structure. Hence activated carbon is
referred to as non-graphitizing, as opposed to graphitizing. The graphitizing type
applies to pitches derived from petroleum, coal tar, and aromatic hydrocarbons,
which form an intermediate liquid crystal phase called mesophase.
Carbonization alone is not adequate to develop large porosity, hence activation
by gasification is needed. The resulting activated carbon can be described by
various models. The most representative model is a twisted network of
defective hexagonal carbon layer planes, cross-linked by aliphatic bridging
groups. The layer planes consist of single layers or layers of two, three or four
with variable interlayer spacing s that typically range from 0.34 to 0.8 nm. The
size of the layer planes varies but is typically about 5 nm wide. Simple
functional group (e.g., C–OH, C=O), as well as heteroatoms (mainly oxygen
and hydrogen) , are incorporated in the network (Yang et al., 2001).
2.6.2 Pore Structure and Standard Tests for Activated Carbon
Activated carbon are characterized by a large surface area between 300
~ 4000 m2/g, as measured by the BET method, and are the largest among all
sorbents. Commercial grades of activated carbon are designated for either gas
phase or liquid phase, depending on its application. A majority of the pore
volume is from pores or near or larger than 30 Å in diameter for liquid-phase
21
carbons, whereas the pores of gas-phase carbons is due to the large size of
many dissolved adsorbates and the slower diffusion in liquid than in gas for
molecules of the same size.
A polymodal pore-size distribution is generally found in activated carbon.
The pore structure may be pictured as having many small pores branching off
from larger ones, which are open through the entire particle. The larger pores
are called feeder or transport pores; the smaller ones, which may be dead-end,
are called adsorption pores. The cumulative pore-volume distribution of the fine
pores for a typical gas-phase activated carbon is shown, along with four other
sorbents, in Figure 2.2. The larger pores are mostly submicrometer in size, and
their total volume amounts to a fraction of that found in the fine pores. The
micropore structures of activated carbons can be determined by a variety of
adsorption methods (Yang et al., 2001).
Testing of activated carbons involves measurements of bulk density,
absolute density (or helium density), particle density, particle size distribution,
pressure drop across packed beds, and mechanical strength. Standardized
ASTM tests are available for these measurements. Details of these tests are
available from ASTM. The mechanical strength is defined by the abrasion
number, which is a measure of the change of the mean particle size, expressed
as a percentage, of a sample after 3 min of vigorous agitation with smooth steel
balls. In addition, numerous adsorption tests are used for the characterization of
the adsorbents properties of commercial carbons. The effectiveness of
activated carbon is usually specified by the amount of a certain test chemical it
22
can adsorb under standardized conditions. For gas-phase applications, CCl4 is
commonly used, whereas for aqueous-phase or liquid-phase applications,
iodine and molasses are used (Yang et al., 2001).
2.7 Influence of the adsorbate type
The type of adsorbent can influence the equilibrium adsorption capacity in
two ways:
1. The total pore volume of the adsorbent.
Adsorption occurs by condensation of the adsorbate in the adsorbents
pores. A larger total pore volume will therefore result in a higher maximum
amount of adsorbate being adsorbed. This maximum adsorption capacity,
however, can only be obtained if the gas/air flow is totally saturated with the
adsorbate.
2. The pore size distribution of the adsorbent.
According to IUPAC:
• Micropores : below 1 nm radius
• Mesopores : 1-25 nm radius
• Macropores : radius > 25 nm
The actual adsorption occurs almost only in the micropores. The
macropores will determine the accessibility of the adsorbent, while the
mesopores influence the transport of the adsorbate from the gas phase to the
micropores. An adsorbent with a high activation degree, and therefore a high
total pore volume, will possess a high maximum adsorption capacity.

23
At low adsorbate concentrations adsorption occurs almost only I the
smallest micropores, possessing the highest adsorption energy. The higher the
activation degree of adsorbent, the larger the average pore diameter and the
lower the content of very small micropores. This means that the adsorbent with
the highest activation degree will possess the lowest equilibrium adsorption
capacity at low adsorbate concentrations. This concentration influence on the
equilibrium adsorption capacity implies that carbons with a high activation
degree are less suitable for air purification purpose. This effect will be enhanced
by adsorbent density. This applies particularly in the air purification field, where
the adsorbent is used on a volume basis, the volume adsorption capacity
(grams adsorbed per 100 ml activated carbon) instead of the weight adsorption
capacity is the relevant parameter.
2.8 General Adsorption Properties
The unique surface property of activated carbon, in contrast to the other
major sorbents, is that its surface is nonpolar or only slightly polar as a result of
the surface oxide groups and inorganic impurities. This unique property gives
activated carbon the following advantages:
1. It is the only commercial sorbent used to perform separation and purification
processes without requiring prior stringent moisture removal, such as is
needed in air purification. For the same reason, it is also widely used as a
sorbent for processes treating aqueous solutions.
2. Because of it’s large, accessible internal surface (and large pore volume,
shown in figure 2.2), it adsorbs more nonpolar and weakly polar organic
24
molecules than other sorbents do. For example, the amount of methane
adsorbed by activated carbon at 1 atmosphere (atm) and room temperature
is approximately twice that adsorbed by an equal weight of molecular sieve
5A (Figure 2.3).
3. The heat of adsorption, or bond strength, is generally lower on activated
carbon than on other sorbents. This is because only non-specific; van der
Waals forces are available as the main forces for adsorption. Consequently,
stripping of the adsorbed molecules is relatively easier and results in
relatively lower energy requirements for regeneration of the sorbent (Yang et
al., 2001).
2.9 Surface Chemistry and Its effects on Adsorption
Activated carbon can be represented by a model of a twisted network of
defective hexagonal carbon layer planes (typically 5 nm wide), which are cross-
linked by aliphatic bridging groups. Heteroatoms are incorporated into the
network and are also bound to the periphery of the planes. The heteroatoms
bound to the surfaces assume the character of the functional groups typically
found in aromatic compounds, and react in similar ways with many reagents.
These surface groups play a key role in the surface chemistry of activated
carbon. They are particularly important for adsorption in aqueous solutions and
the catalytic properties of carbon.
The surface groups shown in Figure 2.4 are acidic groups. Concentration
of these groups can be created or increased by oxidation with oxygen at
elevated temperatures (or by aging at mile temperatures) or with liquid oxidants,