student achievement summary report
TRANSCRIPT

STUDENT ACHIEVEMENT
SUMMARY REPORT
2012-2013
Research and Evaluation Services July 2013
Brandon School Division

Brandon School Division 2012-13 Student Achievement Summary Report Page 2
Research and Evaluation Services
©2013 Brandon School Division
All Right Reserved
Website: www.bsd.ca
Contact: Research, Assessment and Evaluation Services
Brandon School Division
1031 6th St.
Brandon, Manitoba
R7A 5Y1
(204) 729-0349 or (204) 729-3100

Brandon School Division 2012-13 Student Achievement Summary Report Page 3
Research and Evaluation Services
Table of Contents
Executive Summary 8
Section A: Kindergarten Results 10
I. Early Development Instrument: 2010/11 Results 11
Comparison of BSD and Manitoba: Average EDI Scores 11
Average Physical Health Scores 12
Average Social Competence Scores 12
Average Emotional Maturity Scores 12
Average Language & Thinking Skills 13
Average Communication Skills Scores 13
Proportion of Kindergarten EAL Students: BSD versus Manitoba 13
Percentage of BSD Students 'Not Ready' and 'Very Ready' in Each Domain 14
Percentage of Students 'VERY READY' in One or More Domain 14
Percentage of Students 'NOT READY' in One or More Domain 14
Percentage of Students with Multiple Challenges 15
Summary of Early Development Instrument Results 15
II. Phonological Awareness Screening Results 16
Fall-to-Spring Comparison in PAST Score 17
Percent of Students by Phonological Awareness Competency Level: Fall-to-Spring Comparison 17
Fall-to-Spring Comparisons of Raw Scores and Percent Meeting Expectations by School 18
Summary of Phonological Awareness Screening Results 19
III. Brandon School Division Kindergarten Continuum Results 20
June Fine Motor Competencies: % E, M, A, N 20
Difference in Percent of Students Meeting or Exceeding Fine Motor Expectations 20
June Literacy Competencies: % E, M, A, N 21
Difference in Percent of Students Meeting or Exceeding Literacy Expectations 21
June Numeracy Competencies: % E, M, A, N 22
Difference in Percent of Students Meeting or Exceeding Numeracy Expectations 22
Kindergarten Literacy and Fine Motor Competencies: Percent Meeting or Exceeding by School 23
Kindergarten Numeracy Competencies: Percent Meeting or Exceeding by School 24
Summary of Kindergarten Continuum Results 25
IV. The Effect of Full Day Every Day Kindergarten on Student Achievement 26
Kindergarten Schedules: Relative Progress of % of Students Meeting Phonological Awareness Expectations 26
November to June Difference in Percent of Students Meeting or Exceeding Fine Motor Expec-tations: Comparing Full to Half-Time Kindergarten 27

Brandon School Division 2012-13 Student Achievement Summary Report Page 4
Research and Evaluation Services
November to June Difference in Percent of Students Meeting or Exceeding Literacy Expecta-tions: Comparing Full to Half-Time Kindergarten 27
November to June Difference in Percent of Students Meeting or Exceeding Numeracy Expecta-tions: Comparing Full to Half-Time Kindergarten 28
Summary of the Effects of Full Day Every Day Kindergarten 28
Section B: Divisional and Provincial Formative Assessment Results 29
I. Division-Wide Formative Assessment Results: Reading 30
Grade 3 Provincial Reading Assessment: Percent Meeting, Approaching and Not Meeting 30
Grade 3 Provincial Reading Assessment: Two-Year Comparison of % Meeting 30
Grade 5 Divisional Reading Assessment: Percent Meeting, Approaching and Not Meeting 31
Grade 5 Divisional Reading Assessment: Two-Year Comparison of % Meeting 31
Grade 7 Divisional Reading Assessment: Percent Meeting, Approaching and Not Meeting 32
Grade 7 Divisional Reading Assessment: Two-Year Comparison of % Meeting 32
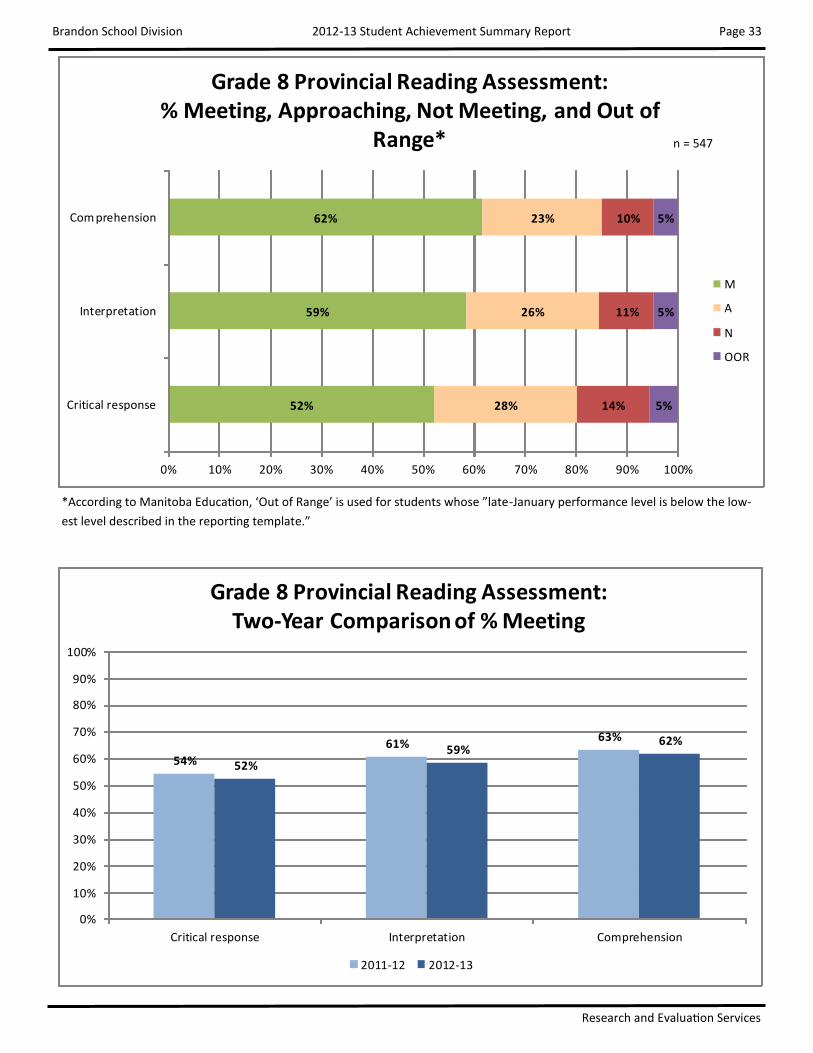
Grade 8 Provincial Reading Assessment: Percent Meeting, Approaching, Not Meeting, and Out of Range
33
Grade 8 Provincial Reading Assessment: Two-Year Comparison of % Meeting 33
Grade 9 Divisional Reading Assessment: % E, M, A, N 34
Summary of Formative Assessment Results in Reading 34
II. Division-Wide Formative Assessment Results: Writing 35
Grade 3 Divisional Writing Assessment: Percent Meeting, Approaching and Not Meeting 35
Grade 3 Divisional Writing Assessment: Two-Year Comparison of % Meeting 35
Grade 5 Divisional Writing Assessment: Percent Meeting, Approaching and Not Meeting 36
Grade 5 Divisional Writing Assessment: Two-Year Comparison of % Meeting 36
Grade 7 Divisional Writing: Percent Meeting, Approaching and Not Meeting 37
Grade 7 Divisional Writing Assessment: Two-Year Comparison of % Meeting 37
Grade 8 Provincial Writing Assessment: Percent Meeting, Approaching, Not Meeting, and Out of Range 38
Grade 8 Provincial Writing Assessment: Two-Year Comparison of % Meeting 38
Grade 9 Divisional Writing Assessment: % E, M, A, N 39
Summary of Formative Assessment Results in Writing 39
III. Division-Wide Formative Assessment Results: Numeracy 40
Grade 3 Provincial Numeracy Assessment: Percent Meeting, Approaching and Not Meeting 40
Grade 3 Provincial Numeracy Assessment: Two-Year Comparison of % Meeting 40
Grade 5 Divisional Numeracy Assessment: Percent E, M, A, N 41
Grade 5 Divisional Numeracy Assessment: Two-Year Comparison of % Meeting/Exceeding 41
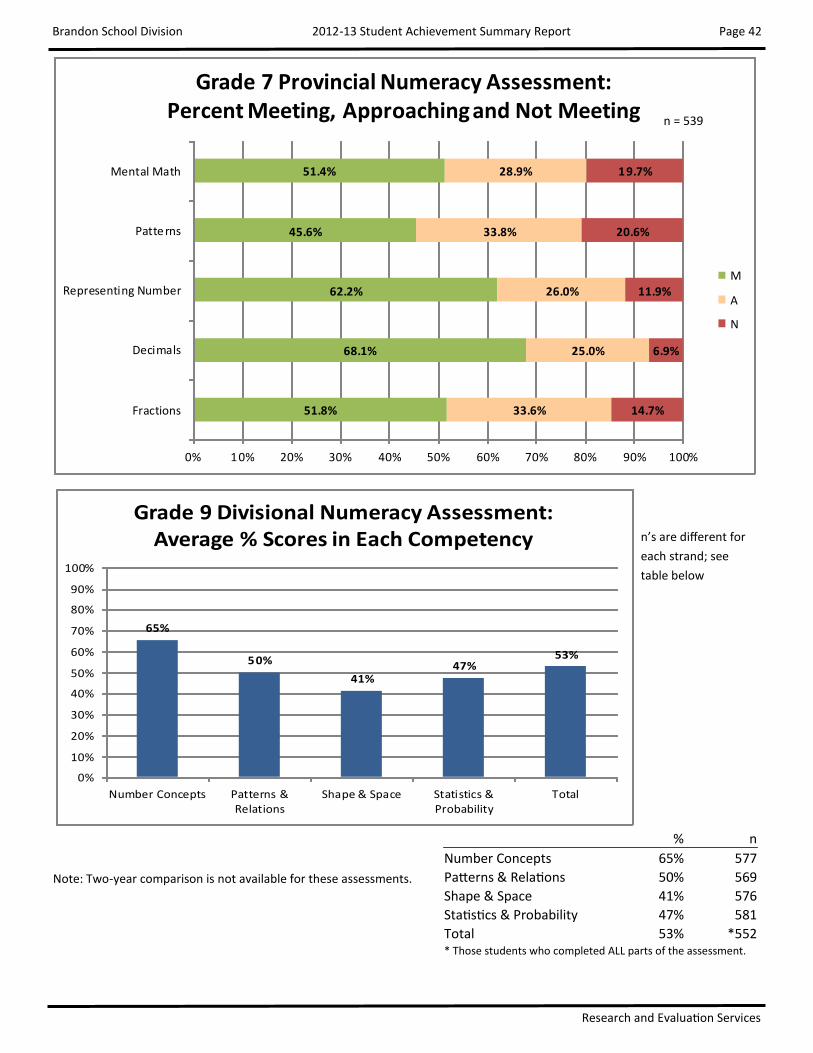
Grade 7 Provincial Numeracy Assessment: Percent Meeting, Approaching and Not Meeting 42
Table of Contents (continued)

Brandon School Division 2012-13 Student Achievement Summary Report Page 5
Research and Evaluation Services
Grade 9 Divisional Numeracy Assessment: Average % Scores in Each Competency 42
Summary of Formative Assessment Results in Numeracy 43
IV. Grade 4 Provincial Reading in French Assessment Results 44
Grade 4 Provincial Reading in French Assessment: Percent Meeting, Approaching, and Not Meeting 44
Grade 4 Provincial Reading in French Assessment: Two-Year Comparison of % Meeting 44
Summary of Formative Assessment Results in Reading in French 44
V. Grade 7 Provincial Engagement Assessment Results 45
Grade 7 Provincial Engagement Competencies: % at Each Engagement Level 45
Grade 7 Provincial Engagement Assessment: Two-Year Comparison of % ‘Established’ 45
Summary of Provincial Engagement Assessment Results 46
VI. School-Site Formative Assessment Results 47
Grade 3 Reading, Writing, and Numeracy: % Meeting or Exceeding by School 47
Grade 5 Reading, Writing, and Numeracy: % Meeting or Exceeding by School 48
Grade 7 Reading, Writing, and Numeracy: % Meeting or Exceeding by School 49
Grade 9 Reading, Writing, and Numeracy: % Meeting or Exceeding by Sending School 50
VII. Grade 9 Formative Assessment Results by Receiving School 51
Grade 9 Reading Competencies: % Meeting or Exceeding by Receiving School 51
Grade 9 Writing Competencies: % Meeting or Exceeding by Receiving School 52
Grade 9 Numeracy: Average Percent Scores in Each Competency by Receiving School 53
VIII. Grade 12 Provincial Standards Tests 54
BSD Percent Point Differential from Manitoba Mean: ELA & Math Tests 54
Grade 12 English Language Arts Provincial Standards Test 55
ELA: Crocus Plains % Difference from Manitoba Mean 56
ELA: Neelin % Difference from Manitoba Mean 56
ELA: Vincent Massey % Difference from Manitoba Mean 56
Grade 12 Pre-Calculus Provincial Standards Test 57
Pre-Calculus: Crocus Plains % Difference from Manitoba Mean 58
Pre-Calculus: Neelin % Difference from Manitoba Mean 58
Grade 12 Applied Mathematics Provincial Standards Test 59
Applied Math: Crocus Plains % Difference from Manitoba Mean 59
Grade 12 Essential Mathematics Provincial Standards Test 60
Essential Math: Crocus Plains % Difference from Manitoba Mean 61
Essential Math: Vincent Massey % Difference from Manitoba Mean 61
Grade 12 Français Langue Seconde Provincial Standards Test 62
Français: BSD % from the Manitoba Mean 62
Table of Contents (continued)

Brandon School Division 2012-13 Student Achievement Summary Report Page 6
Research and Evaluation Services
Section C: Specific Learner Group Achievement 63
I. Comparison of Male and Female Learners 64
Percent Meeting/Exceeding Kindergarten Fine Motor Expectations: Comparison of Male and Female Students 64
Percent Meeting/Exceeding Kindergarten Literacy Expectations: Comparison of Male and Fe-male Students 64
Percent Meeting/Exceeding Kindergarten Numeracy Expectations: Comparison of Male and Female Students 65
Percent Meeting Expectations in Grade 3, 5, 7 & 9 Reading Competencies: Comparison of Boys and Girls 66
Percent Meeting Expectations in Grade 3, 5, 7 & 9 Writing Competencies: Comparison of Boys and Girls 67
Percent Meeting Expectations in Grade 3, 5, & 7 Numeracy Competencies: Comparison of Boys and Girls
68
Average Percent Score in Grade 9 Numeracy Strands: Comparison of Boys and Girls 69
Summary of the Comparison of Male and Female Learners 69
II. Comparison of Aboriginal and Non-Aboriginal Learners 70
Percent M/E Kindergarten Fine Motor Expectations: Comparison of Aboriginal and Non-Aboriginal Students
70
Percent M/E Kindergarten Literacy Expectations: Comparison of Aboriginal and Non-Aboriginal Students 70
Percent Meeting/Exceeding Kindergarten Numeracy Expectations: Comparison of Aboriginal and Non-Aboriginal Students 71
Percent Meeting Expectations in Grade 3, 5, 7, & 9 Reading Competencies: Comparison of Ab-original and Non-Aboriginal Students 72
Percent Meeting Expectations in Grade 3, 5, 7, & 9 Writing Competencies: Comparison of Abo-riginal and Non-Aboriginal Students 73
Percent Meeting Expectations in Grade 3, 5, & 7 Numeracy Competencies: Comparison of Ab-original and Non-Aboriginal Students 74
Average Percent Score in Grade 9 Numeracy Strands: Comparison of Aboriginal and Non-Aboriginal Students 75
Summary of the Comparison of Students with and without Aboriginal Heritage 75
III. Comparison of EAL and Non-EAL Learners 76
Percent Meeting/Exceeding Kindergarten Fine Motor Expectations: Comparison of EAL and Non-EAL Students 76
Percent Meeting/Exceeding Kindergarten Literacy Expectations: Comparison of EAL and Non-EAL Students 76
Table of Contents (continued)

Brandon School Division 2012-13 Student Achievement Summary Report Page 7
Research and Evaluation Services
Table of Contents (continued)
Percent Meeting/Exceeding Kindergarten Numeracy Expectations: Comparison of EAL and Non-EAL Students 77
Percent Meeting Expectations in Grade 3, 5, 7 & 9 Reading Competencies: Comparison of EAL and Non-EAL Students 78
Percent Meeting Expectations in Grade 3, 5, 7 & 9 Writing Competencies: Comparison of EAL and Non-EAL Students 79
Percent Meeting Expectations in Grade 3, 5 & 7 Numeracy Competencies: Comparison of EAL and Non-EAL Students 80
Average Percent Score in Grade 9 Numeracy Strands: Comparison of EAL and Non-EAL Stu-dents 81
Summary of the Comparison of EAL and Non-EAL Students 81
Appendix A: Historical Demographics for Formative Assessments 82

Brandon School Division 2012-13 Student Achievement Summary Report Page 8
Research and Evaluation Services
Executive Summary
The purpose of this report is to provide a comprehensive overview of Brandon School Division (BSD) student achieve-ment results for the 2012-13 school year: Kindergarten, Grades 3, 5, 7, 9 and 12 in both Literacy and Numeracy. In-cluded are other relevant data that provide important contextual information necessary for an in-depth understand-ing of the key factors that influence student achievement.
This report encompasses results from Brandon School Division divisional formative assessments as well as provincially mandated standards tests in Grade 12, formative assessments in earlier grades and the Early Development Instru-ment. Furthermore, this report covers results of the Divisional Kindergarten Phonological Awareness Screening from and Divisional Kindergarten Continuum. All formative assessments and Kindergarten Continuum assessments are cri-terion referenced (or outcome-based) to the particular curricula.
Unless otherwise stated within the report, MANE performance indicators (Meeting, Approaching, Not Meeting or Needs Ongoing Help, and Exceeding) are used to show students’ level of achievement in critical competencies. Teach-ers use a collection of evidence to determine the performance indicator which best describes each student’s level of competency according to pre-established curricular rubrics. In addition to descriptive statistics on the sheer percent-age of students at each level of performance, two-year or historical trend comparisons are included where possible. Furthermore, the impact of full day every day Kindergarten is briefly reported. Finally, this report includes detailed examinations of the achievement of specific learner groups.
Summary of Results
Early Development Instrument: The results of the 2010-2011 EDI indicate that BSD students enter Kindergar-ten, on average, with less developed school readiness skills than other Manitoba children. More children enter this Division with multiple challenges compared with the Province as a whole. There are disproportionately greater numbers of BSD students at both the ‘not ready’ and ‘very ready’ ends of the ‘readiness continuum.’ The developmental area of greatest need is Language and Thinking Skills.
Phonological Awareness: Improvements were seen from fall to spring in Kindergarten students’ phonological
awareness (from 18 to 38 out of a possible 50 points; and from 28% to 72% of students meeting/exceeding ex-pectations). However, 14% of students entering Grade 1 will require additional supports in order to be success-ful, especially in reading.
Kindergarten Continuum: At least 70% of students are meeting or exceeding the vast majority of Kindergarten
outcomes assessed in June. Most students finish Kindergarten with appropriate fine motor skills. Although the identification of letter sounds continues to be an area of challenge for approximately 25% of students, this skill saw the greatest amount of progress throughout the school year. As in previous years, the areas of greatest challenge for students entering Grade 1 are in ‘story retell’ and ‘word recognition,’ two important preliminary reading skills.
Full Day Every Day Kindergarten: Compared with half-time students, a greater percentage of FDED Kindergar-
ten students ended the year meeting phonological awareness expectations, despite having started the year with lower average scores. This tendency for closing the achievement gap with FDED students was seen also on the Kindergarten Continuum assessments, in which FDED students tended to make greater gains or less loss than their half-time counterparts.
Reading: At least 80% of students are either meeting or approaching grade level expectations on all but one
reading competency at one grade level. Comprehension is generally the reading competency with the higher percentages of students meeting expectations, while critical response to text is the reading competency of greatest challenge.

Brandon School Division 2012-13 Student Achievement Summary Report Page 9
Research and Evaluation Services
Writing: At least 80% of students are either meeting or approaching writing expectations on all but one writing competency at one grade level, however, there is a general tendency toward poorer performance in writing compared with reading. Word choice is the writing competency of greatest challenge.
Numeracy: At least 80% of students are either meeting or approaching expectations on all but two numeracy
competencies across all grade levels. Competencies within the Number Strand are generally those of relative strength for BSD students; however, mental math continues to be the competency of greatest challenge.
Reading in French: At least 80% of students are meeting or approaching expectations in the Provincial Reading
in French assessment. Engagement: For 4 of the 5 engagement skills assessed across both English and French Immersion students,
close to 80% of students are demonstrating the skills ‘very often’ or even ‘almost always.’ Students find self-assessment the most challenging area of engagement.
Grade 12 Provincial Standards Tests: BSD students continue to demonstrate strong Language Arts scores. Pre-
Calculus scores are strong in one high school and improving in the others. Only Crocus Plains Regional Second-ary School had students taking the Applied Mathematics assessment in the fall; however, these results show an improvement over all previous years’ results. In Essential Math (previously Consumer Math), the first semester results show considerable improvement over last year at both participating high schools. Finally, BSD results are very similar to the Provincial average on the Français langue seconde provincial standards test.
Gender: There are significantly greater percentages of girls meeting expectations in some reading competen-
cies, in every writing competency, and in Kindergarten fine motor skills. With the exception of colour identifica-tion in Kindergarten, there are no significant gender differences in numeracy across any grade level.
Learners of Aboriginal Heritage: A smaller percentage of Aboriginal students are meeting expectations in all
reading, writing, and numeracy competencies compared with non-Aboriginal students. This difference is seen from Kindergarten onward. These differences are especially prominent in writing and in numeracy.
English as an Additional Language Learners: Significantly lower percentages of EAL students are meeting all
Kindergarten literacy and numeracy outcomes. Significantly lower percentages of EAL students are meeting reading expectations in Grades 3, 5, and 7. In numeracy, the gap between EAL and non-EAL students closes more readily than it does in literacy.
As this report indicates, student achievement continues to be progressively positive in the major areas of measure-ment: Literacy and Numeracy in Kindergarten and in Grades 3, 5, 7, 9 and 12. Areas of greatest challenge are moni-tored continuously and utilized to inform School Development Planning and Division-wide Strategic Planning. Once the implementation plan and procedures are complete for Policy 1001.2 Educational Sustainability in Student Achieve-ment, specific percentages of summative student achievement in core learning outcomes will be available on a Divi-sional aggregate basis in Grades 3, 5, 7 and 9. A pilot study was completed in the 2012-13 school year on the Sustaina-bility Rubrics created at the Grade 3, 5 and 7 levels. A complete report of this pilot is available through Research and Evaluation Services.

Brandon School Division 2012-13 Student Achievement Summary Report Page 10
Research and Evaluation Services
KINDERGARTEN
RESULTS
Section A:

Brandon School Division 2012-13 Student Achievement Summary Report Page 11
Research and Evaluation Services
8.88.3
7.98.2
7.5
8.68.2
7.97.6
7.1
0.0
1.0
2.0
3.0
4.0
5.0
6.0
7.0
8.0
9.0
10.0
Physical Health Social Competence Emotional Maturity Language &Thinking Communication &Knowledge
Comparison of BSD and Manitoba: Average EDI Scores
Manitoba BSD
In 4 of the 5 domains, Brandon School Division children scored lower than the Manitoba baseline/comparison. Generally, this indi-cates that current BSD students are entering Kindergarten with less developed school readiness skills than other Manitoba chil-dren.
Highest Possible Score: 10
Early Development Instrument: 2010/11 Results
The Early Development Instrument (EDI) was developed by the Offord Centre for Child Studies out of McMaster University. It is a measurement of developmental health of children who are about to enter Grade one. The objectives of the EDI are to assess the strengths and needs of Kindergarten children and to predict how children will do in school. It is used across Canada and interna-tionally and is administered biennially to all Kindergarten students in Manitoba. The instrument itself is a teacher-completed checklist that assesses children’s readiness in five developmental areas (or domains):
physical health and well-being,
social competence,
emotional maturity,
language and cognitive development, and
communication skills and general knowledge. The 2010/11 EDI results were made available in the fall of 2012, and so are summarized here. A complete 2010/11 EDI report is available through Research and Evaluation Services. It is important to note that the students participating in the 2010/11 round of assessment have just completed Grade 2. This past winter, Kindergarten teachers again administered the EDI to their students. A report will be forthcoming when these 2012/13 results are received.

Brandon School Division 2012-13 Student Achievement Summary Report Page 12
Research and Evaluation Services
8.58.3
8.6 8.6
8.8
5.0
5.5
6.0
6.5
7.0
7.5
8.0
8.5
9.0
9.5
10.0
2005/06 2006/07 2008/09 2010/11
Average Physical Health Scores
BSD Manitoba Baseline
8.28.0 8.1 8.2
8.3
5.0
5.5
6.0
6.5
7.0
7.5
8.0
8.5
9.0
9.5
10.0
2005/06 2006/07 2008/09 2010/11
Average Social Competence Scores
BSD Manitoba Baseline
7.8 7.8 7.8 7.9
7.9
5.0
5.5
6.0
6.5
7.0
7.5
8.0
8.5
9.0
9.5
10.0
2005/06 2006/07 2008/09 2010/11
Average Emotional Maturity Scores
BSD Manitoba Baseline
Over the last 4 EDI measure-ments, BSD has had consistent results in the areas of physical health and well-being, social competence, and emotional maturity. In these domains, BSD scores have been only slightly lower than the Provin-cial baseline scores; however the differences are statistically significant at the .05 level.

Brandon School Division 2012-13 Student Achievement Summary Report Page 13
Research and Evaluation Services
8.0 7.9 7.87.6
8.2
5.0
5.5
6.0
6.5
7.0
7.5
8.0
8.5
9.0
9.5
10.0
2005/06 2006/07 2008/09 2010/11
Average Language & Thinking Skills
BSD Manitoba Baseline
7.3 7.27.4
7.1
7.5
5.0
5.5
6.0
6.5
7.0
7.5
8.0
8.5
9.0
9.5
10.0
2005/06 2006/07 2008/09 2010/11
Average Communication Skills Scores
BSD Manitoba Baseline
2.0% 2.1%
7.0%
13.2%
9.1% 9.6%10.2%
12.0%
0%
2%
4%
6%
8%
10%
12%
14%
2005/06 2006/07 2008/09 2010/11
Proportion of Kindergarten EAL Students: BSD versus Manitoba
BSD Manitoba
Manitoba students are weakest in the area of Communication Skills, and this trend is evident in the Divi-sion.
Despite a significant increase in the proportion of Kindergarten students with EAL in BSD (from 2% in 2005/06 to 13.2% in 2010/11), there has been only a slight decrease in readi-ness in the areas of language and communication.

Brandon School Division 2012-13 Student Achievement Summary Report Page 14
Research and Evaluation Services
57% 57% 59% 60%
63%
0%10%20%30%40%50%60%70%80%90%
100%
2005/06 2006/07 2008/09 2010/11
Percentage of Students 'VERY READY' in
One or More Domain
BSD Manitoba Baseline
31%37% 36% 33%
28%
0%10%20%30%40%50%60%70%80%90%
100%
2005/06 2006/07 2008/09 2010/11
Percentage of Students 'NOT READY' in One or More Domain
BSD Manitoba Baseline
The domain of greatest challenge for BSD students is Language and Thinking Skills. It is the domain with the fewest 'very ready' and the most 'not ready' stu-dents. While the Communication Skills domain shows many 'not ready' stu-dents, it is also the domain with the most 'very ready students'.
Comparing BSD with provincial statistics reveals that there is a similar percentage of students ‘very ready’ in at least one domain; however, there is a greater per-centage of students at BSD who are ‘not ready’ in at least one domain.
16%
20%
12%
13%
15%
48%
52%
55%
54%
53%
36%
28%
33%
33%
32%
0% 10% 20% 30% 40% 50% 60% 70% 80% 90% 100%
Communication Skills
Language & Thinking Skills
Emotional Maturity
Social Competence
Physical Health
Percentage of BSD Students 'Not Ready' and 'Very Ready' in Each Domain
Not Ready Mid-Range Very Ready

Brandon School Division 2012-13 Student Achievement Summary Report Page 15
Research and Evaluation Services
8% 8%6%
8%
5%0%
10%
20%
30%
40%
50%
2005/06 2006/07 2008/09 2010/11
Percentage of Students with Multiple Challenges*
BSD Manitoba Baseline
*Multiple Challenge In-dex: the proportion of children who have multi-ple challenges in 9 or more of the 16 sub-domains assess on the EDI.
Eight percent of BSD Kindergarten students are classified as having ‘multiple challenges.’ This is significantly higher than the Province’s baseline of 5%. Furthermore, there is greater discrepancy between the BSD and the Canadian sta-tistic of only 3.8%.
Summary of Early Development Instrument Results
The results of the 2010-2011 EDI reveal that Brandon School Division students are entering Kindergarten with, on av-erage, less developed school readiness skills than other Manitoba children. There are disproportionately greater num-bers of BSD students at each end of the ‘readiness continuum;’ meaning that more than 30% of our students are ‘very ready’ in 4 of the 5 domains, and more than 10% of our students are ‘not ready’ in each domain. The developmental area with the greatest need is Language and Thinking Skills since this is the area with the fewest ‘very ready’ and the most ‘not ready’ students. Significantly more children entering BSD schools do so with multiple challenges when com-pared with the Manitoba and the national data. In almost all areas, these most recent results extend the consistent pattern of results over the previous four EDI administrations, pointing to consistent negative trends.

Brandon School Division 2012-13 Student Achievement Summary Report Page 16
Research and Evaluation Services
Phonological Awareness Screening Results
BSD Kindergarten students are screened during the first and last six weeks of school by a yeam of Speech and Lan-
guage Pathologists and Speech and Language Educational Assistants using the Phonological Awareness Screening Test
(PAST). The screening consists of ten tasks relating to developmentally appropriate phonological awareness skills in-
cluding rhyming, letter sounds, word counting and syllable counting.
It is important to note that the PAST tool and scoring have not changed; however, the method of categorizing and re-
porting these results has changed as of June 2013. This is to bring the results more in line with other BSD assessment
performance indicators. Together with raw scores, results are now reported on MANE with different raw score ranges
used at each of the two screening periods. This new performance indicator reporting format is summarized in the fol-
lowing table.
A complete PAST report is available through Research and Evaluation Services.
Level #
Competency Level
Description Fall Raw Score
Range Spring Raw Score Range
4 Exceeding Beyond developmentally appropri-ate skill
38 - 50
3 Meeting Developmentally appropriate skill 25 - 37.5 35 - 50
2 Approaching Some difficulty with developmental-ly appropriate skill
12.5 - 24.5 25.5 - 34.5
1 Not Meeting Significant difficulty with develop-mentally appropriate skill
0 - 12 0 - 25

Brandon School Division 2012-13 Student Achievement Summary Report Page 17
Research and Evaluation Services
6%
72%
22%
14%
34%
14%
38%
0% 10% 20% 30% 40% 50% 60% 70% 80% 90% 100%
Spring
Fall
Percent of Students by Phonological Awareness Competency Level: Fall-to-Spring Comparison
Exceeding* Meeting Approaching Not Meeting
* Performance indicator expectations increase for the spring screening (see table on previous page); therefore the
exceeding level is eliminated in the spring screening.
In September 2012, 663 Kindergarten students were registered in Brandon School Division (BSD). Of those, 645 com-
pleted the fall screening. As of the end of June 2013, 671 students were registered, 639 of whom were assessed in the
spring of 2013.
18
38
0
5
10
15
20
25
30
35
40
45
50
Spring Fall
Fall-to-Spring Comparison in PAST Score
Highest possible score: 50

Brandon School Division 2012-13 Student Achievement Summary Report Page 18
Research and Evaluation Services
Fall-to-Spring Comparisons of Raw Scores and Percent Meeting Expectations by School

Brandon School Division 2012-13 Student Achievement Summary Report Page 19
Research and Evaluation Services
Summary of Phonological Awareness Screening Results
In general, significant improvements were seen over the year in Kindergarten students’ phonological awareness. This improvement is evident in the increase of average raw score (from 18 to 38 out of a possible 50 points), and these scores are virtually identical to those collected last year. Improvement is also shown in the increased percentage of students meeting developmentally appropriate phonological awareness skills in the spring (72%) compared with the fall (28%). Furthermore, while 38% of students entering Kindergarten were ‘not meeting,’ this was true of only 14% of students at the end of the year. These changes are especially noteworthy considering that the performance indicator expectations increase for the end-of-year screening. Despite the improvement, it should be noted that 14% of stu-dents entering Grade 1 will require additional supports in order to be successful, especially in reading. In examining only those students who were screened in both the fall and spring, each school site saw an increase in their students’ average scores, with eight schools seeing an increase in more than 20 raw score points. Furthermore, ten schools saw an increase in percentage of students meeting expectations of at least 45%; three of which experi-enced an increase of more than 70% of students. At a few schools, however, lower rates of growth are evident despite low scores in the fall.

Brandon School Division 2012-13 Student Achievement Summary Report Page 20
Research and Evaluation Services
18%
17%
12%
64%
67%
72%
86%
88%
16%
14%
15%
13%
10%
2%
2%
2%
1%
1%
0% 10% 20% 30% 40% 50% 60% 70% 80% 90% 100%
Accurate Drawing
Colouring
Prints Name
Scissors
Pencil Grip
June Fine Motor Competencies: % E, M, A, N
E
M
A
N
8%5%
2%
13% 12%
-40%
-30%
-20%
-10%
0%
10%
20%
30%
Pencil Grip Scissors Prints Name Colouring Accurate Drawing
Difference in Percent of Students Meeting or Exceeding Fine Motor Expectations
n = 567
Brandon School Division Kindergarten Continuum Results The Best Practices Kindergarten Continuum was developed by a team of Brandon School Division teachers and admin-istrators. Last year (2011-2012), this continuum was piloted in 10 BSD schools. In this, the 2012-2013 school year, the Kindergarten Continuum was utilized by all Kindergarten teachers in the reporting of student achievement in Novem-ber, March and June reports. The Kindergarten Continuum assesses the extent to which each student is achieving ex-pectations in literacy, numeracy, and fine motor skills. Expected skills increase in each subsequent reporting period. Thus, a child is meeting the counting expectations in November if she can count to 10 starting from 1. However, in order to be meeting expectations in March, that same child must demonstrate the ability to count to 10 starting from any number; and in June must count to 30 starting from any number.
A French Immersion version of the Kindergarten Continuum was piloted and subjected to various revisions through-out the 2012/13 school year, thus it is important to note that current results do not include French Immersion stu-dents. Full November, March, and June reports are available through Research and Evaluation Services.

Brandon School Division 2012-13 Student Achievement Summary Report Page 21
Research and Evaluation Services
21%
45%
39%
58%
66%
11%
50%
75%
75%
50%
12%
35%
23%
19%
42%
21%
24%
24%
20%
21%
13%
11%
8%
37%
12%
1%
1%
9%
22%
13%
8%
7%
11%
17%
0% 10% 20% 30% 40% 50% 60% 70% 80% 90% 100%
Listens to Others
Listens to Stories
Beginning Sounds*
Word Recognition
Letter Sounds
Lower Case
Upper Case
Story Retell
Sense of Rhyme
June Literacy Competencies: % E, M, A, N
E
M
A
N
8%
-9%
12%
7%
24%
-38%
14% 15%
-40%
-30%
-20%
-10%
0%
10%
20%
30%
Sense ofRhyme
Story Retell* Upper Case Lower Case Letter Sounds WordRecognition
Listens toStories
Listens toOthers
Difference in Percent of Students Meeting or Exceeding Literacy Expectations
* Indicates competencies not assessed in November, therefore progress is from March to June.
n = 567

Brandon School Division 2012-13 Student Achievement Summary Report Page 22
Research and Evaluation Services
26%
19%
21%
38%
53%
40%
19%
40%
79%
47%
48%
82%
61%
55%
43%
31%
51%
60%
34%
10%
42%
91%
23%
16%
19%
20%
17%
14%
7%
10%
12%
8%
10%
8%
3%
1%
1%
3%
2%
1%
2%
11%
14%
3%
1%
1%
0% 10% 20% 30% 40% 50% 60% 70% 80% 90% 100%
3-D Objects*
Shapes
Compares 2 Objects*
Sorts
Representing Number*
Subitize
Match Sets/Numerals
Backward Counting
Forward Counting
Number Recognition
Patterns
Colours
June Numeracy Competencies: % E, M, A, N
E
M
A
N
3%
8%5%
-18%
4%
-3%
9%
-6% -5%
-40%
-30%
-20%
-10%
0%
10%
20%
30%
Colours Patterns NumberRecognition
ForwardCounting
BackwardCounting*
Match Sets/Numerals*
Subitize* Sorts Shapes
Difference in Percent of Students Meeting or Exceeding Numeracy Expectations
* Indicates competencies not assessed in November, therefore progress is from March to June.
n = 567

Bra
nd
on
Sch
oo
l Div
isio
n
20
12
-13
Stu
den
t A
chie
vem
ent
Sum
mar
y R
epo
rt
Pag
e 2
3
Res
earc
h a
nd
Eva
luati
on
Ser
vice
s
Kin
de
rgar
ten
Lit
era
cy a
nd
Fin
e M
oto
r C
om
pet
en
cie
s: P
erc
ent
Me
etin
g o
r Ex
cee
din
g b
y Sc
ho
ol*
*Fre
nch
Imm
ersi
on
stu
den
ts a
re n
ot
rep
ort
ed. P
erce
nta
ges
in r
ed a
re lo
wer
th
an 8
0%
; bo
lded
red
are
low
er t
han
50
%.

Bra
nd
on
Sch
oo
l Div
isio
n
20
12
-13
Stu
den
t A
chie
vem
ent
Sum
mar
y R
epo
rt
Pag
e 2
4
Res
earc
h a
nd
Eva
luati
on
Ser
vice
s
Kin
de
rgar
ten
Nu
me
racy
Co
mp
eten
cies
: Pe
rce
nt
Me
etin
g o
r Ex
cee
din
g b
y Sc
ho
ol*
*Fre
nch
Imm
ersi
on
stu
den
ts a
re n
ot
rep
ort
ed. P
erce
nta
ges
in r
ed a
re lo
wer
th
an 8
0%
; bo
lded
red
are
low
er t
han
50
%.

Brandon School Division 2012-13 Student Achievement Summary Report Page 25
Research and Evaluation Services
Summary of Kindergarten Continuum Results
Fine Motor
In each of the 5 fine motor competencies, 80% of students or more are meeting or exceeding expectations. Further-
more, very few students (less than 3%) are ‘not meeting’ in each of these fine motor competencies.
Literacy
More than 80% of students are ‘meeting’ or ‘exceeding’ expectations in identifying upper- and lowercase letters. Al-
ternatively, a third or more students are only approaching or ‘not meeting’ expectations in the areas of word recogni-
tion and story retell. Of particular note, a full 22% of students are unable to recognize at least 10 sight words (i.e., not
meeting expectations in that domain). There is greater discrepancy of performance level attainment on literacy com-
petencies compared with numeracy.
Numeracy
In 9 of the 12 math competencies assessed in June, at least 80% of students are ‘meeting’ or ‘exceeding’ expecta-
tions. Forward and backward counting, are the numeracy competencies with the greatest percentage of students ‘not
meeting’ expectations (14% and 11% respectively).
Year-Long Progress Monitoring in all Domains
For the majority of competencies assessed at multiple points throughout the year, there is a greater percentage of
students ‘meeting’ or ‘exceeding’ expectations in June compared with earlier in the year. Although the identification
of letter sounds continues to be an area of challenge for about a quarter of students, this skill area saw the greatest
amount of progress across the Division (24% more students are meeting expectations in this skill in June compared
with November). All of the percentage gains are indicative of strong growth considering that, for most of the compe-
tencies assessed, the expectations have increased in complexity for obtaining each of the MANE indicators.
There are only three competencies for which there was a decline in the percentage of students ‘meeting’ or
‘exceeding’ expectations. These were forward counting, story retell, and word recognition. These declines signal com-
petencies in which students struggle with the increased level of expectation in June compared with November or
March. For instance, in the area of word recognition which saw a 38% decline over the year, students meet Novem-
ber expectations if they are able to recognize their own name, whereas in June they must recognize 10 sight words.

Brandon School Division 2012-13 Student Achievement Summary Report Page 26
Research and Evaluation Services
The Effect of Full Day Every Day Kindergarten on Student
Achievement
In the 2012/13 school year, five schools offered full day every day (FDED) Kindergarten programs. At thirteen elemen-
tary schools, half-time Kindergarten was offered (either every morning, every afternoon, or full day every other day). It
In tracking the effect of FDED Kindergarten on student achievement, comparative analyses were conducted on FDED
and half-time students’ PAST scores and June Continuum scores. Specifically, tracking was done on the relative pro-
gress made in each of these student groups.
16%
80%
35%
72%
0%
10%
20%
30%
40%
50%
60%
70%
80%
90%
100%
% Meeting in Fall % Meeting in Spring
Kindergarten Schedules: Relative Progress of % of Students Meeting Phonological Awareness Expectations
Full Day Every Day Half-Time

Brandon School Division 2012-13 Student Achievement Summary Report Page 27
Research and Evaluation Services
12%9% 8%
12% 14%
6%3%
-1%
14%11%
-50%
-40%
-30%
-20%
-10%
0%
10%
20%
30%
40%
Pencil Grip Scissors Prints Name Colouring Accurate Drawing
November to June Difference in Percent of Students Meeting or Exceeding Fine Motor Expectations:
Comparing Full to Half-Time Kindergarten
FDED Half-Time
11%
-11%
18%14%
30%
-33%
16% 15%
5%
-10%
8%
3%
20%
-41%
14% 14%
-50%
-40%
-30%
-20%
-10%
0%
10%
20%
30%
40%
Sense ofRhyme
Story Retell* Upper Case Lower Case Letter Sounds WordRecognition
Listens toStories
Listens toOthers
November to June Difference in Percent of Students Meeting or Exceeding Literacy Expectations: Comparing
Full to Half-Time Kindergarten
FDED Half-Time

Brandon School Division 2012-13 Student Achievement Summary Report Page 28
Research and Evaluation Services
Summary of the Effects of Full Day Every Day Kindergarten
Despite starting the year with a smaller percentage of students meeting expectations compared with students on half
-time schedules, a greater percentage of FDED Kindergarten students ended the year meeting phonological aware-
ness expectations. These statistics suggest that FDED Kindergarten experience is one factor that has contributed to
closing the gap in phonological awareness of BSD students.
When considering the difference in percentages from November to June of students meeting or exceeding expecta-
tions in all Kindergarten outcomes, there is a tendency towards FDED students making greater gains, or showing less
loss. For instance, although the percentage of students meeting forward counting expectations went down (again,
note the changing/increasing criteria), 13% fewer students in FDED are meeting this outcome in June compared with
21% fewer students in the other schedules. And although 20% more half-time students were meeting expectations in
letter sound identification in June compared with November, this was true of 30% of the FDED students.
7% 8% 9%
-13%
1%
-2%
6%
-6%
0%1%
8%4%
-21%
4%
-3%
10%
-7% -8%
-50%
-40%
-30%
-20%
-10%
0%
10%
20%
30%
40%
Colours Patterns NumberRecognition
ForwardCounting
BackwardCounting*
Match Sets/Numerals*
Subitize* Sorts Shapes
November to June Difference in Percent of Students Meeting or Exceeding Numeracy Expectations:
Comparing Full to Half-Time Kindergarten
FDED Half-Time

Brandon School Division 2012-13 Student Achievement Summary Report Page 29
Research and Evaluation Services
DIVISIONAL AND
PROVINCIAL FORMATIVE
ASSESSMENT RESULTS
Section B:

Brandon School Division 2012-13 Student Achievement Summary Report Page 30
Research and Evaluation Services
56.0%
62.5%
58.9%
25.3%
18.1%
22.4%
18.6%
19.3%
18.1%
0% 10% 20% 30% 40% 50% 60% 70% 80% 90% 100%
Sets Reading Goals
Strategies
Comprehension
Grade 3 Provincial Reading Assessment:Percent Meeting, Approaching and Not Meeting
M
A
N
n = 586
Division-Wide Formative Assessment Results: Reading
The following graphs show the results of BSD students on all formative assessments in reading. Grade 3 and Grade 8
are Provincial assessments, while Grade 5, 7, and 9 are Divisional assessments. In each graph, percentages are based
on the total number of students who completed any part of the assessment. Therefore, stacked bars do not always
add up to 100%. The remaining (empty) portion of the bar represents the proportion of students for whom data is
not available.
59% 63% 62%56%
63% 59%
0%
10%
20%
30%
40%
50%
60%
70%
80%
90%
100%
Sets Reading Goals Strategies Comprehension
Grade 3 Provincial Reading Assessment:Two-Year Comparison of % Meeting
2011/12 2012/13

Brandon School Division 2012-13 Student Achievement Summary Report Page 31
Research and Evaluation Services
48.9%
43.5%
61.6%
35.8%
45.9%
29.1%
14.1%
10.1%
9.1%
0% 10% 20% 30% 40% 50% 60% 70% 80% 90% 100%
Fluency and Expression
Responds Critically
Comprehension
Grade 5 Divisional Reading Assessment: Percent Meeting, Approaching and Not Meeting
M
A
N
n = 573
57%
49%
58%
49%44%
62%
0%
10%
20%
30%
40%
50%
60%
70%
80%
90%
100%
Fluency and Expression Responds Critically Comprehension
Grade 5 Divisional Reading Assessment:Two-Year Comparison of % Meeting
2011/12 2012/13

Brandon School Division 2012-13 Student Achievement Summary Report Page 32
Research and Evaluation Services
54.0%
53.6%
57.6%
32.6%
36.6%
32.0%
12.7%
9.7%
9.8%
0% 10% 20% 30% 40% 50% 60% 70% 80% 90% 100%
Fluency and Expression
Responds Critically
Comprehension
Grade 7 Divisional Reading Assessment:Percent Meeting, Approaching and Not Meeting
M
A
N
n = 528
57% 55%
62%
54% 54%58%
0%
10%
20%
30%
40%
50%
60%
70%
80%
90%
100%
Fluency and Expression Responds Critically Comprehension
Grade 7 Divisional Reading Assessment:Two-Year Comparison of % Meeting
2011/12 2012/13
Brandon School Division 2012-13 Student Achievement Summary Report Page 33
Research and Evaluation Services
52%
59%
62%
28%
26%
23%
14%
11%
10%
5%
5%
5%
0% 10% 20% 30% 40% 50% 60% 70% 80% 90% 100%
Critical response
Interpretation
Com prehension
Grade 8 Provincial Reading Assessment:% Meeting, Approaching, Not Meeting, and Out of
Range*
M
A
N
OOR
n = 547
54%
61%63%
52%59%
62%
0%
10%
20%
30%
40%
50%
60%
70%
80%
90%
100%
Critical response Interpretation Comprehension
Grade 8 Provincial Reading Assessment:Two-Year Comparison of % Meeting
2011-12 2012-13
*According to Manitoba Education, ‘Out of Range’ is used for students whose ”late-January performance level is below the low-
est level described in the reporting template.”

Brandon School Division 2012-13 Student Achievement Summary Report Page 34
Research and Evaluation Services
6.9%
5.3%
7.6%
5.1%
14.4%
41.7%
31.2%
21.7%
28.3%
56.3%
29.6%
41.0%
19.0%
39.3%
24.1%
12.3%
12.0%
41.9%
18.7%
2.1%
0% 10% 20% 30% 40% 50% 60% 70% 80% 90% 100%
Comprehnsion - Main Idea (NF)
Comprehnsion - Inference (F)
Personal & Critical Response
Techniques & Elements (NF)
Comprehension (F)
Grade 9 Divisional Reading Assessment: % E, M, A, N
E M A N
n = 568
Summary of Formative Assessment Results in Reading
At least 80% of students are either ‘meeting’ or ‘approaching’ grade level expectations on these formative assessments in read-
ing. In general, a little more than half of the students are meeting expectations, while approximately 10% of students need ongo-
ing help to meet grade-level expectations. However, there are slightly higher percentages of Grade 3 and Grade 9 students who
need ongoing help in reading.
Across grade level assessments, comprehension is generally the reading competency with the higher percentages of students
meeting expectations. At the grade 9 level, the majority of students (71%) are meeting expectations in comprehending fiction;
however, comprehension of non-fiction and the ability to make inferences from text are two competencies in need for more de-
velopment. Across all grade levels, critical response to text is the competency with consistently fewer students meeting expecta-
tions compared with the other reading competencies.
In the coming years, a multiple-year comparison will allow for a more complete analysis of historical trends. Currently, the two-
year comparison reveals slightly lower percentages of students meeting expectations in the current year; however, the reading
competencies with highest and lowest relative scores remain consistent.
Note: Two-year comparison is not available for this assessment.

Brandon School Division 2012-13 Student Achievement Summary Report Page 35
Research and Evaluation Services
52.4%
46.0%
36.7%
45.4%
44.0%
40.1%
40.3%
34.5%
40.7%
36.7%
7.3%
13.7%
28.5%
13.7%
19.2%
0% 10% 20% 30% 40% 50% 60% 70% 80% 90% 100%
Ideas
Organization
Word Choice
Sentence Fluency
Conventions
Grade 3 Divisional Writing Assessment:Percent Meeting, Approaching and Not Meeting
M
A
N
n = 548
Division-Wide Formative Assessment Results: Writing
The following graphs show the results of BSD students on all formative assessments in writing. Grade 3, 5, 7, and 9
are Divisional assessments while Grade 8 is a Provincial assessment. In each graph, percentages are based on the to-
tal number of students who completed any part of the assessment. Therefore, stacked bars do not always add up to
100%. The remaining (empty) portion of the bar represents the proportion of students for whom data is not available.
53% 52%
36%
44% 44%
52%46%
37%
45% 44%
0%
10%
20%
30%
40%
50%
60%
70%
80%
90%
100%
Ideas Organization Word Choice Sentence Fluency Conventions
Grade 3 Divisional Writing Assessment:Two-Year Comparison of % Meeting
2011/12 2012/13

Brandon School Division 2012-13 Student Achievement Summary Report Page 36
Research and Evaluation Services
39.6%
31.6%
44.7%
46.2%
49.6%
39.4%
14.0%
18.8%
15.4%
0% 10% 20% 30% 40% 50% 60% 70% 80% 90% 100%
Ideas/Organization
Word Choice
Conventions
Grade 5 Divisional Writing Assessment:Percent Meeting, Approaching and Not Meeting
M
A
N
n = 573
45%
35%
45%40%
32%
45%
0%
10%
20%
30%
40%
50%
60%
70%
80%
90%
100%
Ideas/Organization Word Choice Conventions
Grade 5 Divisional Writing Assessment:Two-Year Comparison of % Meeting
2011/12 2012/13

Brandon School Division 2012-13 Student Achievement Summary Report Page 37
Research and Evaluation Services
46.2%
37.3%
50.4%
38.1%
46.6%
35.2%
15.3%
15.7%
14.0%
0% 10% 20% 30% 40% 50% 60% 70% 80% 90% 100%
Ideas/ Organization
Word Choice
Conventions
Grade 7 Divisional Writing Assessment:Percent Meeting, Approaching and Not Meeting
M
A
N
n = 528
49% 48%52%
46%
37%
50%
0%
10%
20%
30%
40%
50%
60%
70%
80%
90%
100%
Ideas/ Organization Word Choice Conventions
Grade 7 Divisional Writing Assessment:Two-Year Comparison of % Meeting
2011/12 2012/13

Brandon School Division 2012-13 Student Achievement Summary Report Page 38
Research and Evaluation Services
50%
48%
54%
32%
33%
30%
13%
14%
10%
5%
5%
5%
0% 10% 20% 30% 40% 50% 60% 70% 80% 90% 100%
Conventions
Word choice
Ideas and organization
Grade 8 Provincial Writing Assessment:Percent Meeting, Approaching, Not Meeting, and Out
of Range*
M
A
N
OOR
n = 547
48% 50%
60%
50% 48%54%
0%
10%
20%
30%
40%
50%
60%
70%
80%
90%
100%
Conventions Word choice Ideas and organization
Grade 8 Provincial Writing Assessment:Two-Year Comparison of % Meeting
2011-12 2012-13
*According to Manitoba Education, ‘Out of Range’ is used for students whose ”late-January performance level is below the low-
est level described in the reporting template.”

Brandon School Division 2012-13 Student Achievement Summary Report Page 39
Research and Evaluation Services
17.4%
19.2%
13.9%
19.0%
59.3%
63.7%
57.2%
61.6%
17.3%
10.7%
22.1%
12.9%
0.9%
1.1%
1.4%
1.4%
0% 10% 20% 30% 40% 50% 60% 70% 80% 90% 100%
Grammar & Mechanics
Voice
Organization
Ideas
Grade 9 Divisional Writing Assessment: % E, M, A, N
E M A N
n = 568
Summary of Formative Assessment Results in Writing
With the exception of one competency at one grade level, at least 80% of students are either ‘meeting’ or ‘approaching’ writing
expectations on these formative assessments. In general, a little fewer than half of the students are meeting expectations on the
Grade 3, 5, and 7 formative assessments in writing, while approximately 15% of students and need ongoing help to meet grade-
level expectations.
Across grades 3, 5, and 7, word choice is the writing competency of greatest challenge. At these grade levels, word choice is con-
sistently the writing competency in which the smallest percentage of students is meeting expectations.
In future years, a multiple-year comparison will allow for a more complete analysis of historical trends. Currently, the two-year
comparison generally reveals slightly lower percentages of students meeting expectations in the current year; however the
writing competencies with highest and lowest relative scores remains consistent.
Note: Two-year comparison is not available for this assessment.

Brandon School Division 2012-13 Student Achievement Summary Report Page 40
Research and Evaluation Services
59.5%
53.5%
67.3%
50.3%
30.2%
34.0%
23.0%
30.3%
9.8%
12.0%
9.7%
18.7%
0% 10% 20% 30% 40% 50% 60% 70% 80% 90% 100%
Patterns
Equality
Representing Numbers
Mental Math
Grade 3 Provincial Numeracy Assessment:Percent Meeting, Approaching and Not Meeting
M
A
N
n = 600
Division-Wide Formative Assessment Results: Numeracy
The following graphs show the results of BSD student achievement on all formative assessments in numeracy.
Grades 3 and 7 are Provincial assessments, while Grades 5 and 9 are locally developed assessments. While the as-
sessments in Grades 3, 5, and 7 use the MANE indicators, the Grade 9 numeracy assessment is scored using tradi-
tional percentage scores. In each graphical representation of MANE, percentages are based on the total number of
students who completed any part of the assessment. Therefore, stacked bars do not always add up to 100%. The
remaining (empty) portion of the bar represents the proportion of students for whom data was not available.
54% 52%
69%
50%
60%54%
67%
50%
0%
10%
20%
30%
40%
50%
60%
70%
80%
90%
100%
Patterns Equality Representing Numbers Mental Math
Grade 3 Provincial Numeracy Assessment:Two-Year Comparison of % Meeting
2011/12 2012/13

Brandon School Division 2012-13 Student Achievement Summary Report Page 41
Research and Evaluation Services
11.1%
10.9%
10.7%
9.7%
18.0%
45.1%
38.8%
39.6%
41.7%
55.8%
31.6%
38.9%
31.3%
25.9%
17.5%
12.2%
11.1%
18.4%
22.8%
8.5%
0% 10% 20% 30% 40% 50% 60% 70% 80% 90% 100%
Decimals
Fractions
Patterns
Mental Math
Place Value
Grade 5 Divisional Numeracy Assessment:Percent E, M, A, N
E
M
A
N
n = 588
48%45% 47%
43%
63%
56%50% 50% 51%
74%
0%
10%
20%
30%
40%
50%
60%
70%
80%
90%
100%
Decimals Fractions Patterns Mental Math Place Value
Grade 5 Divisional Numeracy Assessment:Two-Year Comparison of % Meeting/Exceeding
2011/12 2012/13
Brandon School Division 2012-13 Student Achievement Summary Report Page 42
Research and Evaluation Services
51.8%
68.1%
62.2%
45.6%
51.4%
33.6%
25.0%
26.0%
33.8%
28.9%
14.7%
6.9%
11.9%
20.6%
19.7%
0% 10% 20% 30% 40% 50% 60% 70% 80% 90% 100%
Fractions
Decimals
Representing Number
Patterns
Mental Math
Grade 7 Provincial Numeracy Assessment:Percent Meeting, Approaching and Not Meeting
M
A
N
n = 539
65%
50%
41%47%
53%
0%
10%
20%
30%
40%
50%
60%
70%
80%
90%
100%
Number Concepts Patterns &Relations
Shape & Space Statistics &Probability
Total
Grade 9 Divisional Numeracy Assessment: Average % Scores in Each Competency
% n
Number Concepts 65% 577
Patterns & Relations 50% 569
Shape & Space 41% 576
Statistics & Probability 47% 581
Total 53% *552 * Those students who completed ALL parts of the assessment.
Note: Two-year comparison is not available for these assessments.
n’s are different for
each strand; see
table below

Brandon School Division 2012-13 Student Achievement Summary Report Page 43
Research and Evaluation Services
Summary of Formative Assessment Results in Numeracy
In the majority of numeracy competencies across all grade levels, close to 80% of students or more are either ‘meeting’ or
‘approaching’ expectations. Competencies with the highest percentage of students meeting expectations include: Representing
Number in Grade 3 (67%), Place Value in Grade 5 (74%), Decimals in Grade 7 (68%) and Representing Number in Grade 7 (62%).
Each of these competencies is from the Number Strand of the Manitoba Mathematics Curriculum. Number Concepts is also the
strand with the highest average percentage on the Grade 9 numeracy assessment. This strand is a relative strength for BSD stu-
dents.
Across grades 3, 5, and 7, mental math is the numeracy competency of greatest challenge. While approximately 50% of students
at each grade are meeting expectations in this competency, approximately 20% of students need ongoing help in this skill.
Patterns is also a competency of challenge for BSD students. While 60% of Grade 3 students are meeting expectations in pattern-
ing, this rate of competency declines in subsequent grades to 50% in Grade 5 and 45% in Grade 7. Furthermore, 1 in 5 students
need ongoing help in patterning at the Grade 5 and 7 levels. Shape and Space as well as Statistics and Probability are included in
the Grade 9 assessment only, but these two strands have the lowest average percentage scores of that assessment (41% and 47%
respectively).
In the coming years, a multiple-year comparison will allow for a more complete analysis of historical trends. Currently, the two-
year comparison generally reveals slightly higher percentages of students meeting expectations in the current year; and the nu-
meracy competencies with highest and lowest relative scores remain consistent.

Brandon School Division 2012-13 Student Achievement Summary Report Page 44
Research and Evaluation Services
Grade 4 Provincial Reading in French Assessment Results
66%
66%
68%
14%
19%
20%
20%
15%
12%
0% 10% 20% 30% 40% 50% 60% 70% 80% 90% 100%
Sets Reading Goals
Strategies
Comprehension
Grade 4 Provincial Reading in French Assessment:Percent Meeting, Approaching, and Not Meeting
M
A
N
94%90% 90%
66% 66% 68%
0%
10%
20%
30%
40%
50%
60%
70%
80%
90%
100%
Sets Reading Goals Strategies Comprehension
Grade 4 Provincial Reading in French Assessment:Two-Year Comparison of % Meeting
2011-12 2012-13
Summary of Formative Assessment Results in Reading in French
In all competencies assessed, at least 80% of students are meeting or approaching expectations in this assessment. Compared
with other provincial and divisional assessments, there is a tendency for there to be fewer students approaching expectations;
rather, we see slightly higher percentages of students at both ends of the continuum—meeting and not meeting. This year’s re-
sults have declined from last year.
n = 59

Brandon School Division 2012-13 Student Achievement Summary Report Page 45
Research and Evaluation Services
Grade 7 Provincial Engagement Assessment Results The following graph depicts the results of BSD students in the Grade 7 Provincial Engagement assessment. Students in both the
English and French Immersion programs are assessed on 5 engagement skill areas, and students in the French Immersion pro-
gram are assessed on one additional skill relating to their use of the French language. Teachers assess students using the follow-
ing indicators: Establish (nearly always), Developing (quite often), Emerging (only sometimes), and Inconsistent.
17%
49%
47%
43%
35%
44%
68%
31%
32%
35%
35%
34%
15%
15%
17%
17%
24%
17%
0%
4%
4%
4%
5%
3%
0% 10% 20% 30% 40% 50% 60% 70% 80% 90% 100%
Using French as a tool for growth*
Accepting responsibility for assignments
Participating in lessons
Aware of learning goals
Engaging in self-assessment
Demonstrating interest in learning
Grade 7 Provincial Engagement Competencies: % at Each Engagement Level
Established Developing Emerging Inconsistent
* Only assessed for students in the French Immersion Program; n = 41.
n = 551
50%58%
52% 52%
41%
50%
17%
49% 47%43%
35%44%
0%
10%
20%
30%
40%
50%
60%
70%
80%
90%
100%
Using French as atool for growth*
Acceptingresponsibility for
assignments
Participating inlessons
Aware of learninggoals
Engaging in self-assessment
Demonstratinginterest in learning
Grade 7 Provincial Engagement Assessment: Two-Year Comparison of % 'Established'
2011-12 2012-13

Brandon School Division 2012-13 Student Achievement Summary Report Page 46
Research and Evaluation Services
Summary of Provincial Engagement Assessment Results
The 5 engagement skill areas assessed across both the English and French Immersion programs are considered first. Slightly less
than 50% of BSD students are demonstrating established engagement skills, while another third are demonstrating these skills
quite often. For 4 of the 5 skills, close to 80% of students are demonstrating the skills very often or even ‘almost always.’ Stu-
dents find self-assessment the most challenging skill—only a third of students are established in this skill while a full quarter are
emerging. The data also shows that the second lowest percentage of ‘established’ students is in “being aware of learning goals of
a unit of study and/or personal learning goals.”
“Using French as a tool for personal and social growth” is an engagement skill assessed in the French Immersion program only. In
general, this skills is not well established for students in BSD and across the province.

Bra
nd
on
Sch
oo
l Div
isio
n
20
12
-13
Stu
den
t A
chie
vem
ent
Sum
mar
y R
epo
rt
Pag
e 4
7
Res
earc
h a
nd
Eva
luati
on
Ser
vice
s
Sch
oo
l-S
ite
Fo
rma
tiv
e A
sse
ssm
en
t R
esu
lts
R
ead
ing
Wri
tin
g N
um
era
cy
Sch
oo
l n
Sets
Re
ad-
ing
Go
als
Stra
tegi
es
Co
mp
re-
he
nsi
on
n
Id
eas
Org
aniz
a-
tio
n
Wo
rd
Ch
oic
e
Sen
ten
ce
Flu
en
cy
Co
nve
n-
tio
ns
n
Patt
ern
s Eq
ual
ity
Re
pre
-
sen
tin
g
Nu
mb
ers
Me
nta
l
Mat
h
BSD
5
86
5
9%
6
3%
6
2%
5
48
5
3%
5
2%
3
6%
4
4%
4
4%
6
00
5
4%
5
2%
6
9%
5
0%
Ale
xa
nd
er
Sch
oo
l 1
0
100
%
100
%
10
0%
1
0
10
0%
9
0%
1
00
%
10
0%
6
0%
1
0
10
0%
1
00
%
10
0%
8
0%
Be
tty G
ibson
Scho
ol
36
3
1%
31%
3
1%
2
4
25
%
17
%
13
%
33
%
21
%
38
3
7%
4
7%
5
0%
2
9%
Ea
rl O
xfo
rd S
ch
ool
25
3
2%
32%
2
8%
2
3
48
%
44
%
22
%
17
%
13
%
25
3
2%
2
8%
4
8%
2
0%
Éco
le H
arr
iso
n
43
8
8%
84%
8
6%
4
2
57
%
48
%
55
%
55
%
52
%
43
8
1%
7
4%
7
9%
7
4%
Ge
org
e F
itto
n S
cho
ol
51
5
5%
59%
5
7%
4
9
51
%
37
%
29
%
28
%
41
%
54
2
2%
3
7%
5
4%
3
9%
Gre
en
Acre
s S
ch
ool
17
3
5%
41%
4
1%
1
6
63
%
75
%
63
%
10
0%
5
6%
1
7
41
%
59
%
77
%
53
%
J.
R. R
eid
Sch
ool
27
3
7%
63%
6
7%
2
5
72
%
76
%
56
%
56
%
60
%
27
7
0%
7
0%
8
5%
7
0%
Kin
g G
eo
rge
Sch
ool
28
6
4%
57%
5
0%
2
8
39
%
29
%
21
%
32
%
36
%
28
7
9%
8
6%
7
1%
5
7%
Kir
kca
ldy H
eig
hts
Scho
ol
47
3
2%
62%
4
3%
4
6
28
%
17
%
11
%
17
%
33
%
47
4
0%
4
3%
3
8%
3
8%
Lin
den
Lan
es S
cho
ol
37
9
2%
78%
7
6%
3
4
82
%
79
%
77
%
68
%
65
%
37
6
8%
5
1%
8
7%
6
0%
Me
ad
ow
s S
ch
ool
38
5
0%
58%
5
3%
3
6
53
%
39
%
36
%
50
%
42
%
40
6
5%
4
3%
6
8%
4
3%
Éco
le N
ew
Era
Sch
ool (E
NG
) 3
3
3%
3
3%
27
%
22
3
2%
3
2%
1
8%
5
5%
2
3%
3
3
79
%
39
%
58
%
24
%
Éco
le N
ew
Era
Sch
ool (F
R)
26
8
9%
73%
6
9%
2
3
44
%
39
%
26
%
48
%
48
%
26
4
6%
4
6%
4
6%
4
2%
Éco
le O
'Ke
lly S
cho
ol (E
NG
) 2
5
80%
8
0%
80
%
25
6
8%
6
0%
6
0%
6
0%
6
4%
2
5
72
%
68
%
80
%
80
%
Éco
le O
'Ke
lly S
cho
ol (F
R)
8
63%
7
5%
88
%
8
63
%
75
%
50
%
63
%
63
%
8
10
0%
7
5%
1
00
%
88
%
Riv
erh
eig
hts
Sch
oo
l 2
5
88%
8
0%
68
%
31
3
6%
3
2%
1
3%
3
2%
3
9%
3
1
71
%
71
%
77
%
65
%
Riv
erv
iew
Sch
oo
l 2
3
4%
4
4%
52
%
22
2
3%
0
%
0%
9
%
5%
2
3
48
%
17
%
39
%
30
%
Sp
rin
g V
alle
y C
olo
ny S
ch
ool
4
4
4
St.
Au
gustin
e S
ch
ool
24
6
3%
88%
8
8%
2
5
64
%
76
%
44
%
64
%
64
%
25
9
2%
3
6%
8
8%
3
6%
Va
lleyvie
w C
en
ten
nia
l S
ch
oo
l 2
3
61%
5
7%
44
%
19
6
8%
5
8%
3
2%
6
3%
7
4%
2
3
52
%
44
%
91
%
65
%
Wave
rly P
ark
Sch
oo
l 3
6
81%
7
8%
81
%
36
6
9%
6
9%
6
1%
5
0%
5
0%
3
6
72
%
83
%
83
%
75
%
Gra
de
3 R
ead
ing,
Wri
tin
g, a
nd
Nu
me
racy
: % M
eeti
ng
or
Exce
edin
g b
y Sc
ho
ol*
*Per
cen
tage
s in
th
is t
able
sh
ou
ld b
e re
ad a
s th
e p
erce
nta
ge o
f st
ud
ents
mee
tin
g ex
pe
ctati
on
s in
eac
h c
om
pet
ency
. In
cas
es
wh
ere
a p
erfo
rman
ce le
vel o
f ‘E
xcee
din
g’ is
po
ssi-
ble
, th
e p
erce
nta
ges
in t
his
tab
le r
efer
to
th
e co
mb
inati
on
of
stu
den
ts w
ho
are
me
etin
g O
R e
xce
edin
g ex
pe
ctati
on
s. P
erce
nta
ge
s in
red
are
low
er t
han
th
e D
ivis
ion
al %
fo
r th
at
com
pet
ency
.

Bra
nd
on
Sch
oo
l Div
isio
n
20
12
-13
Stu
den
t A
chie
vem
ent
Sum
mar
y R
epo
rt
Pag
e 4
8
Res
earc
h a
nd
Eva
luati
on
Ser
vice
s
R
ead
ing
Wri
tin
g N
um
era
cy
Sch
oo
l n
Flu
en
cy &
Exp
ress
ion
Re
spo
nd
s
Cri
tica
lly
Co
mp
reh
en
-
sio
n
n
Ide
as/
Or-
gan
izati
on
Wo
rd
Ch
oic
e
Co
nve
nti
on
s n
D
eci
mal
s Fr
acti
on
s P
atter
ns
Me
nta
l
Mat
h
Pla
ce V
alu
e
BSD
5
73
4
9%
4
4%
6
2%
5
73
4
0%
3
2%
4
5%
5
88
5
6%
5
0%
5
0%
5
1%
7
4%
Ale
xa
nd
er
Sch
oo
l 8
7
5%
63%
7
5%
8
7
5%
5
0%
6
3%
8
10
0%
1
00
%
10
0%
1
00
%
10
0%
Be
tty G
ibson
Scho
ol
28
5
0%
25%
6
4%
2
8
25
%
14
%
25
%
32
9
%
19
%
19
%
9%
4
4%
Ea
rl O
xfo
rd S
ch
ool
17
4
7%
35%
7
1%
1
7
18
%
18
%
18
%
18
3
3%
2
2%
6
%
0%
6
1%
Éco
le H
arr
iso
n
23
8
3%
83%
9
1%
2
3
74
%
87
%
83
%
23
9
6%
7
0%
8
7%
8
7%
1
00
%
Ge
org
e F
itto
n S
cho
ol
49
3
1%
33%
3
9%
4
9
33
%
16
%
37
%
51
4
9%
2
4%
6
5%
5
5%
8
0%
Gre
en
Acre
s S
ch
ool
14
5
0%
43%
7
1%
1
4
50
%
14
%
93
%
17
5
9%
4
7%
2
9%
5
9%
7
1%
J.
R. R
eid
Sch
ool
20
4
5%
70%
6
0%
2
0
25
%
20
%
40
%
18
6
1%
5
6%
5
0%
3
9%
5
6%
Kin
g G
eo
rge
Sch
ool
20
3
5%
40%
6
0%
2
0
25
%
20
%
15
%
21
8
1%
5
7%
7
6%
5
2%
9
5%
Kir
kca
ldy H
eig
hts
Scho
ol
48
6
3%
58%
7
3%
4
8
48
%
33
%
40
%
48
7
1%
7
9%
7
5%
6
7%
9
2%
Lin
den
Lan
es S
cho
ol
31
5
8%
58%
7
1%
3
1
65
%
36
%
32
%
34
7
4%
6
8%
6
5%
9
1%
9
4%
Me
ad
ow
s S
ch
ool
58
4
3%
29%
6
4%
5
8
53
%
43
%
41
%
61
6
1%
4
6%
5
3%
7
4%
8
0%
Éco
le N
ew
Era
Sch
ool (E
NG
) 4
3
19%
1
2%
23
%
43
1
6%
1
6%
3
3%
4
3
40
%
40
%
35
%
35
%
51
%
Éco
le N
ew
Era
Sch
ool (F
R)
26
5
8%
58%
6
2%
2
6
54
%
31
%
50
%
25
4
4%
5
2%
3
6%
2
8%
8
0%
Éco
le O
'Ke
lly S
cho
ol
23
5
2%
26%
8
3%
2
3
39
%
35
%
44
%
23
4
8%
1
7%
0
%
39
%
48
%
Riv
erh
eig
hts
Sch
oo
l 4
1
51%
3
9%
56
%
41
2
2%
2
9%
4
6%
4
3
19
%
21
%
35
%
30
%
56
%
Riv
erv
iew
Sch
oo
l 2
3
61%
5
2%
65
%
23
3
9%
2
6%
6
1%
2
2
36
%
36
%
27
%
32
%
55
%
Sp
rin
g V
alle
y C
olo
ny S
ch
ool
2
2
2
St.
Au
gustin
e S
ch
ool
25
7
6%
68%
7
6%
2
5
56
%
56
%
60
%
25
9
2%
8
0%
7
2%
8
8%
8
8%
Va
lleyvie
w C
en
ten
nia
l S
ch
oo
l 2
5
48%
5
2%
52
%
25
4
0%
2
8%
6
0%
2
8
75
%
64
%
43
%
14
%
57
%
Wave
rly P
ark
Sch
oo
l 4
9
41%
4
3%
67
%
49
3
1%
3
7%
5
3%
4
6
72
%
83
%
72
%
65
%
91
%
Gra
de
5 R
ead
ing,
Wri
tin
g, a
nd
Nu
me
racy
: % M
eeti
ng
or
Exce
edin
g b
y Sc
ho
ol*
*Per
cen
tage
s in
th
is t
able
sh
ou
ld b
e re
ad a
s th
e p
erce
nta
ge o
f st
ud
ents
mee
tin
g ex
pe
ctati
on
s in
eac
h c
om
pet
ency
. In
cas
es
wh
ere
a p
erfo
rman
ce le
vel o
f ‘E
xcee
din
g’ is
po
ssi-
ble
, th
e p
erce
nta
ges
in t
his
tab
le r
efer
to
th
e co
mb
inati
on
of
stu
den
ts w
ho
are
me
etin
g O
R e
xce
edin
g ex
pe
ctati
on
s. P
erce
nta
ge
s in
red
are
low
er t
han
th
e D
ivis
ion
al %
fo
r th
at
com
pet
ency
.

Bra
nd
on
Sch
oo
l Div
isio
n
20
12
-13
Stu
den
t A
chie
vem
ent
Sum
mar
y R
epo
rt
Pag
e 4
9
Res
earc
h a
nd
Eva
luati
on
Ser
vice
s
Per
cen
tage
s in
th
is t
able
sh
ou
ld b
e re
ad a
s th
e p
erce
nta
ge o
f st
ud
ents
mee
tin
g ex
pec
tati
on
s in
eac
h c
om
pet
ency
. In
cas
es
wh
ere
a p
erfo
rman
ce le
vel o
f ‘E
xcee
din
g’ is
po
ssi-
ble
, th
e p
erce
nta
ges
in t
his
tab
le r
efer
to
th
e co
mb
inati
on
of
stu
den
ts w
ho
are
me
etin
g O
R e
xce
edin
g ex
pe
ctati
on
s. P
erce
nta
ge
s in
red
are
low
er t
han
th
e D
ivis
ion
al %
fo
r th
at
com
pet
ency
.
R
ead
ing
Wri
tin
g N
um
era
cy
Sch
oo
l n
Flu
en
cy &
Exp
ress
ion
Re
spo
nd
s
Cri
tica
lly
Co
mp
re-
he
nsi
on
n
Ide
as/
Org
aniz
a-
Wo
rd
Ch
oic
e
Co
nve
n-
tio
ns
n
Frac
tio
ns
De
cim
als
Re
pre
-
sen
tin
g P
atter
ns
Me
nta
l
Mat
h
BSD
5
28
5
4%
5
4%
5
8%
5
28
4
6%
3
7%
5
0%
5
39
5
2%
6
8%
6
2%
4
6%
5
1%
Ale
xa
nd
er
Sch
oo
l 7
8
6%
86%
1
00
%
7
71
%
71
%
71
%
5
Be
tty G
ibson
Scho
ol
29
4
5%
41%
3
8%
2
9
41
%
28
%
48
%
30
4
7%
5
7%
4
7%
7
%
23
%
Ea
rl O
xfo
rd S
ch
ool
35
5
4%
71%
8
0%
3
5
71
%
51
%
26
%
37
3
8%
9
5%
8
4%
6
8%
8
7%
Éco
le H
arr
iso
n
32
7
2%
81%
8
8%
3
2
63
%
81
%
69
%
32
8
1%
9
7%
9
4%
9
7%
9
4%
Ge
org
e F
itto
n S
cho
ol
51
2
9%
43%
4
1%
5
1
26
%
14
%
29
%
54
4
4%
6
1%
4
6%
4
8%
2
6%
Gre
en
Acre
s S
ch
ool
15
5
3%
40%
4
7%
1
5
60
%
60
%
47
%
16
5
0%
6
9%
3
1%
0
%
38
%
J.
R. R
eid
Sch
ool
34
4
7%
71%
7
9%
3
4
38
%
35
%
53
%
34
6
5%
6
8%
7
1%
6
8%
5
3%
Kin
g G
eo
rge
Sch
ool
42
5
5%
24%
3
6%
4
2
33
%
33
%
55
%
46
2
8%
3
7%
4
4%
3
5%
5
4%
Kir
kca
ldy H
eig
hts
Scho
ol
32
6
3%
38%
4
1%
3
2
41
%
31
%
53
%
31
4
2%
7
7%
7
1%
5
2%
6
1%
Lin
den
Lan
es S
cho
ol
33
8
8%
88%
9
1%
3
3
76
%
61
%
70
%
33
7
9%
7
3%
8
5%
7
3%
8
5%
Me
ad
ow
s S
ch
ool
37
6
5%
57%
7
0%
3
7
60
%
41
%
43
%
38
6
6%
6
6%
9
7%
2
9%
6
1%
Éco
le N
ew
Era
Sch
ool (E
NG
) 3
9
21%
2
1%
23
%
39
2
3%
8
%
23
%
39
3
6%
7
2%
2
3%
1
0%
0
%
Éco
le N
ew
Era
Sch
ool (F
R)
9
44%
5
6%
33
%
9
11
%
11
%
33
%
9
56
%
10
0%
7
8%
2
2%
4
4%
Éco
le O
'Ke
lly S
cho
ol
18
3
3%
44%
5
0%
1
8
39
%
22
%
39
%
18
1
1%
2
8%
1
1%
0
%
6%
Riv
erh
eig
hts
Sch
oo
l 4
4
46%
4
8%
52
%
44
4
8%
2
7%
6
6%
4
5
73
%
62
%
58
%
31
%
40
%
Sp
rin
g V
alle
y C
olo
ny S
ch
ool
2
2
2
St.
Au
gustin
e S
ch
ool
25
7
6%
60%
4
8%
2
5
32
%
36
%
80
%
25
3
2%
8
8%
6
8%
6
0%
5
6%
Wave
rly P
ark
Sch
oo
l 4
4
71%
7
1%
75
%
44
5
7%
5
5%
6
1%
4
5
62
%
67
%
73
%
73
%
76
%
Gra
de
7 R
ead
ing,
Wri
tin
g, a
nd
Nu
me
racy
: % M
eeti
ng
or
Exce
edin
g b
y Sc
ho
ol*

Bra
nd
on
Sch
oo
l Div
isio
n
20
12
-13
Stu
den
t A
chie
vem
ent
Sum
mar
y R
epo
rt
Pag
e 5
0
Res
earc
h a
nd
Eva
luati
on
Ser
vice
s
In t
his
tab
le, G
rad
e 9
re
sult
s ar
e b
roke
n d
ow
n in
to
res
ult
s fo
r ea
ch ‘s
end
ing
sch
oo
l.’ S
end
ing
sch
oo
l is
defi
ned
as
the
K-8
sch
oo
l th
e st
ud
ent
atten
ded
in t
he
pre
vio
us
year
. Stu
-
den
ts r
epea
tin
g G
rad
e 9
are
th
eref
ore
exc
lud
ed f
rom
th
is t
able
. Per
cen
tage
s in
th
e b
lue
po
rtio
n o
f th
is t
able
sh
ou
ld b
e re
ad a
s th
e p
erce
nta
ge o
f st
ud
ents
me
etin
g (o
r ex
ceed
-
ing)
exp
ecta
tio
ns
in e
ach
co
mp
eten
cy. P
erce
nta
ges
in t
he
ora
nge
po
rtio
n o
f th
is t
able
sh
ou
ld b
e re
ad a
s tr
aditi
on
al p
erce
nta
ge
sco
res.
Per
cen
tage
s in
red
are
low
er t
han
th
e
div
isio
nal
% f
or
that
co
mp
ete
ncy
. In
th
is t
able
, ‘F’
sta
nd
s fo
r “F
icti
on
” w
hile
‘NF’
sta
nd
s fo
r “N
on
-Fic
tio
n.”
Gra
de
9 R
ead
ing,
Wri
tin
g, a
nd
Nu
me
racy
: % M
eeti
ng
or
Exce
edin
g b
y Se
nd
ing
Sch
oo
l

Brandon School Division 2012-13 Student Achievement Summary Report Page 51
Research and Evaluation Services
Grade 9 Formative Assessment Results by Receiving School
Grade 9 Reading Competencies: % Meeting or Exceeding by Receiving School
In all but personal, and critical response, there is a greater percentage of students who are meeting expectations entering Vincent Massey than the other schools. Fewer students entering Neelin are meeting expectations in every reading competency. In com-parison to Divisional results, fewer of last year’s Grade 9 cohort at Crocus Plains were meeting expectations. However, this year, more students entering Crocus Plains are meeting or exceeding expectations in comprehension of fiction, personal and critical response, and n comprehension of non-fiction. It is important to note that Crocus Plains piloted a new, extended and more class-room-based delivery method of the Divisional literacy assessment. At this point it is difficult to say whether Crocus Plains’ current scores are cohort-specific, the result of a positive trend, or whether the different delivery method improved students’ ability to demonstrate their proficiency.

Brandon School Division 2012-13 Student Achievement Summary Report Page 52
Research and Evaluation Services
Grade 9 Writing Competencies: % Meeting or Exceeding by Receiving School
Consistent with last year’s results, there is far less between-school discrepancies with respect to incoming students’ level of writing proficiency. Consistent with last year, students entering Vincent Massey do so with slightly higher rates of writing compe-tency than students entering the other two high schools. Similar to the reading results, this cohort of students entering Crocus Plains has performed slightly better than in previous years.

Brandon School Division 2012-13 Student Achievement Summary Report Page 53
Research and Evaluation Services
Grade 9 Numeracy: Average Percent Scores in Each Competency by Receiving School
Consistent with last year, students entering Crocus Plains have lower scores than the Divisional average in every competency, while student entering Vincent Massey score higher in every competency. While students entering Neelin last year scored above the Divisional average in patterns and relations, this year’s cohort is consistent with the Divisional average in this competency.

Brandon School Division 2012-13 Student Achievement Summary Report Page 54
Research and Evaluation Services
Grade 12 Provincial Standards Tests
-15
-10
-5
0
5
10
15
2002-03 2003-04 2004-05 2005-06 2006-07 2007-08 2008-09 2009-10 2010-11 2011-12 2012-13*
BSD Percent Point Differential from Manitoba Mean: ELA & Math Tests
Language Arts Pre-Calculus Math Applied Math Consumer Math
Grade 12 Provincial (Manitoba) Standards Tests completed in the Brandon School Division have been monitored closely and ana-
lyzed since the 2002-03 school year. (The French test has been monitored for the last 3 years; see the next section of this report.)
The tests are administered in January and June of each school year to accommodate the semester schedule and include the Grade
12 Language Arts, Pre-Calculus Mathematics, Applied Mathematics, and Essential Mathematics assessments developed by Mani-
toba Education.
The following results are from the January 2013 assessment. June 2013 assessment results will be available in the fall of 2013. In
the tables and graphs that follow, an asterisk(*) has been used to remind the reader that the results are from the first semester
only. Full reports of all Grade 12 results are available through Research and Evaluation Services.
It is important to note that as of 2012-2013 there has been a change in the Manitoba Mathematics curricula, resulting in changes
to the Grade 12 Mathematics Provincial Standards Tests. While the majority of the outcomes have remained in the same strand
(i.e., pre-calculus versus applied), some outcomes have been switched between the Grade 11 and Grade 12 levels. These changes
will have resulted in some content differences within the tests. The most notable alteration has been in the format of the Essen-
tial Mathematics area, which was previously Consumer Math. Instead of three components of the assessment—a project, portfo-
lio, and written test—the assessment is now composed solely of a written test.
The content of the assessments may be comparable enough that comparisons to previous years’ results are valid at this time.
However, once multi-year results are available on this updated curriculum assessments, it will become preferable to include only
these results in historical trend analyses. For now, a red line appears in the following tables in order to remind the reader of the
change in assessments.

Brandon School Division 2012-13 Student Achievement Summary Report Page 55
Research and Evaluation Services
Grade 12 English Language Arts Provincial Standards Test
Year BSD CP Neelin VM
2002-2003 -2.2 -6.5 0.4 2.7
2003-2004 -0.6 -3.2 4.1 1.7
2004-2005 1.4 0.5 2.9 1.8
2005-2006 2.3 -0.3 5.9 3.9
2006-2007 -0.6 -3.6 3.6 0
2007-2008 -0.5 -3.2 5.1 0.4
2008-2009 1.2 -2.4 7.7 1.5
2009-2010 1.6 -1.5 5.6 2.7
2010-2011 3.7 1.5 5.2 6.3
2011-2012 2.9 0.4 13.1 0.6
2012-13* 4.8 0.2 10.2 5.2
Mean 1.3 -1.6 5.8 2.4
Summary of Grade 12 ELA Results
Vincent Massey and Neelin high schools have demonstrated strong Language Arts scores consistently . The Language Arts scores
from Crocus Plains Regional Secondary School have been improving consistently over the last six years, and have leveled off
somewhat in the first semester of this year.

Brandon School Division 2012-13 Student Achievement Summary Report Page 56
Research and Evaluation Services
-15
-10
-5
0
5
10
15
2002-2003 2003-2004 2004-2005 2005-2006 2006-20072007-20082008-20092009-20102010-20112011-2012 2012-13*
ELA: Crocus Plains % Difference from Manitoba Mean
BSD CP
-15
-10
-5
0
5
10
15
2002-2003 2003-2004 2004-2005 2005-2006 2006-2007 2007-2008 2008-2009 2009-2010 2010-2011 2011-2012 2012-13*
ELA: Neelin % Difference from Manitoba Mean
BSD Neelin
-15
-10
-5
0
5
10
15
2002-2003 2003-2004 2004-2005 2005-2006 2006-2007 2007-2008 2008-2009 2009-2010 2010-2011 2011-2012 2012-13*
ELA: Vincent Massey % Difference from Manitoba Mean
BSD VM

Brandon School Division 2012-13 Student Achievement Summary Report Page 57
Research and Evaluation Services
Grade 12 Pre-Calculus Provincial Standards Test
Year BSD CP Neelin VM
2002-2003 2.3 -3.5 10 5.6
2003-2004 5.3 1.3 10.9 9.5
2004-2005 3.3 -3.8 5.8 8.2
2005-2006 0.2 -5.4 -14.2 6.3
2006-2007 -4.6 -11.8 -22.9 8.8
2007-2008 3 -1.1 -6.7 9.1
2008-2009 3.5 1.3 -10 9
2009-2010 1 -0.1 -30.4 8.9
2010-2011 3.3 -2.4 -2.3 9.9
2011-2012 2.4 -4.8 -0.7 8.1
2012-13* -7.8 -5.7 -11.5
Mean 1.1 -3.3 -6.5 8.3

Brandon School Division 2012-13 Student Achievement Summary Report Page 58
Research and Evaluation Services
-35
-30
-25
-20
-15
-10
-5
0
5
10
15
2002-2003 2003-2004 2004-2005 2005-2006 2006-2007 2007-2008 2008-2009 2009-2010 2010-2011 2011-2012 2012-13*
Pre-Calculus: Crocus Plains % Difference from Manitoba Mean
BSD CP
-35
-30
-25
-20
-15
-10
-5
0
5
10
15
2002-20032003-20042004-20052005-20062006-20072007-2008 2008-2009 2009-20102010-20112011-2012 2012-13*
Pre-Calculus: Neelin % Difference from Manitoba Mean
BSD Neelin
Summary of Grade 12 Pre-Calculus Results
Vincent Massey has demonstrated a consistent trend of strong Pre-Calculus scores throughout the ten-year period, with score above the provincial mean score in every year since 2002-03. Neelin has shown some marked improvement in its scores over the last two years. Crocus Plains has shown similar improvement over the 2007-2008 to 2009-2010 period, with a slight decrease over the last two years.

Brandon School Division 2012-13 Student Achievement Summary Report Page 59
Research and Evaluation Services
Grade 12 Applied Mathematics Provincial Standards Test
-15
-10
-5
0
5
10
15
2002-2003 2003-2004 2004-2005 2005-2006 2006-2007 2007-2008 2008-2009 2009-2010 2010-2011 2011-2012 2012-13*
Applied Math: Crocus Plains % Difference from Manitoba Mean
BSD CP
Year BSD CP Neelin VM
2002-2003 4.9 2.7 8.5 6.7
2003-2004 6.2 3.2 4.6 8.6
2004-2005 5.2 2.6 -3.6 11.1
2005-2006 3 -2.5 5.7 6.8
2006-2007 5.2 6.5 5.1 7
2007-2008 0.3 0.6 -4.7 1.1
2008-2009 0.3 0.2 5.9 -2.4
2009-2010 5 1.5 5.1 9.9
2010-2011 3.5 -0.1 3.9 7.9
2011-2012 -1.5 -3.1 -6.2 5.4
2012-13* 4.3 4.3
Mean 3.3 1.4 2.4 6.2
Summary of Grade 12 Applied Mathematics Results
With the exception of 2011-12, the three high schools have shown strong Applied Mathematics results compared to the Manito-
ba average. Only Crocus Plains had students taking the Applied Mathematics assessment in the fall semester. These results show
an improvement over all previous years’ results.

Brandon School Division 2012-13 Student Achievement Summary Report Page 60
Research and Evaluation Services
Grade 12 Essential Mathematics** Provincial Standards Test **Previously Consumer Mathematics.
Year BSD CP Neelin VM
2002-2003 2.3 2.8 4.6 -2
2003-2004 2.8 5 -4.4
2004-2005 3.7 4.5 1
2005-2006 -1.5 -0.9 -7
2006-2007 -2.9 -0.4 -0.7 -8
2007-2008 -0.5 0.4 -3.9 0.3
2008-2009 -0.3 1.7 -5.6 -1.7
2009-2010 1.2 -1.6 3 3.8
2010-2011 -4.6 -1.9 -3.8 -9.3
2011-2012 -5.1 -6.5 -2.1
2012-13* 1.9 -0.6 6.2
Mean -0.3 0.2 -1.9 -1.5

Brandon School Division 2012-13 Student Achievement Summary Report Page 61
Research and Evaluation Services
-15
-10
-5
0
5
10
15
2002-2003 2003-2004 2004-2005 2005-2006 2006-2007 2007-2008 2008-2009 2009-2010 2010-2011 2011-2012 2012-13*
Essential Math: Crocus Plains % Difference from Manitoba Mean
BSD CP
-15
-10
-5
0
5
10
15
2002-2003 2003-2004 2004-2005 2005-2006 2006-2007 2007-2008 2008-2009 2009-2010 2010-2011 2011-2012 2012-13*
Essential Math: Vincent Massey % Difference from Manitoba Mean
BSD VM

Brandon School Division 2012-13 Student Achievement Summary Report Page 62
Research and Evaluation Services
Grade 12 Français Langue Seconde Provincial Standards Test
Summary of Grade 12 Français Langue Seconde Results
BSD results are very similar to the Provincial average on the Français langue seconde Provincial standards test.
In BSD, as in the Province as a whole, average scores on the Grade 12 French assessment tend to be higher than average scores
on all other Grade 12 standards tests.
-15%
-10%
-5%
0%
5%
10%
15%
2010-11 2011-12 2012-13
Français: BSD % from the Manitoba Mean
Year BSD
2010-2011 2.6
2011-2012 -0.8
2012-2013 -1.0
Mean 1.5
The Grade 12 Français test results have been tracked for three years. The results
shown here are noted as BSD results, however in the case of the French test, only
students from École Secondaire Neelin High School take this test.

Brandon School Division 2012-13 Student Achievement Summary Report Page 63
Research and Evaluation Services
SPECIFIC LEARNER GROUP
ACHIEVEMENT
Section C:

Brandon School Division 2012-13 Student Achievement Summary Report Page 64
Research and Evaluation Services
*Difference in statistically significant at the .05 level. **Difference is statistically significant at the .01 level.
***Difference is statistically significant at the .001 level.
Specific Learner Group Achievement:
Comparison of Male and Female Learners
84% 82% 81%77%
71%
93% 91%88%
92% 93%
0%
10%
20%
30%
40%
50%
60%
70%
80%
90%
100%
Pencil Grip** Scissors** Prints Name* Colouring*** Accurate Drawing***
Percent Meeting/Exceeding Kindergarten Fine Motor Expectations: Comparison of Male and Female Students
Boys Girls
69%
48%
82%78%
71%
59%
67% 67% 66%
73%
57%
88%84%
77%
56%
76%
85% 85%
0%
10%
20%
30%
40%
50%
60%
70%
80%
90%
100%
Sense ofRhyme
Story Retell* Upper Case Lower Case LetterSounds*
WordRecognition
BeginningSounds***
Listens toStories***
Listens toOthers***
Reading Writing Listening
Percent Meeting/Exceeding Kindergarten Literacy Expectations: Comparison of Male and Female Students
Boys Girls

Bra
nd
on
Sch
oo
l Div
isio
n
20
12
-13
Stu
den
t A
chie
vem
ent
Sum
mar
y R
epo
rt
Pag
e 6
5
Res
earc
h a
nd
Eva
luati
on
Ser
vice
s
*Diff
eren
ce in
sta
tisti
cally
sig
nifi
can
t at
th
e .0
5 le
vel.
**D
iffer
ence
is s
tati
stica
lly s
ign
ifica
nt
at t
he
.01
leve
l. **
*Diff
ere
nce
is s
tati
stica
lly s
ign
ifica
nt
at t
he
.00
1 le
vel.
88
%8
9%
90
%
74
%7
9%
90
%8
7%
81
%
74
%
80
%8
0%
76
%
94
%9
0%
89
%
74
%
80
%
92
%
82
%8
1%
80
%7
9%
84
%
72
%
0%
10
%
20
%
30
%
40
%
50
%
60
%
70
%
80
%
90
%
10
0%
Colours*
Patterns
Number Recognition
Forward Counting
Backward Counting
Match Sets/ Numerals
Subitize
Representing Number
Sorts
Compares 2 Objects
Shapes
3-D Objects
Pat
tern
s &
Re
lati
on
sN
um
be
r C
on
cep
tsSh
ap
e &
Sp
ace
Per
cen
t Mee
tin
g/Ex
ceed
ing
Kin
der
gart
en N
um
erac
y Ex
pec
tati
on
s:
Co
mp
aris
on
of
Mal
e an
d F
emal
e St
ud
ents
Bo
ysG
irls

Bra
nd
on
Sch
oo
l Div
isio
n
20
12
-13
Stu
den
t A
chie
vem
ent
Sum
mar
y R
epo
rt
Pag
e 6
6
Res
earc
h a
nd
Eva
luati
on
Ser
vice
s
*Diff
eren
ce in
sta
tisti
cally
sig
nifi
can
t at
th
e .0
5 le
vel.
**D
iffer
ence
is s
tati
stica
lly s
ign
ifica
nt
at t
he
.01
leve
l. **
*Diff
ere
nce
is s
tati
stica
lly s
ign
ifica
nt
at t
he
.00
1 le
vel.
52
%
59
%5
5%
45
%
37
%
59
%
51
%5
2%
56
%
33
%
26
%
49
%
37
%
68
%
60
%
67
%6
4%
55
%5
2%
65
%
58
%5
6%
60
%
40
%3
8%
58
%
44
%
78
%
0%
10
%
20
%
30
%
40
%
50
%
60
%
70
%
80
%
90
%
10
0%
Sets Reading Goals
Strategies
Comprehension*
Fluency and Expression
Responds Critically***
Comprehension
Fluency and Expression
Responds Critically
Comprehension
Techniques & Elements (NF)
Personal & Critical Response*
Comprehension - Main Idea (NF)
Comprehension - Inference (F)
Comprehension (F)**
Gra
de
3G
rad
e 5
Gra
de
7G
rad
e 9
Pe
rcen
t M
eet
ing
Exp
ect
atio
ns
in G
rad
e 3
, 5
, 7
& 9
Re
adin
g C
om
pe
ten
cie
s:
Co
mp
aris
on
of
Bo
ys a
nd
Gir
ls
Bo
ysG
irls

Bra
nd
on
Sch
oo
l Div
isio
n
20
12
-13
Stu
den
t A
chie
vem
ent
Sum
mar
y R
epo
rt
Pag
e 6
7
Res
earc
h a
nd
Eva
luati
on
Ser
vice
s
*Diff
eren
ce in
sta
tisti
cally
sig
nifi
can
t at
th
e .0
5 le
vel.
**D
iffer
ence
is s
tati
stica
lly s
ign
ifica
nt
at t
he
.01
leve
l. **
*Diff
ere
nce
is s
tati
stica
lly s
ign
ifica
nt
at t
he
.00
1 le
vel.
45
%
39
%
32
%
39
%4
1%
30
%
22
%
35
%4
0%
28
%
45
%
80
%
68
%
82
%
77
%
60
%
53
%
41
%
52
%
47
%5
1%
42
%
56
%5
3%
47
%
56
%
90
%
81
%
93
%
85
%
0%
10
%
20
%
30
%
40
%
50
%
60
%
70
%
80
%
90
%
10
0%
Ideas***
Organization***
Word Choice**
Sentence Fluency**
Conventions*
Ideas/Organization***
Word Choice***
Conventions***
Ideas/ Organization**
Word Choice***
Conventions*
Ideas**
Organization**
Voice***
Grammar & Mechanics*
Gra
de
3G
rad
e 5
Gra
de
7G
rad
e 9
Per
cen
t Mee
tin
g Ex
pe
ctat
ion
s in
Gra
de
3, 5
, 7 &
9 W
riti
ng
Co
mp
eten
cie
s:
Co
mp
aris
on
of
Bo
ys a
nd
Gir
ls
Bo
ysG
irls

Bra
nd
on
Sch
oo
l Div
isio
n
20
12
-13
Stu
den
t A
chie
vem
ent
Sum
mar
y R
epo
rt
Pag
e 6
8
Res
earc
h a
nd
Eva
luati
on
Ser
vice
s
*Diff
eren
ce in
sta
tisti
cally
sig
nifi
can
t at
th
e .0
5 le
vel.
**D
iffer
ence
is s
tati
stica
lly s
ign
ifica
nt
at t
he
.01
leve
l. **
*Diff
ere
nce
is s
tati
stica
lly s
ign
ifica
nt
at t
he
.00
1 le
vel.
61
%5
7%
71
%
54
%5
5%
47
%4
8%
51
%
74
%
52
%
71
%
63
%
47
%
53
%
58
%
50
%
64
%
47
%
57
%
53
%5
4%
51
%
74
%
52
%
65
%6
2%
44
%
50
%
0%
10
%
20
%
30
%
40
%
50
%
60
%
70
%
80
%
90
%
10
0%
Patterns
Equality
Representing Numbers
Mental Math
Decimals
Fractions
Patterns
Mental Math
Place Value
Fractions
Decimals
Representing Number
Patterns
Mental Math
Gra
de
3G
rad
e 5
Gra
de
7
Per
cen
t Mee
tin
g Ex
pe
ctat
ion
s in
Gra
de
3, 5
, & 7
Nu
mer
acy
Co
mp
eten
cie
s:
Co
mp
aris
on
of
Bo
ys a
nd
Gir
ls
Bo
ysG
irls

Brandon School Division 2012-13 Student Achievement Summary Report Page 69
Research and Evaluation Services
*Difference in statistically significant at the .05 level. **Difference is statistically significant at the .01 level. ***Difference is statistically significant at the .001 level.
Summary of the Comparison of Male and Female Learners
There is a trend towards a greater percentage of girls meeting expectations in every reading competency. However, some of
these differences are relatively small and could be occurring by chance (i.e., are not statistically significant). Statistically signifi-
cant gender differences in reading are evident in Story Retell and Letter Sound Identification at Kindergarten, in Comprehen-
sion at Grade 3, in Critical Response at Grade 5, and in both Comprehension of Fiction and in Critical Response at Grade 9.
In contrast to reading, there are significant gender differences in every writing competency, with a greater percentage of girls
meeting grade level writing expectations.
With the exception of colour identification in Kindergarten, there are no significant gender differences in numeracy.
Although fine motor skills are not formally reported beyond the Kindergarten level, a significantly greater percentage of girls
finish Kindergarten meeting each of the fine motor competencies assessed.
67%
50%
42%48%
53%
64%
50%
41%47%
52%
0%
10%
20%
30%
40%
50%
60%
70%
80%
90%
100%
Number Concepts Patterns & Relations Shape & Space Statistics & Probability Total
Grade 9
Average Percent Score in Grade 9 Numeracy Strands: Comparison of Boys and Girls
Boys Girls

Brandon School Division 2012-13 Student Achievement Summary Report Page 70
Research and Evaluation Services
*Difference in statistically significant at the .05 level. **Difference is statistically significant at the .01 level.
Specific Learner Group Achievement:
Comparison of Aboriginal and Non-Aboriginal Learners
58%
37%
71%
65%60%
42%
62%
74%71%
81%
60%
89%86%
80%
66%
76% 76% 76%
0%
10%
20%
30%
40%
50%
60%
70%
80%
90%
100%
Sense ofRhyme***
Story Retell*** Upper Case*** Lower Case*** LetterSounds***
WordRecognition***
BeginningSounds**
Listens toStories
Listens toOthers
Reading Writing Listening
Percent M/E Kindergarten Literacy Expectations: Comparison of Aboriginal and Non-Aboriginal Students
Aboriginal Non-Aboriginal
87% 87% 86%
79%75%
88% 87%82% 84% 82%
0%
10%
20%
30%
40%
50%
60%
70%
80%
90%
100%
Pencil Grip Scissors Prints Name Colouring Accurate Drawing
Percent M/E Kindergarten Fine Motor Expectations: Comparison of Aboriginal and Non-Aboriginal Students
Aboriginal Non-Aboriginal

Bra
nd
on
Sch
oo
l Div
isio
n
20
12
-13
Stu
den
t A
chie
vem
ent
Sum
mar
y R
epo
rt
Pag
e 7
1
Res
earc
h a
nd
Eva
luati
on
Ser
vice
s
*Diff
eren
ce in
sta
tisti
cally
sig
nifi
can
t at
th
e .0
5 le
vel.
**D
iffer
ence
is s
tati
stica
lly s
ign
ifica
nt
at t
he
.01
leve
l. **
*Diff
ere
nce
is s
tati
stica
lly s
ign
ifica
nt
at t
he
.00
1 le
vel.
88
%
83
%8
1%
61
%
70
%
85
%
75
%
71
%
64
%
73
%
78
%
58
%
95
%
91
%9
2%
82
%
87
%
93
%9
0%
84
%8
4%
86
%9
0%
81
%
0%
10
%
20
%
30
%
40
%
50
%
60
%
70
%
80
%
90
%
10
0%
Co
lou
rs*
**P
atte
rns*
Nu
mb
er
Re
cogn
itio
n*
Forw
ard
Co
un
tin
g***
Ba
ckw
ard
Co
un
tin
g***
Ma
tch
Se
ts/
Nu
me
rals
*Su
bit
ize
**R
ep
rese
nti
ng
Nu
mb
er*
Sort
s**
*C
om
par
es 2
Ob
ject
s**
Sha
pes
**
3-D
Ob
ject
s***
Pat
tern
s &
Re
lati
on
sN
um
be
r C
on
cep
tsSh
ap
e &
Sp
ace
Per
cen
t Mee
tin
g/Ex
ceed
ing
Kin
der
gart
en N
um
erac
y Ex
pe
ctat
ion
s: C
om
par
ison
o
f A
bo
rigi
nal
an
d N
on
-Ab
ori
gin
al S
tud
ents
Ab
ori
gin
alN
on
-Ab
ori
gin
al

Bra
nd
on
Sch
oo
l Div
isio
n
20
12
-13
Stu
den
t A
chie
vem
ent
Sum
mar
y R
epo
rt
Pag
e 7
2
Res
earc
h a
nd
Eva
luati
on
Ser
vice
s
*Diff
eren
ce in
sta
tisti
cally
sig
nifi
can
t at
th
e .0
5 le
vel.
**D
iffer
ence
is s
tati
stica
lly s
ign
ifica
nt
at t
he
.01
leve
l. **
*Diff
ere
nce
is s
tati
stica
lly s
ign
ifica
nt
at t
he
.00
1 le
vel.
33
%
48
%4
6%
33
%2
9%
51
%
45
%4
4%
46
%
20
%2
0%
48
%
22
%
63
%
70
%7
6%
72
%
61
%5
5%
71
%
65
%6
3%
69
%
40
%
33
%
55
%
45
%
76
%
0%
10
%
20
%
30
%
40
%
50
%
60
%
70
%
80
%
90
%
10
0%
Sets Reading Goals***
Strategies***
Comprehension***
Fluency and Expression***
Responds Critically***
Comprehension***
Fluency and Expression***
Responds Critically**
Comprehension***
Techniques & Elements (NF)***
Personal & Critical Response*
Comprehension - Main Idea (NF)
Comprehension - Inference (F)***
Comprehension (F)*
Gra
de
3G
rad
e 5
Gra
de
7G
rad
e 9
Per
cen
t Mee
tin
g Ex
pec
tati
on
s in
Gra
de
3, 5
, 7, &
9 R
ead
ing
Co
mp
eten
cies
: C
om
par
iso
n o
f A
bo
rigi
nal
an
d N
on
-Ab
ori
gin
al S
tud
ents
Ab
ori
gin
alN
on
-Ab
ori
gin
al

Bra
nd
on
Sch
oo
l Div
isio
n
20
12
-13
Stu
den
t A
chie
vem
ent
Sum
mar
y R
epo
rt
Pag
e 7
3
Res
earc
h a
nd
Eva
luati
on
Ser
vice
s
*Diff
eren
ce in
sta
tisti
cally
sig
nifi
can
t at
th
e .0
5 le
vel.
**D
iffer
ence
is s
tati
stica
lly s
ign
ifica
nt
at t
he
.01
leve
l. **
*Diff
ere
nce
is s
tati
stica
lly s
ign
ifica
nt
at t
he
.00
1 le
vel.
37
%
26
%
17
%2
0%
28
%2
4%
11
%
26
%
35
%
28
%
40
%
74
%
61
%
79
%
73
%
62
%
56
%
47
%
56
%5
2%
49
%
40
%
55
%5
4%
46
%
59
%
87
%
77
%
90
%8
6%
0%
10
%
20
%
30
%
40
%
50
%
60
%
70
%
80
%
90
%
10
0%
Ideas***
Organization***
Word Choice***
Sentence Fluency***
Conventions***
Ideas/Organization***
Word Choice***
Conventions***
Ideas/ Organization***
Word Choice***
Conventions***
Ideas***
Organization***
Voice***
Grammar & Mechanics**
Gra
de
3G
rad
e 5
Gra
de
7G
rad
e 9
Per
cen
t Mee
tin
g Ex
pe
ctat
ion
s in
Gra
de
3, 5
, 7, &
9 W
riti
ng
Co
mp
eten
cie
s:
Co
mp
aris
on
of
Ab
ori
gin
al a
nd
No
n-A
bo
rigi
nal
Stu
de
nts
Ab
ori
gin
alN
on
-Ab
ori
gin
al

Bra
nd
on
Sch
oo
l Div
isio
n
20
12
-13
Stu
den
t A
chie
vem
ent
Sum
mar
y R
epo
rt
Pag
e 7
4
Res
earc
h a
nd
Eva
luati
on
Ser
vice
s
*Diff
eren
ce in
sta
tisti
cally
sig
nifi
can
t at
th
e .0
5 le
vel.
**D
iffer
ence
is s
tati
stica
lly s
ign
ifica
nt
at t
he
.01
leve
l. **
*Diff
ere
nce
is s
tati
stica
lly s
ign
ifica
nt
at t
he
.00
1 le
vel.
38
%3
6%
51
%
25
%
38
%
24
%2
6%
30
%
52
%
29
%
51
%
39
%
31
%3
0%
68
%
63
%
77
%
63
%6
3%
57
%5
6%
56
%
81
%
58
%
74
%7
3%
53
%
62
%
0%
10
%
20
%
30
%
40
%
50
%
60
%
70
%
80
%
90
%
10
0%
Patterns***
Equality***
Representing Numbers***
Mental Math***
Decimals***
Fractions***
Patterns***
Mental Math***
Place Value***
Fractions***
Decimals***
Representing Number***
Patterns***
Mental Math***
Gra
de
3G
rad
e 5
Gra
de
7
Per
cen
t M
eeti
ng
Exp
ecta
tio
ns
in G
rad
e 3
, 5, &
7 N
um
erac
y C
om
pe
ten
cie
s:
Co
mp
aris
on
of
Ab
ori
gin
al a
nd
No
n-A
bo
rigi
nal
Stu
de
nts
Ab
ori
gin
alN
on
-Ab
ori
gin
al

Brandon School Division 2012-13 Student Achievement Summary Report Page 75
Research and Evaluation Services
*Difference in statistically significant at the .05 level. **Difference is statistically significant at the .01 level. ***Difference is statistically significant at the .001 level.
Summary of the Comparison of Students with and without Aboriginal Heritage
With the exception of listening skills in Kindergarten, in all reading, writing, and numeracy competencies, there is a greater per-
centage of non-Aboriginal students meeting grade-level expectations, and all but one of these differences are statistically signifi-
cant. Thus, a smaller percentage of Aboriginal students are meeting expectations at each of the grade levels assessed, and this
difference is seen from Kindergarten onward. These differences are especially prominent in writing and in numeracy. Further-
more, this ubiquitous trend replicates what has been seen in previous years.
55%
36%31%
35%42%
68%
54%
45%
53%57%
0%
10%
20%
30%
40%
50%
60%
70%
80%
90%
100%
Number Concepts*** Patterns &Relations***
Shape & Space*** Statistics &Probability***
Total***
Grade 9
Average Percent Score in Grade 9 Numeracy Strands: Comparison of Aboriginal and Non-Aboriginal Students
Aboriginal Non-Aboriginal

Brandon School Division 2012-13 Student Achievement Summary Report Page 76
Research and Evaluation Services
*Difference in statistically significant at the .05 level. **Difference is statistically significant at the .01 level.
***Difference is statistically significant at the .001 level.
Specific Learner Group Achievement:
Comparison of EAL and Non-EAL Learners
92%
81%
92% 91%86%88% 87%
82% 84% 82%
0%
10%
20%
30%
40%
50%
60%
70%
80%
90%
100%
Pencil Grip Scissors Prints Name Colouring Accurate Drawing
Percent Meeting/Exceeding Kindergarten Fine Motor Expectations: Comparison of EAL and Non-EAL Students
EAL Non-EAL
39% 37%
78%73%
61%
38%
59%
73% 71%
81%
60%
89% 86%80%
66%
76% 76% 76%
0%
10%
20%
30%
40%
50%
60%
70%
80%
90%
100%
Sen
se o
f R
hym
e**
*
Sto
ry R
etel
l**
*
Up
per
Cas
e**
Low
er
Cas
e**
*
Lett
er
So
un
ds*
**
Wo
rd R
eco
gnit
ion
***
Be
gin
nin
g S
ou
nd
s**
List
en
s to
Sto
rie
s
List
en
s to
Oth
ers
Reading Writing Listening
Percent Meeting/Exceeding Kindergarten Literacy Expectations: Comparison of EAL and Non-EAL Students
EAL Non-EAL

Bra
nd
on
Sch
oo
l Div
isio
n
20
12
-13
Stu
den
t A
chie
vem
ent
Sum
mar
y R
epo
rt
Pag
e 7
7
Res
earc
h a
nd
Eva
luati
on
Ser
vice
s
*Diff
eren
ce in
sta
tisti
cally
sig
nifi
can
t at
th
e .0
5 le
vel.
**D
iffer
ence
is s
tati
stica
lly s
ign
ifica
nt
at t
he
.01
leve
l. **
*Diff
ere
nce
is s
tati
stica
lly s
ign
ifica
nt
at t
he
.00
1 le
vel.
76
%
87
%8
4%
55
%5
5%
89
%
72
%7
4%
60
%5
8%
56
%
61
%
95
%9
1%
92
%
82
%
87
%
93
%9
0%
84
%8
4%
86
%9
0%
81
%
0%
10
%
20
%
30
%
40
%
50
%
60
%
70
%
80
%
90
%
10
0%
Colours***
Patterns
Number Recognition***
Forward Counting***
Backward Counting***
Match Sets/ Numerals
Subitize***
Representing Number*
Sorts***
Compares 2 Objects***
Shapes***
3-D Objects***
Pat
tern
s &
Re
lati
on
sN
um
be
r C
on
cep
tsSh
ap
e &
Sp
ace
Per
cen
t Mee
tin
g/Ex
ceed
ing
Kin
der
gart
en N
um
erac
y Ex
pe
ctat
ion
s:
Co
mp
aris
on
of
EAL
and
No
n-E
AL
Stu
den
ts
EA
LN
on
-EA
L

Bra
nd
on
Sch
oo
l Div
isio
n
20
12
-13
Stu
den
t A
chie
vem
ent
Sum
mar
y R
epo
rt
Pag
e 7
8
Res
earc
h a
nd
Eva
luati
on
Ser
vice
s
*Diff
eren
ce in
sta
tisti
cally
sig
nifi
can
t at
th
e .0
5 le
vel.
**D
iffer
ence
is s
tati
stica
lly s
ign
ifica
nt
at t
he
.01
leve
l. **
*Diff
ere
nce
is s
tati
stica
lly s
ign
ifica
nt
at t
he
.00
1 le
vel.
26
%2
7%
24
%2
6%
20
%
38
%
24
%2
7%
30
%3
5%
43
%4
3%
53
%
71
%7
0%
76
%7
2%
61
%
55
%
71
%
65
%6
3%
69
%
40
%
33
%
45
%
55
%
76
%
0%
10
%
20
%
30
%
40
%
50
%
60
%
70
%
80
%
90
%
10
0%
Sets Reading Goals***
Strategies***
Comprehension***
Fluency and Expression***
Responds Critically***
Comprehension***
Fluency and Expression***
Responds Critically***
Comprehension***
Techniques & Elements (NF)
Personal & Critical Response
Comprehension - Main Idea (NF)
Comprehension - Inference (F)
Comprehension (F)
Gra
de
3G
rad
e 5
Gra
de
7G
rad
e 9
Per
cen
t Mee
tin
g Ex
pe
ctat
ion
s in
Gra
de
3, 5
, 7 &
9 R
ead
ing
Co
mp
eten
cie
s:
Co
mp
aris
on
of
EAL
and
No
n-E
AL
Stu
den
ts
EA
LN
on
-EA
L

Bra
nd
on
Sch
oo
l Div
isio
n
20
12
-13
Stu
den
t A
chie
vem
ent
Sum
mar
y R
epo
rt
Pag
e 7
9
Res
earc
h a
nd
Eva
luati
on
Ser
vice
s
*Diff
eren
ce in
sta
tisti
cally
sig
nifi
can
t at
th
e .0
5 le
vel.
**D
iffer
ence
is s
tati
stica
lly s
ign
ifica
nt
at t
he
.01
leve
l. **
*Diff
ere
nce
is s
tati
stica
lly s
ign
ifica
nt
at t
he
.00
1 le
vel.
30
%
22
%
14
%
27
%2
6%
22
%2
1%
27
%3
0%
16
%
30
%
86
%
78
%
86
%
66
%6
2%
56
%
47
%
56
%5
2%
49
%
40
%
55
%5
4%
46
%
59
%
87
%
77
%
90
%8
6%
0%
10
%
20
%
30
%
40
%
50
%
60
%
70
%
80
%
90
%
10
0%
Ideas***
Organization***
Word Choice***
Sentence Fluency***
Conventions***
Ideas/Organization***
Word Choice***
Conventions***
Ideas/ Organization***
Word Choice***
Conventions***
Ideas
Organization
Voice
Grammar & Mechanics***
Gra
de
3G
rad
e 5
Gra
de
7G
rad
e 9
Per
cen
t M
eeti
ng
Exp
ect
atio
ns
in G
rad
e 3,
5, 7
& 9
Wri
tin
g C
om
pet
enci
es:
C
om
par
iso
n o
f EA
L an
d N
on
-EA
L St
ud
en
ts
EA
LN
on
-EA
L
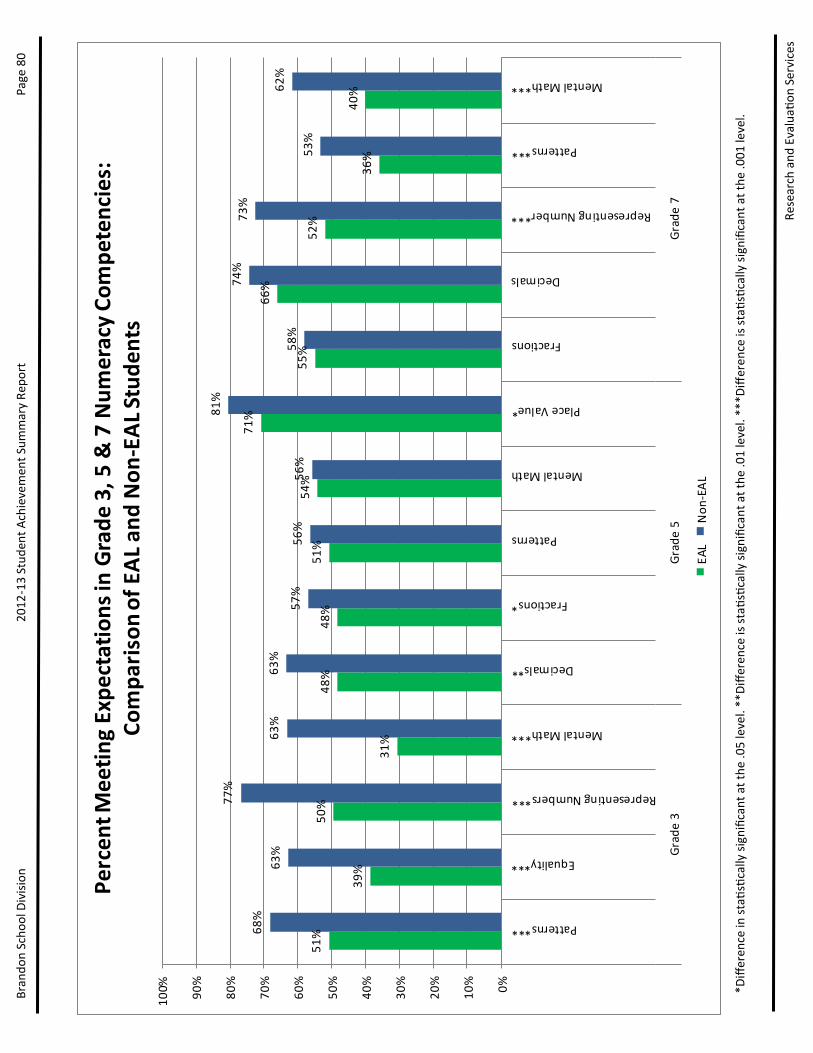
Bra
nd
on
Sch
oo
l Div
isio
n
20
12
-13
Stu
den
t A
chie
vem
ent
Sum
mar
y R
epo
rt
Pag
e 8
0
Res
earc
h a
nd
Eva
luati
on
Ser
vice
s
*Diff
eren
ce in
sta
tisti
cally
sig
nifi
can
t at
th
e .0
5 le
vel.
**D
iffer
ence
is s
tati
stica
lly s
ign
ifica
nt
at t
he
.01
leve
l. **
*Diff
ere
nce
is s
tati
stica
lly s
ign
ifica
nt
at t
he
.00
1 le
vel.
51
%
39
%
50
%
31
%
48
%4
8%
51
%5
4%
71
%
55
%
66
%
52
%
36
%4
0%
68
%
63
%
77
%
63
%6
3%
57
%5
6%
56
%
81
%
58
%
74
%7
3%
53
%
62
%
0%
10
%
20
%
30
%
40
%
50
%
60
%
70
%
80
%
90
%
10
0%
Patterns***
Equality***
Representing Numbers***
Mental Math***
Decimals**
Fractions*
Patterns
Mental Math
Place Value*
Fractions
Decimals
Representing Number***
Patterns***
Mental Math***
Gra
de
3G
rad
e 5
Gra
de
7
Per
cen
t M
eeti
ng
Exp
ect
atio
ns
in G
rad
e 3,
5 &
7 N
um
erac
y C
om
pet
enci
es:
C
om
par
iso
n o
f EA
L an
d N
on
-EA
L St
ud
en
ts
EA
LN
on
-EA
L

Brandon School Division 2012-13 Student Achievement Summary Report Page 81
Research and Evaluation Services
*Difference in statistically significant at the .05 level. **Difference is statistically significant at the .01 level. ***Difference is statistically significant at the .001 level.
Summary of the Comparison of EAL and Non-EAL Students
At the Kindergarten level, there are no significant differences between EAL and non-EAL learners in listening skills or in any fine
motor skill. However, almost all differences between these two groups in Kindergarten literacy and numeracy skills are statisti-
cally significant, with a smaller percentage of EAL students meeting end-of-Kindergarten expectations.
Significantly lower percentages of EAL students are meeting reading expectations in Grades 3, 5, and 7. But in Grade 9, the differ-
ences are negligible; in fact, EAL students outperformed non-EAL students in Personal and Critical Response. A similar trend is
seen in the writing assessments; significantly lower percentages of EAL students are meeting Grade 3, 5, and 7 writing expecta-
tions, but differences at the Grade 9 level are not statistically significant. However, these differential results in Grade 9 versus
those in lower grades should be interpreted with caution at this time. Formative assessment results were submitted for almost
all EAL students at the Grade 3, 5, and 7 levels, while the Grade 9 results are based on only 38% of the Grade 9 EAL population.
Thus, the greater equality in results at the Grade 9 level could be due to an anomaly of data submission.
In numeracy, the gap between EAL and non-EAL students closes more readily than it does in literacy. While there is a significantly
greater percentage of non-EAL students meeting all Grade 3 mathematics expectations, there is no significant difference be-
tween at least some of the Grade 5, 7, and 9 scores. It is noteworthy, however, that despite only 38% of the Grade 9 EAL popula-
tion being represented in these results, EAL students still have significantly lower average scores in 3 of the 4 math strands as-
sessed.
66%
48%
37% 38%
50%
68%
54%
45%53% 57%
0%
10%
20%
30%
40%
50%
60%
70%
80%
90%
100%
Number Concepts Patterns & Relations* Shape & Space* Statistics &Probability***
Total**
Grade 9
Average Percent Score in Grade 9 Numeracy Strands: Comparison of EAL and Non-EAL Students
EAL Non-EAL

Brandon School Division 2012-13 Student Achievement Summary Report Page 82
Research and Evaluation Services
HISTORICAL
DEMOGRAPHICS
Appendix A:

Brandon School Division 2012-13 Student Achievement Summary Report Page 83
Research and Evaluation Services
Appendix A:
Historical Demographics for Formative Assessments
This table includes the number of students who successfully completed all parts of each formative assessment for the last seven
years.