struggling with formal and informal trade barriers · struggling with formal and informal trade...
TRANSCRIPT

2014
Mike Rotich
Challenges Facing the
Long Distance Trucking
Industry in East Africa
Community
8/26/2014
STRUGGLING WITH FORMAL AND INFORMAL
TRADE BARRIERS

1
Executive Summary
Formal and informal trade barriers remain major obstacles to economic growth and social
development in the East African Community (EAC). In the World Economic Freedom Report
2013, EAC countries -- Burundi, Kenya, Rwanda, Tanzania, and Uganda -- ranked in the bottom
60 in the freedom-to-trade index among the 152 countries surveyed.i Although tariffs on major
commodities have declined significantly under the East Africa Common Market Protocol
(EACMP), which aims at the “free movement of people, goods, services and capital”, economic
models consistently show that trade between East African economies falls far short of its
potential.ii That potential is being thwarted by a variety of impediments to free trade among the
region’s economies.
Further trade liberalization in East Africa requires not only reducing duties but also getting
rid of trade barriers of all kinds. Moreover, intraregional trade will not flourish without
eliminating licensing fees, complex custom procedures, and delays at borders, even if these are
not explicitly intended to impede trade. Thus a well-integrated transport infrastructure and
improved logistical performance are critical for the EAC’s further trade integration and
economic development.
We believe that government initiatives, including the EACMP, have not effectively
addressed nontariff barriers that continue to cost millions of dollars in waste to businesses and
consumers every year. In this paper we examine the challenges that trucking businesses, the
most important inland facilitators of trade, face when operating along two major EAC corridors.
Further analysis will address concrete steps to assist the EAC in decreasing transportation
obstacles in order to permit more inland trade.

2
Overview of the Problems
Because of an unpredictable railway system, over 95 percent of the East African Community
(EAC) trade moves by road every year, and more than 70 percent of it traverses two major
corridors:
● Northern Corridor: Mombasa–Malaba–Kampala, which links Kenya, Uganda, and
Rwanda
● Central Corridor: Dar es Salaam–Mutukula-Masaka, which links Tanzania, Uganda,
Rwanda, and Burundi
The Northern Corridor (1,738 km long) begins at the Port of Mombasa, Kenya, and is East
Africa’s principal trading route. It is estimated that the Northern Corridor links 200 million
people and carries 75 percent of the EAC’s inland trade. The route also serves as the bloodline
for Kenya, Uganda, Rwanda, and Burundi, and transports goods to Ethiopia, South Sudan, and
eastern Democratic Republic of the Congo (DRC).
The Central Corridor (3,026 km long) begins at the port of Dar es Salaam, Tanzania, and
connects that country, Zambia, Rwanda, Burundi, and eastern DRC. This corridor carries only 25
percent of the trade in the EAC, however, it is the main trading route for Tanzania, Burundi, and
Rwanda.iii
Source: United State International Trade Commission, 2012
3
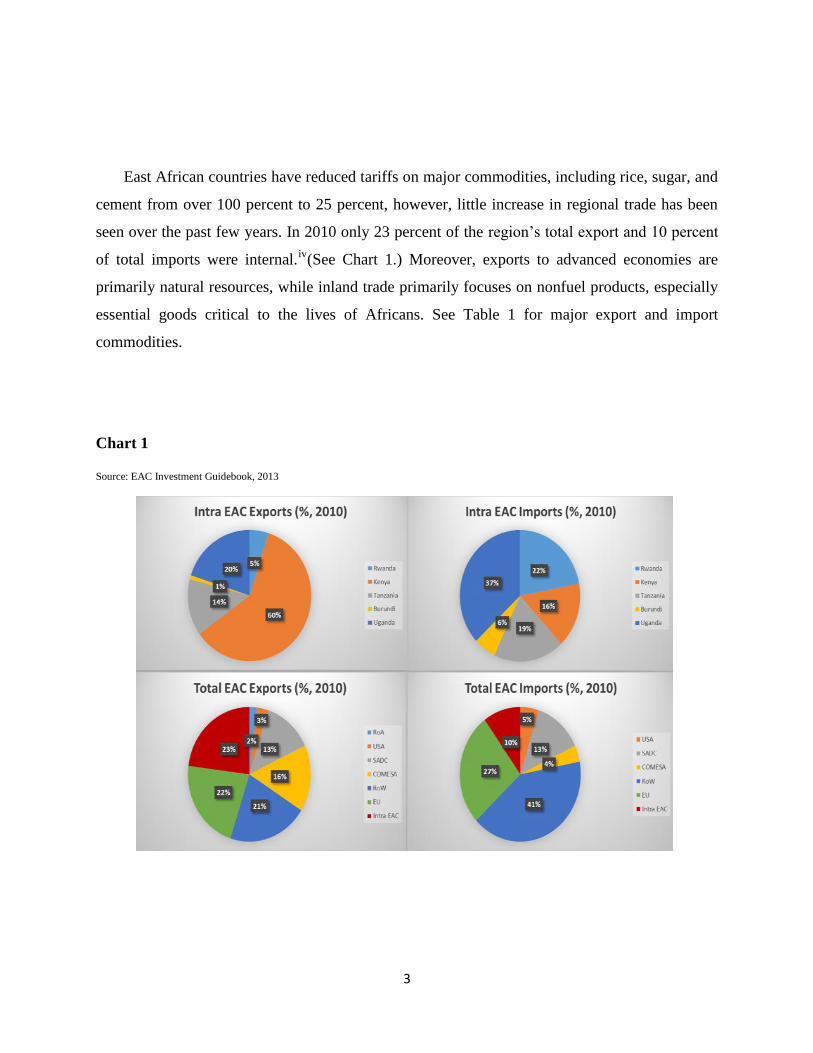
East African countries have reduced tariffs on major commodities, including rice, sugar, and
cement from over 100 percent to 25 percent, however, little increase in regional trade has been
seen over the past few years. In 2010 only 23 percent of the region’s total export and 10 percent
of total imports were internal.iv
(See Chart 1.) Moreover, exports to advanced economies are
primarily natural resources, while inland trade primarily focuses on nonfuel products, especially
essential goods critical to the lives of Africans. See Table 1 for major export and import
commodities.
Chart 1
Source: EAC Investment Guidebook, 2013

4
Table 1: Top commodity exports in Intra-regional trade (by value, 2004-2008 average)
Destination
Origin
Kenya
Tanzania
Uganda
Rwanda
Burundi
Kenya
Soaps/cleansers/
polishes; articles
of apparel, rolled
plated
manufactured
steel
Lime/Cement/
Construction
materials;
Petroleum
products; articles
of apparel; rolled
plated
manufactured
steel
Petroleum
products,
soaps/
cleansers/
polishes
Roll plated
manufactur
ed steel,
petroleum
products
Tanzania
Tea and mate,
cotton, fish,
made-up
textile articles,
maize except
sweet corn
Elements/oxides/
halogen salt,
made-up textile
articles
Elements/
oxides/
halogen
salt, maize
except
sweet corn
Elements/
oxides/
halogen
salt, maize
except
sweet corn
Uganda Tea and mate,
cotton, fish,
made-up
textile articles,
maize except
sweet corn
Electric current;
maize except
sweet corn;
tobacco, rolled
plated
manufactured
steel
Roll plated
manufacture
d steel;
Vegetables
Maize
except
sweet corn,
vegetables,
roll plated
manufactur
ed steel
Rwanda Tea and mate,
hides/skins,
petroleum,
coffee and
substitutes
Coffee and
substitutes; ores
and concentrates
of base metal
Ores and
concentrates of
base metal,
petroleum
products,
hides/skin,
coffee and coffee
substitutes
Petroleum
products
Burundi Gold
nonmonetary;
hides/skin; tea
and mate
Coffee and coffee
substitutes; Tea
and mate
Coffee and
coffee substitute
Sugar/
molasses/
honey
Source: 4th EAC Development Strategy, 2011; Commercial Trade database, 2010

5
One important cause of lower intraregional trade is the extremely poor logistical quality. Among
160 countries observed by the World Bank in 2013, EAC countries ranked in the bottom 60 in
the Logistic Performance Index (LPI).vTheir performances are significantly lower than in
advanced countries for customs processing, infrastructure, border services, and timeliness.vi
Improving logistical performance by 50 percent would increase trade an estimated 15 percent
and GDP 5 percent.vii(See Table 2.)
Much of the cost imposed by low logistical performance is borne by long-distance trucking
businesses and in turn by African consumers through higher prices. Therefore, understanding the
cost structure and barriers to trade remains critical. Removing those barriers would significantly
reduce the cost of inland trade as well as lower the prices of consumer goods critical to Africa’s
social and economic development.
Table 2: Logistic Performance Index &Rankings 2014
overall LPI
score
Customs
Infrastructure
Logistics
quality and
competence
Timeliness
EAC
2.58
(106)
2.40
(105)
2.37
(107)
2.52
(106)
2.95
(104)
Germany
4.12
(1)
4.10
(2)
4.32
(1)
4.12
(3)
4.36
(4)
United
Kingdom
4.02
(4)
3.94
(5)
4.16
(6)
4.03
(5)
4.33
(7)
United States
3.92
(9)
3.73
(16)
4.18
(5)
3.97
(7)
4.14
(14)
Canada
3.86
(12)
3.61
(20)
4.05
(10)
3.94
(10)
4.18
(11)
Hong Kong
SAR, China
3.83
(15)
3.72
(17)
3.97
(14)
3.81
(13)
4.06
(18)
Source: Institute of Trade Development, 2012

6
Challenges Facing Long Distance Trucking Businesses
1. High Variable Cost
Border fees and bribes remain a large part of cost of trade in Africa. The variable/fixed cost
ratio for trucking businesses in the East Africa is around 60/40, compared to the 70/30 ratio in
West and Central Africa. In contrast, in developed systems the ratio is 15/85. A higher
variable/fixed cost ratio is often an indication of higher transportation cost, especially from
informal trade barriers.Fuel and lubricants are the main variable cost, accounting for around 35
percent of the total variable cost.viii
However, we found that other overhead and bribes account
for almost 19 percent of the companies’ total operation cost. Drivers who were interviewed by
the appellantclaimed that many unexpected overcharges and bribes have to be paid at check
points and weighbridges on the borders. (See Table 3.)
Table 3: Variable Cost Structure/Trip/Standard Load
Item
Amount
(USD)
Percentage (2 Decimals)
Fuel 2,275 34.5
Maintenance &Tyres 650 9.9
Depreciation & Insurance 1,040 15.8
Toll road charges 465 7.0
Staff 910 13.8
Other Overheads including
Bribes
1,250 19.0
Total 5,680 100.0 Source: Field Data, Eastern Africa Policy Centre,2014
Small companies with ten to one hundred trucks, which constitute 80 percent of the market,
operate on thin margins and are therefore more vulnerable than larger firms to these charges, as
well as to the needlessly complex customs procedures and bureaucratic hoops that raise the cost
of doing business. (See Table 4.)

7
2. Delays
Delays at borders constitute a major trade barrier in the region. An estimated 40 percent of
the cost of transport along the Northern Corridor consists in fixed port charges and delays at the
Mombasa port due to inadequacies of infrastructure, burdensome documentation rules,
inefficient cargo clearance, and lengthy customs procedures. More than 90 percent of all delays
along the Northern Corridor are estimated to be at ports, most of which are run by two or three
government transportation- and finance-related agencies.
The wait for loaded trucks at Malaba, the main border post between Kenya and Uganda
normally runs one to two days. The average wait at the borders between EAC countries is about
13 hours, about 12 times longer than the wait at most OECD countries.ix
(See Table 5.) It is often
hard to predict the time between the placement of an order with a supplier and the arrival of the
goods. That increases the prices of the goods dramatically.
Table 4: Variable Cost/Mile Breakdown in Percentage ( Big Vs. Small Truck Businesses)
Big Businesses Small Businesses
Fuel 35 36
Maintenance &Tyres 10 12
Depreciation & Insurance 16 10
Toll Road Charges 7 7
Staff Costs 14 9
Other Overheads Including
Bribes
19 26
Total - -
Source: Field Data, Eastern Africa Policy Centre, 2014
Table 5: Average Time Delay at the Borders

8
Highly complex clearance procedures cause delays and severe logistical constraints. For
instance, 52 documents and signatures are required for a single trip between Mombasa, Kenya,
and Kigali, Rwanda. (See Table 6.) Despite recent simplification through the creation of one-stop
centers at ports, truckers still must go through many steps before crossing borders. They must
wait in central Mombasa for customs and the container terminal in the port for approvals from
other agencies. Messengers have been hired to assist government-employed operators to help
move documents from one counter to the next.x
Table 6: Document Clearance at Borders of Kenya
Documentation Clearance Number
Docs for Export 14
Signatures for Export 14
Time for Export(Days) 6
Documents for Import 9
Signatures for Import 9
Source: Field research, Eastern Africa Policy Centre, 2014
For those reasons, road transport in the EAC is significantly more expensive than ship and air
transport to advanced economies such as the United States and European Union. For instance, to
Country Time to Cross the Borders
(hrs)
Time(hrs) Waited to Pick Up
Freight Once in the Border
Uganda 15.25 11.75
Kenya 8.18 5.93
Tanzania 16.25 15.35
Rwanda 10.25 5.5
Burundi 16.25 13.50
Source: World Bank Report, 2013
9
transport a 20-tonne container via road from Mombasa to Kigali costs $3,400-$6,500. However,
to make a shipment by sea of the same tonnage from Mombasa to the United Kingdom often
costs only $2,000- $4,000.xi
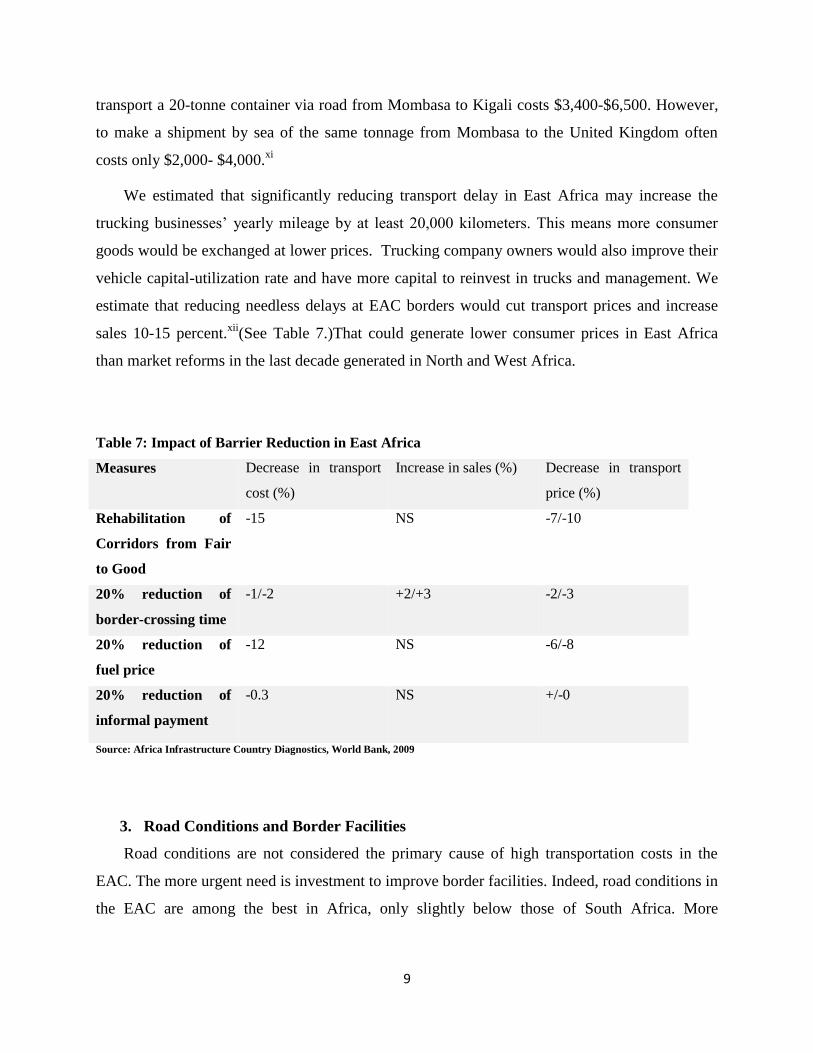
We estimated that significantly reducing transport delay in East Africa may increase the
trucking businesses’ yearly mileage by at least 20,000 kilometers. This means more consumer
goods would be exchanged at lower prices. Trucking company owners would also improve their
vehicle capital-utilization rate and have more capital to reinvest in trucks and management. We
estimate that reducing needless delays at EAC borders would cut transport prices and increase
sales 10-15 percent.xii
(See Table 7.)That could generate lower consumer prices in East Africa
than market reforms in the last decade generated in North and West Africa.
Table 7: Impact of Barrier Reduction in East Africa
Measures Decrease in transport
cost (%)
Increase in sales (%) Decrease in transport
price (%)
Rehabilitation of
Corridors from Fair
to Good
-15 NS -7/-10
20% reduction of
border-crossing time
-1/-2 +2/+3 -2/-3
20% reduction of
fuel price
-12 NS -6/-8
20% reduction of
informal payment
-0.3 NS +/-0
Source: Africa Infrastructure Country Diagnostics, World Bank, 2009
3. Road Conditions and Border Facilities
Road conditions are not considered the primary cause of high transportation costs in the
EAC. The more urgent need is investment to improve border facilities. Indeed, road conditions in
the EAC are among the best in Africa, only slightly below those of South Africa. More

10
government investment in road improvement would only marginally reduce inland transport cost.
(See Table 9.)
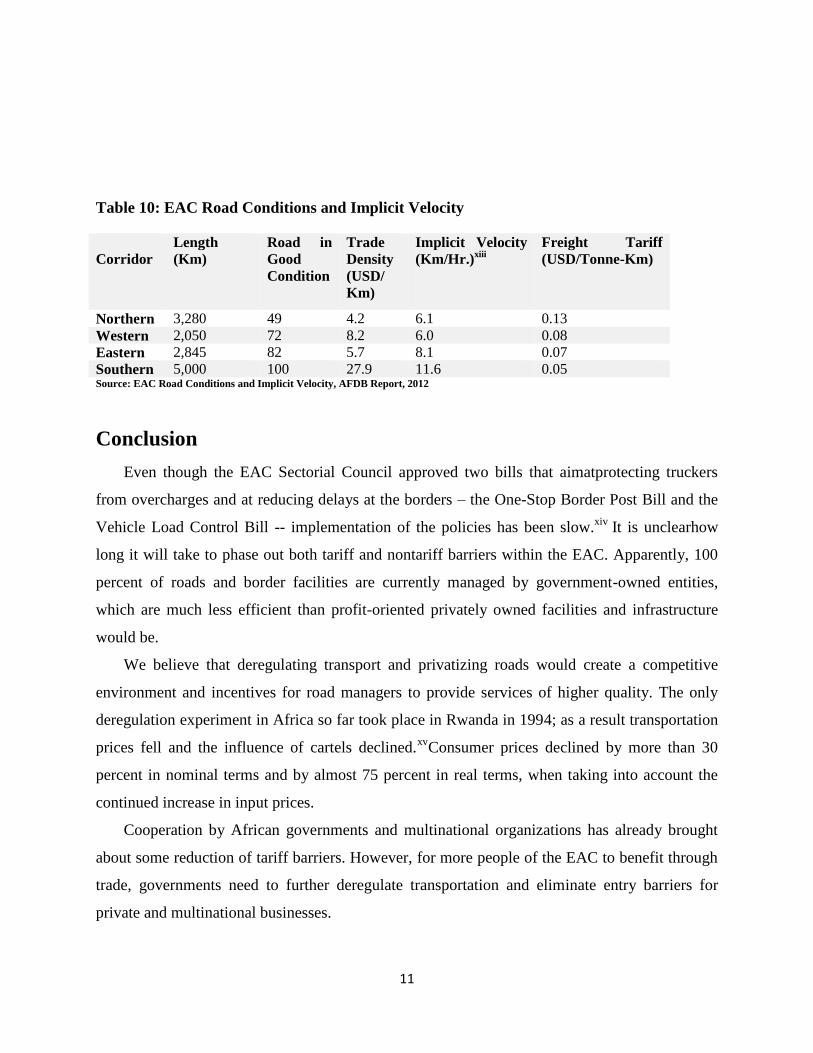
Despite its better road conditions, East Africa has the second lowest trade density among African
regions, which indicates the great potential for further trade integration if inland transport costs
were significantly reduced. Currently, only $5.7 million per kilometer was transported along its
corridors, compared to $8.2 million in the western region and $27.9 million in southern region.
(See Table 10.) There is no doubt that rehabilitating the infrastructure at the borders and
improving management facilities to reduce delays to zero would significantly improve flows of
trade in the region.
Table 9: Africa Road Conditions By Regions
Region Origin Destination Percentage of road in
good/ fair condition
West Africa Tema/Accra Ouagadougou 82
Tema/Accra Bamako 53
Central Africa Douala ND’jamena 45
Douala Bangui 53
Ngaondere Mondou 100
Ngaondere ND’jamena 61
East Africa Mombasa Kampala 86
Kampala Kigali 75
South Africa Lusaka Johannesburg 100
Lusaka Dar-es-salaam Not Available
Source : World Bank Report, 2012
11
Conclusion
Even though the EAC Sectorial Council approved two bills that aimatprotecting truckers
from overcharges and at reducing delays at the borders – the One-Stop Border Post Bill and the
Vehicle Load Control Bill -- implementation of the policies has been slow.xiv
It is unclearhow
long it will take to phase out both tariff and nontariff barriers within the EAC. Apparently, 100
percent of roads and border facilities are currently managed by government-owned entities,
which are much less efficient than profit-oriented privately owned facilities and infrastructure
would be.
We believe that deregulating transport and privatizing roads would create a competitive
environment and incentives for road managers to provide services of higher quality. The only
deregulation experiment in Africa so far took place in Rwanda in 1994; as a result transportation
prices fell and the influence of cartels declined.xv
Consumer prices declined by more than 30
percent in nominal terms and by almost 75 percent in real terms, when taking into account the
continued increase in input prices.
Cooperation by African governments and multinational organizations has already brought
about some reduction of tariff barriers. However, for more people of the EAC to benefit through
trade, governments need to further deregulate transportation and eliminate entry barriers for
private and multinational businesses.
Table 10: EAC Road Conditions and Implicit Velocity
Corridor
Length
(Km)
Road in
Good
Condition
Trade
Density
(USD/
Km)
Implicit Velocity
(Km/Hr.)xiii
Freight Tariff
(USD/Tonne-Km)
Northern 3,280 49 4.2 6.1 0.13
Western 2,050 72 8.2 6.0 0.08
Eastern 2,845 82 5.7 8.1 0.07
Southern 5,000 100 27.9 11.6 0.05 Source: EAC Road Conditions and Implicit Velocity, AFDB Report, 2012
12
Notes
i See James Gwartney, Robert Lawson, and Joshua Hall, “2013 Economic Freedom Dataset, published in Economic
Freedom of the World: 2013 Annual Report,” Fraser Institute (2013),
http://www.freetheworld.com/datasets_efw.html.
ii See “Accelerating Growth through Intra-African Trade”, Africa Growth Initiative at Brookings Institute, January
2012;
http://www.brookings.edu/~/media/research/files/reports/2012/1/intra%20african%20trade/01_intra_african_trade_f
ull_report.pdf
iii See Trade Facilitation in the East African Community: Recent Developments and Potential Benefits”, U.S.
International Trade Commission, Investigation No. 332-530, Publication No. 4335, July 2012;
http://www.usitc.gov/publications/332/pub4335.pdf
ivSee “East African Community (EAC) Investment Guidebook”, African Development Bank, Washington DC, 2013.
v See The World Bank, “Logistics Performance Index,” The World Bank Group, (2014), http://lpi.worldbank.org/.
vi See Jean-François Arvis, Daniel Saslavsky , LauriOjala, Ben Shepherd, Christina Busch
and Anasuya Raj, “Connecting to Compete 2014: Trade Logistics in the Global Economy”, World Bank, 2014
http://www.worldbank.org/content/dam/Worldbank/document/Trade/LPI2014.pdf.
vii See “Enabling Trade: Valuing Growth Opportunities”, World Economic Forum, Bain Company and World Bank,
2013, http://www3.weforum.org/docs/WEF_SCT_EnablingTrade_Report_2013.pdf.
viiiSupeeTeravaninthorn and GaëlRaballand, “Transport Prices and Costs in Africa: A Review of the Main
International Corridors”, Africa Infrastructure Country Diagnostic (AICD), Working Paper 14, July 2008.
ix See “Transport Prices and Costs in Africa A Review of the International Corridors”, the World Bank, 2009.
13
x See “Kenya: Issues in Trade Logistics”, Turku School of Economics and Business Administration (TSEBA) in
Finland, 2012, http://siteresources.worldbank.org/INTTLF/Resources/Kenya_Final_Report_Jul05.pdf.
xiThe East African Team, “Nightmare of moving cargo from Mombasa”, The East Africa, October 2011;
http://www.theeastafrican.co.ke/business/Nightmare+of+moving+cargo+from+Mombasa+/-/2560/1246550/-
/vnef5kz/-/index.html.
xii See “Transport Prices and Costs in Africa A Review of the International Corridors”, the World Bank, 2009.
xiii The total distance divided by the total time taken to make the trip, including time spent stationary at the ports,
border crossings, and other stops.
xiv See “Sectorial Council Clears Bill for One Stop Border Posts” , East African Community Secretariat, February
2012; http://www.eac.int/index.php?option=com_content&id=929:sectoral-council-clears-bill-for-
osbps&Itemid=194.
xv See “Rwanda: From Post-Conflict Reconstruction to Development,” International Development Association
(IDA), World Bank, (August 2009), http://siteresources.worldbank.org/IDA/Resources/ida-Rwanda-10-02-09.pdf.