structure inspection manual part 5 – ndt and pdt...
TRANSCRIPT
Structure Inspection Manual Part 5 – NDT and PDT Testing
March 2011 5-i
Chapter 1 – General Overview and Summary Table
Chapter 2 – Visual Inspection
Chapter 3 – Audible Inspections
Chapter 4 – Infrared Thermography
Chapter 5 – Ground Penetrating Radar
Chapter 6 – Acoustic Emission
Chapter 7 – R-Meter Testing
Chapter 8 – Schmidt Hammer
Chapter 9 – Impact Echo Testing
Chapter 10 – Windsor Probe
Chapter 11 – Half-Cell Testing
Chapter 12 – Chloride Ion Testing
Chapter 13 – Material Sampling
Chapter 14 – Ultrasonic Testing
Chapter 15 – Liquid Penetrant
Chapter 16 – Magnetic Particle
Chapter 17 – Monitoring Systems
Chapter 18 – Unknown Foundation Investigation
Chapter 19 – Hydrographic Survey
Appendix A: References

Structure Inspection Manual
[THIS PAGE INTENTIONALLY LEFT BLANK]
Structure Inspection Manual Part 5 – NDT and PDT Testing Chapter 1 – General Overview and Summary Table
March 2011 5-1-1
Table of Contents
5.1 General Overview and Summary Table ................................................................................ 2
5.1.1 Introduction.................................................................................................................... 2
5.1.2 NDT and PDT Inspector Qualifications ......................................................................... 4
5.1.2.1 Specialists ............................................................................................................. 4
5.1.3 Data Collection and Interpretation ................................................................................. 4
Structure Inspection Manual Part 5 – NDT and PDT Testing Chapter 1 – General Overview and Summary Table
March 2011 5-1-2
5.1 GENERAL OVERVIEW AND SUMMARY TABLE
5.1.1 Introduction
Structures of all types are susceptible to a range of defects. Some defects are unknowingly built into a structure, while others develop with time due to natural or manmade events. While some of these defects may be detected by visual or tactile means, others may be hidden within the structure’s members or components. In some cases, an indication of a defect may be readily observed, but the true extent or cause of the defect is not evident. For these cases, the use of nondestructive testing (NDT) methods or partially destructive testing (PDT) methods can be used to more thoroughly investigate a structure’s condition. NDTs permit the inspection of an element without inflicting damage, while partially destructive testing typically causes minor localized, repairable damage. Specifically, NDT and PDT are used to investigate the material integrity of the test component and not the function of the component beyond material failure.
Part 5 presents an overview of NDT techniques as they apply to bridges and miscellaneous support systems. Although NDT is often performed by specialists, all structure inspectors should be familiar with available NDT techniques so they can recommend appropriate testing procedures and recognize the limitations of the data.
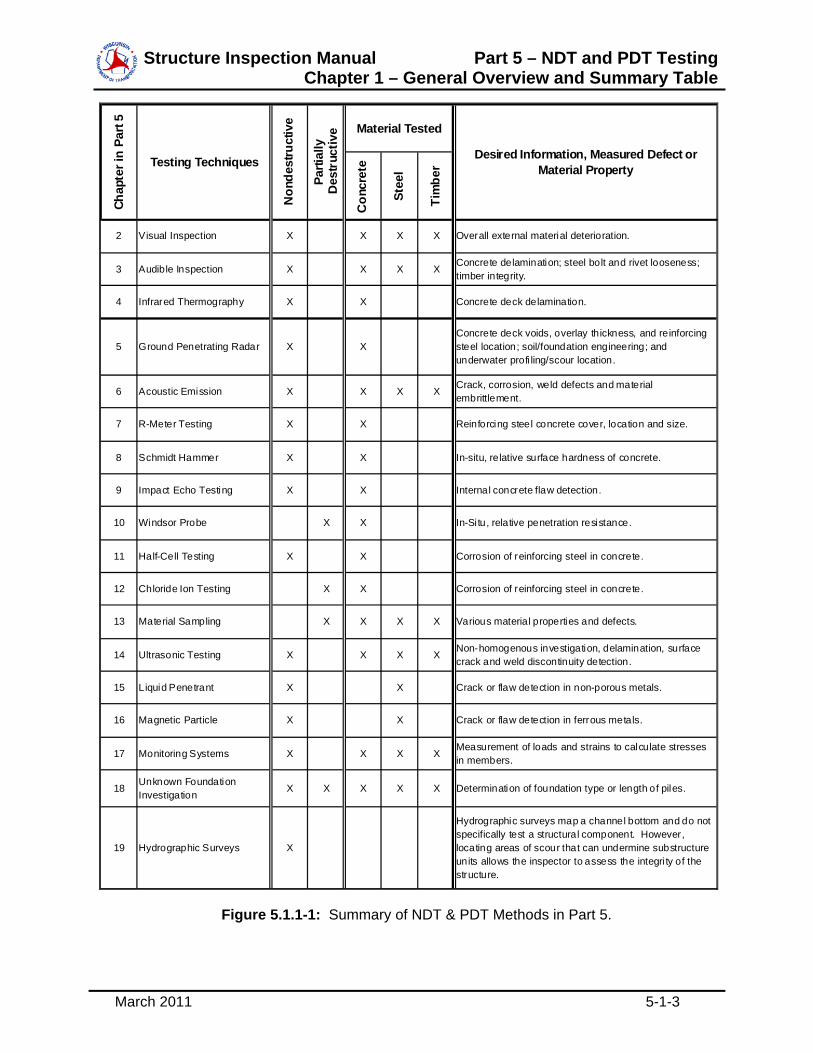
A variety of NDT and PDT techniques have been developed and are commonly employed in the inspection of structures. While several of these techniques are described in Part 5, the inspector should be aware that many other methods are also currently available and new techniques are constantly being developed. Refer to Figure 5.1.1-1 for a brief comparison of the techniques covered in Part 5.
Structure Inspection Manual Part 5 – NDT and PDT Testing Chapter 1 – General Overview and Summary Table
March 2011 5-1-3
Con
cret
e
Stee
l
Tim
ber
2 Visual Inspection X X X X Overall external material deterioration.
3 Audible Inspection X X X X Concrete delamination; steel bolt and rivet looseness; timber integrity.
4 Infrared Thermography X X Concrete deck delamination.
5 Ground Penetrating Radar X XConcrete deck voids, overlay thickness, and reinforcing steel location; soil/foundation engineering; and underwater profi ling/scour location.
6 Acoustic Emission X X X X Crack, corrosion, weld defects and material embrittlement.
7 R-Meter Testing X X Reinforcing steel concrete cover, location and size.
8 Schmidt Hammer X X In-situ, relative surface hardness of concrete.
9 Impact Echo Testing X X Internal concrete flaw detection.
10 Windsor Probe X X In-Situ, relative penetration resistance.
11 Half-Cell Testing X X Corrosion of reinforcing steel in concrete.
12 Chloride Ion Testing X X Corrosion of reinforcing steel in concrete.
13 Material Sampling X X X X Various material properties and defects.
14 Ultrasonic Testing X X X X Non-homogenous investigation, delamination, surface crack and weld discontinuity detection.
15 Liquid Penetrant X X Crack or flaw detection in non-porous metals.
16 Magnetic Particle X X Crack or flaw detection in ferrous metals.
17 Monitoring Systems X X X XMeasurement of loads and strains to calculate stresses in members.
18 Unknown Foundation Investigation
X X X X X Determination of foundation type or length of piles.
19 Hydrographic Surveys X
Hydrographic surveys map a channel bottom and do not specifically test a structural component. However, locating areas of scour that can undermine substructure units allows the inspector to assess the integri ty of the structure.
Material Tested
Desired Information, Measured Defect or Material PropertyTesting Techniques
Chap
ter i
n Pa
rt 5
Non
dest
ruct
ive
Parti
ally
D
estr
uctiv
e
Figure 5.1.1-1: Summary of NDT & PDT Methods in Part 5.
Structure Inspection Manual Part 5 – NDT and PDT Testing Chapter 1 – General Overview and Summary Table
March 2011 5-1-4
5.1.2 Nondestructive Testing (NDT) and Partially Destructive Testing (PDT) Inspector Qualifications
Nondestructive and partially destructive testing methods range from simple chain drags and timber coring to complex methods such as ultrasonic and Windsor Probe testing. It is important that the person conducting the test, as well as the personnel interpreting the test data, be properly trained in the applied method. Additional qualifications should include both an understanding of the theory behind the test and practical experience. All inspection methods should be conducted in accordance with applicable American Society for Nondestructive Testing (ASNT) procedures, American Society for Testing and Materials (ASTM) standards, and American Association of State Highway and Transportation Officials (AASHTO) specifications.
Refer to Part 1 of this Manual for the minimum standards for inspector qualification. Furthermore, Part 1 of this Manual discusses the requirements for submitting written practices and personnel certifications to WisDOT for review. Nationally recognized certifications in NDT are provided through ASNT. Many tests are particular to bridges, such as thermography and ground penetrating radar testing of bridge decks, are not covered by ASNT certifications; however, these tests are covered by the ASTM standards and experience can be documented.
5.1.2.1 Specialists
NDT: NDT personnel shall be qualified in accordance with nationally recognized NDT personnel qualifications practice or standards such as ANSI/ANST-CP-198, SNT-TC-1A, MIL STD 410, NAS-410 or a similar document. The practice or standard used and the applicable revision shall be specified in the contractual agreement between the structure owner and the NDT inspector.
NDT Requirements: Consultants, contractors, and their subcontractors performing NDT [magnetic particle testing (MT), liquid (dye) penetrant testing (PT) or ultrasonic testing (UT)] on bridges or miscellaneous structures as defined in the Wisconsin Structure Inspection Manual shall submit their written practice and personnel certifications for review prior to being allowed to solicit or perform these activities.
Consultants, contractors, and their subcontractors performing NDT (visual inspection) on bridges or miscellaneous structures, as defined in the Wisconsin Structure Inspection Manual, shall have taken and passed the NHI 80-hour course (Safety Inspection of In-service Bridges) or be certified as an American Welding Society Certified Welding Inspector (AWS/CWI) or submit their written practice and certifications documenting the equivalent training that qualifies their personnel to perform visual inspection on structures in the state of Wisconsin. The third option must be approved by the Wisconsin Department of Transportation’s (WisDOT) Statewide NDT Program Manager for approval prior to performing any work.
5.1.3 Data Collection and Interpretation
Upon embarking on a nondestructive or partially destructive testing program, a plan should be developed which details the type(s) of testing to be performed, amount of data needed, test locations, criteria for data interpretation, and follow-up procedures for handling
Structure Inspection Manual Part 5 – NDT and PDT Testing Chapter 1 – General Overview and Summary Table
March 2011 5-1-5
unanticipated test results. Many testing methods produce considerable test data. Data should be collected on the applicable forms, which include the location and test results. When possible, copies of all field data should be retained as part of the structure’s official file.
Interpretation of nondestructive testing (NDT)/partially destructive testing (PDT) data should be performed by persons knowledgeable both in the test theory and in the analysis or evaluation of the structure being tested. For some tests, such as ultrasonic weld inspection, recognized criteria exists for evaluating the effects of any detected anomalies. However, for many other test methods, the NDT/PDT data must be evaluated based on each individual structure’s behavior.
Most nondestructive programs detect and assist in the evaluation of flaws and discontinuities, as well as determining the strength or serviceability, by indirect methods. The tests typically indicate the existence, extent, and location of discontinuities. However, the influence of the discontinuity on the strength or serviceability of the structural component is often more difficult to determine. The validity of an NDT test depends on good engineering judgment based on experience, or fully destructive testing results. The information collected by NDT/PDT is typically raw data and the specialist must interpret the information to correlate it to a usable parameter. Also, certain techniques may provide false data under certain conditions; therefore, the specialist must be familiar with a technique and recognize the false readings. Likewise, the inspector should not recommend testing, or accept testing results, without being familiar with the technique.

Structure Inspection Manual
[THIS PAGE INTENTIONALLY LEFT BLANK]
Structure Inspection Manual Part 5 – NDT and PDT Testing Chapter 2 – Visual Inspection
March 2011 5-2-1
Table of Contents
5.2 Visual Inspection ................................................................................................................... 2
5.2.1 Introduction.................................................................................................................... 2
5.2.2 Applications ................................................................................................................... 2
5.2.3 Limitations ..................................................................................................................... 3
Structure Inspection Manual Part 5 – NDT and PDT Testing Chapter 2 – Visual Inspection
March 2011 5-2-2
5.2 VISUAL INSPECTION
5.2.1 Introduction
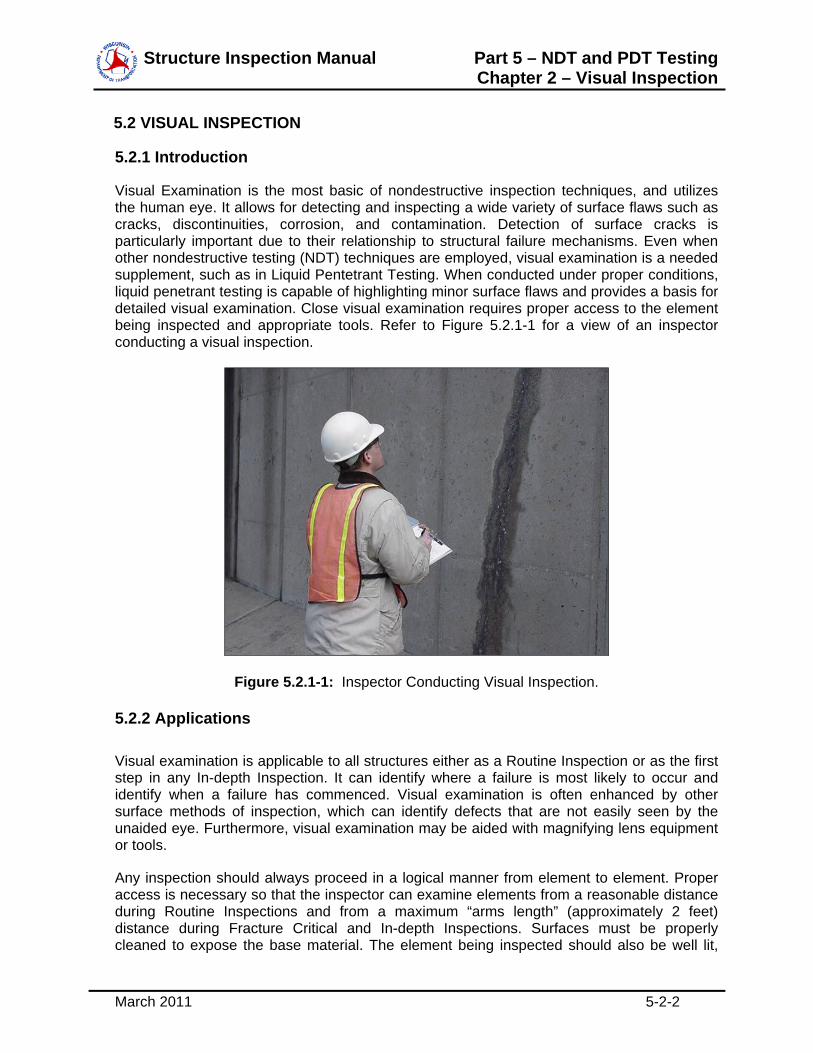
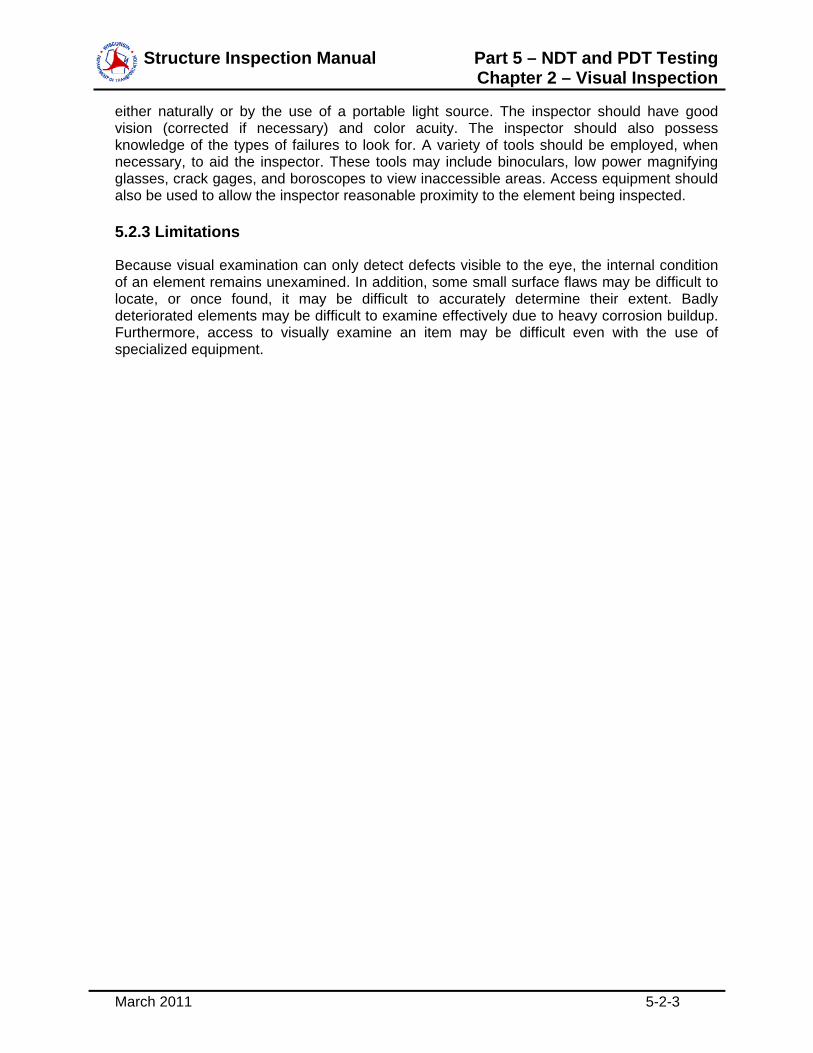
Visual Examination is the most basic of nondestructive inspection techniques, and utilizes the human eye. It allows for detecting and inspecting a wide variety of surface flaws such as cracks, discontinuities, corrosion, and contamination. Detection of surface cracks is particularly important due to their relationship to structural failure mechanisms. Even when other nondestructive testing (NDT) techniques are employed, visual examination is a needed supplement, such as in Liquid Pentetrant Testing. When conducted under proper conditions, liquid penetrant testing is capable of highlighting minor surface flaws and provides a basis for detailed visual examination. Close visual examination requires proper access to the element being inspected and appropriate tools. Refer to Figure 5.2.1-1 for a view of an inspector conducting a visual inspection.
Figure 5.2.1-1: Inspector Conducting Visual Inspection.
5.2.2 Applications
Visual examination is applicable to all structures either as a Routine Inspection or as the first step in any In-depth Inspection. It can identify where a failure is most likely to occur and identify when a failure has commenced. Visual examination is often enhanced by other surface methods of inspection, which can identify defects that are not easily seen by the unaided eye. Furthermore, visual examination may be aided with magnifying lens equipment or tools.
Any inspection should always proceed in a logical manner from element to element. Proper access is necessary so that the inspector can examine elements from a reasonable distance during Routine Inspections and from a maximum “arms length” (approximately 2 feet) distance during Fracture Critical and In-depth Inspections. Surfaces must be properly cleaned to expose the base material. The element being inspected should also be well lit,
Structure Inspection Manual Part 5 – NDT and PDT Testing Chapter 2 – Visual Inspection
March 2011 5-2-3
either naturally or by the use of a portable light source. The inspector should have good vision (corrected if necessary) and color acuity. The inspector should also possess knowledge of the types of failures to look for. A variety of tools should be employed, when necessary, to aid the inspector. These tools may include binoculars, low power magnifying glasses, crack gages, and boroscopes to view inaccessible areas. Access equipment should also be used to allow the inspector reasonable proximity to the element being inspected.
5.2.3 Limitations
Because visual examination can only detect defects visible to the eye, the internal condition of an element remains unexamined. In addition, some small surface flaws may be difficult to locate, or once found, it may be difficult to accurately determine their extent. Badly deteriorated elements may be difficult to examine effectively due to heavy corrosion buildup. Furthermore, access to visually examine an item may be difficult even with the use of specialized equipment.

Structure Inspection Manual
[THIS PAGE INTENTIONALLY LEFT BLANK]

Structure Inspection Manual Part 5 – NDT and PDT Testing Chapter 3 – Audible Inspections
March 2011 5-3-1
Table of Contents
5.3 Audible Inspections ............................................................................................................... 2
5.3.1 Introduction.................................................................................................................... 2
5.3.2 Applications ................................................................................................................... 3
5.3.3 Limitations ..................................................................................................................... 3
Structure Inspection Manual Part 5 – NDT and PDT Testing Chapter 3 – Audible Inspections
March 2011 5-3-2
5.3 AUDIBLE INSPECTIONS
5.3.1 Introduction
The two most common types of audible inspections are “Chain Dragging” and “Hammer Sounding.” Chain Dragging is normally used on large concrete surface areas, such as bridge decks, while Hammer Sounding can be used on a number of materials in random locations. Both methods typically rely on the experience of the inspector to differentiate the relative sounds of similar materials.
The Chain Dragging is a simple method allowing the inspector to drag several lengths of heavy chain over a concrete surface. The chains contact the concrete surface and produce an audible indication of delaminated areas, much like tapping with a hammer. These areas are marked and mapped for further evaluation.
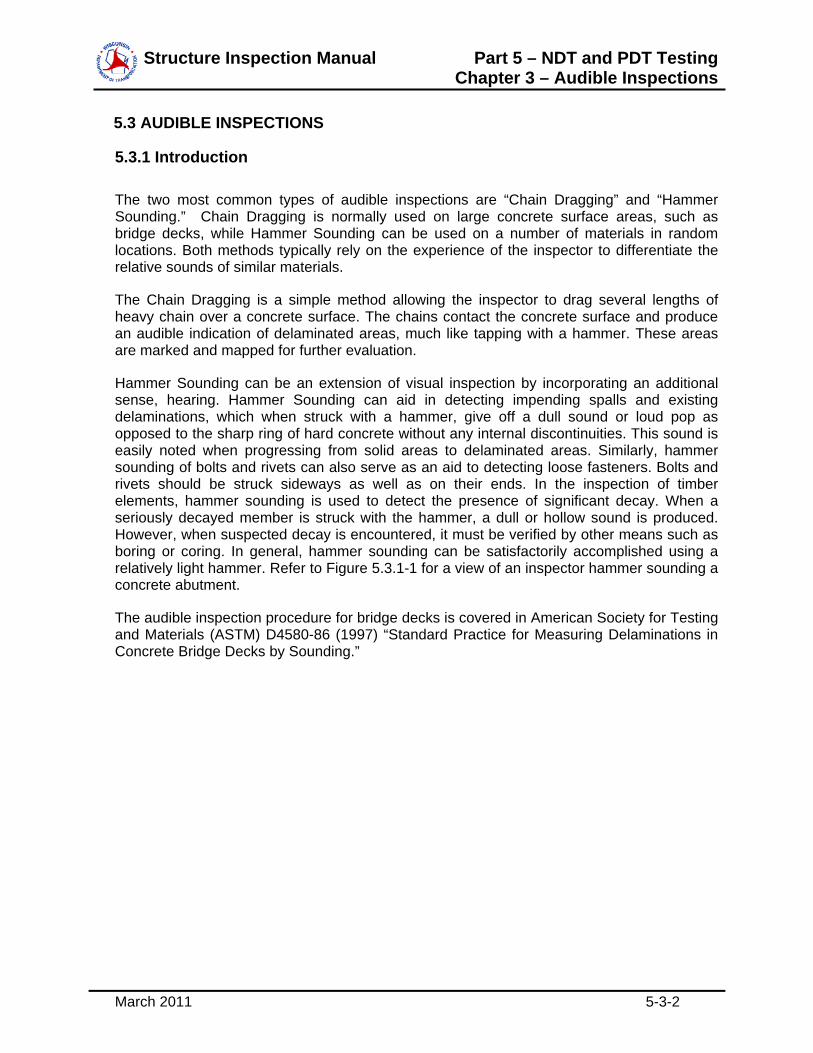
Hammer Sounding can be an extension of visual inspection by incorporating an additional sense, hearing. Hammer Sounding can aid in detecting impending spalls and existing delaminations, which when struck with a hammer, give off a dull sound or loud pop as opposed to the sharp ring of hard concrete without any internal discontinuities. This sound is easily noted when progressing from solid areas to delaminated areas. Similarly, hammer sounding of bolts and rivets can also serve as an aid to detecting loose fasteners. Bolts and rivets should be struck sideways as well as on their ends. In the inspection of timber elements, hammer sounding is used to detect the presence of significant decay. When a seriously decayed member is struck with the hammer, a dull or hollow sound is produced. However, when suspected decay is encountered, it must be verified by other means such as boring or coring. In general, hammer sounding can be satisfactorily accomplished using a relatively light hammer. Refer to Figure 5.3.1-1 for a view of an inspector hammer sounding a concrete abutment.
The audible inspection procedure for bridge decks is covered in American Society for Testing and Materials (ASTM) D4580-86 (1997) “Standard Practice for Measuring Delaminations in Concrete Bridge Decks by Sounding.”
Structure Inspection Manual Part 5 – NDT and PDT Testing Chapter 3 – Audible Inspections
March 2011 5-3-3
Figure 5.3.1-1: Inspector Hammer Sounding a Bridge Abutment.
5.3.2 Applications
Chain Dragging is most commonly used as an aid in inspecting concrete bridge decks. However, it can be used on other horizontal surfaces. Because several chains can be incorporated into the drag, large areas can be quickly examined. This method is most efficiently conducted using a two-person team.
Hammer Sounding is most commonly used as an aid in inspecting concrete, but can also be used on metal fasteners and timber members. This technique works well on both horizontal and vertical surfaces. Large areas can be inspected in a reasonable amount of time only if spacing is random; however, the inspector should take care to thoroughly cover the entire surface of the element since the hammer only provides information on the local area under the point of impact. A single inspector can conduct this method of investigation, but access equipment may be needed.
Both techniques require minimal training; however, the inspector should be familiar with the tonal differences between sound and delaminated concrete.
5.3.3 Limitations
Chain dragging is limited to locating areas of delamination in exposed concrete bridge decks. It is not effective on asphalt-overlaid decks, since there is no difference in sounds between delaminated concrete and debonded overlays. Hammer sounding is limited to areas visually identified for possible deterioration. Deterioration may include delamination and impending spalls in exposed concrete; rotting timber; and loosened fasteners. Although chain dragging and hammer sounding are inexpensive, it can be physically demanding and time consuming. Likewise, traffic control is often needed for bridge decks.

Structure Inspection Manual Part 5 – NDT and PDT Testing Chapter 3 – Audible Inspections
March 2011 5-3-4
Although the use of chain dragging and hammer sounding is relatively simple, the extent of the noted delamination is subject to the inspector’s interpretation of the tonal differences in the produced sound. Likewise, areas with high levels of background noise, such as large traffic volume or adjacent airports, industry, or construction sites will make the tonal differences of the produced sounds difficult to distinguish. Furthermore, data recording must be done manually using field sketches and photographs. Refer to Part 5 Chapter 6 for audible inspection method using acoustic emissions.

Structure Inspection Manual Part 5 – NDT and PDT Testing Chapter 4 – Infrared Thermography
March 2011 5-4-1
Table of Contents
5.4 Infrared Thermography ......................................................................................................... 2
5.4.1 Introduction.................................................................................................................... 2
5.4.2 Applications ................................................................................................................... 4
5.4.3 Limitations ..................................................................................................................... 4
Structure Inspection Manual Part 5 – NDT and PDT Testing Chapter 4 – Infrared Thermography
March 2011 5-4-2
5.4 INFRARED THERMOGRAPHY
5.4.1 Introduction
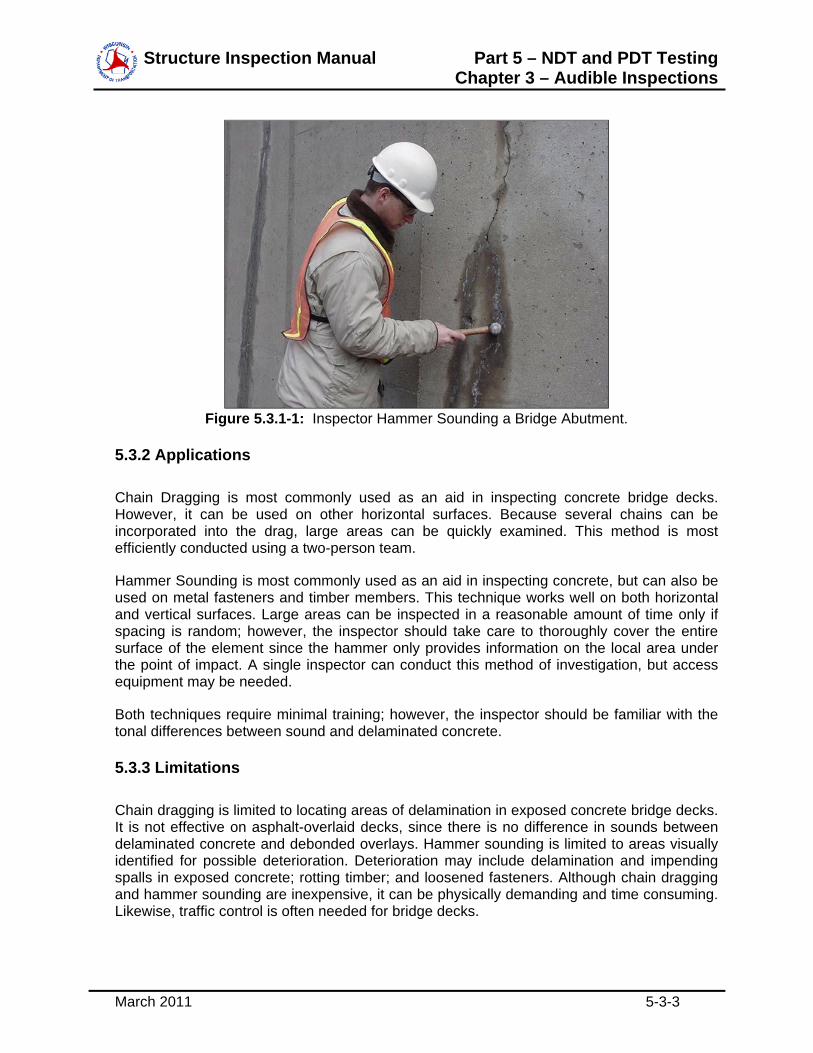
One type of deterioration encountered in bridge decks is delaminations within the concrete deck. A delamination is defined as a horizontal fracture plane at or above the top layer of the reinforcing. Overlay surfaces can hide delaminations until they are well advanced and it can be difficult to distinguish between deterioration in the concrete deck slab and debonding of the overlay. Refer to Figure 5.4.1-1 for an overall view of a concrete bridge deck with an asphalt overlay.
Figure 5.4.1-1: Bridge Deck with Asphalt Overlay and Extensive Patching.
As discussed in Chapter 3 of Part 5, traditional nondestructive testing (NDT) methods involve chain dragging and hammer sounding. These audible methods require inspector judgment, a great deal of effort, traffic control, and traffic disruption from the lane closures. The presence of an asphalt or concrete overlay reduces the effectiveness of these traditional audible methods.
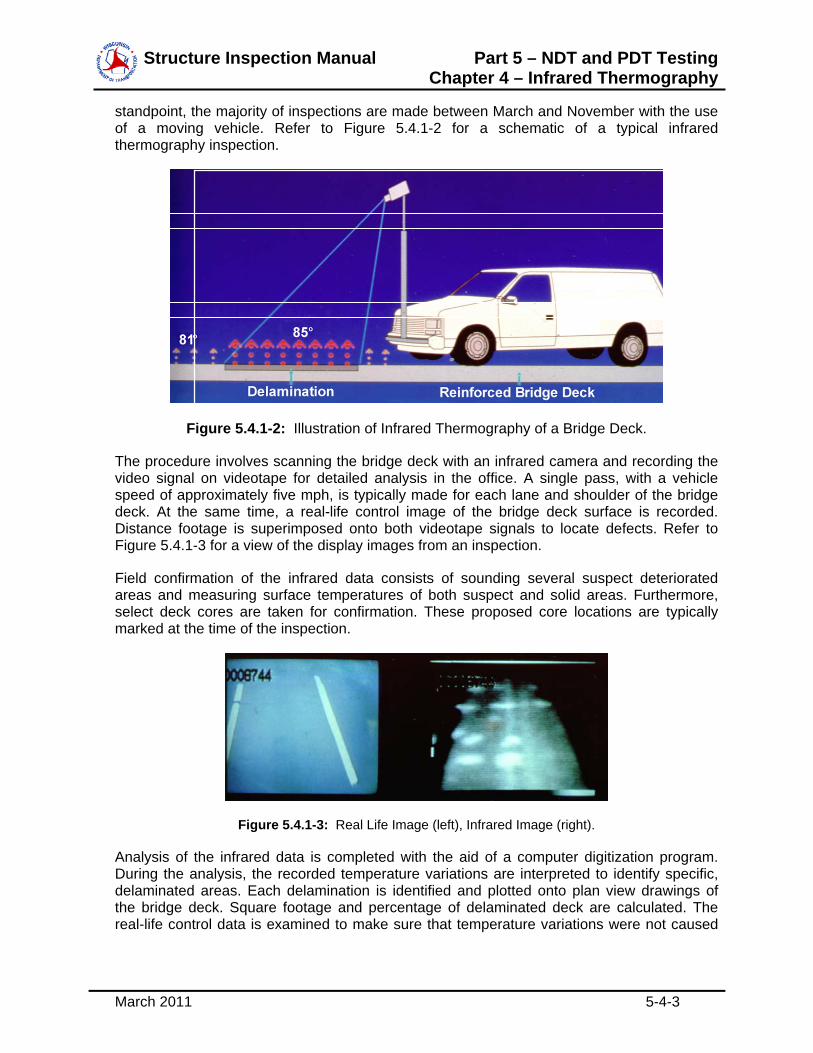
Infrared Thermography is an alternative tool for locating and mapping delaminations in bridge decks and pavements. A technique using an infrared scanner and control video camera, infrared thermography senses temperature differences between delaminated and non-delaminated areas.
A delamination in a concrete deck creates a thermal discontinuity that acts as an insulator. Thermography operates on the principal that when the sun warms the deck, the delaminated area heats up at a faster rate and reaches a higher temperature than the solid areas.
A temperature difference between delaminated and solid areas is normally established only on sunny or partially sunny days. The deck must be dry and winds must be less than 25 mph. Temperature difference is primarily related to the amount of sun, not the ambient air temperature, so inspections can be undertaken under various temperatures. From a practical
Structure Inspection Manual Part 5 – NDT and PDT Testing Chapter 4 – Infrared Thermography
March 2011 5-4-3
standpoint, the majority of inspections are made between March and November with the use of a moving vehicle. Refer to Figure 5.4.1-2 for a schematic of a typical infrared thermography inspection.
Figure 5.4.1-2: Illustration of Infrared Thermography of a Bridge Deck.
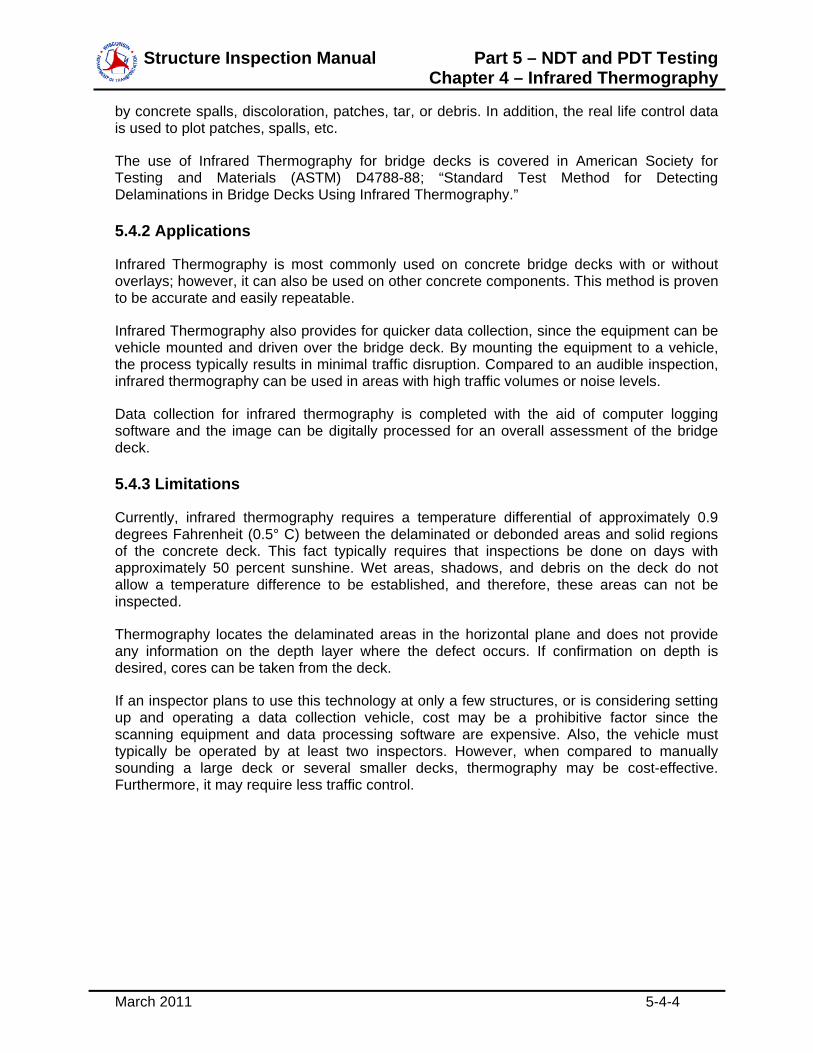
The procedure involves scanning the bridge deck with an infrared camera and recording the video signal on videotape for detailed analysis in the office. A single pass, with a vehicle speed of approximately five mph, is typically made for each lane and shoulder of the bridge deck. At the same time, a real-life control image of the bridge deck surface is recorded. Distance footage is superimposed onto both videotape signals to locate defects. Refer to Figure 5.4.1-3 for a view of the display images from an inspection.
Field confirmation of the infrared data consists of sounding several suspect deteriorated areas and measuring surface temperatures of both suspect and solid areas. Furthermore, select deck cores are taken for confirmation. These proposed core locations are typically marked at the time of the inspection.
Figure 5.4.1-3: Real Life Image (left), Infrared Image (right).
Analysis of the infrared data is completed with the aid of a computer digitization program. During the analysis, the recorded temperature variations are interpreted to identify specific, delaminated areas. Each delamination is identified and plotted onto plan view drawings of the bridge deck. Square footage and percentage of delaminated deck are calculated. The real-life control data is examined to make sure that temperature variations were not caused
Structure Inspection Manual Part 5 – NDT and PDT Testing Chapter 4 – Infrared Thermography
March 2011 5-4-4
by concrete spalls, discoloration, patches, tar, or debris. In addition, the real life control data is used to plot patches, spalls, etc.
The use of Infrared Thermography for bridge decks is covered in American Society for Testing and Materials (ASTM) D4788-88; “Standard Test Method for Detecting Delaminations in Bridge Decks Using Infrared Thermography.”
5.4.2 Applications
Infrared Thermography is most commonly used on concrete bridge decks with or without overlays; however, it can also be used on other concrete components. This method is proven to be accurate and easily repeatable.
Infrared Thermography also provides for quicker data collection, since the equipment can be vehicle mounted and driven over the bridge deck. By mounting the equipment to a vehicle, the process typically results in minimal traffic disruption. Compared to an audible inspection, infrared thermography can be used in areas with high traffic volumes or noise levels.
Data collection for infrared thermography is completed with the aid of computer logging software and the image can be digitally processed for an overall assessment of the bridge deck.
5.4.3 Limitations
Currently, infrared thermography requires a temperature differential of approximately 0.9 degrees Fahrenheit (0.5° C) between the delaminated or debonded areas and solid regions of the concrete deck. This fact typically requires that inspections be done on days with approximately 50 percent sunshine. Wet areas, shadows, and debris on the deck do not allow a temperature difference to be established, and therefore, these areas can not be inspected.
Thermography locates the delaminated areas in the horizontal plane and does not provide any information on the depth layer where the defect occurs. If confirmation on depth is desired, cores can be taken from the deck.
If an inspector plans to use this technology at only a few structures, or is considering setting up and operating a data collection vehicle, cost may be a prohibitive factor since the scanning equipment and data processing software are expensive. Also, the vehicle must typically be operated by at least two inspectors. However, when compared to manually sounding a large deck or several smaller decks, thermography may be cost-effective. Furthermore, it may require less traffic control.

Structure Inspection Manual Part 5 – NDT and PDT Testing Chapter 5 – Ground Penetrating Radar
March 2011 5-5-1
Table of Contents
5.5 Ground Penetrating Radar .................................................................................................... 2
5.5.1 Introduction.................................................................................................................... 2
5.5.2 Applications ................................................................................................................... 3
5.5.3 Limitations ..................................................................................................................... 4
Structure Inspection Manual Part 5 – NDT and PDT Testing Chapter 5 – Ground Penetrating Radar
March 2011 5-5-2
5.5 GROUND PENETRATING RADAR
5.5.1 Introduction
Ground Penetrating Radar (GPR) is a recognized non-destructive testing technique with many applications. Applications on bridges include bridge deck condition evaluation, overlay thickness, voiding under bridge approach slabs, reinforcing steel location, foundation investigation, and underwater profiling. Chapter 5 will discuss the use of GPR on bridge decks and approaches, while Chapters 18 and 19 will discuss additional uses of GPR.
A radar system typically consists of a control unit, radar antenna, and display unit. The control unit generates a radar pulse and sends it through a cable to the antenna. The antenna transmits the pulse into the surface. When this energy encounters an interface between two materials of differing dielectric properties, such as reinforcing steel, air, moisture, or the base-course material, a portion of the energy is reflected back to the radar antenna. The received pulse is sent back to the control unit for processing/storage. The display unit (video or chart recorder) presents the data.
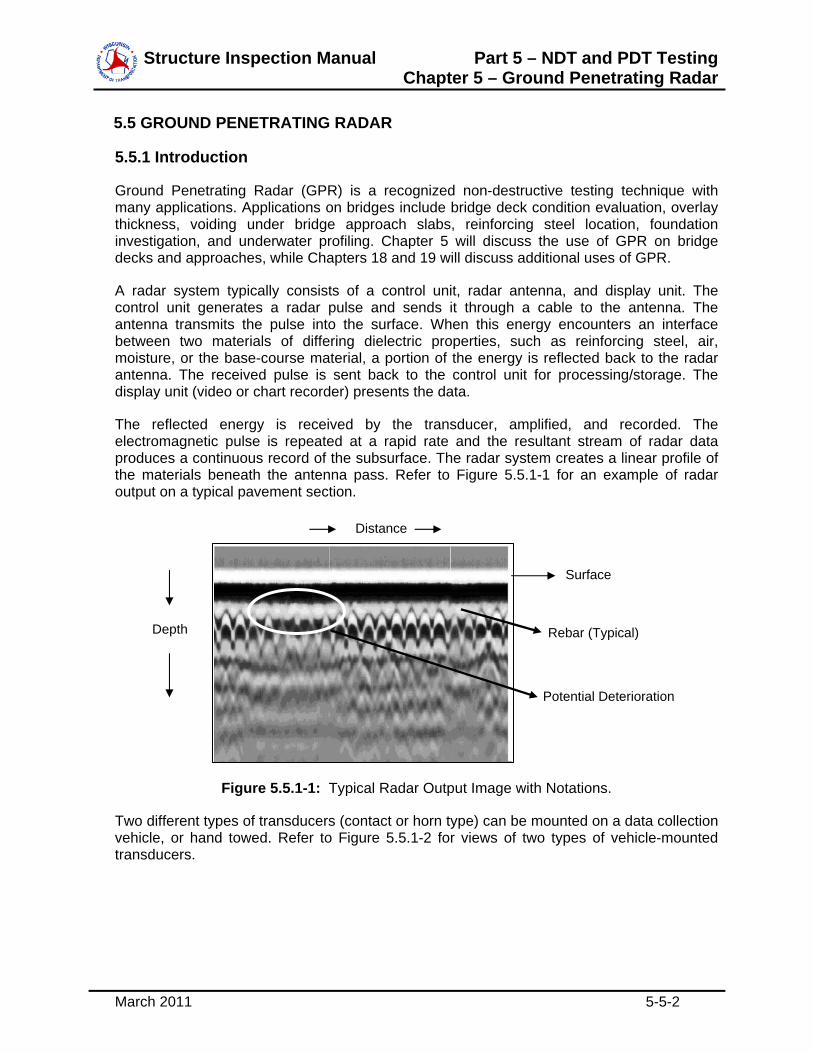
The reflected energy is received by the transducer, amplified, and recorded. The electromagnetic pulse is repeated at a rapid rate and the resultant stream of radar data produces a continuous record of the subsurface. The radar system creates a linear profile of the materials beneath the antenna pass. Refer to Figure 5.5.1-1 for an example of radar output on a typical pavement section.
Figure 5.5.1-1: Typical Radar Output Image with Notations.
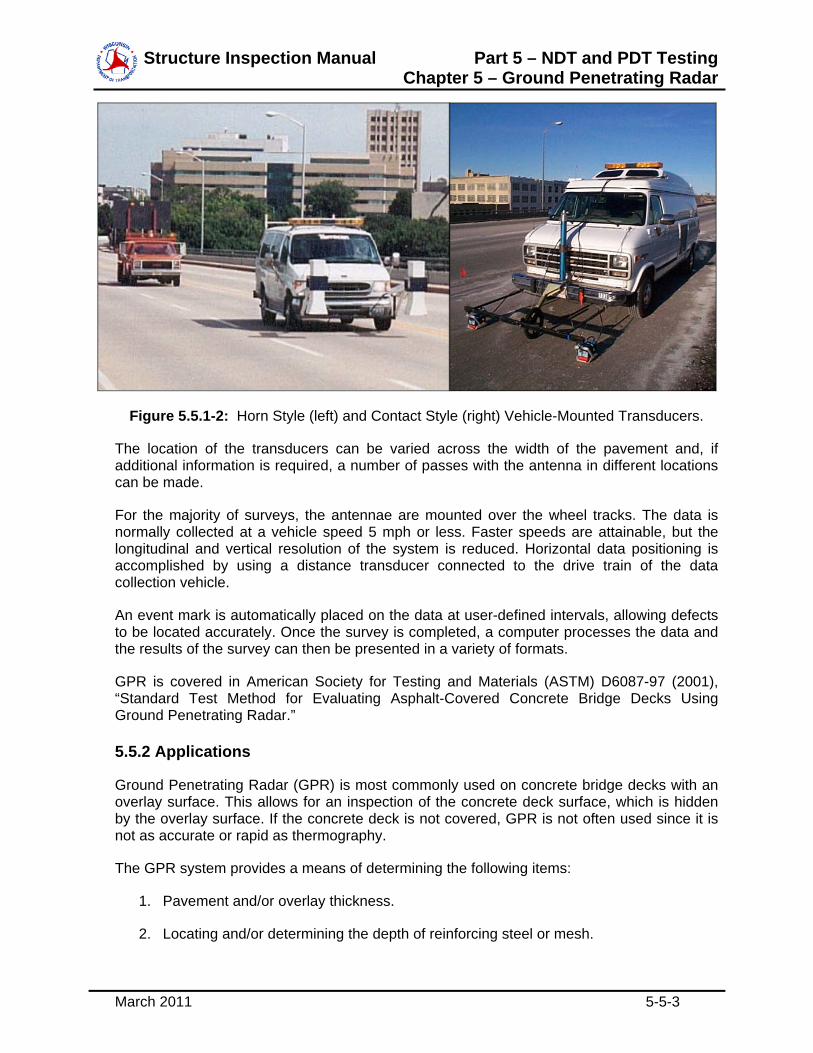
Two different types of transducers (contact or horn type) can be mounted on a data collection vehicle, or hand towed. Refer to Figure 5.5.1-2 for views of two types of vehicle-mounted transducers.
Surface
Depth Rebar (Typical)
Potential Deterioration
Distance
Structure Inspection Manual Part 5 – NDT and PDT Testing Chapter 5 – Ground Penetrating Radar
March 2011 5-5-3
Figure 5.5.1-2: Horn Style (left) and Contact Style (right) Vehicle-Mounted Transducers.
The location of the transducers can be varied across the width of the pavement and, if additional information is required, a number of passes with the antenna in different locations can be made.
For the majority of surveys, the antennae are mounted over the wheel tracks. The data is normally collected at a vehicle speed 5 mph or less. Faster speeds are attainable, but the longitudinal and vertical resolution of the system is reduced. Horizontal data positioning is accomplished by using a distance transducer connected to the drive train of the data collection vehicle.
An event mark is automatically placed on the data at user-defined intervals, allowing defects to be located accurately. Once the survey is completed, a computer processes the data and the results of the survey can then be presented in a variety of formats.
GPR is covered in American Society for Testing and Materials (ASTM) D6087-97 (2001), “Standard Test Method for Evaluating Asphalt-Covered Concrete Bridge Decks Using Ground Penetrating Radar.”
5.5.2 Applications
Ground Penetrating Radar (GPR) is most commonly used on concrete bridge decks with an overlay surface. This allows for an inspection of the concrete deck surface, which is hidden by the overlay surface. If the concrete deck is not covered, GPR is not often used since it is not as accurate or rapid as thermography.
The GPR system provides a means of determining the following items:
1. Pavement and/or overlay thickness.
2. Locating and/or determining the depth of reinforcing steel or mesh.
Structure Inspection Manual Part 5 – NDT and PDT Testing Chapter 5 – Ground Penetrating Radar
March 2011 5-5-4
3. If sufficient rigid pavement cover exists above reinforcing steel to allow pavement-grinding rehabilitation.
4. Identifying pavement or joint types.
5. Locating and determining the size of voids beneath pavements.
5.5.3 Limitations
Ground penetrating radar (GPR) identifies areas of a concrete deck with different dielectric properties or conductivities. Some concretes, such as dry low permeability concrete, affect the accuracy of GPR to detect areas of delamination. GPR is also sensitive to the presence of water and chlorides on the deck and between overlays and the base concrete, as well as the presence of debris on the deck surface. These conditions can significantly influence the accuracy of the data.
GPR must also be scanned perpendicular to the top layer of reinforcing steel. Therefore, inspection of some structures will require the survey to be conducted perpendicular to the flow of traffic. This will require traffic to be restricted or stopped altogether while the survey is being conducted. Frequently, several passes must be made on the deck area and the cost may be prohibitive.

Structure Inspection Manual Part 5 – NDT and PDT Testing Chapter 6 – Acoustic Emission
March 2011 5-6-1
Table of Contents
5.6 Acoustic Emission ................................................................................................................. 2
5.6.1 Introduction.................................................................................................................... 2
5.6.2 Applications ................................................................................................................... 3
5.6.3 Limitations ..................................................................................................................... 3
Structure Inspection Manual Part 5 – NDT and PDT Testing Chapter 6 – Acoustic Emission
March 2011 5-6-2
5.6 ACOUSTIC EMISSION
5.6.1 Introduction
Noises occurring in nature are accompanied by, and are probably the result of, an energy release of some kind. Fatigue cracks, weld discontinuities, and many other failure causing mechanisms also produce sound energy. Although a portion of the sound produced by materials under stress may exist as audible sound, most is low energy and inaudible. This depends on deformation magnitude and type, and upon flaw growth or failure. An example of the audible stress release occurred at the Mianus River Bridge in Greenwich, CT, where various newspapers reported loud noises were heard by residents days before the actual collapse occurred. This was also the case at the Hoan Bridge in Milwaukee, where witnesses reported a loud noise at the time of the brittle fracture of the steel girders.
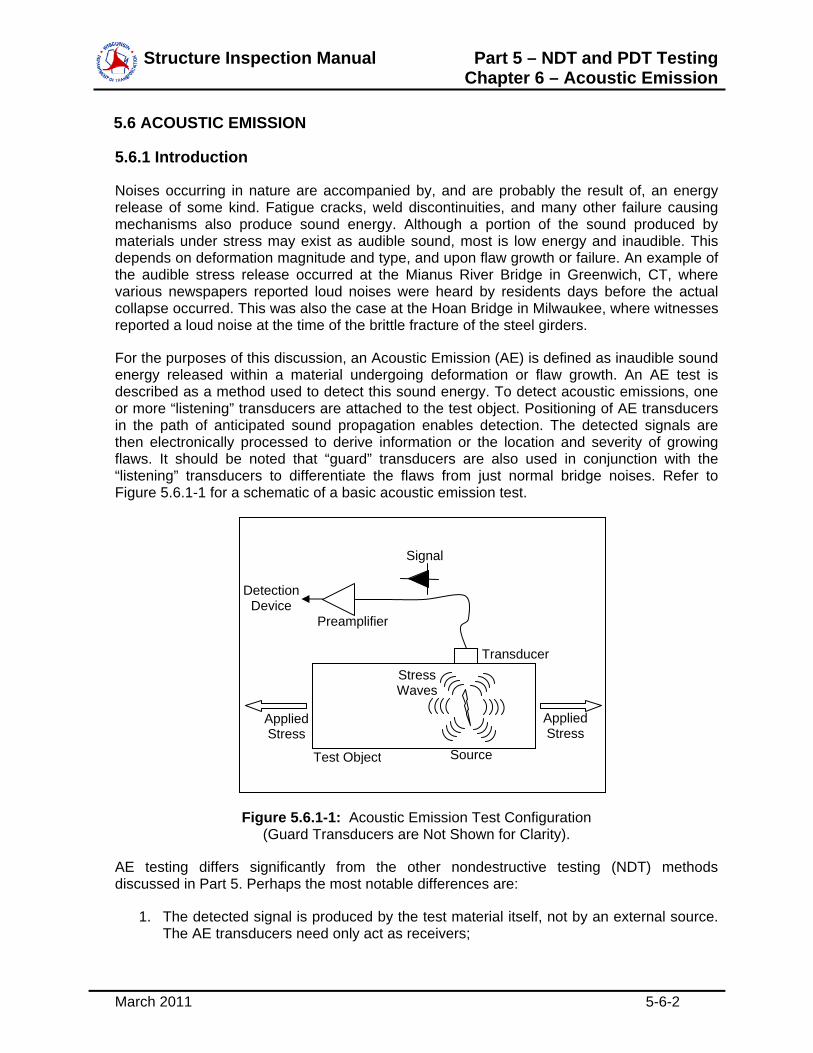
For the purposes of this discussion, an Acoustic Emission (AE) is defined as inaudible sound energy released within a material undergoing deformation or flaw growth. An AE test is described as a method used to detect this sound energy. To detect acoustic emissions, one or more “listening” transducers are attached to the test object. Positioning of AE transducers in the path of anticipated sound propagation enables detection. The detected signals are then electronically processed to derive information or the location and severity of growing flaws. It should be noted that “guard” transducers are also used in conjunction with the “listening” transducers to differentiate the flaws from just normal bridge noises. Refer to Figure 5.6.1-1 for a schematic of a basic acoustic emission test.
Figure 5.6.1-1: Acoustic Emission Test Configuration (Guard Transducers are Not Shown for Clarity).
AE testing differs significantly from the other nondestructive testing (NDT) methods discussed in Part 5. Perhaps the most notable differences are:
1. The detected signal is produced by the test material itself, not by an external source. The AE transducers need only act as receivers;
Detection Device
Test Object
Signal
Preamplifier
Stress Waves
Source
Transducer
Applied Stress
Applied Stress
Structure Inspection Manual Part 5 – NDT and PDT Testing Chapter 6 – Acoustic Emission
March 2011 5-6-3
2. AE tests detect movement, where most other methods typically only detect existing geometrical discontinuities; and
3. An applied stress is required to cause flaw growth, and hence, the acoustic emission. The applied stress can be the result of the components service and dead loads or an induced load used specifically for the AE test. In many tests, a combination of the two is necessary.
Various American Society for Testing and Materials (ASTM) Standards cover AE testing and are dependant on the material and type of structural component being tested.
5.6.2 Applications
Acoustic Emission (AE) testing is used to detect cracks, corrosion, weld defects, and material embrittlement. This method can be used on a wide variety of materials, such as metal, timber, concrete, fiberglass, composites, and ceramic.
An entire structure can be monitored with AE testing from a few locations, reducing the amount of access required. AE testing can also be conducted while the structure is in-service.
AE testing is a real-time nondestructive testing (NDT) method. In other words, it is monitoring the actual condition of the component during the test. The AE test method can also be used to record an accumulation of damage occurring within a structure. The data obtained can be used as history for a structure, and possibly to predict failure.
5.6.3 Limitations
A primary limitation of Acoustic Emission (AE) testing of structures, such as bridges, is the requirement to differentiate the sound energy released by a growing flaw from that which is called background noise. Many background noise generators such as bolts, joint friction, traffic, and others can mimic or mask the sound energy released from growing cracks. Some AE test methods avoid this problem by isolating areas known to contain possible background noise generators.
When a global AE inspection is conducted to determine areas where structural problems exist, additional nondestructive testing (NDT) or partially destructive testing (PDT) methods may be required to identify the exact nature of the emission source defect.

Structure Inspection Manual
[THIS PAGE INTENTIONALLY LEFT BLANK]

Structure Inspection Manual Part 5 – NDT and PDT Testing Chapter 7 – R-Meter Testing
March 2011 5-7-1
Table of Contents
5.7 R-Meter Testing .................................................................................................................... 2
5.7.1 Introduction.................................................................................................................... 2
5.7.2 Applications ................................................................................................................... 2
5.7.3 Limitations ..................................................................................................................... 3
Structure Inspection Manual Part 5 – NDT and PDT Testing Chapter 7 – R-Meter Testing
March 2011 5-7-2
5.7 R-METER TESTING
5.7.1 Introduction
Covermeters or pachometers, often referred to as R-Meters, are electromagnetic devices that detect the reinforcing steel in concrete and measure its size and the depth of cover. The device produces a magnetic field and locates the reinforcing steel by measuring the distortion of the magnetic field created by the presence of the steel. The signal received increases with increasing bar size and decreases with increasing cover thickness. Making certain assumptions, the R-Meter can be calibrated to convert the signal into a distance, which indicates the depth of cover.
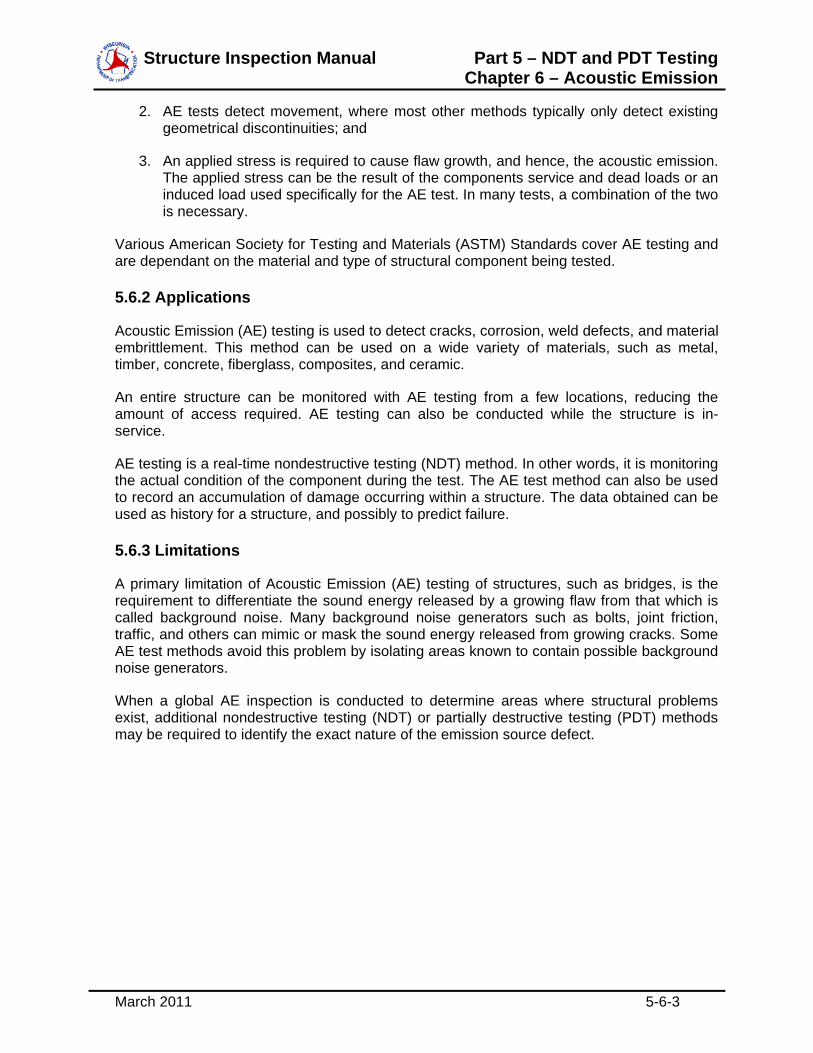
The importance of measuring depth of cover is highlighted by the relationship between cover depth and deterioration mechanisms. Inadequate cover can undermine the protection that the concrete provides to the steel reinforcement from corrosion. Carbonation begins as soon as concrete is exposed to air, where carbon dioxide and moisture mix with products in the concrete to bring about chemical changes. The process of carbonation neutralizes the protective alkaline nature of the concrete. If the cover is too shallow, the carbonation will reach the level of the reinforcing steel and the alkaline protection will be lost, allowing corrosion to begin on the steel. The exposure of the concrete and reinforcing steel to road salts and moisture will further accelerate the corrosion process once the cover has been breached by cracks or spalls. If the cover is too deep, there is the possibility of increased crack widths and decreased effective depth, which both affect design parameters on a concrete member. Refer to Figure 5.7.1-1 for a view of a covermeter.
Figure 5.7.1-1: View of a Basic Covermeter Unit.
5.7.2 Applications
Accurately locating the reinforcing steel in concrete, allows the inspector to determine if the steel is placed outside of the zone of carbonation. Covermeters, in general, can accurately measure the cover depth within 0.25 inch in the range of 0 to 3 inches in lightly reinforced structural members. Covermeters can also be used to locate reinforcing steel for the purpose
Structure Inspection Manual Part 5 – NDT and PDT Testing Chapter 7 – R-Meter Testing
March 2011 5-7-3
of “tying-in” a new structural member to an existing structure. This process typically occurs during rehabilitation and involves drilling into the existing structure and added reinforcing steel, which spans from the old to the new components.
5.7.3 Limitations
The effectiveness of a covermeter as a nondestructive testing method is limited by several factors. A covermeter only locates the reinforcing steel and does not provide any actual information about defects or the material’s state of deterioration. Secondly, it does not distinguish if one or more bars are present at a certain location and therefore, the intensity of the signal may be misinterpreted and the cover depth can be incorrectly noted as shallower than the true depth. This problem is most pronounced in heavily reinforced structures or when large steel objects, such as scaffold, are near the test area. Also, some reports indicate that the epoxy coatings on reinforcing steel can distort the readings of an R-Meter. Likewise, the relative material properties of the concrete often must be assumed to utilize conversion charts for the readings.

Structure Inspection Manual
[THIS PAGE INTENTIONALLY LEFT BLANK]

Structure Inspection Manual Part 5 – NDT and PDT Testing Chapter 8 – Schmidt Hammer
March 2011 5-8-1
Table of Contents
5.8 Schmidt Hammer .................................................................................................................. 2
5.8.1 Introduction.................................................................................................................... 2
5.8.2 Applications ................................................................................................................... 2
5.8.3 Limitations ..................................................................................................................... 2
Structure Inspection Manual Part 5 – NDT and PDT Testing Chapter 8 – Schmidt Hammer
March 2011 5-8-2
5.8 SCHMIDT HAMMER
5.8.1 Introduction
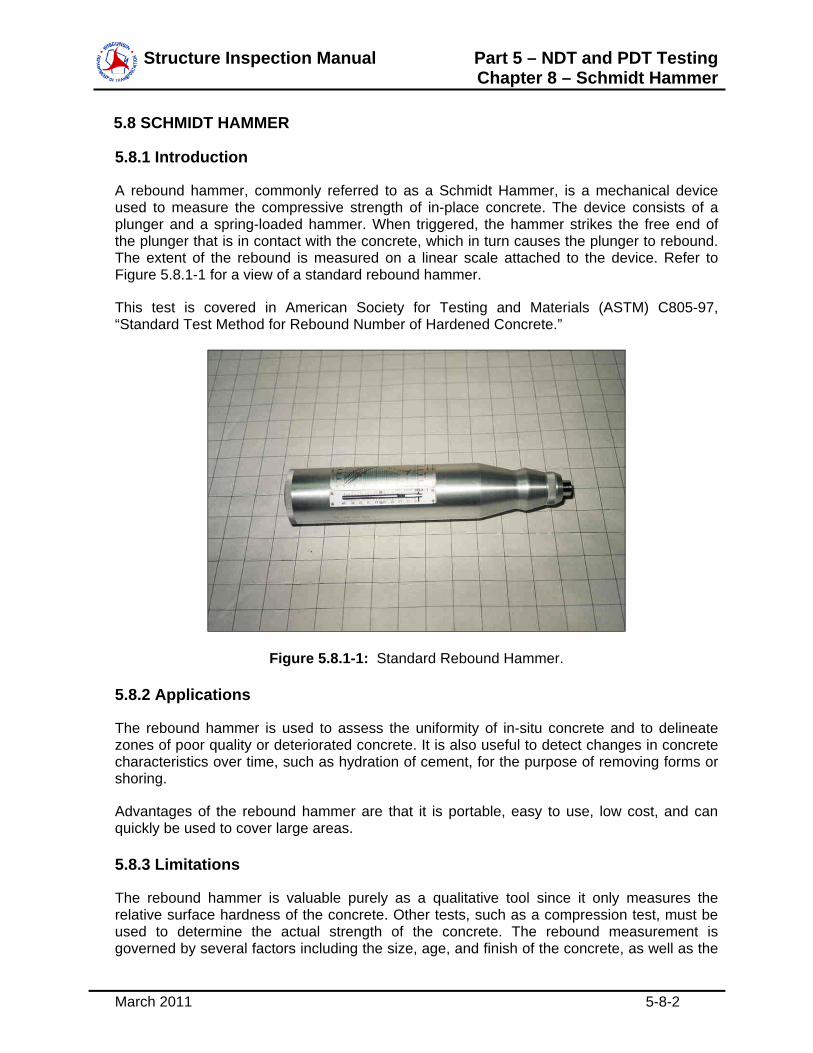
A rebound hammer, commonly referred to as a Schmidt Hammer, is a mechanical device used to measure the compressive strength of in-place concrete. The device consists of a plunger and a spring-loaded hammer. When triggered, the hammer strikes the free end of the plunger that is in contact with the concrete, which in turn causes the plunger to rebound. The extent of the rebound is measured on a linear scale attached to the device. Refer to Figure 5.8.1-1 for a view of a standard rebound hammer.
This test is covered in American Society for Testing and Materials (ASTM) C805-97, “Standard Test Method for Rebound Number of Hardened Concrete.”
Figure 5.8.1-1: Standard Rebound Hammer.
5.8.2 Applications
The rebound hammer is used to assess the uniformity of in-situ concrete and to delineate zones of poor quality or deteriorated concrete. It is also useful to detect changes in concrete characteristics over time, such as hydration of cement, for the purpose of removing forms or shoring.
Advantages of the rebound hammer are that it is portable, easy to use, low cost, and can quickly be used to cover large areas.
5.8.3 Limitations
The rebound hammer is valuable purely as a qualitative tool since it only measures the relative surface hardness of the concrete. Other tests, such as a compression test, must be used to determine the actual strength of the concrete. The rebound measurement is governed by several factors including the size, age, and finish of the concrete, as well as the

Structure Inspection Manual Part 5 – NDT and PDT Testing Chapter 8 – Schmidt Hammer
March 2011 5-8-3
aggregate type and the moisture content. Also, the Schmidt Hammer Test should not be done over exposed aggregate or a false reading will be given.

Structure Inspection Manual
[THIS PAGE INTENTIONALLY LEFT BLANK]
Structure Inspection Manual Part 5 – NDT and PDT Testing Chapter 9 – Impact Echo Testing
March 2011 5-9-1
Table of Contents
5.9 General ................................................................................................................................. 2
5.9.1 Introduction.................................................................................................................... 2
5.9.2 Applications ................................................................................................................... 3
5.9.3 Limitations ..................................................................................................................... 3
Structure Inspection Manual Part 5 – NDT and PDT Testing Chapter 9 – Impact Echo Testing
March 2011 5-9-2
5.9 GENERAL
5.9.1 Introduction
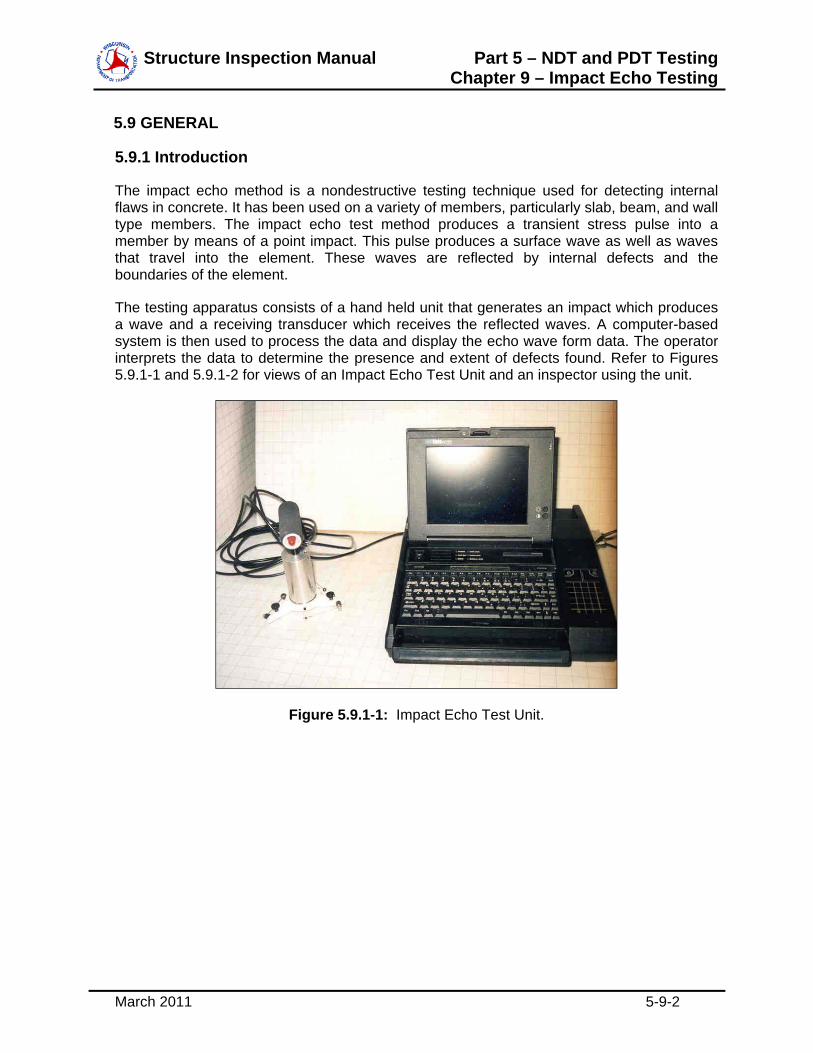
The impact echo method is a nondestructive testing technique used for detecting internal flaws in concrete. It has been used on a variety of members, particularly slab, beam, and wall type members. The impact echo test method produces a transient stress pulse into a member by means of a point impact. This pulse produces a surface wave as well as waves that travel into the element. These waves are reflected by internal defects and the boundaries of the element.
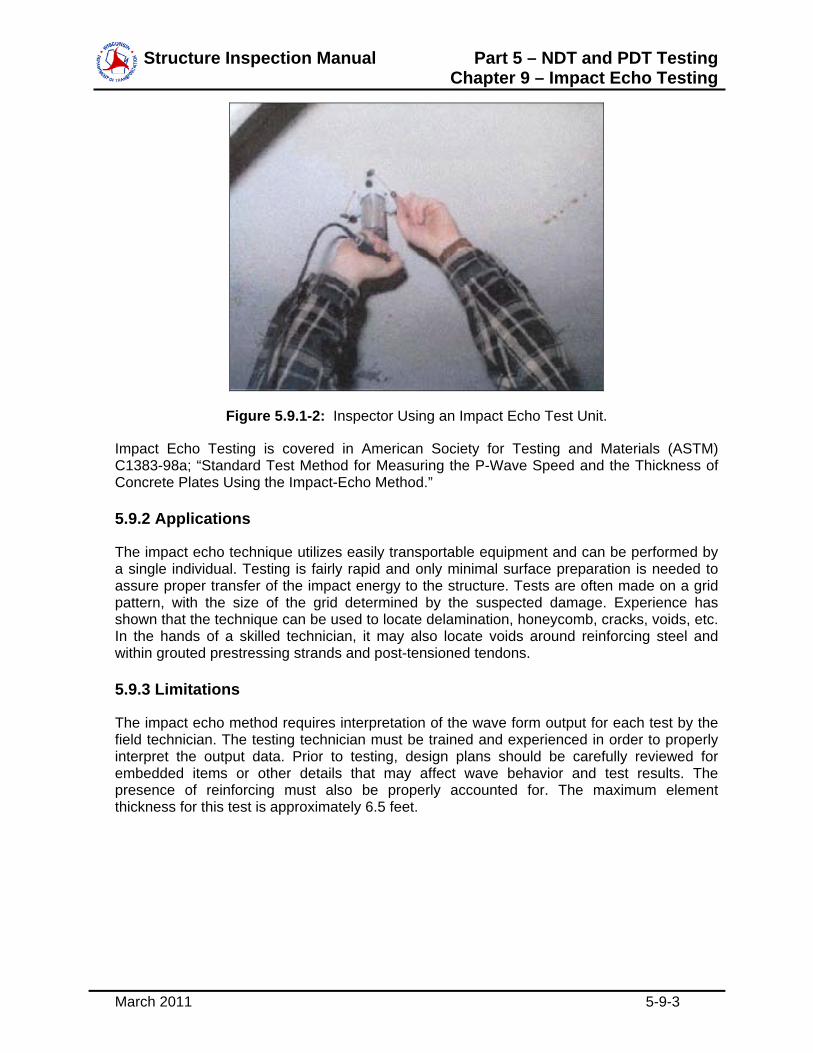
The testing apparatus consists of a hand held unit that generates an impact which produces a wave and a receiving transducer which receives the reflected waves. A computer-based system is then used to process the data and display the echo wave form data. The operator interprets the data to determine the presence and extent of defects found. Refer to Figures 5.9.1-1 and 5.9.1-2 for views of an Impact Echo Test Unit and an inspector using the unit.
Figure 5.9.1-1: Impact Echo Test Unit.
Structure Inspection Manual Part 5 – NDT and PDT Testing Chapter 9 – Impact Echo Testing
March 2011 5-9-3
Figure 5.9.1-2: Inspector Using an Impact Echo Test Unit.
Impact Echo Testing is covered in American Society for Testing and Materials (ASTM) C1383-98a; “Standard Test Method for Measuring the P-Wave Speed and the Thickness of Concrete Plates Using the Impact-Echo Method.”
5.9.2 Applications
The impact echo technique utilizes easily transportable equipment and can be performed by a single individual. Testing is fairly rapid and only minimal surface preparation is needed to assure proper transfer of the impact energy to the structure. Tests are often made on a grid pattern, with the size of the grid determined by the suspected damage. Experience has shown that the technique can be used to locate delamination, honeycomb, cracks, voids, etc. In the hands of a skilled technician, it may also locate voids around reinforcing steel and within grouted prestressing strands and post-tensioned tendons.
5.9.3 Limitations
The impact echo method requires interpretation of the wave form output for each test by the field technician. The testing technician must be trained and experienced in order to properly interpret the output data. Prior to testing, design plans should be carefully reviewed for embedded items or other details that may affect wave behavior and test results. The presence of reinforcing must also be properly accounted for. The maximum element thickness for this test is approximately 6.5 feet.

Structure Inspection Manual
[THIS PAGE INTENTIONALLY LEFT BLANK]

Structure Inspection Manual Part 5 – NDT and PDT Testing Chapter 10 – Windsor Probe
March 2011 5-10-1
Table of Contents
5.10 Windsor Probe .................................................................................................................... 2
5.10.1 Introduction.................................................................................................................. 2
5.10.2 Applications ................................................................................................................. 2
5.10.3 Limitations ................................................................................................................... 2
Structure Inspection Manual Part 5 – NDT and PDT Testing Chapter 10 – Windsor Probe
March 2011 5-10-2
5.10 WINDSOR PROBE
5.10.1 Introduction
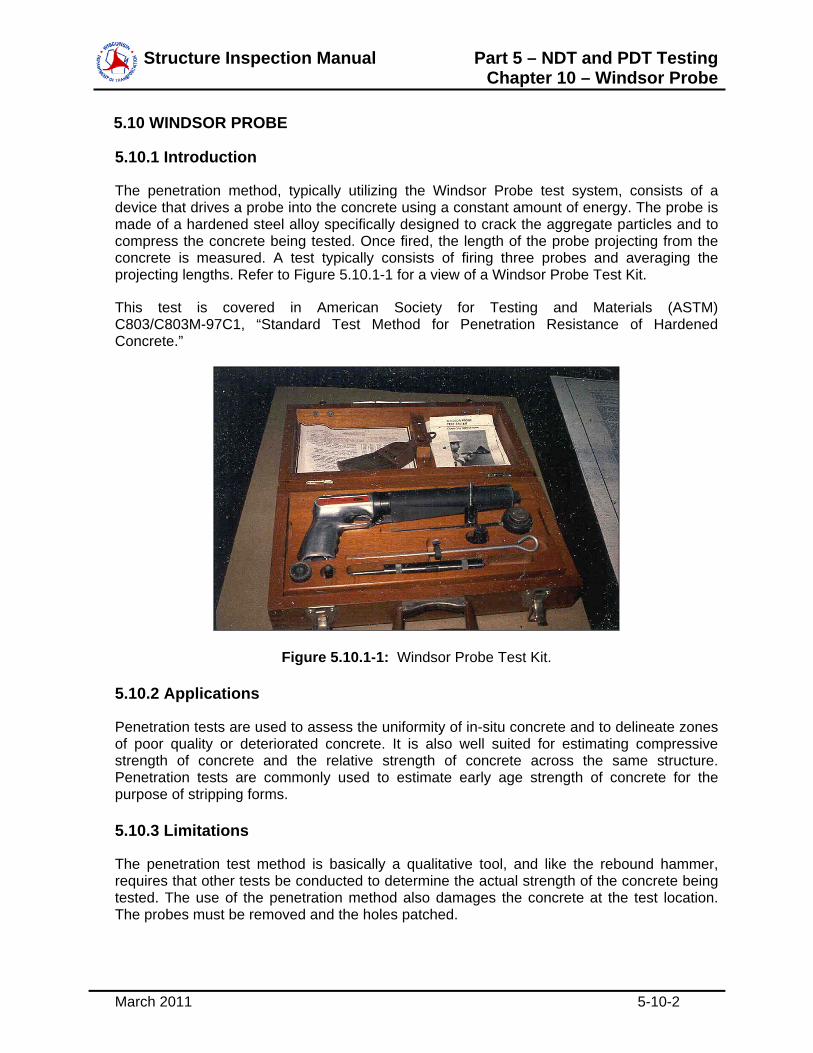
The penetration method, typically utilizing the Windsor Probe test system, consists of a device that drives a probe into the concrete using a constant amount of energy. The probe is made of a hardened steel alloy specifically designed to crack the aggregate particles and to compress the concrete being tested. Once fired, the length of the probe projecting from the concrete is measured. A test typically consists of firing three probes and averaging the projecting lengths. Refer to Figure 5.10.1-1 for a view of a Windsor Probe Test Kit.
This test is covered in American Society for Testing and Materials (ASTM) C803/C803M-97C1, “Standard Test Method for Penetration Resistance of Hardened Concrete.”
Figure 5.10.1-1: Windsor Probe Test Kit.
5.10.2 Applications
Penetration tests are used to assess the uniformity of in-situ concrete and to delineate zones of poor quality or deteriorated concrete. It is also well suited for estimating compressive strength of concrete and the relative strength of concrete across the same structure. Penetration tests are commonly used to estimate early age strength of concrete for the purpose of stripping forms.
5.10.3 Limitations
The penetration test method is basically a qualitative tool, and like the rebound hammer, requires that other tests be conducted to determine the actual strength of the concrete being tested. The use of the penetration method also damages the concrete at the test location. The probes must be removed and the holes patched.

Structure Inspection Manual Part 5 – NDT and PDT Testing Chapter 11 – Half-Cell Testing
March 2011 5-11-1
Table of Contents
5.11 Half-Cell Testing ................................................................................................................. 2
5.11.1 Introduction.................................................................................................................. 2
5.11.2 Applications ................................................................................................................. 2
5.11.3 Limitations ................................................................................................................... 3
Structure Inspection Manual Part 5 – NDT and PDT Testing Chapter 11 – Half-Cell Testing
March 2011 5-11-2
5.11 HALF-CELL TESTING
5.11.1 Introduction
Steel reinforcement is typically protected from corrosion by the alkaline nature of concrete. If the alkalinity of the concrete is compromised, corrosion on the steel will commence provided moisture and oxygen are present. The corrosion reaction will promote anodic and cathodic activity along the reinforcing steel. The corrosion of the reinforcement produces a corrosion cell caused by these differences in electrical potential.
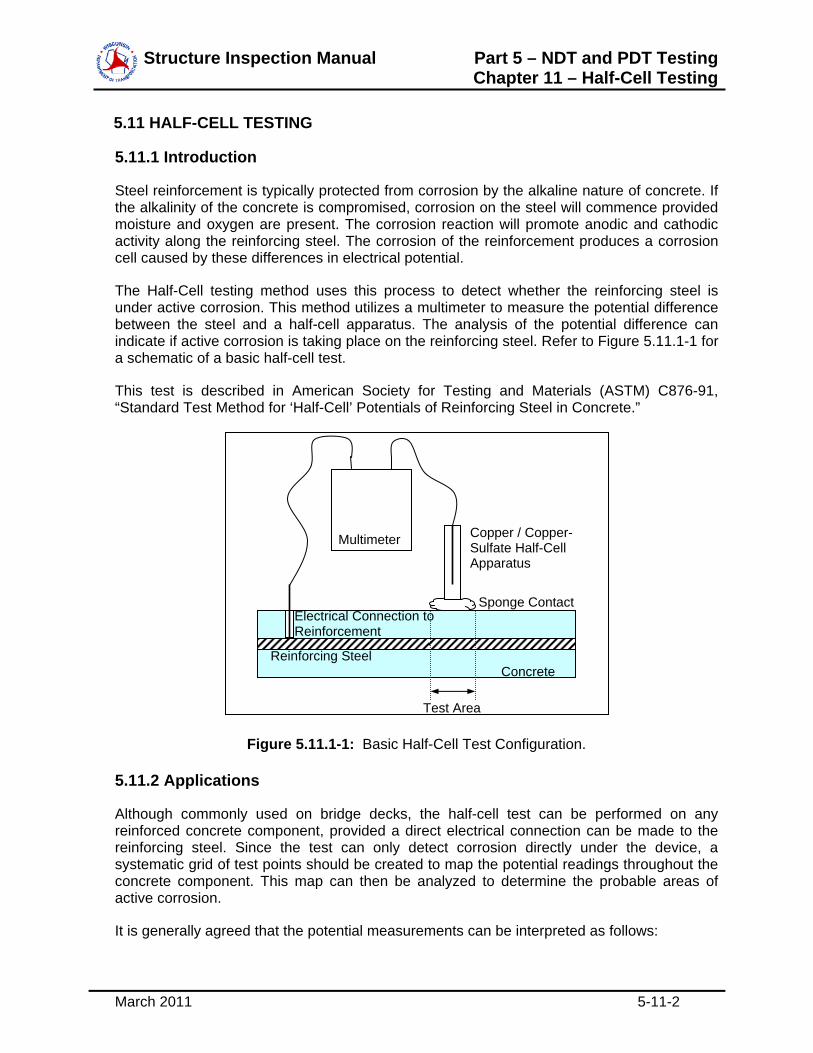
The Half-Cell testing method uses this process to detect whether the reinforcing steel is under active corrosion. This method utilizes a multimeter to measure the potential difference between the steel and a half-cell apparatus. The analysis of the potential difference can indicate if active corrosion is taking place on the reinforcing steel. Refer to Figure 5.11.1-1 for a schematic of a basic half-cell test.
This test is described in American Society for Testing and Materials (ASTM) C876-91, “Standard Test Method for ‘Half-Cell’ Potentials of Reinforcing Steel in Concrete.”
Figure 5.11.1-1: Basic Half-Cell Test Configuration.
5.11.2 Applications
Although commonly used on bridge decks, the half-cell test can be performed on any reinforced concrete component, provided a direct electrical connection can be made to the reinforcing steel. Since the test can only detect corrosion directly under the device, a systematic grid of test points should be created to map the potential readings throughout the concrete component. This map can then be analyzed to determine the probable areas of active corrosion.
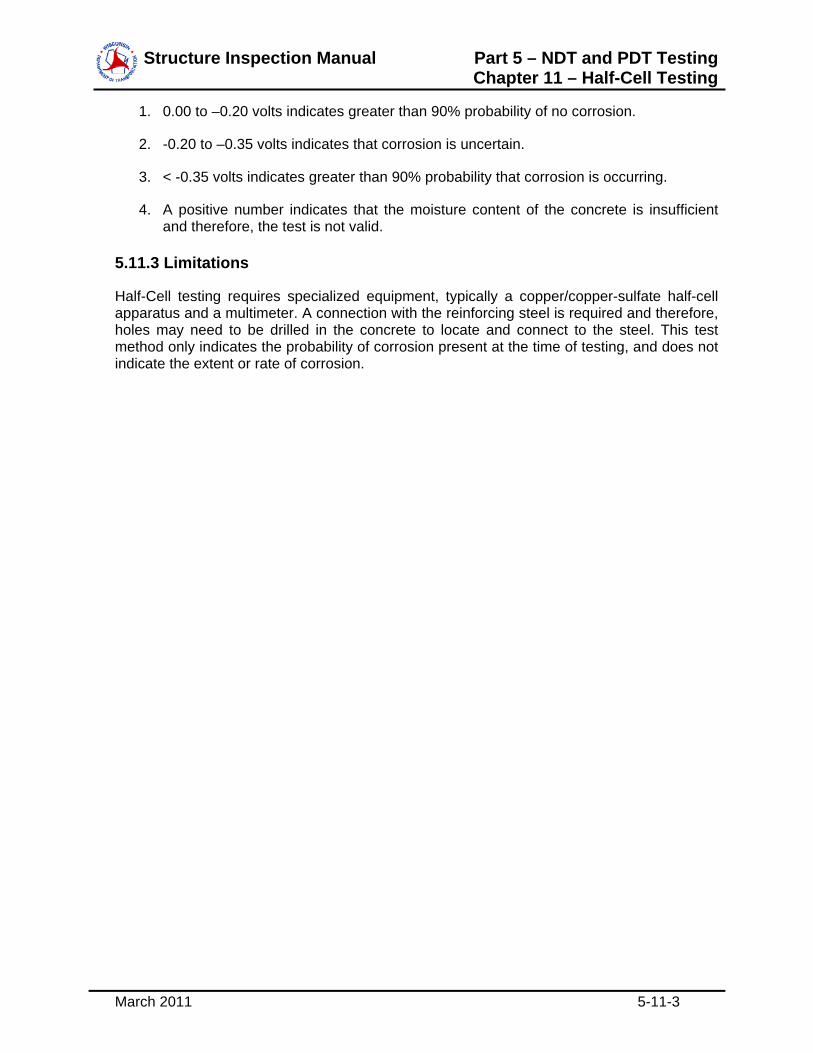
It is generally agreed that the potential measurements can be interpreted as follows:
Copper / Copper-Sulfate Half-Cell Apparatus
Concrete Reinforcing Steel
Sponge Contact Electrical Connection to Reinforcement
Multimeter
Test Area
Structure Inspection Manual Part 5 – NDT and PDT Testing Chapter 11 – Half-Cell Testing
March 2011 5-11-3
1. 0.00 to –0.20 volts indicates greater than 90% probability of no corrosion.
2. -0.20 to –0.35 volts indicates that corrosion is uncertain.
3. < -0.35 volts indicates greater than 90% probability that corrosion is occurring.
4. A positive number indicates that the moisture content of the concrete is insufficient and therefore, the test is not valid.
5.11.3 Limitations
Half-Cell testing requires specialized equipment, typically a copper/copper-sulfate half-cell apparatus and a multimeter. A connection with the reinforcing steel is required and therefore, holes may need to be drilled in the concrete to locate and connect to the steel. This test method only indicates the probability of corrosion present at the time of testing, and does not indicate the extent or rate of corrosion.

Structure Inspection Manual
[THIS PAGE INTENTIONALLY LEFT BLANK]

Structure Inspection Manual Part 5 – NDT and PDT Testing Chapter 12 – Chloride Ion Testing
March 2011 5-12-1
Table of Contents
5.12 Chloride Ion Testing ............................................................................................................ 2
5.12.1 Introduction.................................................................................................................. 2
5.12.2 Applications ................................................................................................................. 2
5.12.3 Limitations ................................................................................................................... 3
Structure Inspection Manual Part 5 – NDT and PDT Testing Chapter 12 – Chloride Ion Testing
March 2011 5-12-2
5.12 CHLORIDE ION TESTING
5.12.1 Introduction
Chloride ions are the major cause of reinforcing steel corrosion in concrete. Chloride ions are most often provided from road salt, although they may also be available as contaminants in the original concrete mix. Although present, these chloride ions are not likely to cause problems unless they exist in unusually high concentrations. Since corrosion of steel reinforcing is generally considered to begin at a chloride ion content of between 0.025 percent and 0.033 percent by weight of concrete, knowledge of chloride content can aid in determining the likelihood of the onset or presence of corrosion.
In evaluating chloride content, it is recommended that a chloride profile (chloride concentration percentage versus depth measurement below the concrete surface) be developed. This profile is important for assessing the future corrosion susceptibility of steel reinforcing and in determining the primary source of chlorides.
The chloride content in concrete is typically determined through laboratory analysis of powdered concrete samples. The powdered samples can be obtained on-site or in the laboratory. Field collected powdered samples are typically taken by drilling at different depths down to and beyond the level of the reinforcing steel. Extreme care should be exercised to avoid inadvertent contamination of the samples. Alternatively, cores can be collected and powdered samples can be obtained at different depths in the laboratory. The collection of these samples, in essence actually destroys a portion of the component making this test procedure similar to Material Sampling as described in Chapter 13 of Part 5. However, since this test can be performed in the field and results obtained quickly, it has been separated from the material sampling section.
The chloride ion content of concrete is usually measured in the laboratory using wet chemical analysis. Although laboratory testing is the most accurate, it is time consuming and often takes several weeks before results are available. As a result, field test kits have been developed. The use of field test kits allows rapid determination of chloride levels to be made on-site. Although the field kits are not as accurate as the laboratory method, they do provide good correlation with laboratory tests when a correction factor is used.
The detailed procedure for chloride sampling and testing is covered in American Association of State Transportation and Highway Officials (AASHTO) T 260-84; “Sampling and Testing for Chloride Ion in Concrete and Concrete Raw Materials” and in American Society for Testing and Materials (ASTM) C114-00; “Standard Test methods for Chemical Analysis of Hydraulic Cement.” However, both of these publications apply to testing in the laboratory, not in the field.
5.12.2 Applications
Chloride ion testing can be performed on any concrete component. Field kits allow inspectors to perform the test on-site and determine chloride levels immediately.
When samples are collected at different depths and plotted on a chloride profile chart, this method is a very useful tool in determining the depth of deck to be milled off prior to an overlay.
Structure Inspection Manual Part 5 – NDT and PDT Testing Chapter 12 – Chloride Ion Testing
March 2011 5-12-3
5.12.3 Limitations
Collecting samples to perform this test requires a portion of the concrete member be damaged and the tested area to be destroyed. Therefore, several samples can’t be taken from a single location to validate results. This method is also a time consuming process, and requires access to the member. In the case of a bridge deck, the bridge may need to be closed to traffic during the sampling process.

Structure Inspection Manual
[THIS PAGE INTENTIONALLY LEFT BLANK]
Structure Inspection Manual Part 5 – NDT and PDT Testing Chapter 13 – Material Sampling
March 2011 5-13-1
Table of Contents
5.13 Material Sampling ............................................................................................................... 2
5.13.1 Introduction.................................................................................................................. 2
5.13.2 Applications ................................................................................................................. 2
5.13.3 Limitations ................................................................................................................... 2
5.13.4 Concrete Testing ......................................................................................................... 2
5.13.5 Steel Testing ............................................................................................................... 3
5.13.6 Timber Testing ............................................................................................................ 4
Structure Inspection Manual Part 5 – NDT and PDT Testing Chapter 13 – Material Sampling
March 2011 5-13-2
5.13 MATERIAL SAMPLING
5.13.1 Introduction
To fully determine the condition of a structure, it may sometimes be necessary to extract material samples from the structure so that laboratory tests may be run to better determine the condition of the structure’s materials or states of deterioration or damage. Typical laboratory tests may include compressive tests and petrographic examination of concrete; tension tests, Charpy tests, or crack surface investigations of steel; or even simple integrity examination of timber.
Prior to obtaining any samples, the extent and purpose of the sampling must be determined. The sample size is often stipulated in the specific test methods to be used. In most cases, particularly where deterioration is present, it is advisable to take samples from both good and bad areas so that a comparison can be made. Once the number and location of samples is determined, they should be plotted on a drawing of the structure both to aid in fieldwork and serve as a record for the evaluation of the test results.
5.13.2 Applications
All materials can be sampled and tested either in the field or in a laboratory to provide useful information as to the strength, extent of deterioration, and material characteristics. Specimens should come from representative areas of the structure and typically three samples are required.
All material samples should be collected and tests conducted in accordance with applicable American Society for Testing and Materials (ASTM) and American Association of State Transportation and Highway Officials (AASHTO) methods for the respective materials.
5.13.3 Limitations
The removal of material from the structure should only be conducted when a specific piece of information is required and the information attained provides useful information in the evaluation of the structure.
The extracting of samples will leave holes or voids in the tested component and therefore, repairs are required. Concrete and timber repairs are relatively easy, but steel repairs may be more complex. Welding requires the use of experienced personnel and care should be taken to minimize any residual stresses or fatigue prone details associated with the repair.
5.13.4 Concrete Testing
Concrete material sampling most often consists of drilled cores, though sections may also be obtained by sawing or breaking off a portion of the component. The core size should be determined by the tests to be run; however, in most cases a four-inch diameter core is extracted. Core holes are normally filled with grout; other sample areas should also be repaired with a suitable mortar material. When feasible, steel reinforcement should typically be avoided unless sampling specifically requires it to be part of the core.
Structure Inspection Manual Part 5 – NDT and PDT Testing Chapter 13 – Material Sampling
March 2011 5-13-3
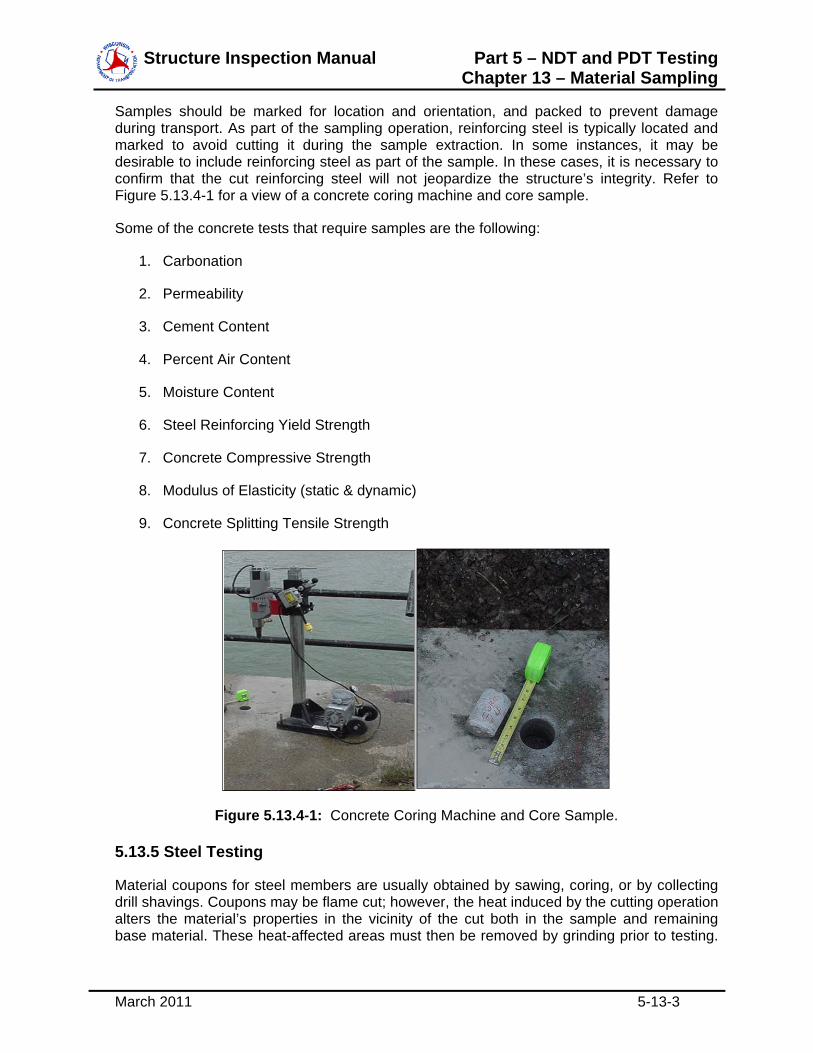
Samples should be marked for location and orientation, and packed to prevent damage during transport. As part of the sampling operation, reinforcing steel is typically located and marked to avoid cutting it during the sample extraction. In some instances, it may be desirable to include reinforcing steel as part of the sample. In these cases, it is necessary to confirm that the cut reinforcing steel will not jeopardize the structure’s integrity. Refer to Figure 5.13.4-1 for a view of a concrete coring machine and core sample.
Some of the concrete tests that require samples are the following:
1. Carbonation
2. Permeability
3. Cement Content
4. Percent Air Content
5. Moisture Content
6. Steel Reinforcing Yield Strength
7. Concrete Compressive Strength
8. Modulus of Elasticity (static & dynamic)
9. Concrete Splitting Tensile Strength
Figure 5.13.4-1: Concrete Coring Machine and Core Sample.
5.13.5 Steel Testing
Material coupons for steel members are usually obtained by sawing, coring, or by collecting drill shavings. Coupons may be flame cut; however, the heat induced by the cutting operation alters the material’s properties in the vicinity of the cut both in the sample and remaining base material. These heat-affected areas must then be removed by grinding prior to testing.
Structure Inspection Manual Part 5 – NDT and PDT Testing Chapter 13 – Material Sampling
March 2011 5-13-4
Repair to the base material is also often required. For these reasons, flame cutting should typically be avoided. In selecting coupon locations to test material properties such as yield strength or toughness, it must be remembered that the properties of steel members vary over the cross-section as a result of varying rates of heat loss due to fabrication techniques and rolling/production practices. Note that the orientation of the steel samples should be recorded prior to removal.
Some of the steel tests that require samples are the following:
1. Brinell Hardness Test
2. Charpy Impact Test.
3. Chemical Analysis
4. Tensile Strength Test
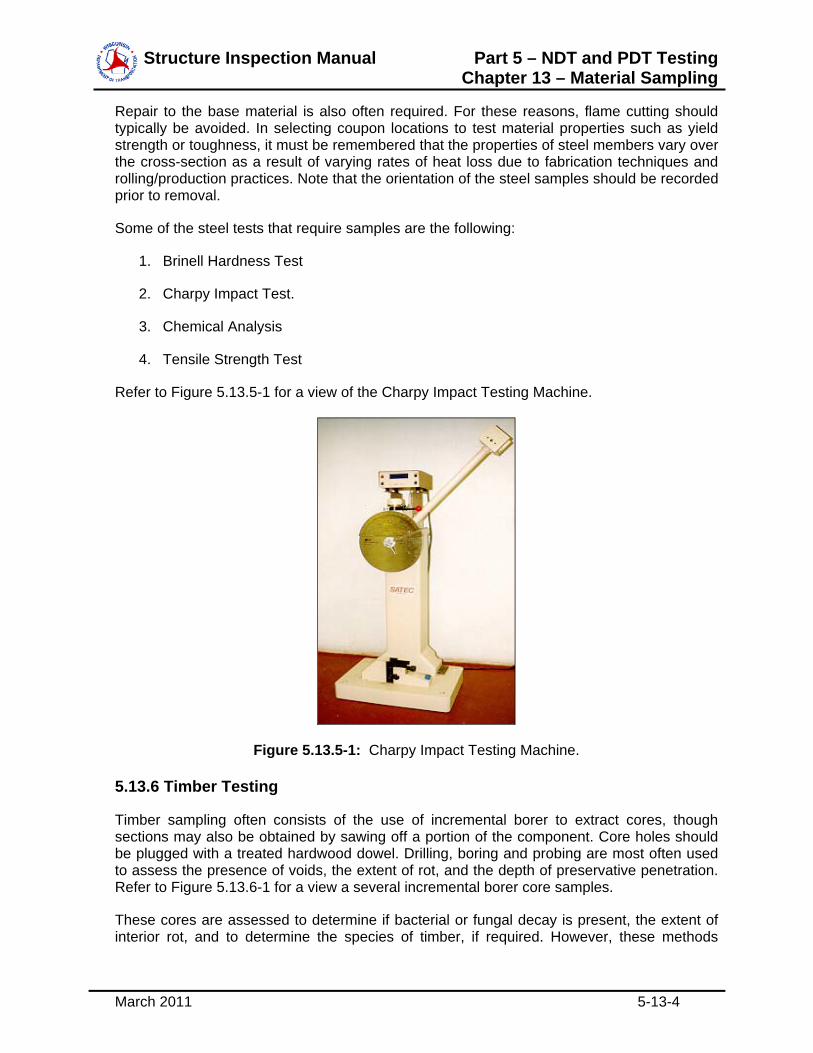
Refer to Figure 5.13.5-1 for a view of the Charpy Impact Testing Machine.
Figure 5.13.5-1: Charpy Impact Testing Machine.
5.13.6 Timber Testing
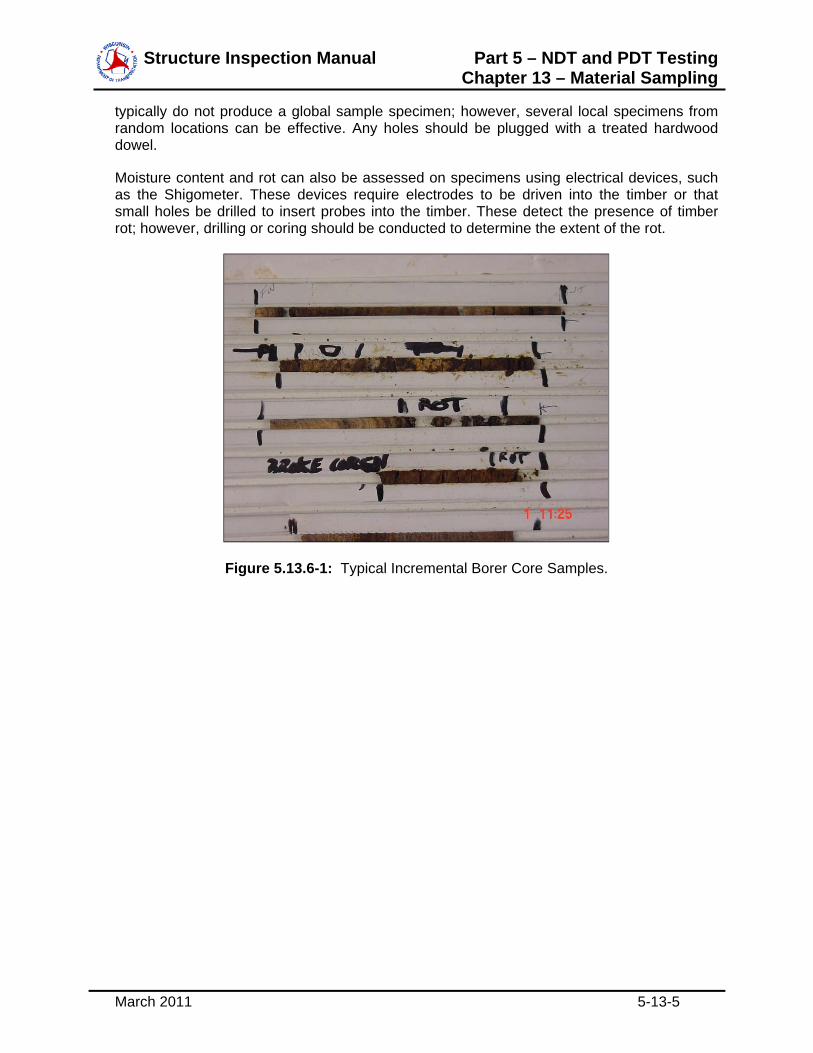
Timber sampling often consists of the use of incremental borer to extract cores, though sections may also be obtained by sawing off a portion of the component. Core holes should be plugged with a treated hardwood dowel. Drilling, boring and probing are most often used to assess the presence of voids, the extent of rot, and the depth of preservative penetration. Refer to Figure 5.13.6-1 for a view a several incremental borer core samples.
These cores are assessed to determine if bacterial or fungal decay is present, the extent of interior rot, and to determine the species of timber, if required. However, these methods
Structure Inspection Manual Part 5 – NDT and PDT Testing Chapter 13 – Material Sampling
March 2011 5-13-5
typically do not produce a global sample specimen; however, several local specimens from random locations can be effective. Any holes should be plugged with a treated hardwood dowel.
Moisture content and rot can also be assessed on specimens using electrical devices, such as the Shigometer. These devices require electrodes to be driven into the timber or that small holes be drilled to insert probes into the timber. These detect the presence of timber rot; however, drilling or coring should be conducted to determine the extent of the rot.
Figure 5.13.6-1: Typical Incremental Borer Core Samples.

Structure Inspection Manual
[THIS PAGE INTENTIONALLY LEFT BLANK]

Structure Inspection Manual Part 5 – NDT and PDT Testing Chapter 14 – Ultrasonic Testing
March 2011 5-14-1
Table of Contents
5.14 Ultrasonic Testing ............................................................................................................... 2
5.14.1 Introduction.................................................................................................................. 2
5.14.2 Applications ................................................................................................................. 4
5.14.3 Limitations ................................................................................................................... 5
Structure Inspection Manual Part 5 – NDT and PDT Testing Chapter 14 – Ultrasonic Testing
March 2011 5-14-2
5.14 ULTRASONIC TESTING
5.14.1 Introduction
Ultrasonic Testing (UT) is used to evaluate the internal (volumetric) condition of materials. Specifically, it is used to confirm suspected discontinuities or cracks, as well as check questionable material thicknesses or lengths. Typical discontinuities, which are detectable by use of UT, include laminations, surface cracks, and many surface and subsurface weld related discontinuities (lack of fusion, porosity, etc).
The use of sound to determine the internal properties of a member is not new; audible sound has been used as a nondestructive method for centuries. For instance, striking a porcelain bowl to listen for either a ring or dull tone is an old way to detect a crack. Today, shear stud connectors used for composite bridge beams are still crudely tested by striking them with a hammer and listening to the change in ringing note.
With Ultrasonic Testing, the transducer can be thought of as replacing both the hammer and ear. The transducer directs a wave of high frequency vibrations, inaudible to the human ear, into the test specimen and then receives the returning echoes. The ultrasonic instrument provides the necessary electronics to produce these waves and display the returning echoes for interpretation.
A transducer is a device that is capable of converting energy from one form to another. In the case of UT, electrical energy is changed to mechanical energy and vice versa. Ultrasonic testing transducers convert electrical energy into mechanical vibrations, which in turn produce high frequency sound waves. They also convert high frequency sound back into electrical energy upon receiving the return echoes.
The most common ultrasonic technique currently in use in the United States is called pulse echo. The pulse echo method employs short bursts, or pulses, of waves, which are transmitted into the specimen by the transducer which must be in integral contact with the specimen. Any returning unexpected echo from these pulses is evaluated for the determination of reflector location and size.
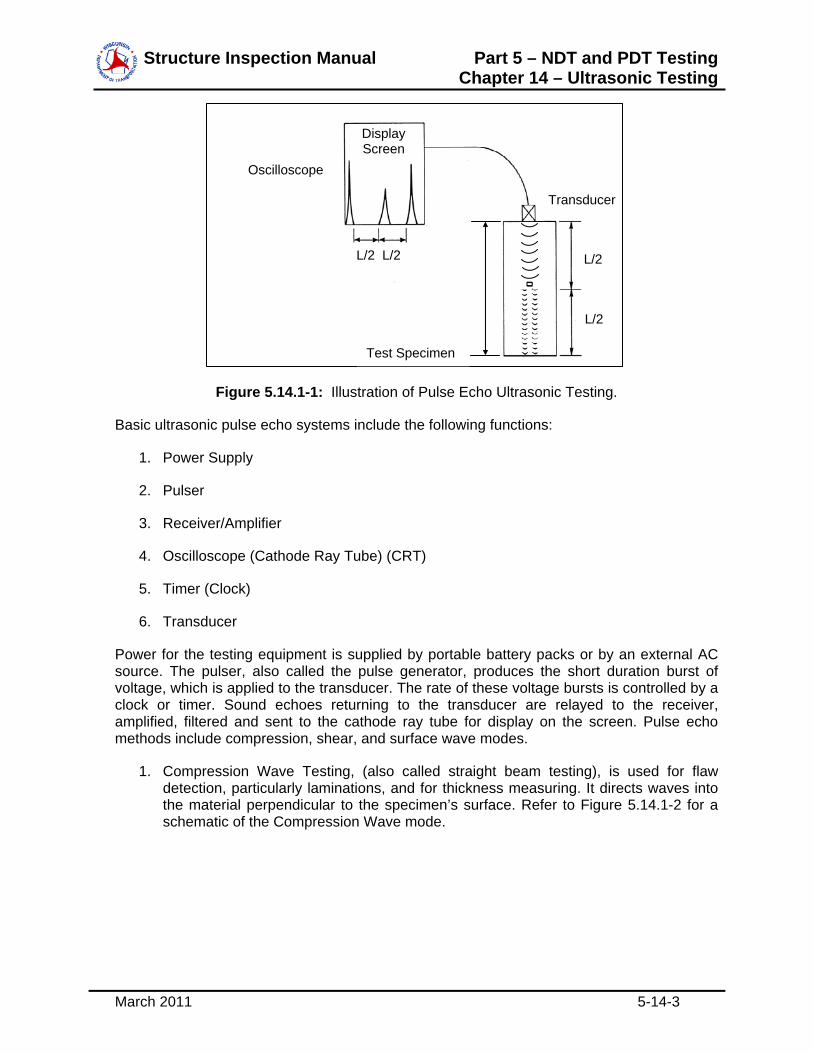
The signal height or amplitude is related to the amount of reflected sound energy. Large reflectors, causing total reflection of sound, produce signal responses of higher amplitude than smaller reflectors, which only reflect a portion of sound energy. Larger return echo amplitudes suggest larger sized flaws. Echo indications are normally retested from another position to confirm flaw size and position. Refer to Figure 5.14.1-1 for an illustration of pulse echo ultrasonic testing.
Structure Inspection Manual Part 5 – NDT and PDT Testing Chapter 14 – Ultrasonic Testing
March 2011 5-14-3
Figure 5.14.1-1: Illustration of Pulse Echo Ultrasonic Testing.
Basic ultrasonic pulse echo systems include the following functions:
1. Power Supply
2. Pulser
3. Receiver/Amplifier
4. Oscilloscope (Cathode Ray Tube) (CRT)
5. Timer (Clock)
6. Transducer
Power for the testing equipment is supplied by portable battery packs or by an external AC source. The pulser, also called the pulse generator, produces the short duration burst of voltage, which is applied to the transducer. The rate of these voltage bursts is controlled by a clock or timer. Sound echoes returning to the transducer are relayed to the receiver, amplified, filtered and sent to the cathode ray tube for display on the screen. Pulse echo methods include compression, shear, and surface wave modes.
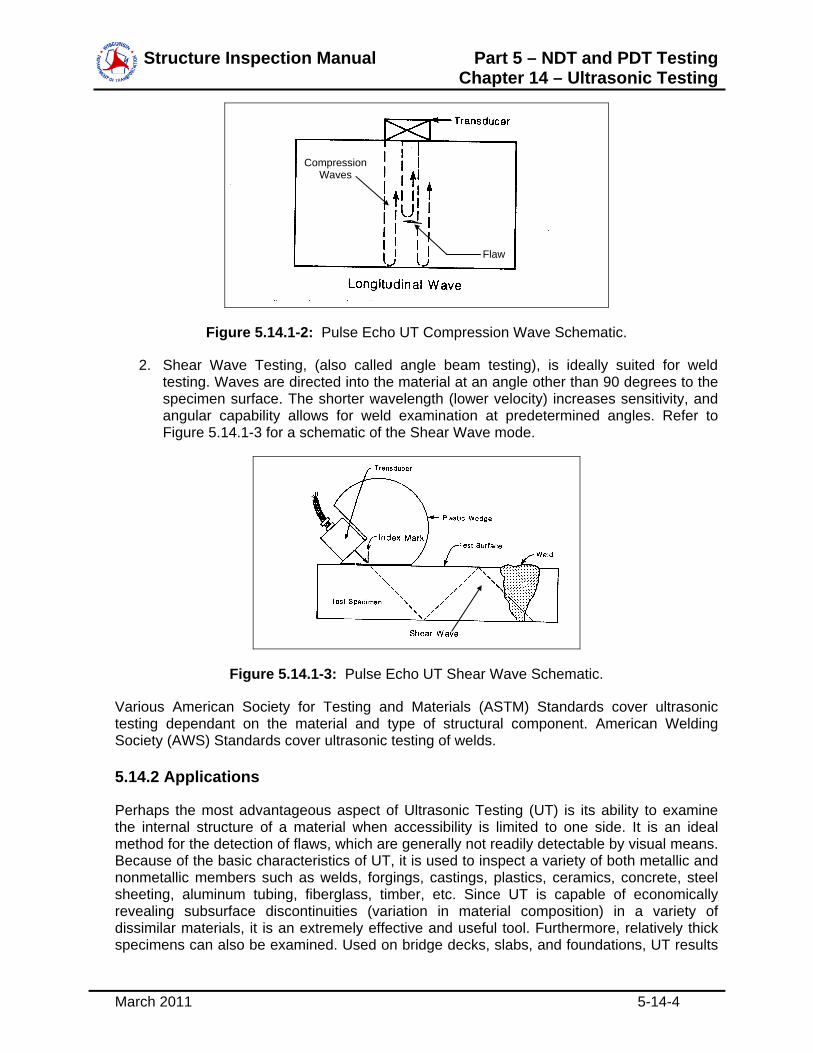
1. Compression Wave Testing, (also called straight beam testing), is used for flaw detection, particularly laminations, and for thickness measuring. It directs waves into the material perpendicular to the specimen’s surface. Refer to Figure 5.14.1-2 for a schematic of the Compression Wave mode.
Test Specimen
L/2 L/2 L/2
L/2
Transducer
Display Screen
Oscilloscope
Structure Inspection Manual Part 5 – NDT and PDT Testing Chapter 14 – Ultrasonic Testing
March 2011 5-14-4
Figure 5.14.1-2: Pulse Echo UT Compression Wave Schematic.
2. Shear Wave Testing, (also called angle beam testing), is ideally suited for weld testing. Waves are directed into the material at an angle other than 90 degrees to the specimen surface. The shorter wavelength (lower velocity) increases sensitivity, and angular capability allows for weld examination at predetermined angles. Refer to Figure 5.14.1-3 for a schematic of the Shear Wave mode.
Figure 5.14.1-3: Pulse Echo UT Shear Wave Schematic.
Various American Society for Testing and Materials (ASTM) Standards cover ultrasonic testing dependant on the material and type of structural component. American Welding Society (AWS) Standards cover ultrasonic testing of welds.
5.14.2 Applications
Perhaps the most advantageous aspect of Ultrasonic Testing (UT) is its ability to examine the internal structure of a material when accessibility is limited to one side. It is an ideal method for the detection of flaws, which are generally not readily detectable by visual means. Because of the basic characteristics of UT, it is used to inspect a variety of both metallic and nonmetallic members such as welds, forgings, castings, plastics, ceramics, concrete, steel sheeting, aluminum tubing, fiberglass, timber, etc. Since UT is capable of economically revealing subsurface discontinuities (variation in material composition) in a variety of dissimilar materials, it is an extremely effective and useful tool. Furthermore, relatively thick specimens can also be examined. Used on bridge decks, slabs, and foundations, UT results
Compression Waves
Flaw
Structure Inspection Manual Part 5 – NDT and PDT Testing Chapter 14 – Ultrasonic Testing
March 2011 5-14-5
are definitive for both bare and covered concrete decks. Penetration of asphalt thicknesses of up to 6 inches has been quite successful. Used on caissons and piles, the length and integrity of piles and caissons can be determined. Ultrasonic tests on concrete, wood, and steel piles have been generally successful to lengths of 100 inches.
UT is most successful for detecting discontinuities, which are oriented perpendicular to the direction of propagating sound. It is also often used as a complimentary method to other nondestructive testing (NDT) procedures such as radiography.
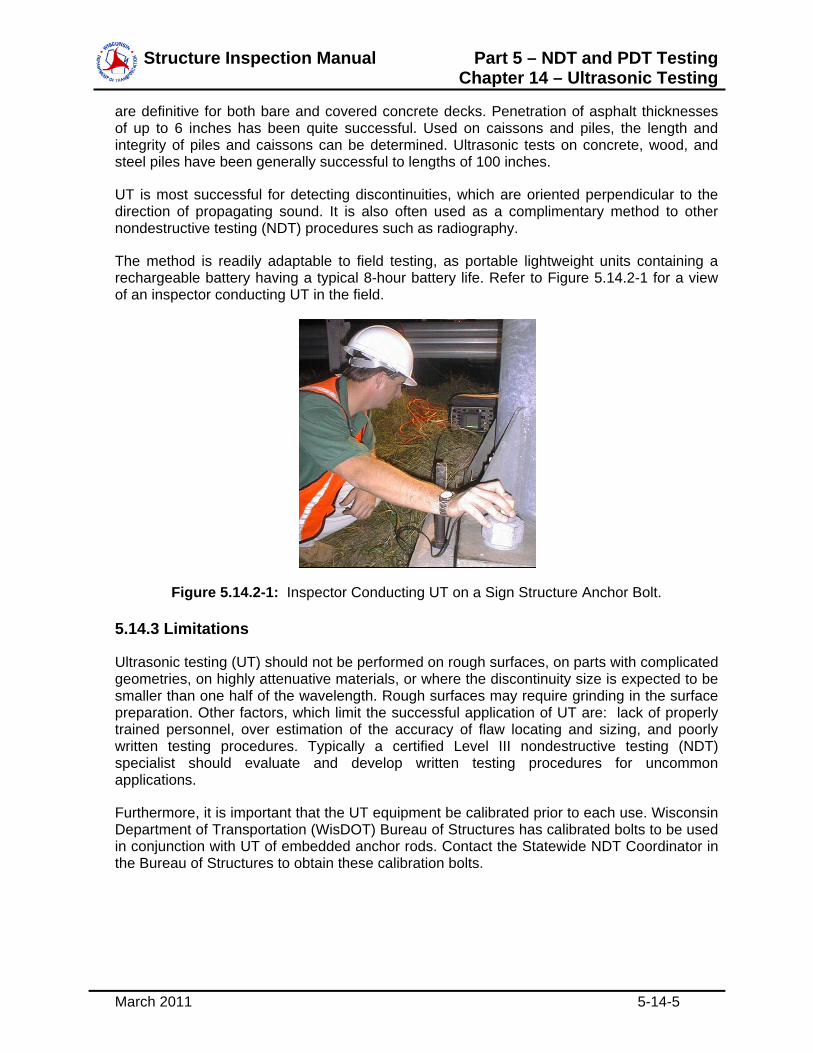
The method is readily adaptable to field testing, as portable lightweight units containing a rechargeable battery having a typical 8-hour battery life. Refer to Figure 5.14.2-1 for a view of an inspector conducting UT in the field.
Figure 5.14.2-1: Inspector Conducting UT on a Sign Structure Anchor Bolt.
5.14.3 Limitations
Ultrasonic testing (UT) should not be performed on rough surfaces, on parts with complicated geometries, on highly attenuative materials, or where the discontinuity size is expected to be smaller than one half of the wavelength. Rough surfaces may require grinding in the surface preparation. Other factors, which limit the successful application of UT are: lack of properly trained personnel, over estimation of the accuracy of flaw locating and sizing, and poorly written testing procedures. Typically a certified Level III nondestructive testing (NDT) specialist should evaluate and develop written testing procedures for uncommon applications.
Furthermore, it is important that the UT equipment be calibrated prior to each use. Wisconsin Department of Transportation (WisDOT) Bureau of Structures has calibrated bolts to be used in conjunction with UT of embedded anchor rods. Contact the Statewide NDT Coordinator in the Bureau of Structures to obtain these calibration bolts.

Structure Inspection Manual
[THIS PAGE INTENTIONALLY LEFT BLANK]
Structure Inspection Manual Part 5 – NDT and PDT Testing Chapter 15 – Liquid Penetrant
March 2011 5-15-1
Table of Contents
5.15 Liquid Penetrant .................................................................................................................. 2
5.15.1 Introduction.................................................................................................................. 2
5.15.2 Applications ................................................................................................................. 3
5.15.3 Limitations ................................................................................................................... 4
Structure Inspection Manual Part 5 – NDT and PDT Testing Chapter 15 – Liquid Penetrant
March 2011 5-15-2
5.15 LIQUID PENETRANT
5.15.1 Introduction
Liquid Penetrant Testing is used to confirm the presence of a crack or flaw. It relies on the ability of a liquid to enter into a discontinuity. Therefore it can only find discontinuities, which are open to the surface of the material. It can be applied to any material provided it is non-porous, and is not adversely affected by the penetrant material.
The basic procedure requires that the material be pre-cleaned to remove all surface contaminants and the application of a liquid (penetrating oil) to the surface being tested. The penetrant will seek out and enter small surface openings. Penetrant is then removed from the test surface by wiping or water rinsing. A drying developer is next applied. The penetrant remaining in the discontinuity bleeds out forming a highly visible, contrasting indication on the test surface.
The characteristics of a good penetrant relate to the ability of the fluid to be drawn into small openings even against gravity. This penetrating ability is affected by many variables including surface tension of the liquid, wetting ability, surface condition, surface contamination, and temperature.
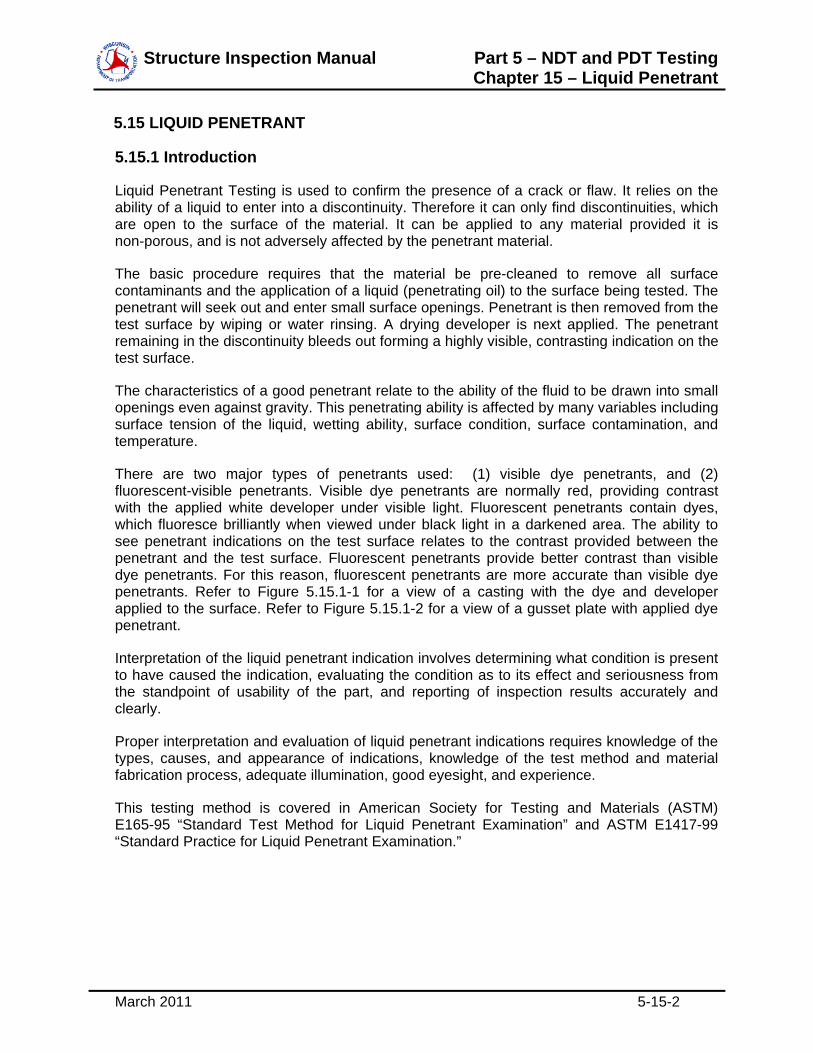
There are two major types of penetrants used: (1) visible dye penetrants, and (2) fluorescent-visible penetrants. Visible dye penetrants are normally red, providing contrast with the applied white developer under visible light. Fluorescent penetrants contain dyes, which fluoresce brilliantly when viewed under black light in a darkened area. The ability to see penetrant indications on the test surface relates to the contrast provided between the penetrant and the test surface. Fluorescent penetrants provide better contrast than visible dye penetrants. For this reason, fluorescent penetrants are more accurate than visible dye penetrants. Refer to Figure 5.15.1-1 for a view of a casting with the dye and developer applied to the surface. Refer to Figure 5.15.1-2 for a view of a gusset plate with applied dye penetrant.
Interpretation of the liquid penetrant indication involves determining what condition is present to have caused the indication, evaluating the condition as to its effect and seriousness from the standpoint of usability of the part, and reporting of inspection results accurately and clearly.
Proper interpretation and evaluation of liquid penetrant indications requires knowledge of the types, causes, and appearance of indications, knowledge of the test method and material fabrication process, adequate illumination, good eyesight, and experience.
This testing method is covered in American Society for Testing and Materials (ASTM) E165-95 “Standard Test Method for Liquid Penetrant Examination” and ASTM E1417-99 “Standard Practice for Liquid Penetrant Examination.”
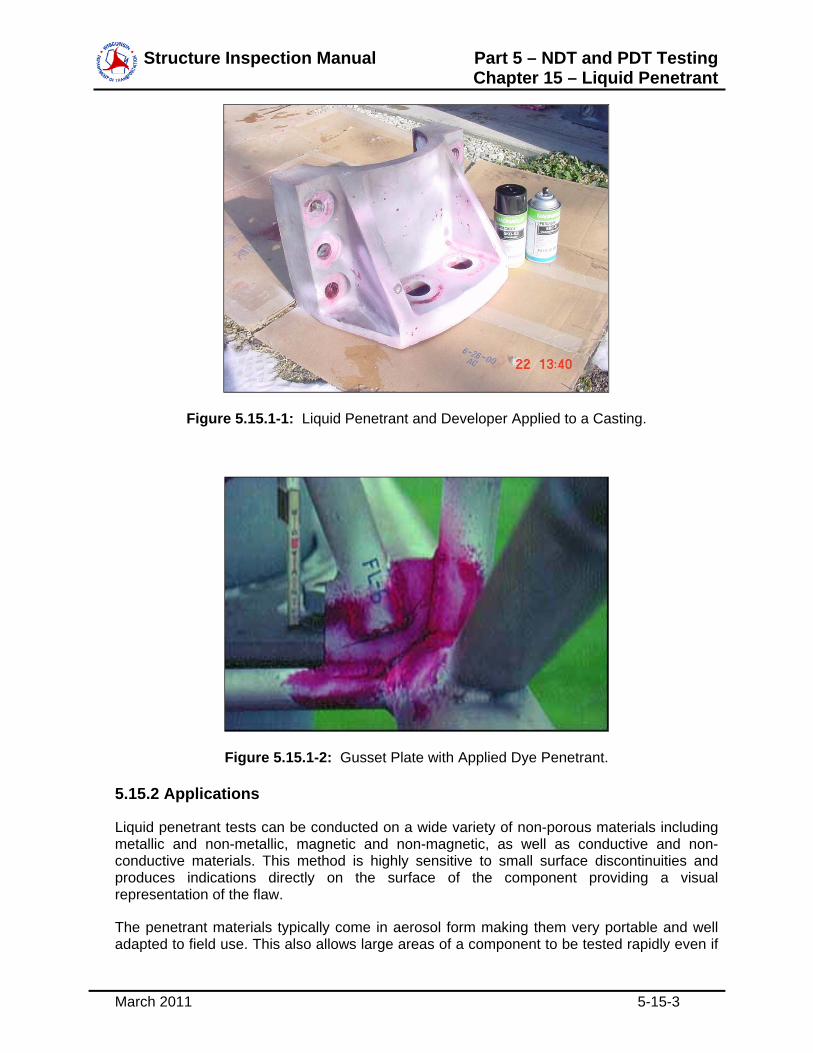
Structure Inspection Manual Part 5 – NDT and PDT Testing Chapter 15 – Liquid Penetrant
March 2011 5-15-3
Figure 5.15.1-1: Liquid Penetrant and Developer Applied to a Casting.
Figure 5.15.1-2: Gusset Plate with Applied Dye Penetrant.
5.15.2 Applications
Liquid penetrant tests can be conducted on a wide variety of non-porous materials including metallic and non-metallic, magnetic and non-magnetic, as well as conductive and non-conductive materials. This method is highly sensitive to small surface discontinuities and produces indications directly on the surface of the component providing a visual representation of the flaw.
The penetrant materials typically come in aerosol form making them very portable and well adapted to field use. This also allows large areas of a component to be tested rapidly even if
Structure Inspection Manual Part 5 – NDT and PDT Testing Chapter 15 – Liquid Penetrant
March 2011 5-15-4
the component has a complex geometric shape. Powder penetrant materials are also available, but are typically cumbersome in the field.
Finally, penetrant materials and the associated equipment are relatively inexpensive, especially when compared to most other nondestructive testing (NDT) methods.
5.15.3 Limitations
Liquid penetrant testing does have several limitations. This method only works on non-porous materials. Also, surface finish and roughness can affect the sensitivity of the test.
It can only detect discontinuities which are open to the surface. Discontinuities filled with contaminants, paint, rust, oxidation, or corrosion products may not be detected. Therefore, pre-cleaning is critical. The process also requires multiple steps of cleaning, applying the dye/fluorescent, cleaning off the dye/fluorescent, applying the developer, and cleaning off the developer after the test is completed. This effort requires the safe handling of chemicals and the proper disposal of saturated cleaning rags and empty aerosol cans.
Finally, the test sensitivity is lowered at reduced temperatures since crack widths are typically reduced and the test medium is less fluid.
Structure Inspection Manual Part 5 – NDT and PDT Testing Chapter 16 – Magnetic Particle
March 2011 5-16-1
Table of Contents
5.16 Magnetic Particle ................................................................................................................ 2
5.16.1 Introduction.................................................................................................................. 2
5.16.2 Applications ................................................................................................................. 4
5.16.3 Limitations ................................................................................................................... 6
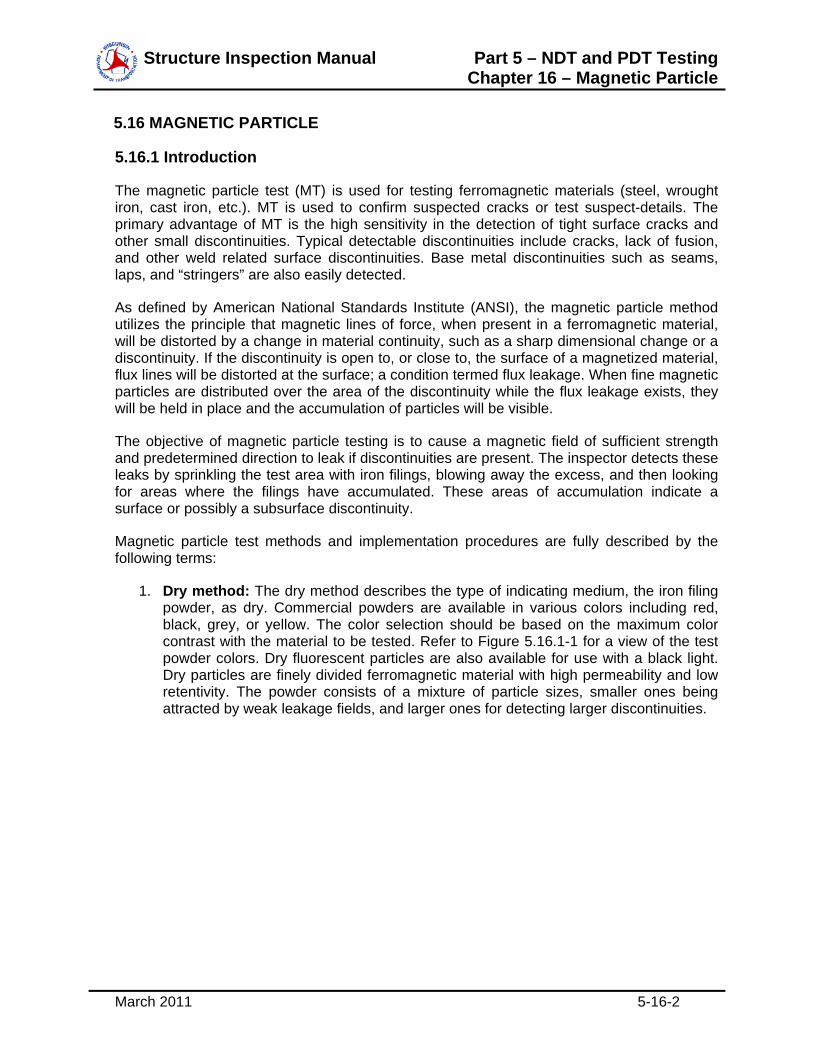
Structure Inspection Manual Part 5 – NDT and PDT Testing Chapter 16 – Magnetic Particle
March 2011 5-16-2
5.16 MAGNETIC PARTICLE
5.16.1 Introduction
The magnetic particle test (MT) is used for testing ferromagnetic materials (steel, wrought iron, cast iron, etc.). MT is used to confirm suspected cracks or test suspect-details. The primary advantage of MT is the high sensitivity in the detection of tight surface cracks and other small discontinuities. Typical detectable discontinuities include cracks, lack of fusion, and other weld related surface discontinuities. Base metal discontinuities such as seams, laps, and “stringers” are also easily detected.
As defined by American National Standards Institute (ANSI), the magnetic particle method utilizes the principle that magnetic lines of force, when present in a ferromagnetic material, will be distorted by a change in material continuity, such as a sharp dimensional change or a discontinuity. If the discontinuity is open to, or close to, the surface of a magnetized material, flux lines will be distorted at the surface; a condition termed flux leakage. When fine magnetic particles are distributed over the area of the discontinuity while the flux leakage exists, they will be held in place and the accumulation of particles will be visible.
The objective of magnetic particle testing is to cause a magnetic field of sufficient strength and predetermined direction to leak if discontinuities are present. The inspector detects these leaks by sprinkling the test area with iron filings, blowing away the excess, and then looking for areas where the filings have accumulated. These areas of accumulation indicate a surface or possibly a subsurface discontinuity.
Magnetic particle test methods and implementation procedures are fully described by the following terms:
1. Dry method: The dry method describes the type of indicating medium, the iron filing powder, as dry. Commercial powders are available in various colors including red, black, grey, or yellow. The color selection should be based on the maximum color contrast with the material to be tested. Refer to Figure 5.16.1-1 for a view of the test powder colors. Dry fluorescent particles are also available for use with a black light. Dry particles are finely divided ferromagnetic material with high permeability and low retentivity. The powder consists of a mixture of particle sizes, smaller ones being attracted by weak leakage fields, and larger ones for detecting larger discontinuities.
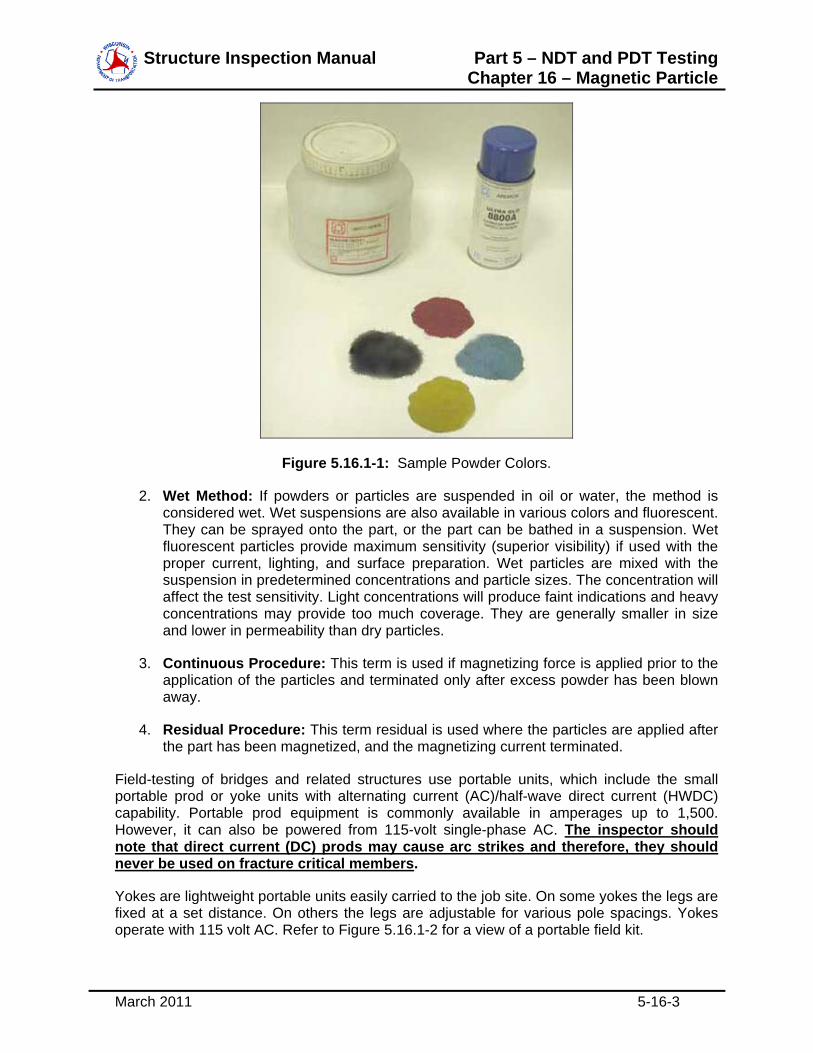
Structure Inspection Manual Part 5 – NDT and PDT Testing Chapter 16 – Magnetic Particle
March 2011 5-16-3
Figure 5.16.1-1: Sample Powder Colors.
2. Wet Method: If powders or particles are suspended in oil or water, the method is considered wet. Wet suspensions are also available in various colors and fluorescent. They can be sprayed onto the part, or the part can be bathed in a suspension. Wet fluorescent particles provide maximum sensitivity (superior visibility) if used with the proper current, lighting, and surface preparation. Wet particles are mixed with the suspension in predetermined concentrations and particle sizes. The concentration will affect the test sensitivity. Light concentrations will produce faint indications and heavy concentrations may provide too much coverage. They are generally smaller in size and lower in permeability than dry particles.
3. Continuous Procedure: This term is used if magnetizing force is applied prior to the application of the particles and terminated only after excess powder has been blown away.
4. Residual Procedure: This term residual is used where the particles are applied after the part has been magnetized, and the magnetizing current terminated.
Field-testing of bridges and related structures use portable units, which include the small portable prod or yoke units with alternating current (AC)/half-wave direct current (HWDC) capability. Portable prod equipment is commonly available in amperages up to 1,500. However, it can also be powered from 115-volt single-phase AC. The inspector should note that direct current (DC) prods may cause arc strikes and therefore, they should never be used on fracture critical members.
Yokes are lightweight portable units easily carried to the job site. On some yokes the legs are fixed at a set distance. On others the legs are adjustable for various pole spacings. Yokes operate with 115 volt AC. Refer to Figure 5.16.1-2 for a view of a portable field kit.
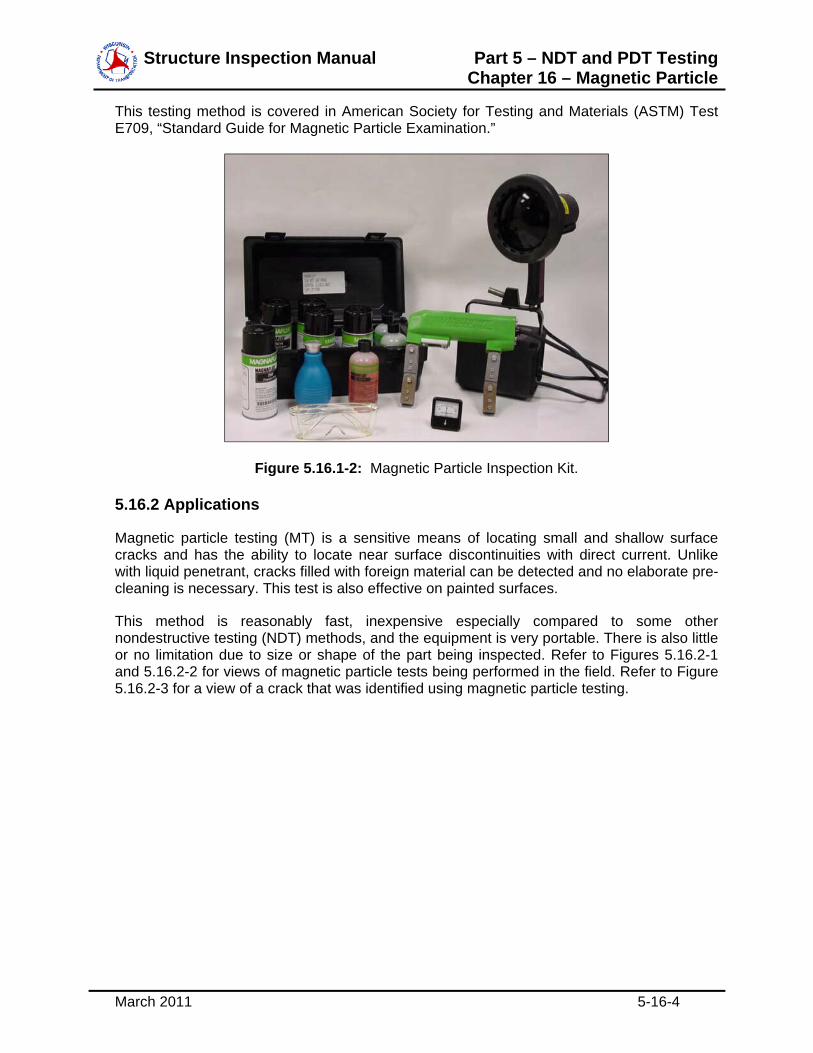
Structure Inspection Manual Part 5 – NDT and PDT Testing Chapter 16 – Magnetic Particle
March 2011 5-16-4
This testing method is covered in American Society for Testing and Materials (ASTM) Test E709, “Standard Guide for Magnetic Particle Examination.”
Figure 5.16.1-2: Magnetic Particle Inspection Kit.
5.16.2 Applications
Magnetic particle testing (MT) is a sensitive means of locating small and shallow surface cracks and has the ability to locate near surface discontinuities with direct current. Unlike with liquid penetrant, cracks filled with foreign material can be detected and no elaborate pre-cleaning is necessary. This test is also effective on painted surfaces.
This method is reasonably fast, inexpensive especially compared to some other nondestructive testing (NDT) methods, and the equipment is very portable. There is also little or no limitation due to size or shape of the part being inspected. Refer to Figures 5.16.2-1 and 5.16.2-2 for views of magnetic particle tests being performed in the field. Refer to Figure 5.16.2-3 for a view of a crack that was identified using magnetic particle testing.
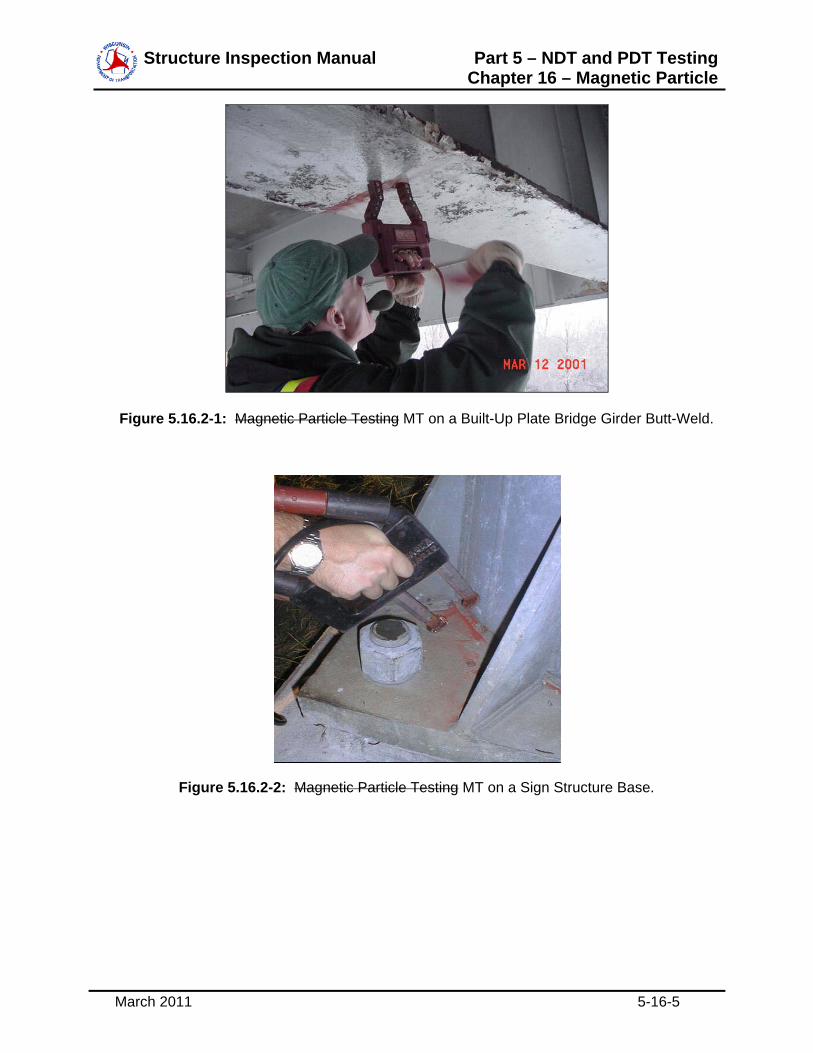
Structure Inspection Manual Part 5 – NDT and PDT Testing Chapter 16 – Magnetic Particle
March 2011 5-16-5
Figure 5.16.2-1: Magnetic Particle Testing MT on a Built-Up Plate Bridge Girder Butt-Weld.
Figure 5.16.2-2: Magnetic Particle Testing MT on a Sign Structure Base.
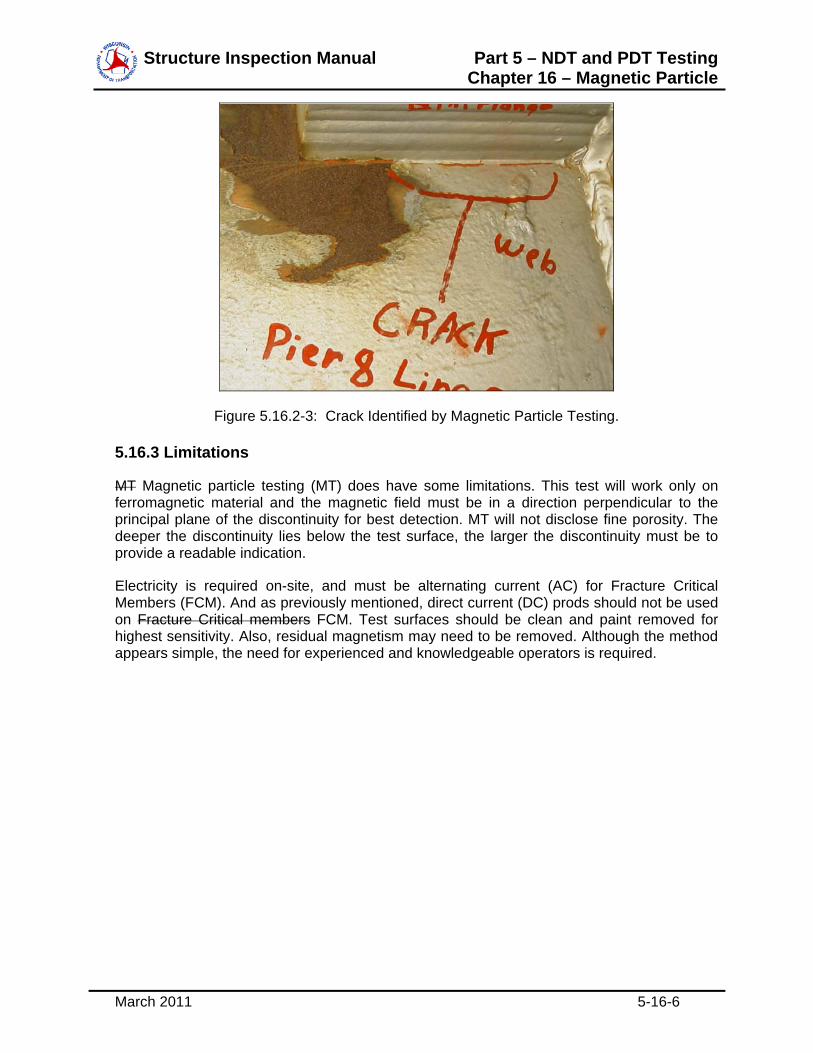
Structure Inspection Manual Part 5 – NDT and PDT Testing Chapter 16 – Magnetic Particle
March 2011 5-16-6
Figure 5.16.2-3: Crack Identified by Magnetic Particle Testing.
5.16.3 Limitations
MT Magnetic particle testing (MT) does have some limitations. This test will work only on ferromagnetic material and the magnetic field must be in a direction perpendicular to the principal plane of the discontinuity for best detection. MT will not disclose fine porosity. The deeper the discontinuity lies below the test surface, the larger the discontinuity must be to provide a readable indication.
Electricity is required on-site, and must be alternating current (AC) for Fracture Critical Members (FCM). And as previously mentioned, direct current (DC) prods should not be used on Fracture Critical members FCM. Test surfaces should be clean and paint removed for highest sensitivity. Also, residual magnetism may need to be removed. Although the method appears simple, the need for experienced and knowledgeable operators is required.

Structure Inspection Manual Part 5 – NDT and PDT Testing Chapter 17 – Monitoring Systems
March 2011 5-17-1
Table of Contents
5.17 Monitoring Systems ............................................................................................................ 2
5.17.1 Introduction.................................................................................................................. 2
5.17.2 Applications ................................................................................................................. 4
5.17.3 Limitations ................................................................................................................... 5
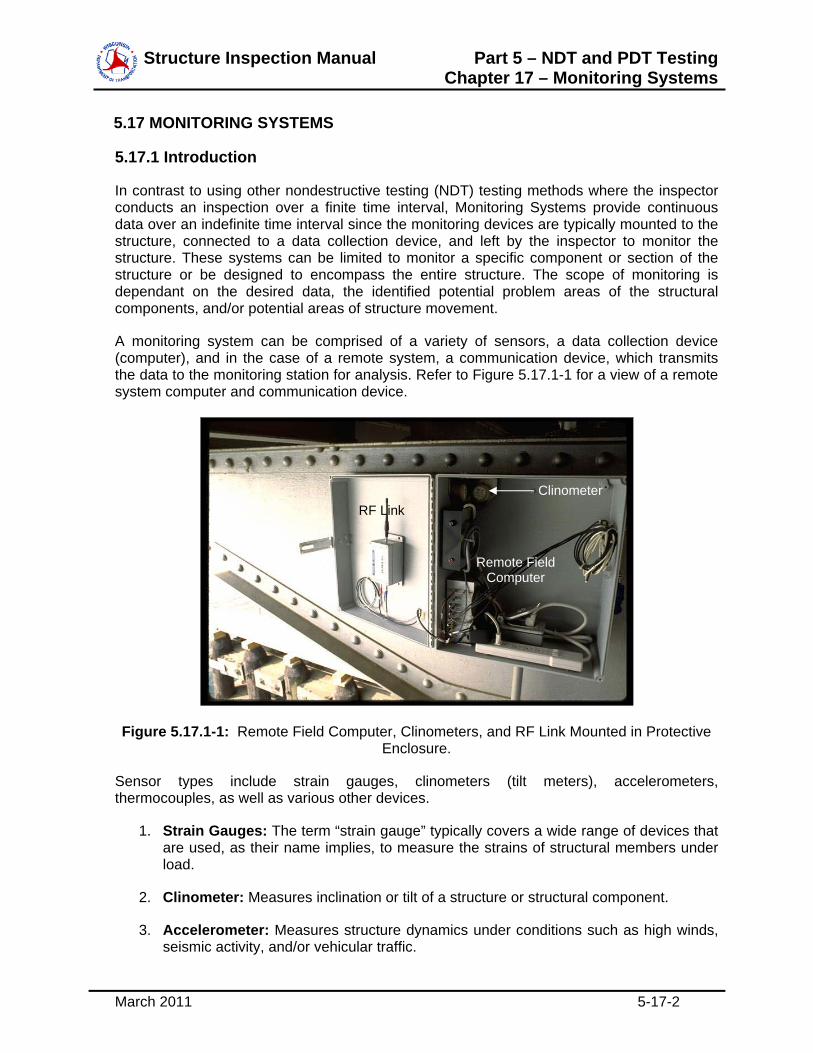
Structure Inspection Manual Part 5 – NDT and PDT Testing Chapter 17 – Monitoring Systems
March 2011 5-17-2
5.17 MONITORING SYSTEMS
5.17.1 Introduction
In contrast to using other nondestructive testing (NDT) testing methods where the inspector conducts an inspection over a finite time interval, Monitoring Systems provide continuous data over an indefinite time interval since the monitoring devices are typically mounted to the structure, connected to a data collection device, and left by the inspector to monitor the structure. These systems can be limited to monitor a specific component or section of the structure or be designed to encompass the entire structure. The scope of monitoring is dependant on the desired data, the identified potential problem areas of the structural components, and/or potential areas of structure movement.
A monitoring system can be comprised of a variety of sensors, a data collection device (computer), and in the case of a remote system, a communication device, which transmits the data to the monitoring station for analysis. Refer to Figure 5.17.1-1 for a view of a remote system computer and communication device.
Figure 5.17.1-1: Remote Field Computer, Clinometers, and RF Link Mounted in Protective Enclosure.
Sensor types include strain gauges, clinometers (tilt meters), accelerometers, thermocouples, as well as various other devices.
1. Strain Gauges: The term “strain gauge” typically covers a wide range of devices that are used, as their name implies, to measure the strains of structural members under load.
2. Clinometer: Measures inclination or tilt of a structure or structural component.
3. Accelerometer: Measures structure dynamics under conditions such as high winds, seismic activity, and/or vehicular traffic.
Clinometer RF Link
Remote Field Computer
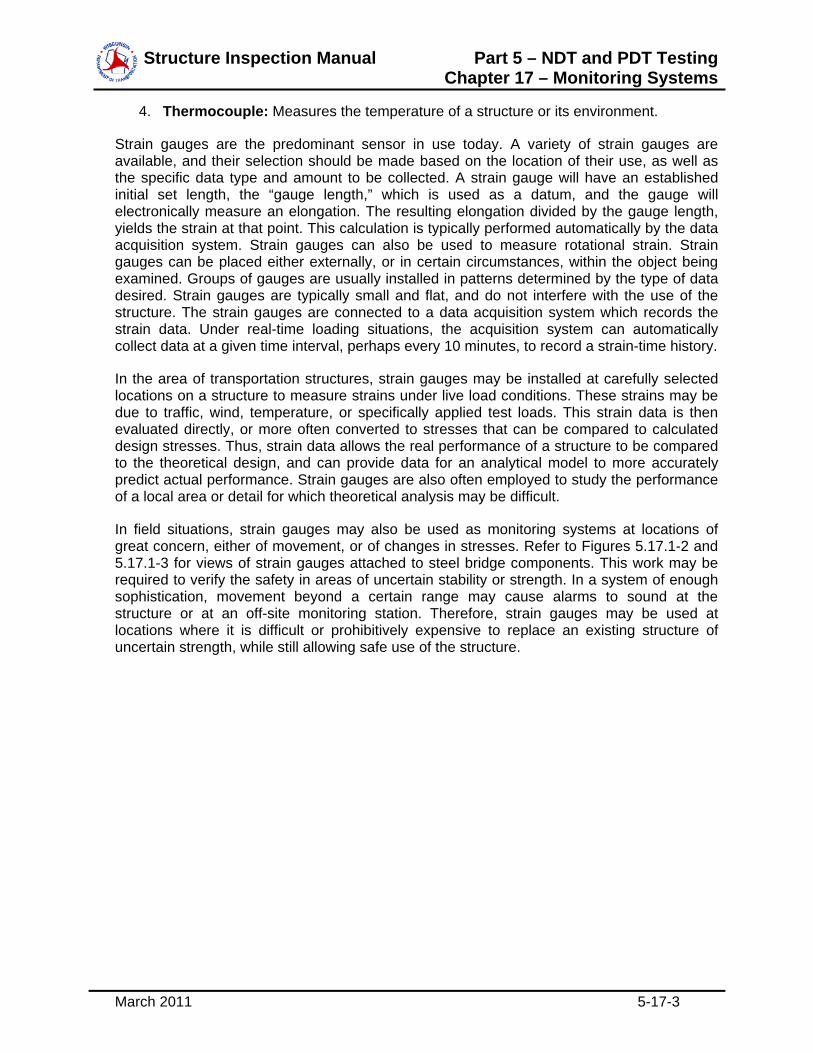
Structure Inspection Manual Part 5 – NDT and PDT Testing Chapter 17 – Monitoring Systems
March 2011 5-17-3
4. Thermocouple: Measures the temperature of a structure or its environment.
Strain gauges are the predominant sensor in use today. A variety of strain gauges are available, and their selection should be made based on the location of their use, as well as the specific data type and amount to be collected. A strain gauge will have an established initial set length, the “gauge length,” which is used as a datum, and the gauge will electronically measure an elongation. The resulting elongation divided by the gauge length, yields the strain at that point. This calculation is typically performed automatically by the data acquisition system. Strain gauges can also be used to measure rotational strain. Strain gauges can be placed either externally, or in certain circumstances, within the object being examined. Groups of gauges are usually installed in patterns determined by the type of data desired. Strain gauges are typically small and flat, and do not interfere with the use of the structure. The strain gauges are connected to a data acquisition system which records the strain data. Under real-time loading situations, the acquisition system can automatically collect data at a given time interval, perhaps every 10 minutes, to record a strain-time history.
In the area of transportation structures, strain gauges may be installed at carefully selected locations on a structure to measure strains under live load conditions. These strains may be due to traffic, wind, temperature, or specifically applied test loads. This strain data is then evaluated directly, or more often converted to stresses that can be compared to calculated design stresses. Thus, strain data allows the real performance of a structure to be compared to the theoretical design, and can provide data for an analytical model to more accurately predict actual performance. Strain gauges are also often employed to study the performance of a local area or detail for which theoretical analysis may be difficult.
In field situations, strain gauges may also be used as monitoring systems at locations of great concern, either of movement, or of changes in stresses. Refer to Figures 5.17.1-2 and 5.17.1-3 for views of strain gauges attached to steel bridge components. This work may be required to verify the safety in areas of uncertain stability or strength. In a system of enough sophistication, movement beyond a certain range may cause alarms to sound at the structure or at an off-site monitoring station. Therefore, strain gauges may be used at locations where it is difficult or prohibitively expensive to replace an existing structure of uncertain strength, while still allowing safe use of the structure.
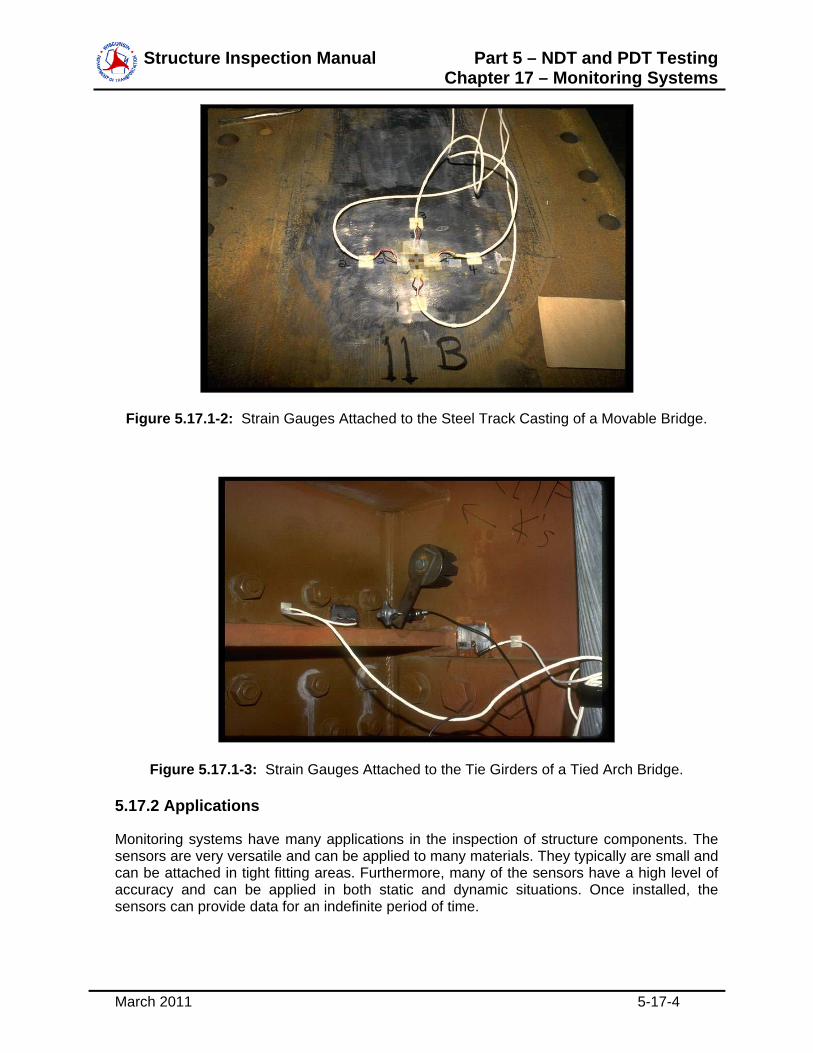
Structure Inspection Manual Part 5 – NDT and PDT Testing Chapter 17 – Monitoring Systems
March 2011 5-17-4
Figure 5.17.1-2: Strain Gauges Attached to the Steel Track Casting of a Movable Bridge.
Figure 5.17.1-3: Strain Gauges Attached to the Tie Girders of a Tied Arch Bridge.
5.17.2 Applications
Monitoring systems have many applications in the inspection of structure components. The sensors are very versatile and can be applied to many materials. They typically are small and can be attached in tight fitting areas. Furthermore, many of the sensors have a high level of accuracy and can be applied in both static and dynamic situations. Once installed, the sensors can provide data for an indefinite period of time.
Structure Inspection Manual Part 5 – NDT and PDT Testing Chapter 17 – Monitoring Systems
March 2011 5-17-5
The ability to continuously monitor structures or specific components, allows the owner to record and clearly observe the performance and detect deterioration. These systems work well from a preventative maintenance stance.
5.17.3 Limitations
Monitoring systems; however, do have some limitations. The sensors, although typically inexpensive, are often one-time use devices. Once mounted to a particular structure they cannot be removed and reused for another application. The sensors also typically require a high level of expertise to install.
The data collection and transmission devices, on the other hand, can be expensive and require specialized individuals to maintain and process the data. The gathered data must also be analyzed and manipulated to provide useable information.

Structure Inspection Manual
[THIS PAGE INTENTIONALLY LEFT BLANK]
Structure Inspection Manual Part 5 – NDT and PDT Testing Chapter 18 – Unknown Foundation Investigation
March 2011 5-18-1
Table of Contents
5.18 Unknown Foundation Investigation ..................................................................................... 2
5.18.1 Introduction.................................................................................................................. 2
5.18.2 Applications ................................................................................................................. 4
5.18.3 Limitations ................................................................................................................... 5
Structure Inspection Manual Part 5 – NDT and PDT Testing Chapter 18 – Unknown Foundation Investigation
March 2011 5-18-2
5.18 UNKNOWN FOUNDATION INVESTIGATION
5.18.1 Introduction
It is estimated that approximately one-fifth of the bridges on the National Bridge Inventory (NBI) have unknown foundations in terms of the type and/or depth. A large number of older non-federal-aid and to a lesser extent federal-aid bridges do not have any design or as-built plans on file to document the type, depth, geometry, or materials incorporated into their foundations. These bridges with unknown foundations pose a potential problem from a scour safety perspective. Since the undermining of bridge foundations poses a risk to the public safety, it is crucial to evaluate all bridges over or near water and determine their susceptibility to scour. In addition to scour concerns, unknown foundations are also a concern when a bridge is considered for improvements.
The evaluation of unknown foundations can be conducted either by conventional methods, such as physically disruptive excavation, coring, or boring methods, as well as less invasive nondestructive testing (NDT) methods. Conventional methods are typically considered to be expensive, destructive, and limited in their application. Therefore, research emphasis has recently been placed on NDT methods that can inexpensively and reliably determine the foundation properties.
The items important in the evaluation of these unknown foundations are:
1. Foundation Depth – the bottom elevation of the footing, piles, or combined system.
2. Foundation Type – shallow (footings), deep (piles or shafts), or a combined system.
3. Foundation Geometry – buried substructure dimensions, pile locations, etc.
4. Foundation Materials – steel, timber, concrete, masonry, etc.
5. Foundation Integrity – condition state of foundation materials.
The foundation depth and type, if unknown, are considered to be the most critical pieces of information in a scour evaluation. The foundation geometry, materials, and integrity are frequently desired when improvements are being considered near or to a structure.
In determining which NDT methods might be useful, the ability of the method to detect and to delineate the foundation components from the surrounding environment is often the deciding factor. The subsurface environment typically consists of a mixture of air, water, riprap materials, soil, and/or rock. Thus, the method needs to consider the wide range of substructure, geological, and hydrological conditions at a particular structure site.
The NDT methods used for unknown foundation investigation can be categorized into either Surface Methods or Borehole Methods. Surface methods are generally less invasive since they do not require soil disruption like borehole methods. Although the following list provides a brief sample of applicable methods, the inspector should be aware that other methods are also currently being researched and implemented.
Currently used Surface Methods include:
Structure Inspection Manual Part 5 – NDT and PDT Testing Chapter 18 – Unknown Foundation Investigation
March 2011 5-18-3
1. Sonic Echo/Impulse Response (SE/IR) Test: The source and receiver are placed on the top and/or sides of the exposed pile or columnar shaped substructure. The depth of the reflector is calculated using the identified echo time(s) for SE tests, or resonant peaks for IR tests.
2. Bending Wave Test: Two horizontal receivers are mounted a few feet apart on one side of an exposed pile and then the pile is impacted horizontally on the opposite side a few feet above the topmost receiver. This method is based on the dispersion characteristics and echoes of bending waves traveling along very slender member like piles.
3. Ultraseismic Test (UST): An exposed substructure is impacted with an impulse hammer to generate and record the travel of compression or flexural waves down and up the substructure at multiple receiver locations.
4. Spectral Analysis of Surface Waves (SASW) Test: This involves determining the variation of surface wave velocity verses depth in layered systems. The bottom depths of exposed substructures or footings are indicated by slower velocities of surface wave travel in underlying soils.
5. Ground Penetrating Radar (GPR): This method uses a radio frequency signal that is transmitted into the subsurface and records the reflection echoes from the concrete/soil interface to determine the unknown depth.
Currently used Borehole Methods include:
1. Parallel Seismic Test: An exposed foundation substructure is impacted either vertically or horizontally with an impulse hammer to generate compression or flexural waves that travel down the foundation and are reflected by the surrounding soil. The reflected compression wave arrival is tracked at regular intervals by either a hydrophone receiver or geophone receiver.
2. Borehole Radar Test: A transmitter/receiver radar antenna is used to measure the reflection of radar echoes from the side of the substructure foundation.
3. Induction Field: A magnetic field is induced around the steel of the pile or reinforced concrete foundation. The field strength will decrease significantly below the bottoms of the foundation.
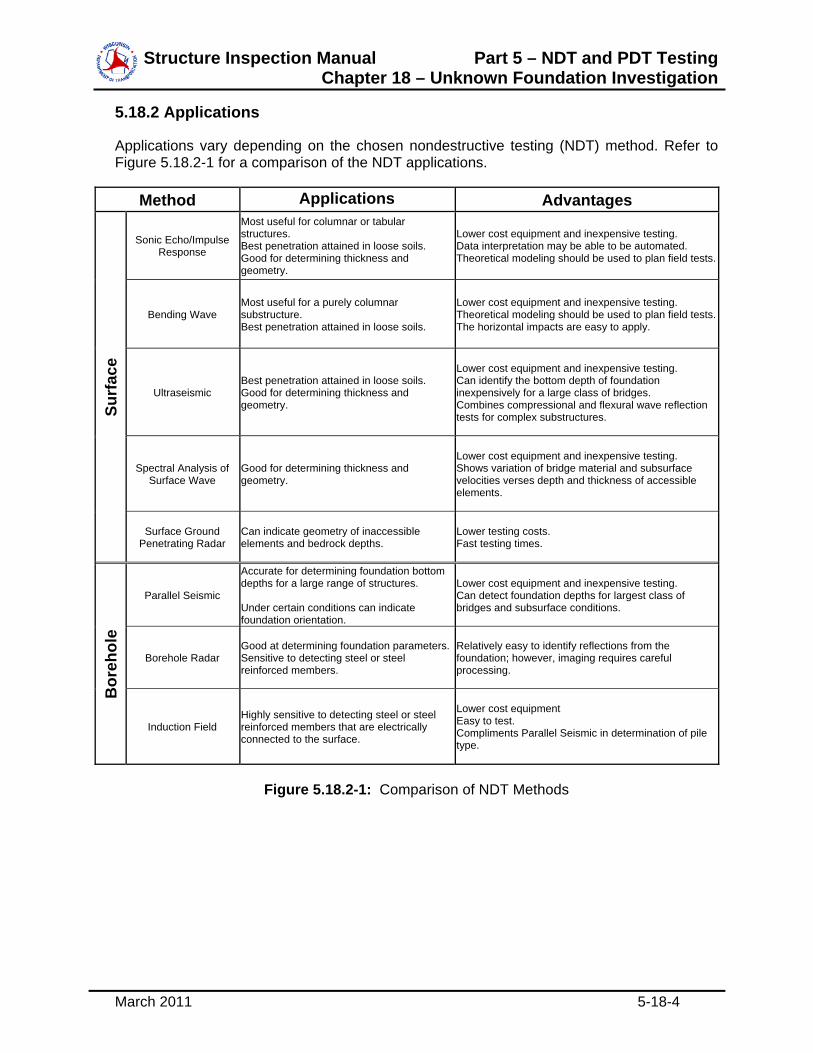
Structure Inspection Manual Part 5 – NDT and PDT Testing Chapter 18 – Unknown Foundation Investigation
March 2011 5-18-4
5.18.2 Applications
Applications vary depending on the chosen nondestructive testing (NDT) method. Refer to Figure 5.18.2-1 for a comparison of the NDT applications.
Figure 5.18.2-1: Comparison of NDT Methods
Method Applications Advantages
Surf
ace
Sonic Echo/Impulse Response
Most useful for columnar or tabular structures. Best penetration attained in loose soils. Good for determining thickness and geometry.
Lower cost equipment and inexpensive testing. Data interpretation may be able to be automated. Theoretical modeling should be used to plan field tests.
Bending Wave Most useful for a purely columnar substructure. Best penetration attained in loose soils.
Lower cost equipment and inexpensive testing. Theoretical modeling should be used to plan field tests.The horizontal impacts are easy to apply.
Ultraseismic Best penetration attained in loose soils. Good for determining thickness and geometry.
Lower cost equipment and inexpensive testing. Can identify the bottom depth of foundation inexpensively for a large class of bridges. Combines compressional and flexural wave reflection tests for complex substructures.
Spectral Analysis of Surface Wave
Good for determining thickness and geometry.
Lower cost equipment and inexpensive testing. Shows variation of bridge material and subsurface velocities verses depth and thickness of accessible elements.
Surface Ground Penetrating Radar
Can indicate geometry of inaccessible elements and bedrock depths.
Lower testing costs. Fast testing times.
Bor
ehol
e
Parallel Seismic
Accurate for determining foundation bottom depths for a large range of structures. Under certain conditions can indicate foundation orientation.
Lower cost equipment and inexpensive testing. Can detect foundation depths for largest class of bridges and subsurface conditions.
Borehole Radar Good at determining foundation parameters.Sensitive to detecting steel or steel reinforced members.
Relatively easy to identify reflections from the foundation; however, imaging requires careful processing.
Induction Field Highly sensitive to detecting steel or steel reinforced members that are electrically connected to the surface.
Lower cost equipment Easy to test. Compliments Parallel Seismic in determination of pile type.
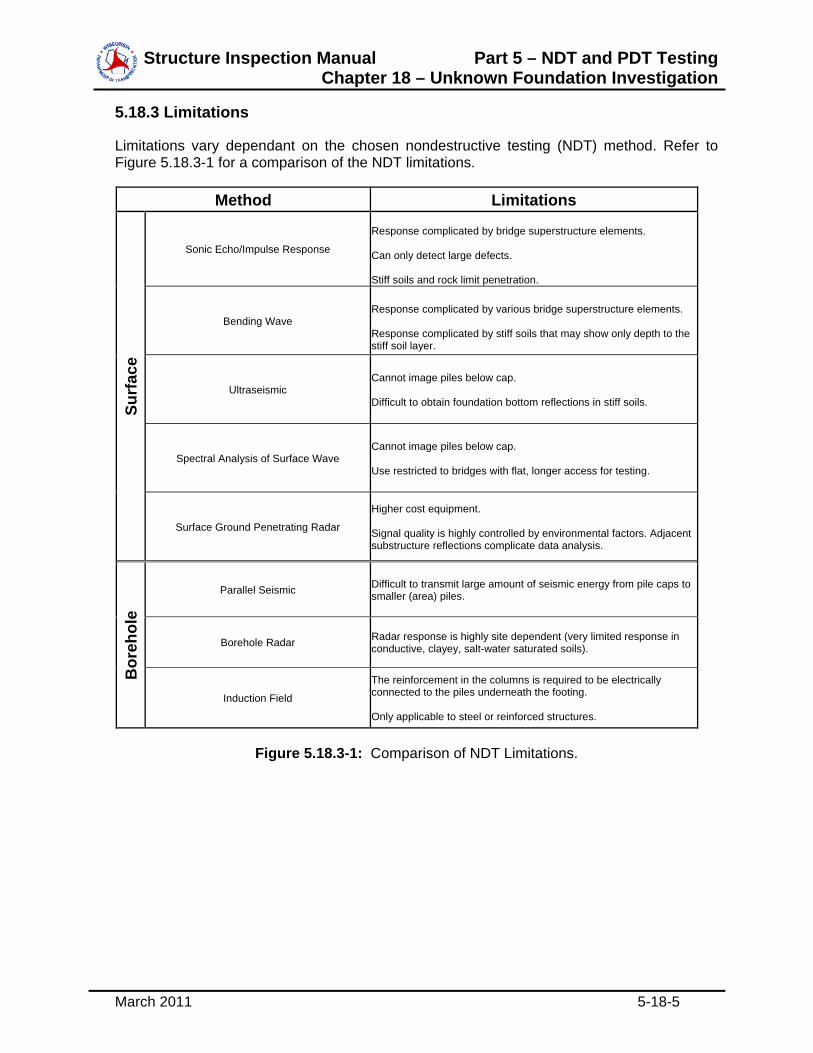
Structure Inspection Manual Part 5 – NDT and PDT Testing Chapter 18 – Unknown Foundation Investigation
March 2011 5-18-5
5.18.3 Limitations
Limitations vary dependant on the chosen nondestructive testing (NDT) method. Refer to Figure 5.18.3-1 for a comparison of the NDT limitations.
Method Limitations
Surf
ace
Sonic Echo/Impulse Response
Response complicated by bridge superstructure elements. Can only detect large defects. Stiff soils and rock limit penetration.
Bending Wave
Response complicated by various bridge superstructure elements. Response complicated by stiff soils that may show only depth to the stiff soil layer.
Ultraseismic Cannot image piles below cap. Difficult to obtain foundation bottom reflections in stiff soils.
Spectral Analysis of Surface Wave Cannot image piles below cap. Use restricted to bridges with flat, longer access for testing.
Surface Ground Penetrating Radar
Higher cost equipment. Signal quality is highly controlled by environmental factors. Adjacent substructure reflections complicate data analysis.
Bor
ehol
e
Parallel Seismic Difficult to transmit large amount of seismic energy from pile caps to smaller (area) piles.
Borehole Radar Radar response is highly site dependent (very limited response in conductive, clayey, salt-water saturated soils).
Induction Field
The reinforcement in the columns is required to be electrically connected to the piles underneath the footing. Only applicable to steel or reinforced structures.
Figure 5.18.3-1: Comparison of NDT Limitations.

Structure Inspection Manual
[THIS PAGE INTENTIONALLY LEFT BLANK]
Structure Inspection Manual Part 5 – NDT and PDT Testing Chapter 19 – Hydrographic Survey
March 2011 5-19-1
Table of Contents
5.19 Hydrographic Survey .......................................................................................................... 2
5.19.1 Introduction.................................................................................................................. 2
5.19.2 Applications ................................................................................................................. 2
5.19.2.1 Lead Line ............................................................................................................. 2
5.19.2.2 Sounding Pole ..................................................................................................... 2
5.19.2.3 Fathometer .......................................................................................................... 3
5.19.2.4 Complex Systems ................................................................................................ 4
5.19.3 Limitations ................................................................................................................... 4
Structure Inspection Manual Part 5 – NDT and PDT Testing Chapter 19 – Hydrographic Survey
March 2011 5-19-2
5.19 HYDROGRAPHIC SURVEY
5.19.1 Introduction
Hydrographic survey is often known as underwater or sub-bottom profiling, as well as referred to as water depth soundings. This process is used to obtain underwater surface elevation data for evaluating the channel bottom surrounding a structure and the waterway in general. Similar to a topographic land survey, a hydrographic survey consists of a series of elevation measurements over a particular area in a waterway. Refer to Section 1.3.8 in Part 1 for discussions on scour inspections with hydrographic surveys. The level of accuracy in hydrographic surveying varies greatly based on the equipment and methods used. Although the U.S. Army Corps of Engineers have specifications and general requirements for hydrographic surveying and there is even a process to become a certified hydrographic surveyor, scour inspections typically only require the use of more simplified methods performed by an individual familiar with the applications and limitations of water depth measurements near a structure.
The inspector determines channel bottom elevations, and then compares the values to previous data. It is necessary to measure the water level at the time of inspection against a benchmark of known elevation on a pier or other part of the substructure. This location of known elevation should be documented in the report for future use, and may even be permanently marked on the structure. Such benchmarks may be chiseled into the substructure for use in future inspections. A “crow’s foot” is a common marking.
5.19.2 Applications
Applications for hydrographic surveys are primarily for evaluating channel bottom movement. The methods include: lead line, sounding pole, fathometer, and more complex systems.
5.19.2.1 Lead Line
A Lead Line is a simple device typically consisting of a standard surveyor’s tape with a weight attached to the end. The inspector simply lowers the Lead Line until the weight comes to rest on the channel bottom. The inspector then pulls the line taut and records the reading from the channel bottom to the waterline or top of deck. An inspector working from the top of the deck most often obtains Lead Line readings.
5.19.2.2 Sounding Pole
A Sounding Pole is another simple device that typically consists of an extendable, graduated rod. An inspector in the water or in a boat will typically place the pole vertically on the channel bottom and record the measurement at the waterline. The inspector then records the distance from the waterline elevation to a known elevation on the structure. Refer to Figure 5.19.2.2-1 for a view of an inspector using a sounding pole.
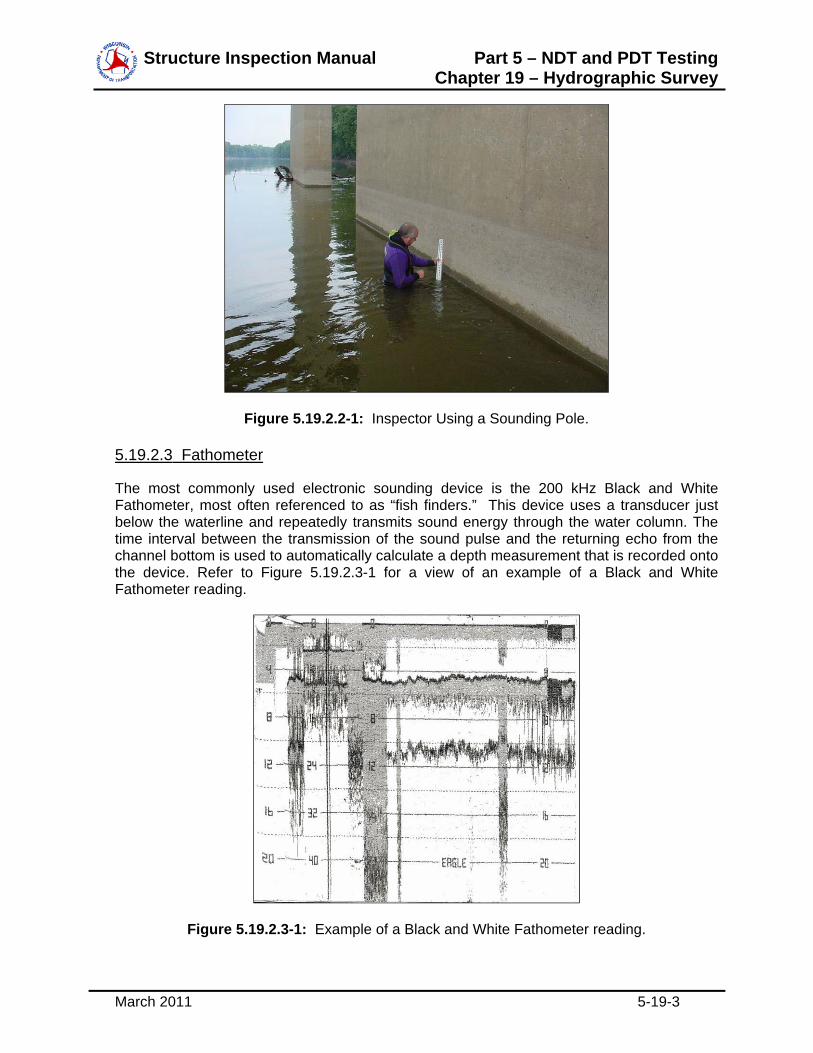
Structure Inspection Manual Part 5 – NDT and PDT Testing Chapter 19 – Hydrographic Survey
March 2011 5-19-3
Figure 5.19.2.2-1: Inspector Using a Sounding Pole.
5.19.2.3 Fathometer
The most commonly used electronic sounding device is the 200 kHz Black and White Fathometer, most often referenced to as “fish finders.” This device uses a transducer just below the waterline and repeatedly transmits sound energy through the water column. The time interval between the transmission of the sound pulse and the returning echo from the channel bottom is used to automatically calculate a depth measurement that is recorded onto the device. Refer to Figure 5.19.2.3-1 for a view of an example of a Black and White Fathometer reading.
Figure 5.19.2.3-1: Example of a Black and White Fathometer reading.
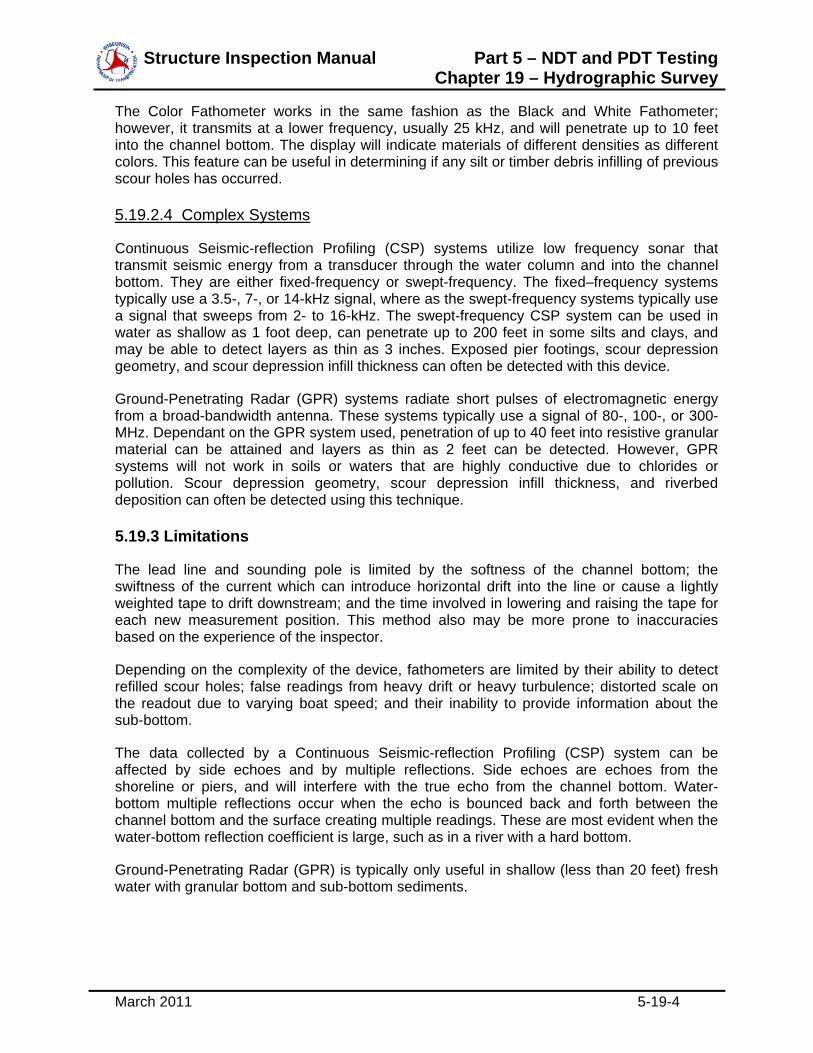
Structure Inspection Manual Part 5 – NDT and PDT Testing Chapter 19 – Hydrographic Survey
March 2011 5-19-4
The Color Fathometer works in the same fashion as the Black and White Fathometer; however, it transmits at a lower frequency, usually 25 kHz, and will penetrate up to 10 feet into the channel bottom. The display will indicate materials of different densities as different colors. This feature can be useful in determining if any silt or timber debris infilling of previous scour holes has occurred.
5.19.2.4 Complex Systems
Continuous Seismic-reflection Profiling (CSP) systems utilize low frequency sonar that transmit seismic energy from a transducer through the water column and into the channel bottom. They are either fixed-frequency or swept-frequency. The fixed–frequency systems typically use a 3.5-, 7-, or 14-kHz signal, where as the swept-frequency systems typically use a signal that sweeps from 2- to 16-kHz. The swept-frequency CSP system can be used in water as shallow as 1 foot deep, can penetrate up to 200 feet in some silts and clays, and may be able to detect layers as thin as 3 inches. Exposed pier footings, scour depression geometry, and scour depression infill thickness can often be detected with this device.
Ground-Penetrating Radar (GPR) systems radiate short pulses of electromagnetic energy from a broad-bandwidth antenna. These systems typically use a signal of 80-, 100-, or 300-MHz. Dependant on the GPR system used, penetration of up to 40 feet into resistive granular material can be attained and layers as thin as 2 feet can be detected. However, GPR systems will not work in soils or waters that are highly conductive due to chlorides or pollution. Scour depression geometry, scour depression infill thickness, and riverbed deposition can often be detected using this technique.
5.19.3 Limitations
The lead line and sounding pole is limited by the softness of the channel bottom; the swiftness of the current which can introduce horizontal drift into the line or cause a lightly weighted tape to drift downstream; and the time involved in lowering and raising the tape for each new measurement position. This method also may be more prone to inaccuracies based on the experience of the inspector.
Depending on the complexity of the device, fathometers are limited by their ability to detect refilled scour holes; false readings from heavy drift or heavy turbulence; distorted scale on the readout due to varying boat speed; and their inability to provide information about the sub-bottom.
The data collected by a Continuous Seismic-reflection Profiling (CSP) system can be affected by side echoes and by multiple reflections. Side echoes are echoes from the shoreline or piers, and will interfere with the true echo from the channel bottom. Water-bottom multiple reflections occur when the echo is bounced back and forth between the channel bottom and the surface creating multiple readings. These are most evident when the water-bottom reflection coefficient is large, such as in a river with a hard bottom.
Ground-Penetrating Radar (GPR) is typically only useful in shallow (less than 20 feet) fresh water with granular bottom and sub-bottom sediments.

Structure Inspection Manual Part 5 – NDT and PDT Testing Appendices
March 2011 5-A-i
Table of Contents
APPENDIX A: REFERENCES ................................................................................................... 1

Structure Inspection Manual Part 5 – NDT and PDT Testing Appendices
March 2011 5-A-ii
[THIS PAGE INTENTIONALLY LEFT BLANK]
Structure Inspection Manual Part 5 – NDT and PDT Testing Appendix A: References
March 2011 5-A-1
APPENDIX A: REFERENCES
AASHTO. Rapid Determination of Chloride Permeability of Concrete, Designation T-277-89I, 1989.
ACI. Testing Hardened Concrete: Nondestructive Methods, 1976.
ASNT. American Society of Nondestructive Testing Handbook. Vols. I & II, 1982.
ASNT. Nondestructive Testing Handbook. 2nd Edition. Vol. 10, 1996.
ASNT. Recommended Practice No. SNT-TC-1A, 1996.
AWS. Structural Welding Code-Steel, 2000.
AWS. Guide for the Nondestructive Inspections, 1977.
FHWA. In-Situ Determination of Chloride Content in Portland Cement Concrete Bridge Decks, RD-80/030, 1980.
Krautkramer. Ultrasonic Testing of Materials. Third Ed., 1983.
Road Research Laboratory. Nondestructive Testing of Concrete, 1962.
Sansalone, Mary J., Streett, William B. IMPACT-ECHO: Nondestructive Evaluation of Concrete and Masonry, 1997.
US Army Corps of Engineers. Development of Nondestructive Testing Systems for In Situ Evaluation of Concrete Structures, 1987.
USDA. Forest Service Inspection of Bridges Using Stress Wave Timing Nondestructive Evaluation Tools, April 1999.
USDOT. FHWA. Bridge Inspector’s Training Manual/90, 1995.
USDOT. Nondestructive Testing Methods for Steel Bridges-Training Manual, 1986.

Structure Inspection Manual Part 5 – NDT and PDT Testing Appendix A: References
March 2011 5-A-2
[THIS PAGE INTENTIONALLY LEFT BLANK]