structure and pattern of urbanisation in punjab: a macro
TRANSCRIPT

69 Singh & Singh: Urbanisation in Punjab
Structure and Pattern of Urbanisation in
Punjab: A Macro Level Analysis
Paramjit Singh
Panjab University, Chandigarh
Balwinder Singh
Punjabi University, Patiala _______________________________________________________________
Unprecedented growth of urban population presents a major challenge for sustainable
economic growth. The State of Punjab which was known for its agricultural
performance and dynamic rural economy upto 1990s is now emerging as a service
economy dominated by urban sector. The State of Punjab has emerged as the sixth
major urbanised State in India. According to the 2011 census 37.49 per cent of the
State’s population is living in urban areas and contributing nearly 60 per cent to State’s
GDP. The majority of the growing urban population was absorbed by the big urban
centers which are likely to cause multiple problems such as lack of basic amenities and
infrastructural deficiencies in these cities. Although the movement of population from
lower order towns towards high order towns and cities and outgrowth of urban areas
kept urban density almost stagnant, the area under urban units has progressed more than
three times from 1971 to 2001. The net rural-urban migration has been increasing since
1971, which leads to the problem of slum growth and urban poverty in Punjab.
_______________________________________________________________
Introduction
On the basis of geographical area, Punjab has 16th rank in India having an area
of 50362 square Km comprising small share of 1.6 per cent of the country’s
total geographical area. Punjab is located in the north-western part of India. It
lies between latitude 290 30’ to 320 32 north latitude and from 730 55’ to 760
50’ east latitude. During the last century, the State’s geographical boundaries
have shifted twice- the violent participation of India in 1947 and the
administrative division of Punjab in 1966 into present day Punjab and the
States of Haryana and Himachal Pradesh. In the recent past, the State faced a
militant problem. Yet, in spite of these disturbances, the State of Punjab
occupies an extremely important place in India. Punjab has achieved
remarkable growth since independence and emerged as the richest State in
India. This growth and prosperity are primarily the result of Punjab’s
adaptation of new technology in agriculture. After the onset of Green
Revolution in 1966-67, significant change has occurred in the economic
structure of Punjab. It has emerged as the largest grain producer State in the
country. Punjab’s economy is mainly agricultural and enjoys an enviable
position among the States in regard to area under HYV seeds, yield per
hectare, irrigation intensity, consumption of chemical fertilizers and electric
power (Singh, 2011). But the situation of Punjab economy has took a serious

JPS 21:1 70
turn with the introduction of liberalisation and globalisation policies during the
early 1990s. The growth rate of Punjab economy remained consistently (except
1996-97) lower than of India as a whole. In terms of growth rate of gross state
domestic product, out of 28 states of Indian Union, Punjab was at the 27th
position during the 10th five year plan, whereas during the 11th plan, the
situation became worse and Punjab has recorded the lowest growth rate in
India. This has happened due to the lower growth of agriculture sector (Singh,
2011; Planning Commission, 2007).
Urbanisation and agricultural development are closely linked in Punjab.
Agricultural prosperity has caused the shift of population from rural areas to
the urban economy. Punjab has a long urban history from the Harappa
civilization. During the colonial rule, the urbanisation process in Punjab was
mainly driven according to the interest of Colonial ruler. With the
establishment of British rule and introduction of the railway the physical
organization of towns and cities in Punjab recorded remarkable transition. The
expansion of railway network caused the spatial outgrowth of existing
towns/cities towards the railway station (Grewal, 1997; Grewal and Grewal,
2005). In Punjab, during the British rule, there was development of Mandi
towns near the railway stations to export the raw material through rail network
towards the major Indian ports and from these ports to the British Empire. So
the urban structure of Punjab, inherited from the colonial period, was
nevertheless relatively balanced as compared to other Indian States.
The agriculturally prosperous State of Punjab showed a marked increase in
its urban population since independence. The population of urban areas in
Punjab increased very sharply after 1970s. At the dawn of the twentieth
century, only 12.46 per cent of the total population of the then pre-partition
Punjab was urban. At the beginning of the twenty-first century, the urban
population of Punjab has increased to 33.95 per cent, against 27.78 per cent for
the country as a whole. According to the 2011 census, 37.49 per cent of the
State’s population is living in urban areas and contributing nearly 60 per cent
to State’s GDP but urban development got only 2 to 3 per cent of total outlays
of plans. It is evident that the growth rate of urban population has been fairly
high in Punjab. In fact, the State has always been among the high urbanised
States in India. Punjab is now the sixth major urbanised State in India after
Kerala, Tamil Nadu, Maharashtra, Gujarat and Karnataka.
The present work is an attempt to analyse the spatial as well as temporal
patterns of urbanisation in Punjab. It is based on the analysis of urbanisation
and other related aspects from 1971 to 2001. However, the provisional data of
rural-urban distribution of population for the 2011 census are now also
available. The analysis also covers the changes which have happened during
recent times. The logic behind the selection of above time period was mainly
for three reasons as below:
1. The period from 1971 to 1981 presents the major change in Punjab
agriculture known as Green Revolution which gave a boost to agro-processing
activities in particular and industrial development in general. So it becomes

71 Singh & Singh: Urbanisation in Punjab
essential to analyse the pace and pattern of urbanisation during this period and
its relation with agricultural and industrial development.
2. During 1981 to 1991 Punjab faced socio-political disturbances. During this
period, terrorism has affected the rural as well as urban areas of Punjab. It is
quite important to look into changes in population distribution during this
period.
3. The period from 1991 onwards is referred as the period of globalisation and
liberlisation. Due to the shift in economic policies, many significant socio-
economic changes have occurred. The western vision of life has made an effect
on the psychology of Punjabies. This period is referred to as the period of
modernisation in the sense that the development of communication as well as
transportation facilities has aided a pace to the urbanisation process.
Degree of Urbanisation
Urbanisation has often been regarded as a positive manifestation of economic
development. It is being argued that without urbanisation economic and social
development may be slow. From the last century and a half there has been a
massive growth in urban population. The process started in Europe and was
taken up in other parts of northern hemisphere; nowadays, the most impressive
urbanisation process is taking place in developing countries (Berg et. al.,
1982). By the end of 18th century, people who lived in the towns and cities
were estimated to be about 3 per cent of the world population, but in 2008 the
proportion of the population living in urban areas reached to 50 per cent
(Bhattacharya, 2002). In the developed countries of the modern days,
urbanisation is very much related to industrialisation. The case is not the same
for developing countries. In most of the developing countries, it is not the
industrial pull which attracts the population towards urban centers. In case of
developing countries rural overpopulation is the major push factor compelling
the urbanisation process. In these countries, the rate of industrialisation and
modernisation has failed to keep pace with urbanisation. The higher proportion
of population of underdeveloped world suddenly moves towards cities beyond
the capacity of latter. The consequences of this may be urban poverty, rather
than industrialisation and modernisation (Smiles, 1975). As far as India is
concerned, due to two centuries of colonial rule, the urban structure of India
has not been following the pattern of urbanisation which is based on the
agricultural development and strong urban industrial base as experienced by
most of the developed counties during their urban transition. Indian
urbanisation model is basically a colonial urban model. The imperialist has
developed the cities and towns to facilitate the transportation of raw material
and surpluses from the Indian periphery to developed imperialist centers and
import the finished products through the same route to sell in the market of
rural hinterland of periphery.
In Punjab, the process of urbanisation has been a steady process for a long
time, but during the last few decades it has gained extra momentum. This was
the period of accelerated agricultural growth, followed by industrilisation of

JPS 21:1 72
the State. During the last 50 years, urban population in the State has increased
four times whereas the population of the State has increased only two and half
times. With the advent of the green revolution and labour saving technology in
the agriculture, the population in rural localities of Punjab is continuously
decreasing.
During 1971, out of the total population 76.27 per cent was living in the
rural areas and since then the proportion of rural population was decreased and
it has reached to 62.51 per cent in 2011. On the other hand, the urban
population in Punjab is showing an upward movement. The urban population
in Punjab was 3.22 million (23.73 per cent of the total population) in 1971 and
it has increased to 37.49 per cent in 2001 (Vide Table and Figure 1).
Table 1: Rural and Urban Population in Punjab
Year Rural
Population
(in million)
Urban
Population
(in million)
Total
Population
(in million)
Rural
Population
as
Percentage
of Total
Population
Urban
Population
as
Percentage
of Total
Population
1971 10.33 3.22 13.55 76.27 23.73
1981 12.14 4.65 16.79 72.32 27.68
1991 14.29 5.99 20.28 70.45 29.55
2001 16.10 8.26 24.36 66.08 33.92
2011 17.32 10.3 27.70 62.51 37.49
Source: Census of India, 1971 to 2001, Punjab, Series-4, Final Population
Totals and Provisional Population Totals, 2011 Census.
Figure 1: Distribution of Rural and Urban Population in Punjab
Source: As in Table 1
0
10
20
30
40
50
60
70
80
1971 1981 1991 2001 2011
76.27 72.32 70.45
66.08 62.51
23.73 27.68
29.55 33.92 37.49
Rural Population as Percentageof Total Populaton
Urban population as Percentageof Total Population

73 Singh & Singh: Urbanisation in Punjab
Table 2: Decadal and Compound Annual Growth Rate of Urban
Population in Punjab
Source: Census of India, Punjab, 1971 to 2001, Series 2, Provisional
Population Total of 2011.
The decadal and annual compound growth of population is highlighted in
Table 2 above. The decadal growth of the total and the rural population has
decreased during the period from 1971 to 2011. The urban population showed
a very impressive decadal growth during 1971-81. It has 44.51 per cent which
was significantly higher in comparison to the growth rate of total and rural
population during this period. There have mainly three reasons which were
responsible for this impressive growth. Firstly, due to the advent of green
revolution the income of farming households increased and they moved
towards the urban localities for better facilities and opportunities. During the
period from 1970-71 to 1980-81, Punjab has recorded historical increase in per
capital income. During 1970-71 the per capita income at constant prices in
Punjab was Rs. 1070 whereas the per capita income at the national level was
recorded only Rs. 633. After the period of ten years (during 1980-81) the per
capital income of Punjab has reached to Rs. 1354, which was near about
double as compare to per capita income at national level (Government of
Punjab, 1985). This was primarily occurs due to the agricultural revolution in
Punjab. Secondly, a large number of people moved due to the push factor as
the mechanisation of agriculture reduced the requirement of labour for
agriculture. Thirdly, the development of the industrial corridor along the
Ludhiana, Jalandhar and Amritsar highways led to the movement of population
from the surrounding areas to the towns. The decadal growth rate of urban
Percentage Decadal Variation
Urban-
Rural
Growth
Different
ial
Annual
Compound
Growth of
Urban
Population
Decade Total
Populatio
n
Urban
Population
Rural
Populatio
n
1971-81 23.89 44.51 17.48 27.03 3.7
1981-91 20.81 29.11 17.69 11.42 2.6
1991-01 20.10 37.86 12.65 25.21 3.2
2001-11 13.73 25.76 7.58 18.20 2.3

JPS 21:1 74
population has decreased from 44.51 per cent to 29.11 per cent in the next
decade but it was still higher than the growth of rural and total population.
The decade of 1981-91 has been described as the lost decade or a decade of
missed opportunities for Punjab (Shivramakrishnana, et. al., 2005). During this
period, to a large extent, Punjab suffered due to the disturbed socio-political
conditions and widespread terrorism. In the next decade (1991-2001), which
was also known as the period of globalisation, the decadal growth of urban
population again accelerated in Punjab and it has reached to 37.86 per cent. It
was near about three times higher than the growth of population in rural
Punjab. It was the time when people started looking for better employment and
education opportunities and better possibilities for investment. The higher
income group of rural localities moved towards urban areas for better
education and better investment opportunities. The lower income group from
rural areas moved in the hope of finding better employment opportunities to
raise their standard of living. During this decade, the growth of the service
sector in Punjab is higher in comparison to the secondary and primary sector.
It is also known as the period of tertiarisation of Punjab economy (Singh,
2010).
The provisional population results of the 2011 census reveal that the
decadal growth of total, urban and rural, population has recorded a decline as
compared to the previous decade. During this period, the growth of urban
population has reached 25.76 per cent which is nearly twice that of the overall
population growth rate (13.73 per cent) and more than three times that of the
rural population (7.58 percent) growth rate. The annual compound growth of
urban population was highest (3.7 per cent) during 1971 to 1981. In the next
decade, the per annum compound growth of urban population decreased to 2.6
per cent but in 1991-2001, the growth of urban population again accelerated
and reached 3.2 per cent per annum. The recent data reveal that the annual
compound growth of urban population is 2.3 per cent from 2001 to 2011 which
is lowest as compared to all the previous decades.
Generally to examine the urbanisation process in a particular region the
researchers are concerned only with the percentage of urban population to the
total population (U/ U+R) (Bose, 1973). There is a problem of underestimation
in this measure because a segment of urban population, that consists of largely
of the refugees from the rural areas who have not been integrated with the
urban economy would figure in the denominator (Kundu, 1980).
Table 3: Degree of Urbanisation in Punjab
Year Urban Population as Percentage of Rural
Population (U/R)
1971 31.12
1981 38.22
1991 41.94

75 Singh & Singh: Urbanisation in Punjab
Source: Census of India, Punjab, 1971 to 2001, Series-4, Final population
Totals and Provisional Population Totals 2011.
For the correct estimation of the degree of urbanisation in a region and to
remove the defects of the underestimation, Kundu’s Method the percentage of
urban population of the rural population (U/R) has been chosen in the present
analysis. During 1971, the percentage of urban population to the rural
population was recorded 31.12 per cent. Since then it has continuously
progressed and reached to 59.47 per cent in 2011. It means that the percentage
of urban population was more than the half of the rural population in Punjab.
Number of Urban Units
One of the most persistent generalisations concerning the urban transformation
in the developed countries is the assertion that it rested upon a series of
technological as well as productive changes which led to growth of industrial
and agricultural production. These changes led to a change in occupational
composition of the population of these countries from agriculture to non-
agricultural activities and increasing concentration of people in urban places
(Mc Gee., 1983). The increase in the number of urban units is a sign of
modernisation and commercialisation of economic activities. As long as the
numbers of urban units increase it is a sign of development because people are
moving towards better inhabitant and better socio-economic environment.
Table 4: Class-wise Distribution of Towns and Change in Number of
Towns Category
of Towns
Number of Towns Change in Number of
Towns
1971 1981 1991 2001 1971-
81
1981-
91
1991-
2001
Class I 4 7 10 14 3 3 4
Class II 8 10 18 18 2 8 0
Class III 22 27 25 36 5 -2 11
Class IV 33 36 46 54 3 10 8
Class V 30 40 14 29 10 -26 15
Class VI 11 14 7 6 4 -7 -1
Source: Census of India, 2001, Punjab, Series-4, General Population Tables.
2001 51.33
2011 59.47
JPS 21:1 76
Note: Class I Towns (100,000 and above), Class II (50,000 to 99,999), Class
III (20,000 to 49,999), Class IV (10,000 to 19,999), Class V (5,000 to 9,999),
Class VI (Less than 5000)
Table 4 provides the information about class-wise distribution of towns and
change in the number of towns over the period of time. The number of towns
in each category has increased during 1971-81. During this decade, the market
towns for agricultural produce were developed in Punjab. In addition to market
towns, certain types of small production towns based on agricultural inputs
have also developed during this period. The number of towns has declined
during the next decade and it has remained 120 in 1991. The number of Class
V and Class VI towns has decreased from 40 to 14 and 14 to 7 respectively
during this decade. It was primarily due to the de-notification of Notified Area
Committees by the State government (Census of India, 2001). The next decade
again showed the pace of urbanisation process and the urban units reached
157 in 2001, out of which 139 were statutory towns1 while the remaining 18
called census towns or non-statutory towns2 (Vide Table 4). The provisional
results of 2011 census highlights that the number of towns in Punjab have
increased to 217 (an addition of 60 towns as compared to previous decades)
out of which 143 are statutory towns and 74 are non-statutory (census towns).
Distribution of Urban Population in Various Classes of Towns
For the healthy growth of a country and regions it is necessary that the process
of growth should be balanced. The same is true for modernisation and
urbanisation. Economic development is facilitated by the emergence of an
integrated settlement system of different size towns and cities serving both
their own residence and the residence of surrounding rural areas (Renkow,
2008). The urban growth should be balanced or it should be started from the
development of low level towns which are known as the Mandi towns or small
towns. Small towns are playing an important role in the regional development.
The functioning of these towns is helpful for the growth of rural hinterlands.
Small towns serve number of marketing functions such as collection,
processing, assembly and distribution of various commodities. Goods
produced in the surrounding rural hinterlands are transported into these towns.
They are also playing certain types of production functions such as agricultural
processing, manufacturing, services and commercial activities. The firms
located in these towns are an important source of certain consumption goods
for rural areas. Small towns also offer a range of services and facilities which
are available in the rural hinterland. These include health services, postal
services, school, colleges, banks and communication facilities.
Table 5 shows the classification of towns according to population ranges.
The proportion of towns and population in various categories showed that in
1971 Class VI towns constituted 10.81 per cent of the total urban area where
1.29 per cent of the total urban population lived. Since then the share of Class
VI towns, both in terms of area and population, is decreasing and reached 5.03

77 Singh & Singh: Urbanisation in Punjab
percent of the total urban area with only 0.34 per cent of the total urban
population in 2001.
Table 5: Towns Classified by According to Population Ranges
Population
Range
1971 1981
No. of
Towns
Population No. of
Towns
Population
Class I 4
(3.70)
1283274
(40.52)
7
(5.22)
2155714
(46.38)
Class II 8
(7.41)
504341
(15.68)
10
(7.46)
668780
(14.39)
Class III 22
(20.37)
699336
(21.74)
27
(20.15)
940482
(20.23)
Class IV 33
(30.55)
463107
(14.40)
36
(26.87)
524505
(11.29)
Class V 30
(27.78)
224959
(6.99)
40
(29.85)
301905
(6.50)
Class VI 11
(10.81)
41162
(1.29)
14
(10.45)
56371
(1.21)
Gini
concentration
0.604 0.634
Source: Census of India, 1971 to 2001, Punjab, Series-4, General Population
Tables.
Note: Class I Towns (100,000 and above), Class II (50,000 to 99,999), Class
III (20,000 to 49,999), Class IV (10,000 to 19,999), Class V (5,000 to 9,999),
Class VI (Less than 5000)
The Class II towns show little variation in the percentage of urban area and
population during 1971 and 1981. The urban area has increased in this
category of towns in 1991 to 15.00 per cent with 19.91 per cent of total urban
population. In the next decade, there was a decrease in the percentage of urban
area as well as urban population. It has recorded 11.32 and 15.91 per cent
respectively. The Class III towns have not shown much variation in urban area
during 1971 to 2001, but the percentage of urban population in these towns has
decreased from 21.74 per cent to 13.10 per cent during this period. The Class
IV towns also have shown little variation in terms of area but there was
decrease in percentage of urban population from 14.40 per cent in 1971 to 9.81
per cent in 2001. The Class V towns constitute 27.78 per cent of the total urban
area with 6.99 per cent of urban population in 1971. The share of these towns
increased in terms of area but the percentage of population in these towns
decreased to 6.50 per cent in 1981. In 1991, these towns show deceleration
both in terms of percentage of urban area and population. In 2001, there was
an increase in percentage of area (18.24 per cent of the total urban area) and
JPS 21:1 78
percentage of urban population (2.58 per cent of total urban population) over
the previous decade.
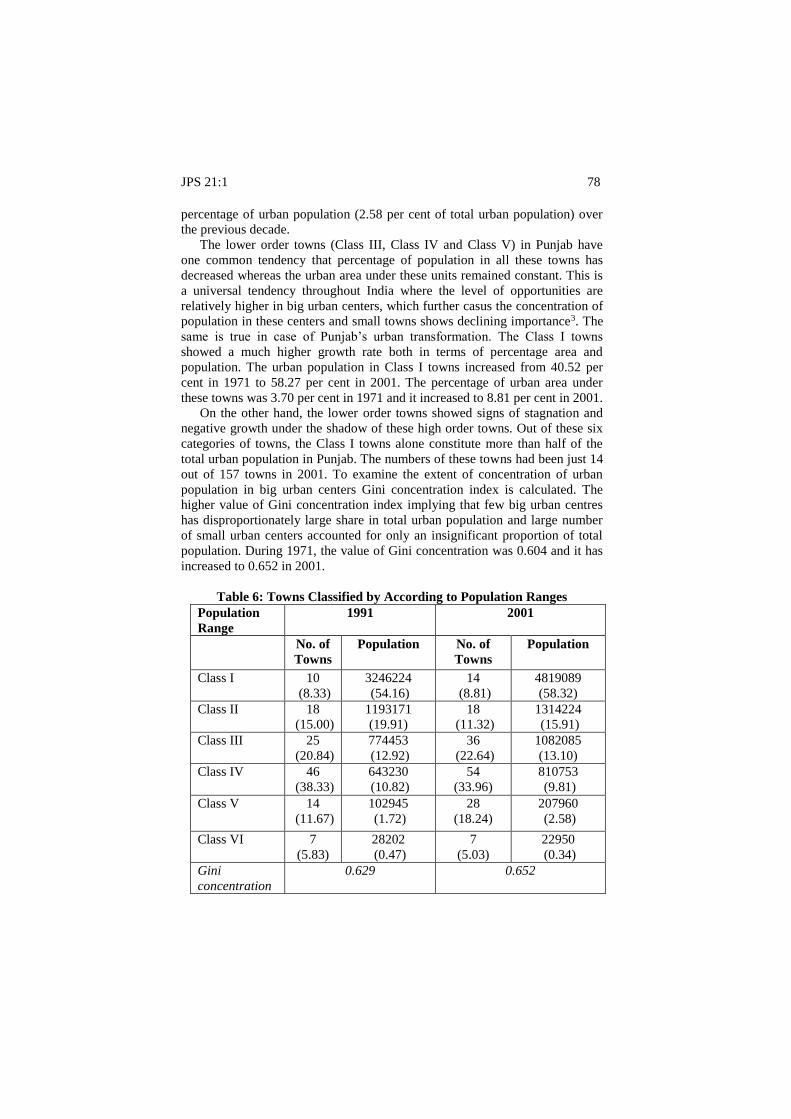
The lower order towns (Class III, Class IV and Class V) in Punjab have
one common tendency that percentage of population in all these towns has
decreased whereas the urban area under these units remained constant. This is
a universal tendency throughout India where the level of opportunities are
relatively higher in big urban centers, which further casus the concentration of
population in these centers and small towns shows declining importance3. The
same is true in case of Punjab’s urban transformation. The Class I towns
showed a much higher growth rate both in terms of percentage area and
population. The urban population in Class I towns increased from 40.52 per
cent in 1971 to 58.27 per cent in 2001. The percentage of urban area under
these towns was 3.70 per cent in 1971 and it increased to 8.81 per cent in 2001.
On the other hand, the lower order towns showed signs of stagnation and
negative growth under the shadow of these high order towns. Out of these six
categories of towns, the Class I towns alone constitute more than half of the
total urban population in Punjab. The numbers of these towns had been just 14
out of 157 towns in 2001. To examine the extent of concentration of urban
population in big urban centers Gini concentration index is calculated. The
higher value of Gini concentration index implying that few big urban centres
has disproportionately large share in total urban population and large number
of small urban centers accounted for only an insignificant proportion of total
population. During 1971, the value of Gini concentration was 0.604 and it has
increased to 0.652 in 2001.
Table 6: Towns Classified by According to Population Ranges
Population
Range
1991 2001
No. of
Towns
Population No. of
Towns
Population
Class I 10
(8.33)
3246224
(54.16)
14
(8.81)
4819089
(58.32)
Class II 18
(15.00)
1193171
(19.91)
18
(11.32)
1314224
(15.91)
Class III 25
(20.84)
774453
(12.92)
36
(22.64)
1082085
(13.10)
Class IV 46
(38.33)
643230
(10.82)
54
(33.96)
810753
(9.81)
Class V 14
(11.67)
102945
(1.72)
28
(18.24)
207960
(2.58)
Class VI 7
(5.83)
28202
(0.47)
7
(5.03)
22950
(0.34)
Gini
concentration
0.629 0.652
79 Singh & Singh: Urbanisation in Punjab
Source: Census of India, 1971 to 2001, Punjab, Series-4, General Population
Tables.
Note: Class I Towns (100,000 and above), Class II (50,000 to 99,999), Class
III (20,000 to 49,999), Class IV (10,000 to 19,999), Class V (5,000 to 9,999),
Class VI (Less than 5000).
It means that the concentration of population in big centers was higher in 2001
in comparison to previous decades. Such a large value of the Gini
concentration indicates the extent of distortion in the urban settlements of
Punjab. A fast growth of few high order towns (Ludhiana, Jalandhar and
Amritsar) creates the problem of regional inequality as the larger cities are
becoming relatively larger. The analysis showed that the population in lower
order towns decreased over the period of time. It is the sign of lopsided
movement of population in Punjab because big cities (Class I cities only)
accounted for near about 60 per cent of State’s total urban population and
majority of these cities (Ludhiana, Jalandhar, Amritsar and Patiala) has
relatively higher level of industrial concentration.
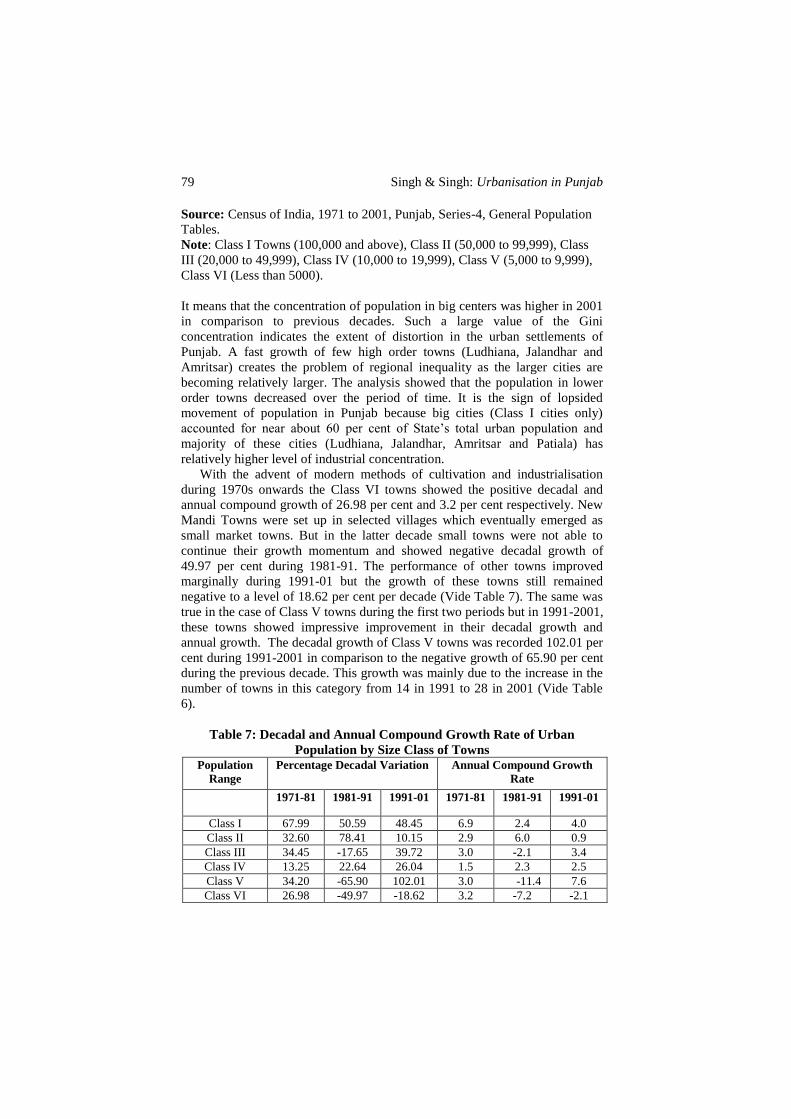
With the advent of modern methods of cultivation and industrialisation
during 1970s onwards the Class VI towns showed the positive decadal and
annual compound growth of 26.98 per cent and 3.2 per cent respectively. New
Mandi Towns were set up in selected villages which eventually emerged as
small market towns. But in the latter decade small towns were not able to
continue their growth momentum and showed negative decadal growth of
49.97 per cent during 1981-91. The performance of other towns improved
marginally during 1991-01 but the growth of these towns still remained
negative to a level of 18.62 per cent per decade (Vide Table 7). The same was
true in the case of Class V towns during the first two periods but in 1991-2001,
these towns showed impressive improvement in their decadal growth and
annual growth. The decadal growth of Class V towns was recorded 102.01 per
cent during 1991-2001 in comparison to the negative growth of 65.90 per cent
during the previous decade. This growth was mainly due to the increase in the
number of towns in this category from 14 in 1991 to 28 in 2001 (Vide Table
6).
Table 7: Decadal and Annual Compound Growth Rate of Urban
Population by Size Class of Towns
Population
Range
Percentage Decadal Variation Annual Compound Growth
Rate
1971-81 1981-91 1991-01 1971-81 1981-91 1991-01
Class I 67.99 50.59 48.45 6.9 2.4 4.0
Class II 32.60 78.41 10.15 2.9 6.0 0.9
Class III 34.45 -17.65 39.72 3.0 -2.1 3.4
Class IV 13.25 22.64 26.04 1.5 2.3 2.5
Class V 34.20 -65.90 102.01 3.0 -11.4 7.6
Class VI 26.98 -49.97 -18.62 3.2 -7.2 -2.1

JPS 21:1 80
Source: Census of India, 1971 to 2001, Punjab, Series-4, General Population
Tables.
The Class III towns showed negative decadal and annual compound growth of
17.65 and 2.1 per cent respectively during 1981-91 and in the next period these
towns showed improvement both in decadal and annual compound growth rate
and it became positive to the level of 39.72 per cent and 3.4 per cent
respectively. The Class I cities showed an impressive growth in all the time
periods. The average decadal growth of Class I cities during the period from
1971 to 2001 was over 50 per cent.
Such a huge growth in Class I cities is not a healthy sign for the State’s
urbanisation. The growth of such towns may emerge quite often at the cost of
lower order towns. The annual compound growth of Class I cities was 6.9 per
cent during 1971-81. It decreased to 2.4 per cent in 1981-91 and again
accelerated to 4.0 per cent in the next decade. The growth rate both decadal
and annual was lower during 1981-91. It was the period when there was a
decrease in the number of towns due to the de-notification of some notified
area. It was also the period of social, economic and political disturbances in
Punjab. The annual growth of these towns has accelerated again in the next
decade and reached to 4.0 per cent.
During 1970 to 1980, the growth of small towns (Class V and Class VI)
was impressive but in later decades Punjab was not able to continue this
momentum. The numbers of big urban centers were increasing and the
numbers of low order towns had been just stagnant or decreasing. The 2011
census has highlighted that more than 50 per cent of the urban population of
Punjab was concentrating in five highly urbanised districts (Ludhiana,
Amritsar, Jalandhar, Patiala, and S.A.S. Nagar) and among these districts all
district headquarters have Class I cities which accounted for majority of urban
population among the district. The major reason behind the rise of big urban
centers in Punjab is concentration of manufacturing and industrial units in
these districts. For example, Ludhiana alone constitutes the 30.61 per cent of
the total registered manufacturing units. So there is polrisation of urban
population in Punjab which causes the overcrowding in big cities (Singh,
2013).
Urban Density
Urban density has also been used as an index of the degree of spatial
concentration of urban population. Such density is calculated by dividing the
total urban population by the total urban area. It is an important measure to
examine the overcrowding in towns. The growing concentration of population
in a few urban centers having a dysfunctional character. As a result, it becomes
difficult to provide proper housing amenities, education and medical attention
and above all, an acceptable urban environment (Kundu, 1980).
Table 8 highlights the urban density in Punjab. The urban density in Punjab
has not varied much since 1971. It was 4117 persons per square km in 1971

81 Singh & Singh: Urbanisation in Punjab
and decreased to 3877 persons in 1981. In the next decade, the urban density
was increased to 4160 and again it has decreased to 3941 persons per square
km in 2001.
Table 8: Urban Density and Urban Area in Punjab, Square km
Year Urban Density
(Persons per
square km)
Urban area
(In square
km)
Urban Density
in Class I
Cities
(Persons per
square km)
Urban
area in
Class I
Cities (In
square
km)
1971 4117 691.66 7464 174.57
1981 3877 1198.80 4810 448.16
1991 4160 1440.80 5834 556.46
2001 3941 2096.62 6315 763.12
Source: (i) Census of India, 1971 to 2001, Punjab, Series-4, General
Population Tables.
(ii) Primary Census Abstracts 1991 and 2001, Part II A and Part B
The least variation in urban density is mainly due to two reasons. Firstly, the
movement of population from low order towns towards high order towns leads
to increase the space in low order towns which keeps the overall urban density
stagnant. Secondly, as the population was growing in urban localities, the area
was also increasing under urban units. This outgrowth of big cities and towns
emerged as a major reason behind the low growth of urban density in Punjab.
The Table also provides the information that the area under urban units was
691.66 sq km in 1971 and it has progressed to more than three times during the
period of four decades and recorded 2096.62 sq km in 2001. The area under
Class I cities has been recorded more than four times increase during 1971 to
2001. Whereas small towns, as referred in previous section, has recorded
decline in their population but the area under these units remained constant. It
has also emerged as one of the reason behind the low growth of urban density.
Migration and Urbanisation
There are mainly two forces which are responsible for the migration of
population from rural areas towards urban centers. Friedrich Engels favoured
pull factor as the explanation because he thought that Manchester’s booming
growth in the early 19th century attracted labour from the surrounding
hinterlands. It is the economic forces which are pulling migration into the
cities. On the other hand, the Malthusian analysis states that agricultural land
scarcity is the major push factor behind the migration towards cities. An

JPS 21:1 82
unusually rapid rate of population growth pressing on limited farm acreage,
pushing landless labour in the cities (Williamson, 1988). In case of developing
regions, most of the demographers and economists favour the Malthusian
hypothesis. In the present analysis only male migrants have been considered as
we all know female migration is attributed largely to marriages, joining the
family and other social factors. The male migration is likely to be responding
directly to the changing economic scenario.
Table 9: Percentage of Internal Male Migration in Punjab, All Durations
Streams 1971-81 1981-91 1991-01
Rural-Rural 695405 (44.80) 715640 (41.77) 200260 (32.94)
Urban-Urban 340654 (21.99) 411587 (24.02) 165911 (27.29)
Rural-Urban 397262 (25.64) 474226 (27.68) 215337 (35.42)
Urban-Rural 115795 (7.48) 111916 (6.53) 26446 (4.35)
Net Urban ward
Migration
18.16 21.15 31.07
Source: Census of India, 1971 to 2001, Punjab, Migration Tables.
The above Table provides the information about the different streams of
migrations in Punjab from 1971 to 2001. During 1971-81, the percentage of
urban-rural migration was 7.48 per cent. The migration from rural area to
urban area has recorded 25.64 per cent. The net migration was positive of
18.16 per cent during this period. It was the period of agricultural development
in Punjab that’s why the net urban ward migration remained under check.
During 1981-91, the rural-urban migration had increased to 27.68 per cent.
The urban-rural migration has been decreased (6.53 per cent) during this
decade. The net rural-urban migration had recorded 21.15 per cent during this
period. The increase in net migration was mainly due to two reasons. Firstly, in
the mid 80s the socio-political disturbances made the rural areas less safe in
comparison to the urban localities. Secondly, the higher use of labour saving
technology (machinery and related equipment) in agriculture acts as a major
push factor for the net out-migration of male workers from rural areas.
During 1991-2001, the rural-urban migration was highest (35.42 per cent)
and the urban-rural migration was least (4.34 per cent). The net migration
towards urban localities had reached to 31.07 per cent. There were mainly two
reasons that seemed to be responsible for the higher net rural-urban migration.
Firstly, due to the introduction of new economic policy in 1991, the western
way of life made a large impact on the psychology of the Punjabi people in
rural areas and they have started moving towards the urban centres for better
facilities. Secondly, the better infrastructural and education facilities of urban
areas attract the higher income group from the rural areas and the lower
income group of rural population also moved toward urban centers in the hope
of better employment opportunities during this period.
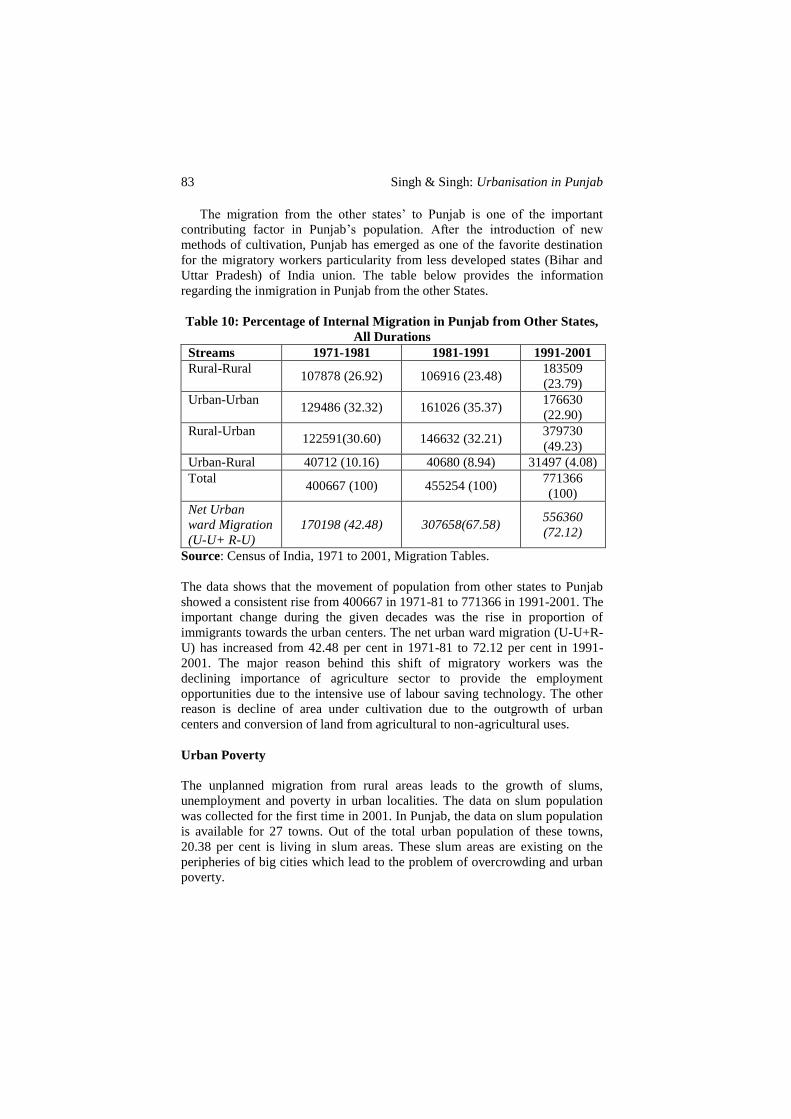
83 Singh & Singh: Urbanisation in Punjab
The migration from the other states’ to Punjab is one of the important
contributing factor in Punjab’s population. After the introduction of new
methods of cultivation, Punjab has emerged as one of the favorite destination
for the migratory workers particularity from less developed states (Bihar and
Uttar Pradesh) of India union. The table below provides the information
regarding the inmigration in Punjab from the other States.
Table 10: Percentage of Internal Migration in Punjab from Other States,
All Durations
Streams 1971-1981 1981-1991 1991-2001
Rural-Rural 107878 (26.92) 106916 (23.48)
183509
(23.79)
Urban-Urban 129486 (32.32) 161026 (35.37)
176630
(22.90)
Rural-Urban 122591(30.60) 146632 (32.21)
379730
(49.23)
Urban-Rural 40712 (10.16) 40680 (8.94) 31497 (4.08)
Total 400667 (100) 455254 (100)
771366
(100)
Net Urban
ward Migration
(U-U+ R-U)
170198 (42.48) 307658(67.58) 556360
(72.12)
Source: Census of India, 1971 to 2001, Migration Tables.
The data shows that the movement of population from other states to Punjab
showed a consistent rise from 400667 in 1971-81 to 771366 in 1991-2001. The
important change during the given decades was the rise in proportion of
immigrants towards the urban centers. The net urban ward migration (U-U+R-
U) has increased from 42.48 per cent in 1971-81 to 72.12 per cent in 1991-
2001. The major reason behind this shift of migratory workers was the
declining importance of agriculture sector to provide the employment
opportunities due to the intensive use of labour saving technology. The other
reason is decline of area under cultivation due to the outgrowth of urban
centers and conversion of land from agricultural to non-agricultural uses.
Urban Poverty
The unplanned migration from rural areas leads to the growth of slums,
unemployment and poverty in urban localities. The data on slum population
was collected for the first time in 2001. In Punjab, the data on slum population
is available for 27 towns. Out of the total urban population of these towns,
20.38 per cent is living in slum areas. These slum areas are existing on the
peripheries of big cities which lead to the problem of overcrowding and urban
poverty.
JPS 21:1 84
Urban poverty has been usually and correctly thought of as being affected
strongly by employment and income trends in rural areas. The complete
landless poor in rural areas have always been footloose migrants, with a large
component migrating seasonally to other rural areas and another stream
migrating to urban areas in search of work. The decrease in the growth rate of
agriculture and absence of diversification of rural economy leads to the
movement of population toward urban localities. The majority of the rural poor
of today become the urban poor of tomorrow due to the lack of any skill
(Patnaik, 2010).
The planning commission estimates the incidence of poverty on the basis
of household consumption expenditure conducted by National Sample Survey
at the interval of five years. The poverty line had been originally defined
precisely as that particular observed monthly per capita expenditure on food
and non-food items, whose food spending part allowed the consumer to obtain
the nutrition norms in terms of calories per day. The official estimates are
based on the calories norms of 2100 calories per capita for urban areas4. The
following Table presents the official estimates (indirect estimates) of urban
poverty in Punjab.
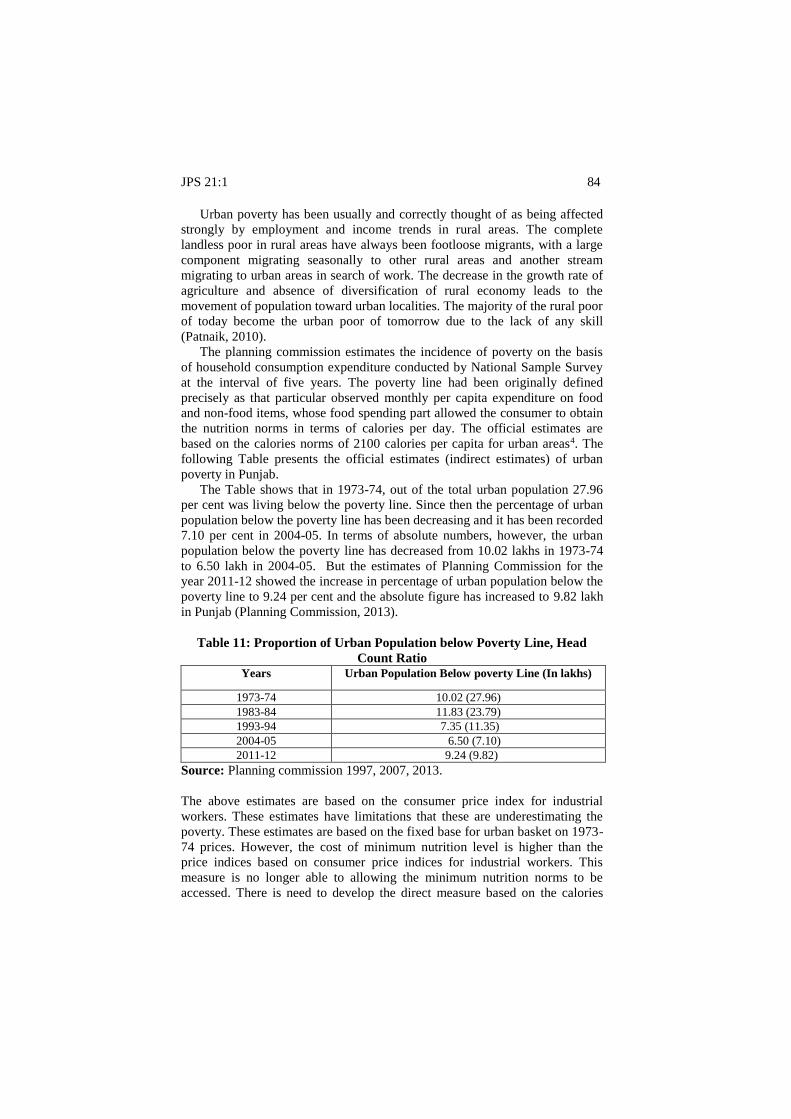
The Table shows that in 1973-74, out of the total urban population 27.96
per cent was living below the poverty line. Since then the percentage of urban
population below the poverty line has been decreasing and it has been recorded
7.10 per cent in 2004-05. In terms of absolute numbers, however, the urban
population below the poverty line has decreased from 10.02 lakhs in 1973-74
to 6.50 lakh in 2004-05. But the estimates of Planning Commission for the
year 2011-12 showed the increase in percentage of urban population below the
poverty line to 9.24 per cent and the absolute figure has increased to 9.82 lakh
in Punjab (Planning Commission, 2013).
Table 11: Proportion of Urban Population below Poverty Line, Head
Count Ratio
Years Urban Population Below poverty Line (In lakhs)
1973-74 10.02 (27.96)
1983-84 11.83 (23.79)
1993-94 7.35 (11.35)
2004-05 6.50 (7.10)
2011-12 9.24 (9.82)
Source: Planning commission 1997, 2007, 2013.
The above estimates are based on the consumer price index for industrial
workers. These estimates have limitations that these are underestimating the
poverty. These estimates are based on the fixed base for urban basket on 1973-
74 prices. However, the cost of minimum nutrition level is higher than the
price indices based on consumer price indices for industrial workers. This
measure is no longer able to allowing the minimum nutrition norms to be
accessed. There is need to develop the direct measure based on the calories

85 Singh & Singh: Urbanisation in Punjab
intake for the true measure of poverty (Patnaik, 2010). The following Table
highlights the data of official as well as direct measures of poverty in Punjab
during pre and post reform period.
Table 12 shows that in 1993-94 the official poverty line based on the
consumer price index for industrial workers was Rs. 253.85. It means if a
person is not able to spend Rs. 8.46 per day for consumption, he would be
considered below the poverty line in Punjab. According to this estimate 11.35
per cent of the urban population was living below the poverty line in Punjab.
But the nutrition norms state that Rs. 253.85 was only able to access 1605
calories whereas the standard calories intake is 2100 calories for urban areas, it
means with Rs. 253.85, the urban population has consuming deficit of 495
calories. So there is an underestimation of urban poverty in Punjab. According
to direct estimates based on the calories intake, out of the total urban
population 51.5 per cent was living the below poverty line in Punjab during
1993-94.
Table 12: Direct Poverty Estimates of Urban Population in Punjab
Descriptions 1993-94 2004-05
Official Poverty Line (OPL) (in
Rs.)
253.85 466.2
Population below Poverty
According to OPL
11.35 7.1
Calories Intake 1605 1435
Calories Required 2100 2100
Deficit of Calories -495 -665
Population Below Poverty Line
According to Direct Estimates
51.5 68.8
Source: (i) Planning Commission 1997 and 2007
(ii) Patnaik, U, (2010), Trends in Urban Poverty under Economic Reforms:
1993-94 to 2004-05, Economic and Political Weekly, Vol. 65, No. 4, p. 43.
The next decade (2004-05), official estimates of poverty states that in urban
Punjab only 7.1 per cent persons were living below the poverty line. During
this decade, according to official estimates if a person is able to spent Rs.
466.2 per month or Rs. 16 per day for consumption purpose not considered as
poor. But the direct estimates stats that Rs. 466.2 was only able to access 1435
calories, a deficit of 665 calories than the standard measure. In order to reach
the nutrition norms of 2100 calories Rs. 1280 monthly expenditure on
consumption was required, nearly three times the official poverty line. In
Punjab, 68.8 per cent of the urban population would not be able to reach this
level. The direct estimates present the real picture of urban Punjab. According
to the direct estimates more than half of the urban population is living below
the poverty line. It also highlights the fact that the poverty in urban Punjab has
not decreased after the economic reforms rater it has increased from 51.5 per
cent in 1993-94 to 68.8 per cent in 2004-05 (Vide Table 12).

JPS 21:1 86
Concluding Remarks
From the above analysis it is clear that the urban growth in Punjab has
balanced in the early decades of Green Revolution. The growth of agriculture
leads to the development of the urban industrial sector. But in the later
decades, Punjab has not able to continue the growth of balanced urbanisation
due to socio-political disturbance and widespread terrorism. Punjab is basically
an agrarian economy but recent analysis reveals that urban sector is emerging
as a major driver of States’ GDP growth. The 2011 census reveals that state of
Punjab has emerged as a one of the major urbanised state in India. The
distribution of urban population in different size towns was relatively balanced
during 1970s but it has not remained balanced any longer and the population
concentration in big urban centers showed an increasing trend after 1970s. The
decadal and annual growth of class I cities was also higher in comparison to
the low order towns. This uncontrolled and haphazard growth of big cities
gave birth to the problem of a shortage of houses, growth of slum areas and
unhealthy environment in these cities. The urban density has not increased
much due to the decrease in population in lower order towns on the one hand
and outgrowth of big cities on the other. The development of labour saving
technology in agriculture and lack of subsidiary employment opportunities in
rural areas has pushed the rural population towards urban area to seek
employment. The net rural-urban migration has increased due to the western
vision of life and the better infrastructural and educational facilities. The
unplanned migration of unskilled workers from rural localities for search of
better livelihood leads to the growth of slum population and urban poverty in
Punjab. The direct estimates of poverty reveal that the incidence of urban
poverty after the introduction of economic reforms has increased in Punjab.
The recent results of 2011 census raises a large number of questions on the
sustainable development of urban areas in Punjab. The distribution of urban
population (both among the different districts and different Classes of towns)
in Punjab was highly unequal. The census shows that 15 districts in Punjab
accounted less than 50 per cent of State’s total urban population whereas
remaining 5 districts accounted of more than 50 per cent of the State’s
population. The higher concentration of urban population among selected
districts in general and in headquarters of these districts in particular has put an
immense pressure on existing infrastructure. There is an urgent need to put
some checks on urban population growth particularly in big urban centers on
the one hand and development of infrastructural facilities and improvement in
outdated infrastructure for the growing urban areas on the other hand. The
recent analysis revealed that the urban sector is getting only 3 to 4 per cent of
the share of development expenditure. So there is an urgent need to devote
sufficient resources for urban development. Efforts are also required to raise
the revenue capacity of urban local bodies by devoting more resources to them.
Energies are also required to control the unplanned migration toward big urban
centers. It can only be possible if the government makes conscious efforts to

87 Singh & Singh: Urbanisation in Punjab
generate the productive employment opportunities in rural areas by initiating
the development oriented programme and industrial progress based on the
resource base of rural Punjab.
Notes
1 The settlements with municipal corporation, corporation, notified the town
area committee or Nagar Panchayat etc. 2 The Settlement does not have an urban civic status, but satisfies demographic
and economic criteria, like a population of more than 5000, a density of 400
persons per square kilometer and 75 per cent male workers in the non-
agricultural sector, it can be declared urban. 3 For detail, See, Kundu A. 1983. ‘Urbanisation and an Alternative Policy
Perspective’. Economic and Political Weekly, Vol. 8, No. 26. 4 For detail, See, Deaton, A. and V. Kozel, 2005. The Great Indian Poverty
Debate, Macmillan, India.
References
Berg, L. et. al., 1982. Urban Europe: A Study of Growth and Decline.
Pergamon Press, Great Britain.
Bhattacharya, P., 2002. ‘Urbanisation in Developing Countries’. Economic and
Political Weekly, Vol. 37, No. 41.
Bose A., 1973. India’s Urbanisation 1901-2001, Tata McGraw Hill
Publication Company Limited, New Delhi.
Census of India, 1971. General Population Tables, Punjab. Series-4,
Directorate of Census Operation, Punjab.
Census of India, 1981. General Population Tables, Punjab. Series-4,
Directorate of Census Operation, Punjab.
Census of India, 1991. General Population Tables, Punjab. Series-4,
Directorate of Census Operation, Punjab.
Census of India, 2001. General Population Tables, Punjab. Series-4,
Directorate of Census Operation, Punjab.
Census of India, 2011. Provisional Population Tables, Punjab. Directorate of
Census Operation, Punjab.
Census of India, 1991. Primary Census Abstracts, Punjab. Part II A and Part B,
Directorate of Census Operation, Punjab.
JPS 21:1 88
Census of India, 2001. Primary Census Abstracts, Punjab. Part II A and Part B,
Directorate of Census Operation, Punjab.
Census of India, 1971. Migration Tables, Punjab. Directorate of Census
Operation, Punjab.
Census of India, 1981. Migration Tables, Punjab. Directorate of Census
Operation, Punjab.
Census of India, 1991. Migration Tables, Punjab. Directorate of Census
Operation, Punjab.
Census of India, 2001. Migration Tables, Punjab. Directorate of Census
Operation, Punjab.
Government of Punjab, 1985. Statistical Abstract of Punjab, Department of
Economic Advisory, Punjab, Chandigarh.
Grewal, R., 1997. ‘Urban Revolution under Colonial Rule’. in I. Banga (eds.),
Five Punjabi Centuries: Polity, Economy, Society and Culture, Manohar
Publication, New Delhi, pp.438-454.
Grewal, R. and J.S. Grewal, 2005. ‘Urbanisation in Colonial Punjab’. in R.
Grewal (eds.), Five Thousand Years of Urbanisation: The Punjab Region,
Manohar Publication, New Delhi, pp. 145-166.
Kundu, A., 1980. Measurement of urban processes: A Study in
Regionalisation, Popular Prakashan, Bombay, pp. 36-37.
Mc Gee, T.G. 1983. ‘Proleterianization, Industrialisation and urbanisation in
Asia, A Case Study of Malaysia’. Journal of Humanities and Social Sciences,
No.23, P. 5.
Planning Commission, 1997. Poverty Estimates for 1994-95, New Delhi.
Planning Commission, 2007. Poverty Estimates for 2004-05, New Delhi.
Planning Commission, 2013. Poverty Estimates for 2011-12, New Delhi.
Patnaik, U., 2010. Trends in Urban Poverty under Economic Reforms: 1993-
94 to 2004-05, Economic and Political Weekly, Vol. 65, No. 4, P. 43.
Ronkow, W., 2008. ‘Cities, Towns, and the Rural Nonfarm Economy’. in
Haggblade, S. (ed.), Transforming the Rural Nonfarm Economy, Oxford
University Press, New Delhi, P.183.

89 Singh & Singh: Urbanisation in Punjab
Planning Commission, 2007 Eleventh Five Year Plan (2007-12), Vol.3,
Government of India, Oxford University Press, New Delhi, P. 3.
Shivramakrishnan, K.C., et. al., 2005. Handbook of Urbnisation in India: An
Analysis of Trends and Processes, Oxford University Press, New Delhi, P.
124.
Singh Paramjit 2010. ‘Punjab Economy: Growth, Deceleration and Crisis’.
Indian Management Studies Journal, Vol. 15, No. 1.
Singh, Paramjit, 2011. ‘Economic Benefits and Ecological Cost of Green
Revolution: A Case Study of Punjab’. Journal of Economic and Social
Development, Vol. VII, No. 1, pp. 64-73.
Singh, Paramjit, 2013. Structure and Pattern of Urbanisation in Punjab. Ph.D
Thesis, Punjabi University Patiala.
Smile, A.E., 1975. The Definition and Measurement of Urbanisation. R. Jones
(ed.), Essays on World Urbanisation, George Philip and Son Limited,
London.
Williamson, J.G., 1988. Migration and Urbanisation, in Chenery H.B. and T.N.
Srinivasan (eds.) Handbook of Development Economics, Vol-1, Elsevier
Science Publication, B.V. Amsterdam, pp. 426-54.