structural reliability applications in developing risk-based
TRANSCRIPT

ABS TECHNICAL PAPERS 2004
Structural Reliability Applications in Developing Risk-based Inspection Plans for a Floating Production Installation 177
Proceedings of OMAE 2004 23nd International Conference on Offshore Mechanics and Arctic Engineering
Vancouver, Canada 2004
OMAE 2004 - 51119
STRUCTURAL RELIABILITY APPLICATIONS IN DEVELOPING RISK-BASED INSPECTION PLANS FOR A FLOATING PRODUCTION INSTALLATION
A. Ku1, C. Serratella2, R. Spong2, R. Basu3, G. Wang3, D. Angevine4
1Energo Engineering, 2ABS Consulting, 3American Bureau of Shipping, 4ExxonMobil Production Company
Presented at the 23nd International Conference on Offshore Mechanics and Arctic Engineering (OMAE 2004)
and published in the Proceedings of OMAE 2004, Vancouver, Canada, June 20-25, 2004 Reprinted with the kind permission of American Society of Mechanical Engineers (ASME), New York, NY
ABSTRACT
This paper outlines the essential steps taken in performing structural reliability calculations during the process of laying out a risk-based inspection program. The structural reliability analysis described in this paper essentially takes the deterministic finite element method (FEM) stress/fatigue analysis results, coupled with uncertain degradation mechanisms (e.g. corrosion rate, crack propagating parameters, etc.), and tracks the time-varying structural reliability index of the structural components under consideration. This can then be used to determine the timing for inspection of structural components.
For the assessment of structural strength, an efficient and straightforward method is proposed to calculate the time-variant reliability index. This method is verified by an example problem and compared to the random process first-passage reliability solutions. Load combination issue is briefly discussed, in which an approach stems from the ABS Dynamic Loading Approach (DLA) coupled with concepts from Turkstra’s rule. This proposed simplistic load combination approach is verified through an example problem in which the result is compared to the solution calculated from a more sophisticated approach. Establishment of target reliability levels is also briefly discussed.
For the assessment of fatigue behavior for welded connections, both S-N curve based and fracture mechanics based reliability methods are discussed. Their usefulness will be discussed in terms of both inspection interval as well as selecting the proper sampling percentage of connections to inspect. Statistical correlation among a group of similar connections is discussed to assist the selection of appropriate locations in the population of the aforementioned sampling. The usefulness of fatigue reliability analysis is also demonstrated by an example problem.
INTRODUCTION In recent years there has been high interest by the
marine and offshore industry to apply structural reliability techniques to risk based inspection planning for marine vessels and floating production installations (see, e.g., [22], [24] and [25]). Structural reliability can assist in providing a framework for quantifying degradation mechanisms (such as fatigue and corrosion). By applying structural reliability and risk assessment techniques to inspection planning, the operator is given a tool to justify the allocation of valuable resources. Structural components with higher risk profile can be inspected with priority, and at the same time inspection activities for low risk components can be relaxed to optimize inspection cost.
This paper addresses the structural reliability analysis applied in laying out a risk-based inspection plan for a floating production unit (termed hereafter the example vessel), which is located in offshore West Africa. Fig. 1a shows a flow chart indicating the analyses involved.
The tasks of information gathering, such as the vessel gauging data, vessel past history, current service condition, etc., are conducted first. The gauging information is then used in direct sea-keeping analysis and finite element analysis to calculate the vessel nominal stress in 100-year design storm events. Spectral-based fatigue analysis was also conducted to calculate the remaining fatigue lives on fatigue-sensitive connections along the vessel.
A qualitative Hazard Identification (HAZID) exercise is conducted with the information given from the strength and fatigue FEM assessment results. The input and output information are schematically shown in Fig. 1b. After the HAZID exercise, high risk-ranked structural components were chosen for subsequent structural reliability analyses. In addition, many components with medium to low risk ranking were also chosen such that a

ABS TECHNICAL PAPERS 2004
178 Structural Reliability Applications in Developing Risk-based Inspection Plans for a Floating Production Installation
good envelope of all structural components under different conditions can be given.
The structural reliability analysis essentially takes the deterministic FEM stress/fatigue analysis results, coupled with uncertain degradation mechanisms (e.g., corrosion rate, crack opening parameters, etc.), and tracks the time-varying structural reliability index of the structural
components under consideration. By performing this exercise, when and how often the structural components should be inspected can be informed.
The following sections describe in more details the technical aspects of the deterministic/probabilistic analyses.
Sea Keeping Analysis and Generation
of Load Cases
Global FEMAnalysis under
Current Scantling
Information Gatheringand Quantification of
Degradation Mechanisms
Hazard IdentificationExercise (HAZID) to Identify
Higher Risk Components
Selection of StructuralComponents to Perform
Structural Reliability
Strength ReliabilityAssessment
Fatigue ReliabilityAssessment
Hull GirderReliability Analysis
(First-Yield & Ultimate)
Stiffened/Un-StiffenedPanel Reliability
Analysis
S-N Curve BasedFatigue Reliability
Analysis
Fracture MechanicsBased Fatigue
Reliability Analysis
Correlation Studyon Similar
Connections
Determinationof Target Reliability
Level
Risk BasedInspection Extent
and Schedule
Fig. 1a A risk-based inspection planning reliability analysis flow chart
ABS TECHNICAL PAPERS 2004
Structural Reliability Applications in Developing Risk-based Inspection Plans for a Floating Production Installation 179
Forecasted Condition• Wastage comparisons to class
allowables
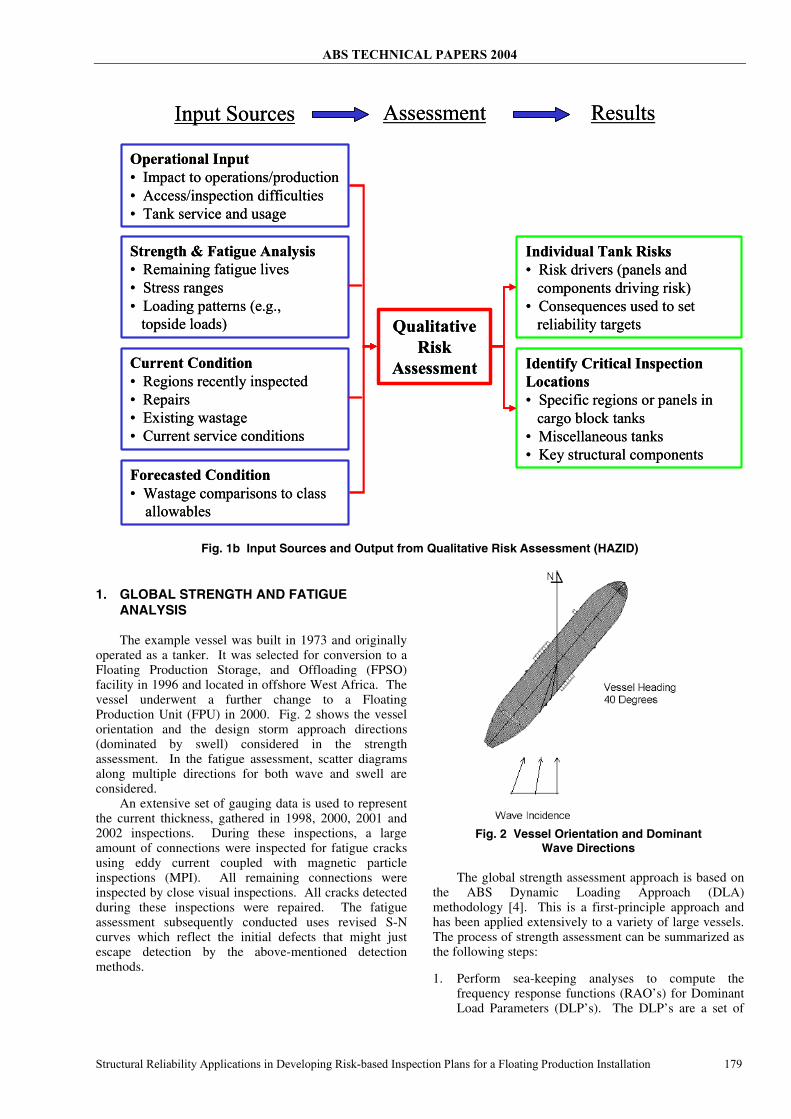
Operational Input• Impact to operations/production• Access/inspection difficulties• Tank service and usage
Strength & Fatigue Analysis• Remaining fatigue lives• Stress ranges• Loading patterns (e.g.,
topside loads)
Current Condition• Regions recently inspected• Repairs• Existing wastage• Current service conditions
Individual Tank Risks• Risk drivers (panels and
components driving risk)• Consequences used to set
reliability targetsQualitative Risk
Assessment Identify Critical Inspection Locations• Specific regions or panels in
cargo block tanks • Miscellaneous tanks• Key structural components
Input Sources ResultsAssessment
Forecasted Condition• Wastage comparisons to class
allowables
Operational Input• Impact to operations/production• Access/inspection difficulties• Tank service and usage
Strength & Fatigue Analysis• Remaining fatigue lives• Stress ranges• Loading patterns (e.g.,
topside loads)
Current Condition• Regions recently inspected• Repairs• Existing wastage• Current service conditions
Individual Tank Risks• Risk drivers (panels and
components driving risk)• Consequences used to set
reliability targetsQualitative Risk
Assessment Identify Critical Inspection Locations• Specific regions or panels in
cargo block tanks • Miscellaneous tanks• Key structural components
Input Sources ResultsAssessment
Fig. 1b Input Sources and Output from Qualitative Risk Assessment (HAZID)
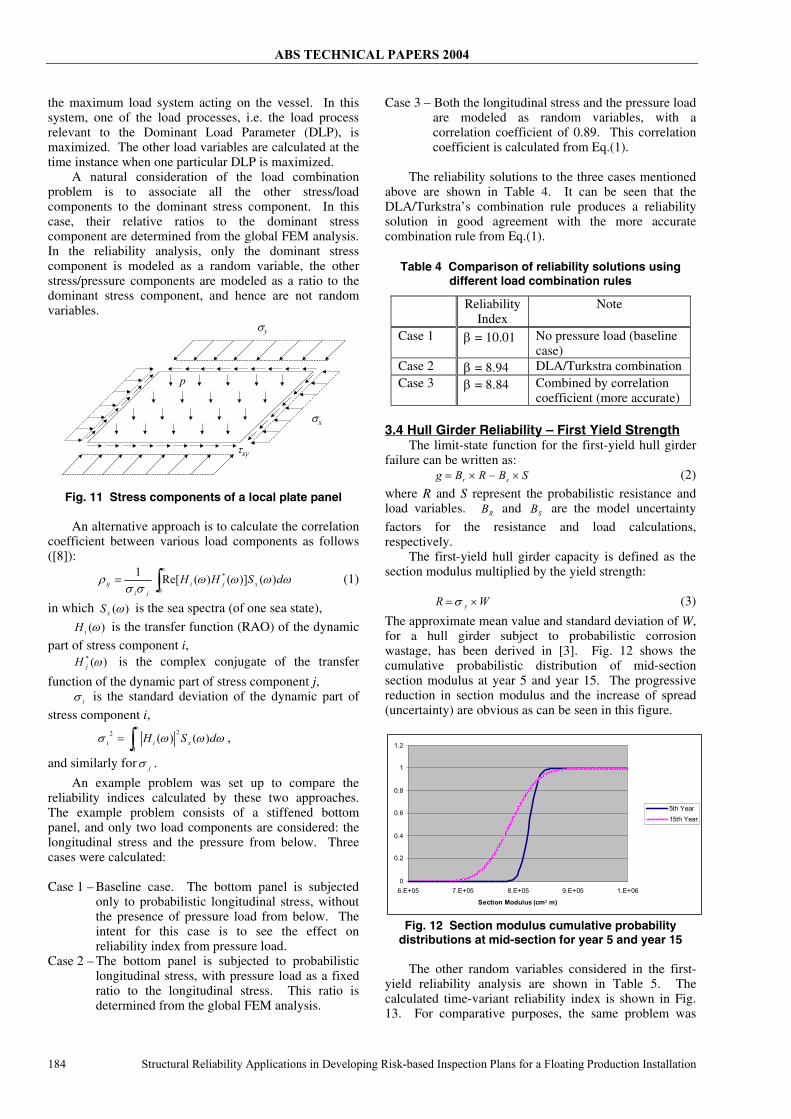
1. GLOBAL STRENGTH AND FATIGUE ANALYSIS The example vessel was built in 1973 and originally
operated as a tanker. It was selected for conversion to a Floating Production Storage, and Offloading (FPSO) facility in 1996 and located in offshore West Africa. The vessel underwent a further change to a Floating Production Unit (FPU) in 2000. Fig. 2 shows the vessel orientation and the design storm approach directions (dominated by swell) considered in the strength assessment. In the fatigue assessment, scatter diagrams along multiple directions for both wave and swell are considered.
An extensive set of gauging data is used to represent the current thickness, gathered in 1998, 2000, 2001 and 2002 inspections. During these inspections, a large amount of connections were inspected for fatigue cracks using eddy current coupled with magnetic particle inspections (MPI). All remaining connections were inspected by close visual inspections. All cracks detected during these inspections were repaired. The fatigue assessment subsequently conducted uses revised S-N curves which reflect the initial defects that might just escape detection by the above-mentioned detection methods.
Fig. 2 Vessel Orientation and Dominant
Wave Directions The global strength assessment approach is based on
the ABS Dynamic Loading Approach (DLA) methodology [4]. This is a first-principle approach and has been applied extensively to a variety of large vessels. The process of strength assessment can be summarized as the following steps:
1. Perform sea-keeping analyses to compute the frequency response functions (RAO’s) for Dominant Load Parameters (DLP’s). The DLP’s are a set of

ABS TECHNICAL PAPERS 2004
180 Structural Reliability Applications in Developing Risk-based Inspection Plans for a Floating Production Installation
load and vessel motion parameters that best characterize extreme loading conditions. The DLP’s considered in this analysis include vertical bending moment, vertical shear force, vertical acceleration, lateral acceleration and roll motion.
2. Perform response analysis for each combination of significant wave height and period. Calculate the extreme value distribution for each of the DLP’s.
3. Determine the equivalent wave system, which is a sinusoidal wave with its amplitude given by the quotient of extreme value for a particular DLP and the maximum value of the frequency response function. There are multiple equivalent wave systems as different DLP’s are maximized one after another. These multiple equivalent wave systems constitute the load cases going into the subsequent FEM analysis.
4. Perform global FEM analysis subject to the load cases generated from the previous step. The global finite element model is shown in Fig. 3.
Discussions of the technical details of the ABS DLA procedure are out of the scope of this paper. Interested reader can refer [4] for more in-depth information.
The fatigue assessment approach is based on the ABS Spectral Fatigue Analysis (SFA) methodology [5]. The stress range RAO’s at virtually every connection along the example vessel are calculated from the sea-keeping analysis. Long-term stress range Weibull distribution parameters are then calculated from the sea state scatter diagrams, and then compared to the S-N curve appropriate for that connection to derive the remaining fatigue lives. The stress concentration factors for several basic connection types (web toe bracket, side shell longitudinal, bottom longitudinal, etc.) are derived from fine-mesh FEM models. One such fine-mesh FEM model for the transverse frame web toe bracket is shown in Fig. 4.
Fig. 3 Global FEM model of Example Vessel
Fig. 4 A fine-mesh model of transverse frame web toe to calculate the stress concentration factor for fatigue
2. TARGET RELIABILITY LEVEL
The target reliability level is an acceptance criterion used in judging the adequency of the calculated structural reliability index (or equivalently the failure probability). In the reliability analysis of the current project, the target reliabiilties are established from the consideration of a “risk diagram”. Discussions on how to set target reliability levels can be found in, e.g., [7] and [26].
Fig. 5 shows such a risk diagram, which combines the consequence and likelihood information on a single chart. This risk digram was first developed by Whitman [17] in determining the target reliability for earth dams. The risk diagram as shown in Fig. 5 conveniently overlay the experiences from other industries, such that the current application can be put into perspective.
Three financial consequences are shown in Fig. 5, in which the highest consequence (Consequence I) means the total loss of vessel plus the loss of production for a time period of approximately twe years. Consequence II is one order of magnitude less than Consequence I in terms of financial loss, and similarly for Consequence III.
The target reliabilities established as described above are compared to the Ship Structure Committee (SSC) recommended values for tankers [13], which is presented in Table 1. Note that in Table 1 Consequence I is further divided into I-a and I-b, in which Consequence I-a applies to reliability analysis if the hull girder first-yield capacity is considered. Consequence I-b applies to the case where hull girder ultimate capacity is considered. Since first-yield capacity typically overestimates the true capacity of the hull girder, a higher reliability level is required. The Consequence I as shown in Fig. 5 is for Consequence I-b (the ultimate capacity, which represents the true capacity of the hull girder).

ABS TECHNICAL PAPERS 2004
Structural Reliability Applications in Developing Risk-based Inspection Plans for a Floating Production Installation 181
1.0E-06
1.0E-05
1.0E-04
1.0E-03
1.0E-02
1.0E-01
1.0E+00
0.01 0.1 1 10 100 1000 10000
Consequences of Failure (MM$)
Ann
ual P
f
DamsFixed
Platforms
Fixed Drilling Rigs
Unacceptable Region
Marginally Acceptable
Acceptable Region
Foundations
MODUs
Buildings
Commercial Aviation
Naval Combatants
Example VesselRBI Consequence I
Example VesselRBI Consequence II
Example VesselRBI Consequence III
Fig. 5 Risk diagram to determine acceptable annual probability for various financial consequences It can be seen that Table 1 shows a consistent
comparison between the target reliability levels established for our example vessel, and the SSC recommended values for tankers.
Table 1 Lifetime target reliability comparison between example vessel and Ship Structure Committee report
[13] recommended values
Consequence Example Vessel
Ship Structure
Committee
Example Vessel
Ship Structure
CommitteeI-a 4.50 4.50 N/A N/AI-b 4.00 4.00 N/A N/AII 3.20 3.50 3.20 3.00III 2.50 3.00 2.50 2.50IV 1.50 N/A 1.50 2.00
Strength Assessment Fatigue Assessment
Note: I-a refers to hull girder first-yield reliability I-b refers to hull girder ultimate reliability
3. STRENGTH RELIABILITY ANALYSIS For both hull girder and local plate panels, the
strength reliability analysis concerns three basic types of variables in the limit state function (A limit state function mathematically defines structural failure in the reliability analysis). These are the capacity of the structural component, the loads acting on the structural component, and the model uncertainties describing the confidence in applying the capacity and load equations. These types of variables will be described in the following sections.
For the structural capacity variables, first the probabilistic corrosion rate estimates have to be described. These estimates project the future plate thickness, and consequently have a direct bearing on the capacities of the structural components.
3.1 Corrosion Rate Estimate For tankers, a commonly used reference for corrosion
rate estimates is the Tanker Structure Cooperative Forum (TSCF) guidance manual [27]. Other databases collected by researchers and class societies also exist, many of them in the public domain (see, e.g., [10] and [16]). Collectively these sources provide a good starting point in
estimating future wastage for FPSO or FPU (such as the example vessel) structural components.
From the above-mentioned database, other factors specific to the example vessel (such as temperature, relative humidity, oxygen concentration, corrosion control measure, etc.) are considered to derive the corrosion rates on various parts along the vessel. An example output on these corrosion rate estimates is shown in Table 2.
Table 2 An example table of corrosion rate estimate on different structural components along the vessel
Min Max Min MaxCenter Deck Plate 23 230 4 18Tank Bottom Plate 5 25 10 80
Stbd. Bulkhead 13 125 5 100Port Bulkhead 13 125 5 100Structural Steel 13 150 13 150
Port Deck Plate 5 100 4 18Wing Tank Bottom Plate 2 49 10 80
Stbd. Bulkhead - Submerged 5 100 13 125 - Splashed 5 100 13 125Port Side Shell - Exposed 5 100 4 18 - Splashed 5 100 3 44 - Submerged 5 100 10 80Structural Steel 5 100 5 100
Corrosion Rate Estimates (µm/year) Tank Inboard Tank Outboard
Probabilistic corrosion rate distributions are
constructed based on the assumptions that the estimated minimum corrosion rate corresponds to a 5% non-exceedence probability, and 95% for the maximum corrosion rate. A popular distribution type for corrosion rate is the Weibull distribution function. An example Weibull corrosion rate distribution is shown in Fig. 6.
0 50 100 150 200 250 300 350 4000
0.001
0.002
0.003
0.004
0.005
0.006
0.007
Corrosion Rate (µm/year)
Prob
abili
ty D
ensi
ty F
unct
ion Min. Value
(5% of Non-Exceedance
Max. Value(95% of Non-Exceedance
Fig. 6 An example Weibull corrosion rate distribution
function, characteristic values are matched to the min/max corrosion rate estimates
An issue in applying probabilistic corrosion rates to a
hull girder reliability analysis is the degree of correlation between these rates on different structural components [3]. For two structural components close to each other, the observed wastage can be expected to be similar. Conversely, for structural components far apart, knowing the wastage on one component does not provide a good indication on the other.
In this project, probabilistic corrosion rates are specified in terms of “corrosion zones” as shown in Fig. 7. In each corrosion zone, a single probabilistic corrosion rate variable is given to all similar components (e.g. deck plate) within this zone. These corrosion rate variables are assumed to be statistically independent from one zone to

ABS TECHNICAL PAPERS 2004
182 Structural Reliability Applications in Developing Risk-based Inspection Plans for a Floating Production Installation
the next. All transverse frames analyzed for probabilistic hull girder strength are assumed to have the same pattern of corrosion zones as shown in Fig. 7.
Fig. 7 Assumed corrosion rate zones (in each zone the corrosion rate is modeled as a single random
variable for the same type of structural components)
3.2 Time-Variant Reliability Index Calculation Time-variant structural reliability problems refer to
the class of problems where either the loading or the resistance characteristics change with time. A marine vessel subject to corrosion is a typical example where the resistance degrades with time.
Fig.8 illustrates a time-variant problem where S(t) and R(t) represent the load and the resistance processes, respectively. Commonly this class of problems is referred to as the “first-passage” reliability problem because a single out-crossing (first-passage) signifies structural failure. Random process theories can be applied to this class of problem as outlined in standard texts such as, e.g., [1] and [2].
The current project utilizes an approximate method to solve the time-variant problem, in which only time-invariant structural reliability analyses (first/second order reliability methods) are involved. The basic idea of the approximate method is to represent the degrading strength by a series of step-wise non-degrading strength as shown in Fig. 8. Within each increment, since the strength is non-degrading, the time-invariant structural reliability method can be used to solve the failure probability in that increment. The total failure probability (i.e., the first-passage probability) can be approximated by summing the failure probabilities of all increments.
An example problem is tested to show the accuracy of the approximate method, with the following input parameters:
Stress Mean, 0.0=Sµ
Standard deviation, 5.0=Sσ
Mean Crossing Rate 10000 =+ν cycle/unit-time
Resistance mtRtR −= 0)(
Mean, 2.30
=Rµ
Standard deviation, 4102.30
−×=Rσ
Mean, 05.0=mµ
Standard deviation, 01.0=mσ
The results are compared to the first-passage reliability solution calculated from random process theory
[19], as shown in Table 3. It can be observed that the approximate reliability solutions are very close to the first-passage reliability solution.
Degrading Resistance, R(t)Approximated as Piece-Wise Non-Degrading
Load, S(t)Approximated as Peak Extreme-Value DistributionWithin a Time Interval
Time
Discretized TimeInterval
Fig. 8 Illustration of a first-passage reliability problem and simplification to a series of time-
invariant problems
Table 3 Comparison of the simplified time-variant reliability solution to the more accurate random
process first-passage solution
First-Passage RandomProcess Reliability Solution
31030.1 −×=fp ( 01.3=β )
Simplified Solution, Time Interval = 10
31020.1 −×=fp ( 04.3=β )
Simplified Solution, Time Interval = 20
31022.1 −×=fp ( 03.3=β )
3.3 Consideration of Loads
3.3.1 Hull Girder Loads The example vessel is a FPU with no frequent
loading/offloading, and consequently having a constant ballast pattern for most of the time. Storage and offloading are carried out on a nearby separate storage vessel. The still water bending moment is taken as a constant as given from the trim & stability manual.
The annual extreme value distribution for the wave-induced bending moment can be calculated from the sea-keeping analysis results, [4]. The wave-induced vertical bending moment is one of the Dominant Load Parameters as mentioned previously. The other DLP’s include vertical shear force, vertical acceleration, lateral acceleration and roll motion. Together these DLP’s establish the necessary set of load cases in the subsequent FEM analysis. The extreme probabilistic distributions for these other DLP’s are also calculated by the same procedure, and will be used in structural reliability analyses of later sections.
Hull girder probabilistic load distributions of a generic type, i.e., one without going through direct sea-keeping analysis have been discussed in, for example, [14] and [15]. Obviously, these generic load distributions will be subject to higher uncertainties compared to the one obtained from direct sea-keeping analysis.

ABS TECHNICAL PAPERS 2004
Structural Reliability Applications in Developing Risk-based Inspection Plans for a Floating Production Installation 183
3.3.2 Short-Term v.s. Long-Term Extreme Load Distributions As mentioned previously, the strength assessment of
the example floating production unit is conducted using the 100-yr design storm conditions from three approaching directions. This analysis approach is of the short-term type, which can be contrasted with the long-term approach where all sea-states are considered from the wave scatter diagram. It needs to be pointed out that the short-term approach is the standard practice in offshore industry for installations fixed in location.
In order to use the acceptable reliability level, as defined in Sec. 2, the long-term annual extreme value load distribution is required. To overcome this obstacle (of having only the short-term extreme loads), a sensitivity study was conducted to see if the calculated short-term extreme load distribution can be approximated as the long-term extreme load distribution.
Fig. 9 shows the vertical wave bending moment as calculated from the sea-keeping analysis (the Rayleigh distribution) for a single peak. The characteristic extreme value is associated with the probability that it will be exceeded once during the duration of the storm (12 hours in the present case). This characteristic extreme value for the Rayleigh distribution occurs at approximately 3E+10 kgf-cm on Fig. 9.
It is known that long-term wave load distribution follows the Weibull distribution. Additionally, it can be expected that the load characteristic extreme values calculated from either the short-term or the long-term approaches should be roughly the same [23]. Based on these assumptions, Weibull distributions are fitted at 3E+10 kgf-cm (the characteristic extreme value) with the probability level of being exceeded once in 15 years (the example vessel’s intended service life). The exceedence probability is once per 7.5E+7 occurrences of waves. Fig. 9 shows two such Weibull distributions with shape factors of 1.0 and 1.5, respectively.
0 5 109 1 1010 1.5 1010 2 1010 2.5 1010 3 10100
1.5 10 10
3 10 10
Vertical Wave Bending Moment (kgf-cm)
3 10 10
0
Rayleigh a( )
Weibull_1 a( )
Weibull_1_5 a( )
3 1010 0 a
Fig. 9 Single peak Rayleigh distribution calculated from the design sea state, versus assumed Weibull
distrubitons matched at extreme characteristic values and different shape factors (1.0 and 1.5)
Fig. 10 shows the extreme load distributions in 15
years on a log scale to magnify the tail values. They represent the maximum values in roughly 3,000 wave occurrences for the short-term approach, and 7.5E+7
wave occurrences for the long-term approach. The maximum values follow the Type-I extreme value distribution.
It can be seen from Fig. 10 that the maximum load extreme value distributions have similar shapes between the short-term and long-term approaches. Most importantly, they have similar spread, i.e., standard deviation, especially between the short-term curve (the “Rayleigh” curve) and the long-term curve with the Weibull shape factor of 1.0. In either case, the extreme load distribution constructed from the short-term approach has higher value on the tails, and hence will be more conservative in the reliability analysis.
From this sensitivity analysis, it is found that the approximation of short-term extreme load distribution as the long-term distribution is satisfactory for the purpose of risk-based inspection planning.
0 1 1010 2 1010 3 1010 4 1010 5 10101 10 15
1 10 14
1 10 13
1 10 12
1 10 11
1 10 10
1 10 9
Vertical Wave Bending Moment (kgf-cm)
3 10 10
10 15
Rayleigh a( )
Weibull_1 a( )
Weibull_1_5 a( )
5 1010 0 a
Fig. 10 Extreme load distribution, calculated from
sea-keeping analysis versus assumed parent Weibull distributions with different shape factors (1.0 and 1.5)
3.3.3 Load and Load Combination of Local Plate Panels Fig. 11 shows the typical stress components acting on
a local plate panel. In some structural members one of the stress components dominates (has higher magnitude than the other components), and in term is dominated by one of the DLP’s. For example, a stiffened deck panel is dominated by the compressive stress acting in the longitudinal direction along the vessel. This longitudinal stress is caused primarily from the vertical bending moment. By knowing the extreme load distribution of vertical bending moment from the sea-keeping analysis, this extreme longitudinal deck stress can be established. The association of the primary stress to a particular DLP is determined in the DLA process in the form of the controlling load case for the given plate panel.
For stress components other than the dominant stress, appropriate load combination rules needs to be considered to determine their contributions to the overall stress.
A simple and popular load combination rule is the Turkstra’s rule, in which the combined extreme response is defined as the maximum value of the dominant stress (occurred at time t) plus the other stress components occurred at the same time. The Dynamic Loading Approach (DLA) employed in the global finite element analysis is, in its essence, a form of the Turkstra’s rule. The DLA uses the “equivalent wave system” to represent
ABS TECHNICAL PAPERS 2004
184 Structural Reliability Applications in Developing Risk-based Inspection Plans for a Floating Production Installation
the maximum load system acting on the vessel. In this system, one of the load processes, i.e. the load process relevant to the Dominant Load Parameter (DLP), is maximized. The other load variables are calculated at the time instance when one particular DLP is maximized.
A natural consideration of the load combination problem is to associate all the other stress/load components to the dominant stress component. In this case, their relative ratios to the dominant stress component are determined from the global FEM analysis. In the reliability analysis, only the dominant stress component is modeled as a random variable, the other stress/pressure components are modeled as a ratio to the dominant stress component, and hence are not random variables.
σx
σy
τxy
p
Fig. 11 Stress components of a local plate panel An alternative approach is to calculate the correlation
coefficient between various load components as follows ([8]):
ωωωωσσ
ρ dSHH xjiji
ij )(])()(Re[10
*∫∞
= (1)
in which )(ωxS is the sea spectra (of one sea state),
)(ωiH is the transfer function (RAO) of the dynamic
part of stress component i, )(* ωjH is the complex conjugate of the transfer
function of the dynamic part of stress component j, iσ is the standard deviation of the dynamic part of
stress component i,
ωωωσ dSH xii )()(0
22 ∫∞
= ,
and similarly for jσ .
An example problem was set up to compare the reliability indices calculated by these two approaches. The example problem consists of a stiffened bottom panel, and only two load components are considered: the longitudinal stress and the pressure from below. Three cases were calculated:
Case 1 – Baseline case. The bottom panel is subjected
only to probabilistic longitudinal stress, without the presence of pressure load from below. The intent for this case is to see the effect on reliability index from pressure load.
Case 2 – The bottom panel is subjected to probabilistic longitudinal stress, with pressure load as a fixed ratio to the longitudinal stress. This ratio is determined from the global FEM analysis.
Case 3 – Both the longitudinal stress and the pressure load are modeled as random variables, with a correlation coefficient of 0.89. This correlation coefficient is calculated from Eq.(1).
The reliability solutions to the three cases mentioned
above are shown in Table 4. It can be seen that the DLA/Turkstra’s combination rule produces a reliability solution in good agreement with the more accurate combination rule from Eq.(1).
Table 4 Comparison of reliability solutions using
different load combination rules
Reliability Index
Note
Case 1 β = 10.01 No pressure load (baseline case)
Case 2 β = 8.94 DLA/Turkstra combination Case 3 β = 8.84 Combined by correlation
coefficient (more accurate)
3.4 Hull Girder Reliability – First Yield Strength The limit-state function for the first-yield hull girder
failure can be written as: SBRBg sr ×−×= (2)
where R and S represent the probabilistic resistance and load variables. RB and SB are the model uncertainty
factors for the resistance and load calculations, respectively.
The first-yield hull girder capacity is defined as the section modulus multiplied by the yield strength:
WR y ×= σ (3)
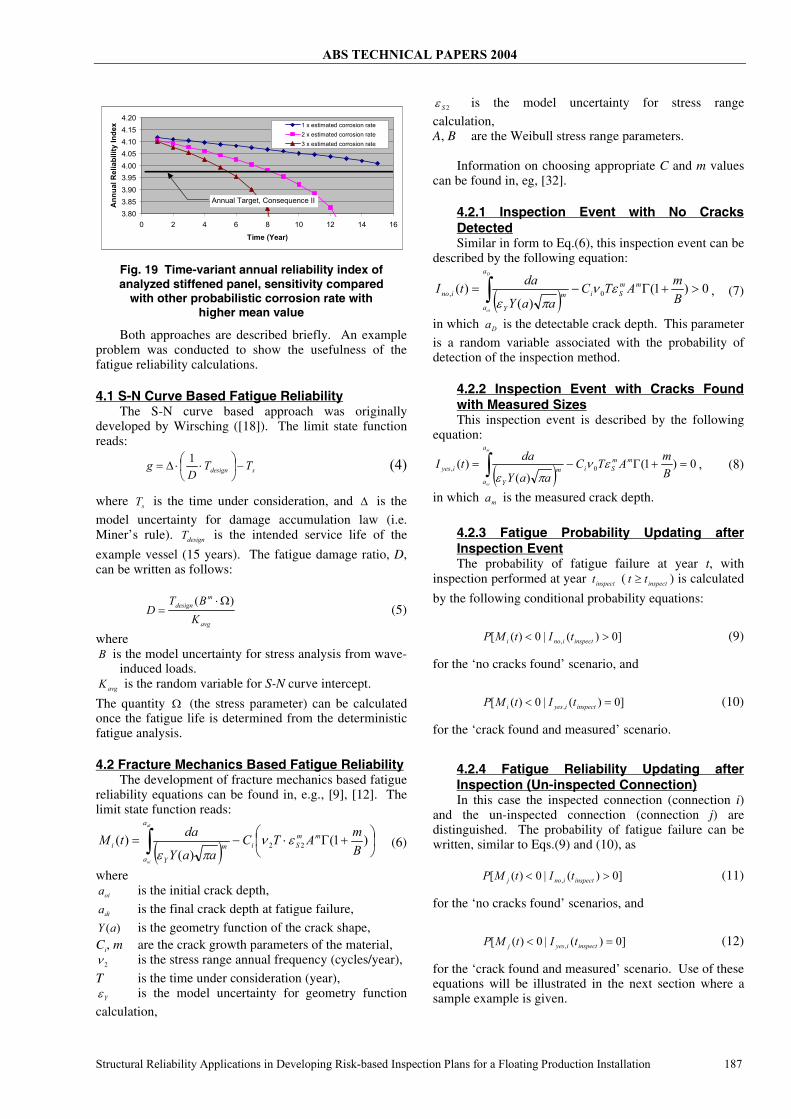
The approximate mean value and standard deviation of W, for a hull girder subject to probabilistic corrosion wastage, has been derived in [3]. Fig. 12 shows the cumulative probabilistic distribution of mid-section section modulus at year 5 and year 15. The progressive reduction in section modulus and the increase of spread (uncertainty) are obvious as can be seen in this figure.
0
0.2
0.4
0.6
0.8
1
1.2
6.E+05 7.E+05 8.E+05 9.E+05 1.E+06
Section Modulus (cm2 m)
5th Year15th Year
Fig. 12 Section modulus cumulative probability
distributions at mid-section for year 5 and year 15 The other random variables considered in the first-
yield reliability analysis are shown in Table 5. The calculated time-variant reliability index is shown in Fig. 13. For comparative purposes, the same problem was

ABS TECHNICAL PAPERS 2004
Structural Reliability Applications in Developing Risk-based Inspection Plans for a Floating Production Installation 185
analyzed except both the still-water bending and the vertical wave bending moment suitable for unrestricted tanker services (see, e.g., [14], [15]) are used. This result is also shown in Fig. 13. The results show that due to the significant reduction in both still-water load and wave load, the hull girder failure probability is significantly reduced and satisfies the target acceptable level as defined in Sec. 2.
Table 5 List of random variables in first-yield hull
girder reliability analysis
Mean cov Distribution Type
Comment
yσ , Yield Strength
1.10* Nominal
10% Normal
sM , Still Water Moment
As given by trim & stability manual
N/A N/A Constant
wM , Wave- Induced Moment
Calculated Calculated Type-I Extreme
Calculated from sea-keeping analysis.
Original Plate Component Thickness
As gauged N/A N/A Determined from gaugingassessments. Regarded as deterministic.
Corrosion Rate
Estimated Estimated Weibull
rB , Model Uncertainty Factor – Capacity
1.0 - - Equations forgeometric section modulus calculation are assumed to have no uncertainties.
sB , Model Uncertainty Factor – Wave Load
1.0 10% Normal Estimate
3.5 Hull Girder Reliability – Ultimate Strength The hull girder ultimate capacity is calculated as
described in [20], which starts from the assumed stress profile as shown in Fig. 14. Subsequently the position of neutral axis is determined from force balances, and the ultimate moment capacity can be calculated from the stress profile once the neutral axis has been determined.
1.E-15
1.E-14
1.E-13
1.E-12
1.E-11
1.E-10
1.E-09
1.E-08
1.E-07
1.E-06
1.E-05
1.E-04
1.E-03
1.E-02
1.E-01
1.E+00
0 2 4 6 8 10 12 14 16 18 20
Year
Ann
ual P
roba
bilit
y of
Fai
lure
Example Vessel
Unrestricted Tanker Load
(Acceptable Target Level)
Fig. 13 Hull girder first-yield annual probability of
failure, example vessel versus same vessel but subjected to unrestricted loads
The calculation of ultimate moment capacity by the above-mentioned approach, together with the probabilistic thinning of plate components due to corrosion, is too complex to be implemented as an integral part in the limit state function similar to Eq.(2). Instead, Monte Carlo simulations were carried out first to determine the mean value and standard deviation of the ultimate moment capacity. In these simulations, the basic random variables are the corrosion rates on various structural components, yield strength and modeling uncertainty of a simplified panel buckling equation [20].
An example result of such simulations is shown in Fig. 15, upon which a Gaussian distribution is fitted to the simulated results with good agreements.
Fig. 14 Assumed stress profile at ultimate bending
capacity for a transverse frame (left: sagging, right: hogging) [20]
Frequency Comparison
.000
.006
.012
.018
.024
1.60E+9 1.85E+9 2.10E+9 2.35E+9 2.60E+9
Normal DistributionMean = 2.10E+9Std Dev = 1.83E+8
Sagging Moment
Overlay Chart
Fig. 15 Simulated (5,000 simulations) ultimate moment capacity (kgf-m) at mid-section (year 15)
The list of random variables is similar to Table 5, and
hence will not be repeated. An exception is the capacity uncertainty factor, which is taken to have a relatively large coefficient of variation of 20% to consider the approximation of buckling strength on the compression side of the hull girder.
The reliability analysis result on the mid-section is shown in Fig. 16, together with the comparative case with unrestricted service load showing the sensitivity with respect to this variable. Curves in this figure are non-smooth due to the fact that Monte Carlo simulation is used for ultimate strength calculation, while curves in Fig. 13 are smooth because analytical expressions are available for the probabilistic parameters of section modulus. It is determined that the projected time-variant reliability index is sufficient during the service life of example vessel.

ABS TECHNICAL PAPERS 2004
186 Structural Reliability Applications in Developing Risk-based Inspection Plans for a Floating Production Installation
1.E-15
1.E-14
1.E-13
1.E-12
1.E-11
1.E-10
1.E-09
1.E-08
1.E-07
1.E-06
1.E-05
1.E-04
1.E-03
1.E-02
1.E-01
1.E+00
0 2 4 6 8 10 12 14 16 18 20
Year
Ann
ual P
roba
bilit
y of
Fai
lure
Example Vessel
Unrestricted Tanker Load
(Acceptable Target Level)
Fig. 16 Hull girder ultimate capacity annual
probability of failure, example vessel versus same vessel but subjected to unrestricted loads
3.6 Stiffened Panel Reliability The limit state function of the stiffened panel
reliability calculation is in the same form as Eq.(2). The calculations on the load part have been covered in Sec. 3.3.3.
The ultimate capacity of a stiffened panel is calculated using ABS Steel Vessel Rule’s (SVR) [28] ultimate capacity equations. Three failure modes are considered in SVR:
- Overall stiffened panel buckling. - Longitudinal stiffener buckling as a beam-
column. - Longitudinal stiffener buckling from tripping. Specific formulations of the ultimate capacity
equations can be found in [28], and will not be repeated here. Accuracy of the SVR’s ultimate capacity is checked by comparing capacity predictions to the results as reported in [11], where for several stiffened-panel examples both experimental and sophisticated nonlinear FEM results are available. These comparisons are shown in Fig. 17.
The SVR’s ultimate capacity equations show close agreement to either the experimental or nonlinear FEM results. For the purpose of inspection planning, these equations present a practical way of implementing the limit-state functions in the reliability calculations. The list of random variables will be similar to Table 5, with the exception that the SVR ultimate strength prediction needs to be multiplied by a model uncertainty factor (bias factor), with a mean value of 1.06, and a coefficient of variation of 18%, to represent the true capacity.
00.20.40.60.8
11.21.4
0 1 2 3 4 5 6
Panel Number
Ratio
to E
xper
imen
t
FEA-1FEA-2ULSAPABS
Fig. 17 Comparison of stiffened panel ultimate capacity predictions by ABS Steel Vessel Rule
equations [28] and more sophisticated FEM results and tests [11]
A bottom panel is chosen for the reliability analysis, as shown in Fig. 18. This panel shows the highest compressive stress, which is associated with vertical wave bending moment in the hogging direction. The reliability analysis results are shown in Fig. 19, with an assumed Consequence II in the event of buckling this panel. The results show the reliability level for this panel stays above the acceptable level throughout the service life of the example vessel. Note that for different panels, different consequences are assigned based on risk considerations. These consequence information are determined from the HAZID analysis.
A couple of sensitivity studies were conducted with increasing corrosion rate estimates. The results in Fig. 19 show that the corrosion rate affects the reliability index significantly, as can be expected. In the inspection planning, the corrosion rate will have to be periodically monitored and updated from future gauging and coupon test specimens.
Analyzed Panel
Fig. 18 Vessel bottom stress (maximum compressive, units in kgf/cm2) plot and the stiffened panel chosen
for example reliability analysis
4. FATIGUE RELIABILITY ANALYSIS Fatigue reliability analysis can be conducted by either
the S-N curve based approach or the fracture mechanics based approach. The S-N curve based approach is both efficient and involves fewer variables, in addition it is also better developed ([18], [29], [30], [31]).
The fracture mechanics based approach is powerful in that it can better deal with an important class of fatigue reliability problems: the updating problem and the correlation sampling problem (extended updating problem). The “sampling problem” is related to the updating of fatigue reliability for a connection that is not directly inspected, but can be resolved by comparison to a similar connection that is inspected. Due to the similarities (from either the material property or the stress ranges) between these connections, the updating on the fatigue reliability is rational, even on a connection which is not inspected directly.
ABS TECHNICAL PAPERS 2004
Structural Reliability Applications in Developing Risk-based Inspection Plans for a Floating Production Installation 187
3.803.853.903.954.004.054.104.154.20
0 2 4 6 8 10 12 14 16
Time (Year)
Ann
ual R
elia
bilit
y In
dex 1 x estimated corrosion rate
2 x estimated corrosion rate3 x estimated corrosion rate
Annual Target, Consequence II
Fig. 19 Time-variant annual reliability index of analyzed stiffened panel, sensitivity compared
with other probabilistic corrosion rate with higher mean value
Both approaches are described briefly. An example problem was conducted to show the usefulness of the fatigue reliability calculations.
4.1 S-N Curve Based Fatigue Reliability The S-N curve based approach was originally
developed by Wirsching ([18]). The limit state function reads:
sdesign TTD
g −⎟⎠⎞
⎜⎝⎛ ⋅⋅∆=
1 (4)
where sT is the time under consideration, and ∆ is the
model uncertainty for damage accumulation law (i.e. Miner’s rule). designT is the intended service life of the
example vessel (15 years). The fatigue damage ratio, D, can be written as follows:
avg
mdesign
KBT
D)( Ω⋅
= (5)
where B is the model uncertainty for stress analysis from wave-
induced loads. avgK is the random variable for S-N curve intercept.
The quantity Ω (the stress parameter) can be calculated once the fatigue life is determined from the deterministic fatigue analysis.
4.2 Fracture Mechanics Based Fatigue Reliability The development of fracture mechanics based fatigue
reliability equations can be found in, e.g., [9], [12]. The limit state function reads:
( ) ⎟⎠⎞
⎜⎝⎛ +Γ⋅−= ∫ )1(
)()( 22 B
mATCaaY
datM mmSi
a
a
m
Y
i
di
oi
ενπε
(6)
where oia is the initial crack depth,
dia is the final crack depth at fatigue failure,
)(aY is the geometry function of the crack shape, Ci, m are the crack growth parameters of the material,
2ν is the stress range annual frequency (cycles/year),
T is the time under consideration (year), Yε is the model uncertainty for geometry function
calculation,
2Sε is the model uncertainty for stress range
calculation, A, B are the Weibull stress range parameters.
Information on choosing appropriate C and m values
can be found in, eg, [32].
4.2.1 Inspection Event with No Cracks Detected Similar in form to Eq.(6), this inspection event can be
described by the following equation:
( ) 0)1()(
)( 0, >+Γ−= ∫ BmATC
aaY
datI mmSi
a
a
m
Y
ino
D
oi
ενπε
, (7)
in which Da is the detectable crack depth. This parameter
is a random variable associated with the probability of detection of the inspection method.
4.2.2 Inspection Event with Cracks Found with Measured Sizes This inspection event is described by the following
equation:
( ) 0)1()(
)( 0, =+Γ−= ∫ BmATC
aaY
datI mmSi
a
a
m
Y
iyes
m
oi
ενπε
, (8)
in which ma is the measured crack depth.
4.2.3 Fatigue Probability Updating after Inspection Event The probability of fatigue failure at year t, with
inspection performed at year inspectt ( inspecttt ≥ ) is calculated
by the following conditional probability equations:
]0)(|0)([ , >< inspectinoi tItMP (9)
for the ‘no cracks found’ scenario, and
]0)(|0)([ , =< inspectiyesi tItMP (10)
for the ‘crack found and measured’ scenario.
4.2.4 Fatigue Reliability Updating after Inspection (Un-inspected Connection) In this case the inspected connection (connection i)
and the un-inspected connection (connection j) are distinguished. The probability of fatigue failure can be written, similar to Eqs.(9) and (10), as
]0)(|0)([ , >< inspectinoj tItMP (11)
for the ‘no cracks found’ scenarios, and
]0)(|0)([ , =< inspectiyesj tItMP (12)
for the ‘crack found and measured’ scenario. Use of these equations will be illustrated in the next section where a sample example is given.

ABS TECHNICAL PAPERS 2004
188 Structural Reliability Applications in Developing Risk-based Inspection Plans for a Floating Production Installation
4.2.5 Probability of Detection (POD) The probability of detection used in this project was
adopted from the information contained in [12]. These detection probabilities for the close visual and the MPI inspection are shown in Fig. 20. With reference to this figure, the POD can be represented by the following Exponential distribution:
( ))(exp1)( τλ −⋅−−= xxF (13) The distribution parameters for the close visual and the MPI inspections are also listed in Table 6.
Fig. 20 Probability of detection (POD) for the close
visual inspection and MPI inspection [20]
4.3 An Example Fatigue Reliability Updating Problem
The example problem in this section illustrates how the reliability methodologies as described in the above sections are used. The example problem consists of the following solution procedure: 1. By given a fatigue life and the S-N curve used in that
fatigue life calculation, calculate the fatigue reliability index using the S-N curve based reliability method.
2. Using the fracture mechanics based reliability methodology, adjust some of the random variable parameters such that the reliability index roughly matches the results as obtained from the S-N curve based reliability method.
3. Assuming inspections are performed at the 5th, 10th and 15th year, calculate the updated reliability index (on an inspected connection). Assume no fatigue cracks are found during these inspections.
4. Calculate the updated reliability index for an un-inspected connection, with increasing number of inspected connections (also assuming no cracks are found among these inspections). The sensitivity of reliability index updating using different assumptions of correlation coefficients is studied. The fatigue connection considered in this example is
assumed to have a fatigue life of 20 years. Assuming S-N curve D applies to this example connection, the fatigue reliability index, using the random variables as shown in Table 7, is shown in Fig. 21. The connection has been analyzed in [33] with the same random variables as listed in Table 7.
Table 6 POD exponential distribution parameters corresponding to Fig. 20
Close Visual Inspection
MPI Inspection
τ , crack length at zero detection probability
15mm
0mm
λ , exponential distribution parameters
0.0462mm-1
0.1279mm-1
Table 7 List of random variables for S-N curve based
reliability calculation
Variable
Description
Symbol
Distribu-tion Type
Mean
c.o.v. S-N curve intercept on the 10Log
scale
)(10 avgKLog Log-Normal
12.60 (D curve)
1.74% (D) (51% on linear scale)
Model uncertainty (fatigue damage accumulation)
∆ Log-Normal
1.0 30%
Model uncertainty (wave-induced stress calculation)
1B Log-Normal
1.0 15%
A fracture mechanics based reliability calculation for
the same example connection was calculated based on the variables as listed in Table 8. As mentioned previously, some of the distribution parameters have been adjusted by trial and error such that the calculated reliability index roughly matches the S-N curve based reliability calculations, as shown in Fig. 21.
The updated fatigue reliability index is calculated using Eqs. (7) and (11) for the example connection assuming MPI inspections are performed at the 5th, 10th and 15th years with no cracks found. The results are shown in Fig. 22.
0123456
0 5 10 15 20 25
Year
Beta beta (S-N)
beta (FM)
Fig. 21 Fatigue reliability variation for the example
problem
The following discussion concerns fatigue reliability updating for a connection that is not directly inspected, but a large number of similar connections have been inspected with no fatigue cracks found (the sampling problem). The similarity is defined by the statistical correlation coefficients between three parameters: the crack growth parameter C, and the Weibull stress range parameters A and B.

ABS TECHNICAL PAPERS 2004
Structural Reliability Applications in Developing Risk-based Inspection Plans for a Floating Production Installation 189
Table 8 List of variables for the FM based reliability calculation
Variable Description
Symbol
Distribution Type
Mean
c.o.v.
Initial crack size (mm)
sa Exponential 0.11
100%
Average stress cycle per year
0v Fixed 6105.2 × -
Crack growth parameter
)ln(C Normal -29.7 1.01%
Crack growth parameter
m Fixed 3.0 -
Weibull stress parameter
)ln(A Normal 2.26 6.6%
Weibull stress parameter
1/B Normal 1.43 7%
Stress modeling error
se Normal 1.0 10%
Random geometry factor
ye Normal 1.0 10%
Crack aspect ratio
a/c Fixed 0.15 -
Plate thickness (mm)
z Fixed 30 -
Plate width (mm)
b Fixed 10,000 -
0
1
2
3
4
5
0 5 10 15 20 25
Time (Year)
Beta
Fig. 22 Fatigue reliability updating on the inspected
connection using MPI inspection method Six cases were set up, as shown in Table 9, to look at
the degree of fatigue reliability updating for various combination of correlation coefficient between the above-mentioned three parameters. The results are presented in Figs. 23 and 24.
The sampling problem calculates the fatigue reliability updates at one particular time, year 11, for demonstration purposes. From Fig. 21, the fatigue reliability index on an un-inspected connection is roughly β = 2.1. Figs. 23 and 24 show the gradual increase on the reliability index with increasing numbers of inspection on similar connections.
The numerical implementation of the sampling problem is not an easy task. Eq. (11) is used to calculate the conditional probability of updated fatigue reliability. As the number of inspections become larger, more conditional events have to be included into Eq. (11) and hence making the conditionally probability more and more difficult to be evaluated. With fracture mechanics equations coupled with complicated geometry function (e.g., in the case of a surface crack), it becomes challenging to have efficient evaluations on the sampling problem for a large number of inspection events.
Table 9 Case definitions in the sensitivity study of a sampling problem
( ))ln(),ln( ji CCρ ( ))ln(),ln( ji AAρand
( )ji BB /1,/1ρ
Comments
Case 1 0.50 1.00 Medium correlation on crack growth parameter, and full correlation on Weibull stress parameters
Case 2 0.50 0.75 Medium correlation on crack growth parameter, and medium correlation on Weibull stress parameters
Case 3 0.50 0.50 Medium correlation on crack growth parameter, and low correlation on Weibull stress parameters
Case 4 0.25 1.00 Low correlation on crack growth parameter, and full correlation on Weibull stress parameters
Case 5 0.25 0.75 Low correlation on crack growth parameter, and medium correlation on Weibull stress parameters
Case 6 0.25 0.50 Low correlation on crack growth parameter, and low correlation on Weibull stress parameters
Until more efficient computation method can be
developed, the current project employs a simplistic approach to evaluate the fatigue reliability updating for a large number of inspection events. For the case 1 calculation, up to 10 inspection events are calculated and shown in Fig. 23. It appears on the figure that the fatigue reliability follows a linear trend on a log-log plot. We then follow the linear extrapolation from these points outward to approximate the cases for large number of inspection events.
1
10
1 10 100 1000Number of Inspected Connections
Fatig
ue R
elia
bilit
y In
dex
Case 1Case 2Case 3
Fig. 23 Fatigue reliability updating on an un-inspected
connection at year 11 from various numbers of inspected similar connections (cases 1, 2 and 3)

ABS TECHNICAL PAPERS 2004
190 Structural Reliability Applications in Developing Risk-based Inspection Plans for a Floating Production Installation
Apparently judgments need to be applied in deciding which set of correlation coefficient is the most appropriate. If, for example, case 2 is employed and the acceptance criterion requires the fatigue reliability be maintained at β = 3.0, 100 fatigue inspections among a large set of connections are required to ensure the rest of the un-inspected connections are acceptable. We reiterate that this example problem assumes no cracks are found during inspections. In the case where fatigue cracks are found, similar calculations can be performed using Eq. (12).
1
10
1 10 100 1000Number of Inspected Connections
Fatig
ue R
elia
bilit
y In
dex
Case 4Case 5Case 6
Fig. 24 Fatigue reliability updating on an un-inspected
connection at year 11 from various numbers of inspected similar connections (cases 4, 5 and 6)
CONCLUSIONS A framework of structural reliability analysis is
provided and demonstrated to assist the process of laying out a risk-based inspection plan. Both strength and fatigue reliability assessments are addressed. Several original approaches are proposed within this framework to facilitate easy implementation. These proposed approaches are validated through examples whenever possible.
The methodology and procedure described in this paper is currently being implemented on a ship-shaped floating production facility. This framework is also organized in a fashion such that when future inspections are conducted, reliability indices are adjusted to reflect the actual vessel condition. Subsequent changes to the inspection plan can be made using the same framework.
ACKNOWLEDGMENTS The analysis work from our following colleagues are
gratefully acknowledged: Simon Thurlbeck, James Phipps, George Smith, Ernie Kottle, Soontaek Lee, Omar de Andrade, Vanja Bogdanovic, Ying Lee, Sue Wang, Sarah Orton, Sriram Narasimhan, as well as Steven Wu, Ray Kuo and Nick Zettlemoyer from ExxonMobil Upstream Research Company.
It is emphasized that the views expressed herein are those of the authors and do not necessarily reflect those of Energo Engineering, ABS Consulting, ABS or ExxonMobil.
REFERENCES [1] Madsen, H., Krenk, S. and Lind N. C., Methods of
Structural Safety, Prentice-Hall Inc., 1986. [2] Melchers, R., Structural Reliability Analysis and
Prediction, John Wiley & Sons, 1999. [3] Guedes Soares, C. and Garbatov, Y., “Reliability
Assessment of Maintained Ship Hulls with Correlated Corroded Elements”, Marine Structures, V.10, pp. 629-653, 1998.
[4] American Bureau of Shipping, Guidance Notes on “Safehull-Dynamic Loading Approach” for Floating Production, Storage and Offloading (FPSO) Systems, 2001.
[5] American Bureau of Shipping, Guidance Notes on Spectral-Based Fatigue Analysis for Floating Production, Storage and Offloading (FPSO) Systems, 2002.
[6] Akpan, U., Koko, T., Ayyub, B. and Dunbar, T., “Risk Assessment of Aging Ship Hull Structures in the Presence of Corrosion and Fatigue”, Marine Structures, V.15, pp. 211-231, 2002.
[7] Bhattacharya, B., Basu, R. and Ma, K., “Developing Target Reliability for Novel Structures: the Case of the Mobile Offshore Base”, Marine Structures, 14, pp.37-58, 2001.
[8] Mansour, A., “Extreme Loads and Load Combinations”, Journal of Ship Research, Vol. 39, No. 1, March 1995, pp. 53-61.
[9] Moan, T. and R. Song, “Implication of Inspection Updating on System Fatigue Reliability of Offshore Structures”, Proceedings of the 17th International Conference on Offshore Mechanics and Arctic Engineering, OMAE98-1214, 1998.
[10] Paik, J. K., Lee, J. M., Hwang, J. S. and Park Y. I., “A Time-Dependent Corrosion Wastage Model for the Structures of Single- and Double-Hull Tankers and FSOs and FPSOs”, Marine Technology, Vol.40, No.3, pp.201-217, 2003.
[11] Paik J. K. and Thayamballi A. K., Ultimate Limit State Design of Steel-Plated Structures, John Wiley & Sons, 2003.
[12] Ship Structure Committee, Ship Maintenance Project: Fatigue Damage Evaluation, SSC-386-I, 1995.
[13] Ship Structure Committee, Probability Based Ship Design: Implementation of Design Guidelines, SSC-392, 1996.
[14] Sun, Hai-Hong and Bai, Yong, "Time-Variant Reliability of FPSO Hulls". SNAME Transactions, Vol.109, Paper No. 15, Orlando, Florida, USA, Oct. 2001.
[15] Wang, X. and T. Moan, “Reliability Analysis of Production Ships”, International Journal of Offshore and Polar Engineering, Vol. 4, No. 4, pp. 302-311, December 1994.
[16] Wang, G., Spencer, J., Sun, H., “Assessment of Corrosion Risks to Aging Ships Using an Experience Database”, Proceedings of the 22nd International Conference on Offshore Mechanics and Arctic Engineering, OMAE2003-37299, 2003.
ABS TECHNICAL PAPERS 2004
Structural Reliability Applications in Developing Risk-based Inspection Plans for a Floating Production Installation 191
[17] Whitman, R., “Evaluating Calculated Risk in Geotechnical Engineering”, Journal of Geotechnical Engineering, ASCE, 110(2), pp.145-188, 1984.
[18] Wirsching, P. H. and Chen, Y.-N., "Consideration on Probability-Based Fatigue Design for Marine Structures", Journal of Marine Structures, Vol.1, 1988, pp. 23-45.
[19] Wirsching, P. and Nguyen, H., Reliability of Degrading Ship Structures: Application of the Time Dependent First Passage Problem to Ship Components, A report prepared for the American Bureau of Shipping, 1999.
[20] Ship Structure Committee, Assessment of Reliability of Ship Structures, SSC-398, 1997.
[21] Guedes Soares, C., Dogliani, M., Ostergaard, C., Parmentier, G. and Pedersen, P., “Reliability Based Ship Structural Design”, SNAME Transactions, Vol.104, pp. 357-389, 1996.
[22] Lotsberg, I., Sigurdsson, G. and Wold, P., “Probabilistic Inspection Planning of the Asgard A FPSO Hull Structure with Respect to Fatigue”, Proceedings of the 18th Conference on Offshore Mechanics and Arctic Engineering, OMAE99/S&R-6040, 1999.
[23] Ochi, M., “Wave Statistics for the Design of Ships and Ocean Structures”, SNAME Transactions, Vol.86, pp. 47-76, 1978.
[24] Mathisen, J and Larsen, K., “Risk-Based Inspection Planning for Mooring Chain”, Proceedings of the 21st International Conference on Offshore Mechanics and Artic Engineering, OMAE2002-28409, 2002.
[25] Faber, M., “Risk-Based Inspection: The Framework”, Structural Engineering International, Vol.12, No.3, pp.186-195, August, 2002.
[26] Stahl, B., Aune, S., Gebara, J. and Cornell, A., “Acceptance Criteria for Offshore Platforms”, Journal of Offshore Mechanics and Arctic Engineering, Vol.122, pp.153-156, August, 2002.
[27] TSCF (Tanker Structure Cooperative Forum), Guidance Manual for Tanker Structures, issued by Tanker Structure Co-operative Forum in association with International Association of Classification Societies, Witherby & Co. Ltd., 1997.
[28] American Bureau of Shipping, Rules for Building and Classing Steel Vessels, 2002.
[29] Wirsching, P., Torng, T., Geyer, J. and Stahl, B., “Fatigue Reliability and Maintainability of Marine Structures”, Marine Structures, Vol.3, pp.265-284, 1990.
[30] Folso, R., Otto, S. and Parmentier, G., “Reliability-based calibration of fatigue design guidelines for ship structures”, Marine Structures, Vol.15, pp.627-651, 2002.
[31] Lassen, T. and Sorensen, J., “A probabilistic damage tolerance concept for welded joints. Part 2: a supplement to the rule based S-N approach”, Marine Structures, Vol.15, pp.615-626, 2002.
[32] BSI, Guide on Methods for Assessing the Acceptability of Flaws in Fusion Welded Structures, BS7910:1999.
[33] Mansour, A., Wirsching, P., McGovney, J., Mushtaq, S., Development of Reliability Based Classification Rules for Tankers, A Report Prepared for American Bureau of Shipping, 2002.
