structural model of the cytosolic domain of etr1 1 structural model
TRANSCRIPT
Structural model of the cytosolic domain of ETR1
1
Structural model of the cytosolic domain of the plant ethylene receptor 1 (ETR1)*
Hubert Mayerhofer1, Saravanan Panneerselvam2, Heidi Kaljunen, Anne Tuukkanen, Haydyn D. T. Mertens & Jochen Mueller-Dieckmann3
EMBL Hamburg c/o DESY, Building 25A, Notkestraße 85, 22603 Hamburg, Germany
1 Current address: Institut de Biologie Structurale, UMR5075 CEA-CNRS-Université Joseph Fourier Grenoble 1, 71 avenue des Martyrs, 38044 Grenoble, France
2 Current address: HASYLAB, DESY, Building 25F, Notkestraße 85, 22603 Hamburg, Germany
3 Current address: Abteilung für Mikrobiologie und Biotechnologie, Biozentrum Klein Flottbek, Universität
Hamburg, Ohnhorststraße 18, 22609 Hamburg, Germany
*Running title: Structural model of the cytosolic domain of ETR1
To whom correspondence should be addressed: Jochen Mueller-Dieckmann, Abteilung für Mikrobiologie und Biotechnologie, Biozentrum Klein Flottbek, Universität Hamburg, Ohnhorststraße 18, 22609 Hamburg, Germany, e-Mail: [email protected], Tel: +49 40 42816 651, Fax: +49 40 42816 459
Keywords: Arabidopsis thaliana, small-‐angle X-‐ray scattering (SAXS), crystal structure, plant hormone, histidine kinase, ethylene receptor, two-component system
Background: Signalling of the phytohormone ethylene is initiated by ethylene receptors.
Results: We present two crystal structures and a solution model of the entire cytosolic domain of ETR1.
Conclusion: This first structural model of the cytosolic domains reveals a flexible receiver domain and asymmetry of the central dimerization domain.
Significance: The molecular architecture of the isolated cytosolic domain forms the basis to understand receptor assembly and interaction.
ABSTRACT Ethylene initiates important aspects of plant growth and development through disulfide-linked receptor dimers, located in the endoplasmic reticulum. The receptors feature a small trans-membrane, ethylene binding domain followed by a large cytosolic domain, which serves as a scaffold for the assembly of large molecular weight complexes of different ethylene receptors and other cellular participants of the ethylene signalling pathway. Here we report the crystallographic structures of the ETR1 Catalytic ATP-binding (CA) and the Ethylene
response sensor 1 (ERS1) Dimerization Histidine phosphotransfer (DHp) domains and the solution structure of the entire cytosolic domain of ETR1, all from A. thaliana. The isolated dimeric ERS1 DHp domain is asymmetric, the result of different helical bending angles close to the conserved His residue. The structures of the CA, DHp and receiver domains of ethylene receptors and of a homologous, but dissimilar, GAF domain were refined against experimental SAXS data, leading to a structural model of the entire cytosolic domain of the ethylene receptor 1. The model illustrates that the cytosolic domain is shaped like a dumbbell and that the receiver domain is flexible and assumes a different position from those observed in prokaryotic histidine kinases. Furthermore the cytosolic domain of ETR1 plays a key role, interacting with all other receptors and several participants of the ethylene-signalling pathway. Our model, therefore, provides the first step towards a detailed understanding of the molecular mechanics of this important signal transduction process in plants.
http://www.jbc.org/cgi/doi/10.1074/jbc.M114.587667The latest version is at JBC Papers in Press. Published on December 1, 2014 as Manuscript M114.587667
Copyright 2014 by The American Society for Biochemistry and Molecular Biology, Inc.
by guest on April 13, 2018
http://ww
w.jbc.org/
Dow
nloaded from

Structural model of the cytosolic domain of ETR1
2
INTRODUCTION Ethylene acts as a phytohormone, which controls numerous aspects of plant growth and development. In A. thaliana the many responses to ethylene are initiated by a group of five membrane bound receptors (ETR1, ETR2, ERS1, ERS2 and EIN4) (1). The basic functional unit of the receptors is a disulfide-linked dimer (2), which binds one copper ion and therefore one ethylene (3). In contrast to the majority of membrane receptors, ethylene receptors lack a soluble signal-binding domain. Instead, ethylene binds at the dimer interface of the conserved hydrophobic N-terminal receptor domain (4), which is embedded in the membrane of the endoplasmic reticulum (5) and directly controls the activity of its cytosolic domain. Ethylene receptors are part of high-molecular-mass multiple protein complexes when isolated from A. thaliana membranes (6). To this end, the C-terminal cytosolic receptor domain serves as a docking station for many cellular components, which directly or indirectly contribute to signal transduction. The cytosolic domain itself comprises a GAF (cGMP-specific phosphodiesterase, adenylyl cyclases and FhlA) domain followed by a HK and in some instances (ETR1, ETR2 and EIN4) a receiver domain. The histidine kinase and receiver domains resemble classical bacterial two-component systems. In prokaryotes they constitute a phosphoryl-relay, which regulates numerous signalling pathways by subsequently executing autokinase, phosphotransferase and phosphatase reactions (7). Ethylene receptors were the first example of TCS-like signalling modules discovered in eukaryotes (8). While ETR1 and ERS1, which constitute subfamily 1, possess all of the conserved hallmark residues associated with HK activity, members of subfamily 2 (ETR2, ERS2 and EIN4) lack one or more of those residues. Consistent with this discovery, histidine-autophosphorylation of ETR1 and ERS1 was demonstrated in vitro (9, 10). This activity, however, appears not to be essential for in vivo signalling (11). Subfamily 2 receptors and also ERS1 show Ser/Thr kinase activity (10). While all receptors contribute to ethylene signalling (12) subfamily 1 receptors play a prominent role. For instance, the effect of silver, an ethylene antagonist, was shown to mostly depend on ETR1 (13). The relevance of the GAF domain for ethylene signalling remains unknown. The histidine kinase
can be subdivided into a dimerization and a catalytic domain. The conserved, phosphoryl-accepting His is located in the dimerization domain DHp. The catalytic domain binds the phosphoryl-donor ATP. At present, only structures of prokaryotic HK domains are available, mainly of the individual domains. More recently the complex between a HK domain and its separate cognate receiver domain from T. maritima (14) and the complete cytoplasmic region of VicK (15) from Streptococcus mutans have been determined. Depending on the receptor’s functional state the interaction and relative orientations of the DHp and CA domains vary (14, 16). The phosphatase-competent state was suggested to display the tightest interaction and closest conformation. In the other two states – phosphotransferase and autokinase - the DHp-CA domain interaction weakens: the CA domain position is more flexible and the DHp domain exhibits varying degrees of intra-molecular asymmetry displayed by different conformations of its N-terminal helices (15–17). In contrast to canonical prokaryotic two-component systems, ethylene receptors control the activity of a cytosolic protein kinase, CTR1 (18, 19). In the absence of ethylene both, receptor and CTR1, are active. Complex formation of ethylene receptors and CTR1 was shown in vivo (19). It involves parts of the HK and RD domains on the ethylene receptor and the N-terminal domain of CTR1 (18–20). CTR1 is homologous to the family of RAF kinases (21), yet no definite proof of an associated canonical MAPK cascade exists (22, 23). More recently EIN2 was shown to be a substrate of CTR1 activity. Phosphorylation of EIN2 by CTR1 prevents its activation and the transport of its cytosolic C-terminal domain into the nucleus (24, 25). Consequently, ethylene signalling in plants combines signal transduction elements from prokaryotic and eukaryotic backgrounds. Ethylene induced conformational changes within the cytosolic domain are thought to translate into conformational changes within CTR1 and thereby manipulate the initial steps of intracellular signal transduction. This step in the signal transduction is still not well understood and relies on evidence from mutants and studies on the subcellular location of CTR1 (18, 19, 26). In addition to the basic functional homodimer, non-covalent higher-order complexes between ethylene receptors were discovered (6, 27). They provide a
by guest on April 13, 2018
http://ww
w.jbc.org/
Dow
nloaded from

Structural model of the cytosolic domain of ETR1
3
plausible explanation for the broad range of ethylene sensitivity (0.2nL - 1,000µL/L) as well as the dominant nature of ethylene insensitive mutants. The functional basis of these inter-receptor signalling networks have only just begun to emerge (28). Recently a signalling pathway relying only on the N-terminal part of ETR1 (res. 1-349) was described, which acts independently of CTR1 but can be inhibited by it (29). This observation adds to the complexity of ethylene receptor signalling. Here we present the crystallographic structures of the DHp domain of ERS1 (DHpERS1, res. 308-407, 84% identical with ETR1 equivalent), the CA domain of ETR1 (CAETR1, res. 407-589) bound to ADP, and the solution structure of the entire cytosolic domain of ETR1, lacking the trans-membrane domain (ETR1-ΔTM, res. 158 – 738). Crystallographic models of a homologous GAF domain (pdb 2O9B (30)), DHpERS1 and CAETR1 of this report, and the receiver domain from a previous study (RDETR1 (31)) were used as input rigid bodies and refined against the SAXS data of the entire cytosolic domain. They provide the first model of the entire intracellular receptor domain of this important class of plant hormone signal transducers. In addition the isolated DHpERS1 domain exhibits an interesting asymmetry, which likely represents the ground state of the central part of the receptor. EXPERIMENTAL PROCEDURES Protein Expression and Purification Cloning and purification of ETR1-ΔTM - N-terminally His-tagged ETR1-ΔTM (res. 158-738) was amplified from a cDNA library obtained from the Arabidopsis Biological Research Centre at Ohio State University (21). The PCR protocol consisted of 25 cycles of annealing at 336 K, followed by 10 s of extension at 345 K using KOD polymerase (Novagen). The sequences of the forward and reverse primers, respectively, were: 5’-CAGGGCGCCAGTGATAGACATACTATTTTAAAGACTACACTTGTTGAGC-3’ and 5’GACCCGACGCGGTTACATGCCCTCGTACAGTACCCG-3’. Both primers contain appropriate extensions for ligation independent cloning. The gene was inserted via LIC into a modified pETM-11/LIC vector, where the N-terminal hexa-His-tag is followed by an GB1 expression and solubility enhancer (32) and a TEV site. The final inserts were verified by DNA
sequencing. The protein was expressed in E. coli Rosetta cells in 2 L of TB media. Cells were grown to an OD600 of 1.5, cooled to 20° C, induced with 0.05 mM IPTG and harvested after 18 h. The cells were lysed in 20 mM Tris pH 8.8, 150 mM NaCl, 1 M Urea, 3 mM β-ME, 0.1 % w/v CHAPS (Carl Roth, Germany), 20 mM Imidazole, EDTA-free protease inhibitors (cOmplete ULTRA Tablets, Mini, Roche) and 10 µg ml-1 DNAse. The Ni-NTA purification steps were carried out as described for ERS1DHp (33) with the exception of adding 0.1 % w/v CHAPS to the Ni-NTA wash buffer, dialyzing pooled fractions against 30 mM Tris pH 8.8, 100 mM NaCl, 6 mM β-mercaptoethanol and 3 % glycerol during the TEV digestion step at 4° C for 18h. After the second Ni-NTA step the sample was either used directly for SAXS measurements (no NDSB 201 added, Figure 4B) or NDSB 201 was added and size-exclusion chromatography (HiLoad 26/60 Superdex 200, Amersham Biosciences) was used as the final purification step. The column was pre-equilibrated in 20 mM Tris pH 8.8, 150 mM NaCl, 1 mM DTT and 250mM NDSB 201. ETR1-ΔTM was concentrated using a Vivaspin concentrator (30,000 MW cutoff, Vivascience, Germany). X-ray structure determination Structure determination of DHpERS1 - Cloning, expression, purification and crystallization of the DHp domain of ERS1 (DHpERS1, ERS1308-407) have been described previously (33). The structure of DHpERS1was solved using the peak and inflection-point data sets of a Se-Met crystal collected on beamline X12 (DESY, Hamburg, EMBL, Germany). The crystal was rotated in steps of 1.1° over a total range of 154°. Data were processed with XDS (34) and scaled with SCALA (35, 36). Phases were obtained using HKL2MAP (37) and an initial model was build into the resulting experimental electron-density map using ARP/warp (38). The model was refined against native 1.9 Å data in C2221 and 2.15 Å data in P21212, both collected on beamline ID29 at the European Synchrotron Radiation Facility, Grenoble. Iterative cycles of Phenix (39) were followed by manual model building in COOT (40). Non-crystallographic symmetries were excluded from the refinement due to structural differences in the individual monomers. MolProbity (41) analysis indicated that the overall geometry of the final
by guest on April 13, 2018
http://ww
w.jbc.org/
Dow
nloaded from

Structural model of the cytosolic domain of ETR1
4
model ranked in the 98th percentile (MolProbity score of 1.38) for C2221 and in the 99th percentile (MolProbity score of 1.43) for P21212, where the 100th percentile is best among structures of comparable resolution. Figures were generated using the PyMOL Molecular Graphics System, Version 1.5.0.4 Schrödinger, LLC. The statistics of the X-ray diffraction data sets and structure refinement are summarized in Table 1 and Table 2. Structure determination of CAETR1 - Cloning, expression, purification and crystallization of CAETR1 (residues 407-589) have been described previously (42). A native data set was collected at beamline PX III of the SLS at a wavelength of 0.998 Å. The structure was solved by molecular replacement with the CA domain of HK853 (PDB code 2C2A) as a search template using Auto-Rickshaw (43). The model was manually corrected with COOT (40) and refined with Phenix (39). In order to confirm the identity of metal ions in the structure, SAD data were collected to a resolution of 2.2 Å at beamline X12 (EMBL-Hamburg, DESY) and a wavelength of 1.377 Å. Phases were independently calculated with the SAD phasing protocol of the Auto-Rickshaw webserver (43) and by using the SHELXD/E program suite (44). Initial phases were further improved with the MRSAD protocol of Auto-Rickshaw (43). The statistics of data collection and structure refinement are given in Table 1.
SAXS experiments SAXS measurements were carried out at beamline P12 (EMBL/DESY, Hamburg) at the PETRA-III storage ring using a Pilatus 2M detector (Dectris) and at the X33 beamline (DESY, Hamburg) at the DORIS storage ring using a Pilatus 1 M detector (45). The purified ETR1-ΔTM receptor domain was measured at several concentrations (0.3 – 1.4mg/ml). Concentrations were determined by measuring the absorption at 280 nm using a NanoDrop ND-1000 spectrophotometer (NanoDrop Technologies, Wilmington, DE) and absorption of 0.502 (at a concentration of 0.1% (= 1 gL-1) at 280 nm). For each measurement twenty 50 ms frames were collected and averaged using a sample volume of 30 µl at a temperature of 10° C. The SAXS camera was set to a sample-detector distance of 3.1 m, covering the momentum transfer range 0.008 Å-1 < s < 0.47 Å-1 (s = 4π sin(θ)/λ where 2θ is the scattering angle and λ=1.24 Å is the X-ray
wavelength). Prior to and following each sample exposure the buffer excluding the protein was measured to allow for background subtraction. The data were corrected for buffer contribution, scaled for solute concentration and extrapolated to infinite dilution using the program PRIMUS (46). The radius of gyration Rg and forward scattering intensity I(0) were determined using Guinier analysis (47), assuming that at very small angles (s ≤ 1.3/Rg) the intensity is represented as I(s)=I(0)exp((sRg)2/3). Rg and I(0) were also independently determined, along with the maximum particle dimension Dmax, using the indirect Fourier transformation approach in the program GNOM (48). The molecular mass (MMSAXS) of the construct was calculated by comparison of the extrapolated forward scattering with reference BSA samples (66 kDa). The excluded volume of the hydrated particle Vp was computed from the small angle portion of the data (s < 0.25 Å-1) using DATPOROD (49), and an estimate of MM was also extracted. For globular proteins, Porod volumes in Å3 are about 1.7 times the molecular masses in Da (49). The scattering patterns from available high-resolution models were calculated using the program CRYSOL (50) and used to determine the fit of these models to the experimental data. Given the atomic coordinates, the program minimizes discrepancy in the fit to the experimental scattering intensity by adjusting the excluded volume of the particle and the contrast of the hydration layer. The discrepancy χ2 between the measured and calculated SAXS profiles is defined as
€
χ2 =1
N −1∑j
Iexp(s j ) − cIcalc (s j )σ(s j )
⎡
⎣ ⎢
⎤
⎦ ⎥
2
(1)
where N is the number of experimental points, c is a scaling factor, Icalc(sj) and Iexp(sj) are the calculated and experimental scattering intensity and σ(sj) experimental error at the momentum transfer sj. The statistics of data collection are summarized in Table 3 and Table 4. SAXS modelling Ab initio models were reconstructed from the ETR1-ΔTM scattering data using the simulated annealing bead-modelling programs DAMMIF (51) and MONSA (52). DAMMIF and MONSA represent the particle as a collection of M (» 1) densely
by guest on April 13, 2018
http://ww
w.jbc.org/
Dow
nloaded from

Structural model of the cytosolic domain of ETR1
5
packed beads inside a loosely constrained search volume compatible with the experimentally determined Rg (DAMMIF) or Dmax (MONSA). In the case of MONSA, three bead phases were defined corresponding to the GAF, DHp and CA, and RD domains, and data from three ETR1 constructs (ETR1DHp-CA, ETR1DHp-CA-RD and the entire ETR1-ΔTM) used in a global refinement procedure. The average of 10 independent reconstructions was used to generate a representative shape envelope, using the program DAMAVER (53). In addition, the ensemble of the DAMMIF ab initio models was used to calculate an excluded volume of the particle, VDAM, from which another independent MM estimate was derived (empirically, MMDAM ~ VDAM/2). Rigid-body models were generated for all constructs using the program CORAL (54), where high-resolution models of domains were defined as rigid bodies and linkers/loops between the individual subunits represented as flexible random polypeptide chains. The results of 10 independent CORAL runs were analyzed using the programs SUPCOMB13 (55) and DAMAVER to identify the most representative/typical models. Three homology models of the cytoplasmic domains of ETR1 were constructed in the program MODELLER (v9.10) (56) based on the DHp domain of ERS1, the structures of the CA and receiver domain of ETR1 (pdb 1DCF (31)) and three homologous GAF domains (pdb 2O9B (30), 2LB5 (57) and 1MC0 (58)). The DHp and the GAF domains were mutated to match the residues in ETR1. The T. maritima TM0853 HK domain (pdb 2C2A) was used to place the DHp and CA domain relative to each other. The GAF domains were placed using the overlap with the N-terminus of the DHpERS1 domain as a guide. The receiver domain was placed relative to this core model by rigid body modelling with a 15 residue flexible linker between the CA and receiver domain as a restraint. Flexibility analysis of ETR1 in solution was conducted using the constructed rigid-body models as input for the ensemble optimization method (EOM). This approach seeks to best fit the experimental scattering profile with an ensemble of conformations (59). The 15 residue linker between the CA and receiver domain was defined as flexible and its possible conformations modelled with RANCH producing 10,000 random configurations (59), while the rest of the dimeric protein was kept
fixed. A genetic algorithm was employed to find the set of conformations best fitting the SAXS data. The structures selected from the random pool of structures were analysed with respect to the Rg distribution. RESULTS An overview of the domain denominations and of the various constructs employed for the modelling, including their termini and structural analysis method, is given in figure 1. Structure of the DHp domain of ERS1 – Attempts to crystallize the ETR1 DHp domain did not yield suitable crystals, whereas DHpERS1 crystallized in two different space groups under similar crystallization conditions. Crystals in space group (SG) C2221 contained one dimer per asymmetric unit (a.u.) and diffracted x-ray radiation to 1.9 Å, while crystals in SG P21212 contained two dimers per a.u. and diffracted x-rays to 2.15 Å resolution. Attempts to solve the structure by molecular replacement failed, probably due to the parallel packing of the long helical segments in both crystal forms. Phasing of the data succeeded through SAD of protein labelled with Se-Met. As expected from previously described prokaryotic homologues (14), the eukaryotic DHpERS1 forms a dimer of helical hairpins (Figure 2A). The two anti-parallel helices of a hairpin are connected by a short loop (res. 371-375). The N-terminal helix α1 (res. 308-370) extends for about 95 Å and is considerably longer than in all known prokaryotic structures. The length of the C-terminal helix α2 adds up to about 40 Å and closely resembles helix α2 of the complete HK from T. maritima, HK853 (pdb 2C2A). The first ~30 residues of helices α1 and α1' (the prime discerns the protomers within a DHp dimer) form a parallel coiled-coil with a left-handed twist of about 23°. The remaining parts of the hairpins constitute a four-helix bundle. Therefore, DHpERS1 consists of two parts, a coiled-coil portion and a four-helix bundle, comparable to the dimerization domain of HK853. Because helix α1 of DHpERS1 is about 5 turns longer than in HK853, the coiled-coil domain is correspondingly longer as well. The entire dimer interface buries 2120 Å2 of solvent accessible surface area from each monomer. The four-helix bundle contributes 1310 Å2 or 62% of this interface. The coiled-coil interface contributes 810 Å2, about 40% more than in HK853.
by guest on April 13, 2018
http://ww
w.jbc.org/
Dow
nloaded from

Structural model of the cytosolic domain of ETR1
6
Since the structure of HK853 contains a crystallographic dyad both hairpins are by definition identical. The situation for DHpERS1 with 3 crystallographically independent copies of dimerization domains is different and reveals a number of intra-dimer discrepancies. Each N-terminal helix displays a noticeable kink at residue M351 just 2 residues prior to the phosphoryl-accepting H353. Both bending angles within each dimer are significantly different, but strikingly comparable among individual dimers. When superimposing all 3 independent copies of DHpERS1 from the conserved histidine residue to their C-termini (residues 353-404), the bending is always about 18º in helix α1 and always about 31° in helix α1´ (Figure 2B). The conserved phosphorylatable H353 adjacent to the kink region is solvent exposed and assumes a variety of side chain orientations. The larger bending of α1´ coincides with a hydrogen bond between the side chain amide of N352´, located at the inner bend of the kink, and the backbone carbonyl of I396 in helix α2, disrupting the canonical helical hydrogen-bonding pattern of helix α1´. In SG C2221 the side chain amide of N352´ and the backbone carbonyl of I396 are within 2.9 Å (Figure 2C). This close contact correlates with an increase of the distance between the backbone carbonyl oxygen of V350´ and the backbone amide of E354´ to 5.2 Å. The corresponding gap represents the outer angle of the helical kink. When there is no interaction between N352 and I396 (d = 4.5 Å), as in helix α1, the helical hydrogen pattern is preserved with a regular distance of 2.8Å. The same pattern is found in all 3 independent dimers of DHpERS1. The most conspicuous and functionally significant difference between the dimerization domains of HK853 and DHpERS1 concerns the topology of the hairpin-loops connecting helices α1 and α2. They are orthogonal to each other, resulting in an opposite handedness of the four-helix bundles (Figure 2D). As a consequence, we expect ERS1 to perform a classical trans-phosphorylation because HK853 had been shown to phosphorylate in cis (14). Any comparison of the dimerization domains of DHpERS1 and HK853 must take their opposite handedness into consideration. Superposition of spatially equivalent helical residues therefore matches one hairpin of DHpERS1 with helix α1 (res. 234 – 277) and helix α2´ (res. 286´- 313´) from
HK853. An rmsd of 1.1 Å between the less bent hairpin of DHpERS1 and HK853 stresses the overall similarity of the dimerization domains despite their different connectivity. A higher rmsd of 1.6Å between the stronger bent hairpin of DHpERS1 and HK853 reflects the structural rearrangement of helix α1´ in DHpERS1. For comparison, the intramolecular rmsd between the hairpins of the dimer of DHpERS1 in SG C2221 is 1.8Å. Structure of the Catalytic domain of ETR1 - CAETR1 crystallized in space group I212121 with 1 molecule per a.u. and data to 1.90Å resolution. The final model contains 150 protein residues, one ADP molecule, 11 Cd2+ ions, 1 Cl- ion and 1 acetate (Figure 3A). The overall structure assumes an α/β sandwich fold and closely resembles the CA domain of HK853. Following the nomenclature of HK853, one layer of the sandwich fold consists of a mixed five-stranded β-sheet (βB and βD – βG) and the other layer consists of 3 helices (α3 – α5) and a pair of short antiparallel β-strands (βA and βC). Two loops, residues 490 to 502 and residues 531 to 543 could not be modelled due to weak electron density. The first loop connects strands βD and βE and exceeds the equivalent loop in HK853 by 16 residues. The second loop constitutes the ATP-lid, which is also partially unstructured in HK853. 138 equivalent pairs of Cα atoms from CAETR1 and HK853 overlay with an rmsd of 1.4 Å. The Nucleotide binding site - An ADP molecule is bound at the expected nucleotide-binding site of CAETR1, in a conformation that emulates the ADP bound by HK853. It interacts with conserved residues from the N, G1, F, G2 and G3 boxes. The purine ring of the ADP is tucked into a hydrophobic pocket formed by F474, I518 and I526. The interaction of F474 with both, the purine and K473 classifies the HK of ETR1 as belonging to the predominant class of histidine kinases, like PhoQ and HK853 (60). The adenine is further fixed by a hydrogen bond between the conserved D513 of the G1-box and N6 of the exocyclic amino group. The only interaction of the ribose is a hydrogen bond between O2’ and the Nε of K529 in the F-box. This interaction is unusual, however, the side chain of K529 has B-factors of more than 80 Ǻ2 and accordingly weak electron density. In CAETR1 and HK853 the last structured residues before the unstructured ATP-lid point into opposite directions. While the loop wraps around and over the ADP in
by guest on April 13, 2018
http://ww
w.jbc.org/
Dow
nloaded from

Structural model of the cytosolic domain of ETR1
7
HK853 it departs from the nucleotide in CAETR1. This departure points the loop towards the inferred regulatory interface with the DHp domain, based on analogy with HK853. As in HK853, the O3’ of the ribose is in hydrogen bonding distance of its own β-phosphate. The α- and β-phosphates are positioned similarly as in HK853 by interactions with N470, the main chain amide of L548 and the already mentioned K473 (Figure 3B). The disorder of the ATP-lid (res. 531-543 in CAETR1 and res. 433 - 441 in HK853) was blamed on the absence of a γ-phosphate in HK853 (60, 61). The shorter ATP-lid of the CA domain of ThkA (pdb 3A0T), however, is flexible in the ligand-free form, but ordered in the ADP bound form (62). The conformation of the ATP-lid, therefore, appears to depend on multiple parameters. Positions of the metal binding sites - CAETR1 was crystallized in the presence of CdSO4. Crystallization attempts in the absence of nucleotide or CdSO4 were as unsuccessful as attempts to replace Cd2+ with Mg2+ or Mn2+. Based on SAD data a total of 11 Cd2+ sites per monomer were identified. Eight of these sites are located on the protein surface in close contact with appropriate side chains. The remaining 3 sites mediate interactions between protein and ADP. Two cadmium ions are ligated by the phosphate groups. Oxygens of the α- and β-phosphates, the side chains of N466 and N470, and two water molecules octahedrally coordinate one ion (Figure 3C). The position of this Cd2+ ion is equivalent to the position of the Mg2+ ion in the AMPPNP complex of PhoQ (pdb 1ID0). The second Cd2+ is very close to the crystallographic dyad parallel to the c axis. Accordingly, this cation interacts with the β-phosphates from symmetry related ADP molecules in adjacent a.u., which are just 6.5Ǻ apart. The occupancy of this Cd2+ site was set to 50%.
In many histidine kinases a water molecule mediates a contact between the conserved D513 (D415 in 1ID0, D411 in HK583 and D533 in 3SL2) from the G1 box and N1 of the adenine ring. In CAETR1 a Cd2+ takes this position. C573 and a Cl- ion complete a tetrahedral ligand sphere around this Cd2+ (Figure 3B). This cysteine residue is part of the G3 box motif and found only in subfamily 1 but not in subfamily 2 receptors (ETR2, ERS2 and EIN4) (Figure 9). Here, the cysteine is replaced with
glutamate, lysine, and glutamin, respectively, which are much larger in size and accordingly unsuitable to accommodate the binding of a cadmium ion.
SAXS model of the cytosolic ETR1 receptor domain - A construct of ETR1 comprising the entire cytosolic domain (ETR1-∆TM, res. 158-738) was analysed by SAXS, after resisting vigorous crystallization attempts. ETR1-∆TM tends to aggregate, which prevented acquisition of useable data at high sample concentrations (> 1 mg/mL). The sample's sensitivity also prevented the acquisition of useful SAXS data in the presence of nucleotides. The addition of the stabilizing agent NDSB (250 mM) to the sample facilitated measurement across an increased range of concentrations. The good data quality allowed a detailed structural modelling, especially at low angles, describing the overall shape of the particle.
Due to some uncertainty in the accuracy of protein concentration estimations for the ETR1 constructs, the molecular mass (MM) was derived from hydrated particle volumes determined from the SAXS data and independent of sample concentration (Table 2 and Table S2). MM based on the Porod volume Vp is 160 ± 25 kDa consistent with that expected for a dimeric receptor (130 kDa). Furthermore, the molecular envelope reconstructed from ab initio bead modelling can only be adequately fit, by docking the high-resolution domain fragments as a dimer into the model volume. Subsequent rigid body refinement of the crystallographic fragments as a dimer yields acceptable goodness-of-fit parameters, with discrepancies (χ) between the experimental data and rigid-body models in the range 1.1 < χ < 1.5, further providing strong evidence that ETR1-ΔTM is dimeric in solution (Figure 5A). SAXS data for the entire soluble domain of ETR1 and two shorter constructs (ETR1DHp-CA, ETR1DHp-
CA-RD) were used in global refinement procedures to determine the low-resolution solution structure of ETR1-∆TM (Figure 4A). Multiphase bead models were reconstructed ab initio from the three data sets, defining three distinct phases: (1) GAF domain, (2) DHp and CA domains and (3) RD domain. A global refinement was conducted, generating dimeric models with a “dumbbell” shape for both +/- NDSB data, and with the GAF and RD domains at opposing sides of the central DHp dimer interface and CA domains (Figure 4D). Independent
by guest on April 13, 2018
http://ww
w.jbc.org/
Dow
nloaded from

Structural model of the cytosolic domain of ETR1
8
of the ab initio modelling, the available high-resolution data of the ETR1 domains were also used in a multi-curve global rigid body refinement procedure (Figure 5A, B). Structural information of the GAF domain was derived from homology modelling because all attempts to obtain crystallographic information of the GAF domain of ETR1 failed. Three GAF domains with different functional backgrounds gave virtually identical results in rigid body refinements against SAXS data (Figure 4C). The features of the dimeric ETR1-∆TM models are shown in Figure 5C, where the CA domains and RD domains extend outward from the central DHp helical stalk. There appears to be little contact under the conditions used in the measurement between the catalytic and receiver components themselves, or between the RD domain and the dimerisation domain. The CA domain, however, appears consistently associated with the DHp domain in a similar manner as (but distinct from) that observed in the T. maritima crystal structures (3DGE, 2C2A). When the best rigid body model is superimposed with the multiphase bead model (Figure 4D), the agreement in terms of overall shape is excellent. However, the bead model suggests that the average position of the CA domain is distinct from that observed in the rigid body model, being closer to the GAF domain. Also, in the fits of the rigid body model to the data for the complete cytosolic region, both with and without NDSB, the maxima at ~ s = 1 nm-1 is somewhat smeared out. Taken together, this may reflect a dynamic and flexible nature of the linkers between the peripheral domains. To further explore the potential flexibility of the cytosolic domain of ETR1, an ensemble based modelling approach was conducted using the Ensemble Optimisation Method (EOM) (59). An ensemble of models was selected from a pool of randomly generated conformations that best describe the experimental data. Models were constructed from the high-resolution domain structures with randomised DHp - CA and CA - RD linkers, maintaining the fixed position and orientation of the GAF and DHp domains. The selected ensembles provide an improved description of the data, accounting for the smearing out of the maxima at s ~ 1.0 nm-1 by modelling domain flexibility (Figure 6B). The size-distributions generated in this procedure suggest that the system is not completely flexible, as the width of the
selected ensembles relative to the pool are visibly more narrow (Figure 6). It is interesting to note that the distribution of Rg’s for the data set in the absence of NDSB is shifted to higher values, an indicator of predominantly extended structures, whereas the NDSB data yields a distribution close to the average Rg of the pool. This suggests that the addition of a stabilizing agent to the solution promotes the formation of more compact structures. Agreement between independent modelling approaches confirmed the expected dimeric assembly of ETR1. The overall dumbbell shape obtained by ab initio modelling correlates well with the rigid body model, positioning the GAF domain at the top and the catalytic and receiver domains at the bottom of a central helical bundle, respectively. There seems to be some flexibility of the receiver domain position but it appears to be distinct from the position described for a T. maritima receiver domain in complex with its HK (14). DISCUSSION Signal transduction involves the activation of cytosolic proteins by membrane bound receptors. Specific protein-protein interactions between receptor and its intracellular target molecules constitute the foundation of this process, which is modulated by structural re-arrangements in the cytosolic domain of the receptor. Any detailed understanding of signal transduction, therefore, requires structural knowledge of the different conformational states of the receptor and its complexes. Our results provide the first model of the entire cytosolic domain of the main ethylene receptor ETR1, together with indications of specific conformational rearrangements of its central cytosolic domain. The Dimerization domain - A distinct feature of the isolated DHp domain of ERS1 is its inherent asymmetry. In three independent copies of DHpERS1 the bending angles of the N-terminal helices at M351 consistently amount to about 18º for helix α1 and 31° for α1’, the second helix of the dimer. In all three cases the larger bending angle (helix α1´) correlates with a hydrogen bond between the side chain amide of N352´, located at the inner bend of the kink, and the backbone carbonyl of I396 in helix α2 and with a disruption of the direct helical hydrogen bond between V350' and E354' by a water molecule. N352 is conserved in subfamily 1 and substituted with a serine, another potential
by guest on April 13, 2018
http://ww
w.jbc.org/
Dow
nloaded from

Structural model of the cytosolic domain of ETR1
9
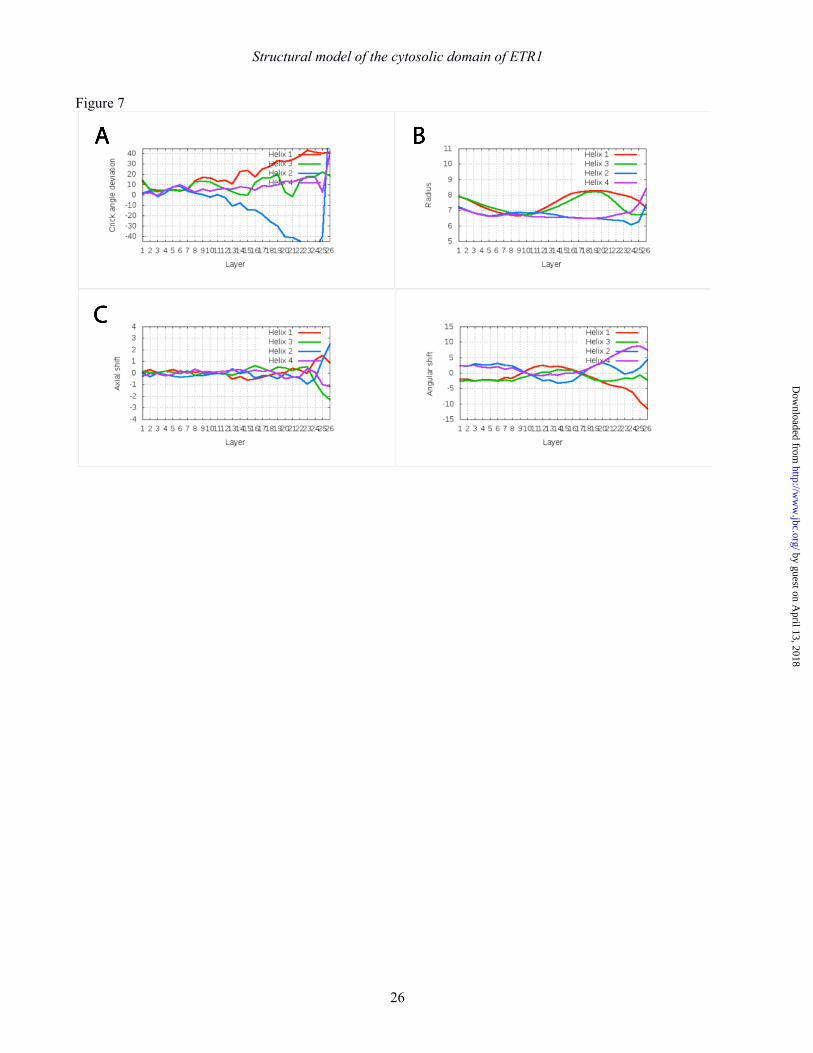
hydrogen donor, in subfamily 2 (Figure 9). The canonical hydrogen bond of the dimer related helix is extended but maintained over the 18º kink. Molecular dynamics calculations on DHpERS1 indicate that the observed asymmetry is dynamic in nature, such that the less bent helix may assume the higher bent state at the expense of the other helix, which simultaneously transitions from a high to the less bent state (data not shown). The sections of individual hairpins before (res. 312 – 340) and after (res. 356 – 405) the kink overlay well, with rmsd values of about 0.75Å for the pre-kink sections and about 0.45Å for the post-kink sections. The region around the kink, between residues 341 and 355, overlays with an rmsd value of about 1.4Ǻ. In contrast to the pre- and post-kink sections, this part at the intersection of coiled-coil and four-helix bundle does not follow the classical knobs-into-holes packing of buried side chains, which is reflected in a variability of the Crick angle, the radius and the angular shift (especially in chain A as analysed using the program samCC (63)) (Figure 7). The asymmetry is also found on the level of side chains participating in the inter-helix contacts. Helices α1 and α2 of chain A show a cogwheel-like movement relative to each other, when compared with chain B. This is most prominent at the end of chain A, the domain boundary to the catalytic CA domain, after residue 399. E.g. residue 402 in helix α2’ (chain B) points to the core of the 4-helix bundle, while the same residue in helix α2 points to the solvent (Figure 8). The observed asymmetries at both termini of the central dimerization domain are expected to influence the orientation of the preceding GAF domains and the succeeding catalytic domains. Previously, different rotational states of a charged layer within two-component HKs were correlated with different activity states of the HK (17). In DHpERS1 this region corresponds to the residues around R344 at the intersection of coiled-coil and 4-helix bundle. R344 of helix α1 points to the centre of the bundle, while R344 of helix α1’ points towards the surface, with a Crick angle difference of about 20° between both. This asymmetric arrangement is neither in line with a knobs-into-holes nor an x-da arrangement (Figure 8). A similar configuration is observed in variants of the DesK, another HK domain (16). Therefore, this arrangement flanked with regular arrangements before and after the kink likely constitutes the
conformation of the DHp domain in the absence of external restraints. The observed conformations at least highlight a highly flexible hinge within DHpERS1, close to the phosphoryl-accepting histidine. This hinge within the long helix α1 is capable to simultaneously bend and rotate. Since we observed no other conformational state of this domain in its isolated state, it likely represents the structural ground state of the DHp domain. The connecting loops at the tip of the four-helix bundle of the five receptors in A. thaliana appear to fall into two sequentially related groups. Subfamily 1 sequences from A. thaliana, as well as members from subfamily 1 from other plants are highly conserved, while the sequences of subfamily 2 are diverse. Therefore, the topology of subfamily 1 dimerization domains is expected to be left-handed, while no prediction of the connectivity can be made for subfamily 2. The connectivity of the hairpin domains in DHpERS1 suggests a trans phosphorylation mechanism as already observed for other HKs (64). The interface of the N-terminal coiled-coil of DHpERS1 contains a number of polar or charged residues (S316, R320, N327, R334) at the a or d positions of the helical heptad. Charged residues at positions a or d were also found in the HKs EnvZ or Sln1 making this a general feature of coiled-coils in HKs. The interface residues of the five ethylene receptors in A. thaliana at positions a or d between residues 313 and 337 are conserved or conservatively replaced (R for K in 2 receptors). This strongly suggests coiled-coils of similar length and crossing angles in all of them. The catalytic domain - The structure of the catalytic domain in complex with ADP is highly similar to the catalytic domain of the complete prokaryotic HK853. The largest structural differences are located in a loop connecting the F-box and G2-box motifs, which comes closest to the interface between dimerization and catalytic domain. Another significant difference was found within the ADP binding pocket. Ordinarily, a water molecule mediates the interaction between the conserved aspartate of the G1 motif and the endocyclic N1 of the purine. In CAETR1 the same interaction is mediated by a Cd2+ ion, which is further ligated by C573 and a close-by anion, which was interpreted as a Cl- ion. The identity of this Cd2+ was unambiguously determined by anomalous
by guest on April 13, 2018
http://ww
w.jbc.org/
Dow
nloaded from

Structural model of the cytosolic domain of ETR1
10
scattering. While it is debatable, whether Cd2+ is the biological cation, the ligand sphere and available space strongly argue for the presence of a cation at this position in ETR1. Sequence comparison within the ethylene receptor family suggests that this binding site is limited to subfamily 1 and probably absent in subfamily 2 members, because of the substitution of Cys by much larger amino acids. The cytosolic domain of ETR1 - The cytosolic domain of ETR1 resembles the shape of a dumbbell with the N-terminal GAF domain immediately adjacent to the ethylene binding membrane domain, separated from the ATP binding catalytic and the receiver domains by the long coiled-coils of the dimerization domains. There is no evidence of physical interaction between the GAF and CA domains, which are separated by at least 35 Å. The conformational freedom of the GAF domains is restrained by the preceding small disulfide linked ethylene binding membrane domains. It appears reasonable, therefore, to endow the coiled coil region of the DHp with the task of communicating ethylene binding between its binding site and the catalytic domain. The rigid body refinement of an asymmetric model, reflecting the different helical kinks observed for the DHp domain, against the SAXS data yielded a marginally lower quality of the fit (χ = 1.3) than that of a symmetric model (χ = 1.2) (data not shown). Our attempts to obtain SAXS data in the presence of ATP failed due to a dramatically decreased data quality. SAXS measurements of the ATP binding HK domain (DHp-CA) of ETR1 in the presence and absence of ATP did not reveal conformational differences at this level of resolution (data not shown). This finding, however, cannot exclude conformational rearrangements of the full-length receptor as a function of nucleotide binding. The chimeric nature of our model (DHp from ERS1 and GAF from homologous sources) adds some incertitude. Since the DHp domains of ERS1 and
ETR1 share 93% similarity (84% identity), anything but a very high degree of structural analogy between both proteins would be surprising. The fact that the quality of our SAXS model was virtually independent of the chosen GAF domain (Figure 4C) shows that i) no conclusion can be drawn as to the functional nature of GAF in our model ii) our model is a good representation of the solution structure of the cytosolic domain of ETR1. In the SAXS model of the cytosolic domain of ETR1, the GAF and HK, consisting of DHp and CA, assume comparatively defined positions relative to each other. The receiver domains, in contrast, are flexible and do not assume a fixed position. A closer analysis of the range of conformations consistent with the experimental data reveals that the average centre of mass distance between DHp and the receiver domain varies between 30 and 78 Å. In none of the models do the two receiver domains come close enough to form the specific interaction previously observed for the isolated domains (31), (Figure 5C). However, in the most frequent conformation of the receptor dimer selected by an ensemble analysis, the receiver domains adopt an arrangement perfectly suited to mediate those specific interactions between receptor dimers. This interaction may contribute to the observed formation of inter-receptor complexes, possibly in a phosphorylation dependent manner. The RD domain would hence serve as a module controlling the known receptor interaction, which was made responsible for the wide range of ethylene sensitivity, rather than for phosphoryl-relay. ACCESSION NUMBERS Coordinates and structure factors have been deposited in the PDB under the accession numbers 4MTX and 4MT8 for the DHpERS1 domain and 4PL9 for the CAETR1 domain.
REFERENCES 1. Stepanova, A. N., and Alonso, J. M. (2009) Ethylene signaling and response: where different regulatory modules meet. Curr. Opin. Plant Biol. 12, 548–555 2. Schaller, G. E., Ladd, A. N., Lanahan, M. B., Spanbauer, J. M., and Bleecker, A. B. (1995) The ethylene response mediator ETR1 from Arabidopsis forms a disulfide-linked dimer. J. Biol. Chem. 270, 12526–12530 3. Rodríguez, F. I., Esch, J. J., Hall, A. E., Binder, B. M., Schaller, G. E., and Bleecker, A. B. (1999) A copper cofactor for the ethylene receptor ETR1 from Arabidopsis. Science 283, 996–998
by guest on April 13, 2018
http://ww
w.jbc.org/
Dow
nloaded from

Structural model of the cytosolic domain of ETR1
11
4. Schaller, G. E., and Bleecker, A. B. (1995) Ethylene-Binding Sites Generated in Yeast Expressing the Arabidopsis ETR1 Gene. Science 270, 1809–1811 5. Chen, Y.-F., Randlett, M. D., Findell, J. L., and Schaller, G. E. (2002) Localization of the ethylene receptor ETR1 to the endoplasmic reticulum of Arabidopsis. J. Biol. Chem. 277, 19861–19866 6. Chen, Y.-F., Gao, Z., Kerris, R. J., Wang, W., Binder, B. M., and Schaller, G. E. (2010) Ethylene receptors function as components of high-molecular-mass protein complexes in Arabidopsis. PloS One 5, e8640 7. Parkinson, J. S., and Kofoid, E. C. (1992) Communication modules in bacterial signaling proteins. Annu. Rev. Genet. 26, 71–112 8. Chang, C., Kwok, S., Bleecker, A., and Meyerowitz, E. (1993) Arabidopsis ethylene-response gene ETR1: similarity of product to two-component regulators. Science 262, 539–544 9. Gamble, R. L., Coonfield, M. L., and Schaller, G. E. (1998) Histidine kinase activity of the ETR1 ethylene receptor from Arabidopsis. Proc. Natl. Acad. Sci. U. S. A. 95, 7825–7829 10. Moussatche, P., and Klee, H. J. (2004) Autophosphorylation Activity of the Arabidopsis Ethylene Receptor Multigene Family. J. Biol. Chem. 279, 48734–48741 11. Gamble, R. L., Qu, X., and Schaller, G. E. (2002) Mutational Analysis of the Ethylene Receptor ETR1. Role of the Histidine Kinase Domain in Dominant Ethylene Insensitivity. Plant Physiol 128, 1428–1438 12. Hua, J., and Meyerowitz, E. M. (1998) Ethylene Responses Are Negatively Regulated by a Receptor Gene Family in Arabidopsis thaliana. Cell 94, 261–271 13. McDaniel, B. K., and Binder, B. M. (2012) Ethylene Receptor 1 (ETR1) Is Sufficient and Has the Predominant Role in Mediating Inhibition of Ethylene Responses by Silver in Arabidopsis thaliana. J. Biol. Chem. 287, 26094–26103 14. Casino, P., Rubio, V., and Marina, A. (2009) Structural insight into partner specificity and phosphoryl transfer in two-component signal transduction. Cell 139, 325–336 15. Wang, C., Sang, J., Wang, J., Su, M., Downey, J. S., Wu, Q., Wang, S., Cai, Y., Xu, X., Wu, J., Senadheera, D. B., Cvitkovitch, D. G., Chen, L., Goodman, S. D., and Han, A. (2013) Mechanistic Insights Revealed by the Crystal Structure of a Histidine Kinase with Signal Transducer and Sensor Domains. PLoS Biol 11, e1001493 16. Albanesi, D., Martín, M., Trajtenberg, F., Mansilla, M. C., Haouz, A., Alzari, P. M., de Mendoza, D., and Buschiazzo, A. (2009) Structural plasticity and catalysis regulation of a thermosensor histidine kinase. Proc. Natl. Acad. Sci. 106, 16185–16190 17. Ferris, H. U., Dunin-Horkawicz, S., Hornig, N., Hulko, M., Martin, J., Schultz, J. E., Zeth, K., Lupas, A. N., and Coles, M. (2012) Mechanism of regulation of receptor histidine kinases. Structure 20, 56–66 18. Huang, Y., Li, H., Hutchison, C. E., Laskey, J., and Kieber, J. J. (2003) Biochemical and functional analysis of CTR1, a protein kinase that negatively regulates ethylene signaling in Arabidopsis. Plant J. Cell Mol. Biol. 33, 221–233 19. Gao, Z., Chen, Y.-F., Randlett, M. D., Zhao, X.-C., Findell, J. L., Kieber, J. J., and Schaller, G. E. (2003) Localization of the Raf-like kinase CTR1 to the endoplasmic reticulum of Arabidopsis through participation in ethylene receptor signaling complexes. J. Biol. Chem. 278, 34725–34732 20. Clark, K. L., Larsen, P. B., Wang, X., and Chang, C. (1998) Association of the Arabidopsis CTR1 Raf-like kinase with the ETR1 and ERS ethylene receptors. Proc. Natl. Acad. Sci. U. S. A. 95, 5401–5406 21. Kieber, J. J., Rothenberg, M., Roman, G., Feldmann, K. A., and Ecker, J. R. (1993) CTR1, a negative regulator of the ethylene response pathway in Arabidopsis, encodes a member of the raf family of protein kinases. Cell 72, 427–441 22. Zhao, Q., and Guo, H.-W. (2011) Paradigms and Paradox in the Ethylene Signaling Pathway and Interaction Network. Mol. Plant 4, 626–634 23. Hahn, A., and Harter, K. (2009) Mitogen-Activated Protein Kinase Cascades and Ethylene: Signaling, Biosynthesis, or Both? Plant Physiol. 149, 1207–1210 24. Ju, C., Yoon, G. M., Shemansky, J. M., Lin, D. Y., Ying, Z. I., Chang, J., Garrett, W. M., Kessenbrock, M., Groth, G., Tucker, M. L., Cooper, B., Kieber, J. J., and Chang, C. (2012) CTR1
by guest on April 13, 2018
http://ww
w.jbc.org/
Dow
nloaded from

Structural model of the cytosolic domain of ETR1
12
phosphorylates the central regulator EIN2 to control ethylene hormone signaling from the ER membrane to the nucleus in Arabidopsis. Proc. Natl. Acad. Sci. U. S. A. 109, 19486–19491 25. Qiao, H., Shen, Z., Huang, S.-S. C., Schmitz, R. J., Urich, M. A., Briggs, S. P., and Ecker, J. R. (2012) Processing and Subcellular Trafficking of ER-Tethered EIN2 Control Response to Ethylene Gas. Science 338, 390–393 26. Qu, X., Hall, B. P., Gao, Z., and Schaller, G. E. (2007) A strong constitutive ethylene-response phenotype conferred on Arabidopsis plants containing null mutations in the ethylene receptors ETR1 and ERS1. BMC Plant Biol. 7, 3 27. Gao, Z., Wen, C.-K., Binder, B. M., Chen, Y.-F., Chang, J., Chiang, Y.-H., Kerris, R. J., Chang, C., and Schaller, G. E. (2008) Heteromeric interactions among ethylene receptors mediate signaling in Arabidopsis. J. Biol. Chem. 283, 23801–23810 28. Mayerhofer, H., Panneerselvam, S., and Mueller-Dieckmann, J. (2012) Protein Kinase Domain of CTR1 from Arabidopsis thaliana Promotes Ethylene Receptor Cross Talk. J. Mol. Biol. 415, 768–779 29. Qiu, L., Xie, F., Yu, J., and Wen, C.-K. (2012) Arabidopsis RTE1 Is Essential to Ethylene Receptor ETR1 Amino-Terminal Signaling Independent of CTR1. PLANT Physiol. 159, 1263–1276 30. Wagner, J. R., Zhang, J., Brunzelle, J. S., Vierstra, R. D., and Forest, K. T. (2007) High Resolution Structure of Deinococcus Bacteriophytochrome Yields New Insights into Phytochrome Architecture and Evolution. J. Biol. Chem. 282, 12298–12309 31. Müller-Dieckmann, H. J., Grantz, A. A., and Kim, S. H. (1999) The structure of the signal receiver domain of the Arabidopsis thaliana ethylene receptor ETR1. Struct. Lond. Engl. 1993 7, 1547–1556 32. Zhou, P., Lugovskoy, A. A., and Wagner, G. (2001) A solubility-enhancement tag (SET) for NMR studies of poorly behaving proteins. J. Biomol. NMR 20, 11–14 33. Mayerhofer, H., and Mueller-Dieckmann, J. (2013) Cloning, expression, purification and preliminary X-ray analysis of the dimerization domain of ethylene response sensor 1 (ERS1) from Arabidopsis thaliana. Acta Crystallograph. Sect. F Struct. Biol. Cryst. Commun. 69, 1029–1032 34. Kabsch, W. (2010) XDS. Acta Crystallogr. D Biol. Crystallogr. 66, 125–132 35. Collaborative Computational Project Number 4 (1994) The CCP4 suite: programs for protein crystallography. Acta Crystallogr Biol Crystallogr 50, 760–763 36. Evans, P. (2005) Scaling and assessment of data quality. Acta Crystallogr. D Biol. Crystallogr. 62, 72–82 37. Pape, T., and Schneider, T. R. (2004) HKL2MAP : a graphical user interface for macromolecular phasing with SHELX programs. J. Appl. Crystallogr. 37, 843–844 38. Langer, G., Cohen, S. X., Lamzin, V. S., and Perrakis, A. (2008) Automated macromolecular model building for X-ray crystallography using ARP/wARP version 7. Nat. Protoc. 3, 1171–1179 39. Adams, P. D., Afonine, P. V., Bunkóczi, G., Chen, V. B., Davis, I. W., Echols, N., Headd, J. J., Hung, L.-W., Kapral, G. J., Grosse-Kunstleve, R. W., McCoy, A. J., Moriarty, N. W., Oeffner, R., Read, R. J., Richardson, D. C., Richardson, J. S., Terwilliger, T. C., and Zwart, P. H. (2010) PHENIX: a comprehensive Python-based system for macromolecular structure solution. Acta Crystallogr. D Biol. Crystallogr. 66, 213–221 40. Emsley, P., Lohkamp, B., Scott, W. G., and Cowtan, K. (2010) Features and development of Coot. Acta Crystallogr. D Biol. Crystallogr. 66, 486–501 41. Chen, V. B., Arendall, W. B., Headd, J. J., Keedy, D. A., Immormino, R. M., Kapral, G. J., Murray, L. W., Richardson, J. S., and Richardson, D. C. (2009) MolProbity : all-atom structure validation for macromolecular crystallography. Acta Crystallogr. D Biol. Crystallogr. 66, 12–21 42. Panneerselvam, S., Kaljunen, H., and Mueller-Dieckmann, J. (2013) Cloning, overexpression, purification and preliminary X-ray analysis of the catalytic domain of the ethylene receptor ETR1 from Arabidopsis thaliana. Acta Crystallograph. Sect. F Struct. Biol. Cryst. Commun. 69, 1307–1309 43. Panjikar, S., Parthasarathy, V., Lamzin, V. S., Weiss, M. S., and Tucker, P. A. (2005) Auto-Rickshaw : an automated crystal structure determination platform as an efficient tool for the validation of an X-ray diffraction experiment. Acta Crystallogr. D Biol. Crystallogr. 61, 449–457 44. Sheldrick, G. M. (2007) A short history of SHELX. Acta Crystallogr. A 64, 112–122
by guest on April 13, 2018
http://ww
w.jbc.org/
Dow
nloaded from

Structural model of the cytosolic domain of ETR1
13
45. Roessle, M. W., Klaering, R., Ristau, U., Robrahn, B., Jahn, D., Gehrmann, P., Konarev, P., Round, A., Fiedler, S., Hermes, C., and Svergun, D. (2007) Upgrade of the small-angle X-ray scattering beamline X33 at the European Molecular Biology Laboratory, Hamburg. J Appl Cryst 40, 190–194 46. Konarev, P. V., Volkov, V. V., Sokolova, A. V., Koch, M. H. J., and Svergun, D. I. (2003) PRIMUS : a Windows PC-based system for small-angle scattering data analysis. J. Appl. Crystallogr. 36, 1277–1282 47. Guinier, A. (1939) La diffraction des rayons X aux tres petits angles; application a l’etude de phenomenes ultramicroscopiques. Ann Phys Paris 12, 161–237 48. Svergun, D. I. (1992) Determination of the regularization parameter in indirect-transform methods using perceptual criteria. J. Appl. Crystallogr. 25, 495–503 49. Petoukhov, M. V., Franke, D., Shkumatov, A. V., Tria, G., Kikhney, A. G., Gajda, M., Gorba, C., Mertens, H. D. T., Konarev, P. V., and Svergun, D. I. (2012) New developments in the ATSAS program package for small-angle scattering data analysis. J. Appl. Crystallogr. 45, 342–350 50. Svergun, D., Barberato, C., and Koch, M. H. J. (1995) CRYSOL – a Program to Evaluate X-ray Solution Scattering of Biological Macromolecules from Atomic Coordinates. J. Appl. Crystallogr. 28, 768–773 51. Franke, D., and Svergun, D. I. (2009) DAMMIF, a program for rapid ab-initio shape determination in small-angle scattering. J. Appl. Crystallogr. 42, 342–346 52. Svergun, D. I. (1999) Restoring Low Resolution Structure of Biological Macromolecules from Solution Scattering Using Simulated Annealing. Biophys. J. 76, 2879–2886 53. Volkov, V. V., and Svergun, D. I. (2003) Uniqueness of ab initio shape determination in small-angle scattering. J. Appl. Crystallogr. 36, 860–864 54. Petoukhov, M. V., and Svergun, D. I. (2005) Global Rigid Body Modeling of Macromolecular Complexes against Small-Angle Scattering Data. Biophys. J. 89, 1237–1250 55. Kozin, M. B., and Svergun, D. I. (2001) Automated matching of high- and low-resolution structural models. J. Appl. Crystallogr. 34, 33–41 56. Eswar, N., Webb, B., Marti-Renom, M. A., Madhusudhan, M. s., Eramian, D., Shen, M., Pieper, U., and Sali, A. (2002) in Current Protocols in Bioinformatics, John Wiley & Sons, Inc. 57. Ulijasz, A. T., Cornilescu, G., Cornilescu, C. C., Zhang, J., Rivera, M., Markley, J. L., and Vierstra, R. D. (2010) Structural basis for the photoconversion of a phytochrome to the activated Pfr form. Nature 463, 250–254 58. Martinez, S. E., Wu, A. Y., Glavas, N. A., Tang, X.-B., Turley, S., Hol, W. G. J., and Beavo, J. A. (2002) The two GAF domains in phosphodiesterase 2A have distinct roles in dimerization and in cGMP binding. Proc. Natl. Acad. Sci. U. S. A. 99, 13260–13265 59. Bernadó, P., Mylonas, E., Petoukhov, M. V., Blackledge, M., and Svergun, D. I. (2007) Structural characterization of flexible proteins using small-angle X-ray scattering. J. Am. Chem. Soc. 129, 5656–5664 60. Marina, A., Mott, C., Auyzenberg, A., Hendrickson, W. A., and Waldburger, C. D. (2001) Structural and Mutational Analysis of the PhoQ Histidine Kinase Catalytic Domain. J. Biol. Chem. 276, 41182–41190 61. Bilwes, A. M., Quezada, C. M., Croal, L. R., Crane, B. R., and Simon, M. I. (2001) Nucleotide binding by the histidine kinase CheA. Nat Struct Mol Biol 8, 353–360 62. Yamada, S., Sugimoto, H., Kobayashi, M., Ohno, A., Nakamura, H., and Shiro, Y. (2009) Structure of PAS-Linked Histidine Kinase and the Response Regulator Complex. Structure 17, 1333–1344 63. Dunin-Horkawicz, S., and Lupas, A. N. (2010) Measuring the conformational space of square four-helical bundles with the program samCC. J. Struct. Biol. 170, 226–235 64. Yang, Y., and Inouye, M. (1991) Intermolecular complementation between two defective mutant signal-transducing receptors of Escherichia coli. Proc. Natl. Acad. Sci. U. S. A. 88, 11057–11061 65. Petoukhov, M. V., Konarev, P. V., Kikhney, A. G., and Svergun, D. I. (2007) ATSAS 2.1 – towards automated and web-supported small-angle scattering data analysis. J. Appl. Crystallogr. 40, 223–228 Acknowledgements -We gratefully acknowledge the ESRF for provision of beamtime at beamlines ID23-1 and ID29, SLS for provision of beam time at beamline X06DA and EMBL/DESY for access to the beamlines X12, X33 and P12 and Manfred Weiss for support.
by guest on April 13, 2018
http://ww
w.jbc.org/
Dow
nloaded from

Structural model of the cytosolic domain of ETR1
14
FOOTNOTES The abbreviations used are: CA, Catalytic ATP-binding; CTR1, Constitutive triple response-1; DHp, Dimerization Histidine phosphotransfer; ERS1, Ethylene response sensor 1; ETR1, ethylene receptor 1; HK, histidine kinase; NDSB, 250mM 3-(1-Pyridinio)-1-propanesulfonate; RD, receiver domain; SAXS, small angle x-ray scattering; TCS, two-component system; 1To whom correspondence should be addressed: Jochen Mueller-Dieckmann, Abteilung für Mikrobiologie und Biotechnologie, Biozentrum Klein Flottbek, Universität Hamburg, Ohnhorststraße 18, 22609 Hamburg, Germany, e-Mail: [email protected], Tel: +49 40 42816 651, Fax: +49 40 42816 459 *HDTM and AT were supported by fellowships from the EMBL Interdisciplinary Postdocs programme (EIPOD). FIGURES LEGENDS Figure 1: Schematic model of an ETR1 dimer with curly brackets indicating the boarders of the constructs used to assemble the final model. Constructs used for SAXS measurements are on the left, the homology models and crystal structures on the right. The crystal structures of the ERS1 DHp domain and the ETR1 CA domain and all the SAXS models are described in this work. Figure 2: Dimerization domain of ERS1 (DHpERS1). A) Cartoon representation in two orientations separated by 90º. The two hairpins per dimer are coloured dark (chain A) and light red (chain B), respectively, with the scheme being preserved in all panels of the image. B) Superposition of DHpERS1 (res. 353-404) highlighting the effect of the kink on the N-terminal section of the domain. The axis used to calculate the angle between the helices is indicated. C) Comparison of the region around the phosphoryl-accepting histidine residue (shown as sticks) with a1 (small kink, left) and a1’ (large kink, right) with selected residues shown as sticks and atom distances shown as dashed lines D) Comparison of the topology of the hairpin-loops of DHpERS1 (red) and HK853 (grey). Figure 3: Catalytic domain of ETR1 (CAETR1). A) Cartoon representation of CAETR1 in complex with ADP. The plant specific insert residues (490-502) and the ATP lid (531-435) are disordered and shown as dashed lines, the ADP and acetate as sticks and the metal ions as spheres. B) The CAETR1 nucleotide binding side with ADP and interacting residues shown as sticks. A hydrophobic pocket formed by residues F474, I518, I526, covers the adenine moiety of ADP. A cadmium ion is coordinated between N1 of adenine ring, the residues D513 and C573 and a chloride ion (green sphere). Binding of this metal ion requires the G3-box motif residue C573, which is present only in the ethylene subfamily I receptors. C) Cd2+ coordination with phosphate groups of ADP. Ions are shown as sphere and interacting residues as sticks. Two cadmium ions (blue spheres) interacting with water molecules (red sphere) and the phosphate groups of ADP and the interacting residues (sticks) are shown. The α and β-phosphate oxygen atoms of the ADP, N470, N466 and two water molecules (W57 and W80) octahedrally coordinated the ion. Symmetry related ions and residues are highlighted with an asterisk symbol. Figure 4: Multiphase ab initio reconstruction of ETR1-∆TM A) Global fits of the models reconstructed from data for three constructs of ETR1 (ETR1-∆TM, ETR1DHp-CA-RD and ETR1DHp-CA), with the model bead phases corresponding to each data set indicated. B) SDS gel of ETR1-∆TM during different steps of the purification. Lane M marker, lane 1 empty, lane 2 pooled fractions after the NiNTA step, lane 3 after the TEV step, lane 4 after the 2nd NiNTA step, lane 5 concentrated protein used for SAXS C) Rigid body refinement of ETR1-∆TM with three homologous but dissimilar GAF domains against data of ETR1-∆TM. D) The reconstructed multiphase models, overlaid with the best rigid body model (bottom). Models on the right are rotated 90 degrees about the vertical.
by guest on April 13, 2018
http://ww
w.jbc.org/
Dow
nloaded from

Structural model of the cytosolic domain of ETR1
15
Figure 5: Rigid body refinement of ETR1-∆TM. A) Model refined in a global fit against data from three constructs, including 250 mM NDSB data for the cytoplasmic domains of ETR1. Discrepancies, χ for the fit of the models to the ETR1-∆TM, ETR1DHp-CA-RD and ETR1DHp-CA data with 250 mM NDSB are 1.5, 1.1 and 1.3, respectively. Discrepancies, χ for the fit of the models to the ETR1-∆TM, ETR1DHp-CA-RD and ETR1DHp-CA data without NDSB are 1.4, 1.2 and 1.4, respectively. B) Model refined as in A but using data without NDSB for the cytoplasmic domains of ETR1 at low protein concentration. C) Ensemble of rigid body models of ETR1-∆TM refined against SAXS data. Models at the bottom are rotated through 90 degrees relative to those above. The GAF, DHp, CA and RD domains are coloured yellow, blue, orange and green, respectively. Figure 6: Domain flexibility analysis of ETR1-∆TM. A) Rg distributions from the EOM analysis using +/- 250 mM NDSB. Runs were conducted with both DHp-CA and CA-RD linkers defined as flexible. B) Fits of the selected EOM ensemble to the experimental data. Discrepancies, χ for the fit of the models to the ETR1-∆TM data with and without 250 mM NDSB are 1.2 and 1.1, respectively. Figure 7: Results of the analysis using the program SamCC for DHPERS1 in SG C2221. The numbering of the helices from 1 to 4 corresponds to helix a1, a2, a1’ and a2’. Values are given for each layer of the four-helix bundle. Figure 8: Individual cross-sections of the DHPERS1 structure. The numbering corresponds to the amino acids in ERS1. The helices were approximately perpendicular to the view axis. Residues outside of the layer in focus were excluded for clarity. Residues are shown as sticks and water as red spheres. Figure 9: Annotated alignment of ethylene receptors and 2 bacterial histidine kinases. Red tubes and green arrows annotate the secondary structure as observed in the structures. Conserved features are indicated with the phosphorylatable His in red, the N-box in purple, the plant specific insert in orange, the G1 box in light- green, the F-box in blue, the ATP-lid in salmon, the G2 box in green and the G3 box in dark-green. The cysteine residue (C573) from G3 box motif is highlighted with an arrow symbol. This cysteine residue required for Cd2+ binding and found only in subfamily I receptors (ETR1 and ERS1). In subfamily II receptors (ETR2, ERS2 and EIN4), this cysteine is replaced by larger residues, which are not suitable to accommodate the binding of a cadmium ion.
by guest on April 13, 2018
http://ww
w.jbc.org/
Dow
nloaded from

Structural model of the cytosolic domain of ETR1
16
TABLES
Table 1: Refinement and model quality statistics of DHpERS1 and CAETR1, respectively
Protein DHpERS1 DHpERS1 CAETR1 Space group C2221 P21212 I212121 Resolution ( Å) 1.90 2.15 1.90 R-work 0.1948 (0.2872) 0.1984 (0.2373) 0.1469 (0.1380) R-free 0.2265 (0.4067) 0.2506 (0.3133) 0.1822 (0.2103) Number of atoms 1634 3224 2606 macromolecules 1550 3048 1182 water 84 176 99 RMS bonds (Å) 0.017 0.011 0.010 RMS angles (°) 1.48 1.28 1.34 Ramachandran favored (%) 99 100 99 Ramachandran outliers (%) 0 0 0 Clashscore 5.81 9.42 23.63 Average B-factor 36.90 33.10 41.80 macromolecules 36.90 33.00 40.90 solvent 37.40 35.30 50.70 Statistics for the highest-resolution shell are shown in parentheses.
by guest on April 13, 2018
http://ww
w.jbc.org/
Dow
nloaded from

Structural model of the cytosolic domain of ETR1
17
Table 2: Data collection statistics of DHpERS1 SeMet crystals
SeMet peak SeMet inflection X-ray source X12, DESY X12, DESY Wavelength (Å) 0.9772 0.9777 Resolution range (Å) 47.3-3.0 (3.15-3.0) 47.3-3.0 (3.15-3.0) Temperature (K) 100 100 Crystal-to-detector distance (mm)
272 272
Rotation range per image (°) 1.1 1.1 Total rotation range (°) 154 154 Space group C2221 C2221 Cell dimensions (Å) a = 75.20, b = 99.09,
c = 77.12 a = 75.16, b = 99.07,
c = 77.09 Observed reflections 36,987 (5,733) 36,764 (5,768) Unique reflections 11,119 (1,743) 11,090 (1,755) Multiplicity 3.3 (3.3) 3.3 (3.3) Rmerge (%) 7.0 (26.0) 7.3 (27.5) Rpim (%) 4.6 (17.1) 4.8 (18.1) Completeness (%) 99.8 (99.1) 99.9 (99.6) <I/ (I)> 17.6 (6.1) 16.8 (5.4)
by guest on April 13, 2018
http://ww
w.jbc.org/
Dow
nloaded from

Structural model of the cytosolic domain of ETR1
18
Table 3: SAXS Data Collection and Scattering Derived Parameters
Data collection parameters ETR1-ΔTM ETR1-ΔTM + NDSB Instrument P12-EMBL (storage ring
PETRAIII, Hamburg, Germany)
X33-EMBL (storage ring DORIS-III, Hamburg,
Germany) Beam geometry (mm2) 0.2 x 0.12 2.0 x 0.6 Wavelength (Å) 1.24 1.54 s-range (Å-1) 0.008 – 0.47 0.01 - 0.6 Exposure time (ms) 1 (20 x 0.05) 120 (8 x 15) Concentration range (mg ml-1) 0.7 - 4.2 0.7 – 2.7 Temperature (K) 283 283 Structural parameters* I(0) (arbitrary units) (from P(r)) 1175 ±10 72.5 ± 0.3 Rg (Å) (from P(r)) 59 ± 6 48.8 ± 1 I(0) (arbitrary units) (from Guinier) 1164 ± 40 67.9 ± 0.7 Rg (Å) (from Guinier) 55 ± 11 47.9 ± 2 Dmax (Å) 190 ± 5 150 ± 5 Porod volume estimate (Å3) 274000 ± 4200 289000 ± 5000 Dry volume calculated from sequence (Å3)
78367 78367
Molecular mass determination* Contrast (Δρ x 1010 cm-2) 3.047 2.610 Molecular mass Mr (from I(0)) 53000 ± 5000 55310 ± 5000 Molecular mass Mr (from Porod volume) 161200 ± 24000 169886 ± 20000 Calculated monomeric Mr from sequence 64771.3
64771.3
Software employed Primary data reduction Data processing Ab initio analysis Validation and averaging Rigid body modelling Computation of model intensities 3D graphics representations
Automated radial averaging (65) PRIMUS DAMMIN
DAMAVER CORAL, EOM
CRYSOL PYMOL
*Reported for 0.66 mg ml-1 measurement
by guest on April 13, 2018
http://ww
w.jbc.org/
Dow
nloaded from

Structural model of the cytosolic domain of ETR1
19
Table 4: SAXS Data Collection and Scattering Derived Parameters for short ETR1-ΔTM constructs.
Data collection parameters ETR1DHp-CA-RD ETR1DHp-CA Instrument X33-EMBL
(storage ring DORIS-III, Hamburg, Germany) Beam geometry (mm) 2.0 x 0.6 mm2 2.0 x 0.6 mm2 Wavelength (Å) 1.54 1.54 s-range (Å-1) 0.01 – 0.6 0.01 – 0.6 Exposure time (s) 120 (8 x 15) 120 (8 x 15) Concentration range (mg ml-1) 0.7 – 5.0 0.6 – 6.0 Temperature (K)
283 283
Structural parameters* I(0) (arbitrary units) (from P(r)) 63.7 ± 5 22.1 ± 0.3 Rg (Å) (from P(r)) 41.1 ± 1 27.6 ± 1 I(0) (arbitrary units) (from Guinier) 63.6 ± 1 22.2 ± 1 Rg (Å) (from Guinier) 39.8 ± 1 29.4 ± 2 Dmax (Å) 139 ± 5 87 ± 5 Porod volume estimate (Å3) 144130 ± 4200 73567 ± 5000 Dry volume calculated from sequence (Å3)
53494 33262
Molecular mass determination* Contrast (Δρ x 1010 cm-2) 3.047 3.047 Molecular mass Mr (from I(0)) 66366 ± 5000 24870 ± 2000 Molecular mass Mr (from Porod volume) 90081 ± 24000 45979 ± 5000 Calculated monomeric Mr from sequence 44210
27491
Software employed Primary data reduction Data processing Ab initio analysis Validation and averaging Rigid body modelling Computation of model intensities 3D graphics representations
Automated radial averaging (65) PRIMUS
DAMMIF, MONSA DAMAVER
CORAL, EOM CRYSOL PYMOL
by guest on April 13, 2018
http://ww
w.jbc.org/
Dow
nloaded from

Structural model of the cytosolic domain of ETR1
20
FIGURES Figure 1
by guest on April 13, 2018
http://ww
w.jbc.org/
Dow
nloaded from

Structural model of the cytosolic domain of ETR1
21
Figure 2
by guest on April 13, 2018
http://ww
w.jbc.org/
Dow
nloaded from

Structural model of the cytosolic domain of ETR1
22
Figure 3
by guest on April 13, 2018
http://ww
w.jbc.org/
Dow
nloaded from

Structural model of the cytosolic domain of ETR1
23
Figure 4
by guest on April 13, 2018
http://ww
w.jbc.org/
Dow
nloaded from

Structural model of the cytosolic domain of ETR1
24
Figure 5
by guest on April 13, 2018
http://ww
w.jbc.org/
Dow
nloaded from

Structural model of the cytosolic domain of ETR1
25
Figure 6
by guest on April 13, 2018
http://ww
w.jbc.org/
Dow
nloaded from
Structural model of the cytosolic domain of ETR1
26
Figure 7
by guest on April 13, 2018
http://ww
w.jbc.org/
Dow
nloaded from

Structural model of the cytosolic domain of ETR1
27
Figure 8
by guest on April 13, 2018
http://ww
w.jbc.org/
Dow
nloaded from

Structural model of the cytosolic domain of ETR1
28
Figure 9
by guest on April 13, 2018
http://ww
w.jbc.org/
Dow
nloaded from

D.T. Mertens and Jochen Mueller-DieckmannHubert Mayerhofer, Saravanan Panneerselvam, Heidi Kaljunen, Anne Tuukkanen, HaydynStructural Model of the Cytosolic Domain of the Plant Ethylene Receptor 1 (ETR1)
published online December 1, 2014J. Biol. Chem.
10.1074/jbc.M114.587667Access the most updated version of this article at doi:
Alerts:
When a correction for this article is posted•
When this article is cited•
to choose from all of JBC's e-mail alertsClick here
by guest on April 13, 2018
http://ww
w.jbc.org/
Dow
nloaded from