structural insights into semicrystalline states of
TRANSCRIPT

This is a repository copy of Structural insights into semicrystalline states of electrospun nanofibers: a multiscale analytical approach.
White Rose Research Online URL for this paper:https://eprints.whiterose.ac.uk/177777/
Version: Accepted Version
Article:
Maurya, AK, Weidenbacher, L, Spano, F et al. (6 more authors) (2019) Structural insights into semicrystalline states of electrospun nanofibers: a multiscale analytical approach. Nanoscale, 11 (15). pp. 7176-7187. ISSN 2040-3364
https://doi.org/10.1039/c9nr00446g
[email protected]://eprints.whiterose.ac.uk/
Reuse
Items deposited in White Rose Research Online are protected by copyright, with all rights reserved unless indicated otherwise. They may be downloaded and/or printed for private study, or other acts as permitted by national copyright laws. The publisher or other rights holders may allow further reproduction and re-use of the full text version. This is indicated by the licence information on the White Rose Research Online record for the item.
Takedown
If you consider content in White Rose Research Online to be in breach of UK law, please notify us by emailing [email protected] including the URL of the record and the reason for the withdrawal request.
1
Structural Insights into Semicrystalline States of Electrospun Nanofibers: a Multiscale Analytical Approach
Anjani K. Maurya1, 2, 5, Lukas Weidenbacher2, 3, 6, Fabrizio. Spano2, Giuseppino Fortunato2, René M. Rossi2, Martin Frenz4, Alex Dommann1, 5, Antonia Neels1,7*, Amin Sadeghpour1, 2,
3*
1Empa, Swiss Federal Laboratories for Materials Science and Technology, Center for X-ray
Analytics, St. Gallen, Switzerland
2Empa, Swiss Federal Laboratories for Materials Science and Technology, Laboratory for
Biomimetic Membranes and Textiles, St. Gallen, Switzerland
3Empa, Swiss Federal Laboratories for Materials Science and Technology, Laboratory of
Biointerfaces, St. Gallen, Switzerland
4Institute of Applied Physics, University of Bern, Bern, Switzerland
5Cellular and Biomedical Sciences, Faculty of Medicine, University of Bern, Bern,
Switzerland
6Institute for Biomechanics, Department of Health Sciences and Technology, ETH Zürich,
Zürich, Switzerland
7Department of Chemistry, University of Fribourg, Fribourg, Switzerland

2
Abstract
A dedicated nanofiber design for applications in the biomedical domain is based on the understanding of nanofiber structures. The structure of electrospun nanofibers strongly influences their properties and functionalities. In polymeric nanofibers X-ray scattering and diffraction methods, i.e. SAXS and WAXD, are capable of decoding their structural insights from about 100 nm down to the Angström scale. Here, we present a comprehensive X-ray scattering and diffraction based study and introduce new data analysis approaches to unveil detailed structural features in electrospun Poly(vinylidene fluoride-co-hexafluoropropylene) (PVDFhfp) elctrospun nanofiber membranes. Particular emphasis was placed on anisotropic morphologies being developed during the nanofiber fabrication process. Global analysis was performed on SAXS data to derive the nanofibrillar structure of repeating lamella crystalline domains with average dimensions of 12.5 nm thickness and 7.8 nm spacing along with associated tie molecules. The varying surface roughness of the nanofiber was evaluated by extracting the Porod exponent in parallel and perpendicular direction to the nanofiber axis, which was further validated by Atomic Force Microscopy. Additionally, the presence of a mixture of the monoclinic alpha and the orthorhombic beta PVDFhfp phases both exhibiting about 6% larger unit cells compared to the corresponding pure PVDF phases was derived from WAXD. The current study shows a generic approach in detailed understanding of internal structures and surface morphology for nanofibers. This forms the basis for targeted structure and morphology steering and the respective controlling during the fabrication process with the aim to engineer nanofibers for different biomedical applications with specific requirements.
Keywords: Nanofiber, Multiscale Analysis, SAXS, WAXD, Alignment, Polymer Electrospinning

3
Introduction
Mechanical and surface properties of advanced materials for biomedical and tissue engineering applications evolve not only from the innate chemical properties of materials but also their particular molecular arrangements, both internally and at the surface in the micro- to nanoscale. In recent years, correlations between structure and function have been emphasized and as a result, new applications for well-known materials have been derived by structural modifications 1, 2. The strategies for tuning the molecular assemblies are refined by the emergence of new methodologies and approaches to data analysis which help to provide feedback and investigate the development of novel structural features in advanced materials.
Electrospinning is a well-established technique that has been developed to produce polymeric nanofibers 3 with various applications in tissue and biomedical engineering, sensing, energy storage and filtration 4-13. The reasons for such a wide range of applications originate from the tunable morphological, mechanical, chemical and surface properties of electrospun nanofibers
14. The resultant mechanical and morphological properties are mainly derived from the structure of the polymeric chains, which are folded in nanoscale to form the nano- to micro-sized fibers14, 15. It has also been reported that a certain degree of nanofiber alignment is important for specific biomedical applications 16-18. The combined role of polymer chemical structure and nanofiber alignment shows a significant effect in promoting interactions with cells, such as controlling the phenotype and morphology of osteoblasts 16 and skeletal myoblasts14, 15, 19. In vascular graft applications, topography driven from the size distribution of nanofibers influence the platelets adhesion on membranes and the blood compatibility 20.
It is well understood that the folding of the polymeric chains into nanofibers and the morphology is highly dependent not only on the conductivity of the electrospinning solution, the spinning parameters 21, and the post-treatment of the nanofiber membranes 22, but also on the polymer type and environmental conditions. The polymer fiber is drawn during the electrospinning process in between the needle and the collector. Due to the simultaneous solvent evaporation and the drawing effect, the polymeric chains suspended in the solution arrange themselves to form the nanofibers. The alignment of nanofibers can be controlled by the collector setup. A facile way to tune the degree of alignment and the crystallographic phase formation is to use a rotating drum collector which can be operated at varying speeds. The polymer fiber could further be stretched if the speed of the rotating drum collector is higher than the speed of the polymer solution jet. This causes modifications in the internal arrangement of nanofibers 14. The molecular orientation brings in additional functionalities such as higher electric conductivity and more controlled tissue engineering possibilities 23, 24. In addition, the formation of non-polar crystallographic phases will enable piezoelectrical effects14 and accordingly applications for electromechanical drug delivery systems. Therefore, it is important to investigate the structural features of the nanofibers at the nanometer scale to open up new opportunities precisely to steer their properties by improving the control during the fabrication process 21, 25-27.
In literature, structures of natural and synthetic melt-spun polymeric fibers of diameters within the range of tens of micrometers have been widely investigated by several research groups using small angle X-ray scattering (SAXS) and wide angle X-ray diffraction (WAXD)

4
techniques. Both SAXS and WAXD offer a unique opportunity to investigate the internal structure of the fibers from the Angström to the nanometer length scale 22, 28, 29. In the 1950s Heyn 30 and Statton 31, 32 reported on the distribution of micro-voids and microcrystals in the fibers using SAXS. Hermans et al. 33 discussed the quantitative investigation of scattering powers of various cellulose fibers using SAXS. In the 1970s, detailed theoretical and experimental research works have been published by Ruland 34-36 on the calculation of length and misorientation width of microfibrils in carbon fibers. Furthermore, investigations followed in the 2000s by Murhty et al. 37, 38 on the analysis of small angle scattering of polyamide-6 and nylon-6 fibers. Above reported works have performed the scattering experiments (SAXS/WAXD) on single microfibers because of their bigger diameter and high probing volume. However, performing these experiments on single electrospun fibers within the size range of nanometers to micrometers is challenging due to the low crystallinity and very small probing volume of the nanofibers. Hence, very often measurements are performed on nanofiber membranes which make the data analysis more sophisticated based on a high number of nanofibers being simultaneously probed by a micrometer size X-ray beam 22, 28, 29,
39. In few reported studies on electrospun nanofibers, structural information from 2D SAXS profiles has been qualitatively discussed 28, 40, 41 and only very limited microscopic information such as nanofiber orientation has been extracted 41. Recently, Kogikoski et al. 42 reported on a quantitative analysis of the data based on simulations of the whole scattering profile to understand the structure and molecular arrangement in a polycaprolactone-polyaniline blend.
In this study, we have investigated electrospun membranes fabricated of Poly(vinylidene fluoride-co-hexafluoropropylene) (PVDFhfp). This fluorinated copolymer has been used in the production of semi-permeable membranes and also various biomedical applications due to its high biocompatibility 43-46. We report on a comprehensive roadmap, in which the scattering and diffraction methods and their relevant theories have been used and applied for a detailed understanding of the nanostructure inside and at the surface of semicrystalline electrospun nanofibers. In particular, we used globally simulated 1D-SAXS profiles in horizontal and vertical alignment directions to obtain structural insights and surface morphology variations on aligned and non-aligned electrospun nanofibers.
Surface morphology was further validated by atomic force microscopy (AFM). The crystalline domains in nanofibers were investigated by WAXD identifying the present crystallographic phases. By applying combined SAXS and WAXD techniques, a multiscale picture in which nanofibrillar structure with repeated lamellar crystalline domains separated by tie-molecules was derived. Additionally, the degree of alignment of nanofiber in the membranes, prepared at different rotating speed, was quantified by applying the Ruland approach as well as a new correlation analysis approach used on scanning electron microscopy images of membranes.
Materials and Methods
Sample preparation

5
Electrospinning experiments were performed with a conventional setup, schematic of which is shown in figure 1 and described elsewhere 43. In short, PVDFhfp (Mw: 400 000) was dissolved in dimethylformamide (DMF) in a concentration of 35% w/v. The solution was filled in a 3 ml syringe (B. Braun, Melsungen, Germany) equipped with a blunt 21 G needle. The flow rate was adjusted to 20 µl min-1 and the voltage was set to +14 kV at the needle and
-5 kV at the collector. Both a flat plate collector and a rotating drum collector with a diameter of 5 cm (Yflow Systemas y Desarrollos S.L., Málaga, Spain) were used to collect the fibers at a distance of 25 cm at room temperature with a 30-40% relative humidity condition. The rotating drum was operated at different speeds of 1000, 1500 and 2000 rpm, which correspond to 5.2, 7.8, and 10.5 m/s linear speeds, respectively.
Figure (1). (a) Schematic of the electrospinning technique. (b) Different collectors used to produce non-aligned and aligned nanofiber membrane.
Small angle X-ray scattering (SAXS) and wide angle X-ray diffraction (WAXD)
SAXS experiments were performed with a Bruker Nanostar instrument (Bruker AXS GmbH, Karlsruhe, Germany) equipped with pinhole collimation system and a micro-focused X-ray Cu source (wavelength CuKα 1.5406 Å) providing a beam with a diameter of about 400 µm. A 2D MikroGap technology based detector (VÅNTEC-2000) with 2048 x 2048 pixels with each pixel size of 68 x 68 µm provided a resolvable q-range between 0.05 to 2.20 nm-1 for a 107 cm sample-to-detector distance (SDD). The instrument was also equipped with a semi-transparent, custom-built beamstop. The X-ray beam in transmission mode impinged non-aligned and aligned nanofiber membranes. The scattering frames were recorded for 3 hours at room temperature in moderate vacuum condition of about 10-2 mbar pressure to reduce air scattering. Prior to the experiments, the SDD was calibrated with standard silver behenate powder. 1D profiles were extracted using the Bruker software DIFFRAC.EVA. The background was subtracted after normalizing the total scattering profile by the transmitted intensity measured at the direct beam position.
WAXD patterns were recorded on a Stoe Mark II-Imaging Plate Diffractometer System (Stoe & Cie, 2015) equipped with a graphite-monochromator. Data collection was performed at room temperature using MoKα radiation (λ = 0.7107 Å) and a beam having a diameter of about 500 µm. Each measurement was performed for 60 minutes at the SDD of 20 cm. The
(a) (b)

6
1D profile was extracted using the X-Area software provided by Stoe & Cie. The 1D profile from different samples was averaged over 5 acquisitions for each sample to achieve a better signal to noise ratio.
Scanning Electron Microscopy (SEM)
Electrospun membranes were imaged with a scanning electron microscope (Hitachi S-4800, Hitachi-High Technologies, Illinois, USA). An acceleration voltage of 2 kV and a current flow of 10 mA were used. All samples were sputtered with 8 nm of gold-palladium conducting layers. To determine the average nanofiber diameter, 30 nanofibers were selected and measured in diameter using ImageJ freeware 47.
Atomic Force Microscopy (AFM)
The AFM characterization of the electrospun nanofibers was performed using a scanning probe microscope FlexAFM V5 (Nanosurf AG, Liestal, Switzerland). The microscope was equipped with a C3000 controller and its associated software. The measurements were performed in dynamic (tapping) mode. Two types of probes have been used throughout this work: the Tap190Al-G probes, long silicon cantilevers with pyramidal tip and the SHR300, a high resolution cantilever with a particular sharp diamond-like carbon tip. Both cantilevers were purchased from Budgetsensors, Sofia, Bulgaria. The Tap190Al-G probe has a nominal force constant of 48 N/m, a resonant frequency of 190 kHz and a tip radius lower than 10 nm. The SHR300 probe has a nominal force constant of 40 N/m, a resonant frequency of 300 kHz and a precise tip radius of 1 nm. No additional cleaning process has been applied to the probe.
The set point was maintained to 50% during scanning with continuous attention to the presence of adhesion forces at the interface. No artefacts have been observed. Small scanning areas (from 1-2 µm2) were selected for producing high resolution images. Topographic images, roughness and profile characterization were obtained after filtering using the SPIP V6.5 and Gwyddion V2.45 software.
Theoretical analysis approach
For the determination of the degree of nanofibers orientation, two different approaches have been used in our study: (1) the correlation analysis of SEM images in real space and (2) the orientation analysis by the Ruland method applied on SAXS patterns in inverse (Fourier) space.
(1) Degree of orientation quantification by correlation analysis of SEM images
In order to quantify the degree of orientation of the nanofibers in the electrospun membranes prepared at different speeds of the rotating collector, we employed the spatial correlation analysis 48 by the use of SEM micrographs as real space images. In this approach, the original SEM micrographs (1920×2560 pixels) were cropped into smaller dimension of 500×500 pixels at a random position, which were used as a reference image. The spatial cross-correlation coefficients (R) of this reference image were calculated with those cropped into the same dimension but at positions shifted by up to 40 pixels, either in parallel or perpendicular directions with respect to a reference axis (usually defined by the nanofiber

7
alignment axis). Theoretically, R would decrease upon displacement in either direction, demonstrating decay due to the loss of similarity between two cropped images. We have used such quantitative measures of dissimilarity by displacements in either direction (which have been averaged over 50 repetitions) to determine the relative degree of alignment of nanofibers. Based on this approach, we introduced a misorientation coefficient obtained from SEM images (Eq. 1):
Misorientation coefficient = 𝐿𝑣𝐿ℎ (1)
where, 𝐿𝑣 and 𝐿ℎ refer to the displacement in vertical and horizontal directions at half decays of R, respectively. The decay profiles of each sample were fitted by exponential decay function to calculate the 𝐿𝑣 and 𝐿ℎat half decay of R. Note that, in the above equation, the nanofiber axis is set as the reference and therefore 𝐿𝑣𝐿ℎ always has a value below or equal to
unity. The misorientation coefficient varies between 0 and 1, for perfectly aligned and randomly oriented nanofibers, respectively. (2) Orientation analysis by the Ruland method using SAXS data
The degree of orientation of the scatterers can also be obtained from the Ruland approach by analyzing the 2D-SAXS profiles (Fourier space) 34. In this method, the azimuthal broadening of intensities along the streak axis, which relates to the anisotropic scattering in the aligned nanofiber samples, is evaluated. This azimuthal broadening for infinite length scatterer in SAXS is independent of q and equal to the misorientation width of the scatterers. However, for finite length scatterers, there is an additional term weighted mainly at low q which introduces the observed azimuthal broadening as a function of q and hence, both lengths of scatterer (lf) and misorientation width can be derived from the analysis. The azimuthal broadening (𝐵𝑜𝑏𝑠) is defined as the full width half maximum (FWHM) of the azimuthal profile fitted using the Lorentzian peak function at constant q. Compared to other peak functions, the Lorentzian function provides the best fit properties in this type of analysis, as reported and successfully applied in previous studies 34, 41, 49, 50. Azimuthal broadening (𝐵𝑜𝑏𝑠) linearly depends on the inverse of scattering vector modulus (𝑞−1) if the Lorentzian function is used to fit the azimuthal profiles (Eq. 2):
𝐵𝑜𝑏𝑠 = 2𝜋𝑙𝑓𝑞 + 𝐵Ф (2)
Therefore, the length of the scatterer (lf) and the misorientation width (𝐵Ф) can be computed from the slope and the intercept of the plot representing 𝐵𝑜𝑏𝑠 as a function of 𝑞−1, respectively 34. To apply the Ruland method, the center of the beam and the SDD was obtained for azimuthal scans by fitting the 2D-SAXS pattern of silver behenate calibrant using the Fit2D software 51. Azimuthal scans and all the fittings were obtained using Matlab.
Global analysis of SAXS data
As nanofibers ideally possess a cylindrical symmetry, more distinguished anisotropic scattering is expected from the nanofibers with higher degree of alignment. In order to achieve structural features along and perpendicular to the nanofiber axis, the 2D-SAXS

8
patterns were azimuthally integrated (radial profile) over 30° along and perpendicular to the nanofiber alignment axis. The resulting 1D-SAXS profiles were fitted with a model capable of simulating the scattering pattern over the entire q range after background subtraction, referred to as the global analysis approach. This approach employs the structure factor model by the correlation peak function, which has originally been proposed for analyzing polymer aggregates in solution 52, 53. In addition, a Porod function is embedded to explain the decay in scattering intensity. Interestingly, the Porod slope can precisely be determined for nanofiber membrane systems due to their large and polydisperse scatterers. Therefore, the scattering intensity can be determined by Eq. 3:
𝐼 (𝑞) = 𝐴𝑞𝛼 + 𝐵1 + (2 |𝑞 − 𝑞0|𝑤 )𝑚 (3)
where A and B are the multiplying factors, α is the Porod exponent, 𝑞0 is the peak position, 𝑤 is the FWHM of the peak and 𝑚 is the fitting parameter for correction of the peak shape (when 𝑚 = 2 a Lorentzian peak function is assumed). We performed the optimization of all parameters in Matlab applying a least-square method (Levenberg-Marquardt algorithm).
The decay, explained by the Porod function, provides information about the surface roughness of the nanofibers. The average d-spacing (d) between the polymer aggregates was calculated from the peak position (𝑞0) by applying Bragg’s law (Eq. 4);
𝑑 = 2𝜋𝑞𝑜 (4)
The average thickness of the polymer aggregates was calculated by the Scherer equation (Eq. 5):
ℎ = 𝐾 2𝜋𝑤 (5)
where 𝐾 is the shape factor and w is the broadening of the correlation peak. The shape factor of 0.866 is used, obtained from the derivation adapted to scattering with area detectors by Smilgies 54.

9
Results and discussion
Degree of alignment evaluated by image analysis of SEM micrographs
SEM micrographs of the non-aligned and aligned nanofiber membranes are shown in Figure 2. Average nanofiber diameters were evaluated from SEM micrographs. An average diameter of 490 ± 230 nm was measured for non-aligned as well as aligned samples.
Figure (2). SEM micrographs of nanofiber membranes; (a) non-aligned and (b) aligned at1000 rpm, (c) aligned at1500 rpm and (d) aligned at 2000 rpm drum speed.
By applying the image correlation analysis, the degree of orientation of nanofibers has been quantified as a function of the rotating drum speed. Correlation coefficients for horizontal and vertical displacement are plotted in Figure 3a and 3b, respectively. The inner panels represent a displacement at 50% of the initial R.
Figure (3). Correlation coefficients (R) vs displacement plots; (a) displacement in horizontal direction and (b) displacement in vertical direction. Continuous red lines represent the
20 µm 20 µm
20 µm 20 µm
(a) (b)
(c) (d)
Alignment

10
exponential fitting. The inner panels represent the correlation lengths guided through a trend line for each sample in which the halves of initial R have been reached.
A high misorientation coefficient of 0.92 ± 0.08 was obtained for the non-aligned sample while it reduces for samples aligned at increasing rotating drum speed. The misorientation coefficient of 0.59 ± 0.07, 0.55 ± 0.07 and 0.38± 0.05 were calculated for aligned samples at 1000, 1500 and 2000 rpm, respectively which quantified that increasing the rotating speed also increases the degree of alignment.
Structural features obtained by SAXS
SAXS measurements were performed on the nanofiber membranes. Since the beam size was about 400 µm, a high number of individual nanofibers were exposed within the scattering volume and their collective scattering was recorded. Therefore, the measured scattering profiles not only appear due to the internal electronic contrast of the nanostructures within the nanofibers but also from the surface scattering occurring from electronic contrast between polymer nanofibers and the voids within the nanofiber membrane. The 2D-SAXS profiles from non-aligned and aligned nanofiber membranes are shown in Figure 4. The non-aligned membrane scatters the X-ray in all directions because the nanofibers are randomly distributed while the aligned nanofiber membranes scatter in a preferred direction due to their anisotropic fibrous structure. Two scattering regions are identified in the 2D-SAXS profile of aligned nanofibers. The first is the region in which two lobes appear along the nanofibers axis at q values of 0.81±0.01 nm-1 at both sides of the direct beam. These lobes reflect the scattering from correlated crystalline domains or lamellae 35, known as the correlation peak. It is worth mentioning that, in some electrospun nanofiber systems such as Poly(ethylene oxide) and Poly(vinyl alcohol), these two lobes are not observed in the scattering profiles 28, 41. This might be due to their highly amorphous nature and hence the absence of lamellar chain packing. In the case of semicrystalline polymer systems, the lobes might be still invisible if the correlation length between crystalline domains are bigger (or crystallites are larger) than the resolution of SAXS setup, e.g. in extended chain crystals.
(a) (b)
(c) (d)

11
Figure (4). 2D small angle X-ray scattering (SAXS) profiles from PVDFhfp nanofiber membrane samples; (a) non-aligned, (b) aligned at 1000 rpm (c) aligned at 1500 rpm (d) aligned at 2000 rpm.
The second scattering feature in the 2D-SAXS profile of aligned nanofibers is the streak-like signal in the vicinity of the direct beam which demonstrates the preferred direction of the scattered intensity. This streak is perpendicular to the direction of nanofibers axis. Several reasons for this part of the scattering profile have been discussed in literature 28, 30, 34, 37, 41. The streak could be produced by extended scattering objects along the nanofiber axis 41, 55. The electronic contrast occurs between nanofibers and longitudinal pores (or voids) or within the nanofiber between amorphous and crystalline phases (known as nanofibrils). Though, the major contribution was considered to originate from the surface scattering related to the high electronic contrast between the nanofibers and the longitudinal voids 41.
We applied the Ruland analysis on this streak signal in order to quantify the degree of orientation of nanofibers by calculating the misorientation width of the elongated longitudinal voids in the membrane. The q space from 0.14 to 0.59 nm-1 was divided into 40 equispaced regions at which the azimuthal profiles were computed. Each profile was fitted using the Lorentzian function and the peak broadening (Bobs) was obtained from the FWHM (Lorentzian function demonstrates better fit to the azimuthal profiles; see the supporting information). The Bobs vs q-inverse plot for aligned samples, where the streak signal was observed, is shown in Figure 5.
Alignment Alignment
Alignment
(a) (b)
(c) (d)

12
Figure (5). Bobs as a function of q-1 for three aligned samples presented together with their corresponding linear fit according to Eq. 2 (solid lines).
The misorientation widths (BФ) of voids were then calculated from the intercept of the linear fits. The results are summarized in Table 1.
Table (1). Misorientation width calculated by the Ruland method and misorientation coefficient calculated from correlation analysis for SEM micrographs for non-aligned and aligned samples.
Samples BФ (in deg) Misorientation coefficient
Non-aligned NA 0.92 ± 0.08
Aligned (1000rpm) 49±3 0.59 ± 0.07
Aligned (1500rpm) 48±1 0.55 ± 0.07
Aligned (2000rpm) 35±1 0.38 ± 0.05
The values of BФ represent the broadness of angular distribution of elongated longitudinal voids within the nanofiber membranes. Therefore, a narrower misorientation width signifies a higher degree of alignment 41. Bobs remains sensitive to noise, which is the reason for deviation from linearity mainly at large q values (regions of low intensity). The fitting outcomes are also influenced by the degree of alignment of nanofibers, which would directly correspond to elongation in the voids inside the nanofiber membrane. The more elongated voids will produce more distinct streak signals, which will lead to more linear behavior in Bobs
vs q-1 plot. If there was no preferred elongation in the voids then no streak signal was observed as can be seen in non-aligned samples Figure 4(a). Therefore, the sample prepared with a rotating drum set to 1000 rpm was observed to possess poor linear behavior (R2 = 0.49). The nanofibers aligned at 1500 rpm and 2000 rpm resulted in a relatively better linear fit as indicated by the higher R2 values of 0.77 and 0.84, respectively. Higher R2 represent a more reliable result in the calculation of the misorientation width of the longitudinal voids. Nevertheless, the overall behavior as indicated from the calculated misorientation widths represents an increasing degree of alignment of nanofiber in the membrane fabricated at increasing rotating drum speed as shown in Table 1. These results are in accordance with the previously described correlation analysis of SEM images.
Aligned (1000 )
Aligned (1500 rpm)
Aligned (2000 rpm)

13
In order to extract further structural information from the scattering data, the 1D radial profiles have been extracted by azimuthal integration in both vertical and horizontal directions. The background subtracted radial profiles and the relevant theoretical curves (produced by global fitting with the model described in the analysis section) are presented in Figure 5.
Figure (5). 1D radial integration SAXS profile for non-aligned and aligned nanofiber membranes, (a) radial profile in horizontal direction (b) radial profile in vertical direction. The corresponding extracted peaks are shown in the inset boxes.
The lobes in the 2D-SAXS profiles are now transferred into 1D broad peaks with varying intensities depending on the nanofibers degree of alignment. They were fitted with a correlation peak function and the parameters of 𝑞0 and 𝑤 have been obtained for different samples. The d-spacings from the peak positions and the thickness of the lamellar crystalline domains from the peak broadening (FWHM) have been calculated in horizontal and vertical directions and are listed in Table 2. The results reveal that the peak position remains approximately at 0.81±0.01 nm-1 for the samples with different alignments, which corresponds to a d-spacing of 7.78±0.10 nm. Similarly, the FWHM of the peaks is invariant within the error margin; by applying the Scherrer equation, the lamella thickness of 12.53±0.10 nm was calculated.

14
Table (2). Fitting parameters obtained by global analysis of SAXS data in horizontal and vertical directions (see Eqs. 4 to 6). Ap represents the numerical area under the peak after subtracting the corresponding Porod line.
Horizontal direction Vertical direction
qo (nm-1)
d=𝟐𝝅𝒒𝒐
(nm) w (nm-1)
h = K𝟐𝝅𝒘
(nm)
Ap
qo (nm-1)
d=𝟐𝝅𝒒𝒐
(nm) w (nm-1)
h = K𝟐𝝅𝒘
(nm)
Ap
Non-aligned
0.82±0.01 7.66±0.10 0.45±0.02 11.91±0.1
3 117.5±1.
4 0.82±0.01
7.66±0.10
0.47±0.03 11.80±0.1
6
120.5±1.8
Aligned (1000 rpm)
0.81±0.01 7.75±0.09 0.44±0.02 12.58±0.1
0 269.8±2.
4 0.82±0.01
7.66±0.10
0.50±0.03 11.10±0.3
2
45.8±1.1
Aligned (1500 rpm)
0.80±0.01 7.85±0.09 0.44±0.01 12.69±0.0
9 469.9±3.
9 0.83±0.02
7.57±0.14
0.47±0.04 11.74±0.6
0
30.6±1.6
Aligned (2000 rpm)
0.80±0.01 7.85±0.09 0.43±0.01 12.96±0.0
6 524.4±4.
1 0.83±0.03
7.57±0.23
0.53±0.05 10.32±0.6
7
19.5±0.8
Despite the constant peak positions and broadness, the peak intensity measured in horizontal and vertical directions for different samples varies noticeably compared to the non-aligned sample. In order to quantify this variation in the peak intensity, the area under the peak (Ap) was computed and presented in Table 2. As the alignment of nanofibers increases, Ap increases in horizontal direction while it shows a decreasing trend in the vertical direction. These trends prove that crystalline domains are arranged along the nanofiber axis direction. If more nanofibers are aligned, more intensified peaks are obtained. Hence, the positions of crystalline domains (or lamella) within the nanofibers are correlated along the nanofiber axis. The correlation of lamellar domains along the nanofiber direction further provides the experimental evidence of the nanofibrillar structure as shown schematically in Figure 6. More details of such lamellar domains and the chain packings will be discussed in the WAXD section.
Figure (6). Schematic representation of the nanofibrillar structure and repeated lamella crystalline domains.
Another important parameter extracted from the fitting of the scattering profiles was the Porod exponent, which explains the overall decay of intensity as a function of q. The Porod exponent is an indicator for the roughness at the interface of scatterers from which the

15
electron density contrast is resolved. A maximum decay exponent of 4.0 determines a very smooth interface while systematic deviation from this value indicates roughness and non-correlated density fluctuations within the phases as explained in detail by Ruland 35, 36. We observed a constant Porod decay over a wide q range due to the large and polydisperse nanofiber size distribution. This parameter has been obtained as a fitting output for aligned and non-aligned nanofibers in both directions. In Figure 7, the Porod exponents are plotted as function of rotating drum speeds used for fabricating the aligned nanofiber membranes.
Figure (7). Porod exponent as a function of drum speeds used for aligning the nanofibers obtained in horizontal (red) and vertical (blue) direction from fitting their corresponding radial profiles. A Porod exponent of 4 is indicated by constant green line for a very smooth interface.
As indicated, the Porod exponent decreases in the direction of the nanofiber axis while it increases in the perpendicular direction for aligned samples when compared to non-aligned samples. Given the nanofiber axis in horizontal direction as a reference, the increase towards the value of 4 in vertical direction in the scattering pattern (or indeed, in the reciprocal space) determines the smooth surface along the nanofiber axis. In contrast, the decrease in the Porod exponent in the horizontal direction in reciprocal space is an indication of increased surface roughness perpendicular to the nanofiber axis. Consequently, the nanofibers present a textured surface in the perpendicular direction while being rather smooth along the nanofiber axis, recalling the nanofibrillar structure of the nanofibers.
AFM was performed on single nanofibers, which also demonstrated the existence of nanofibrillar surface morphology of the nanofiber as shown in Figure 8. Similar fibrillar structures were also reported by Lim and Tan et al. 27, 56 for electrospun polycaprolactone (PCL) and poly (L-lactic acid) (PLLA) nanofibers analyzed using AFM on a single nanofiber. In order to evaluate the surface roughness in both directions, 10 horizontal and 10 vertical height profiles were extracted from AFM height images (see supporting information 1.2). The roughness of 3.5±0.7 and 1.5±0.9 nm was obtained in the horizontal and vertical directions, respectively. The values indicate that nanofibers are smoother along the main axis compared

16
to perpendicular direction. This outcome from AFM studies confirm the interpretations derived from the Porod exponent of the SAXS profiles.
Figure (8). AFM images of a single nanofiber, (a) height images (b) corresponding phase image of the single nanofiber.
In order to achieve the structural features in the Ångstrom-scale, WAXD measurements were performed on the nanofiber membranes. The 2D-WAXD profiles for the non-aligned and aligned samples with different degree of alignment are shown in Figure 9. In Figure 9a, the intensities of Bragg peaks are isotropically distributed in the rings in the 2D-WAXD profile. This indicates the overall random orientation of the lamella domain in the membrane due to the effect of the randomness of the nanofibers in the membrane. In contrast, Figures 5b, 5c and 5d represent preferred orientations for groups of reflections. This behavior becomes more pronounced with increasing degree of alignment of nanofibers in the membranes. The Bragg peak intensities are prominent due to the preferred orientation of crystallographic planes from which the reflections are originated.
(a) (b)
00⁰
128⁰

17
Figure (9). 2D WAXD patterns from PVDFhfp; (a) non-aligned, (b) aligned at 1000 rpm (c) aligned at 1500 rpm (d) aligned at 2000 rpm nanofiber membrane samples. Uniform distribution of intensities could be noted in “a” which turns into preferred reflections at horizontal or vertical directions in (b), (c) and (d).
In order to explore the crystallographic information in detail, the crystallographic phases and the related polymer chain packing within the lamella domains can be depicted after extracting the radial diffraction profiles in horizontal and vertical directions, with respect to the nanofiber alignment axis, from the measured 2D-WAXD patterns, as shown in Figure 10(a).
(110) (110)
(002)
Alignment
Alignment Alignment
(a) (b)
(c) (d)
002
110
110
00
2
18
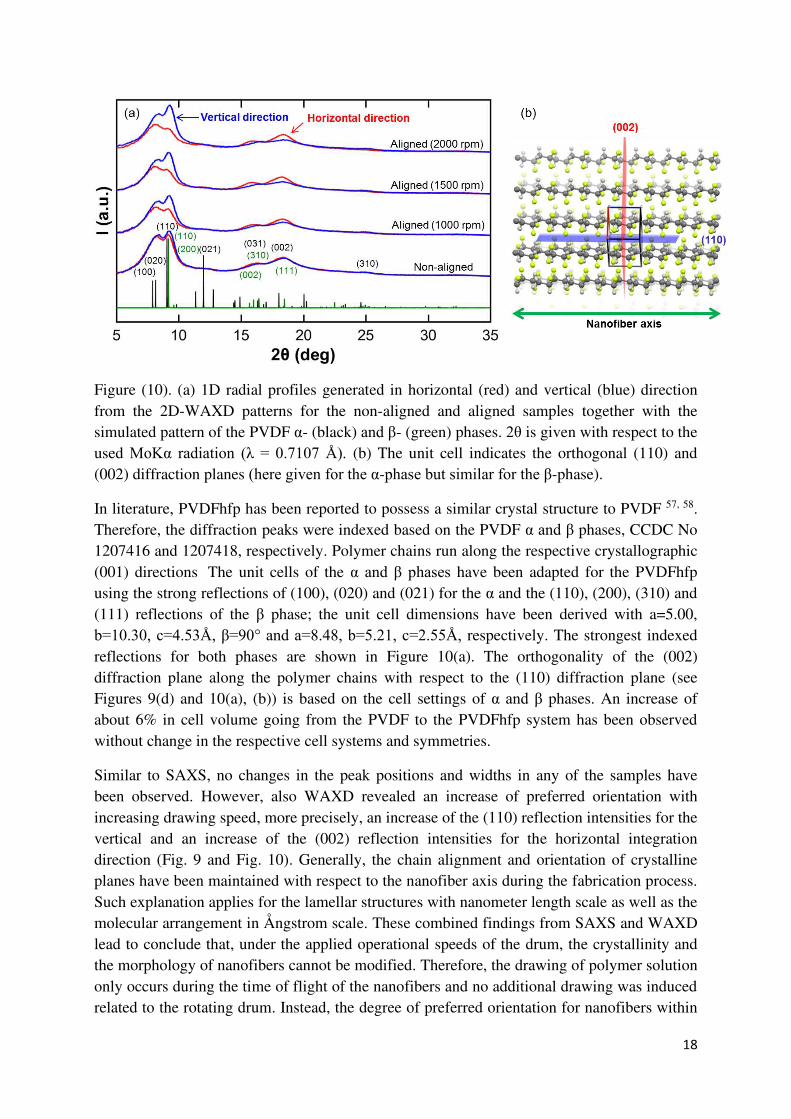
Figure (10). (a) 1D radial profiles generated in horizontal (red) and vertical (blue) direction from the 2D-WAXD patterns for the non-aligned and aligned samples together with the simulated pattern of the PVDF α- (black) and β- (green) phases. 2θ is given with respect to the used MoKα radiation (λ = 0.7107 Å). (b) The unit cell indicates the orthogonal (110) and (002) diffraction planes (here given for the α-phase but similar for the β-phase).
In literature, PVDFhfp has been reported to possess a similar crystal structure to PVDF 57, 58. Therefore, the diffraction peaks were indexed based on the PVDF α and β phases, CCDC No 1207416 and 1207418, respectively. Polymer chains run along the respective crystallographic (001) directions. The unit cells of the α and β phases have been adapted for the PVDFhfp using the strong reflections of (100), (020) and (021) for the α and the (110), (200), (310) and (111) reflections of the β phase; the unit cell dimensions have been derived with a=5.00, b=10.30, c=4.53Å, β=90° and a=8.48, b=5.21, c=2.55Å, respectively. The strongest indexed reflections for both phases are shown in Figure 10(a). The orthogonality of the (002) diffraction plane along the polymer chains with respect to the (110) diffraction plane (see Figures 9(d) and 10(a), (b)) is based on the cell settings of α and β phases. An increase of about 6% in cell volume going from the PVDF to the PVDFhfp system has been observed without change in the respective cell systems and symmetries.
Similar to SAXS, no changes in the peak positions and widths in any of the samples have been observed. However, also WAXD revealed an increase of preferred orientation with increasing drawing speed, more precisely, an increase of the (110) reflection intensities for the vertical and an increase of the (002) reflection intensities for the horizontal integration direction (Fig. 9 and Fig. 10). Generally, the chain alignment and orientation of crystalline planes have been maintained with respect to the nanofiber axis during the fabrication process. Such explanation applies for the lamellar structures with nanometer length scale as well as the molecular arrangement in Ångstrom scale. These combined findings from SAXS and WAXD lead to conclude that, under the applied operational speeds of the drum, the crystallinity and the morphology of nanofibers cannot be modified. Therefore, the drawing of polymer solution only occurs during the time of flight of the nanofibers and no additional drawing was induced related to the rotating drum. Instead, the degree of preferred orientation for nanofibers within

19
the electrospun membrane was a result of the rotating drum collector and can be controlled by its speed. Hence, the membrane morphology can be tuned in the sub-microscale. A highly increased rotation speed (3x faster than used in this study) or mechanical stretching would most probably induce much larger modifications in the nanofibers internal structure which are investigated in following studies 14, 41. We also expect a significant influence on the ratio of crystalline α and β phase. These studies and our further investigation shall establish new strategies for designing and processing of functional electrospun membranes.
Conclusions
In this study, a comprehensive and systematic route map has been developed to investigate the structure of electrospun nanofibers by SAXS and WAXD, scanning electron and atomic force microscopy. We demonstrated that electrospun PVDFhfp nanofibers have nanofibirillar structures with repeated lamellar structures with tie molecules in between. The lamella thickness of 12.5±0.1 nm and the interlamellar distances of 7.8±0.1 nm within the nanofibrils have been determined from the global analysis of SAXS data. The quantitative measure of the alignment in nanofibers was established from the Ruland approach as well as from a novel correlation analysis approach of SEM micrographs. Furthermore, the surface morphology of the nanofibers was studied along and perpendicular to the nanofiber axis by interpreting the systematic deviation in the Porod exponent. These findings are also supported by the outcomes obtained by AFM analysis. Additionally, the presence of the crystallographic α and β phases has been shown which reveals a different polymer orientation behaviour in the electrospinning process being important with respect to future electromechanical applications for specific cell growth, drug delivery and sensing application.
We conclude that despite the very chaotic nature of the electrospinning process, in which the solvent evaporation and the related polymer chain packing and lamellae arrangement occur quite rapidly, the polymer structures within the nanofibers are retained with respect to the nanofiber drawing axis by rotating the drum collector at moderate speeds used in this study. However, the nanofiber alignment can be controlled while the morphology of membranes can only be modified in the sub-micron length scale. This study presents a generic approach in understanding the crystal structure, molecular arrangements and morphology of electrospun nanofibers, which can help to precisely measure and to control the influence of fabrication process parameters. In addition, the study offers a comparative perspective as these systematic approaches might be applied to similar types of materials such as melt-spun fibers, yarns, fabrics or even wood samples and hence provides the basis for better understanding of the correlations between their structure and functions.
Author contribution
Corresponding Authors
*E-mail: [email protected]
*E-mail: [email protected]

20
ORCID Anjani K. Maurya: 0000-0002-9134-6693
ORCID Amin Sadeghpour: 0000-0002-0475-7858
ORCID Antonia Neels: 0000-0001-5752-2852
ORCID Giuseppino Fortunato: 0000-0002-3889-7816
ORCID René M. Rossi: 0000-0003-0946-682X
ORCID Martin Frenz: 0000-0002-6741-9434
ORCID Alex Dommann: 0000-0002-0804-1179
Funding sources
The authors are grateful to the Swiss National Foundation (Project No. 173012) for the financial support.
Acknowledgement
The authors are thankful to Dr. Felix Reifler for his support in the introduction to the Nanostar instrument.
References
1. S. Brocchini, K. James, V. Tangpasuthadol and J. Kohn, J. Biomed. Mater. Res., 1998, 42, 66-75.
2. R. Inai, M. Kotaki and S. Ramakrishna, Nanotechnology, 2005, 16, 208-213. 3. J. Doshi and D. H. Reneker, J. Electrost., 1995, 35, 151-160. 4. M. S. Khil, D. I. Cha, H. Y. Kim, I. S. Kim and N. Bhattarai, J. Biomed. Mater. Res.
Part B, 2003, 67B, 675-679. 5. E. A. T. Vargas, N. C. D. Baracho, J. de Brito and A. A. A. de Queiroz, Acta
Biomater., 2010, 6, 1069-1078. 6. R. Ramachandran, V. R. Junnuthula, G. S. Gowd, A. Ashokan, J. Thomas, R.
Peethambaran, A. Thomas, A. K. K. Unni, D. Panikar, S. V. Nair and M. Koyakutty, Sci Rep, 2017, 7, 16.
7. G. Yang, K. L. Kampstra and M. R. Abidian, Adv. Mater., 2014, 26, 4954-4960. 8. R. J. Wade and J. A. Burdick, Nano Today, 2014, 9, 722-742. 9. D. Silva, A. Natalello, B. Sanii, R. Vasita, G. Saracino, R. N. Zuckermann, S. M.
Doglia and F. Gelain, Nanoscale, 2013, 5, 704-718. 10. T. D. Stocco, N. J. Bassous, S. Q. Zhao, A. E. C. Granato, T. J. Webster and A. O.
Lobo, Nanoscale, 2018, 10, 12228-12255. 11. X. S. Shi, Z. Xu, C. B. Huang, Y. Wang and Z. F. Cui, Macromolecules, 2018, 51,
2283-2292. 12. X. B. Yan, Z. X. Tai, J. T. Chen and Q. J. Xue, Nanoscale, 2011, 3, 212-216.

21
13. A. Sanger, S. B. Kang, M. H. Jeong, M. J. Im, I. Y. Choi, C. U. Kim, H. Lee, Y. M. Kwon, J. M. Baik, H. W. Jang and K. J. Choi, Adv. Sci., 2018, 5, 8.
14. T. Kongkhlang, K. Tashiro, M. Kotaki and S. Chirachanchai, J. Am. Chem. Soc., 2008, 130, 15460-15466.
15. E. Rezabeigi, P. M. Wood-Adams and N. R. Demarquette, Macromolecules, 2018, 51, 4094-4107.
16. F. Cristofaro, M. Gigli, N. Bloise, H. L. Chen, G. Bruni, A. Munari, L. Moroni, N. Lotti and L. Visai, Nanoscale, 2018, 10, 8689-8703.
17. L. C. Lins, F. Wianny, S. Livi, C. Dehay, J. Duchet-Rumeau and J. F. Gerard, J.
Biomed. Mater. Res. Part B, 2017, 105, 2376-2393. 18. C. H. Lee, H. J. Shin, I. H. Cho, Y. M. Kang, I. A. Kim, K. D. Park and J. W. Shin,
Biomaterials, 2005, 26, 1261-1270. 19. A. Morel, S. Domaschke, V. Urundolil Kumaran, D. Alexeev, A. Sadeghpour, S. N.
Ramakrishna, S. J. Ferguson, R. M. Rossi, E. Mazza, A. E. Ehret and G. Fortunato, Acta Biomater., 2018, 81, 169-183.
20. V. Milleret, T. Hefti, H. Hall, V. Vogel and D. Eberli, Acta Biomater., 2012, 8, 4349-4356.
21. J. M. Deitzel, J. Kleinmeyer, D. Harris and N. C. B. Tan, Polymer, 2001, 42, 261-272. 22. X. H. Zong, S. F. Ran, K. S. Kim, D. F. Fang, B. S. Hsiao and B. Chu,
Biomacromolecules, 2003, 4, 416-423. 23. M. Richard-Lacroix and C. Pellerin, Macromolecules, 2013, 46, 9473-9493. 24. C. Liu, C. Zhu, J. Li, P. Zhou, M. Chen, H. Yang and B. Li, Bone Research, 2015, 3,
15012. 25. J. F. Shi and B. Xu, Nano Today, 2015, 10, 615-630. 26. A. Grinthal, S. H. Kang, A. K. Epstein, M. Aizenberg, M. Khan and J. Aizenberg,
Nano Today, 2012, 7, 35-52. 27. C. T. Lim, E. P. S. Tan and S. Y. Ng, Appl. Phys. Lett., 2008, 92, 3. 28. M. Gazzano, C. Gualandi, A. Zucchelli, T. Sui, A. M. Korsunsky, C. Reinhard and M.
L. Focarete, Polymer, 2015, 63, 154-163. 29. X. F. Wang, H. B. Zhao, L. S. Turng and Q. Li, Ind. Eng. Chem. Res., 2013, 52, 4939-
4949. 30. A. N. J. Heyn, J. Appl. Phys., 1955, 26, 1113-1120. 31. W. O. Statton, Journal of Polymer Science, 1959, 41, 143-155. 32. W. O. Statton, Journal of Polymer Science, 1962, 58, 205-&. 33. P. H. Hermans, D. Heikens and A. Weidinger, Journal of Polymer Science, 1959, 35,
145-165. 34. W. Ruland, Journal of Polymer Science Part C-Polymer Symposium, 1969, 143-&. 35. W. Ruland, Journal of Applied Crystallography, 1971, 4, 70-73. 36. W. Ruland, Colloid and Polymer Science, 1977, 255, 417-427. 37. N. S. Murthy, C. Bednarczyk, R. A. F. Moore and D. T. Grubb, J. Polym. Sci. Pt. B-
Polym. Phys., 1996, 34, 821-835. 38. N. S. Murthy and D. T. Grubb, J. Polym. Sci. Pt. B-Polym. Phys., 2002, 40, 691-705. 39. A. M. Jordan and L. T. J. Korley, Macromolecules, 2015, 48, 2614-2627. 40. X. H. Zong, S. F. Ran, D. F. Fang, B. S. Hsiao and B. Chu, Polymer, 2003, 44, 4959-
4967. 41. T. Yano, Y. Higaki, D. Tao, D. Murakami, M. Kobayashi, N. Ohta, J. Koike, M.
Horigome, H. Masunaga, H. Ogawa, Y. Ikemoto, T. Moriwaki and A. Takahara, Polymer, 2012, 53, 4702-4708.
42. S. Kogikoski, M. S. Liberato, I. M. Factori, E. R. da Silva, C. L. P. Oliveira, R. A. Ando and W. A. Alves, Journal of Physical Chemistry C, 2017, 121, 863-877.

22
43. A. G. Guex, L. Weidenbacher, K. Maniura-Weber, R. M. Rossi and G. Fortunato, Macromol. Mater. Eng., 2017, 302, 8.
44. S. U. Patel, S. U. Patel and G. G. Chase, Energy Fuels, 2013, 27, 2458-2464. 45. L. Weidenbacher, A. Abrishamkar, M. Rottmar, A. G. Guex, K. Maniura-Weber, A. J.
deMello, S. J. Ferguson, R. M. Rossi and G. Fortunato, Acta Biomater., 2017, 64, 137-147.
46. F. Ahmed, N. R. Choudhury, N. K. Dutta, S. Brito e Abreu, A. Zannettino and E. Duncan, Biomacromolecules, 2014, 15, 744-755.
47. C. A. Schneider, W. S. Rasband and K. W. Eliceiri, Nature Methods, 2012, 9, 671. 48. R. R. Sokal and N. L. Oden, Biological Journal of the Linnean Society, 1978, 10, 199-
228. 49. B. R. Pauw, M. E. Vigild, K. Mortensen, J. W. Andreasen and E. A. Klop, Journal of
Applied Crystallography, 2010, 43, 837-849. 50. W. Ruland, J. Appl. Phys., 1967, 38, 3585-&. 51. A. P. Hammersley, S. O. Svensson and A. Thompson, Nucl. Instrum. Methods Phys.
Res. Sect. A-Accel. Spectrom. Dect. Assoc. Equip., 1994, 346, 312-321. 52. B. Hammouda and D. L. Ho, J. Polym. Sci. Pt. B-Polym. Phys., 2007, 45, 2196-2200. 53. B. Hammouda, D. L. Ho and S. Kline, Macromolecules, 2004, 37, 6932-6937. 54. D.-M. Smilgies, Journal of Applied Crystallography, 2009, 42, 1030-1034. 55. R. S. Bear and O. E. A. Bolduan, Acta Crystallographica, 1950, 3, 236-241. 56. E. P. S. Tan and C. T. Lim, Nanotechnology, 2006, 17, 2649-2654. 57. S. Abbrent, J. Plestil, D. Hlavata, J. Lindgren, J. Tegenfeldt and A. Wendsjo, Polymer,
2001, 42, 1407-1416. 58. R. Hasegawa, Y. Takahashi, Y. Chatani and H. Tadokoro, Polymer Journal, 1972, 3,
600.