structural health monitoring of innovative bridges … · structural health monitoring of...
TRANSCRIPT

STRUCTURAL HEALTH MONITORING OF INNOVATIVE BRIDGES IN CANADA WITH FffiER
OPTIC SENSORS
RC.Tennyson, A.A.Mufti, S.Rizkalla, G.Tadros, and B.Benmokrane
ISIS Canada, A Network of Centres of Excellence
227 Engineering Building University of Manitoba
Winnipeg, Manitoba, Canada R3T 5V6
Short Title: Structural Health Monitoring with Fiber Optic Sensors

ABSTRACT
This paper describes the development and application of fiber optic sensors for monitoring bridges structures. Fiber Bragg gratings (FBG's) have been used to measure static and dynamic loads on bridge decks and columns, including composite repairs for rehabilitation purposes. A new long gauge concept that permits overall average strains to be measured has also been developed with gauge lengths varying from I .... 20 m. These gauges can be bonded to the concrete structure or imbedded in the composite repair patch. Six projects undertaken by ISIS Canada to incorporate fiber optic sensing to monitor the structural health of bridges in Canada are described. Data will be presented for several bridges that indicate a measure of system reliability over several years in a hostile environment. The benefits of fiber optic sensorS will be highlighted.
KEYWORDS: fiber optics, sensors, Bragg gratings, long gauges, concrete structures
PaJ{e 2 of22

1. INTRODUCTION
There are five types of commercially available fiber optic sensors. Three are based on measuring light intensity using changes in fiber curvature or reflected light from a mirrored surface. Another type is the Fabry-Perot sensor which is based on measuring the displacement between two mirrored ends of fibers fused within a glass capillary tube using a Fizeau interferometer concept. These gauges provide a linear response over a large strain range and can be made available with temperature compensation. This paper will focus on the fiber Bragg grating (FBG) which measures wavelength shift, and is immune to signal intensity fluctuations. An FBG is a region of germanium- doped glass fiber core that has been exposed to UV radiation using a "phase mask" to fabricate a periodic "grating" of material with a modulated index of refraction. This precise spacing, called the ''pitch'', reflects incident light in a narrow band centered about the "Bragg" wavelength, defined by
~= 2nA (1)
where ~ is the Bragg wavelength, n is the average effective index of refraction of the grating and A is the pitch spacing, as shown in Figure 1. The FBG also provides a linear response based on the measurement of wavelength shift (LU) due to straining of the gauge. Measuring M provides a means of determining the strain, taking into account temperature effects which will also cause a wavelength shift according to the equation,
M/Ao = (GF)£ + ~~T (2)
where M = A. - 1..0, GF = the FBG gauge factor, typically about 0.75-0.82, £ is strain, ~ is the apparent thermal strain/degree temperature change, and ~T is the temperature change relative to the temperature at installation. One can calculate ~ from the relation,
(3)
where ~o is the thermo-optic response of the FBG at fabrication (typically 10-25 J.lS per degree Celsius), CLs and ~ are the thermal expansion coefficients of the substrate and sensor, respectively. The latter is typically"'" 0.5 x 10⁻⁶/CJ. The length of fiber containing the FBG (nominally 6 mm) is subsequently fusion bonded to standard telecom fiber optic cable with appropriate optical connectors to allow easy hook-up to instrumentation. Most FBG's and associated instrumentation are manufactured at an operating Bragg wavelength of 1535-1550 nm.
Some of the major benefits of FBG sensors relate to their immunity to EMIJRF interference, they measure wavelength shift and not signal amplitude, and form a part of the data transmission optical fiber connecting the instrumentation. They are not electrically conductive and thus can be employed in hostile environments where electrical currents might pose a hazard. Long lead lengths can be employed with little signal loss (typically several kilometers), depending on the light source used such as light emitting diodes or tunable lasers (typically -3 mW power). One special advantage ofFBG sensors is that they can be serially multiplexed along a single optical fiber. For example, consider a tunable laser. Depending on its wavelength range, large numbers of FBG' s can be used to measure strainItemperature at multiple points along the structure to obtain load profiles. The number of gauges one can utilize is shown in Figure 2 as a function of "strain range" and tunable laser wavelength range. This graph also shows the combined number of thermal/strain sensors one can use on a

single fiber as well. Thennal measurements are made by not bonding the FBG to the structure, thus allowing the gauge to respond to the local temperature.
Once the number of sensors has been determined for a particular application, one must then decide on the instrumentation and means of accessing / transmitting the sensor data. Three systems are shown in Figure 3; on-site monitoring, telephone line and wireless remote communication networks.
ISIS Canada, Intelligent Sensing for Innovative Structures, is a Canadian Network of Centres of Excellence established in 1995 to research and develop innovative uses of (FRPs) in concrete structures that are prone to deterioration because of corroding steel reinforcements. As a means of documenting the behaviour of FRP, ISIS Canada also researches and develops structuraIly-integrated FOS systems that allow engineers to monitor structures from remote locations. The six projects described in this paper outline the collaborative projects undertaken by ISIS Canada to incorporate fiber optic sensing and remote monitoring in bridges built in Calgary, Alberta; Nova Scotia; Headingley, Manitoba; Sherbrooke, Quebec,; and Prince Edward IslandlNew Brunswick, Canada.
2. APPUCATION OF FIBER OPTIC SENSORS TO BRIDGE STRUCTURES
ISIS Canada, Intelligent Sensing for Innovative Structures, is a Canadian Network of Centres of Excellence established in 1995 to research and develop innovative uses of (FRPs) in concrete structures that are prone to deterioration because of corroding steel reinforcements. As a means of documenting the behaviour ofFRP, ISIS Canada also researches and develops structurally-integrated FOS systems that allow engineers to monitor structures from remote locations. The six projects described in this paper outline the collaborative projects undertaken by ISIS Canada to incorporate fiber optic sensing and remote monitoring in bridges built in Calgary, Alberta; Nova Scotia; Headingley, Manitoba; Sherbrooke, Quebec,; and Prince Edward IslandlNew Brunswick, Canada.
2.1 Beddington Trail Bridge - Alberta
This is the first bridge to be instrumented in Canada with fiber optic sensors, and the first bridge known to contain pre-stressed carbon fiber composite cables with FBG sensors embedded in the concrete girders supporting the bridge. A total of20 FBG's were installed by Electrophotonics Corp. (EPC) of Canada in 1993, with pre-testing of the composites and sensors performed at the University of Manitoba. The fiber optic instrumentation, designed by EPC, is based on a patent held by researchers who developed this technology at UTlAS. The network of FBG's is connected to a junction box which provides for on-site monitoring (Figure 4(a». To check the integrity of the carbon fiber cables and the FBG's, measurements were made (Nov 1999) and 18 of the sensors were still operative. No structural problems were detected. A typical dynamic response to a heavy truck load is shown in Figure 4(b).
2.2 SalmOD River Bridge-Nova Scotia
This bridge is noteworthy because one span was constructed in 1995 using an innovative steel-free deck consisting of polypropylene fiber reinforced concrete with no internal continuous reinforcement (1). FBG's were embedded into the fiber reinforced plastic during manufacture for use in the adjacent curb sections. Of particular interest in this application is the extensive testing done on a fuIl- scale model incorporating components that were instrumented with both FBG's and foil resistance strain gauges (2). Figure 5 presents comparisons of these two sensors. In Figure 5 (a), results are given for tension and
Pa2e 4 of 22

compression tests on steel strap elements. Figure 5(b) shows comparisons for steel strap elements incorporated into the complete deck model which was loaded to failure. In all cases, the two sensor systems correlated very well (3). Figure S(c) gives a typical bridge response for an FBG imbedded in the composite curb under live traffic conditions. From a design point of view, the test data taken in 1999 indicate that the curb has been successfully isolated from the deck bending behaviour (4).
2.3 Taylor Bridge - Manitoba
Taylor Bridge is considered to be the world's largest highway bridge reinforced by FRP and monitored using FOS. The 165.1 m-Iong bridge consists of 40 prestressed concrete AASHTO type girders. Four girders of the Taylor Bridge were prestressed by two different types of CFRP material using straight and draped tendons. The girders were also reinforced by CFRP stirrups protruded from the AASHTO type girders to act in composite action with the bridge deck. A portion of the deck slab is reinforced by CFRP reinforcement. Glass fiber reinforced polymer (GFRP) was also used to reinforce the barrier walls.
Fiber Bragg Grating (FBG) sensors were used to monitor the strains in the CFRP reinforcement of the girders and the deck slab of Taylor Bridge, as well as the GFRP reinforcement of the barrier walls. Selective girders reinforced by conventional steel reinforcement were also instrumented using FBG sensors. The FBG sensors used in the Taylor Bridge were fabricated by E-TEK ElectroPhotonics Solutions, Toronto, Canada, and had a full range of 10,000 microstrain. A total of 63 FBG sensors and two multi-Bragg sensors were glued to the reinforcing CFRP bars. The FBG sensors at were installed at different locations along the girders. FBG sensors located at the midspan were designed to monitor the maximum strain in the reinforcement due to applied loads, while FBG sensors located at the girder ends were designed to evaluate the transfer length of prestressing tendons. Due to the relatively high initial prestressing strain (-8800 micro strain) and the limited full range of the FBG sensors, most of the sensors were installed after tensioning the prestressing tendons. Some of the FBG sensors were installed before prestressing to measure the initial prestressing strains of the CFRP and steel tendons.
Twenty-two AD590 electric-based temperature sensors, also produced by E-TEK Electrophotonics Solutions, were installed for the purpose of compensation for thermal apparent strain. Temperature sensors provide representative temperature measurements among different girders and at various locations along and through the depth of the girder and the deck slab. The reading of a FBG sensor was used to estimate the temperaturecompensated strain.
A total of 26 electric strain gauges were used at locations as close as possible to some of the FBG sensors. The electric strain gauges were installed on the CFRP tendons prior to pretensioning to monitor the prestressing strain. Even though the strain gauges were properly sealed, more than 60 percent of the electric strain gauges malfunctioned due to excessive moisture resulting from steam curing of the concrete girders.
The strains were recorded using a fiber grating strain indicator (FLS3500R~. a 32-channel multiplexing unit for quasi-static strain measurements and a 24-channel multiplexing unit for temperature measurements, as schematically shown in Figure 6. The FLS3500 is a standalone unit with programmability and strain measurement from either the front panel display or the back panel analog/digital output ports.

The monitoring devices and the computer are housed in a heated enclosure mounted in the abutment of the bridge, as shown in Figure 7. The bridge is also monitored with a camera to provide video information synchronized with the optic sensors' signals as shown in Figure 8. The camera operates in Java Image Feed mode and continuously takes photographs to determine the corresponding strain reading as shown in Figure 9.
A full-featured software package, "ESPAN", has been developed by the researchers in ISIS Canada for analyzing FBG sensors' data downloaded from the Taylor Bridge computer (5). The "ESP AN" software is portable in the sense that it can run on any major platform (operating system), including Windows '98 and Unix.
The FHG sensor was able to record the strain change experienced by the CFRP tendon as shown in Figure 10. The figure clearly identifies both the truck and the trailer loading as two distinct peaks in the response curve even though the magnitude of the strains is quite small. The direction of travel can also be detected by the relative magnitudes of the peaks since the truck load is larger than the trailer load. Hence, the first event in Figure 10 represents a backward pass and the subsequent one is a forward pass over the span.
2.4 CROWCHILD TRAIL BRIDGE
The original Crowchild Trail Bridge in Calgary, Alberta, was a two-lane, three-span prestressed concrete box-girder bridge. The bridge was found to be under-strength as a result of deterioration over 20 years and increased traffic load on the bridge. Therefore, the bridge superstructure was replaced in June 1997.
The new superstructure is the first continuous span steel-free bridge deck in the world. The removal of internal steel reinforcement is made possible by providing lateral restraint to the supporting steel girders through evenly spaced transverse steel straps placed across the tops of the adjacent girders. Glass fiber reinforcements are used at the regions of interior supports and overhanging cantilevers. Prefabricated glass fiber reinforcing grid, NEFMAC, is used for the reinforcement of side barriers.
A total of 103 strain gauges, two fiber optic strain sensors, and five thennisters were used in the monitoring program.
The first tests (1997) consisted of a static truck load test, an ambient vibration test, an effect of temperature test, and dynamic measurements under passing trucks. The second tests (1998) consisted of static and dynamic truck load tests and ambient vibration test.
To monitor strain distribution in the transverse direction of the bridge deck, 17 embedded strain gauges were installed in a total of five precast blocks-three in the positive moment region and two in the negative moment region. Figure 11 shows the location of the embedded strain gauges. Eighteen gauges monitored the performance of the steel straps. Six strain gauges were used to monitor strains in end shear studs of the strap. Thirty-four strain gauges were used to monitor steel girders. The webs of all five girders were instrumented with three gauges at both positive and negative moment regions to monitor load sharing among the girders and moment distributions along the girders. Four gauges were also installed on the flanges to measure any warping of the girders. The response of one cross frame was monitored by four strain gauges. At the barriers, two strain gauges were installed on a NEFMAC and two on a stainless steel stud. Six gauges at the overhanging cantilevers and 14 gauges at the pier monitored glass fiber reinforcement.
P~6of2:!

To evaluate the use ofFOS technology, two commercially-available sensors were installed on the glass fiber reinforcement at the same section as the electrical strain gauges. The sensors were Fabry-Perot type and non-compensated for temperature. To measure deflections of the bridge under heavy traffic loads, a testing program was organized by the City of Calgary before the bridge was open to traffic. Two trucks, each loaded nominally to 355 kN, were used to produce nine different load cases (6).
Temperature profiles were recorded with the thermisters and strain measurements were taken using the strain indicator and the manual switching box. As the test took several hours, it was necessary to account for the thermal effects. The results provided preliminary information such as load sharing among the girders, location of the neutral axis, and moment distribution between mid-span and support. Similar infonnation was later obtained from the results of the dynamic measurements. Measured strains were all less than 80 iJ.& in the girders, and less than 40 J.L& in the steel straps. Concrete strains were insignificant.
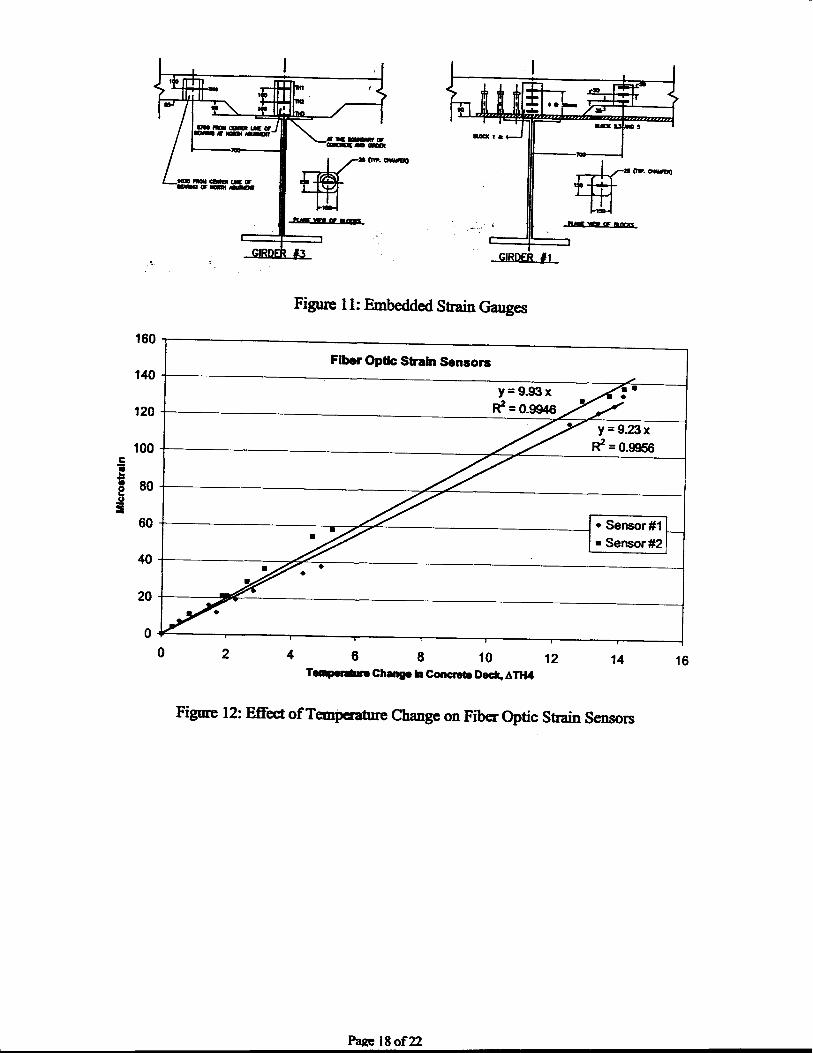
2.4.1 Thermal Effect
Temperature effects produce the most significant strains in the bridge. To evaluate the performance of the two FOS, strains caused by temperature change are plotted in Figure 12. As the sensors were not temperature-compensating gauges, they measured the total strain caused by both free expansion and restrained thermal deformation. The constraint strains for only 13°C increase in air temperature are comparable with strain measured during static test using truck load, as shown in Figure 12.
2.4.2 Dynamic Measurements Under Passing Heavy Vehicles
The response of the bridge to car traffic was insignificant. For passing trucks a 10 second window of data at a scan rate of 1000 readings per second was gathered. Infonnation such as type of truck, number of axles, and passing lane was recorded by videotape. Electronic lowpass filters in the data acquisition unit were set at 10kHz. Figure 13 shows the response of one strain gauge to a passing truck. Figure 14 illustrates the load sharing among girders based on the measured strains.
Figure 15 illustrates the vibratory and non-vibratory portion of the response of a strain gauge to the truck. The non-vibratory portion was almost identical to the response in the static test. It can be seen that the vibration of the bridge is quite small in magnitude, resulting in a dynamic amplification factor ofless than 1.15.
2.5 JOFFRE BRIDGE
The Joffre Bridge, located over the St-Franftois River in Sherbrooke, Quebec, Canada, built in 1950, showed signs of severe deterioration of the concrete deck slab and girders primarily due to reinforcement corrosion. The City of Sherbrooke and the Ministry of Transport of Quebec reconstructed a significant part of the bridge deck, sidewalk and traffic barrier using carbon and glass FRP reinforcements, and monitored the performance not only to answer the safety concerns, but also to generate valuable data for the research and development of FRP technology for reinforced concrete structures.
The selected CFRP reinforcement used to reinforce the concrete deck slab is manufactured by Autocon Composites Inc. in Ontario, Canada, and is commercially known as NEFMAC C19-R2 grid. The CFRP reinforcement was in the form of a rectangular cross-section 100x200

mm grid with a constant thickness of 19 mm. The grids were manufactured with longitudinal spacing of 200 mm and transverse spacing of 100 mm. The GFRP rebars used as reinforcement for the concrete sidewalk and traffic barrier are produced by Marshall Industries Composites Inc. and commercially known as GFRP C-BAR The light weight of the FRP reinforcements was very convenient for easy handling and placement during construction.
The bridge was extensively instrumented with several different types of gauges (7). A total of 180 critical locations were identified and instruments (fiber optic sensors, vibrating wire strain gauges, and electrical strain gauges) were installed at those locations in the concrete deck sJab and on the steel girders.
A number of CFRP reinforcement grids were integrated with fiber optic sensors during the manufacturing process, as shown in Figure 16. Gauges were installed on the steel girders and embedded strain gauges were placed inside the concrete to measure the strain inside the concrete to provide information about the hidden structural damage in the concrete deck slab.
The bridge was opened to traffic on December 5, 1997. The dynamic responses of different components of the bridge are being regularly recorded using computer-aided data logging systems. The interim results indicate confidence in the use of FRP reinforced concrete structures and the use of state-of-the-art instrumentation for continuous long-term structural performance monitoring. Figure 17 shows typical data recorded by fiber optic sensors installed on a CFRP grid reinforcement under normal traffic load. The variation of recorded strain with time and temperature clearly indicates that it is possible to obtain meaningful and consistent results from fiber optic sensors and that temperature is the most prominent factor influencing the strain variation in the bridge deck.
In November 1998, one year after the opening of the bridge to traffic, field dynamic and static tests, using calibrated heavy trucks (Figure 18), were conducted on the bridge to evaluate the stress level in the FRP reinforcement, concrete deck, and steel girders. Figure 19 shows the results of strains recorded using FOS at the middle of the web of the steel girders due to movement of the trucks. The data clearly shows that during a 35-second duration, a large strain event (e.g. a truck) followed by two similar strain events (e.g. two consecutive trucks) took place on the bridge.
2.6 Confederation Bridge - Prince Edward Island I New Brunswick
This is the longest bridge over iced-ocean water, spanning 12.9 Ian from Prince Edward Island to the New Brunswick main land. Its enormous size required the use of the most modern concrete manufacturing process (8) and a hollow core design to incorporate a very large utility corridor. Because this bridge has been designed for a 100 year lifetime and must operate in a most severe environment, extensive sensor instrumentation has been employed to monitor the loads and structural performance. Included in the suite of sensors used were FBG's bonded to steel rebars that were imbedded in concrete. A total of 15 FBG's are currently in service on both a main girder and in the adjacent drop-in span, as shown schematically in Figure 20. Four gauges were left "unbonded" to provide temperature compensation and a means to compare with bonded thermocouple data The system installation in 1996 involved engineers from various groups within ISIS Canada and EPC. A more complete description of the installation details and bridge structure can be found in Ref.9.
Pllll;e 8 of 22

3. THE LONG GAUGE FIBER OPTIC SENSOR
A new long gauge fiber optic sensor system has been developed that measures the path displacement between two points on a structure or host material. The flexible fiber optic sensor contains two mirrored ends, or two FBG's at each end that act like mirrors, connected by an optical fiber. The distance between the two ends defines the "gauge length", which at this time has been made for a range of 1-20 m. Thus it is possible to measure the overall average displacement of the structure to which this sensor is bonded, with on-site temperature compensation provided by an equivalent "unbonded" length of optical fiber mounted adjacent to the strain sensor. The instrument demodulates the light signals returning from the mirrors by the principle of low coherence interferometry. A schematic of the instrument is illustrated in Figlle 21 below. The structural change in length, 6.L, is measured by changing the internal reference optical path AR such that when the two optical paths are matched, interference occurs and a peak photodetector records the actual displacement.
The long gauge sensor has been used to monitor the integrity of composite reinforcement patches on concrete columns on a bridge in Toronto, C~ and no deterioration of the sensor or the column I patch has been detected over the past four years. In addition, this sensor has been used to measure corrosion damage in a reinforced concrete column in laboratory tests. The variation in circumferential strain as a function of time is shown in Figure 22 (Ref.10).
4. CONCLUSIONS
A total of 16 bridges have been instrumented across Canada with various combinations of fiber optic sensors, strain gauges and thermal gauges. Field experience has been gained in terms of the operational performance of fiber optic Bragg gratings over a period of six years. In all cases, very few failures of these sensors have been found when they were properly installed. The examples described in this paper were chosen for the special features associated with the bridge structure, the use of advance composite materials and fiber optic sensing. Both of these technologies are relatively new in the field of civil engineering structures. However, the emerging need to provide new design concepts taking advantage of new materials necessitates the requirement for long term monitoring. The FOS, calibrated through severa110ad tests, showed good performance as compared to the conventional electric strain gauges. When embedded in concrete members, FOS are more durable than electric strain gauges. The monitoring system can provide a profile of the bridge, with detailed information on its structural behaviour, as well as health due to applied loads and environmental effects. Fiber optic sensing with its many advantages over conventional electrical resistance strain gauges provides a unique opportunity to use modem telecommunication technologies which are developing at the same time. The availability of high bandwidth transmission makes possible the task of employing multisensor systems that can serve the long term "health" monitoring of new and rehabilitated structures from central sites, and minimize the need to do on-site inspections.
ACKNOWLEDGEMENTS
The authors are members of the Network of Centres of Excellence on Intelligent Sensing for Innovative Structures (ISIS Canada) and wish to acknowledge the support of the Networks of Centres of Excellence Program of the Government of Canada and the Natural Sciences and Engineering Research Council of Canada. The cooperation and financial support of the various provinciall municipal transport ministries were essential in providing opportunities to install these sensor systems.

LIST OF REFERENCES
1. Newhook,J.P and Mufti,A.A.,"A Reinforcing Steel-Free Concrete Bridge Deck for the Salmon River Bridge", Concrete International. 18 (6), pp.30-34 2. Doncaster,A.M., Newhook,J'p. and Mufti,A.A.,"An Evaluation of Fiber Optic Sensors", Advanced Composite Materials in Bridges and Structures. EI-Badry,M.M.,Edit., Canadian Society for Civil Engineering, Montreal, Canada, 1996, pp. 1011-1021 3. Doncaster,A.M. and Mufti,A.A., "An Evaluation of Fiber Optic Sensors for Monitoring of Civil Engineering Structures", The Nova Scotia CAD/CAM Centre, Research Report No.l-1997, Dalhousie University, 1997 4. Mufti,A.A, Newhook,J.P and Mahoney.M.M, "Salmon River Bridge Field Assessment Deck Cracking", The Nova Scotia CAD/CAM Centre. Research Report No.l-1999, Dalhousie University, 1999 5. Maalej, M., Pantazopoulou, S. J., Karasaridis, A., and Hatzinakos, D., 1998. "Intelligent Monitoring of Instrumented Infrastructure Facilities", Proceedings of the 30th
SAMPE Conference, "Materials - The Star at Center Stage", San Antonio, Texas, U.S.A. 6. Afbami, S. and Cheng, J. J. R, 1999. "Field Instrumentation and Monitoring of CrowchildTrail Bridge in Calgary, Alberta", Technical Report to the City of Calgary and SPECO Engineering Ltd. 7. Chekired, M., Masmoudi, Z., Debbache, M., and Benmokrane, B., 1999. "Concrete Deck Slab Reinforced with Carbon FRP Reinforcement", Laboratory Tests and Application to Joffre Bridge (In French), Technical Report No.2 to the Ministry of Transportation of Quebec, Contract 1220-97-BD07. 8. Tadros,G., "Design and Construction of the Northumberland Straight Crossing Fixed Link Project", Canadian Civil Engineer. 12(7), pp. 18-21 9. Mufti,A.A.,Tadros,G. and Jones,P oR, "Field Assessment of Fiber-Optic Bragg Grating Strain Sensors in the Confederation Bridge", Canadian J. Civil Engineering. 24, 1997, pp.963-966 10. Lee, C., "Accelerated Corrosion and Repair of Reinforced Concrete Columns Using
CFRP Sheets", Dept. Civil Engineering University o/Toronto. M.A.Sc. Thesis, 1998
Page 10 of 22

FIGURE CAPTIONS
Figure 1: Fiber Bragg Grating Concept
Figure 2: Number of Fiber Bragg Gratings on a Single Optical Fiber as a Function of Laser Bandwidth and Strain Range
Figure 3: Fiber Optic Sensor Monitoring Systems
Figure 4: On-Site Monitoring ofBeddington Trail Bridge (a) Accessing Fiber Optic Junction Box;(b) Dynamic FBG Response to Truck Load
Figure 5: Comparison ofFBG's and Foil Strain Gauges (a) Steel Strap in Compression (b) Steel Strap in Model Deck (c) Curb
Response to Traffic (b)
Figure 6: Schematic of Instrumentation and Office Link
Figure 7: Data Acquisition System
Figure 8: On-site Web Camera
Figure 9: Snapshot of the Screen of On-site Computer
Figure 10: Truck Passage Data
Figure 11: Embedded Strain Gauges
Figure 12: Effect of Temperature Change on Fiber Optic Strain Sensors
Figure 13: Dynamic Measurement on Gauge 3 of Girder #1 and Effects of Digital Filtration
Figure 14: Load Sharing Among Girders Based on Dynamic Strain Measurements 1997
Figure 15: Response of a Strain Gauge to the Truck in 1998 Test
Figure 16: CFRP Grid with Integrated Fabry-Perot Fiber Optic Sensors (FOS)
Figure 17: Data Recorded by Fiber Optic Sensors Installed on CFRP Grid
Figure 18: Trucks Being Positioned for Static Calibrated Load Testing
Figure 19: Strain Responses from Dynamic Load Tests of Joffre Bridge
Figure 20: Location ofFBG's on Sections of the Confederation Bridge (from EPC)
Figure 21: Schematic of Long Gauge Optical Displacement Measuring System
Figure 22: Long Gauge Measurements of Hoop Strain in Concrete Column

Broadband or Tunable Source
£] incident Ugbt
ILLUSTRATIONS
Broaclland Incident light
~ Optical Rbre Optical Rbre Core
Transmitted Ught
~----~~OOQ--~-+
Bragg Grating
Optical Spedrum Anayzer UgIrt 1 l orPhotodeCsctor .,
15 .-. E c: 14 -&: 13 -" 12 'i " 11 c • 10 CD
• 9 :E • 8 c ~ 7 = 8 a-S
5 .. • • ... • ~ 3
1 2
1
0 0
Narrowband RefIec:ted light Shifts with Applied Strain
Broadband Transmitted light with Narrowband Removed by Grating
Figure 1: Fiber Bragg Grating Concept
2 3 5
Ma StraIn :0: ~ A£12
Centre Bngg """"'Igth for.rt Gauge
/!J.. 2k-1 >.at • 1550 + T ~ -1) (nm)
1 s k S N, inIIIger
Temper-.. COIIIpIIIUdon 0 Hr ~ ... (N-Hy) ClINeS (~ s T s.we)
e 7 8 9 10 AEx 1000
(AE) Strain Range (J.LE)
Figure 2: Number of Fiber Bragg Gratings on a Single Optical Fiber as a Function of Laser Bandwidth and Strain Range
PaRe 12 of 22

'IELECOM TO REMOTE SITE
~ .... -----' .-JtI'fC't1mI
.ox
Figure 3: Fiber Optic Sensor Monitoring Systems

(a)
~r-----------------------------------------------------~
30 ------0--_---------4-1---
25°+----
c 2D ____ 0 __ - 0 __ _
1 i 15
fO+---
sr------------------+--------------
O~----------------------------------------------------~ mo 2310
(b)
2315
TIIne ••
234.0 234.5
Figure 4: On-Site Monitoring ofBeddington Trail Bridge (a) Accessing Fiber Optic Junction Box;(b) Dynamic FBG Response to Truck Load
Pa$le 14 of 22
23500

~~--------------------------+--.~
250
200
•• --200
... ... --... ... ••
600 800
s ...... (p.c)
1000
I 8 =-~
~
1200 1.coo
100
10
10
70 tID
50 40
30
20 10
0 0
(b) (a) .101 .....-________________ ----_-----1
.112
.nl
. ]'.120 c e ·124 ii
.121 , I I
·'32 t -Ill 1...: ___ ---------------------~
(c)
Figure 5: Comparison ofFBG's and Foil Strain Gauges (a) Steel Strap in Compression (b) Steel Strap in Model Deck (c) Curb Response to Traffic
24-dlannel mulipIexing uoit for temperature
Figure 6: Schematic of Instrumentation and Office Link

Figure 7: Data Acquisition System
Figure 8: On-site Web Camera
?3.l!:e 16 of:2

Jnu:..: ~~":ln:, I.k.-:. in...,:' !II ",,:;, 1"1U):., !II ~:I . ." IC:;'"- ~ , ;.IJ' • .!J.;or I
15
10
5
o
-5 o
Figure 9: Snapshot of the Screen of On-site Computer
50 100 150 time (seconds)
.... sensor location
Figure 10: Truck Passage Data
200
-- ..
eM WJr lIE egp
' .. GIRPER #3 GIRDER #1
Figure 11: Embedded Strain Gauges
160
Fiber Optic Strain Sensors 140
120
100 c
~ • 80 0 .. u i
60 +-------------------~~~~~------________________ ~.Sensor#1 • Sensor #2
40
20
0 0 2 4 6 8 10 12 14 16
T .......... Change'" Conc:reta Dedr.ATH4
Figure 12: Effect of Temperature Change on Fiber Optic Strain Sensors
~ 18 of 22

C
'! -fI)
G3 - Passing Truck F11t8r1: LowP_ 57 Hz, order 100
F11ter2: BandStop 38-42 Hz, order.-Fllter3: BandStop 1 .. 21 Hz, order 2
50 F_ 'lIo 100
In Hz ........ IM_ i 110&_ _0 jl
40 51 3 51 17 il 57 711.7 51 118
37&43 118 30 38&42 711.7 .. 0
41 7 00 _0 0 20 40 60
In Hz 3!1 5
20 "&21 711.7 20 _0
0IherW .... 10
_IO-lo*------------------1~:....--------~ ShIII_ IIIF-.g
~~------------------------------~ r_ in Seconds 10 o
Figure 13: Dynamic Measurement on Gauge 3 of Girder #1 and Effects of Digital Filtration
0,1..------:...-.-
Figure 14: lA>ad Sharing Among Girders Based on Dynamic Strain Measurements 1997

Dynamic Test Aug. 1998 (Strain Gauge, #3: Truck influence line and freauencies 10.8-10] Hz carves)
i-G3 LO.8-1O] Hz -G3 [0-0.8LHz] 100~----~--~--~--____ ~~~~~~~
" ; "I." ' ". ".""."" -" " " -" -. ". " "." " "'" "i; " :~ " i " i " j " -: - ; - - - -: - -, - - - - - -: - '- - '- - ~ - - - - - : - -: - -: - - - -: - -;- - ~ - ~ - ;. -~ - ~ -
I I I I I I I
/' : : : : : : : -: -; ----, --:/: ----- - -:- -: ---: -~ --,- -: ----t -t -t -~ -~ -~ -~-
• I I , •• I
80
- 60 1&1 :i
= 40 -ell a.. -Zl 20 '. - - - - - - - '" - .' - .' - - - - '. - '- - '-. _ L _ '- _ J. _ .J _ , I I I I I • I
, I I I I I •
0
-20
2 4 6 8 10 12 Time [Sec]
Figure 15: Response of a Strain Gauge to the Truck in 1998 Test
Figure 16: CFRP Grid with Integrated Fabry-Perot Fiber Optic Sensors (FOS)
-:0
i .-;0
" ., ;-~ i
31
'5 25
Figure 17: Data R~corded by Fiber Optic Sensors Installed on CFRP Grid
?Jge:O 0f::

Figure 18: Trucks Being Positioned for Static Calibrated Load Testing
Figure 19: Strain Responses from Dynamic Load Tests of Joffre Bridge
Sensor Location
InstnBnented Span Box Girder Cross-Section
Figure 20: Location of FBG' s on Sections of the Confederation Bridge (from EPC)

1/ }[-iL±
. 0 __ AL
Broad BandwIdth Bragg Gratings or Mlnurs
"~Otrnp "PIIokldelech
kUdorConnllkll
I~~' &.=M.,rAls
Figure 21: Schematic of Long Gauge Optical Displacement Measuring System
- 0.5 b -- 0.4 -i 0.3
iii 0.2
1! 0.1 e ~ 0 __ Cobnn4 ::2 -0.1 ~CoUm5 e u -0.2
0 20 40 80 80 100 120 140
nme(days)
Figure 22: Long Gauge Measurements of Hoop Strain in Concrete Column
Paj!C 22 of 22