strong full year performance 2018 financial highlights - greggs... · greggs is the leading bakery...
TRANSCRIPT

1
07 March 2019
PRELIMINARY RESULTS FOR THE 52 WEEKS ENDED 29 DECEMBER 2018
Greggs is the leading bakery food-on-the-go retailer in the UK,
with over 1,950 retail outlets throughout the country
STRONG FULL YEAR PERFORMANCE
2018 Financial highlights
• Total sales up 7.2% to £1,029.3m (2017: £960.0m)
• Company-managed shop like-for-like sales* up 2.9% (2017: 3.7%)
• Operating profit excluding property profits** and exceptional items*** up 9.1% to £89.1m (2017: £81.7m)
• Pre-tax profit excluding exceptional items*** £89.8m (2017: £81.8m)
• Pre-tax profit £82.6m (2016: £71.9m)
• Strong cash generation supporting investment programme and shareholder returns
• Total ordinary dividend per share up 10.5% to 35.7p (2017: 32.3p)
• Currently expect to declare special dividend with interim results
* like-for-like sales in company-managed shops (excluding franchises) with a calendar year’s trading history
** freehold property disposal gains of £0.7m in 2018 (2017: £0.5m)
*** exceptional pre-tax charge of £7.2m in 2018 (2017: £9.9m charge)
Strategic progress
• Shop estate and product offer transformed over the last five years
• Further developments in growth categories such as healthier options, hot drinks,
breakfast and hot food
• Brand reputation growing, driving reappraisal
• 149 new shops opened, 50 closures (99 net openings); 1,953 shops trading at 29
December 2018
• Good progress investing in consolidated manufacturing operations, building
logistics capacity to support around 2,500 shops
Current trading
• Very strong start to the year
• Company-managed shop like-for-like sales up by 9.6% in the seven weeks to 16
February 2019
• Exceptional sales performance helped in part by publicity surrounding launch of the vegan-friendly sausage roll

2
“2018 was a year that tested the resilience of Greggs’ business model and demonstrated the benefits of our strategic investment programme. The first half was significantly impacted by extreme weather but once this returned to normal our underlying strengths helped us recover the lost ground and deliver results for the year that exceeded our expectations. “Whilst there are significant uncertainties in the months ahead, Greggs has started 2019 in great form, helped in part by the publicity surrounding the launch of our vegan-friendly sausage roll. We hope to continue benefiting from this strong momentum during the first half of 2019 before facing stronger comparatives later in the year. We have a strong financial position which we plan to use to invest in Greggs’ potential for further growth, whilst also delivering good returns for shareholders.”
- Roger Whiteside OBE, Chief Executive
ENQUIRIES: Greggs plc Roger Whiteside, Chief Executive Richard Hutton, Finance Director Tel: 0191 281 7721
Hudson Sandler Wendy Baker / Hattie O’Reilly Tel: 020 7796 4133
An audio webcast of the analysts’ presentation will be available to download later today at http://corporate.greggs.co.uk/

3
Chairman’s statement
In 2018 Greggs once again demonstrated its resilience and capacity for growth, delivering record profits in a challenging retail environment, heavily impacted by extreme weather conditions. Alongside the robust trading performance, we continued to invest in our internal supply chain and systems, laying a strong foundation for further growth and efficiency. I am proud that Greggs carries out its business in a responsible manner, aiming to deliver sustainable long-term growth for the benefit of all stakeholders. Overview Over the year as a whole Greggs performed robustly in 2018. Sales were well ahead of last year, profit was above our expectations and the Company ended the year with a healthy cash balance. This was achieved in a very uncertain economic environment with significant cost pressures and challenging trading conditions, whilst managing a major reorganisation and change programme in the internal supply chain. Trading conditions in the first half of the year were negatively affected by extremes of weather. In the second half our performance picked up and we ended the year very strongly. Our people and values The Board recognises that 2018 was a year of significant change for many of Greggs' employees. We oversaw and engaged regularly with the exhaustive planning that went into the reorganisation of our manufacturing operations, designed to improve competitiveness and support further growth in the number of shops. We tested the approach taken by management against our values and were pleased that the changes are being made without a need for compulsory redundancies. Significant progress was also made on the multi-year project to enhance the systems that support our growing business. I would like to record my personal admiration and the thanks of the Board to our 23,000 colleagues who have coped with the many changes over the course of the year and delivered another great outcome for the Company and its shareholders. Greggs prides itself on conducting its business in a responsible manner and the Board supports and challenges its agenda in this respect. We continued to support the work of the Greggs Foundation, which celebrated the opening of its 500th primary school Breakfast Club in 2018, and we are building on our environmental management programme with a target to reduce the use of single-use plastic across our operations in the year ahead. Greggs’ success depends on its ability to attract and engage a talented and diverse workforce that understands the needs of its customers. The Board sets a strong example on gender balance and has encouraged the business in its journey to create a more inclusive workplace. Our Chief Executive Roger Whiteside has shown great personal leadership in this regard and I was delighted that this was recognised in The New Year Honours list, with Roger being awarded the Order of the British Empire for services to Women and Equality. The Board Greggs has enjoyed a period of stability on the Board and this has been helpful in ensuring continuity and consistency. We are, nevertheless, planning succession for Board Directors and have embarked on the recruitment of an Audit Committee Chair to succeed Allison Kirkby who will not be offering herself for re-election at the AGM, following her appointment to the Board of BT Group. Allison has proved to be a warm and enthusiastic colleague over her six years on the Board, and has displayed passion and professionalism in equal measure. We thank Allison for her contribution and wish her well in her future career.

4
In 2018 we continued to spend a significant amount of time overseeing the major investments being made in our internal supply chain and the associated change management programme. It was appropriate therefore that the Board held one of its meetings at our Leeds bakery, affording an opportunity for us to see for ourselves the investments being made to create a centre of excellence for small cakes, and also to review our retail operations in the Leeds area. Both visits allowed the Directors to hear directly from staff involved in the programme of organisational change that supports our growth plans. Outside of such formal arrangements, Directors continue to visit different areas of the business and experience it through the eyes of our colleagues, customers and other stakeholders. This helps to ensure that Non-Executive Directors’ contributions to Board discussions are well informed, supporting open and constructive dialogue with the management team. Risk management continues to be an important area of focus for the Board, particularly in light of heightened awareness of the risks around allergens, the Company’s ongoing change programme and the uncertainties surrounding the UK’s exit from the European Union. We also spent time during the year understanding management’s approach to ensuring that the culture within Greggs remains one that manages risks well as the business grows further. Further details of the Board’s work are included in the Governance and Committee sections of the Annual Report. Dividend Our progressive dividend policy targets an ordinary dividend that is two times covered by earnings, with further surplus cash being returned to shareholders as appropriate. Our Finance Director, Richard Hutton, outlines the expected application of the distribution policy in more detail in the financial review. We currently expect to be in a position to declare a special dividend at the time of our interim results in July. In line with its progressive ordinary dividend policy, the Board intends to recommend at the Annual General Meeting a final dividend of 25.0 pence per share (2017: 22.0 pence), giving a total ordinary dividend for the year of 35.7 pence (2017: 32.3 pence), an increase of 10.5 per cent. Looking ahead It is hard to report on the performance of Greggs without reference to the vegan sausage roll, launched in early 2019 to an enthusiastic reception from our customers. The extraordinary level of social and general media coverage that followed has attracted additional visits to our shops, offering a great opportunity to showcase the many improvements that have been made to our shops and product offering in recent years. At a time of unprecedented political and economic uncertainty for the food industry and for the UK, Greggs continues to demonstrate its resilience. Whilst we cannot be immune to the impact that this uncertainty may have on the economy as a whole, we are in a strong financial position and are investing for further growth and increased competitiveness in the years ahead. Ian Durant Chairman 7 March 2019
5
Chief Executive’s report 2018 was a year that tested the resilience of Greggs’ business model and demonstrated the benefits of our strategic investment programme. The first half was significantly impacted by extreme weather but our multi-year investment in food-on-the-go products, customer experience and new shop locations allowed us to maintain positive sales growth in relatively difficult market conditions. Once weather conditions returned to normal these underlying strengths were revealed in a strong second-half performance that saw us recover all of the lost ground and deliver results for the year that exceeded our expectations. At the same time, we continued to make good progress with the remaining elements of our business transformation programme, including the significant supply chain investment that will deliver increased efficiency and capacity for further growth in shop numbers. Financial performance Total sales grew 7.2 per cent to £1,029.3 million in 2018, the first time in its history that the business has generated turnover of more than a billion pounds in a year. Within this, company-managed shop like-for-like sales (defined in Note 9) grew by 2.9 per cent. Underlying operating profit, excluding property profits and exceptional items, grew by 9.1 per cent to £89.1 million (2018: £81.7 million). Pre-tax profit (including exceptional items) grew by 14.8 per cent to £82.6 million. Market background Economic conditions remained challenging in 2018. Although inflationary pressures on consumers eased and they saw a return to growth in disposable incomes, confidence levels were low due to continued uncertainty regarding the economic outlook. The general retail sector saw continued declines in high street footfall as traditional business models struggled to adapt to the new dynamics in customer behaviour, whilst dealing with continued rising costs, particularly relating to labour. The weather had a significant impact on trading in 2018. After a good start to the year the severe wintry conditions in early March hit sales badly and a more subdued trading period followed. In June and July the prolonged heatwave also affected sales, with strong demand for cold drinks, but less for bakery items. As soon as temperatures reverted to the seasonal norm, we saw a pick-up in sales growth, and this strengthened further through the fourth quarter. In contrast to the general retail environment, the food-on-the-go sector overall continues to grow, though it remains highly competitive. We have worked hard over the last five years to redevelop our shop estate in order to be less dependent on shopping locations, and to refocus our product range on growth categories and extended day-parts which have been key to our success. These strategic initiatives have been underpinned by fast and friendly service, further driving genuine consumer affection for the Greggs brand. Delivering our strategy Greggs draws on its heritage in fresh bakery to compete successfully in the food-on-the-go market. Our purpose is to make good, freshly prepared food accessible to everyone with the aim of becoming the customers’ favourite for food-on-the-go. We are also committed to conducting our business in a responsible manner and, in doing so, having a positive impact on people’s lives.

6
In the five years since we launched our strategic plan to focus on the growing food-on-the-go market we have radically reshaped the business making it better balanced and more efficient whilst focusing it on those areas that will provide a platform for continued long-term growth in a rapidly changing retail environment. We are now a significant way through our transformation programme, which is on plan and scheduled to complete in 2021. This has required a significant level of capital investment and business change, but we have already seen resulting benefits and these investments are positioning the business to succeed over the long term. When the programme has completed, we will have the capacity to grow the estate to around 2,500 shops, as well as having a materially more efficient and flexible platform and infrastructure. Our strategy has four pillars: 1. Great-tasting freshly prepared food Greggs products are differentiated by the way that we freshly prepare food each day in our shops and by offering outstanding value for good quality, great tasting food-on-the-go. Making good, freshly prepared food accessible to everyone is embedded in our core purpose as a brand. Our outstanding value meal deals set us apart from the competition and have increased in popularity as awareness of them grows. Over the years we have developed a market-leading reputation in long-established traditional bakery categories adapted to food-on-the-go. Whilst these products remain best sellers, we continue to build a reputation in new areas that create more reasons to visit Greggs, meeting food-on-the-go needs at all times of the day. Breakfast Breakfast-on-the-go continues to grow strongly and remains the fastest-growing part of our trading day. We now offer a wide range of breakfast menu options to cater for regular customers seeking variety each day, and awareness is growing as we add lines such as fruit and yoghurt to our breakfast meal deal. New products such as fresh porridge and breakfast boxes are also showing good potential as they become available in more shops. Hot Drinks Led by coffee at breakfast, our reputation for quality, value and service in this growth category continues to build. We are focused on offering the best-selling coffee choices in the market at outstanding value, often combined with food purchases. We have been successful in adding new flavours to coffee and in offering a reusable cup to help reduce levels of packaging waste. Dietary choices Growing consumer interest in food choices and its impact on health and the environment is driving increased demand for dietary options in food-on-the-go. Greggs has a key role to play in encouraging healthier food choices. Our range of options for customers is widening - adding gluten-free and vegan-friendly products alongside those in our Balanced Choice range that offers fewer than 400 calories and good nutritionals. Notable successes include our range of gluten-free soups, award-winning vegan-friendly Mexican bean wrap and, in early 2019, the launch of our vegan-friendly sausage roll. We have adopted a proactive approach, working closely with Public Health England, to reduce salt, fat and sugar in our products and to encourage greater consumption of vegetables as part

7
of a balanced diet. We remain one of the few food-on-the-go retailers to publish full calorie and nutritional information on all of the products we sell to help customers make informed choices. Hot food Hot food is also a key area of development for us, with increasing demand for quick meal solutions later in the day when demand for sweet bakery items and cold sandwiches has passed its peak. Hot sandwiches are available in all shops and we are now beginning the roll-out of hot self-serve cabinets, making successful new product ranges available across the country. These include fresh porridge, soups, potato wedges and chicken goujons. 2. Best customer experience Fast and friendly service is a key reason why customers choose Greggs. Great service is not an easy thing to deliver under pressure and our shop teams do an amazing job. This year we have supported them with training to deliver “The Greggs Way”, our best practice programme that aims to release more time to serve customers by simplifying processes and increasing productivity. Our investment in systems capability has also improved product availability through better ordering and ranging. The use of technology to improve the customer experience is developing rapidly and we have begun trials to determine the best way forward for Greggs in new areas including ‘click and collect’ and home delivery. Early results have been promising and we intend further development and roll out in the year ahead. Our marketing is beginning to play a more significant role as we target infrequent and non-users who have yet to recognise how much Greggs has changed in recent years. We have invested to strengthen our marketing capability, which has seen an improvement in all areas, beginning with customer insight and through to product packaging, shop point of sale and brand communication. Social media channels are playing a key role in our strategy to drive brand awareness, with the recent campaign launching our vegan-friendly sausage roll showing the scale of impact that can be achieved. This launch built on a series of campaigns, building advertising awareness through 2018 and prompting reappraisal of the brand and increased frequency of visits. Combined with insight from our Greggs Rewards scheme, we have been able to assess the extent of new customer acquisition and repeat purchase patterns, informing our future plans for ranging and fulfilment. In the year ahead we plan to invest further in Greggs Rewards to broaden its user base, measure customer satisfaction and help us better understand and meet customer needs. Our shops Our shop estate has been transformed in recent years to create an attractive food-on-the-go experience with relevant products, extended trading hours and seating, and a wide variety of location types offering convenient access wherever our customers are. Convenience is the key consideration when customers choose where to shop for food-on-the-go. Being within easy reach for customers when they need us is a prerequisite and we are working hard to increase shop numbers in order to provide good access. In 2018 we opened 149 new shops (including 62 franchise units) and closed 50, growing the estate to 1,953 shops trading as at 29 December 2018. We now have 262 franchised shops, predominantly in travel locations, and we extended our company-managed estate into a number of high-profile transport hubs in the year. These included Birmingham New Street station, Glasgow Buchanan bus terminal and East Midlands
8
airport. In London we opened in Westminster underground, Cannon Street and London Bridge stations, the latter of which has quickly become one of our busiest shops. Refurbishment of our shops continued at a relatively modest level in 2018 thanks to the substantial investments made over the last five years to transform legacy bakery shops to our food-on-the-go format. We completed 89 refurbishments and franchise partners refurbished a further 11 units. In the year ahead we expect to refurbish around 60 shops, and this will then step back up to a level of around 200 per year three years from now. We have a strong pipeline of new shop openings for 2019 and expect to add at least 100 net new shops in the year, including around 50 with franchise partners. We will continue to focus on increasing our presence in travel, leisure and work-centred catchments. At the end of 2018, 37 per cent of our shop estate was located in these catchment types and we expect this proportion will continue to rise as we work towards our target of at least 2,500 shops. 3. Competitive supply chain 2018 was a year of significant progress in our major investment programme to support shop growth by increasing logistics capacity and consolidating our manufacturing operations. Once complete, in 2021, this new supply chain platform will provide capacity for around 2,500 shops and deliver improvements to product quality and competitiveness. The significant elements of this programme delivered in 2018 were:
• Consolidation of doughnut base manufacturing at our Gosforth Park bakery in Newcastle upon Tyne.
• Transfer of pizza production to our Manchester site, and successful commissioning of a new roll plant there.
• Closure of our bakery and distribution operations in Norwich.
• Creation of a national facility for the production of fresh cream products at our Leeds bakery.
In the year ahead we aim to complete the programme to consolidate manufacturing into our centres of excellence and have also commenced work to build our new southern distribution centre at Amesbury in Wiltshire. This is expected to complete at the end of 2019 and will provide additional support for our growth plans from 2020 onwards. The final stage of the investment plan, expected to commence in 2020, will be the conversion of our Birmingham site to become a dedicated distribution centre. A further opportunity to increase efficiency in our logistics network has also been identified. This two-year project will result in us building an automated frozen distribution facility at our Balliol distribution centre in order to reduce our reliance on third-party providers. Once again, I must pay tribute to the commitment of our supply chain team who have managed such significant change whilst maintaining a high standard of service as we continue to grow shop numbers. It has not been easy but we are building a supply network that we can be proud of, and which will enable the Greggs business to improve product quality and increase capacity to reach customers in more parts of the UK. 4. First class support teams Our investment programme to modernise our processes and IT systems is now well advanced. In 2018 we enhanced processes for managing product ranging and pricing as well as implementing the human resource and estate management modules of our integrated SAP solution.
9
Preparations are now well advanced for the replacement of our payroll system in the first half of 2019; this will leave the integration of our logistics and manufacturing sites as the final element of the programme, which should complete in 2021. With the end of our multi-year SAP deployment programme in sight, our IT team is now turning its attention to the exciting opportunities that lie ahead as we develop our digital capabilities to build new services and a seamless customer experience across all channels. Having a positive impact on people’s lives Greggs has a long-standing tradition and reputation as a socially responsible business and as such we want our actions to have a positive impact on people’s lives. Customers are increasingly aware of the impact of economic activity on society and the environment and are becoming more demanding when making consumption choices. We at Greggs recognise that we must play our part and show leadership in areas that really matter to our customers. We encourage healthier food-on-the-go choices Customers are becoming increasingly aware of the impact of diet on their health and wellbeing and we aim to help customers make good well-informed choices when consuming food-on-the-go. We provide calorie and nutritional information for all of our products either on shelf or through our website and mobile application, and are proud supporters of Public Health England’s ‘One You’ campaign. We aim to provide our customers with convenient access to healthier choices in food, with ranges such as our Balanced Choice products offering options with fewer than 400 calories. We also offer a number of gluten-free products and, more recently, vegan-friendly options. Our Mexican Bean wrap was named ‘Best Vegan Sandwich’ at the PETA Vegan Food Awards 2018. Reducing sugar is also a key objective - we are fully engaged with Public Health England and are on track to achieve a 20 per cent reduction across all our products by 2020. Our carbonated drinks have almost all been reformulated to reduce sugar and we are making good progress in sweet bakery, which is the next largest category to be targeted. Whilst traditional bakery products remain popular, we are seeing good growth in a wide range of products offering healthier choices as customers seek out fewer calories, less sugar and vegetable fillings. As a result of our ‘Pledge for Veg’, made in partnership with the Food Foundation, we helped our customers to consume over one million extra portions of veg in 2018. The Greggs Foundation is proud to be ‘Tackling Health’ through the implementation of a national programme in primary schools. The initiative, in partnership with Premiership Rugby, will encourage 30,000 children from across the country (many of whom attend one of the Greggs Foundation’s Breakfast Clubs) to make healthier food choices and to get active through playing tag rugby by the end of 2020. We care where our products come from Customers are showing growing interest in the supply chain impact of their buying choices. All the tea, coffee, hot chocolate, orange juice, apple juice and bananas we sell are certified Fairtrade – the premium paid for our coffee over the last 13 years has enabled farmers to invest over £2.5 million into their farms and communities. We source our ingredients from sustainable sources and maintained a ‘Tier 2’ standing in the Business Benchmark on Farm Animal Welfare for the third year running. In our internal supply chain the majority of our manufacturing sites have achieved AA standard on version seven of the BRC Global standard for food safety.
10
In 2018 Greggs became the first high-street company to invest in Shared Interest - a social lender that has over 11,500 UK members with a collective investment of £40 million in share capital. This money is pooled in order to offer loans and credit facilities to Fairtrade producers who struggle to find finance elsewhere. We share our success with the community around us Greggs is a national brand with a local culture. Our teams take enormous pride in their connection with, and support for, the local communities in which we operate. Every day we distribute unsold fresh food to local charities and collect change in our shops for the Greggs Foundation, which has been established for over 30 years. Each year we donate at least one per cent of profits to the Greggs Foundation and this, along with support from our staff and partners, has enabled the charity to invest £2.8 million in 2018 in a wide range of initiatives that improve the quality of life in our local communities. These included the award-winning Greggs Breakfast Club programme which, with support from 89 partners, now provides over six million free wholesome breakfasts each year to children in over 500 primary schools. We also fundraise for a number of other charities which our people and customers feel passionate about, including BBC Children in Need, the Poppy Appeal and the Disasters Emergency Committee (DEC). We are also proud supporters of the North of England Children’s Cancer Research charity and are the main sponsor of its annual Children’s Cancer Run. To date, the run has raised over £30 million to fund research into improving recovery rates. We aim to use energy efficiently and minimise waste The ‘Blue Planet effect’ has driven customer awareness of the environmental impact of their consumption choices to a whole new level. We are proud to support national environmental initiatives including Surfers Against Sewage’s Autumn Beach and River Clean series (for the third year running) and are committed to doing our bit to protect the health of the planet. Plastic has become a key focus and we have responded by testing replacements for single-use plastics in our shops. Following successful trials these will be rolled out across our entire estate during 2019. Once complete this will remove over 300 tonnes of plastic from our supply chain each year. Coffee cups remain a target for further reduction and improved recycling. Our reusable cup, which offers customers a 20 pence discount on any hot drink, is increasingly popular and we are working with industry peers to develop sector-wide improvements in the way we manage coffee cup usage and disposal. We hold the Carbon Trust Standard in recognition of our work on carbon efficiencies and our Environmental Management System is certificated to ISO 14001. We continue to trial technologies that could help to reduce our carbon footprint even further in the years ahead. We are committed to creating a great place to work Deeply embedded in the Greggs culture, and a fundamental source of our enduring success as a brand, is the way our colleagues feel about working for Greggs. We have worked hard to preserve their loyalty and affection whilst making transformational changes to our business model in recent years. Our Employee Opinion Survey provides us with the best insight to understand employee sentiment and remains at sector-leading levels. Our engagement score for 2018 increased once more to 82 per cent. We aim to make Greggs an even better place to work and are challenging ourselves against the criteria of the National Equality Standard. We are committed to supporting the development of all our colleagues, notably our talented female colleagues, and in 2018

11
reported a gender pay gap of 18 per cent (2017: 22 per cent). We have made good progress with this in recent years and are currently ranked 10th in the FTSE 250 ranking for women on boards and in leadership. We share ten per cent of our profits with employees and will be sharing a record £10.0 million with our people as a result of our performance in 2018. Further details of all of our actions in these areas will be described in the Annual Report. Outlook for 2019 There are significant uncertainties in the months ahead, not least as the UK negotiates its exit terms from the European Union and the potential impact that a disorderly exit might have on supply chains, tariffs, exchange rates and consumer demand. However, Greggs has started 2019 in great form, with company-managed shop like-for-like sales in the seven weeks to 16 February 2019 up 9.6 per cent, and total sales up 14.1 per cent. We have enjoyed strong sales growth, particularly in January, helped in part by the publicity surrounding the launch of our vegan-friendly sausage roll. We hope to continue benefiting from this strong momentum during the first half of 2019 before facing stronger comparatives later in the year. 2019 will be another significant year for investment in our supply chain as we create the capacity and platforms for further growth. We have a strong financial position which we plan to use to invest in Greggs’ potential for further growth, whilst also delivering good returns for shareholders.
Roger Whiteside OBE Chief Executive
7 March 2019

12
Financial review In 2018 we delivered a record financial performance, taking more than one billion pounds in sales for the first time in the company’s history and recovering from a very challenging first half to deliver an increase in profit and margin for the year as a whole. Cash generation was strong, setting us up well to finance our growth-oriented investment programme, while at the same time improving shareholder returns. 2018
£m 2017
£m Revenue 1,029.3 960.0 Operating profit (excluding exceptional items and property profits)
89.1 81.7
Property profits 0.7 0.5
Operating profit (excluding exceptional items) 89.8 82.2 Operating margin (excluding exceptional items) 8.7% 8.6% Finance expense (0.0) (0.4)
Profit before taxation (excluding exceptional items) 89.8 81.8 Exceptional items (7.2) (9.9)
Profit before taxation 82.6 71.9
Sales Total Group sales for the 52 weeks ended 29 December 2018 were £1,029.3 million (2017: £960.0 million), an increase of 7.2 per cent. Sales in company-managed shops with more than one calendar year’s trading history (‘like-for-like’) grew by 2.9 per cent to £876.3 million (2017: £851.7 million). Profit Operating profit before exceptional items was £89.8 million (2017: £82.2 million). This included a £0.7 million contribution from property disposals (2017: £0.5 million). Excluding the impact of property profits from both years, the underlying growth in operating profit was 9.1 per cent. Pre-tax profit before exceptional items was £89.8 million (2017: £81.8 million). Including exceptional items, pre-tax profit was £82.6 million (2017: £71.9 million). Exceptional items Our major investment programme, designed to reshape our internal supply chain for future growth, commenced in 2016. We continue to expect the total exceptional cash costs of this change programme, excluding any associated property disposal gains, to be in the region of £25.0 million, with a further £5.0 million charge in respect of non-cash costs (accelerated depreciation and asset write-offs). Total charges so far amount to £22.8 million and we expect a further £4.3 million in 2019. Activity in 2018 included the consolidation of doughnut base manufacturing at our Gosforth Park bakery in Newcastle upon Tyne, the transfer of pizza and roll production to our Manchester site and the creation of a national facility for the production of fresh cream products at our Leeds bakery. At the end of 2018 we also closed our bakery and distribution

13
operations in Norwich. The total exceptional charge in relation to this programme was £5.9 million in 2018 (2017: £10.1 million). An exceptional pension cost arose in the year as a result of the High Court ruling in the case of Lloyds Bank in relation to Guaranteed Minimum Pension (“GMP”) equalisation. Whilst this may still be subject to appeal, we have made a provision of £1.7 million for the expected one-off impact of GMP equalisation on the reported liabilities of the Company’s defined benefit pension scheme. After adjustments made for the reversal of prior year exceptional costs the total exceptional charge for the year was £7.2 million (2017: £9.9 million), comprised as follows: 2018 2017 £m £m Supply chain restructuring:
- redundancy costs (release)/provision (0.2) 7.4 - transfer of operations 4.9 1.3 - property-related 0.5 0.5
Cash costs of supply chain restructuring 5.2 9.2
- depreciation and asset write-offs 0.7 1.3 - property disposal gains - (0.4)
Net supply chain restructuring charge 5.9 10.1 GMP equalisation past service costs 1.7 -
Release of prior years’ exceptional items: - property-related (0.4) (0.2)
Total exceptional items 7.2 9.9
There were no exceptional property gains in the year in respect of the supply chain restructuring programme. Our vacant Twickenham site is under contract for sale subject to certain conditions. Should this progress to completion then any resultant profit will be treated as an exceptional gain. We continue to expect the total proceeds arising from supply chain site disposals to be in line with those anticipated in our investment plan. In 2018 the total cash impact of exceptional items was a net outflow of £9.0 million (2017: £1.9 million cash outflow). We expect the 2019 cash outflow in respect of exceptional items to be c.£7.0 million. Operating margin Operating margin before finance expenses and exceptional items was 8.7 per cent (2017: 8.6 per cent). Including exceptional items, the operating margin was 8.0 per cent (2017: 7.5 per cent). Gross margin before exceptional items was stable year-on-year at 63.7 per cent (2017: 63.7 per cent). Food input costs proved less inflationary than was the case in 2017, and the rate of inflation reduced as the year went on. Including exceptional items, gross margin was 63.1 per cent (2017: 62.7 per cent). In 2018 we continued to drive actions to make the business simpler and more efficient, and in doing so partially mitigated the impact of cost inflation on the business. In 2018 we delivered savings of £7.4 million (2017: £9.7 million) through procurement initiatives, benefits from our

14
investment in modernised IT systems and as a result of improvements across our retail and supply chain operations. Employment cost inflation continued to be a headwind and this will be the case again in 2019, with increases to the National Living Wage as well as higher pension contributions. Financing charges There was a net financing expense of £0.0 million in the year (2017: £0.4 million) reflecting the funding position of the defined benefit pension scheme, offset by interest received and exchange gains. In the year ahead we expect to incur a financing expense of around £0.2 million relating to the net liability of the pension scheme at the start of the year. Financing charges will also be affected by the adoption of IFRS16 (see below). Taxation The Company has a simple corporate structure, carries out its business entirely in the UK and all taxes are paid there. We aim to act with integrity and transparency in respect of our taxation obligations. Excluding the effect of exceptional items, the Group’s underlying effective tax rate was 20.2 per cent (2017: 20.7 per cent). The overall tax rate for the year including exceptional items was 20.4 per cent (2017: 20.9 per cent). The year-on-year reduction in the effective rate primarily reflected reductions in the headline rate of corporation tax and settlement of prior year tax computations. We expect the effective rate for 2019 to be around 20.75 per cent and that the effective rate going forward will be almost two per cent above the headline corporation tax rate. This is principally because of disallowed expenditure such as depreciation on non-tax-deductible qualifying properties and costs of acquisition of new shops. Earnings per share Diluted earnings per share before exceptional items were 70.3 pence (2017: 63.5 pence), an increase of 10.7 per cent. Basic earnings per share before exceptional items were 71.1 pence (2017: 64.5 pence). Including exceptional items diluted earnings per share were 64.5 pence (2017: 55.7 pence) and basic earnings per share were 65.2 pence (2017: 56.6 pence). Dividend The Board recommends a final ordinary dividend of 25.0 pence per share (2017: 22.0 pence). Together with the interim dividend of 10.7 pence (2017: 10.3 pence) paid in October 2018, this makes a total ordinary dividend for the year of 35.7 pence (2017: 32.3 pence), an increase of 10.5 per cent. This is covered two times by diluted earnings per share before exceptional items in line with our progressive dividend policy. Our policy on special distributions is outlined below under ‘Cash flow and capital structure’. Subject to the approval of shareholders at the Annual General Meeting, the final dividend will be paid on 30 May 2019 to shareholders on the register on 26 April 2019.

15
Balance sheet Capital expenditure We invested a total of £73.0 million (2017: £70.4 million) in capital expenditure during 2018. The total included £33.1 million for development and maintenance of our retail estate and £7.0 million in respect of development and maintenance of our IT infrastructure. Investment in our supply chain totalled £32.9 million as we commissioned new production lines to consolidate our previously decentralised regional bakery operations, and expanded our distribution capability to facilitate further growth in shop numbers. Depreciation and amortisation in the year was £55.9 million (2017: £53.5 million). The investment in our supply chain will continue throughout 2019, when we will complete the consolidation of manufacturing whilst building our new distribution facility at Amesbury in Wiltshire. We will also continue to expand our shop estate, investing in between 80 and 90 new company-managed shops alongside further openings with franchise partners. Overall, we plan capital expenditure of around £90 million in 2019. The investment programme in our supply chain is expected to complete in mid-2021 and we intend to continue to grow shop numbers at a rate of c.100 net shops per year, likely to be evenly split between company-managed and franchised operations. The requirement for capital expenditure to refurbish our shops will increase in the coming years, as we come out of the current lull in the refurbishment cycle; at the same time the expenditure on our supply chain will be reducing. Overall, we expect the medium-term capital expenditure requirement to be in the range £80-90 million per annum. Working capital Group net current liabilities decreased to £4.5 million at the end of 2018 (2017: £21.4 million). We held a relatively high cash balance at the end of 2018 as a result of delays in the phasing of capital expenditure, and a higher than normal trade creditor position as we changed energy supplier. Inventory levels rose by £2.1 million and receivables fell by £1.8 million in the year. With the current uncertainties over the UK’s exit from the European Union we have taken the precaution, where possible, of building additional stocks of key ingredients and equipment that could be affected by disruption to the flow of goods into the UK. An additional £2.7m of working capital has been committed in this way in early 2019 and additional operating expenditure of £0.25 million is expected in 2019 as a result of our actions. Pension scheme liability The net liability shown on the balance sheet for the Company’s closed defined benefit pension scheme increased to £8.4 million (2017: £7.5 million). As noted above, provision has been made for the expected one-off impact of GMP equalisation on past service costs. In 2018 the assets of the scheme lost value due to market conditions but this fall was broadly offset by actuarial assumptions, particularly a strengthening of the discount rate used to value the scheme’s liabilities. The scheme will next undergo a full actuarial revaluation in 2020. Return on capital We manage return on capital against predetermined targets and monitor performance through our Investment Board, where all capital expenditure is subject to rigorous appraisal

16
before and after it is made. For investments in new shops we target an average cash return on invested capital of 25 per cent, with a hurdle rate of 22.5 per cent, over an average investment cycle of eight years. Other investments are appraised using discounted cash flow analysis. The performance of new shops opened in 2018 was good, with average sales above the level expected at the time of investment. New shops opened in 2017 are maturing well and are, on average, now making returns above our target. Within this we continue to see particularly strong returns on the relocation of shops within their existing catchments. On average, a company-managed shop generated sales of £568,000 in 2018, and required £226,000 in capital employed, generating a cash return of 37% on this capital (taking into account store-level cash contribution less an allocation of incremental support costs). Annual income from a franchised shop was, on average, £211,000 in the same period, and required £89,000 in capital employed. After allocated support costs franchised shops generated a cash return of 29% on capital. We delivered an overall return on capital employed (ROCE, defined in Note 9) for 2018 of 27.4 per cent excluding exceptional items (2017: 26.9 per cent), reflecting the strength of performance in the year, and lower than expected capital expenditure. Lease accounting Greggs will adopt the requirements of IFRS16 “Leases” for the first time in 2019. As a result, we will recognise a balance sheet asset and corresponding obligation relating to our use of properties and other assets leased under multi-year agreements. Rental payments made under these leases will be accounted for as repayments of the balance sheet liability, which will include an implied interest element, and the asset recognised will be depreciated over the remaining lease term. Greggs will adopt the modified approach to transition where the initial asset values will be equal to the present value of the future lease payments as at the date of transition. This will result in all existing leases being capitalised over their remaining lives, as if they had just been entered into, and the company’s accounts will reflect an elevated interest charge following adoption. On transition our opening balance sheet position for 2019 will be adjusted for right-of-use assets in the order of £270 million, with corresponding lease liabilities in the order of £270 million. 2019 net profit before tax will decrease by an estimated £4.2 million as the pre-IFRS 16 rental charge is replaced by depreciation and interest. The depreciation will be charged on a straight-line basis; however interest is charged on the outstanding lease liabilities and will therefore be higher in the earlier years and decrease over time. On the basis of the Company’s plans for further growth in shop numbers the expected impact on reported profit performance over the next three years is as follows:

17
2019
£m 2020
£m 2021
£m
Expected increase in operating profit 2.6 2.8 3.8
Expected increase in finance expenses (6.8) (7.9) (8.5)
Expected decrease in net profit before tax (4.2) (5.1) (4.7)
On a cash flow basis, the impact of transition to IFRS16 will be £nil and adoption of the standard will have no impact on the way that we evaluate shop investment. The above results are sensitive to a number of judgements, including a key one relating to the treatment of properties where the current lease term has expired but we remain in negotiation with the landlord for potential renewal. Our interpretation of IFRS16 is such that, where we believe renewal to be reasonably certain, we will account for the lease as having been renewed. This is a material judgement and so we have developed a number of objective tests to ensure that leases are treated consistently. At the end of 2018 there were 264 property leases in this situation that we intend to capitalise for this reason. These properties account for £40 million of the assets and liabilities referred to above and £0.4 million of the expected decrease in profit. Cash flow and capital structure The net cash inflow from operating activities in the year was £136.2 million (2017: £116.9 million). At the end of the year the Group had net cash and cash equivalents of £88.2 million (2017: £54.5 million). The Board continues to believe that it is appropriate to maintain a target year-end net cash position of around £40 million to allow for seasonality in our working capital cycle and to protect the interests of all creditors. The current cash position is clearly above this level, reflecting the strength of performance in 2018 and some short-term changes to working capital and the phasing of capital expenditure. Given the current political and economic uncertainties facing the UK the Board believes that maintaining a strong cash position is advantageous to the Company. Looking forward, after taking into account the Company’s investment requirements and the intention to maintain our progressive dividend policy, it is likely that a proportion of the current cash position will be surplus to requirements. We are keeping our plans under active review and currently expect to be in a position to declare a special dividend at the time of the interim results in July 2019.
Richard Hutton Finance Director
7 March 2019

18
Greggs plc
Consolidated income statement for the 52 weeks ended 29 December 2018 (2017: 52 weeks ended 30 December 2017)
Note 2018 2018 2018 2017 2017 2017 Excluding
exceptional items
Exceptional items
(see Note 3)
Total
Excluding exceptional
items
Exceptional items
(see Note 3)
Total
£’000 £’000 £’000 £’000 £’000 £’000 Revenue 2 1,029,347 - 1,029,347 960,005 - 960,005 Cost of sales (373,487) (5,947) (379,434) (348,098) (10,060) (358,158) ________ ________ ________ ________ ________ ________ Gross profit 655,860 (5,947) 649,913 611,907 (10,060) 601,847 Distribution and selling costs
(513,161) 416 (512,745) (476,215) 198 (476,017)
Administrative expenses
(52,856) (1,682) (54,538) (53,517) - (53,517)
________ ________ ________ ________ ________ ________ Operating profit 89,843 (7,213) 82,630 82,175 (9,862) 72,313 Finance expense (12) - (12) (368) - (368) ________ ________ ________ ________ ________ ________ Profit before tax 89,831 (7,213) 82,618 81,807 (9,862) 71,945 Income tax 4 (18,201) 1,322 (16,879) (16,923) 1,884 (15,039) ________ ________ ________ ________ ________ ________ Profit for the financial year attributable to equity holders of the Parent
71,630
(5,891)
65,739
64,884
(7,978)
56,906
======= ======= ======= ======= ======= ======= Basic earnings per share
5 71.1p (5.9p) 65.2p 64.5p (7.9p) 56.6p
Diluted earnings per share
5 70.3p (5.8p) 64.5p 63.5p (7.8p) 55.7p

19
Greggs plc Consolidated statement of comprehensive income for the 52 weeks ended 29 December 2018 (2017: 52 weeks ended 30 December 2017)
2018 2017 £’000 £’000 Profit for the financial year 65,739 56,906
Other comprehensive income Items that will not be recycled to profit and loss:
Re-measurements on defined benefit pension plans
966 15,962
Tax on re-measurements on defined benefit pension plans
(164) (2,714)
________ ________ Other comprehensive income for the financial year, net of income tax
802 13,248
________ ________ Total comprehensive income for the financial year
66,541 70,154
======= =======

20
Greggs plc Consolidated Balance Sheet at 29 December 2018 (2017: 30 December 2017)
2018 2017 ASSETS £’000 £’000 Non-current assets Intangible assets 16,886 14,737 Property, plant and equipment 330,472 319,195 Deferred tax asset 191 782 ________ ________ 347,549 334,714 Current assets Inventories 20,792 18,688 Trade and other receivables 31,581 33,365 Cash and cash equivalents 88,197 54,503 ________ ________ 140,570 106,556 ________ ________ Total assets 488,119 441,270 ________ ________ LIABILITIES Current liabilities Trade and other payables (126,377) (107,126) Current tax liability (10,059) (8,714) Provisions (8,659) (12,090) ________ ________ (145,095) (127,930) Non-current liabilities Other payables (4,655) (5,127) Defined benefit pension liability (8,416) (7,506) Long-term provisions (735) (1,344) ________ ________ (13,806) (13,977) ________ ________ Total liabilities (158,901) (141,907) ________ ________ Net assets 329,218 299,363 ======= =======
EQUITY Capital and reserves Issued capital 2,023 2,023 Share premium account 13,533 13,533 Capital redemption reserve 416 416 Retained earnings 313,246 283,391 ________ ________ Total equity attributable to equity holders of the Parent
329,218 299,363
======= =======

21
Greggs plc Consolidated statement of changes in equity for the 52 weeks ended 29 December 2018 (2016: 52 weeks ended 30 December 2017) 52 weeks ended 30 December 2017 Attributable to equity holders of the Company Issued
capital Share
premium Capital
redemption reserve
Retained earnings
Total
£’000 £’000 £’000 £’000 £’000 Balance at 1 January 2017
2,023 13,533 416 248,688 264,660
Total comprehensive income for the year
Profit for the financial year
- - - 56,906 56,906
Other comprehensive income
- - - 13,248 13,248
________ ________ ________ ________ ________ Total comprehensive income for the year
- - - 70,154 70,154
Transactions with owners, recorded directly in equity
Sale of own shares - - - 5,358 5,358 Purchase of own shares - - - (11,352) (11,352) Share-based payment transactions
- - - 1,835 1,835
Dividends to equity holders
- - - (32,187) (32,187)
Tax items taken directly to reserves
- - - 895 895
________ ________ ________ ________ ________ Total transactions with owners
- - - (35,451) (35,451)
________ ________ ________ ________ ________ Balance at 30 December 2017
2,023 13,533 416 283,391 299,363
======= ======= ======= ======= =======

22
Greggs plc Consolidated statement of changes in equity (continued) 52 weeks ended 29 December 2018 Issued
capital Share
premium Capital
redemption reserve
Retained earnings
Total
£’000 £’000 £’000 £’000 £’000 Balance at 31 December 2017
2,023 13,533 416 283,391 299,363
Total comprehensive income for the year
Profit for the financial year
- - - 65,739 65,739
Other comprehensive income
- - - 802 802
________ ________ ________ ________ ________ Total comprehensive income for the year
- - - 66,541 66,541
Transactions with owners, recorded directly in equity
Sale of own shares - - - 5,270 5,270 Purchase of own shares - - - (9,945) (9,945) Share-based payment transactions
- - - 2,018 2,018
Dividends to equity holders
- - - (33,086) (33,086)
Tax items taken directly to reserves
- - - (943) (943)
________ ________ ________ ________ ________ Total transactions with owners
- - - (36,686) (36,686)
________ ________ ________ ________ ________ Balance at 29 December 2018
2,023 13,533 416 313,246 329,218
======= ======= ======= ======= =======

23
Greggs plc Consolidated statement of cashflows for the 52 weeks ended 29 December 2018 (2017: 52 weeks ended 30 December 2017) 2018 2017
£’000 £’000
Operating activities Cash generated from operations (see below) 152,222 134,470
Income tax paid (16,050) (17,602)
________ ________
Net cash inflow from operating activities 136,172 116,868
________ ________
Investing activities Acquisition of property, plant and equipment (61,437) (68,646)
Acquisition of intangible assets (5,188) (3,918)
Proceeds from sale of property, plant and equipment 1,726 2,171
Interest received 182 249
________ ________
Net cash outflow from investing activities (64,717) (70,144)
________ ________
Financing activities Sale of own shares 5,270 5,358
Purchase of own shares (9,945) (11,352)
Dividends paid (33,086) (32,187)
________ ________
Net cash outflow from financing activities (37,761) (38,181)
________ ________
Net increase in cash and cash equivalents 33,694 8,543
Cash and cash equivalents at the start of the year 54,503 45,960
________ ________
Cash and cash equivalents at the end of the year 88,197 54,503
======= ======= Cash flow statement – cash generated from operations 2018 2017
£’000 £’000
Profit for the financial year 65,739 56,906 Amortisation 3,039 3,435 Depreciation 52,867 50,044 Impairment / (reversal of impairment) 367 (415) Loss on sale of property, plant and equipment 1,602 2,719 Release of government grants (472) (472) Share-based payment expense 2,018 1,835 Finance expense 12 368 Income tax expense 16,879 15,039 Increase in inventories (2,104) (2,754) Decrease / (increase) in receivables 1,784 (2,652) Increase in payables 12,849 4,497 (Decrease) / increase in provisions (4,040) 5,920 Increase in pension liability 1,682 - ________ ________ Cash from operating activities 152,222 134,470 ======= =======

24
Greggs plc Notes 1. Basis of preparation and accounting policies The preliminary announcement has been prepared in accordance with the recognition and measurement principles of International Financial Reporting Standards as adopted by the EU ("adopted IFRSs"), IFRIC interpretations and the Companies Act 2006 applicable to companies reporting under IFRS. It does not include all the information required for full annual accounts.
The financial information set out above does not constitute the Company's statutory accounts for the years ended 29 December 2018 or 30 December 2017 but is derived from these accounts. Statutory accounts for the 52 weeks ended 30 December 2017 have been delivered to the registrar of companies, and those for the 52 weeks ended 29 December 2018 will be delivered in due course. The auditor has reported on those accounts; the audit reports were (i) unqualified, (ii) did not include a reference to any matters to which the auditor drew attention by way of emphasis without qualifying their report and (iii) did not contain a statement under section 498 (2) or (3) of the Companies Act 2006.
The preliminary announcement has been prepared using the accounting policies published in the Group’s accounts for the 52 weeks ended 30 December 2017, which are available on the Company’s website www.greggs.co.uk. From 31 December 2017 the following standards, amendments and interpretations were adopted by the Group:
• IFRS 9 Financial Instruments
• IFRS 15 Revenue from Contracts with Customers. The adoption of the above has not had a significant impact on the Group’s profit for the period or equity.
2. Segmental analysis The Board is considered to be the “chief operating decision maker” of the Group in the context of the IFRS 8 definition. In addition to its retail activities, the Group generates revenues from franchise and wholesale. However, these elements of the business are not sufficiently significant to be “Reportable Segments” in the context of IFRS 8.
Products and services - the Group sells a consistent range of fresh bakery goods, sandwiches and drinks in its shops. The Group also provides frozen bakery products to its wholesale customers.
Major customers - the majority of sales are made to the general public on a cash basis. A small proportion of sales are made on credit to certain organisations, including wholesale customers and franchisees. These are included within the ‘Other’ column in the table below.
Geographical areas - all results arise in the UK.
The Board regularly reviews the revenues and trading profit of each segment separately but receives information on overheads, assets and liabilities on an aggregated basis consistent with the Group accounts. Details of the revenue and trading profit are shown below:

25
2018 2017 Retail
company-managed
shops
Other Total Retail company-managed
shops
Other Total
£’000 £’000 £’000 £’000 £’000 £’000
Revenue 949,250 80,097 1,029,347 891,778 68,227 960,005
======= ======= ======== ======= ======= ========
Trading profit* 151,211 14,355 165,566 144,014 12,084 156,098
Overheads including profit share
(75,723)
(73,923)
________ _______
Operating profit before exceptional items
89,843
82,175
Finance expense (12) (368)
_______ _______
Profit before tax (excluding exceptional items)
89,831
81,807
Exceptional items (see Note 3)
(7,213)
(9,862)
_______ _______
Profit before tax 82,618 71,945
======= =======
* Trading profit is defined as gross profit less supply chain costs and retail costs (including property costs) and before central overheads.
26
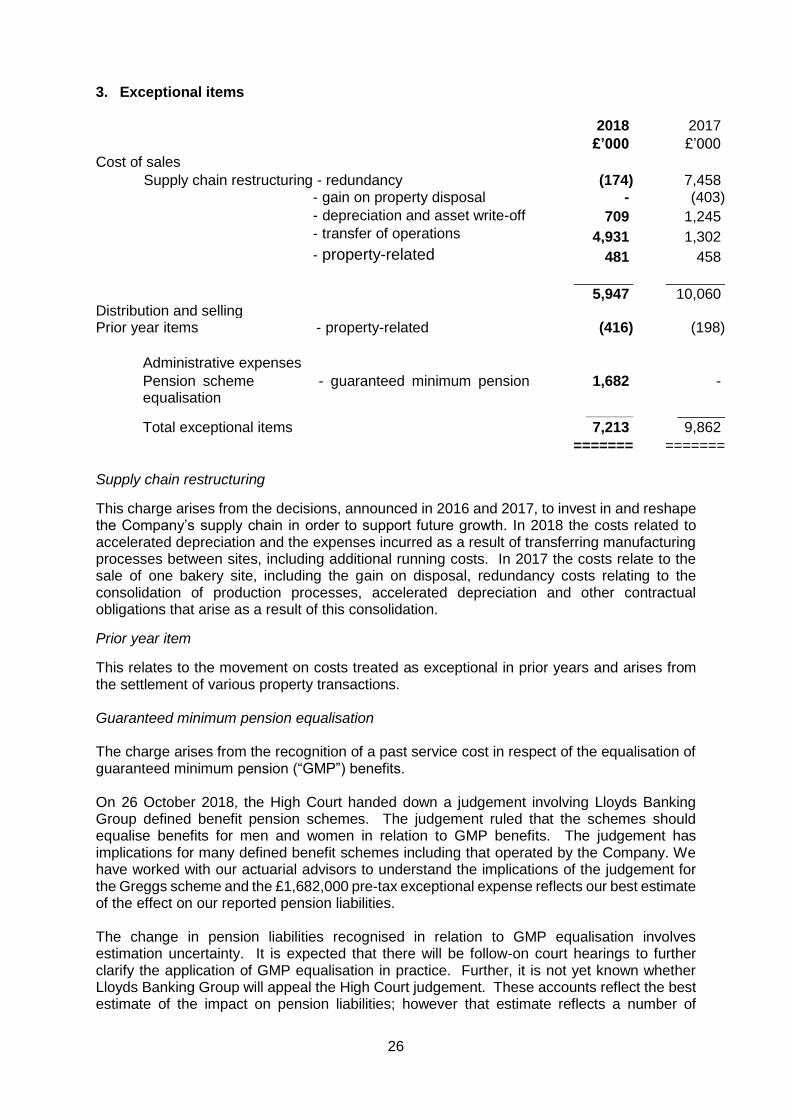
3. Exceptional items 2018 2017
£’000 £’000
Cost of sales
Supply chain restructuring - redundancy (174) 7,458 - gain on property disposal - (403)
- depreciation and asset write-off 709 1,245 - transfer of operations 4,931 1,302
- property-related 481 458 __________ __________ 5,947 10,060
Distribution and selling Prior year items - property-related (416) (198)
Administrative expenses
Pension scheme - guaranteed minimum pension equalisation
1,682 -
________ ________
Total exceptional items 7,213 9,862
======= ======= Supply chain restructuring
This charge arises from the decisions, announced in 2016 and 2017, to invest in and reshape the Company’s supply chain in order to support future growth. In 2018 the costs related to accelerated depreciation and the expenses incurred as a result of transferring manufacturing processes between sites, including additional running costs. In 2017 the costs relate to the sale of one bakery site, including the gain on disposal, redundancy costs relating to the consolidation of production processes, accelerated depreciation and other contractual obligations that arise as a result of this consolidation.
Prior year item
This relates to the movement on costs treated as exceptional in prior years and arises from the settlement of various property transactions. Guaranteed minimum pension equalisation The charge arises from the recognition of a past service cost in respect of the equalisation of guaranteed minimum pension (“GMP”) benefits. On 26 October 2018, the High Court handed down a judgement involving Lloyds Banking Group defined benefit pension schemes. The judgement ruled that the schemes should equalise benefits for men and women in relation to GMP benefits. The judgement has implications for many defined benefit schemes including that operated by the Company. We have worked with our actuarial advisors to understand the implications of the judgement for the Greggs scheme and the £1,682,000 pre-tax exceptional expense reflects our best estimate of the effect on our reported pension liabilities. The change in pension liabilities recognised in relation to GMP equalisation involves estimation uncertainty. It is expected that there will be follow-on court hearings to further clarify the application of GMP equalisation in practice. Further, it is not yet known whether Lloyds Banking Group will appeal the High Court judgement. These accounts reflect the best estimate of the impact on pension liabilities; however that estimate reflects a number of

27
assumptions. As the outcome of future court hearings cannot be reliably predicted, it is not practical to quantify the extent of the estimation uncertainty but the best estimate reflects the information currently available. The Directors will continue to monitor any further clarifications or court hearings arising from the Lloyds case and consider the impact on pension liabilities accordingly. The Directors have made the judgement that the estimated effect of GMP equalisation is a past service cost that should be reflected through the income statement and that any subsequent change in the estimate should be recognised in other comprehensive income. This judgement is based on the fact that the reported pension liabilities as at 30 December 2017 did not include any amount in respect of GMP equalisation. 4. Taxation
Recognised in the income statement
Excluding
exceptional items
Exceptional items
Total Excluding exceptional
items
Exceptional items
Total
2018 2018 2018 2017 2017 2017 £’000 £’000 £’000 £’000 £’000 £’000 Current tax Current year 18,954 (916) 18,038 18,902 (1,756) 17,146 Adjustment for prior years
(643) - (643) (1,256) - (1,256)
________ ________ ________ ________ ________ ________ 18,311 (916) 17,395 17,646 (1,756) 15,890 ________ ________ ________ ________ ________ ________ Deferred tax Origination and reversal of temporary differences
(237) (406) (643) (457) (128) (585)
Adjustment for prior years
127 - 127 (266) - (266)
________ ________ ________ ________ ________ ________
(110) (406) (516) (723) (128) (851) ________ ________ ________ ________ ________ ________ Total income tax expense in income statement
18,201 (1,322) 16,879 16,923 (1,884) 15,039
======= ======= ======= ======= ======= =======

28
5. Earnings per share
Basic earnings per share
Basic earnings per share for the 52 weeks ended 29 December 2018 is calculated by dividing profit attributable to ordinary shareholders by the weighted average number of ordinary shares outstanding during the 52 weeks ended 29 December 2018 as calculated below.
Diluted earnings per share
Diluted earnings per share for the 52 weeks ended 29 December 2018 is calculated by dividing profit attributable to ordinary shareholders by the weighted average number of ordinary shares, adjusted for the effects of all dilutive potential ordinary shares (which comprise share options granted to employees) outstanding during the 52 weeks ended 29 December 2018 as calculated below. Profit attributable to ordinary shareholders
2018 2018 2018 2017 2017 2017 Excluding
exceptional items
Exceptional items
Total Excluding exceptional
items
Exceptional items
Total
£’000 £’000 £’000 £’000 £’000 £’000
Profit for the financial year attributable to equity holders of the Parent
71,630 (5,891) 65,739 64,884 (7,978) 56,906
======= ======= ====== ======= ======= =======
Basic earnings per share
71.1p (5.9p) 65.2p 64.5p (7.9p) 56.6p
Diluted earnings per share
70.3p (5.8p) 64.5p 63.5p (7.8p) 55.7p
Weighted average number of ordinary shares
2018 2017 Number Number Issued ordinary shares at start of year 101,155,901 101,155,901 Effect of own shares held (462,731) (510,293) __________ __________ Weighted average number of ordinary shares during the year
100,693,170 100,645,608
Effect of share options on issue 1,161,042 1,489,067 __________ __________ Weighted average number of ordinary shares (diluted) during the year
101,854,212 102,134,675
========= =========

29
6. Dividends The following tables analyse dividends when paid and the year to which they relate: 2018 2017 Per share Per share pence pence 2016 final dividend - 21.5p 2017 interim dividend - 10.3p 2017 final dividend 22.0p - 2018 interim dividend 10.7p - ________ ________ 32.7p 31.8p ======= =======
The proposed final dividend in respect of 2018 amounts to 25.0 pence per share (£25,161,000). This proposed dividend is subject to approval at the Annual General Meeting and has not been included as a liability in these accounts. 2018 2017
£’000 £’000
2016 final dividend - 21,768
2017 interim dividend - 10,419
2017 final dividend 22,262 -
2018 interim dividend 10,824 -
________ ________
33,086 32,187
======= =======
7. Related parties
The Group has a related party relationship with its subsidiaries, associates, Directors and executive officers and pension schemes.
There have been no related party transactions in the year which have materially affected the financial position or performance of the Group.

30
8. Principal risks and uncertainties
The Directors have carried out a robust assessment of the principal risks facing the Company, including those that would threaten its business model, future performance, solvency or liquidity. Where appropriate, the impact of these risks occurring has been considered when developing the scenarios tested as part of the financial viability statement. For this year, we have separately stated the risks of business change relating to our transformation programme and our IT systems implementation. This is due to the fact that the two risks diverge in their nature and mitigations as the transformation agenda nears completion. We have also specifically described a broader risk of increased legislation, which previously focused on the financial impact of non-compliance. Previously disclosed risks relating to the wider economy and our response to competitor activity have been removed, since we have robust routine management processes in place to control these issues and we are able to flex our business model as required. The risks are grouped according to their overriding theme, and are described along with the movement in net risk during the year. Organisational capacity
Description Key mitigations Change
Business transformation
Our business change programme continues, requiring restructuring and capital investment. Expected timelines or savings may not be met, and there may be disruption to our customers.
We phase our change activity to avoid affecting the Company as a whole wherever possible. Timelines and forecasts are clearly defined and agreed. Progress against these is closely monitored and reported on a regular basis to our Operating Board.
↔
Loss of production
As we continue to move towards more centralised production, any interruption to production may have a significant impact on availability of product for our customers.
All of our supply sites have contingency plans in place. We simulate scenarios and test our recovery processes periodically. We have identified alternative supply sources for key ingredients and products, and periodically test these alternative routes. Our property insurers conduct annual site inspections, helping us to protect our facilities. We also believe that to an extent customers will choose an alternative product if their first choice is not available.
↑

31
Loss of distribution capability
We are creating larger distribution centres of excellence with a greater reliance on technology. This increases the impact of any operational failure on our ability to deliver to our shops.
We work closely with our property insurers in our building design, to ensure an appropriate level of protection. As with our production sites, annual inspections are carried out by our insurers. We are refreshing our site-based contingency plans to ensure that they remain relevant for dedicated distribution centres. Our IT disaster recovery plans are being updated as part of a review of our approach to cyber risk.
New
Management of third party relationships
As our reliance on third parties for services, ingredients or business support increases, we become more exposed to their business interruption risks. This could impact on our ability to produce, distribute or sell our products.
Our own contingency arrangements consider the implications of key systems or ingredients being unavailable. All third parties are vetted prior to us engaging with them. Key supplier relationships are managed by our central procurement team.
↔
Ability to attract / retain / motivate people
Market forces and particularly the impact of Brexit may result in a shortage of available workforce. This may be compounded by the relative complexity of our shop operations compared with other retailers.
We offer attractive remuneration and benefit packages to reward our teams, along with training and development opportunities. We carry out an annual opinion survey which confirms high levels of employee engagement. We are continually striving to streamline and simplify our shop processes and operations for our teams. As part of our business change programme, we have invested in improved recruitment processes, making the application journey easier for a potential employee.
↔

32
Brand reputation
Product quality & safety
Due to our vertically-integrated structure, and the fact that we freshly prepare food every day in our shops, we may have a greater exposure to food safety risk than many of our competitors.
Procedures are in place throughout our supply sites and shops to ensure that food safety is maintained. Compliance is monitored both internally and by regulators. We are working with industry bodies to help to shape new allergen controls and regulations.
↑
Food scare
We may suffer a loss of trade due to customer confidence being impacted by an external food scare beyond our control.
Most of the products on sale in our shops are made by our staff in our bakeries. Routine checks are carried out to confirm the integrity of our products and ingredients. We have robust procedures in place to execute product withdrawals quickly should the need arise.
↔
Consumer trends
As customers become more concerned about nutrition and health, demand for the more indulgent products in our range may reduce.
We continue to work on improving the nutrition of our traditional products, including a commitment to reduce sugar and fat in line with Public Health England’s guidance. Our “Balanced Choice” range provides a number of healthier options, and we continue to develop new lines catering for emerging dietary choices.
↔
Technology
Cyber & data security
As with all businesses, our data and systems are exposed to external threats such as hackers or viruses. These could lead to data breaches or disruption to our operations.
We actively monitor our networks and systems, including conducting regular penetration testing. Our approach to information security is closely monitored by the Board.
↔
33
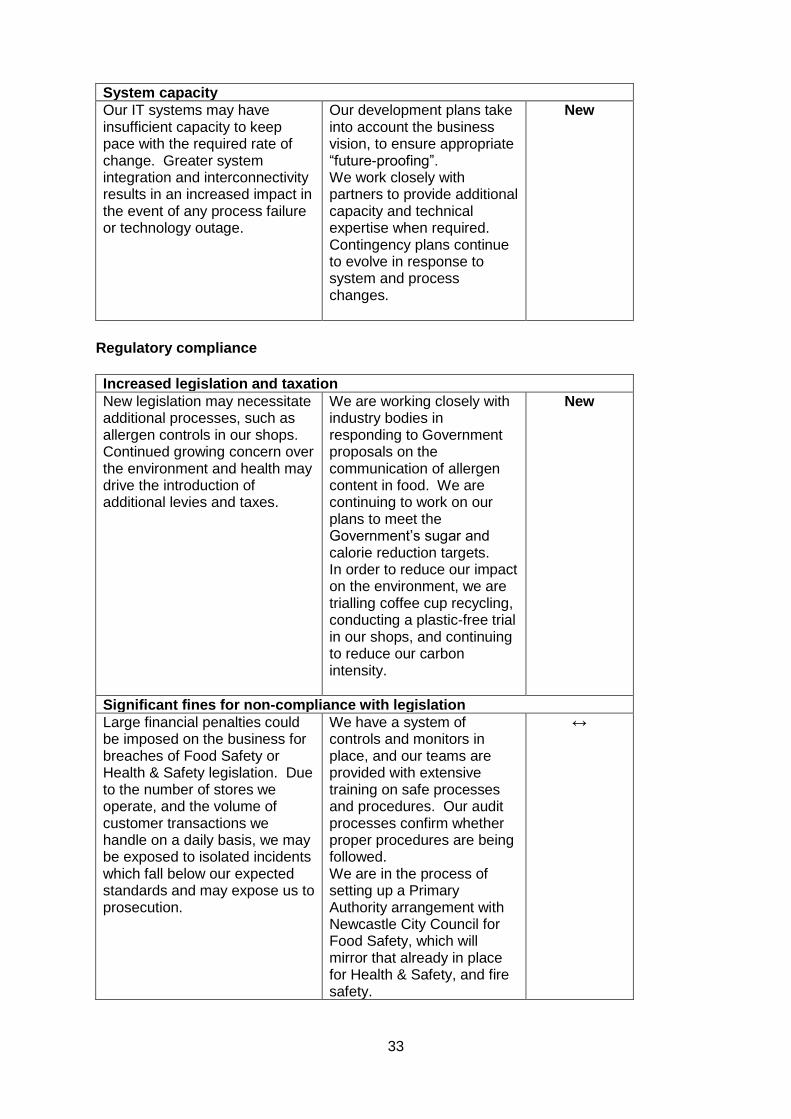
System capacity
Our IT systems may have insufficient capacity to keep pace with the required rate of change. Greater system integration and interconnectivity results in an increased impact in the event of any process failure or technology outage.
Our development plans take into account the business vision, to ensure appropriate “future-proofing”. We work closely with partners to provide additional capacity and technical expertise when required. Contingency plans continue to evolve in response to system and process changes.
New
Regulatory compliance
Increased legislation and taxation
New legislation may necessitate additional processes, such as allergen controls in our shops. Continued growing concern over the environment and health may drive the introduction of additional levies and taxes.
We are working closely with industry bodies in responding to Government proposals on the communication of allergen content in food. We are continuing to work on our plans to meet the Government’s sugar and calorie reduction targets. In order to reduce our impact on the environment, we are trialling coffee cup recycling, conducting a plastic-free trial in our shops, and continuing to reduce our carbon intensity.
New
Significant fines for non-compliance with legislation
Large financial penalties could be imposed on the business for breaches of Food Safety or Health & Safety legislation. Due to the number of stores we operate, and the volume of customer transactions we handle on a daily basis, we may be exposed to isolated incidents which fall below our expected standards and may expose us to prosecution.
We have a system of controls and monitors in place, and our teams are provided with extensive training on safe processes and procedures. Our audit processes confirm whether proper procedures are being followed. We are in the process of setting up a Primary Authority arrangement with Newcastle City Council for Food Safety, which will mirror that already in place for Health & Safety, and fire safety.
↔
34
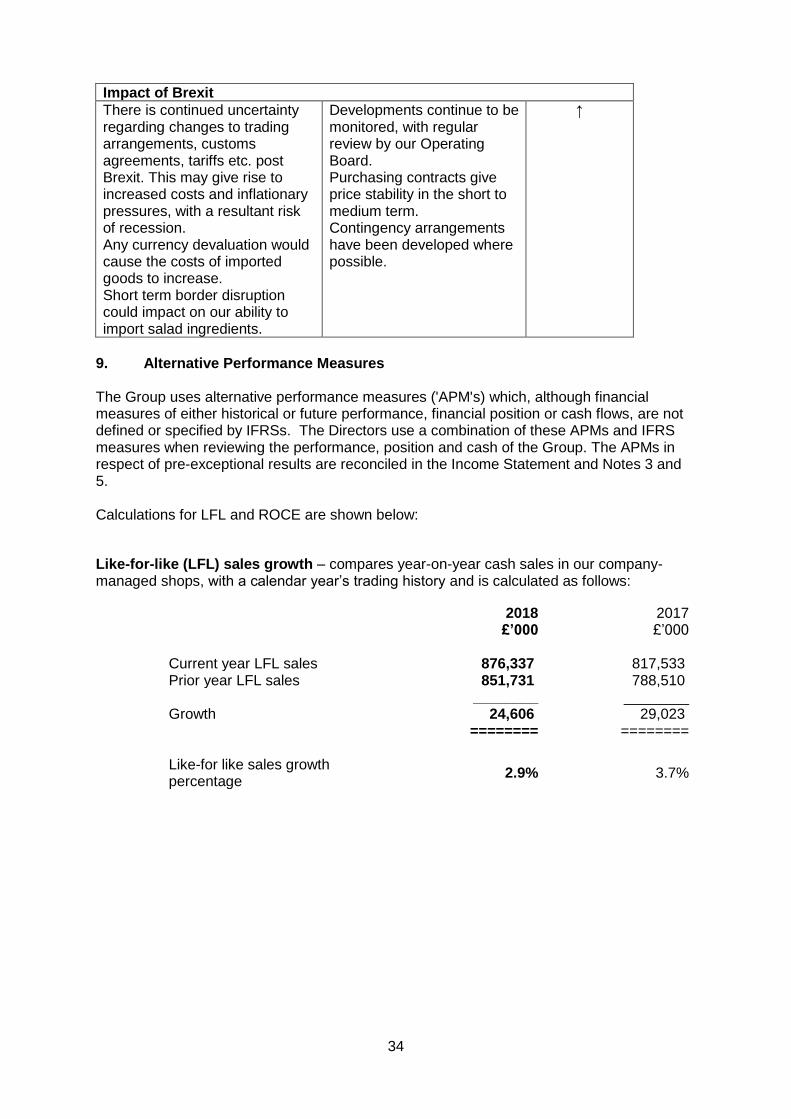
Impact of Brexit
There is continued uncertainty regarding changes to trading arrangements, customs agreements, tariffs etc. post Brexit. This may give rise to increased costs and inflationary pressures, with a resultant risk of recession. Any currency devaluation would cause the costs of imported goods to increase. Short term border disruption could impact on our ability to import salad ingredients.
Developments continue to be monitored, with regular review by our Operating Board. Purchasing contracts give price stability in the short to medium term. Contingency arrangements have been developed where possible.
↑
9. Alternative Performance Measures The Group uses alternative performance measures ('APM's) which, although financial measures of either historical or future performance, financial position or cash flows, are not defined or specified by IFRSs. The Directors use a combination of these APMs and IFRS measures when reviewing the performance, position and cash of the Group. The APMs in respect of pre-exceptional results are reconciled in the Income Statement and Notes 3 and 5. Calculations for LFL and ROCE are shown below:
Like-for-like (LFL) sales growth – compares year-on-year cash sales in our company-managed shops, with a calendar year’s trading history and is calculated as follows:
2018 2017 £’000 £’000 Current year LFL sales 876,337 817,533 Prior year LFL sales 851,731 788,510 ________ ________ Growth 24,606 29,023 ======== ======== Like-for like sales growth percentage
2.9% 3.7%

35
Return on capital employed (ROCE) - calculated by dividing profit before tax by the average total assets less current liabilities for the year.
2018 2018 2017 2017 Underlying Including
exceptional items
Underlying Including exceptional
items £’000 £’000 £’000 £’000 Profit before tax 89,831 82,618 81,807 71,945
======= ======= ======= ======= Capital employed:
Opening 313,340 313,340 294,536 294,536 Closing 343,024 343,024 313,340 313,340 ------------- ------------- ------------- ------------- Average 328,182 328,182 303,938 303,938 ======= ======= ======= ======= Return on capital employed
27.4% 25.2% 26.9% 23.7%