strength enhancement of concrete containing … archive/files/merge/vol-40... · strength...
TRANSCRIPT
I
STRENGTH ENHANCEMENT OF CONCRETE CONTAINING MSW INCINERATOR ASH
James T. Cobb, Jr., Daniel J. Reed and James T. Lewis III Department of Chemical & Petroleum Engineering
University of Pittsburgh Pittsburgh, Pennsylvania 15261
Keywords: municipal solid waste, incinerator ash, concrete
ABSTRACT
In previous work [I] pretreatment of fresh municipal solid waste (MSW) incinerator ash With a novel type of additive, which was not identified chemically in that paper, was shown to markedly increase the compressive strength of portland cement concrete using the MSW ash as fine aggregate. A r m n t study has shown that, at lower levels of additive, aged MSW ash does not demonstrate the Same enhancement. This presentation will provide additional information concerning the previous study, give the results of the current one and discuss the implications of both.
INTRODUCTION
Much work is being conducted to find beneficial uses for the solid residues from energy- conversion process, such as coal-fired electric power plants and combustors of municipal solid waste (MSW). Landfill caps and liners, grouts, structural fills, artificial aggregate for road bases, concretes of various types, and additives for cement have all been examined as outlets for these energy-related wastes. For all of the uses just listed, solidification is the principal goal, while stabilization of the eight RCRA metals (arsenic, barium, cadmium, chromium, lead, mercury, selenium and silver) is an important secondary consideration.
Two residues obtained from the most thorough of the MSW combustors - the O’Conner rotary burner - fail to meet the following specifications for Class C Fly Ash - moisture content, ignition loss, pozzolanic activity index and fineness. [l] In addition they fail the EP toxicity test for cadmium and lead [I], as shown in Table 1. Thus, they cannot be used as cement additives and they must be stabilized when included in any of the other beneficial uses listed in the last Paragraph.
An earlier paper [l] described a study in which a combined MSW ash from the O’Conner combustor was used as fine aggregate in portland cement concrete. In that paper it was pointed out that using MSW ash for this purpose substantially degrades the strength of the concrete so produced, but it reported that a novel additive had been discovered which gives early indications of economically restoring concretes containing MSW ash to their normal strengths.
However, the authors of that earlier paper did not reveal the chemical composition of the novel additive. At that time they were exploring the possibility of obtaining a patent on the use of the additive. Since then, they have decided that, such a patent being essentially be unenforceable if awarded, the nature of the additive should be disclosed.
One purpose of this paper, then, is that disclosure, along with some additional information obtained during the last few months of the Westinghouse-sponsored project, which came to its conclusion shortly after that paper was written. [2] Subsequently, another graduate student conducted a brief examination of this topic and found some interesting differences between the behavior of fresh and aged MSW ash. [3] The second purpose of this paper, then, is to report his findings.
SOLIDIFICATION ENHANCEMENT USING NOVEL ADDITIVES
The novel additive is a common acid. Two different acids have been tested - hydrochloric acid and acetic acid. The method of introduction of the acid may best be shown by giving the procedure (based upon ASTM C192-88) for mixing a batch of concrete in which it is included. The specific batch described is Batch 32:
0 Add 17.0 pounds of coarse aggregate and 25.8 pounds of MSW ash to a small cement mixer and commence rotation.
Add 500 ml of 12 normal hydrochloric acid and mix for several minutes.
853

0 Add 33.5 pounds of Cement and 12.0 pounds of water (enough to provide a slump of 1.5 to 2.5 inches) to the mixer in equal proportions, one after the other, in three or four different intervals.
when the mix is ready for molding, fill twenty three inch by six inch cylindrical cardboard molds and place them in a curing room.
After each period of three, seven, fourteen, twenty-eight and ninety days, test four cylinders for compressive strength, reporting the average strength of the strongest three cylinders.
0
0
Figure 1 provides a record of the 28-day average compressive strengths for twelve concretes prepared with MSW ash as fine aggregate and with varying amounts of either hydrochloric acid or acetic acid. The abscissa is structured in units of gram moleslpounds MSW ash. For comparison, the 28-day strength of a concrete made with no additive (Batch 5) is shown. Nearly a 300% increase in compressive strength (1400 psi to 5500 psi) is achieved by Batch 30, made with 0.25 gram moles of hydrochloric acid per pound of MSW ash.
The results of the 90-day compressive strengths are confused. These batches were made near the end of the project and 90-day strengths were not obtained for Batches 44 through 49. In addition, the cylinders for Batches 27, 35, 36 and 37 deteriorated such that no strength could be measured. The 90-day compressive strengths for Batches 30, 31,32 and 42 are 4940, 4380, 6200 and 1618 respectively. [It should be noted that no 28day strength for batch 42 was measured. The value in Figure 1 is the 90-day strength.] Thus, the compressive strength of Batch 30 decreased somewhat after Day 28, that for Batch 31 rose very slightly and that for Batch 32 increased dramatically. The addition of these two acids may be affecting the crystallography of the cementitious portion of the concretes. Intermediate amounts of acid appear to increase strength without degradation, while larger amounts cause deterioration. Much work needs to be conducted to understand the causes and effects of strength enhancement by acid addition.
METAL STABILIZATION IN MSW ASH-CONTAINING CONCRETE
Samples of the first nine concretes containing MSW ash, made in this project, were extracted by the project team according to the EP toxicity method and the concentrations of the eight RCRA metals in the extracts were measured by Geochemical Testing of Somerset, Pennsylvania. The results of these tests are given in Table 1. The two metals, cadmium and lead, which caused the MSW ash to fail the EP toxicity test, have been well stabilized in all nine concretes.
COMPARISON OF BEHAVIOR OF FRESH AND AGED ASH
This portion of the study was conducted two years after the earlier portion. Aged ash was drawn from the fourth (and final) batch of ash that had been collected several years previously. Fresh ash was obtained from the Dutchess County MSW Incinerator. It was drawn from the ash conveyor prior to lime addition.
This portion of the study utilized mortar, rather than full concrete containing coarse aggregate. The method of mortar production, based upon ASTM C109, was as follows:
0
0 Add water and mix.
0
0
Place the ash into a mixing bowl.
Add hydrochloric acid (if it is to be used) and mix,
Add cement (to a water/cement ratio of 0.81) and mix.
Fill six plastic two-inch molds with mortar, place them in a curing room for 24 hours, break them from the molds, and continue curing for six more days.
Measure the compressive strength of each of the six cubes, using a universal testing machine; calculate the average strength of the four strongest cubes.
Figure 2 provides a record of the compressive strengths for eight aged ash-containing m o m s , six prepared with varying amounts of hydrochloric acid and two with no acid. Figure
854

?
EPMcity Cmaumt Madurn
Auaabla Umt
ksenlc 500 &durn io0.m
W 500 MsrmlY azo Gelenlum 1.00 Silver 50.00
c8dmlUm 1.00 chmmlum Lao
I
Primary PIaln Ave Mar A q Mmt Mnidng ca#rt*, Conuem Qncmm &h Ash WaBl conpol Bemplea Bem@m 8nmF4Ia samples
8tandarda M . 1 tog lto9 l a d 2 lend2 am awe o.oiez 0.05 aoit 0.018 1 .am 1.09 0.7WO 1.38 ales 0.240
am 0.01 0 . 1 5 ~ 0.n am 7.480
aoio am 0 . m 0.02 am 0.m
0.010 0.01 0.1061 0.47 1.375 1.m 0.050 am 0.- a09 0.0) 0.050
am a m 0 . m 0.004 0.001 0.001
am 0.01 0.0167 0.M 0.025 0.m
3 provides a record of the compressive strengths for three fresh ash-containing mortars, two Prepared With varying amounts of hydrochloric acid and one with no acid. For comparison of Figures 2 and 3 with Figure 1, it may be noted that 100 mmol of acid in Figures 2 and 3 corresponds to 0.032 gram moles acidlpound of ash in Figure 1.
First, it may be observed that all of the mortars were prepared with relatively low amounts of acid. The largest amount of acid, about 0.05 gram moles acidlpound of ash, was used in Batch 6. This corresponds to the amount used in Batches 31 and 37 of the earlier portion of the study. Thus, the increases in compressive strength with increasing amounts of acid, observed in Figures 2 and 3 to be under 100%. are as expected, based upon the experience recorded in Figure 1.
From a comparison of Figures 2 and 3 it i s clear that the compressive strength of mortar made from fresh ash is over six times that of mortar made from aged ash. Fresh ash has a certain amount of pozzolanic character which is lost as it ages. It is also clear from this comparison that acid addition is much more effective in increasing the compressive strength of mortar containing fresh ash than for that containing aged ash. Mortar with fresh ash doubles in strength with the addition of about 60 mmols of acid, while mortar with aged ash may require 120 mmols or more of acid for the same effect. Thus, there may be a phenomenological linkage between the strength enhancement caused by acid addition and the pozzolanic nature of the ash.
CONCLUSIONS
The addition of common acids, such as hydrochloric and acetic acids, to mortars and concretes containing MSW incinerator ash, increases the compressive strength of the final product. The increase is more pronounced when the ash is fresh. Aging of ash degrades the final strength of the mortar and also reduces the effect to be expected by acid addition.
It should be noted that the results of this study are quite preliminary in nature. Much more work needs to be done to verify and quantify the trends and to ascertain their causative mechanism.
REFERENCES
[I]
[2] [3]
Cobb, J. T., Jr., et al., Clean Enercy from Waste& Coal, M. R. Khan, ed., ACS Symposium Series, 515, 1993, p. 264. Reed, D. I . , MS Thesis, University of Pittsburgh, 1992. Lewis, J. T., 111, MS Thesis, University of Pittsburgh, 1994.
Table 1. EP Toxicity Tests on Nine Concretes Containing MSW Ash
855

Figure 1 . Effect of Acid Concentration on Compressive Strength of Concrete Containing MSW Ash
0
P 6
8 16
18
u) la, 1% Amount of Acid (mmol)
Figure 2. Effect of Acid Concentration on Compressive Strength of Mortar Containing Aged MSW Ash
856 1

1100
1000
0 10 m 30 Amount of Acid (mmol)
Figure 3. Effect of Acid Concentration on Compressive Strength of Mortar Containing Fresh MSW Ash
857
INVESTIGATION OF THE CO, ABSORPTION CAPACITY OF DRY FGD WASTES
Taulbee, D.N., Graham, U., Rathbone, R.F., and Robl, T.L. University of Kentucky-Center for Applied Energy Research
3572 Iron Works pike Lexington, KY 4051 1
Keywords: CO, or carbon dioxide, Rue-gas desulfurization or FGD, natural gas, Calcium Oxide
ABSTRACT Numerous utility boilers and tail-gas desulfurization units utilize lime or limestone-based
sorbents to remove sulfur oxides generated during the combustion of fossil fuels. Such units generate about 20 million tons of flue-gas desulfurization (FGD) wastes annually in the US., the bulk of which (-95%) is discarded in landfills or holding ponds.' Thus. commercial utilization of FGD wastes would benefit from both a plentiful low-cost raw material as well as a signifcant savings in disposal. One such use may be for the reduction of CO, in multi-component gas streams.
During the removal of SO,, the lime added to or generated in the desulfurization unit, is not iully utilized. That is, a portion of the Ca fed to the unit is not sulfated (remains as CaO or Ca(OH),). In some FGD wastes, the fraction of available Ca is quite high (> In ) , paniculariy for dry wastes. When hydrated, such wastes exhibit a strong aftinity to absorb CO, at ambient temperature. Funher, both the kinetics and extent of absorption are favorable as CO, initially at -2.5 volume% was rapidly reduced to below the detection limit of the measurement device (ppm range) used in this study. Leaching behavior and changes in the mineralogy of the FGD samples exposed to CO, are also discussed.
INTRODUCTION. Over the past decade, numerous FGD units have been added to existing utility boilers in an
effort to satisfy federal mandates on SO2 emissions. Such units are usually classified as either wet or dry &pending on whether the absorbent is used in a slurry (wet) or as a hydrated solid. Wet scrubbers capture sulfur chiefly as gypsum (CaS04R,0) with some sulfite formation (e.g., CaS03.2H,0). Dry technologies such as AFBC produce a dry product in which sulfur is captured mostly as anhydrite-CaS04 or for the dry tail-gas units such as spray drier and duct-injection, sulfur is captured as gypsum, anhydrite or hemi-hydrate (CaSO,H,O). Dry FGD by-products also differ from their wet-scrubber counterparts in that a significant portion of the calcium in the dry waste remains unsulfated. This Ca is present as either calcium oxide, CaO, or as slaked lime, &(OH),. Because FGD wastes, particularly dry FGD wastes represent relatively new materials, <6% of the -20 M tons of FGD wastes generated in 1993 are currently finding commercial uses.'
The work described here represents a preliminary examination of the capacity of dry-FGD wastes to remove CO, from multi-component gas streams. Such an absorbent may have numerous commercial uses, e.g., gas purification, removal of C02 during H2 production, etc. However, the current study focused on the potential to reduce CO, in simulated natural-gas streams. As a rule of thumb, the costs associated with available COz-removal technologies (wet scrubbers, molecular sieves, membranes) are prohibitive for gas wells that produce less than about 100,OOO SCF/day? This effectively eliminates commercial production from low-porosity, carbonate-conta@ing strata common to many gas-producing deposits. Thus, a low-cost CO, absorbent that can be safely disposed or marketed (road base or fertilizer) may have applications in the natural-gas industry.
In this study, CO, absorption capacity was evaluated for waste samples generated from different utility boilers, one demonstration plant, and tests conducted under four sets of conditions i n a single pilot plant. With the exception of a utility-derived fly ash used as a control, all samples examined are dry-FGD waste materials. Absorption capacity was examined for both hydrated samples as well as aqueous slm'es. As of this writing, only gas blends containing inert gases and CO2 or inert gas and COJCH4 have been tested. Additional tests are planned to evaluate absorption behavior during exposure of hydrated FGD-wastes to a gas blend containing 3 s . CO,, and CH,.
EXPERIMENTAL. Absorption Reactor. A schematic of one configuration of the reactor used to measure CO,
absorption for the hydrated samples is shown in Figure 1 (shown with 9" X 1/4"-i.d. tube reactors). This is essentially the reactor described in earlier adsorption/cracking studies of liquid hydrocarbons3 with some modification. The more significant modifications include the inucduction of standard gases containing COdAr or COdCHdAr via the entry line in which pure Ar was pfiviously metered, plugging of the liquids inlet, use of 4 X 3/8"-i.d. reactors in addition to the 9" x 1/4" reactors (most of the hydrated-sample tests), and placement of the 4" reactors in a vertical alignment to provide a more uniform flow of gases through the hydrated samples. Essentially the Same measurement system was used to measure absorption of CO, by the water/sample slurries except that a pair of 250-mLcapacity gas scrubbers were substituted for the ss tube reactors.
Samples. Many of the study samples examined were obtained from commercial utilities that
858

I
preferred to remain unidentified. Thus, only cursory descriptions of the samples will be given and some producers will remain anonymous.
A total of 11 samples were examined. A very brief description along with the identification label used in this repon is given in Table I. The fly ash utilized as conml &FA) is a Class F fly ash from a pulverizedcoal-combustion (F'CC) utility boiler operating on bituminous coal. The fluidized-& combustion materials (FU-FA/BA and CC-FA/BA) were derived from circulating or entrained flow units operating on high-sulfur bituminous coal. The coarse material @A-bed ash) was drained from the bed while the finer material (FA) represents cyclone and baghouse catch. These samples differ primarily in panicle size and relative proportions of free lime. Two types of dry post-combustion flue-gas material were utilized in the study, a spray-dryer ash from a large industrial boiler in the Midwest, and materials from the Coolside duct-injection technology. The Coolside materials include a sample (CS) from Ohio =son's 1990 demonsmation of the technology at its Edgewater power plant4 as well as materials derived from the CONSOL'S Coolside pilot plant in Library, PA (PPl-PP4)S
Run Conditions and Procedures. All absorption measurements were made at ambient temperature. Nominal gas flows of 100 mumin (ambient temperature) for the hydrated-solids tests and 150 mumin for the slurry tests were metered through each reactor. The gas streams were comprised solely of N, in the bypass line and a standard-gas blend (either Ar/CO,/He- 7.5/2.5/90.0 ~01%; or Ar/COZ/cH,-30.4/49.6/20.1 ~01%) in the absorbent line. Argon was included as a tracer gas to eliminate measurements problems associated with minor leaks or instrumental drift.
Hydrated samples of known water content were obtained by careful blending of distilled water and dry waste. Between 2 and 5 g of the hydrated samples were packed into the absorbent reactor between quartz-wool plugs. The bypass reactor was packed with 6 g of Ottawa sand.
For the slurry absorption experiments, -5 g of dry sample was added to 200 mL of distilled water in a 250-mL gas scrubber. The slurry was stirred with a magnetic stir bar for the duration of the experiment. Gas concentrations in the combined sample/bypass exit stream were determined with a VG-quadrupole mass spectrometer (QMS). This unit was operated in a selected-ion- monitoring mode in which intensities for m/e 18-H20+, 20-d'. 28-N2+, 40-h'. 44-C02+, and 15- CH3+ (for methane) were recorded at approximately 1-second intervals.
For both the hydrated-solids and slurry tests, data collection was initiated with the switching valve in the bypass position, i.e., with the CO, stream passing through the bypass reactor. After a minimum of 150 data points were collected (usually 2-4 minutes), the valve was rotated so that the C02 stream was switched to the absorbent reactm and the N, stream was simultaneously switched to the bypass reactor. After a selected exposure time, the valve was returned to the initial position to reestablish the QMS baseline.
Following data collection, the QMS data were imported to a spreadsheet where the molecular-ion signal for CO, (m/e-44) was ratioed to the Ar-ion signal (m/e-40). The curves described by the COgAr ratio were then numerically integrated over the interval during which CO, was routed to the absorbent reactor to determine the fraction of the 0, absorbed. The fraction of CO, absorbed was calculated to an absolute basis then to SCF of C02 absorbed per ton of waste.
Several of the hydrated samples were retained in sealed vials for post-run XRD analysis to investigate changes in mineralogy resulting from CO, absorption. Likewise, selected slurry waters were retained in sealed containers for ICP analysis of heavy metals/cations.
RESULTS A plot of the C02/Ar ion-intensity ratios is shown in Figure 2. In this run, the Ar/C02 blend
(2.5% CO,) was initially flowed through the sand-packed bypass reactor, switched to the absorbent bed packed with hydrated FU-fly ash at 3 min, returned to the bypass reactor at 53 min, then again to the absorbent reactor 3-min later. This particular plot demonsuates both the rapid kinetics and the extent to which CO, was absorbed in the 9 reactor as well as provides an indication of the reproducibility of the QMS response during the two bypass- and expose-mode intervals. A more complete run, also conducted in the 9" reactor with 2.5% CO,. is shown in Figure 3. This latter plot demonstrates how the QMS response collected as the CO, passes through the bypass reactor (before and after the valve switch) provides a suitable baseline for integration of the ion intensities recorded during passage of CO, through the absorbent bed.
Absorption by hydrated solids. Absorption of COz is shown in Figure 4 as a function of water content. These plots were prepared from runs in which 2-5 g (dry basis) of hydrated sample were exposed to flowing 0 2 (49.6%; -100 mumin) in the 4" X 3/8"-i.d. reactors. In dry form, none of the wastes examined showed a smng affinity for COT However, with addition of H,O, the absorption capacity increased rapidly until the water content was sufficiently high to create a mud- like texture in the waste samples. At the highest moisture levels, absorption capacities declined, presumably limited by sample permeability. Maximum absorption ranged from -1,700 SCF/ton for the FU-FA to -300 SCF/ton for the conml fly-ash sample (L-FA). Limited testing in the 9 reactor showed absorption in excess of 2,000 SCF/ton for the FU-FA sample.
859
Absorption by watedwaste slurries. For the final phase of the study, the ss tube reactors were replaced with a pair of 250-mL gas bubbler/scrubbers. As described earlier, -5 g of solid waste were added to 200 mL of distilled water in the absorbent scrubber (bypass scrubber contained 200 mL of distilled water). The gas blend containing C02, Ar, and CH, (-50:30:20) was bubbled through the water in the bypass reactor during the initial bypass interval then switched to the absorbent sluny for up to one hour before returning to bypass. The QMS data collected during the slurry tests was processed the same as those collected during the hydration studies.
Results from the slurry tests are shown in Figure. 5. Absorption ranged from less than 1.OOO SCF/ton for the L-FA control sample to more than 3,500 SCF/ton for the FU-FA and PP4 samples. These results generally correlate with the free lime data in Table I with the exception of the two samples of bed ash. The significantly larger particle size of the bed ash samples likely limits diffusion of CO, into the particle and explains their lower than expected absorption capacity.
Although removal of CO, was greater in the slurry tests on an absolute basis, neither the rate or level of maximum absorption was as great as measllred for'the equivalent hydrated samples. Slurry runs typically required 10-20 minutes before CO, response returned to 95% of the original level. Further, at maximum absorption, CO, was typically reduced from 49.6% in the feed stream to around 12-15% in the exit stream for the slurry tests as compared to 1% or less in the exit stream for the hydrated-waste tests. However, the shape of the adsorption curves obtained from the slurry tests is thought to be more of a reflection of scrubber design rather than absorption kinetics. It is believed that both kinetics and the maximum level of absorption can be markedly improved with a more efficiently designed bubbledscrubber (smaller bubbles, longer contact time).
Post-run analysis of hydrated solids and slurry waters. Selected samples from the hydration tests were examined by XRD and compared to similar analyses of unexposed samples. The XRD results indicate that the only significant change in mineralogy following absorption was an increase in calcium carbonate (CaC03). There was also a minor increase in etningite, a hydrous calcium sulfo- aluminate phase that can substitute carbonate for sulfate in its structure. However, since the samples remained moisturized following exposure. (i.e., they may continue to react), it is possible that these minor changes occurred after the absorption run and before the XRD analysis. Regardless, it appears that the CO, reacts primarily with available Ca (CaO or Ca(OH),) to form carbonate.
Two of the water samples retained from the sluny tests were analyzed for metalkations content (Table 11). Elemental concentrations are in large part controlled by pH which was >12 for these samples. At such high pH, most transition metals are relatively insoluble. This likely explains why none of the elements tested were detected at levels sufficient to suggest unreasonable disposal problems due to the leaching of toxic elements from the waste samples into the slurry water.
SUMMARY The results obtained in this study clearly show that when hydrated, FGD wastes exhibit a
high affinity for CO,, ranging as high as 3,600 SCF/ton. Further, there are significant differences i n the capacity of FGD wastes generated in different plants to absorb COT With the exception of the larger particle-size bed-ash samples, these differences appear to be controlled by the available lime content of a given waste. This is supported by the free-lime data in Table I and XRD analysis which indicated that the absorbed C02 reacts with free lime to form CaCO,. Thus, dry wastes from less efficient utility scrubbers should produce higher-capacity CO, absorbents. Finally, analysis of the slurry waters suggests that process waters that may be used in a liquid scrubber can be safely disposed following contact with FGD wastes.
ACKNOWLEDGEMENT
Jefferson Gas Transmission for their assistance with this project.
REFERENCES.
The authors would like to thank K. Saw and B. Schram of the UK-CAER and K. Baker of
1. Coal Combustion Byproduct (CCB); Production & use: 1966-1993. Report for Coal Burning Utilities in the United States. American Coal Ash Association. 1995, Alexandria, VA, 68p.
Personal communications with Wiiliam Johnson and associates at NIPER in Bartlesville OK and Tom Cooley with Grace Membrane Systems, Houston, TX.
Taulbee, D. N., Prepr., ACS Div. of Fuel Chem., 1993, 38, # I , American Chemistry Society, Washington, DC, 324-329.
K a n q , D.A., R.M. Stanick. H.Yoon, et& 1990, Coolside Process Demonstration at the Ohio Edison Company Edgewater Plant Unit 4-Boiler 13. Proceedings, 1990 SO, Control Symposium 3, EPRVU.S. EPA, Session 7A,, New Orleans, LA, 1%.
Withum, J.A., W.A. Rosenhoover and H. Yoon, 191 Proceedings, 5& Pittsburgh Coal Conf. University of Pittsburgh, 84-96.
2.
3.
4.
5.
860

J
Table I. Waste samples examined
Table IL Concentration (ppm) of cation/metals in the waters retained from slurry-absorption tests.
,_______________________________.___. . .______.____ Metering Valves -=-
Flow check j Switching valve( I I
Heated valve OW* -> i... . . . .._ __. .. _ _ _ _. . . . .. .. . .. .. . .. . . . . . _._ ~ _ _ __. .
Reactor furnace (above ambient tmp Only)
‘4 ............................................................ ...__.._ Adsorbent reactor
I
1 QMS j
Bypass reactor ._.....__-__._.._.....~~......~.........-..-..~~.....--.~~......~.~...
Figure 1. Schematic of the absorption reactor used for the hydrated samples.
861

I 1 0.4
Time (Min)
Figure 2. CO-JAr ion-ratio curve showing C02/Ar ratios as gas blend is routed through a) bypass reactor, b) absorbent reactor, c) rem to bypass reactor, and d) return to absorbent reactor.
2000 L-Fly Ash
..............
................................................. - ........ -.
......... Y) 0 3 ............................................................. .; 0 o,2 .r ......................................................................................... lo g o .,
OO 40 80 120
Time (Min)
Figure 3. CO,/Ar ion-ratios during run with FU-fly ash in 9" reactors (1.5 g dry FU-FA; 0.58 g H,O; 2.5 mL/min CO,).
oi . IO . io . 30 ' i o Addcd WaIer ( ~ 1 % )
2o00]FU-Eed Ash
Addcd water ( ~ 1 % )
Figure 4. Absorption of CO, by hydrated wastes as a function of water content.
PP3 a-300 PFZ PP4 SD FU-FA CC-FA
Figure 5. CO, absorption by watedwaste slurries. a) Coolside wastes; b) all others.
862

TECHNOLOGIES OF COAL FLY ASH PROCESSING INTO METALLURGICAL AND SILICATE CHEMICAL PRODUCTS
Solomon Shcherhan, Int. Assn. of Science, Inc., 1 I O Bennett Ave., 3H New York, NY 10033; Victor Raizman, Assn. of Engineers & Science, New York;
lliya Pevzner, Coral1 Co. of St.Petersburg Engineer Academy, St.Petersburg
Keywords: coal fly ash, recovery of metals and silica, utilization
ABSTRACT
A study and industrial testing have made for the recovery of aluminum, iron and silica from coal ash, produced by utilities. Alkaline technologies for coal fly ash processing were developed that made it possible to separate the main components of fly ash (SiO, , AI,O,, Fe,O,) and utilize them separately, producing a large variety of useful products. Some of these technologies have already been successfully tested in pilot programs.
INTRODUCTION
The problem of effective utilization of solid waste from coal-fired power plants is of great im- portance to many countries. The coal burning utilities of the former Soviet Union generate more than 100 million tons of solid combustion by-products each year. Approximately 1 billion tons of solid waste from utilities is placed in storage and disposal areas. The combustion of coal by utilities in the United States results in the production of over 80 million tons o f solid by-prod- ucts each year yet less than a quarter of coal ash is presently being utilized [l].
The various fields of fly ash application are known [I-31. In the former Soviet Union much at- tention has been given to the area of research that is called 'High Technology Ash Application' in the United States [ I ] . This research focuses on the development of technologies for ash process- ing with recovery of valuable minerals and metals in particular for the recovery of aluminum. The necessity of this research is caused by the need to find new ways for the utilization of fly and bottom ash and simultaneously to solve the problem of expanding the source of raw materi- als used in aluminum industry.
Ash contains approximately 1.5-2 times less aluminum oxide than common aluminum raw mate- rials (20-35% A120, in ash as compared to 50-62% A1203 in bouxite). The high level of silica in ashes (40-65% SO,) makes it impossible to process them by the easiest and the most economi- cal Bayer method and by the other methods of direct alkaline alumina extraction. Therefore for ash processing other methods are studied: acid, thermal, thermal reducing, electrothermal melt- ing, new alkaline methods.
This paper is dedicated to the development of alkaline methods of ash processing. The labora- tory research of alkaline methods of fly ash processing have been done at the Problem Labora- tory of Recovery of Light and Rare Metals (Kazakh Politechnical University, Alma-Ata). Large- scale testing of the alkaline technologies has been conducted at the pilot plants of the All-Union Aluminum-Mapesium Institute (VAMI, St.Petersburg), State Research and Designed Cement Institute (GIPROCement, St.Peterburg), and the Institute of General and Inorganic Chemistry (Erevan).
EXPERIMENTAL
Chemical and Mineralogical Description of Ash Samples
Chemical analysis of typical fly ash derived from Ekibastuz coal are given in Table 1
Table 1
CHEMICAL ANALYSIS (Wt.%) OF FLY ASH
power C o n s t i t u e n t plant SiO, AI,03 Fe,O, Ti 0, CaO MgO Na20 K 2 0 LO1 Total
pavlodar 59.82 27.79 5.48 1.65 1.20 0.72 0.40 0.62 4.50 97.68 Emak 60.50 27.20 5.05 1.90 1.60 0.58 0.30 0.60 4.00 97.73 Troitsk 58.48 30.21 4.78 1.95 1.12 0.66 0.30 0.55 0.80 98.05
The major constituents of the Ekibastuz ashes are silicon dioxide, aluminum oxide and iron ox- ide which represent about 9044% of the total. Ekibastuz fly ash is characterized by low content ofNa20 and K,O (<= 1%) and CaO and MgO (1.78-2.2).
The mineral part of Ekibastuz coal is represented by kaolinite (60-68%), quartz (27-30%), sider-
/
863

ite (34%), calcite (2.5-3%), magnesite (l-l.5%) and gyps (0.3-0.5%). At burning of coal the mineral part of it is subjected to a short termed influence of high temperatures, which results in kaolinite decomposition, formation of mullite and glassy phase, thermal1 dissociation of carbon- ate, polymorphous conversion of quartz into high temperature modification of silica. All these transformations predetermine the mineralogical composition of ash (Table 2).
Table 2 MINERALOGICAL ANALYSIS OF SILICON AND
ALUMINUM CONTAINING MINERALS IN EKIBASTUZ ASH
Mineral Mass. Yo A n a l y s i s Name in Ash Crystal Optics X-Ray Diffraction IR-spectroscopy
d,A v, cm-' ~ ~~ ~~~
Mulite 30-35 n,=1.666, n,=1,654 5.45; 3.41; 3.36; * a - np= 0.012 2.88; 2.55; 2.21;
Glassy 48-51 I . N=1.503 Amorphous 1100-1050; Phase 2. N=1.534-1.539 Amorphous 780; 475;
Quartz 2-10 Ng=1.544; Np=1.531 4.27; 3.78; 2.44 I 160; 1095; 2.28; 2.23; 1.82 800-790; 465;
Righ 0-45 No=1.486; Ne=1.454 4.09 (intensive); 1160; 1100; Temperature No - Ne = 0.002 2.51; 2.88 975; 820; Silica
- -~ -_ -. .. __-- ~ _ _ * The absorption regions of mullite appear after dissolving the uncombined silica of ash.
As it follows from Table 2 Ekibastuz ash basically consists of glassy phase (SiO, and SiO, with admixtures), mullite (3 AI,0,.2SiO2) and quartz (SO,). Well calcinated ash (Troitsk) contains a high temperature crystalline modification of silica with properties close to crystobalite.
Most important for the alkaline methods of ash processing is the process ofkaolinite decomposi- tion with the formation of mullite and the isolation of the most part of silica in an uncombined (free) form. This process is described by the summary reaction:
3[A12Si,0,(OH),]------->3 A1,03.2Si0,+4Si02+6H,0 kaolinite mullite silica
As a result of this reaction aluminum is concentrated in mullite and about 67% of the kaolinite silica is isolated in a free form. Together with silica of quartz and its high-temperature modifi- cations about 70-80% of silica is contained in the ash in the free form. This creates the neces- sary prerequisites for aluminum oxide and silicon dioxide separation. Stated phase separation of aluminum oxide and silicon dioxide in ashes came to be a basis for research and the develop- ment of alkaline methods for ash processing [4].
Interaction between Ash Minerals and Alkaline Solutions
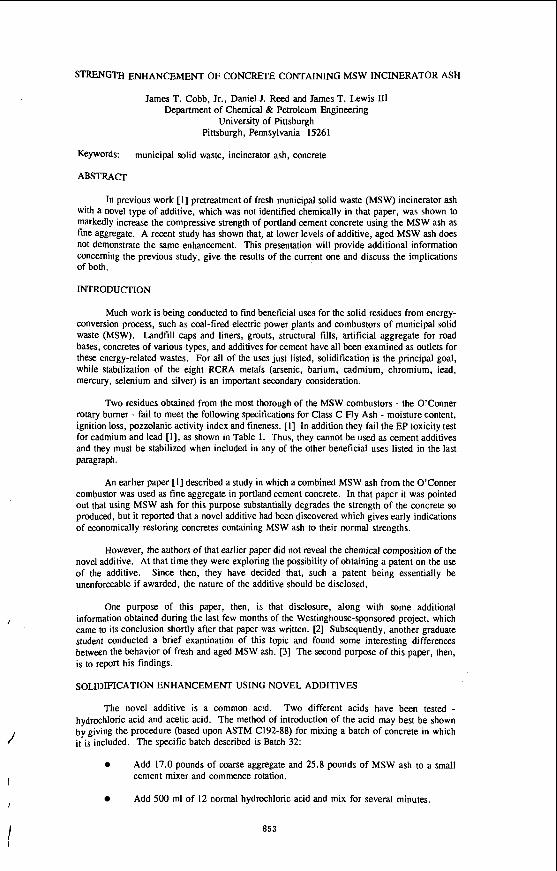
According to the data of mineralogical analysis (Table 2) mullite, glassy phase, quartz and its high temperature modification-crystobalite are the main aluminum and silicon containing ash minerals. The comparison of these minerals dissolubility in the alkaline solution is shown in Figure I .
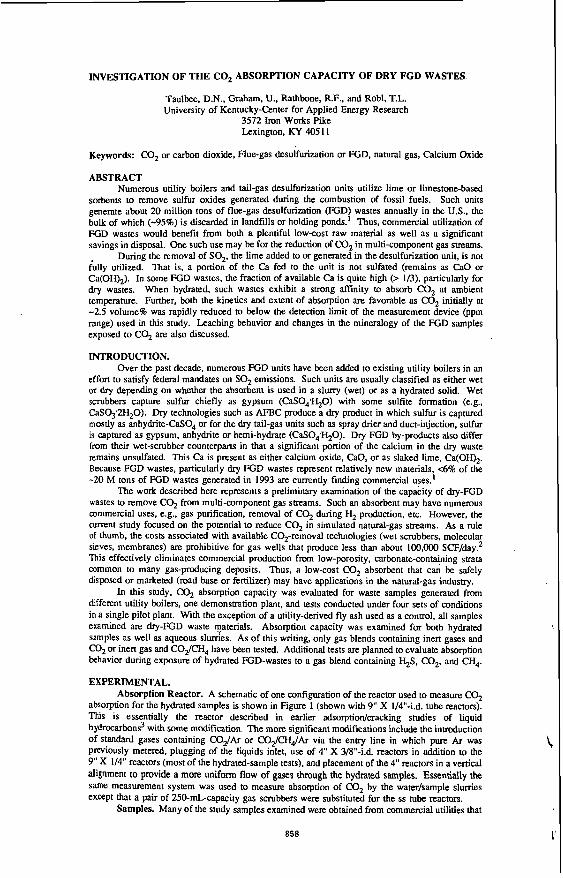
The comparison of the curves (Figure I ) shows that mullite ( I ) and quartz (2) have a small dissolubility in alkaline solution while crystobalite ( S ) dissolves practically completely after 4 hours of alkaline treatment at I05C [5]. The glassy phase (3) also has good disolubility in alka- line solution. Its presence and dissolution are determined by a comparison of IR-spectra of ash (Figure 2) and its residue after alkaline treatment. IR-spectra of ash (Figure 2.1) contain the absorption regions 1100 and 800-780 cm-' which are the characteristic regions of silicates like quartz, crystobalite, and amorphous silica with three- dimensional tetrahedrons of SiO, frame. In the IR-spectra of residue after ash alkaline treatment (2) the regions of quartz, glass and crystobalite have completely or partially disappeared and ab- sorption regions of mullite ( 1 180,970-920, 880-850 cm" ) have appeared.
XRD analysis of residue after alkaline ash treatment reveals the complete disappearance of
864
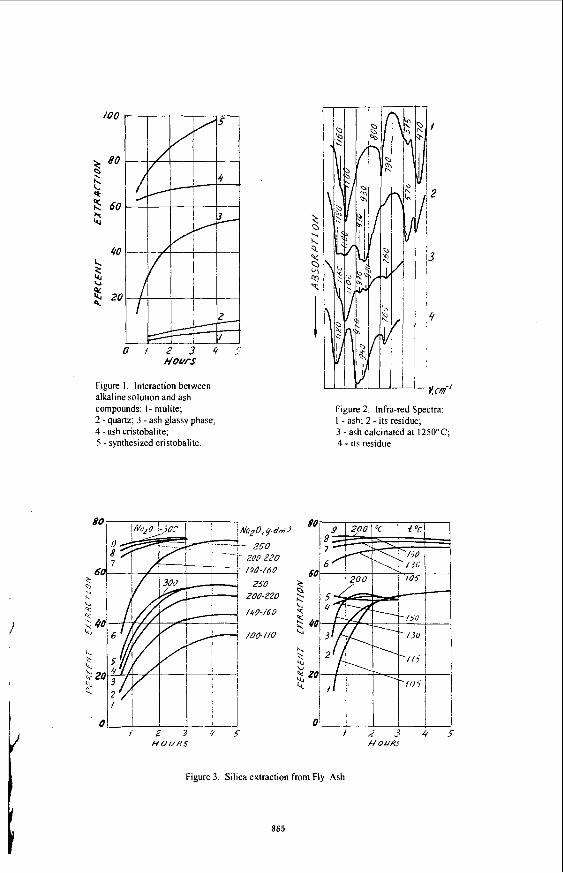
Figure 1. Interaction between alkaline solution and ash compounds: I - mulite; 2 - quartz; 3 - ash glassy phase; 4 -ash cristobalite; 5 - synthesized cristobalite.
n o NRS
Figure 2. Infra-red Spectra: I - ash; 2 - its residue; 3 - ash calcinated at 1250°C; 4 - its residue.
BO
60
40
0 t 2 . ? 4 5
,4 OUR5
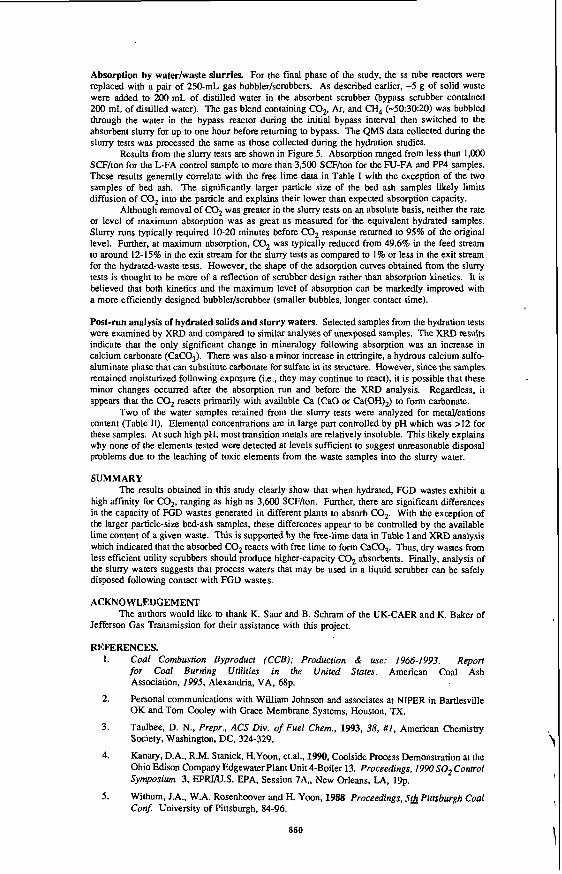
Figure 3. Silica extraction from Fly Ash
865

crystobalite maxima d,A: 4.09-4.10; 4.52; 3.51 which is well coordinated with the data of crystobalite alkaline dissolubility (Figure I). The aforementioned data of chemical, XRD, and IR-spectroscopy research shows that uncombined (free) ash silica is extracted from ash by the alkaline solution.
Hydroalkaline Recovery of Silica from Fly Ash
The influence of various factors on the percentage of silica extraction from fly ash is shown in Figure 3.
The data in Figure 3 shows that free silica is extracted from ash at low rates (temperature 105.C for a duration of 3-4 hours). The process can be realized at atmospheric pressure. The essential augmentation of silica recovery has been reached by means of ash activation which increased the eficiency of silica extraction by 12-20% (Figure 3, curves 6-9).
The intermediates after ash hydralkaline treatment were the silica alkaline solution (SAS) and the solid residue enriched by aluminum oxide (concentrate of alumina). Chemical composition of SAS , gdm-': Na,0=160-220; Si0,=100-250; AI,03=2-7; Fe,O,=O. 1-0.9. Concentrate of alumina included %: 44-55 AI,O,; 30-27 SO,; 5.5-10 Fe,O,.
Recovery o f Iron from Fly Ash by Magnetic Separation
In a number of studies, magnetic separation was applied as a pre-stage before the main opera- tions of ash treatment[6]. Ekibastuz ash consists of 4-lO% Fe (as Fe,O,). The possibility of re- covering the magnetic fraction from Ekibastuz ash and its classified fractions was shown in [7]. The mabmetic fractions after raw ash magnetic separation were rich in Fe (60-62% as Fe,O,). Classified fractions contained 57.6-66.4% Fe as Fe,03. Output of the magnetic fractions was 2.12-5%. The non-magnetic residues were depleted of Fe and contained 2.6-3.6% Fe as Fe,O,.
Technology of Alkaline Fly Ash Processing. The Principle Process Flow Sheet
The described findings of hydroalkaline recovery of silica were taken as a basis for the design of the process flow sheet of fly ash processing into metallurgical, silicate chemical products and building materials. The principle flow sheet (Figure 4) includes the hydroalkaline silica extrac- tion from fly ash. This operation allows one to extract the good part of ash silica (60-77%) into the alkaline solution and then to process it into various silicate chemical products (sodium and calcium metasilicates, sodium-silicate mixtures, amorphous and crystalline silica and others). The solid intermediates from ash extraction-alumina concentrate-can be processed into alumina, aluminum, and aluminates by thermal or hydrochemical alkaline methods or can be used for aluminum-silicon alloys, refractories, and concrete production. Mud of the alumina production is a valuable raw material for cements.
t i p Fe - CONCENTRATE HYDR~ALK KINE SILICA EXTRACTION
F ALUMINA SILICATE ALKALINE
SOLUTION M
PROCESSING INTO REGENERATION PURE SILICATE PRODUCTS: I SILICATES, SILICA, ZEOLITES,
ALUMINA WHITE SOOT, COMPONENTS PRODUCTION FOR GLASSES, CERAMICS, I CEMENT AND OTHER
variants - invariable operation
ALLOYS REFRATORIES BUILDING MATERIALS
ALUMINA
C E ~ E N T
Figure 4. Flow sheet for alumina, silica and iron recovery from ash
866

Large -Scale Testing of the Alkaline Technologies
Practically all of the main technological operations of the fly ash processing have been tested in pilot programs: ash activation, hydroalkaline silica extraction, settling and filtration of ash pulp, washing of the alumina concentrate, processing it into alumina, producing of portland cement from mud, silica alkaline solutions processing into sodium and calcium metasilicates. Alumina Output was made up of 86% A1,0, (90-91.7% at the standard leaching).
REFERENCES
I . Golden D.M. 'Research to Develop Coal Ash Uses.' Ninth International Ash Use Symposium. Proceedings. Orlando, Florida, January 22-25, 1991. .
2. Shpirt M.Y. 'Nonwaste Technology: Utilization of Waste from Mining and Processing of Solid Combustible Fossils. Moscow: Entrails' 1986.
3. 'The Combined utilization of Coal Ash of the SSSR in the National Economy', Abstracts, Meeting, Irkutsk, Russia, 11-13 July, 1989.
4. Shcherban SA., Nurmagambetova S.Kh. 'The Combined Utilization of Coal Ash of the SSSR in the National Economy', Abstract, Meeting, Irkutsk, Russia, 11-13 July, 1989, p.91
5. Suliaieva N.G., Shcherban S.A., Tazhibaeva S.Kh, Romanov L.G. 'Combined Using of Min- eral Row Materials' Periodical. 1982, #3, pp.62-66, Alma-Ata (Russian)
6. Hemmings R.T., Beny E.E. and Golden D.M. 'Direct Acid Leaching of Fly Ash: Recovery of Mettals and the Use of Residues as Fullers'. Eight International Coal Ash Utilization Sym- posium, Washington D.C., October 29-31, 1987, p.38-A
7. Shcherban S.A., Sadykov Zh.S.,Pustovalova L.S., Ergaliev G.B., Fridman S.E. 'Ekibstuz Ash Processing into Alumina with Iron Concentrate Production'. Combined Using of Mineral Raw Materials. Periodical, 1985, N4, pp.68-71, Alma-Ata (Russian)
I
J
I 867

CHARACTERIZATION OF PYROLYSIS OILS OBTAINED FROM NON-CONVENTIONAL SOURCES
J. Houde Jr., J.-P. Charland, Energy Research Laboratories, CANMET, Natural Resources Canada, 555 Booth St., Ottawa, Ont., Canada, KIA OGI. E-mail: jean.houdeQx400.emr.ca
Keywords: pyrolysis oil, automobile shredder residue, pulp and paper sludges
INTRODUCTION
The effluents of pulp bleaching are the main problem of wastewater disposal faced by the pulp industry because of their non-biodegradability. Today the demand for quality discharges requires better methods than conventional biological processes. The changes recently proposed to the federal regulations for controlling discharges from pulp and paper industry operations in Canada have required many operations to install secondary biological effluent treatment process. Such treatment often produce sludges that must be removed from the system and disposed of routinely, usually daily or weekly. At present, Ontario and Quebec have the strictest solids disposal regulations in Canada, with leachate critena that approximate the U.S. Environmental Protection Agency (EPA) toxicity characteristic leaching procedure (TCLP) standard [l]. Most pulp and paper mills in the U.S. have some form of biological treatment, the majority having their own treatment plants, but some are tied into publicly owned treatment plants. Of those which have their own treatment plants, two thirds have aerated stabilization basins and one third have activated sludge [2].
Industrial wastewater secondary treatment using activated sludge techniques has gained increased acceptance in the paper industry. The advantages of activated sludge treatment over conventional aerated lagoons are less real estate requirement, less odour emissions, lower capital cost and higher sludge treatment efficiency [3]. One of the main disadvantages is the production of a large amount of sludge which is difficult to dewater and costly to dispose of. The Canadian pulp and paper industry produces about 2,200 t/d of sludge from wastewater treatment operations. Most of this sludge is produced in wood room or primary clarifiers treating total mill effluents. Approximately 54% of this total is incinerated, with most of the balance being landfilled [4]. Long term environmental uncertainties associated with landfilling, as well as increasing costs and a drive to greater energy efficiency, nuke it preferable to use the sludge.
When old cars and trucks are sent to scrap yards for shredding to recover ferrous and non- ferrous metals, large quantities of non-metallic waste, referred to as autofluff, are generated. Autofluff is a lightweight mixture of plastics, textile, glass, rubber, foam, paper and rust. Also, this material is contaminated with oils, lubricants and other fluids used in automobiles. The trend to substitute lightweight materials for iron and steel reduces the proportion of recycled metals and increases the amount of waste produced [5-81. The economics of the shredding industry relates to the recovery and resale of the ferrous metal which is used to produce high quality steel. Over the years, the use of ferrous metals in automobiles has declined whereas that of plastics and non- ferrous metals has increased. There is a clear economic and environmental advantage to salvaging cars, since metals can be utilized that would otherwise end up as trash. In 1992, in Canada, one million cars and trucks were sent to scrap yards, while in the U.S., 11 million vehicles were taken off the road [71. Autofluff production is estimated at 1,80O,O00 and 2,860,000 t/a, respectively for Canada and the U.S., most of which ends up in landfill sites.
Of the various disposal alternatives, conversion of these materials by pyrolysis or other proven technology to possible value-added products would reduce the use of costly landfill sites for disposal and utilize this potentially valuable resource. The Wastewater Technology Centre (WTC) of Environment Canada has been developing one such technology since 1982. The thermoconversion process involves low temperature treatment of materials such as sludge from the pulp and paper industry or autofluff, to produce liquid'and solid fuel products. A key technical feature of this conversion is the formation of a byproduct oil referred to as pulp and paper sludge derived oil (PPSDO) or autofluff oil. The thermal conversion process has been extensively described elsewhere [9-111.
In 1992, Enersludge Inc., WTC and CANMET's Energy Research Laboratory (ERL) of Natural Resources Canada undertook a joint R&D program. ERL investigated pyrolysis oils obtained from autofluff and pulp and paper mill sludges. .Analytical results are presented as well as a comparison of these oils with those obtained from tires and municipal sewage sludge.
EXPERMENTAL A set of samples was received for each pyrolysis experiment (PPSDO and autofluff oils). The
first samples received included compounds with boiling points up to 150°C (-150°C) whereas the second samples contained compounds boiling above 150°C (+150°C). The +150°C samples
868

I
/
were funher distilled to yield three additional fractions each. Fractionation was performed using automated ASTM D-1160 short path distillation apparatus. Fraction cuts were selected to reflect conventional cut points from the petroleum industry:
b 15O0C-35O"C - typical cut point for middle distillates w 350°C-525"C - typical cut point for heavy gas oils b +525"C - usual distillate-residue cut point
Physical and chemical analyses were performed according to appropriate ASTM methods.
The 'H, DEFT I3C and I3C data were acquired on a VARIAN XL300 operated at 300 MHz h the 'H mode and 75 MHz in the 'F mode. The pulse sequence in D E m experiments transfers the polarization of the hydrogen to the carbon nucleus to selectively increase its signal. The polarization transfer effect is dependent on the number of hydrogens bonded to a given carbon nucleus. This technique is used to distinguish between primary, secondary, tertiaty and quaternary carbon atoms. The NMR spectra are presented in Fig. 1.
Infrared spectra were obtained using a PC-driven BOMEM MBlOO Fourier transform infrared (WR) spectrometer fitted with a standard sample mounting device. The IR spectra from liquids were collected using *a liquid cell fitted with a 13-mm diam circular window. The liquid cell windows are made of KBr and are separated by 0.02 mm. The spectra of the 350°C-525"C colloidal fractions were collected using the smearing technique on conventional 13-mm circular KF3r discs. The IR spectra are presented in Fig. 2.
GUMS work was performed on a Hewlett Packard 5890 GC coupled to a medium resolution mass spectrometer (MS). Chromatographic separation of the sample was done using a Hewlett Packard HP-1 30 m long methyl-silicon bonded fused silica capillary column of medium resolution fitted on the GC. This column is used for separating molecular components in a mixture based on their boiling point. The samples were injected in the GC at 35°C then heated to 200°C at 5"CImin. The temperature was maintained for 10 min at the end of the temperature profile. The chromatographed compounds were identified through a MS data library search.
RESULTS AND DISCUSSION
The +150"C liquids resembled light molasses, similar to a vacuum tower gas oil from a petroleum refinery. The -150°C materials were brown liquids. All samples had an odour characteristic of burnt organic matter. The lower boiling products had the strongest odour. The -150°C oils and the 15O0C-35O0C fractions were characterized by IR, 'H & I 3 C NMR and GCIMS.
Table 1 summarizes the fractionation results for the PPSDO and autofluff samples. For comparison, literature data for a tire oil are also included. With an initial boiling point (IBP) of 155"C, the fractionation of the + 150°C autofluff sample yielded 90 wt % of distillate composed of 37 wt % in the middle distillate range and 53 wt % in the heavy gas oil range. This range is similar to that of a typical petroleum sample. The PPSDO + 150°C sample had an IBP of 102°C and 76 wt % distillate of which 49 wt % was in the middle distillate range and 27 wt % in the heavy gas oil range. Fractionation of the autofluff sample produced more distillate of a heavier nature than the PPSDO. When compared to tire oil, these oils had higher IBPs because they were condensed at a set temperature whereas the tire oil was not. Therefore we cannot compare the distillate yields further.
During fractionation of the PPSDO +15O"C sample, the maximum distillate temperature was 501°C due to the limitation of the pot temperature (4OOOC) from the automatic apparatus used for the distillation. The material loss was 6.0 wt % due to distillate that was trapped in the column and in the condenser. The trapped distillate was so waxy that heating the condenser to a maximum temperature of 80°C in order to recover some distillate was unsuccessful.
The samples were also analyzed using a series of tests commonly used for fuel analysis. Table 2 shows the results as well as literature data for sludge derived oil (SDO), tire oil, N o 2 diesel fuel and No.6 fuel oil. The heat of combustion values for the sludge derived materials namely, PPSDO and SDO, are significantly lower, and their densities at 15°C are higher than the corresponding values for the autofluff oil, tire oil and the two fuels.
Table 2 also gives elemental analysis of the samples. Clearly, PPSDO and SDO produced oils having a lower carbon content. However, their HIC ratios are still comparable to the other data mainly due to their lower hydrogen content. Heteroatom levels, particularly N and 0, are very high when compared with the other oils. Pour points of these pyrolysis oils fall in the fuel oil range and are much higher than diesel oils.
Figure 1 shows the proton-decoupled I3C NMR spectra of two autofluff and two PPSDO oil fractions. The spectrum of the -150°C autofluff fraction exhibited a signal at 45 ppm associated with the -CH,-O- group, an assignment confirmed by I3C DEFT NMR (not shown). This
869
functional group is absent in the -150°C PPDSO fraction. The spectrum of the -150°C PPSDO fiaction shows a signal at 182 ppm assigned to COOH carbons. No carbonyl signal was observed in the C = O region of the -150°C autofluff fraction spectrum.
A comparison of the NMR spectra of the high boiling point fractions in Fig. 1 revealed significant differences. The spectrum of the PPSDO fraction shows many signals in the 170- 180 ppm region due to various -COO(R,H) carbons. No signal was observed in the -COO- region of the autofluff fraction spectrum. Signals in the 150-160 ppm range on both spectra are due to the oxygen-bonded aromatic carbon in phenols. Signals in the 110-115 ppm region on the autofluff spectrum were assigned to terminal =CH,'s in olefinic structures by I3C D E W NMR.
Figure 2 shows the infrared spectra of selected autofluff and PPSDO fractions. The PPSDO spectra display absorptions in the 3200-3600 cm-' region which are more intense than in the autofluff fractions. This intensity also is accompanied by stronger and more complex carbonyl vibration band patterns in the PPSDO's than in the autofluff spectra. This indicates and confirms the presence of carboxylic acids suggested by NMR. Another difference between these two types of oils can be observed in the autofluff fraction spectra which display weak but well resolved olefinic and aromatic =C-H stretching and bending mode bands. This suggests the presence of significantly higher amounts of aromatic and olefinic compounds in the autofluff oil fractions.
Table 3 lists GUMS derived compound type distributions in the low and high temperature PPSDO and autofluff oil fractions. Table 3 indicates that:
1) PPSDO fractions contained carboxylic acids; 2) autofluff fractions are more aromatic and olefinic than PPSDO fractions; 3) low temperature fractions are more aromatic than high temperature fractions; 4) high temperature fractions contain more alcohols than low temperature fractions; 5) high temperature PPSDO fraction contains a significant amount of nitriles.
CONCLUSIONS
Our study has shown that pyrolysis oils and their derived fractions are very complex mixtures of compounds including significant proportions of aromatics and olefins as well as nitriles, alcohols and ketones. In addition, carboxylic acids were found in PPSDO. Pyrolysis oil's heat of combustion and density values fall within the normal fuel oil range.
The high content of olefins and aromatics of these oils and their high HIC ratios would suggest possibilities as feedstocks for low cost, large volume surfactant utilization. The surfactants could be produced by sulphonation or sulphation reactions. A large-scale use would be for enhanced oil recovery for both conventional and heavy oil/bituminous sands and for cleaning heavy bunker oil pipelines. Also for PPSDO, polymerization in asphalt could be performed to improve asphalt cement quality for adhesion to aggregates due to its high nitrogen content.
The low sulphur content and the high heating value of the autofluff sample suggest it could be utilized as a liquid fuel, possibly by blending it with fuels of petroleum origin in order to lower the sulphur level. While the autofluff oil cannot be considered as a diesel fuel, it could be considered as a blending agent for use with a No.6 fuel oil. The autofluff characteristics resemble those of the No.6 fuel oil more than those of diesel.
'
ACKNOWLEDGEMENTS
The authors wish to thank WTC for its financial and technical support and the assistance in interpreting the results of this work. The authors acknowledge the technical assistance and contributions of the staff of the Fuel Quality Assessment Section and Dr. Heather Dettman and Mr. Gary Smiley for providing the NMR and GUMS spectra, respectively. Federal support of this work was provided through the Federal Program on Energy Research and Development (PERD).
REFERENCES
I . Crawford, G.V., Black, S., Miyamoto, H. and Liver, S. , "Equipment selection and disposal of biological sludges from pulp and paper operations", PUID & Paoer Canada 94:4:37-39, April 1993. Springer, A.M. "Bioprocessing of pulp and paper mill effluents - past, present and future", Paoeri ia DUU DaDer and timber 75:3:156-161, 1993. Gamer, J.W. "Activated sludge treatment gains popularity for improving effluent,
Salib, P. "Evaluation of circulating fluidized bed combustion of pulp and paper mill sludges", Contract m o r t Bioenerm DeveloDment Proeram DSS Contract No.: 23216-8-9056/01SZ. RPC, Fredericton, NB, Canada, October 1991. Day, M. "Auto Shredder Residue - Characterization of a solid waste problem", NRCC Soecial Reoort EC123992.3, NRC Institute for Environmental Chemistry, 1992.
2.
3.
4. 64:2:158-163, February 1990.
5 .
870
a

6. Voyer, R. "Etude technico-iconomique et environnementale des pmCdis de traitement de risidus des carcasses d'automobiles", CRIO Report VPOIT-91-098, Centre de recherche industrielle du Quibec, 1992. Pritchard, T. "The over 75% solution", Globe and Mail Reoort on Business, December 1992 issue. Braslaw, J., Melotik, D.J., Gealer, R.L. and Wingfield, Jr, R.C. "Hydrocarbon generation during the inert gas pyrolysis of automobile shredder waste", Thermochimica Acta 186: 1:l- 18, 1991. Martinoli, D.A. "Converting sewage sludge into liquid hydrocarbon - the OFS process", Hydrocarbon Residues and Waste: Conversion and Utilization Seminar, Edmonton, Alberta, Canada, September 4-5, 1991.
10. Campbell, H.W. and Bridle, T.R. "Sludge management by thermal conversion to fuels", Proc. New Directions and Research in Waste Treatment and Residuals Management, Vancouver, 1985.
11. Campbell, H.W. and Martinoli, D.A. "A status report on Environment Canada's oil from sludge technology", hoc . Status of Municipal Sludge Management for the 1990% WPCF Specialty Conference, New Orleans, 1990.
12. Mirrniran, S., Ph.D. Thesis, Department of Chemical Engineering, UniversitC Laval, Quebec, Canada, 1994.
13. Kriz J.F. et al. "Characterization of sludge derived oil and evaluation of utilization options", Division Report ERL 90-50 (CF), November 1990.
14. Kirk-Othmer Encyclopedia of Chemical Technology, 3rd Edition, vol. 11, John Wiley &
15. Personal communication, September 1993.
7.
8.
9.
sons, p. 357.
Table 1 - D-I160 fractionation results of pyrolysis oil samples.
Frac t i on PPSDO A u t o f l u f f T i r e o i l ' IBP ("C) 102 155 37 1BP-350"C (wt X ) 49 37 56 350°C-5250Cz ( w t X ) 27 53 37 Total (IBP-525"C) (wt %) 76 90 93 Residue (+525"C) ( w t X) 18 8 7 Loss ( w t X ) 63 2 nla' Water ( w t I) t r ace 0 n/a
Table 2 - Physical and chemical analysis data of pyrolysis oil samples and petroleum fuels.
Analysi S PPSDO Autofluff SLN5 T i r e o i l ' No.2 No.6
Calorific value (MJIk9) 32.1 41 8 35.3 43 44.9 42.3 (1000 btu / lb ) 13.8 18.0 15.2 18.5 19.3 18.2
Density @ 15°C (k91m3) 1073.2 931.1 <lo02 nla 864.1 980 Elemental analysis (%)
Diesel Fuel o i l 6
Carbon 68.1 83.3 72.4 85.9 86.9 85.7 Hydrogen 8.99 11.4 9.88 10.6 12.4 10.5 Nitrogen 8.82 1.50 6.35 1 4 n la 2.0 Oxygen 12.6 3.2 10.8 1 2 n t a n la Sulphur 0.39 0.5 1.11 0.9 0.44 0.5-3.5
H/C r a t l o 1.6 1.6 1.6 1.5 1.7 1.5 pour po in t ("C) 6 >24' 0 -6 -40 0
' Data from reference [12] * End-point for distillation of PPSDO: 501°C and for tire oil: 469°C
Large loss due to distillate trapped in column and condenser nla: not available Data from reference [I31 Data from references [14-15]
as > 2 4 T ' Film formed on top preventing pouring of sample. Thus the pour point was reported
811 Y

Table 3 - Compound type distribution in selected pyrolysis oil fractions by GUMS.
Compound type -150°C -150°C 102-350°C 150-350°C PPSDO AUTOFLUFF PPSDO AUTOFLUFF
Alcohols 8 .8 10.8 14.7 12.6 A1 dehydes 3.7 0.5 1 . 3 Amines 2.4 3.2 0.9 Amides 3 . 1 2.7 1.1 Aromatics 10.2 48.7 5.2 18.2 Carboxyl ic ac ids 27.8 6.0 Epoxides 0 .6 Esters 0 .5 0.2 ' 0 . 4 Ethers 0.8 1.2 0.5 Heterocyc l ics 5.7 7 . 1 2 .3 Ketones 2 . 8 6.8 4.4 5.1
N i t r o 0 .1 O le f i ns 11.7 14.9 6.6 24.0 Para f f i ns 14.6 9.7 8.9 29.5
Tota l 89.5 100.1 78.2 98.7
N i t r i l e s 1 . 6 5.0 17.4 2.2
, , I &-I5OoC(A)
Fig. 1 - "C NMR regions (0-60 and 100-200 ppm) of selected autofluff (A) & PPSDO (p) fractions.
Y 4000 3500 3000 2500 2000 1500 1000 500 1
W o v e n u m b e r s (cm- 1 )
Fig. 2 - IR spectra of selected autofluff (A) & PPSDO (p) fractions
a n
CATALYTIC PYROLYSIS OF AUTOMOBILE SHREDDER RESIDUE
/
I
Gregory G. Arzoumanidis. Michael J. McIntosh, Eric J. Steffensen. Matthew J. McKee, and Timothy Donahugh
Energy Systems Division, Building 362 Argonne National Laboratory
Argonne, Illinois 60439
Keywords: Catalytic Pyrolysis, Plastics, Automobile Recycling
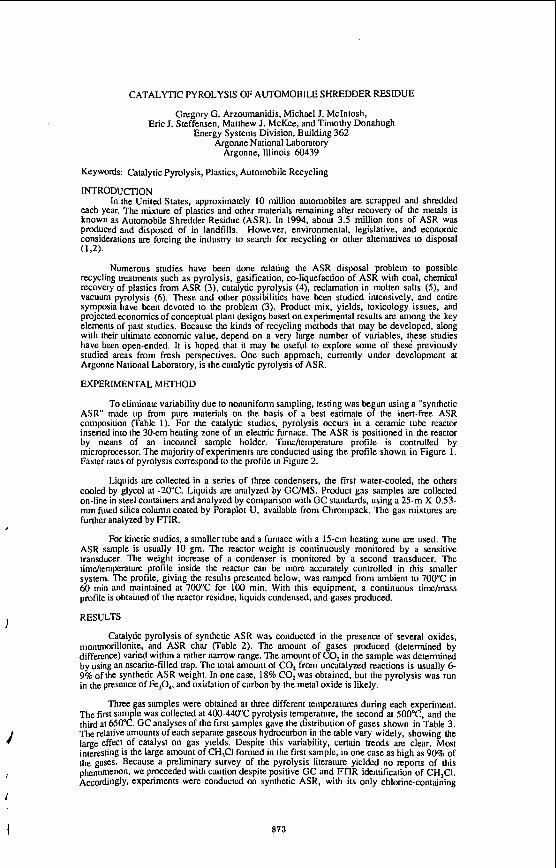
MTRODUCTION In the United States, approximately 10 million automobiles are scrapped and shredded
each year. The mixture of plastics and other materials remaining after recovery of the metals is known as Automobile Shredder Residue (ASR). In 1994, about 3.5 million tons of ASR was produced and disposed of in landfills. However, environmental. legislative, and economic considerations are forcing the industry to search for recycling or other alternatives to disposal (1.2).
Numerous studies have been done relating the ASR disposal problem to possible recycling treatments such as pyrolysis, gasification, co-liquefaction of ASR with coal, chemical recovery of plastics from ASR (3). catalytic pyrolysis (4). reclamation in molten salts (5 ) . and vacuum pyrolysis (6). These and other possibilities have been studied intensively, and entire symposia have been devoted to the problem (3). Product mix, yields. toxicology issues, and projected economics of conceptual plant designs based on experimental results are. among the key elements of past studies. Because the kinds of recycling methods that may be developed, along with their ultimate economic value, depend on a very large number of variables, these studies have been open-ended. It is hoped that it may be useful to explore some of thesd previously studied areas from fresh perspectives. One such approach, currently under development at Argonne National Laboratory, is the catalytic pyrolysis of ASR.
EXPERIMENTAL METHOD
To eliminate variability due to nonuniform sampling, testing was begun using a "synthetic ASR" made up from pure materials on the basis of a best estimate of the inert-free ASR composition (Table 1). For the catalytic studies, pyrolysis occurs in a ceramic tube reactor inserted into the 30-cm heating zone of an elecmc furnace. The ASR is positioned in the reactor by means of an inconnel sample holder. Tiiidtenipenture profile is controlled by microprocessor. The majority of experinients are conducted using the profile shown in Figure 1. Faster rdtes of pyrolysis correspond to the profile in Figure 2.
Liquids are collected in a series of three condensers, the first water-cooled, the others cooled by glycol at -20°C. Liquids are analyzed by GC/MS. Product gas samples are collected on-line in steel containers and analyzed by comparison with GC standards, using a 25-m X 0.53- mm fused silica column coated by Poraplot U, available from Chrompack. The gas mixtures are further analyzed by FTIR.
For kinetic studies, a smaller tube and a furnace with a 15-cm heating zone are used. The ASR sample is usually 10 gm. 'Ihe reactor weight is continuously monitored by a sensitive transducer. The weight increase of a condenser is monitored by a second transducer. The time/iemperature profile inside the reactor can be more accurately controlled in this smaller system. The profile, giving the results presented below, was ramped from ambient to 700°C in 60 min and maintained at 700°C for 100 min. With this equipment, a continuous time/mass profile is obtained of the reactor residue, liquids condensed, and gases produced.
RESULTS
Catalydc pyrolysis of synthetic ASR was conducted in the presence of several oxides, monrmorillonite, and ASR char (Table 2). The amount of gases produced (determined by difference) varied within a rather narrow range. The amount of CO, in the sample was determined by using an ascarite-filled trap. The total amount of CO, from uncatalyzed reactions is usually 6- 9% of the synthetic ASR weight. In one case, 18% CO, was obtained, but the pyrolysis was run in the presence of Fe,O,, and oxidation of carbon by the metal oxide is likely.
Three gas samples were obtained at three different temperatures during each experiment. The first sample was collected at 400-440"C pyrolysis temperature, the second at 500"C, and the third at 650°C. GC analyses of the first samples gave the distribution of gases shown in Table 3. The relative amounts of each separate gaseous hydrocarbon in the table vary widely, showing the large effect of catalyst on gas yields. Despite this variability, certain trends are clear. Most interesting is the large amount of CH$I formed in the fust sample, in one case as high as 90% of the gases. Because a preliminary survey of the pyrolysis literature yielded no reports of this phenomenon. we proceeded with caution despite positive GC and FTIR identification of CH,CI. Accordingly, experiments were conducted on synthetic ASR, with its only chlorine-containing
873

material, PVC, removed. These tests produced essentially no CH,CI. In these experiments, CH, in the frst gas sample was at its highest level (23%). It was also found that addition of NaCO, to the pyrolysis reaction reduces CH,CI formation and increases the level of CH, in the fmt stage. Given these results, the information in Table 3 offers several clues concerning the mechanism and kinetics of ASR pyrolysis. These are discussed below. Interestingly, the relative amounts of the pyrolysis gases from the second (500°C) and third (650°C) samples do not change appreciably, as indicated in Table 4. Changes in the relative amounts of the gases during the duration of the pyrolysis are estimated in Figure 3. This illustrates the large effect of the pyrolysis timd temperature profile on gas product distribution. Several investigators have noticed different product dish-ibutions under a variety of experimental conditions (2a). However, a direct effect of the profile is now clearly seen in the figure. This result raises the possibility that the distribution and composition of gaseous and liquid products can be manipulated by variation of the time/temperature profile. This possibility, which could be of economic importance, is now under investigation.
As shown in Table 2, the residual solids (char) yield varied with catalyst type but remained in the range of 23-33% of the initial ASR weight. Lower levels of char yield translate into higher amounts of liquids, possibly an economically desirable effect. A number of binary oxides containing ZnO as one of the catalyst components appear to reduce the formation of char. Other additives (magnesium titanate, zirconate. Fe,O,, montmorilonite) do not yield results very different from the control run without catalyst. The effects of CuO and TiO,.SiO, also are marginal. In evaluating a commercial ASR recycling process, low cost is of foremost importance. Expensive catalysts, such as the binary oxides of Table 2, are not likely to prove directly useful. The incentive for studying these more expensive materials is to gain an understanding of possible effects, which may aid in the development of cheaper catalysts.
Two classes of liquids are formed by the pyrolysis of ASR. The organic class contains over 50 organic compounds, as analyzed by GC/MS, and the aqueous class contains water and water-soluble oxygenates, primarily acids and alcohols. Water may be physically present in the ASR or may be. produced chemically by primary or secondary pyrolysis reactions (see discussion). Chlorine-containing compounds could not be detected by GC/MS in either liquid class. Production of chlorine-free liquid is a desirable feature of a commercial ASR reclamation process if the liquid is to be used as fuel. In this case, it is also desirable to increase the yield of the organic class of liquid. The effects of various catalysts and pyrolysis conditions on maximizing organic liquids are currently under investigation.
DISCUSSION
The pyrolysis of each separate ASR component has ken extensively studied by numerous investigators, and mechanisms have been proposed (7). These mechanisms are polymer-structure-dependent and may differ within the same class of polymers. For example, thermal degradation of polyurethanes may occur by three different types of hydrogen transfer: N- H, a-CH, and p-CH, depending on the exact monomeric and polymeric structure of the pyrolyzing material (8). It is generally recognized that pyrolysis in a highly reducing environment proceeds via a radical mechanism. Detailed discussion of these mechanisms is beyond the scope of this paper.
The mechanism of ASR pyrolysis is very complex. Single products (e& methane and other aliphatic hydrocarbons) may be formed via different mechanisms, depending on the rype and structure. of the polymer of origin. Therefore, it is difficult to present a unified mechanism by observation of pyrolysis products alone. An important consideration, however, is the range of different temperatures at which degradation begins for each type of polymer. Polyurethanes may start degrading just above 200°C (7). Removal of HCI from PVC takes place at a relatively low temperature, and it is completed almost before the degradation of the hydrocarbon backbone begins (9). Similar observations may be made for other reactions, such as decarboxylation of nylon, polyesters, polyurethanes and acrylics, formation of chemical water from wood and paper, etc. Thus, it is reasonable to assume that each polymer begins the pyrolysis process individually, based on its own structural and thermodynamic character.
One of the key roles of catalysts is to lower the decomposition temperature by lowering the activation energy for some reactions. A single catalyst will not cause the same decrease of activation energy for all reactions of all ASR components. It is likely the main reason for the wide variation of the reIative amounts of products in the fmt gas sample (Table 3) is h e variability of catalyst effects as the temperature reaches a level where the most facile reactions are fairly rapid. However, most of the ASR polymers, after losing such weak-link components as CO HCI, and bo. revert to mostly hydrocarbon backbones, which likely are very similar. This progably is the reason for the limited variations in the product distribution of the second and third gas samples (Table 4).
From the above discussion, at least two distinct stages in the pyrolysis of ASR are hypothesized. The fust stage ends at about 300°C. and the second. in our case, continues up to
\
a74
I
700°C. Preliminary experiments suggest that most of the CO,, CO. H,O, CH,CI, and possibly some nitmgen-containing components are being released in the first stage. 'Significantly, these materials carry most of the hetero-atoms that may interfere with the overall quality of useful ASR PyrOlYSiS products.
The formation of CH,CI in relatively high concenmtions during the fust stage offers an indirect view of the reactions occurring during synthetic ASR pyrolysis. It is postulated that H a released from PVC attacks N-containing polymers, such as polyurethane, to form quaternary cationic nitrogen species; this is followed by scission of the polymer chain t h u g h CO, elimination, with subsequent formation of an olefinic end-group and an amine, as described earlier (8). The amine, most likely containing an N-CH, moiety (S), is further a m k d by HCI to fom a second, low-MW quaternary salt that decomposes to yield CH,CI.
To test the two-stage pyrolysis hypothesis, separate first- and second-stage pyrolysis experiments are. under way. The products from each stage are recovered, and the residue from the first pyrolysis stage is used as starting material for the second. Preliminary results indicate that the fmt residue is about 75% by weight of the synthetic ASR charged. The first-stage liquids azz mostly of the aqueous class: about SO-%% of the total CO, is released, and more than 90% of the CH,CI is released. Only very low levels of gaseous hydrocarbons form during the fust stage. Most of the oxygen is I W K I V ~ ~ in the fust stage in the form of CO,, CO, and H,O, so seconday reactions of these inorganics with the residue are. minimized (10). Therefore, second-stage pyrolysis yields primarily organic liquids and a gas rich in olefinic and paraffinic hydrocarbons.
A conceptual, two-stage ASR pyrolysis process that segregates the products from the two stages is envisioned It could produce commodity methyl chloride i n the first stage and valuable feedstock chemicals in the second stage. The potential for producing products from ASR pyrolysis more valuable than liquid fuel may thus be possible.
The above possibilities suggest a need to determine ASR pyrolysis kinetics experimentally. The smaller reactor system described in the experimental section was developed and operated for this purpose. In a universal reaction scheme that seems to fit the kinetic data, six universal reactions and five universal reactants and products in ASR pyrolysis are assumed: fresh ASR 0, gaseous products (G), unvaporized liquids (L), solid residue ( S ) , and condensed liquids (C). The sum of F, L, and S (denoted as R) is retained in the reactor and monitored by the fust transducer, Cis monitored by the second uansducer, and the weight of gases is obtained by difference. The results of an early ASR pyrolysis run are graphically presented in Figure 4. These results are correlated by the following simple scheme of universal reactions:
G +--de f 4
F r-<L--- - s ..
L A - - c If reactions 1 through 6 are assumed to be Arrhenius-type first-order reactions, the kinetic
model is simple and easily solved. The best-fit Arrhenius constants are given in the figure. The lines in the figure represent the best-fit model, and the points are from the experimental run. These results are consistent with the two-stage ASR pyrolysis hypothesis given above. Universal reactions I , 2, and 3 with relatively low activation energies dominate the process initially at low temperatures. When higher temperatures are reached, reactions 4 and 5 become significant. Note that reaction 5, the production of liquids from solids, continues throughout the run, as evidenced by the mirror-image slopes of the R and L lines. Results like those presented in Figure 4 are currently being used to evaluate and develop conceptual commercial pyrolysis processes. A more detailed discussion of the kinetic model and its applications will be presented in a later paper.
CONCLUSIONS
The following conclusions, based on early but nevertheless solid experimental data, must be considered tentative, awaiting results from additional confirmatory experiments that are currently under way:
1. Interaction of ASR components during pyrolysis modifies product distributions relative to single-component pyrolysis.
It is hypothesized that ASR pyrolysis occurs in two stages. The early, low-temperature stage (300°C) produces mostly inorganic, light gases and high yields of methyl chloride and is susceptible to modification by catalysts. The later, high- temperature stage (700°C) produces mostly organic liquids and gases and is less affected by the catalysts studied so far. Tests to identify catalysts effective in the second stage are under way.
Chlorine-containing compounds have not been found in ASR pyrolysis liquids.
2.
3.
Y 875

4. A universal reaction scheme based on first-order Arrhenius kinetics can be fit to ASR pyrolysis kinetic data and is consistent with the two-stage hypothesis.
The two-stage hypothesis inmases the possibilities for devising two-stage commercial ASR pyrolysis processes that have improved economic potential.
5 .
ACKNOWLEDGMENT
This work was supported by the U.S. Department of Energy, Assistant Secretary for Energy Efficiency and Renewable Energy, under contract W-31-109-Eng-38.
The GC/MS analyses were done by the Analytical Chemistry Laboratory at Argonne National Laboratory.
REFERENCES
1. 2a. 2b.
2c. 3a. 3b. 4.
5a. 5b.
6.
7 .
8. 9.
Automotive Engineering, August 1994, p. 29 Day, M., Z. Shen, J.D. Cwney. Proc. Auto Recycle '94, p. 169 Aganvar. K.. SPE, hoc. "Plastics Recycling: Technology Charts the Course," Schaumburg, Ill., 1994, p. 232 Tabery, R.S., Proc. Shredder Operations Conference, Austin, Texas, 1990, p. 1 Roc. Auto Recycle '93, Schotland, Southfield, Mich. Proc. Auto Recycle '94, Schotland, Dearborn, Mich. Compton, W.D., N.A. Gjostein, Joint IndustryjUniversity Research Programs, DOE Contract No. DE-AC02-78ERlG049, May 15,1984 Pierce, A,, Proc. Auto Recycle '92, p. 215 Chambers, C., J.W. Larsen, W. Li, R. Wiesen, Ind. Eng. Chem. Process Res. Dev.,
Roy, C., P. Mallette, Proc. Energy From Biomass and Wastes, IGT Conference XVI, 1992, p. 827 Flynn, J.H., R.E. Florin, "Pyrolysis and GC in Polymer Analysis," S.A. Liebman and E.J. Levy, Eds., Marcel Dekker Inc., New York, p. 149 Rumao, L.P., K.C. Frisch, J. Pol. Sci., Part A-1, 10, 1499-1509 OMara, M.M., J. Pol. Sci., Part A-I, 8, 1887-1899 (1970)
1984, 23, 648-654
(1972)
876

TABLE 1: SYNTHETIC ASR
COMPONENTS AMOUNT PER RUN
33% Glass Reinforced Po ester 3.91 7"- " " C I am I Q.QJ
Polyurethane Foam I 2.23 Polypropylene 1.89 D\lr I 4 ET 1
TOTAL WEIGHT 21 .a
TABLE 2: PYROLYSIS OF "SYNTHETIC" AUTOMOBILE SHREDDER RESIDUE - ASR
TABLE 3. COyWSmON OF GASES (PER C E W BY GC . FIRST SAYPLE
TABLE4. GC ANALYSIS OF THE SECOND AND THIRD GAS SAMPLES, AT 500 *C AND 650 PC, RESPECTIVELY. STATISTICAL DISTRIBUTION OF PRODUCTS FROM RUNS 1 - 15
IGASES I SECOND SAMPLE I THIRD SAMPLE 3 D DEVIATION
,

FIG. 3. RELATIVE GAS CONCENTRATIONS AT VARIOUS PYROLYSIS TEMPERATURES
tm m
E m - 8 , +€mane
-X-Pmpqlem
9 s
P 1: 10
0 203 300 403 5m
Temperature (*C)
1
2
3
4
5
6
__
FIG 4 ASR PYROLYSIS DATA (POINTS) AND MODEL (LINES)
3000 0.13
3000 0.10
5500 0.14
14000 0.004
7000 0.08
5000 10.0
I o h) 40 MI 80 io0 la 140 160
TIYE(min)
878

X-RAY CHARACTERIZATION OF TIRE DERIVED PARTICLES RESULTING FROM DIFFERENT SOLVENTS
Ricky C. Cummings, Charles B. Smithhart,' Jeff Quin, and David L. WerU Department of Chemistry & Biochemistry
and Center for Coal Product Research University of Southern Mississippi Hattiesburg, MS 39406-5043 USA
Key Phrases: Tire derived particle, x-ray spectroscopy, inorganin
INTRODUCTION
Currently, 200 million scrap tires are being annually stockpiled, landfilled, or illegally dumped, with Ea. 50 million scrap tires being recycled in a variety of ways. The current disposal methods are causing numerous short-term environmental problems. Whole tires occupy large amounts of space and may "float" or rise to the top of landfills, causing puncturing of the landfill cover. In an attempt to prevent floating, many landfills require that the scrap tires be shredded, a process which is energy intensive and wasteful. Scrap tire stock piles produce large health risks by providing a place for rodents and mosquitos to breed -- aiding in the spread of diseases.' Large stockpile fires have also broken out in major cities in Florida, Texas, Virginia, and Washington. These fires are long lasting and produce unwanted smoke into the environment? For many reasons, the recycling of scrap tires is desirable.
Current attempts to upgrade the hydrocarbons in the scrap tires to produce oils and carbon materials have met with limited success?
Scrap tires represent a "renewable" source for feedstock for chemicals and for energy, containing 3.16 B W s per tire and high abundances of carbon and hydrogen.
Scrap tires also contain several inorganics which are impregnated into the rubbery portion and iron (with a brass surface) from their steel belts. These inorganics are likely to hinder the recycling of the rubbery portion of the tires: Their removal is necessary because when combusted in a conventional boiler, the inorganic will cause air pollution and/or boiler scale build up as well as interfering with various catalytic processes.
Removal of the inorganics is the subject of this research.
EXPERIMENTAL
Whole tires were cut into 1 inch by 1 inch squares. These tire chunks were then treated with different liquids (n-methyl pyrrolidinone, nitric acid, 50% hydrogen peroxide, and sulfuric acid) by placing the tire chunks in the liquids and stirring at ambient conditions. A tire derived particle (TDP) was then recovered by filtration. After drying, the particles were placed in plastic cups, covered with a thin mylar film, and placed in the sample &amber of our x-ray spectrometer for analysis.
Our x-ray protocol involved collecting intensity at increments of A20 = 0.025' over the range from 20 = 10.OOo to 20 = llO.OOo using a sample spinner.
X-ray fluorescence spectroscopy (XRF) has been an established research tool for at least seventy-five years in the area of elemental analysis? Wavelength dispersive XRF has been used in this project to monitor the removal of the inorganic species noted above by the several processes we have developed. For each WDXRF spectrum, the choice of the monochromator used to disperse the secondaly X rays emitted by the analyte element(s) in the sample and the detector used to measure the secondary X rays are important. For the
i
I 879

WDXRF spectra reported herein, a graphite crystal monochromator (d = 3.38 A) was used to disperse the secondary X rays emitted by the various analytes in the samples. Both a gas proportional counter (gpc) and a scintillation counter (sc) were used to detect and collect the secondary X rays. The former has a high efficiency for collecting "softer" X rays (A > 1.25 A), while the latter has a high efficiency for collecting hard X rays ( A < 1.25 A).
Wavelength dispersive x-ray fluorescence spectroscopy was used to measure the abundances of the inorganic species in the tire before processing and to analyze the removal efficiency of the different liquids for these inorganics.
RESULTS AND DISCUSSION
The resulting TDP's had surface areas in 0.1-2.0 mm2 range.
ANALYSIS OF THE TIRE CHUNKS. The wavelength dispersive XRF spectrum (using Cr radiation and the gas proportional counter) of an untreated tire chunk is shown in Figure 1. The spectrum contains peaks due to zinc (AK, = 1.436 A) calcium (AK, = 3.359 A), and sulfur (AK, = 5.373 A). The chromium peak (A = 2.290 A) in the WDXRF spectrum is due to the.use of chromium as the exciting radiation (tube) for the experiments. Chromium produces "soft" X rays which do not penetrate deeply into the rubbery portion of the scrap tire. Consequently, the x-ray peak due to iron (AK, = 1.937 A) is barely discernible in the spectrum.
Shown in Figure 2 is the WDXRF spectrum of the same tire chunk using a scintillation counter rather than a gas proportional counter for x-ray detection and a molybdenum (AK, = 0.711 A) radiation source. A small peak due to bromine (AK, = 1.041 A) is clearly discernible, along with the Mo peak. There is, of course, no chromium peak in this spectrum.
When the steel belts were removed from the rubbery section of the tire, ground to a powder, and then submitted to our XRF analysis, the peaks due to iron, copper and zinc are clearly discernible.
TREATMENT WITH THE PROCESS LIQUIDS. The four liquids had different effects on the tire chunks. The n-methyl pyrrolidinone is absorbed into the tire chunk, causing the rubbery portion of the tire to swell. NMP cleaves the adhesion between the rubbery portion of the tire and the steel belts, while the'tire chunk becomes very brittle and easily grindable. It proved difficult to recover the NMP from the tire chunks.
Concentrated nitric acid degrades the tire chunk into particles& dissolves the steel belts. The WDXRF spectrum of the resulting TDP is shown in Figure 3. Comparison of the WDXRF spectra of the untreated tire to that of the TDP indicates that the zinc, calcium, and sulfur abundances have been drastically reduced in the TDP by the nitric acid treatment at ambient conditions. Lengthening the time of treatment results in complete removal of the unwanted inorganics.
Figure 4 shows the WDXRF spectrum of the residue produced by evaporating the nitric acid filtrate to dryness. The characteristic peaks due to the metal species are provided in this spectrum, verifying the absence of the unwanted inorganics in the TDP. The large iron peak is due to the fact that the nitric acid dissolves the steel belts.
Comparison of the intensities of the zinc peaks in Figures 1,3, and 4 indicates that the mass balance for zinc in these three samples is not well established and/or that the enhancement/absorption effects for the Zn peaks cannot be ignored in these samples.
Treatment with 50% hydrogen peroxide at ambient conditions does not degrade the tire chunks nearly as rapidly as does the nitric acid treatment. This treatment also extracts the inorganic% which are subsequently found in the residue evaporated from the filtrate. This method also attacks the steel belts, as evidenced by the large iron peaks in the WDXRF of the residue from the evaporate.
880

1 '
Concentrated sulfuric acid degrades the tire chunks almost as well as the nitric acid at ambient conditions but does not dissolve the steel belts. The steel belts may, then be removed easily (and essentially in tact) from the rubbery portion of the tire and collected on the stir bar. Comparison of the WDXRF intensities indicates that the sulfuric acid did not remove the zinc, calcium, or sulfur at ambient conditions.
A summary of current results is presented in Table I. Additional results will be discussed.
CONCLUSIONS
Tires chunks may be treated at ambient conditions with different liquids, producing different effects. The unwanted inorganics can be extracted from the tire chunks, leaving a TDP with a high carbon and hydrogen content and a greatly reduced surface area. Wavelength dispersive x-ray fluorescence spectroscopy may be used to monitor the reduction in abundances of each of the unwanted inorganics. Altering the conditions of the WDXRF experiment provides different information about the distribution of inorganics in the tire chunk and the TDP's.
REFERENCES
1.
2.
3.
4.
5.
6. Ray
US. Environmental Protection Agency. Scrap Tire Handbook Effective Management Alternatives to Scrap Tire Disposal in Illinois, Indiana, Michigan, Minnesota, Ohio, and Wisconsin. 1994.
Transportation Research. Uses of Recycled Rubber Tires in Highways. 1994.
Liu, Z., Zondlo, J.W., and Dadyburjor, D.B., Energy and Fuels, 1994 (8) 607.
Sopek, D.J. and Justice, A.L. in "Clean Energy from Waste & Coal", M.R. Khan, Am. Chem. SOC., 1991.
Jenkins, R., "X-Ray Spectrometry", John Wiley & Sons, NY, 1988.
Rousseau, R. M., "A Practical XRF Calibration Procedure", 43"' Annual Denver X- Conference, Steamboat Springs, CO. 1994.
I
DOE-EPSCoR Graduate Fellow.
TABLE I. EFFECTS OF LIQUIDS OF SCRAP TIRE PARAMETERS.
LIQUID INORGANIC FATE OF CONDITION USED REMOVAL STEEL BELT OF LIQUID
Zn Ca S ADHESIONS
NMP no effect cleaved absorbed into rubber
nitric acid E E E dissolved recyclable
sulfuric acid no effect cleaved recyclable
hydrogen peroxide E E E dissolved recyclable
/
I
E Extracted by the liquid.
881
I

150000 -
10 20 30 40 50 60 70 80 90 100 110 BRBPHITE MONOCHROMATOR ANBLE
FIGURE 1. W D F F SPECTRUM OF UNTREATED TIRE CHUNKS; Cr/GPC.
150000 -
m OFT X-RAY CUT-OFF
0 1 1 1 1 1 1 1 l
10 20 30 40 50 60 70 80 90 100 110 ERAPHITE MONOCHROMATOR ANELE
FIGURE 2. WDXRF SPECTRUM OF UNTREATED TIRE CHUNK; Mo/SC.
150000 -
100000 - I
10 20 30 40 50 60 70 80 90 100 110 ERAPHITE HONOCHROMATOR ANELE
FIGURE 3. WDXRF SPECTRUM OF TDP FROM THE NITRIC ACID TREATMENT, CrIGPC.
882

150000 -
0
50000 -
10 20 30 40 50 60 70 80 90 100 110 BRAPHITE MONOCHROMATOR ANBLE
FIGURE 4. WDXRF SPECTRUM OF RESIDUE FROM NITRIC ACID TREATMENT; Cr/GPC.
250000 - 200000 - 150000 - .n
10 20 30 40 50 60 70 80 90 100 110 BRAPHITE MONOCHROMATOR ANBLE
FIGURE 5. WDXRF SPECTRUM OF THE FILTRATE RESIDUE FROM THE 50% HYDROGEN PEROXIDE TREATMENT, Cr/GPC.
f
883

THE GROWING NEED FOR R I S K ANALYSIS
C.C. Lee and G.L. Huffman R isk Reduct ion Engineer ing Laboratory U.S. Environmental P r o t e c t i o n Agency
C i n c i n n a t i , OH 45268
Keywords: Risk ana lys is , R i s k assessment, R isk management
ABSTRACT Risk ana lys is has been i n c r e a s i n g l y r e c e i v i n g a t t e n t i o n i n making environmental dec is ions . For example, i n i t s May 18, 1993 Combustion St ra tegy announcement, EPA r e q u i r e d t h a t any issuance o f a new hazardous waste combustion permi t be preceded by t h e performance o f a complete ( d i r e c t and i n d i r e c t ) r i s k assess- ment. T h i s new requirement i s a major chal lenge t o many 'engineers who are i n v o l v e d i n waste i n c i n e r a t i o n a c t i v i t i e s . Th is Paper p resents t h e h i g h l i g h t s o f what i s r e q u i r e d f o r ' a r i s k ana lys is from a p r a c t i c a l eng ineer ing p o i n t o f view. It prov ides t h e r e g u l a t o r y bas is f o r it t o p rov ide t h e r a t i o n a l e as t o why r i s k ana lys is i s needed.
INTRODUCTION "Nothing would be done a t a l l i f a man waited till he cou ld do i t so w e l l t h a t no one cou ld f i n d f a u l t w i t h i t " - - C a r d i n a l Jewman. Cardina; Newman's statement i s very p e r t i n e n t t o t h e sub jec t o f R isk Ana lys is . The assessment o f environmental r i s k s posed t o human h e a l t h i s an i n c r e d i b l y complex undertaking. Because of t h i s complexi ty, i t i s very d i f f i c u l t t o do much more than i d e n t i f y sources and e f f e c t s o f p o t e n t i a l concern and, i n a rough manner, t o q u a n t i f y t r a n s p o r t along major pathways (Mar t in -86) . I n add i t ion , r i s k a n a l y s i s has been b a s i c a l l y developed by s c i e n t i s t s . Th is makes i t more d i f f i c u l t f o r zngineers t o apply t h e r i s k models developed by these s c i e n t i s t s t o t h e i r
rea l -wor ld ' ' waste t reatment problems, because o f t h e d i f f e r e n t d i s c i p l i n e s and te rmino log ies invo lved.
B a s i c a l l y , t h e au thors used t h e documents contained i n t h e "References Sect ion" t o d e r i v e t h e i n f o r m a t i o n f o r t h i s Paper. The o b j e c t i v e o f t h i s Paper i s t o summarize t h e h i g h l i g h t s o f what i s r e q u i r e d f o r a r i s k a n a l y s i s from a p r a c t i c a l eng ineer ing p o i n t o f view. I t emphasizes the documentation o f r i s k ana lys is requirements from var ious environmental s t a t u t e s . The purpose i s t o e s t a b l i s h t h e r e g u l a t o r y b a s i s r e l a t i v e t o why r i s k a n a l y s i s i s needed, and how r i s k ana lys is should be conducted. I t i s be l ieved t h a t t h e understanding o f the s t a t u t o r y p r o v i s i o n s i s important and t h a t the o n l y way t o fo rmula te the proper r i s k a n a l y s i s approach i s t o comply w i t h t h e r e g u l a t o r y requirements under t h e s p e c i f i c environmental laws t h a t apply. For example, i n t h e past, r i s k assessments were n o t r e q u i r e d f o r o b t a i n i n g a hazardous waste i n c i n e r a t i o n permi t . However, i n i t s May 18, 1993 Combustion St ra tegy announcement, EPA r e q u i r e d t h a t any issuance o f a new hazardous waste combustion p e r m i t be preceded by a complete d i r e c t and i n d i r e c t r i s k assessment (EPA-93/5). Th is new requirement i s a major cha l lenge t o many engineers who are invo lved i n waste i n c i n e r a t i o n a c t i v i t i e s .
REGULATORY BASIS FOR RISK ASSESSMENT Risk i s t h e p r o b a b i l i t y o f i n j u r y , disease, o r death under s p e c i f i c circumstances (Lee-92/6). R i s k assessment i s a cornerstone o f environmental decis ion-making. EPA d e f i n e s r i s k assessment as: (1 ) the de terminat ion o f the k i n d and degree of hazard posed by an agent (such as a harmful substance); ( 2 ) t h e e x t e n t t o which a p a r t i c u l a r group o f people has been o r may be exposed t o t h e agent; and (3 ) t h e present or p o t e n t i a l h e a l t h r i s k t h a t e x i s t s due t o the agent (Lee-92/6). R i s k assessment i s a complex process by which s c i e n t i s t s determine t h e harm t h a t an i n d i v i d u a l substance can i n f l i c t on human h e a l t h o r t h e environment. For human h e a l t h r i s k assessment, t h e process takes p lace i n a ser ies o f f o u r major steps as f o l l o w s (EPA-90/6; NAC-83):
(1) Hazard i d e n t i f i c a t i o n : I n i d e n t i f y i n g hazards, two k inds o f da ta are gathered and evaluated: (A) data on the types o f h e a l t h i n j u r y o r disease t h a t may be produced by a chemical; and (B) da ta on t h e c o n d i t i o n s o f exposure under which i n j u r y o r disease i s produced. The behavior o f a chemical w i t h i n t h e body and t h e i n t e r a c t i o n s i t undergoes w i t h organs, c e l l s , o r even p a r t s of c e l l s may a lso be charac ter ized . Such da ta may be of value i n answering t h e u l t i m a t e ques t ion o f whether t h e forms o f t o x i c i t y known t o be produced by a substance i n one popu la t ion group o r i n exper imental s e t t i n g s a r e a l s o l i k e l y t o be produced i n humans.
( 2 ) Dose-response assessment: The nex t step i n r i s k assessment descr ibes the r e l a t i o n s h i p between the amount o f exposure t o a substance and the e x t e n t of t o x i c i n j u r y o r disease. Even where good ep idemio log ica l s tud ies have been conducted, r e l i a b l e q u a n t i t a t i v e da ta on exposure i n humans are r a r e l y a v a i l a b l e . Thus, i n most cases, dose-response r e l a t i o n s h i p s must
884

f
r'
f
be est imated from s tud ies i n animals, which immediately r a i s e s t h r e e Serious problems: (A) animals are u s u a l l y exposed a t h i g h doses, and e f f e c t s a t low doses must be pred ic ted by u s i n g t h e o r i e s about t h e form Of t h e dose-response r e l a t i o n s h i p ; (B) animals and humans o f t e n d i f f e r i n s u s c e p t i b i l i t y (if only because o f d i f f e r e n c e s i n s i z e and metabolism); and ( C ) t h e hu an popu la t ion i s heterogeneous, so some i n d i v i d u a l s a re l i k e l y t o be
( 3 ) Human exposure assessment: Assessment o f human exposure r e q u i r e s es t imat ion o f t h e number o f people exposed and t h e magnitude, dura t ion , and t i m i n g of t h e i r exposure. The assessment c o u l d i n c l u d e past exposures, c u r r e n t exposures, o r exposures a n t i c i p a t e d i n t h e f u t u r e . I n some cases, measuring human exposure d i r e c t l y , e i t h e r by measuring l e v e l s of t h e hazardous agents i n t h e ambient environment o r by using personal monitors, i s f a i r l y s t ra igh t fo rward . I n most cases, however, d e t a i l e d knowledge i s requ i red of t h e f a c t o r s t h a t c o n t r o l human exposure, i n c l u d i n g those f a c t o r s t h a t determine t h e behavior o f the agent a f t e r i t s re lease i n t o t h e environment.
(4) Risk c h a r a c t e r i z a t i o n : The f i n a l step i n r i s k assessment combines the in fo rmat ion gained and ana lys is performed d u r i n g t h e f i r s t t h r e e stepes t o determine the l i k e l i h o o d t h a t humans w i l l exper ience any o f the var ious forms of t o x i c i t y associated w i t h a substance. The r i s k c h a r a c t e r i z a t i o n then becomes one o f the f a c t o r s considered i n dec id ing whether and how t h e substance w i l l be regu la ted .
I n the 198Os, as h e a l t h r i s k assessment became more w ide ly used across U.S. €PA programs, t h e need f o r consensus and consistency i n t h e areas o f hazard i d e n t i f i c a t i o n and dose-response assessment became c l e a r . I n 1986, €PA work groups were convened t o e s t a b l i s h consensus p o s i t i o n s on a chemical -by-chemical basis f o r those substances o f common i n t e r e s t and t o develop a system f o r communicating t h e p o s i t i o n s t o €PA r i s k assessors and r i s k managers. This e f f o r t r e s u l t e d i n the c r e a t i o n o f EPA's I n t e g r a t e d Risk I n f o r m a t i o n System (IRIS) i n 1986. I n 1988, the I R I S was made a v a i l a b l e t o t h e p u b l i c .
I R I S c u r r e n t l y conta ins summaries o f EPA human h e a l t h hazard i n f o r m a t i o n t h a t support two o f the f o u r steps--hazard i d e n t i f i c a t i o n and dose-response eva lua t ion- -o f t h e r i s k assessment process. I t c u r r e n t l y conta ins in fo rmat ion on approximately 500 s p e c i f i c substances. Quest ions such as "what i s the p o t e n t i a l human h e a l t h hazard o f exposure t o benzene?" and "what are the possible cancer and/or non-cancer e f f e c t s ? " can f i n d answers f rom IRIS (EPA- 93/1).
A key f a c t o r a f f e c t i n g t h e r e g u l a t o r y coverage o f a s t a t u t e i s t h e d e f i n i t i o n o f the substances sub jec t t o r e g u l a t i o n . The s t a t u t e s use several des;riptive terms, n o t n e c e s s a r i l y having the same meaning, t o i d e n t i f y harmful substances." These inc lude p o l l u t a n t , t o x i c po l 1 u tan t , hazardous substance, contaminant, hazardous m a t e r i a l , and hazardous waste. The Tox ic Substances Control Act (TSCA), f o r example, defines "chemical substances" and "mixtures" subject t o r e g u l a t i o n i f c e r t a i n c r i t e r i a are met; the Federal I n s e c t i c i d e , Fungicide, and Rodent ic ide Act (FIFRA) and t h e Marine Pro tec t ion , Research, and Sanctuaries ,pet (MPRSA) speci fy categor ies o f substances [FIFRA d e f i n i n g "pes t ic ides , and MPRSA "mater ia ls " ] .
I n general, t h r e e aspects of r i s k are addressed i n each s t a t u t e . They are: type o f harm, type of r i s k , and requ i red cons idera t ions between t h e chemical and the harm t h a t may r e s u l t (Mar t in -86) .
TvDe o f Harm: The type of harm i s u s u a l l y e x p l i c i t l y descr ibed by terms t h a t d e f i n e the chemicals o r the substances t o be addressed (e.g., a hazardous substance t h a t may cause i n j u r y t o h e a l t h o r t h e environment). The harm components of a s t a t u t e ' s r i s k d e f i n i t i o n g e n e r a l l y c o n s i s t o f a d e s c r i p t i o n o f an undesired outcome (death, i n j u r y ) and/or a d e s c r i p t i o n o f t h e popu la t ion ( p u b l i c , w i l d l i f e ) a t r i s k o r t h e o b j e c t i v e o f t h e r e g u l a t i o n , such as p r o t e c t i o n o f the environment.
TvDe o f Risk: Consider ing r i s k when developing f e d e r a l r e g u l a t i o n s encom- passes the p r o b a b i l i t y o f harm occur r ing . The p r o b a b i l i t y of harm presented by a chemical may be considered zero, i n s i g n i f i c a n t , o r s i g n i f i c a n t . A term such as " s i g n i f i c a n t r i s k " w i l l then be addressed by the rule-making process.
Reouired Considerat ions: The s t a t u t o r y language may guide t h e des ignat ion and s e t t i n g o f t e c h n i c a l o r c o n t r o l standards f o r e x p l i c i t l y spec i fy ing a b a s i s f o r making r e g u l a t o r y dec is ions and a l s o f o r i n d i c a t i n g what f a c t o r s must be, may be, o r may n o t be considered when developing r e g u l a t i o n s . The s t a t u t e s discuss the amount of p r o t e c t i o n o r r i s k reduc t ions t o be addressed through the issuance o f standards "necessary,
885
, ore suscept ib le than the average. 7

"adequate," o r " s u f f i c i e n t " t o p r o t e c t h e a l t h o r t h e environment by p r o v i d i n g d e t a i l e d guidance (e.g., ample margin o f s a f e t y ) and/or by p r e s c r i b i n g p a r t i a l f a c t o r s (e.g., r i s k and cos t ) t h a t must be considered.
REGULATORY BASIS FOR RISK MANAGEMENT EPA i s responsib le f o r implementing environmental s ta tu tes . Although, t h e s t a t u t e s g e n e r a l l y do n o t p resc r ibe r i s k assessment methodologies, many environmental laws do p rov ide very s p e c i f i c r i s k management d i r e c t i v e s , and these d i r e c t i v e s vary f rom s t a t u t e t o s t a t u t e . EPA de f i nes r i s k management as t h e process o f eva lua t i ng a1 t e r n a t i v e r e g u l a t o r y and non-regulatory responses t o r i s k and s e l e c t i n g among them. The s e l e c t i o n process necessa r i l y requ i res t h e cons ide ra t i on o f l e g a l , economic and soc ia l f a c t o r s (Lee-92/6).
S t a t u t o r y r i s k management mandates can be roughly c l a s s i f i e d i n t o th ree categor ies: (1) pure r i s k ; (2) technology-based standards; and (3) reasonable- ness o f r i s k balanced w i t h b e n e f i t s (EPA-93/1).
(1) Pure-Risk Standards
P u r e - r i s k standards are, sometimes, termed z e r o - r i s k standards. This category a l l ows an adequate margin o f sa fe ty , however, requ i res the p r o t e c t i o n o f p u b l i c h e a l t h w i thou t regard t o technology o r cost f a c t o r s . For example, t h e Na t iona l Ambient A i r Q u a l i t y Standards (NAAQS) o f t he Clean A i r Act belong t o t h i s category.
( 2 ) Technology-Based Standards
Technology-based environmental standards focus on the e f fec t i veness and cos ts o f a l t e r n a t i v e c o n t r o l technologies r a t h e r than on how c o n t r o l ac t i ons could a f f e c t r i s k s . For example, i n d u s t r i a l water p o l l u t i o n standards, where t h e i n s t a l l a t i o n o f a s i n g l e c o n t r o l system can reduce r i s k s from a v a r i e t y o f d i f f e r e n t p o l l u t a n t s , belong t o t h i s category.
Consider t h e severa l technology-based standards i n the Clean Water Act . The Act requ i res i n d u s t r i e s t o i n s t a l l several l e v e l s o f technology-based c o n t r o l s f o r reducing water p o l l u t i o n . These inc lude best p r a c t i c a b l e c o n t r o l technology, b e s t convent ional technology, and best a v a i l a b l e technology economical ly achievable f o r e x i s t i n g sources. New sources a re sub jec t t o t h e best demonstrated con t ro l technology. To ta l costs, age o f equipment and f a c i l i t i e s , processes invo lved, engineer ing aspects, environmental f a c t o r s o t h e r than water q u a l i t y , and energy requirements are t o be taken i n t o account i n assessing technology-based con t ro l s .
(3 ) No Unreasonable Risk
This category c a l l s f o r t h e balanc ing o f r i s k s aga ins t b e n e f i t s i n making r i s k management dec i s ions . The f o l l o w i n g are two examples i n t h i s category:
0 The Federal I nsec t i c ide , Fungicide, and Rodent ic ide Act requ i res EPA t o r e g i s t e r ( l i cense ) pes t i c ides which, i n a d d i t i o n t o o t h e r requirements, i t f i n d s w i l l n o t cause unreasonable adverse e f f e c t s on t h e environment. The phrase r e f e r s t o any unreasonable r i s k s t o man o r t h e environment t a k i n g i n t o account t h e economic, s o c i a l , and environmental cos ts and b e n e f i t s o f t h e use o f any pes t i c ide .
Under the Toxic Substances Contro l Act , EPA i s mandated t o take a c t i o n i f it f i nds t h a t a chemical substance presents o r w i l l p resent an unreasonable r i s k o f i n j u r y t o h e a l t h o r t h e environment. T h i s inc ludes consider ing t h e e f f e c t s o f such a substance on h e a l t h and t h e environment and t h e magnitude of t h e exposure of human beings and the environment t o such a substance; t h e b e n e f i t s o f such a substance f o r i t s va r ious uses and t h e a v a i l a b i l i t y of s u b s t i t u t e s f o r such uses; and t h e reasonably asce r ta inab le economic consequences o f t h e r u l e , a f t e r considera- t i o n o f t h e e f fec t on the na t i ona l economy, small businesses, t echno log ica l i nnova t ion , t h e environment, and p u b l i c hea l th .
THE ROLE OF COMPARATIVE RISK ANALYSIS EPA's suppor t f o r us ing comparative r i s k ana lys i s t o he lp se t i t s regu la to ry p r i o r i t i e s has been no sec re t . Un l i ke r i s k assessment, which f o r years has provided r e g u l a t o r s t h e bas i s f o r dec id ing whether o r n o t an i n d i v i d u a l substance needs t o be c o n t r o l l e d , comparative r i s k ana lys i s and i t s d e r i v a t i v e , r e l a t i v e r i s k , have a r r i v e d on the scene o n l y recen t l y . Very s imply described, comparative r i s k ana lys i s i s a procedure f o r rank ing environmental problems by t h e i r seriousness ( r e l a t i v e r i s k ) f o r t h e purpose of ass ign ing them program P r i o r i t i e s . T y p i c a l l y , teams of exper t s p u t together a l i s t o f problems; then,
886

I
they s o r t t h e problems by types o f r i sk - -cancer , non-cancer hea l th , m a t e r i a l s damage, eco log ica l ef fects, and so on. The exper ts rank t h e problems w i t h i n each type by measuring them against such standards as t h e s e v e r i t y of ef fects, the l i k e l i h o o d of t h e problem occur r ing among those exposed, t h e number of People exposed, and t h e l i k e . The r e l a t i v e r i s k o f a problem i s then used as a fac to r i n de termin ing what p r i o r i t y t h e problem should rece ive . Other fac to rs inc lude s t a t u t o r y mandates, p u b l i c concern over t h e problem, and t h e economic and techno log ica l f e a s i b i l i t y o f c o n t r o l l i n g it.
EPA'S Science Advisory Board urged t h e Agency t o o rder i t s p r i o r i t i e s on t h e bas is o f reducing t h e most ser ious r i s k s . The Board argued, i n p a r t ... There are heavy c o s t s invo lved if s o c i e t y f a i l s t o set environmental p r i o r i t i e s based on r i s k . If f i n i t e resources are expended on lower p r i o r i t y problems a t t h e expense of h igher p r i o r i t y r i s k s , then s o c i e t y w i l l face need less ly h i g h r i s k s . If p r i o r i t i e s are es tab l i shed based on the grea tes t o p p o r t u n i t i e s t o reduce r i s k , t o t a l r i s k w i l l be reduced i n a more e f f i c i e n t way, lessen ing t h r e a t s t o both p u b l i c h e a l t h and l o c a l and g l o b a l ecosystems.. . . (EPA-93/I).
THE ROLE OF RISK COMMUNICATION Bas ica l l y , r i s k communication deals w i t h the approaches t o communicate w i t h t h e pub1 i c on var ious environmental issues. Some recommended communication c h e c k l i s t i tems are prov ided as f o l l o w s (EPA-90/6): (1 ) Be prepared; (2) Review the fac ts ; (3) A n t i c i p a t e l i k e l y questions; and (4 ) Consider what t h e audience wants t o know.
THE ROLE OF R I S K UNCERTAINTY Uncer ta in ty means t h e q u a l i t y o r s t a t e o f having poss ib le v a r i a t i o n s . I n r i s k analysis, u n c e r t a i n t y f a c t o r s include: (1) the v a r i a t i o n i n s e n s i t i v i t y among the members o f t h e human popu la t ion ; (2) the u n c e r t a i n t y i n e x t r a p o l a t i n g animal data t o t h e case o f humans; (3) the u n c e r t a i n t y i n e x t r a p o l a t i n g f rom data obtained i n a study t h a t i s o f l e s s - t h a n - l i f e t i m e exposure; (4) t h e i n a b i l i t y o f any s i n g l e study t o adequately address a l l p o s s i b l e adverse outcomes i n humans.
SUMMARY By way o f summarizing, t h e f o l l o w i n g key quest ions concerning the above- descr ibed " r i s k " terms might be asked:
( 1 ) Risk assessment: What do we know about r i s k ? or how r i s k y i s t h i s s i t u a t i o n ?
(2 ) R isk management: What do we wish t o do about r i s k ? o r what s h a l l we do about i t ?
( 3 ) Comparative r i s k : What i s t h e rank ing ( p r i o r i t y ) o f t h e var ious r i s k s ?
(4) R isk communication: What and how should a r i s k assessor communicate w i t h t h e p u b l i c on r i s k ana lys is?
(5) R isk uncer ta in ty : What i s t h e q u a l i t y o r s t a t e o f having p o s s i b l e v a r i a t i o n s i n conducting r i s k ana lys is?
REFERENCES (EPA-89/3), "R isk p e s s m e n t Guidance f o r Superfund: Volume I 1 - Environmental Evaluat ion Manual, EPA540-1-89-001, March 1989.
(EPA-90/1), "Methodology f o r Assessing Health,,Risks Associated w i t h I n d i r e c t Exposure t o Combustor Emissions, I n t e r i m F i n a l , EPA600-6-90-003, January 1990.
(EpA-90/6), "R isk Assessment, Management and Communication o f D r i n k i n g Water Contamination," EPA625-4-89-024, June 1990.
( ~ ~ ~ - 9 1 / 1 2 ) , "R isk Assessment Guidance f o r Superfund: Volume I - Human Hea l th Evaluat ion Manual (Par t B, Development o f Risk-based P r e l i m i n a r y Remdiation Goals), EPA540-R-92-003, P u b l i c a t i o n 9285.7-018, December 1991.
(EpA-93/1), "The ABCs o f Risk Assessment," EPA Journal , EPA175-N-93-0014, Volume 19, Number 1, January/February/March 1993.
(EPA-93/5), "Environmental News: EPA Admin is t ra to r Browner Announces New Hazardous Waste Reduction and Combustion Strategy," May 18, 1993.
(EpA-94/4), "Exposure Assessment Guidance f o r RCRA Hazardous Waste Combustion F a c i l i t i e s , " EPA530-R-94-021, A p r i l 1994.
(Lee-92/6), "Environmental Engineering D ic t ionary , " C.C. Lee, June 1992.
887
(Mar t in-86) , "Hazardous Waste Management Engineering," Edward J. M a r t i n and James H. Johnson, J r . ) , Van Nostrand Reinhold Company, New York, 1986.
(Mart in-86/2), "1n;inerator Risk Analys is Presentat ion t o : I n c i n e r a t o r Permit W r i t e r ' s Workshop, Edward J. Mar t in , Peer Consultants, Inc., February 4,5, and 6, 1986.
(NAC-83), "Risk Assessment i n t h e Federal Government: Managing t h e Process," Committee on t h e I n s t i t u t i o n a l Means f o r Assessment o f Risks t o Pub l i c Heal th , Commission on L i f e Sciences, Na t iona l Research Counci l , Establ ished by Nat ional Academy Counci l (NAC), Nat ional Academy Press, 1983.
(NIOSH-84/10), "Personal Pr;tective Equipment f o r Hazardous M a t e r i a l s Inc iden ts : A Se lec t i on Guide, U.S. Department o f Hea l th and Human Services, Pub1 i c Hea l th Serv ice, Centers f o r Disease Contro l , Na t iona l I n s t i t u t e f o r Occupational Safety and Hea l th (NIOSH), D i v i s i o n o f Safety Research, Morgantown, West V i r g i n i a 26505, October 1984.
(NRT-87/3), "Hazardous M a t e r i a l s Emergency: Planning Guide," Nat ional Release Team (NRT), NRT-1, March 1987.
888

i b
EVALUATION OF A BIOMASS DERIVED OIL FOR USE AS ADDITIVE4N PAVING ASPHALT 1. Jr., I . Clelland, H. Sawatzky, Energy Research Laboratories, CANMET, Natural Resources
Canada, 555 Booth St., Ottawa, Ont., Canada, KIA OGI. E-mail: jean.houde~x400.emr.ca
Keywords: paving asphalt, additive, antistripping
INTRODUCTION
Treatment and disposal costs of sewage sludge can represent up to 50% of a municipality’s annual wastewater treatment budget. Sewage sludge (30% solids) accounts 5% of Canadian landfill by weight, and the ever increasing volume of sludge coupled with the decreasing options available for disposal creates a growing problem for major municipalities. Current disposal
, options are agricultural application, incineration and landfill. Concern about heavy metal . migration and public pressure to find a local solution has severely curtailed the spreading of
sludge on agricultural land. Incineration is the major option for larger centres but the relatively high cost fof incineration, ranging from $350 to $1000/t dry sludge, has caused a great deal of interest in methods of improving the cost effectiveness of incineration or in new equivalent technologies. The high cost and more stringent environmental regulations for incinerating municipal sludges have led to developing more efficient sludge management technologies that are not agricultural based.
The Wastewater Technology Centre of Environment Canada has been developing one such technology since 1982. The thermoconversion process shown in Fig. 1 involves low temperature
,treatment of sludge to liquid and solid fuel products (1). A key technical feature of the sludge conversion is the formation of a byproduct oil (2) referred to as sludge derived oil (SDO). In 1989, Enersludge Inc., Wastewater Technology Centre and CANMET’s Energy Research Laboratories (ERL) ,of Natural Resources Canada undertook a joint R&D program to be conducted at ERL to investigate promising utilization options for the SDO. SDO is a black, viscous high-boiling ( > 150’C) organic liquid with a characteristic odour. Initial characterization tests led to investigating the use of SDO as a feedstock material for introduction into a refmery stream. Its average chemical structure is that of a large complex molecule, with a hydrocarbon skeleton and functional groups containing nitrogen (pyrroles, amides) and oxygen (esters). Such structures, which indicate protein origins, tend to be very polar. The relatively high concentration of polar groups in SDO, especially the abundance of nitrogenous groups, and its incompatibility with most distillate hydrocarbons except heavy aromatic gas oils, as discovered in more extensive characterization testing, indicated a more appropriate role as an asplialt additive. This paper describes the work done at ERL to develop SDO for antistripping
COMPATIBILITY applications.
The affinity of SDO for heavy petroleum derived materials was initially investigated by blending equal amounts of SDO in each of ROSE” (residual oil supercritical extraction) residue (3) and CANMET hydrocracking pitch (4). Both were observed to be completely miscible and formed stable viscous blends. The same was then observed with SDO and pentane-precipitated Athabasca bitumen asphaltenes.
Asphalt cement (AX), a petroleum product made from the fraction that has a boiling point greater than approximately 350°C. contains many polar components including sulphur and nitrogen containing compounds. SDO was found to be compatible with A/C as indicated by the high ductility of SDO and commercial asphalt blends. Incompatibility in an asphalt blend causes a drastic decrease in ductility that is easily detected in comparison to commercial A/C. Ductility
and rate of elongation until it breaks.
The results of this preliminary investigation as well as the characterization indicated SDO was compatible with N C . Further, the SDO showed evidence of strong affinity for asphaltenes in asphalt. The high nitrogen content of SDO is desirable for improving of adhesion to
ROAD ASPHALTS aggregate.
l is determined by measuring the distance a futed shape of AIC will stretch at a fixed temperature
Asphaltic concrete road pavement is made from a mix of aggregate (sand, gravel and crushed stone) held together by 5% to 10% on a weight basis of A/C. Government transportation agencies have developed road pavement specifications and are also the largest buyers of road pavement. Their specifications include the hardness of the A/C, its ductility, viscosity, flash point, resistance to stripping and performance after simulated road paving and handling evaluations. Table 1 lists the American Society for Testing and Materials (ASTM) test methods typically used to assess commercial AIC’s.
Currently in Canada, A/C is primarily graded on its hardness as measured by penetration, reported as the measured penetration by a needle into a sample of A/C of specified temperature
889

for controlled time and force (weight) on the needle. kphal t of 85 dmm (tenths of millimetres) to 100 dmm, i t . , 85/100 penetration, is considered hard, whereas 150/200 penetration is soft.
ANTISTRIPPING ADDITIVE
The resistance to stripping of the A/C from the surface of the aggregate is an important specification for the performance of asphalt pavement and is monitored by the buyers of asphalt pavement. Since N C does not adhere well to certain aggregates, transportation agencies specify the use of antistripping agents when using these particular aggregates. Stripping involves complex processes which are still not fully understood. Several factors influence the sensitivity of asphalt concrete mix to stripping [5]. For this phenomenon to occur, free water must be present.
Jamieson aggregate (Ontario, Canada) which is prone to stripping and listed by the Ministry of Transport of Ontario (MTO) as requiring at least 1 % antistripping agent in the A/C, was chosen to evaluate the antistripping performance of SDO in A/C blends. ASTM test method D-1664', the test method for evaluating coating and stripping of bitumen-aggregate mixtures, requires a 95% coverage in static immersion tests to meet specifications.
To demonstrate the stripping resistance of SDO in A/C blends, three commercial N C s and various concentrations of SDO were used with Jamieson aggregate as shown in Fig. 2. The results are an average from the visual stripping evaluations of a panel of five evaluators. The coverage of the aggregate by the A/C increased from about 60% (for the first two A/Cs) to above 90% as SDO was added. The retained coverage of the third AIC, with no SDO, increased from about 40% to above 90% as in the above case. Further, the performance of an A/C with one of the commercial antistripping agents, Alkazine-0, recommended by the MTO is shown for comparison (80% retained coating at the 1 wt % level). Under these conditions, SDO has antistripping performance equal to or in excess of that given by at least one commercial agent, and can be used to have coverage in excess of MTO specifications.
Sources of SDO other than the Atlanta SDO (undigested sewage sludge derived oil) were also evaluated for performance as antistripping agents. These samples were also obtained from bench-scale experiments using Highland Creek (Toronto, Canada) sewage sludge, an undigested sludge, and Hamilton sewage sludge, a digested sludge, supplied by the Wastewater Technology Centre. A digested sludge is one that has been subjected to anaerobic bacterial digestion. An SDO from digested sludge has a reduced nitrogen content. In Fig. 3, several concentrations of these two SDOs are compared with commercial antistripping agents: Alkazine-0, Redicote AP and Redicote 82s. Some of these commercial agents are as effective as the SDO at approximately half the concentration. Comparison of Highland Creek SDO and Hamilton SDO (undigested versus digested sludges) as antistripping agents shows a parallel, but slightly less effective performance curve for the digested SDO, indicating the significance of the nitrogen content of SDO as a factor in adhesion to aggregate.
The use of antistripping additive m a y cause significant modifications to other performance properties of asphalt cement. The other properties of asphalt cement susceptible to modifications were also assessed. Candidate blends of asphalt cement with SDO and commercial antistripping agents were evaluated for asphalt cement performance specifications in Table 2. Blends of 2% Redicote 82s were compared with SDO blends as well as several other commercial antistripping agents. These results indicated the performance of SDO at 5% does modify the asphalt cement test results, in particular the loss of volatiles in the thin film oven test and the penetration. The changes to the penetration of the asphalt cement can be modified by a change in the distillation temperature of the SDO fraction or a change in the consistency of the N C . However, there may be a limit to the acceptability of a change in penetration caused by an additive unless the AIC is very hard. It should be noted that the use of only 2% SDO with the AIC3 in Fig. 2, was succeSSful for all specifications monitored. Further, the viscosity of the SDO containing asphalt cement easily met the MTO criteria.
.
In an effort to further define the antistripping performance curve, SDO was again tested by the stripping immersion method including the 3 wl % additive level. The results in Fig. 4 show that the 3 wt % additive level was as effective as the 5 wt % additive level in both 85/100 and 150/200 penetration A/C4. The 3 wt % additive level resulted in less change of the AIC's consistency, as shown in Table 3. In another phase of testing, a one year old SDO sample was compared to a freshly obtained sample. There was no significant difference in effectiveness as an antistripping agent between the SDO samples, indicating the stability of the product.
1
~~~
' Summary of ASTM D-1661 : The selected and prepared aggregate is coated with the bitumen at a specified temperature appropriate to the grade of bitumen used. The coated aggregate is immersed in distilled water for 16 to 18 h. At the end of the soaking period, and with the bitumen-aggregate mixture under water, the total area of the aggregate on which the bituminous film is retained is estimated visually as t 95%.
890 1

I
MARSHALL TEST
The next logical step was to test how SDO as an A/C additive compared to a commercial additive in the asphalt concrete. One of the standard testing methods commonly used is known as the Marshall test. The A/C and selected aggregate are mixed hot to produce an asphalt concrete which is compacted by a laboratory compactor, simulating the roller compaction the concrete would receive in the field. The cooled asphalt concrete sample is tested for strength and resistance to plastic flow with an applied lateral force.
A standard HL3 mix design was used for manufacturing all specimens to be evaluated. The ratio of coarse to fine aggregate was 40/60. Each specimen contained 5 % AIC. Specimens were manufactured according to MTO LS-261 and tested according to MTO LS-263 and LS-264 procedures for resistance to plastic flow using Marshall apparatus and theoretical maximum relative density, respectively. Table 4 gives the results for the Marshall stability of 5 % SDO and 2% Redicote 82.5 blended in 85/100 penetration AIC. Three duplicate determinations were done on each sample. The results show that the SDO blend performed as well as the commercial antistripping agent, Redicote 82s. The SDO addition did not lower the Marshall stability of the samples studied.
RECYCLED ASPHALT
When asphalt pavement is exposed to atmospheric conditions for several years, it degrades by becoming harder and more brittle. For this reason, asphalt pavement must be replaced or drastically repaired at the end of its typical age of 12 years. One notable effect of aging on asphalt cement is the increase in the asphaltene content. Attempts at softening aged asphalt cement by adding low viscosity high-boiling petroleum oils were unsuccessful because these oils do not accommodate the increase in asphaltene content. A successful agent for softening or rejuvenating aged asphalt cement must be able to disperse or peptize the asphaltenes. In general, very soft asphalts, referred to as fluxes, are used to rejuvenate aged asphalts because they can absorb the effect of the increased asphaltenes. Given the excellent ability of SDO to dissolve the CANMET residue, the ROSE" residue, and the Athabasca asphaltenes, it was expected that SDO would rejuvenate aged asphalt. Further, the softening and reduction in penetration observed in blends of SDO and virgin asphalt cement are also desirable.
A sample of aged asphalt cement was obtained from a local asphalt pavement replacement operation. Milled asphalt pavement was extracted with toluene and the aged asphalt cement was recovered by evaporation. The aged asphalt cement was blended with SDO. The penetrations and kinematic viscosities are shown in Table 5.
Further, Bow River crude asphalt of 454°C was blended with the aged asphalt. Bow River asphalt is very soft and is considered to be a high quality flux, which is ideal for rejuvenating asphalt. The results indicate that hard, aged asphalt cement of 30 dmm penetration can be softened to make the equivalent of 85/100 penetration grade asphalt cement. Only 12% SDO was required to make this penetration whereas more than 22% Bow River flux is required. However, the viscosity of 22% Bow River flux in asphalt cement is just above the MTO kinematic viscosity minimum of 280 cSt. If more Bow River were added to make the 85/100 penetration grade of asphalt cement, it would probably just fail the viscosity specification.
SDO performance in hot mixed recycling was investigated using the thin film oven test. The results in Table 6 show that 9% SDO passes the TFOT weight loss specification, as well as improves the viscosity of recycled asphalt cement. While the penetration is below the 85/100 specification, it is possible that either a soft flux can be used, or further addition of SDO can be utilized to soften to a penetration of 85 dmm.
One additional benefit of using SDO for rejuvenation is its property as an antistripping agent. A 9% blend of SDO into aged asphalt cement had a static immersion coverage of 100% on Jamieson aggregate. The unmodified, aged asphalt cement had a coverage of only 42%. The results of SDO rejuvenated asphalt cements in the thin film oven test are also encouraging. As shown in Table 6, when 9% SDO was added to an aged asphalt cement and subjected to the thin f i oven test, a 60% retention of the penetration occurred along with a weight loss of 0.60%. Both meet the ASTM D-946 specification.
Not only does it perform well for rejuvenation, softening, and asphaltene compatibility, it also improves the stripping resistance of the rejuvenated asphalt cement. This increases its value over other agents to recyclers of asphalt pavement. Further, it should be noted that the amounts of SDO used are reported as a fraction of the aged asphalt cement. While this may represent a small amount on the scale of recycled pavement, methods to contact the aged asphalt cement with SDO must be considered.
These results show the performance of SDO as a rejuvenating agent.
891

CONCLUSIONS
It has been demonstrated by extensive antistripping studies conducted on the different SDO samples supplied to ERL that the SDO antistripping properties are independent of the process used to produce the sludge derived oil (bench scale versus pilot scale), and relatively dependent on the sludge type (digested versus undigested). The digestion process removes some materials that would be converted to SDO in the oil from sludge process. The SDO from digested sludge also is less effective as an antistripping agent relative to the SDO from undigested sludge.
A 3% SDO concentration was found to be as effective as 5 % SDO concentration for stripping inhibition. Furthermore, when SDO was used at 3% concentration, the AIC's properties (penetration, viscosity and weight loss after TFOT) were not modified as much as when a 5% concentration was used. If one would like to use 5 % SDO, the starting asphalt cement should be in the 60/70 penetration grade to produce a f d A/C in the 85/100 penetration range. A comparison of the performance of the year old SDO sample with a fresh sample at the 5 % additive level showed no major difference confirming that the SDO is very stable over time and does not lose its beneficial properties.
The addition of SDO can be done either by the wet mode (standard method) in which the additive is blended with the A/C or by the dry mode in which the aggregates are prewetted with SDO before adding the A/C. In the latter case, asphalt engineering/performance tests would be required to confirm that this method does not affect the performance. This is being addressed in road pavement test strips.
The SDO Marshall stability (strength test) was found to be comparable to that of a commercial additive although a greater concentration of SDO is needed. Neither of these additives showed improvement or loss of stability over the commercial virgin asphalt used as control indicating no negative effect on the strength of the asphalt concrete.
Annual demand for antistripping agents for road asphalts in Ontario is valued at approximately $1 million (6). It is estimated that up to lo00 t/a of SDO could be used in such an application. Initial experimentation has also shown that SDO shows promise as a rejuvenant for aged asphalt cement. Not only does SDO perform well for rejuvenation, softening, and asphaltene compatibility, it also improves the stripping resistance of the rejuvenated asphalt cement. This increases its value over other agents to recyclers of asphalt pavement. Recycling asphalt pavement is not a mature technology. Many opportunities exist to advance this technology. As the aggregate resources close to major centres become depleted, this technology will undoubedly receive more attention.
ACKNOWLEDGEMENTS
The authors wish to thank P. Mourot and D. Martinoli of Enersludge Inc. and H. Campbell of WTC for their financial and technical support and their assistance in interpreting the results of this work. The authors also wish to thank J. Odgren of the Regional Municipality of Ottawa- Carleton's Material Testing Laboratory for technical support and interpretation of the Marshall Test portion of the research. Federal support of this work was provided through the Federal Program on Energy Research and Development (PERD).
REFERENCES
1. Campbell, H.W. and Bridle, T.R. "Sludge management by thermal conversion to fuels", Roc. of New Directions and Research in Waste Treatment and Residuals Mananement, Vancouver, 1985.
Campbell, H.W. and Martinoli, D.A. '"A status report on Environment Canada's oil from sludge technology", Proc. of Status of MuniciDal Sludne Manaeement for the 199Os, WPCF Specialty Conference, New Orleans, 1990.
Gearhart, J.A. and Nelson, S.R. "Upgrading heavy residuals and heavy oils with ROSE": Energy Procrssing/Canada, May-July , 1983.
Pokier, M.A. and Sawatzky, H. "The utilization of process residues for the production of road asphalt cements", Proc. of 30th Annual Conference of the Canadian Technical Asohalt Association, Moncton, 30, 42-58 (1990).
Stolle D.F.E. "Silane coupling agents to reduce moisture susceptibility of asphalt concrete", MTO Reuort #PAV-90-04, November 1990.
Kennepohl, G.J., MTO, personal communication, 1990.
2.
3.
4.
5.
6 .
892

Table 1 - ASTM asphalt cement specification tests
ASTM method Test description
ASTM D-5
ASTM D-92
ASTM D-113
ASTM D-1754
ASTM D-2052
ASTM D-2170
ASTM D-2171
Penetration of bituminous materials
Flash Point, Cleveland Open Cup
Ductility of bituminous materials
Effect of heat and air on asphaltic materials
Solubility of asphalt materials in trichloroethylene
Kinematic viscosity of asphalts
Viscosity of asphalts by vacuum capillary viscometer
,y,$s~o 7, 62, 135 282 1557 3288 *150 88.66 ~ % S D O 11,104,204 244 1006 2584 +150 8880 5 s s ~ o 11,128,238 226 7684 2272 135 8889 ,-,%~~Ooid 8, 86. 158 324 1573 3321 +150 88.83 5 y s ~ o o l d 13,156. 168 248 I O U 226 +I50 8885
Table 2 - Atlanta SDO in asphalt cement
0 0 0 58 71 3574 461.5 +I50 0 7 2 82 60 2456 3838 '150 124 88 54 2236 3546 r15O 0 0 2 53 55 3178 446.2 +I50 0.81 75 48 1756 340.3 +I50
WLSDO 38 8.86 .158 324 1573 3321 -1% 8883 55SOO 96 13.1yI.168 248 I O U 2280 + I % 8985 ZXRdbo(olU6 74 13.121.144 Ya 1019 ,2760 ,150 89S3 1% Nddad S4
0 ~ s ~ ) 12.141.253 288 7162 2370 148 88.81 3 y . s ~ O 15.173.307 288 5106 1822 126 8883 5%sm 17.227.372 232 4202 1885 115 88.68 o * s ~ o o l d 15.174.218 316 4761 181 6 130 88.85 5 % ~ D O a l d 19,242,301 284 3151 141.8 + I50 8885
&!cxlwm D I ~ S D O m ?5.174.216 316 4701 % s i 8 130 8985 5WSDO 85 18.242.xIl 2W 3151 1418 1150 8885 ZURsdWlr82S 85 16.1B4.282 YY 3884 1688 +l% 8898 1% Naldad 87 1 2 w n e o 75
u!xlsum WSDO 39 8.83 382 0 22SDO 85 8.81 288 1292 327.0 1XmeLarinsO 60 - 8YlW *95. lSDRW f85. ' S p s C * s T M O l ~ '*Spas MTO c202
,232 ,280" .,w r88 ,220 >lW r88
0 0 1 78 56 1426 3164 ++so 0.00 88 57 1421 282.8 + I50 1 2 4 107 47 877.6 2544 +is0 0.M) 88 57 7885 2440 - 0 8 4 132 54 8135 183.7 +150
002 53 552 3178 4462 *I50 25 081 75 481 1758 3403 +150 S4 016 68 582 1815 387.3 138 87
030 62 681 3 5 3 2 5 1 2 0
a 85 r47 .75
Table 3 - Performance of SDO in asphalt cement
893

Table 4 - Marshall stability tests (MTO LS-263)
Sample Stability Flow V.M.A.' Air Voids # ( KN ) (.OOl in.) ( % ) ( % )
Control I A 11.225 9.50 15.09 6.00 I B ll.M)2 9.90 14.88 6.20 II A 12.622 _-. 13.57 4.88 11 B 12.958 11.00 13.61 4.96 IlIA 13.972 10.12 14.33 5.56 IllB 12.292 10.72 15.25 6.45
5% SDO I A 14.330 9.10 14.17 5.47 I B I I .063 8.20 14.59 5.30
I I B 10.995 9.40 13.29 4.72 IIlA 12.993 10.76 12.54 4.12 llIB 13.612 9.10 13.02 4. I4
I1 A 10.448 __. 13.47 5.28
2% Redicote 82s I A 6.687 2.80 18.46 2.58 I B 6.689 3.00 16.35 2.59 I1 A 12.017 9.40 14.14 5.83 II B 10.585 10.50 14.38 6.28 IllA 12.545 8.34 14.40 6.34 IllB 14.784 9.09 13.83 5.78
' V.M.A. - Voids in mineral aggregates Calculated by the following formula: V.M.A.= 100 - [ C (lOO-AC)/G I
where C = Bulk specific gravity of compacted bituminous mixture AC = Wt % asphalt cement (A/C) G = Maximum specific gravity of aggregate. assumed at 2.70
All mixes made with 5 % by weight A/C - 85/100 penetration Coarse aggregate ( >#4 US Sieve) - Jamieson 140 wt %I Fine aggregate ( <#4 US Sieve) - Dibhlee I60 wt %I
Table 5 - Comparison of penetration and viscosity in AAC' using different additives
Penetration Kinematic viscosity
4°C 25°C 100°C 135°C (dmm) (CSt)
AAC 7 30 11039 866 AAC + 2.1% SDO 7 40 6883 719 AAC + 6.0% SDO 7 50 4794 624 AAC + 12.2% SDO 1 1 98 4801 413 AAC + 22.0% Bow River 454°C 13 80 3079 287 Bow River 454°C > 300 d a ' 67 21 SDO > 400 d a 22 7
Table 6 - AAC properties before and after addition of SDO
~
Post TFOT
AIC SDO Viscosity Pcnctration TFOT Viscosity Penetration Retained Q 6 0 " C Q 25°C wt loss Q60"C @ 25°C pen4
(%) (P) ( d m ) (%) (P) (dmm) (%) AAC 0 29 720 32 0.03 45 210
AAC 9 5 330 65 0.60 9 583 39 60
AAC: Aged asphalt cement n/a: n o t d y z e d Pen: Penetration
894
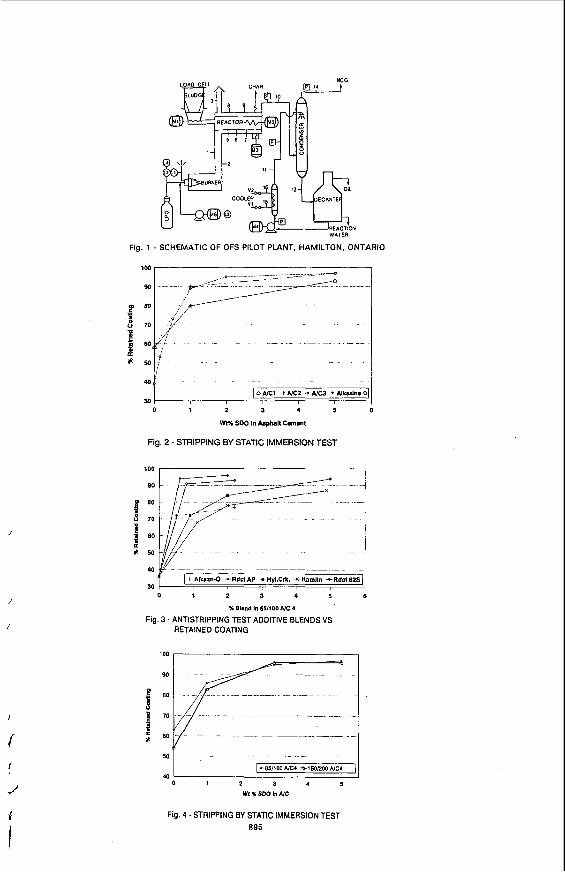
/
/
..... ~.
....... -.- ............. ........... .....
...... ... r - ~- .... . -~~
I
/-
. .
I
Fig. 1 -
100
80
m 80 3
d 70
f $ " * s o
40
30
SCHEMATIC OF OFS PILOT PLANT, HAMILTON, ONTARIO
......... s.".-4 -. --- .. - -,,.. -.-
....... .. --.:.= ...........
-
[*AJc1 +NC2 +Nc) r A l u n . 0 1
1 2 3 4 5 6
Wt% SDO In Asphalt Cement
Fig. 2 - STRIPPING BY STATIC IMMERSION TEST
- - . - - _. - -. . _.. - 40
30 + Alkazn-0 *Rdcl AP +Hyl.Crk. *Harnlln +Rdct 825 1
0 1 2 3 4 5 6
X Blend In 85llOO AJC 4
Flg 3 - ANTISTRIPPING TEST ADDITIVE BLENDS VS RETAINED COATING
100
90
i B 70 z $ 60
50
10
.. .- -I
1*85/100 NC4 *150/200 N U 1 0 1 2 3 4 5
WIX S O 0 b UC
Fig. 4 -STRIPPING BY STATIC IMMERSION TEST 895

MANUFACTURE OF AMMONIUM SULFATE FERTILIZER FROM FGD- GYPSUM
M.4.M. Chou, J.A. Bruinius, Y.C Li, M. Rostam-Abadi, and J.M. Lytle Illinois State Geological Survey
615 E Peabody Drive Champaign, IL 61820
KEYWORDS: gypsum, ammonium sulfate, flue gas desulfurization
ABSTRACT The goal of this study is to assess the technical and economic feasibility of producing marketable products, namely fertilizer-grade ammonium sulfate and calcium carbonate, from gypsum produced as part of lime/limestone flue gas desulfurization (FGD) processes. Millions of tons of FGD-gypsum by-product will be produced in this decade. In this study, a literature review and bench-scale experiments were conducted to obtain process data for the production of marketable products from FGD-gypsum and to help evaluate technical and economic feasibility of the process. FGD-gypsum produced at the Abbott power plant in Champaign, IL was used as a raw material. The scrubber, a Chiyoda Thoroughbred 121 FGD, produced a filter cake product contains 98.36% gypsum (CaS0,.2H20), and less than 0.01% calcium sulfite (&SO3). Conversion of FGD-gypsum to ammonium sulfate were tested at temperatures between 60 to 70°C for a duration of five to six hours. The results of a literature review and preliminary bench-scale experiments are presented in this paper.
INTRODUCTION The 1990 amendments to the Clean Air Act mandate a two-stage, 10-million ton reduction in sulfur dioxide emissions in the United States'. Plants burning high sulfur coal and using FGD technologies must also bear increasingly expensive landfill disposal costs for the solid waste produced2. The FGD technologies would be less of a financial burden if successful commercial uses were developed for the gypsum-rich by-products of the wet limestone scrubbing.
The degree to which FGD-gypsum is commercially used depends on its quality. Currently, high-quality FGD-gypsum with purity greater than 94% is used mainly to manufacture construction materials, i.e. stucco and gypsum-plaster, gypsum wall boards, and cement'. The amount of high quality FGD gypsum could exceed the current demand of the FGD- gypsum industry. Conversion of FGD-gypsum to marketable products could be a deciding factor in the continued use of high-sulfur Illinois coals by electric utilities. One approach is to produce cost-competitive ammonium sulfate fertilizer and commercial-grade calcium carbonate from FGD-gypsum.
Ammonium sulfate is a valuable source of both nitrogen and sulfur nutrients for growing plants. There is an increasing demand for sulfur in the sulfate form as a plant nutrient because of diminished deposition of atmospheric sulfur compounds from flue gas emissions and more sulfur is taken up by plants produced in high yields'. Also, the trend of using high-nitrogen content fertilizers has pressed incidental sulfur compounds out of traditional fertilizer. The current market for ammonium sulfate in the United States is about two million tons per year. It is anticipated that 5 to 10 million tons of new ammonium sulfate production may be required for fertilizer markets annually to make up for the loss of sulfur deposition from the increased restriction on acid-rain. The fertilizer industIy appears ready to accept an added source of fertilizer grade ammonium sulfate to supply sulfur in NPK fertilizer blends'.
In Phase-I of this study, a literature review and a series of bench-scale experiments were conducted to obtain process data for the production of ammonium sulfate from FGD- gypsum and to help evaluate technical and economic feasibilities of the process.
EXPERIMENTAL PROCEDURES Sample of FGD-gypsum and methods of nnnlyses -The Abbott power plant in Champaign, Illinois operates a Chiyoda Thoroughbred 121 FGD-desulfurization system which produces one ton of gypsum for every ten tons of coal burned. The FGD-gypsum sample collected was dried in ambient air for two to four days. The particle size distributions of the sample were determined using both manual and instrumental methods. In the manual method, the sample was wet-sieved through a 100 mesh (149pm) screen and then a 200 mesh (74pm) screen. The weight % of the size-fractional samples were determined after drying. In the
\
3 896

'.
I
I
I
instwmental method, a Micro Trac I1 analyzer was used to determine the mean and standard deviation of the panicle diameter by means of laser light scattering.
The amounts of free water (released at 45°C) and combined water (released at 230°c for gypsum), calcium oxide (CaO), magnesium oxide (MgO), and carbon dioxide in the sample Were determined by the ASTM method (2471. Based on these analytical results, the Compositions were calculated in terms of %CaCO, %MgCO, %CaSO,, %CaS04.2H@, and %(NH&SO,. Thermogravimetric analysis (TGA) was conducted under an air flow of 50 d h h with programmed heating from room temperature to 900°C at lO"C/min. The Weight loss profile was used for preliminary estimates of purity and composition Of gypsum
Conversion of FGD-gypsum ammonium sulfate and calcium carbonate - The batch, bench-scale reactor system consisted of a 1000-mL, three-neck, round-bottomed flask fitted with a mechanical stirrer, a condenser, and a thermometer. An autotransformer and heating mantle were used to control the reaction temperature. The important reaction for producing ammonium sulfate from the FGD-gypsum is the reaction between ammonium carbonate and calcium sulfate. Two sets of experiments were conducted in this study. In the first set of experiments, the gypsum reacted with reagent-grade ammonium carbonate in a liquid medium. In the second set of experiments, ammonium carbonate, formed by the reaction of ammonia and carbon dioxide in a liquid medium reacted with suspended gypsum. The procedures for the experiments are outlined below.
FGD-gypsum was added to an ammonium carbonate solution (prepared by dissolving reagent-grade ammonium carbonate in 500 mL of distilled water) in the 1000-mL reaction flask The temperature of the stirred mixture was raised from room temperature to the reaction temperature and maintained at that temperature for a range of pre-determined times. The solution which contained the ammonium sulfate product was separated from the solid byproduct, calcium carbonate, by vacuum filtration. The filtrate plus the rinsing, a total of about 600 mL of the liquid, was concentrated to a volume of about 150 mL in a constant temperature water bath. The residual concentrate was kept at room temperature to form ammonium sulfate crystals. The condensation and crystallization steps were repeated until no more crystal could be produced. The combined product was dried under ambient air before determining the total weight.
In the second set of experiments, ammonium carbonate was formed by the reaction of ammonia and carbon dioxide in a liquid medium, which was then allowed to react with FGD-gypsum in suspension. After removal of the calcium carbonate, the ammonium sulfate is recovered in a similar manner by filtration, evaporation and crystallization.
The ammonium sulfate produced was analyzed by melting point determination, chemical analysis and TGA analysis. The yield of the ammonium sulfate produced was obtained based on its theoretical yield from a total conversion of calcium sulfate feed. The purity of the ammonium sulfate produced was determined by chemical analysis of the nitrogen content using methods described by the Association of Agriculture Chemists (AOAC) and American Water Works Association (AWWA) procedure, and by ASTM method C-471. The calcium carbonate by-product was dried and subjected to TGA analyses to determine its purity and composition of unreacted gypsum.
RESULTS AND DISCUSSIONS Characterization of the FGD-gypsum sample - The data on particle size distribution obtained by passing the gypsum sample through a series of screens and by Micro Trac I1 particle-size analyzer are shown in Table 1. Ahout 84% of the sample has particle-size smaller than 74 pm (200 mesh), and about 99% of the sample has particles of smaller than 149pm (100 mesh). The results of chemical analyses and the calculations following ASTM method C-471 are shown in Table 2 The FGD-gypsum sample has more combined water (water of hydration) than free moisture and has 98.36% gypsum (CaS04.2H20) with less than 0.01% of calcium sulfite (CaSO,). The TGA curve of the gypsum sample is shown in Figure 1. All weight loss occurred between 98°C and 207°C (peak at 158.65"C). This weight loss is related to removal of the water of hydration from gypsum. No further thermal decomposition occurred to a temperature of 900°C.
Literature review - The chemistry of the process and process conditions6 were reviewed. The literature study showed that the production of ammonium sulfate from natural gypsum, ammonium, and carbon dioxide, known as the Merseburg Process, has been tried in England' and Indias in 1951 .and 1967, respectively. The process was proven to be
897

commercially feasible. The Merseburg Process for manufacturing ammonium sulfate from gypsum is based on the chemical reaction between gypsum and ammonium carbonate. Ammonium carbonate is formed by the reaction of ammonia and carbon dioxide in aqueous solution. The reaction produces insoluble calcium carbonate and an ammonium sulfate solution. The reason it is not currently used is the cost of natural gypsum and the availability of an economical source of carbon dioxide.
In the early 196O's, the chemistry of the Merseburg Process was carefully studied and partially developed in the US.. At that time the Tennessee Valley Authority (TVA) studied a process in which ammonium phosphate was produced using ammonium sulfate and phosphate rock as starting materials. In the process, phosphate rock was extracted with nitric acid. The extract was allowed to react with ammonium sulfate to produce ammonium phosphate. Gypsum was produced as a by-product To minimize the costs of ammonium phosphate conversion, TVA adopted the Merseburg Process and developed a single-stage reactor both in bench scale9 and in pilot scalelo operations. The purpose was to recover the by-product gypsum and use it to regenerate ammonium sulfate for the starting material. In the regeneration, the by-product gypsum and ammonium carbonate were premixed before entering the reactor. Residence times of 0.5, 1, and 3 hours at 125°F (52°C) and 140°F (60°C) were tested, and conversions of greater than 95% were achieved9. Typical operating conditions in the pilot plant were 120°F (49"C), 2 hours residence time, and ammonium carbonate feed at or above 105% stoichiometric requirement, and the conversion was 98%*4
Bench scale testing for ammonium sulfate production - The important reaction for producing ammonium sulfate from the FGD-gypsum is the reaction between ammonium carbonate and calcium sulfate. Two sets of experiments (see experimental procedures section) were conducted in this study. The reaction conditions, amounts of reactants, and the properties of products for the two sets of experiments are listed in Table 3. The ammonium sulfate produced was confirmed both by comparing its melting point with that of a commercial standard and by examining chemical analysis data and TGA data. Based on the weight of the ammonium sulfate produced and its theoretical yield from a total conversion of calcium sulfate feed, a yield of up to 83% and a purity of up to 99% for the ammonium sulfate production was achieved. A mass balance calculation for calcium and sulfur in gypsum was conducted on experiment run No. 5 (Table 3). The results show a recovery of 98% for calcium in calcium carbonate and a recovery of 81% for sulfur in ammonium sulfate were obtained. The TGA curve for calcium carbonate produced in one of the residues is shown in Figure 2 The graph shows a weight loss occumng between 600°C and 770°C This is attributed to the evolution of carbon dioxide from decomposing calcium carbonate. A typical TGA curve (Figure 3) of the ammonium s'ulfate produced shows a total decomposition of the sample with a maximum weight loss at 418.3"C
In summary, the results of these preliminary laboratory experiments suggest that high quality ammonium sulfate can be produced from the FGD-gypsum sample obtained from the Abbott power plant
ACKNOWLEDGEMENT & DISCLAIMER This report was prepared by MA. M. Chou and the ISGS with support, in part, by grants made possible by U.S. department of Energy (DOE) Cooperative Agreement Number DE- FC22-PC92521 and the Illinois Coal Development Board (ICDB) and the Illinois Clean Coal Institute (ICCI). Neither authors nor any of the subcontractors nor the US. DOE, ISGS, ICDB, ICCI, nor any person acting on behalf of either assumes any liabilities with respect to the use of, or for damages resulting from the use of, any information disclosed in this report. The authors would like to acknowledge D.F. Fortik of the Abbott Power Plant for suppling the FGD-gypsum sample and the project manager D.D. Banejee of the ICCI.
REFERENCES 1.
2
3.
E Claussen, "Acid Rain: The Strategy," Office of Communications and Public Affairs, EPA Journal, Washington DC, Jan./Feb. 1991, vol. 17, no. 1. R.E. Bolli and RC. Forsythe, "Ohio Edison Company's Clean Coal Technology and Waste Utilization Programs," EPRI 1990 SO2 Control Symposium, vol. 1, 3b. S.K. Conn, M.G. Vacek, and J.T. Moms Jr., "Conversion from disposal to commercial grade gypsum; An alternative approach for disposal of scrubber wastes." EPRI 1993 SO2 Control Symposium, voL 3,8b. R.G. Hoe% J.E Sawyer, R.M. VandenHeuvel, Mk Schmitt, and G.S. Brinkman, 4.
898

Corn response to sulfur on Illinois soils, J. Fert, 295-104, 1985. 5. N.W. Frank and S. Hirano, "Utilization of FGD Solid Waste in the Form of By-
product Agricultural Fertilizer," EPRI 1990 SO2 Control Symposium, vol. 1, 3b. 6. Kirk-Othmer, Encyclopedia of Chemical Technology, fourth edition, vol. 2,706, John
Wiley & Sons, New York, 1992 7. Higson, G.I., The Manufacture of Ammonium Sulphate from Anhydrite, Chemistry
and Industry, 750-754, September 8, 1951. 8. Nitrogen, Conversion of Gypsum or Anhydrite to Ammonium Sulfate, Nitrogen, 46,
MarcWApril 1967. 9. Blouin, G.M., O.W. Livingston, and J.G. Getsinger, Bench-Scale Studies of Sulfate
Recycle Nitric Phosphate Process, J. Agr. Food Chem., vol. 18, 313-318, 1970. 10. Meline, R.S., H.L Faucett, CH. Davis, and A.R. Shirley Jr., Pilot-Plant
Development of the Sulfate Recycle Nitric Phosphate Process, Ind. Eng. Process Des. DeveIop., vol. 10, 257-264, 1971.
Table 1. Results of particle size anawis of the FGD-gypsum
Siie 5%
> 149pm' 0.97 149-74 pm' 15.40 < 74pm' 83.60
average diameter em), 73.88 standard deviation2 35.63
'By S I e v e analyss; 'ny Micro 'Itac 11
Table 2 Results of ASTM chemical analysis of the FGD-gypsum
Composition in WL % Analytes moisture free basis
combined water 20.59 G O 3292 MgO 0.01 so4 54.90 so1 co.01 co2 0.71 NH, <0.01
Free Moisture co.01
Calculated Values
C~SO,.~H,O 98.36 1.60
co.01 Caco, Caso, Caso, co.01 M E O i 0.01 (Nrq),S04 co.01
/
I
f I
Table 3. Reaction conditions and the results of fmal product and by-product analyses
Caco, W4)ZW I Run Run 'Mole
number Conditions ratio ' Wt% lCalculated 'purity 'Calculated 'm.p. residue yield yield ('C)
1 70'CShr 1.56 97 ND ND ND 242 2 70'C6hr 1.59 86 ND 95 82 237 3 70'C6hr 1.33 81 81 ND 83 241
NH, C02 clco, (NH4)ZSO' Run Run
number conditions m o k h Lwt% in Icalculated 'purity 'Calculated h p . residue yield yield ('C)
ND ND 99 58 240 4 60'C4h+ 1.50 1.25 5 6YC6hF 1.25 1.00 94 104 9s 83 241 6 70eC6h14 1.25 1.00 ND ND 90 76 2?.7 3
]Based on theoretical yield kom FGD-gypsum feed; 'Wet chemical analysis by ASTM c-171 and AWWA procedures; SMelting point for the standard is 240'C; 61.9S mole of gypsum used.
I/ /
899

Figure
100-
95 -
9 0 - 8 5 -
-0.4
- 0 . 2
0
80 - 206.73 C 79.46:
8 0 -
6 0 -
40-
20-
weight (:) Deriv. Weight ( : / C ) 100 0.8
9 0 - 0.6048%/C - 0 . 6
80 - -0.4
70 - -0.2
6 0 - -̂ 0
i 5 a . 8 1 c 57.83:
50 ! , -0.2 0 200 400 600 800 1000
Temperature ( C )
Figure 2 Typical TGA weight loss profile and first derivative for solid by-product (CaCO,) from the ammonium sulfate production.
loo,% 2.5
-2.0
-1.5
-1.0
-0 .5
- - 0 . 0
o , , , , , i -0.5
\ '
1'
I
900
J
I
TECHNO-ECONOMIC EVALUATION OF WASTE LUBE OIL RE-REFINING IN SAUDI ARABIA
Mohammad Farhat Ali, Abdullah J. Hamdan and Faizur Rahman DEPARTMENT OF CHEMISTRY
Kine Fahd Universitv of Petroleum & Minerals " Dhahran: Saudi Arabia
Keywords: Waste Lube Oil. Re-refining, Economics
INTRODUCTION
Abut 80 million gallons of automotive lubricating oils are sold in Saudi Arabia. Much of this oil, after use, is actually contributing to the increased pollution of land because of indiscriminate dumping. Any scheme of secondary use of the waste lube oils would be of interest both for conservation of energy resources and for protection of environment. This paper discusses the secondary use for the used automotive lubricating oils. Process technology of Meinken, Mohawk and KTI were selected for the techno-economic feasibility study for re- refining used oil. Profitability analysis of each process is worked out and the results are compared.
In many counmes the re-refining of the used oils has become an important industry. The objective of recovering high quality raffinates is attained through the use of widely differing techniques.
The processes concerned can be classified according to the chemical or physical method of- used-oil pretreatment selected. Meinken process is based on chemical pretreatment whereas, both Mohawk and KTI processes employ physical methods involving distillation and eliminates the use of sulfuric acid thus providing a facility for safer operation than Meinken.
The plant capacity of two existing units in Jeddah are 10.000 TPA and 80,000 TPA re- refining of waste oil. We selected a plant of 50,000 TPA waste oil re-refining for economic study of these three processes.
Both Mohawk and KTI have been running full range plants in different parts of the world and appear to be efficient and viable. Meinken have successfully implemented more than 60 used oil re-refining plants world wide including Kuwait Lube Oil Company, Iran Motor Oil Company, Saudi Lube Oil Company Limited, Jeddah, and Lube Oil Co. Ltd., Jeddah.
PROCESS TECHNOLOGIES
Meinken Process
The used oil is supplied to the re-refinery by railway tankers, road tankers or in barrels. Before the used oil flows into the waste oil storage tanks, it passes through the filters to remove solid impurities. A block flow diagram of re-refining process is shown in Figure 1.
Meinken process is based on chemical pretreatment [I] . The dewatered oil is treated with sulfuric acid (96 %) and the acid refined oil is vacuum distilled to separate lube base oil from the low boiling spindle oil and gas oil. With sulfuric acid treatment it is necessary to dehydrate the feedstock completely before subjecting it to acid treatment to prevent dilution of the concentrated sulfuric acid. On the other hand, there is no need to remove crankcase "dilution" or fuel components ahead of the acid-treating step, since these could be conveniently stripped from the hot oil in the subsequent clay contacting step. Their presence during acid treatment reduces the viscosity of the oil and thereby increase the ease of separating the acid sludge. However, the sulfuric acid - treatment and clay addition produce waste streams like acid tar and spent clay resulting in a problem of waste disposal. Inspite of the disposal problem associated with Meinken process, the Meinken technology appears to be very popular. At present, there are about 60 such refiners around the world using the same system. New refineries of this w e are in various stages of consauction and planning in Kuwait, Saudi Arabia, UAE, Oman and India manifesting the technology to be well proven and widely accepted.
Mohawk Process
A simplified block flow diagram of the Mohawk-CEP process is shown in Figure 2. This is claimed by the licensors to be. the newest and yet proven high-efficiency re-refining technology. Mohawk technology has been licensed to Chemical Engineering Partners, a private chemical engineering design company based in California, U.S.A.
The fust stage of the process removes water from the feedstock [5,6]. The second stage of the process is distillation, at this step light hydrocarbons are removed resulting in a marketable
901
fuel by-product. The third stage, evaporation, vaporizes the base oil, separating it from the additives, leaving behind a by-product called residue. This residue is used in asphalt indusq. me final processing stage is hydrotreatment which results in a high quality base oil.
The Mohawk process features continuous operation, low maintenance, longer catalyst life span, reduced corrosion, and proven technology.
KTI Process
Kinetic Technology International (KTI) of the Netherlands, in close cooperation with Gulf Science and Technology Co. (Pittsburgh, Pa.) has developed a new re-refining process for all types of waste lubricating oils [5,101.
The KTI waste lube oil re-refining process involves a series of proprietary engineering technologies that affords high economic returns without resulting in environmental loads. The main features of the KTI process include : (a) high recovery yield up to 95 7% of the contained lube oil; @) excellent product quality; (c) flexible operation with wide turndown capability; (d) no requirement for discharging chemicals or treating agents; (e) absence of non commercial by- products; and (f) reliable, inexpensive treatment of waste water contained in the wasted lube oil.
The important steps of this process are as follows. Atmospheric distillation, which removes water and gasoline. Vacuum distillation using special wiped film evaporators separates lube oil from heavy residue containing metals and asphaltenes. The next step is hydrofinishing of lube oil. Hydrogen rich gas is mixed with the oil and heated before passing through the reactor. The treated oil is then steam smpped or fractionated into cuts using a vacuum in order to obtain the right specification.
ECONOMIC EVALUATION
Capital Investment
The total fixed capital investment to process 50,000 TPA of waste oil was obtained from Meinken [l] and Mohawk [6] in 1991. Location factor of 1.25 was used to estimate the fixed capital costs for Saudi location [2]. Table 1 lists the total fixed capital investment estimated for both the technologies. Working capital for the re-refinery was estimated by itemizing the production costs components [12]. It varies with changes in raw material prices, product selling price and so on.
Economic evaluation of KTI process could not be carried out because of non-availability of complete cost data.
Production costs
Production costs consists of direct costs, indirect costs and general expenses.
Direct cost includes expenses incurred directly from the production operation. These expenses are : raw materials (including delivery), catalysts and solvents, utilities, operating labor, operating supervision, maintenance and repairs, operating supplies, royalties and patents.
Raw material prices were estimated from F.O.B. prices in Germany in September 1991 r1.31 and includes $90.0 per ton for shipping. Local price was used for sulfuric acid. Cokction Cost of waste oil in Jeddah [I], Saudi Arabia was estimated as $53.52 per ton. By- product(gas oil) price $1 10 per ton was taken from Petroleum Economist[9], for Caltex, Bahrain location. By-product asphalt price $130.0 per ton was taken from CMR 131, but reduced by 15% as it needs some more processing. If the asphalt residue can not be sold at international price due to low demand in this region, its price has to be further reduced. For economic analysis purposes, the price of asphalt residue was still lowered by 50 I. This is an approximation and the price used finally in the calculations is $55.0 per ton of asphalt residue.
The raw nuterials, utilities, and manpower requirements are given in Table 2 which were obtained from Meinken [ I ] and Mohawk [8]. Table 3 lists raw materials, utilities and manpower costs estimated for Saudi Arabian location [2,1 I]. Natural gas price was taken as $0.5 per million Btu [21 and the benefit of low price of natural gas is reflected in utilities costs such as electricity and steam. However, process water is expensive in Saudi Arabia because it is produced from desalination plants.
Operating costs which includes operating labor, supervision, maintenance and repairs and indirect costs which includes overheads, storage and insurance, and general expenses were estimated according to the standard procedures [ 7,13,141.
902

d
Sumation of all direct costs, indirect costs and general expenses results in a production Cost. Table 4 illustrates production cost of re-refining waste oil resulted from the two technologies. The estimated production cost for Meinken process was $348.8 per ton and for Mohawk process it is $198.4 per ton of re-refined oil.
For Meinken process the raw materials cost is about 54 % of the production COS^ Utilities is 3.0 %, operating cost is 17.2 %, total indirect costs is 20.4 % and general expenses about 7.4 % of the total product cost. The share of raw materials cost in the total product Cost is dominant. \
In case of Mohawk process the raw materials cost is about 42.7 % of the total product Cost. By-products are 12.4 %, utilities are 8.8 %,operating cost 23.0 %, total indirect costs are 25.4 % and general expenses are 12.5 % of the total product cost. So, the production cost will be sensitive to raw materials prices and sensitivity analysis was performed for different raw materials price.
Profitability Analysis
The profitability of an industrial opportunity is a function of major economic variables such as product selling price, raw materials prices, capital investment, energy prices and so on. Year-by-year cash flow analysis have been carried out using assumptions and financial arrangements described in Table 5.
From the analysis of production costs (Table 4) components, it is obvious that the raw materials cost is the dominant item. So, sensitivity analysis were performed for 15 % lower and 15 % higherraw materials prices than prevalent in September 1991.
Since the re-refined oil is not segregated into different neutral oils and bright stock, following typical composition was assumed: 10 % 300 SN, 80 % 500 SN and 10 % bright stock. Based on LUBREF, Jeddah [4] base oil prices of various grades an estimated selling price of $415.60 per ton is used in the financial analysis.
The year-by-year cash flow analysis for international raw materials prices (base case) in September 1991 and for 15 % lower and 15 % higher raw materials prices have been carried out. The results of cash flow analysis are summarized in Table 6. Figure 3 shows the effect of raw materials prices on internal rate of return (IRR).
The total fixed capital investment is very high for Meinken process (28.750 million $) as compared to Mohawk process (17.7 13 million $). The working capital amounts to a high value of 4.998 million US. Dollars for Meinken as compared to relatively low value of 3.050 million Dollars for Mohawk.
The payback period(PBP) and break-even-point (BEP) for Meinken Process are high as expected compared to Mohawk process, which are 8.16 years and 53.8 % of the full production. The PBP for Mohawk is 1.40 years, and BEP is 28.65 %. The IRR for Meinken and Mohawk are estimated to be 11.24 I and 45.36 %. Thus, the total positive annual cash flow for Mohawk process appears to be. more attractive than that for Meinken. The high profitabilities of Mohawk process are due to lower capital costs as a result of (i) excluding hydrogen plant and (ii) possibly due to relatively not well established technology as compared to Meinken process.
The main disadvantage of Mohawk process is that, the plant has to be located near a refinery or petrochemical plant (because of hydrogen supply) to be able to realize such high prufitabilities. If the facilities are to be provided with an independent hydrogen plant, then the capital costs may go up significantly and subsequently profitabilities will be dropped.
ACKNOWLEDGEMENT
The investigators wish to acknowledge King Abdul Aziz City for Science and Technology (KACST) for funding this Research Project (AR-10-60). The facilities and suppon provided by the Department of Chemisuy and the Research Institute of King Fahd University of Petroleum and Minerals (KFUPM) is also gratefully acknowledged.
REFERENCES
1.
2.
B. Meinken, Private Communication, B. Meinken Project and Construction Management Consultants, Haltern, Germany, 1991.
SRI, PEP Yearbook International, Volume 1, SRI International Menlo Park, California, U.S.A., 1989.
903

3.
4.
5 .
6.
7.
8.
9.
10.
11.
12.
13.
14.
Chemical Marketing Reporter, Schnell Publishing Company, Inc., New York, U.S.A., September 1991.
LUBEREF, Private Communication, Petromin Lubricating Oil Refining Company, Jeddah, Saudi Arabia, 1991.
Ali, M. F. and Hamdan, A. J. Studies on Used Lubricating Oil Recovery and Re- refining, Third Progress Report, KACST AR-10-60, KFUPM, Dhahran, 1990.
Magnabosco, L.H., M. Falconer and K. Padmanbhan. The Mohawk-CEP Re-refining Process, The Proceedings of Sixth International Conference on used oil Recovery and Reuse, San Francisco, California, May 28-31, 1991.
Garrett, D.E., Chemical Engineering Economics, Van Nostrand Reinhold, New York, U.S.A.. 1989.
Mohawk, Private Communication, Mohawk Lubricants, A Ltd., Bumaby, B.C., Canada V5G 4G2, 1991.
Petroleum Economist, p.31, June 1991.
Division of Mohawk Oil co.
KTI, Waste Lube Oil Re-refining for King Fahd University of Pemleum and Minerals, Dhahran, Document No. 10091, Kinetic Technology International Corp., California, U.S.A., 1989.
TECNON, List of Heavy Petrochemical Indusmes for Royal Commission for Jubail and Yanbu, Madinat Yanbu Al-Sanaiyah, K.S.A., TECNON (UK) LTD., Peuochemicals Marketing and Planning Consulting Services, London, U.K. 1988.
Bechtel, L.R., Estimate Working Capital Needs, Chemical Engineering, 67 (4): 127 1960.
Axtell, O., Economic Evaluation in the Chemical Process Industries, John Wiley and Sons, New York, U.S.A., 1986.
Ulrich, G.D., A Guide to Chemical Engineering Process Design and Economics, John Wiley and sons, New York, U.S.A., 1984.
904

/
i
f
Table 1. Capital investment of 50,OOO TPA waste oil re-refining plant in Saud ihb ia .
Roc+ss Technology
Meinken, Germany 28.750 Mohawk, Canada 17.713
Total Fixedcapital in 1991 (Million US $ )
Table 2. Raw materials utilities and manpower requirements per ton of product.
-Waste oil. ton - Sulfuric Acid, ton - Activared clay, ton - Lime. ton - Ammonia water(2395). ton - Catalyst. kg
* Gas oil. ton * Asphalt, ton
Lulk.x - Cooling water, ton - Pmcess water, ton * Hydmgen, ton -Steam, ton
Manoower:
Fuel oil, ton
* Total men for 3 shifs
-ve) Sign indicates by-prcduci
Meinken pmcess
1.266 0.095 0.049 0.214 0.008 -
- 0.060 -
0.075
75.000 - - -
33
Mohawk pmcess
1.343 - - - - 3.76
0.135 0.176
0.116 2.003
97.020 0.003 0.667
31
, Table 3. Raw materials, utilities and manpower costs in Saudi Arabia.
Item
* Waste oil, ton - Sulfuric Acid, ton - Activated sludge, ton * Lime, ton - Ammonia water (23%),ton - Catalyst, kg
Ihditia * Fuel oil, ton
Cooling water, ton * Process water. ton 9 Electricity, Kwh Hydrogen, ton
* steam. ton
Manwwer: * One man year ($/year)
Cost ($/unit)
53.52 160.00 673.00 316.00 387.00
3.41
110.00 0.019 0.803 0.015
65.000 4.630
18.000
905

Table 4. Production cost data.
Total fixed capital Working capital SIDF loan Annual vanable expenses Annual fixed expenses Annual sales Payback period (years) Bd-even-point (% capacity) IRR (96/year)
h e m
. Raw materials - By-p-cduc~s -operating Cost
Indirect cost
General Expenses
TOlal production cost
_ _ _ _ _ ~
Meinlren Mohawk RocesS R o c e s S
28.750 17.713 4,999 3.111
16,875 11,356 7,587 2.873 4,746 3.852
16.410 15,377 8.2 1.4
53.8 28.7 11.2 45.4
Meinken mess
188.21 -6.64 70.63
71.03
25.56
348.79
Table 5 . Basis of financial calculations.
ltem I
Mohawk Recess
84.70 -24.52 63.08
50.34
24.82
198.41
Project life Consuuction period Depreciation method Salvage value Equity/SIDF loan SIDF Loan fee Loan payment
Tax rile Inflation Capital expenditure: . 1st year * 2nd year - 3rd year
Capacity utilization: * Istyear * 2nd and subsequent years
~ _ _ _ _ _
Calculaied Basis
20 years 3 w Straight line zao 50% each 3% 7 equal installments stanin8 2 years afler plant start-up 2.5 % 0.0 ?6
20% of fixed capital 45% of fixed capital 35% of rued capital plus
working capital
6046 100%
Table 6. Profitability of rerefining 50,OOO TF’A waste oil in Saudi Arabia (IO00 $)
906
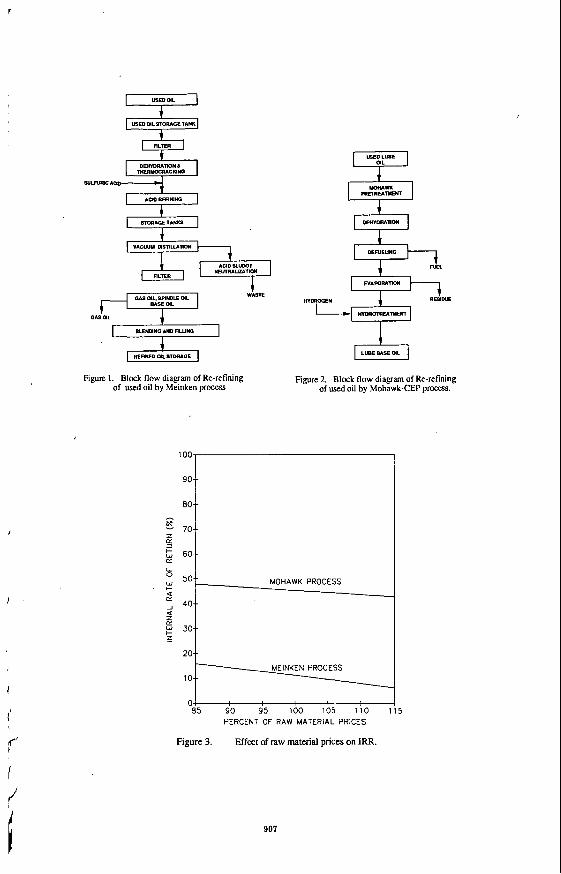
r I
90-
80-
R - 70.- z I T ' 3
I
I
1
(I
rc'
d VACWY usnunow
Figure 1. Block flow diagram of Re-refining of used oil by Meinken process
Figure 2. Block flow diagram of Re-refining of used oil by Mohawk-CEP process.
0 4 85 90 95 100 105 110
PERCENT OF RAW MATERIAL PRICES
Figure 3. Effect of raw material prices on IRR.
5
907