strategies to strengthen bird productivity and business ... · pdf filestrategies to...
TRANSCRIPT
Final Technical Report
Project Number 7631
Strategies to Strengthen Bird Productivity and Business Decision Making in Peri-urban
Smallholder Poultry Flocks in Ghana
Contents
Page No. Executive Summary i Background 1 Project purpose 1 Research Activities 2
Methodologies and Results 2
Project A: Free-range indigenous chicken keeping in peri-urban 2 Accra
Project B: Smallscale chicken keeping in peri-urban Accra 38
and Kumasi Project C: Baseline market information for the Accra broiler 99
market Project D: Smallscale broiler production in peri-urban areas of 124 Ghana and the potential of business management methods for improved management
Project E: On-station feeding trials 155
Other activities
Feed manual 163 Training 163 Outputs 165 Contribution of outputs 176 References 179 Publications 181 Annexes 182
i
Executive Summary Smallscale poultry producers in Ghana are faced with increasing costs of inputs while the price of their
products, particularly poultry meat, remains static. This project identifies the role and importance of
back-yard poultry production to peri-urban livelihoods, develops appropriate technical interventions
and business methods for small-scale backyard poultry producers to increase productivity and provides
market information to improve opportunities.
Cross-sectional surveys were used to describe free-range village chicken systems and more intensive
systems of egg and poultry meat production using exotic strains. Village systems were characterised as
low-input, low-output. The relative importance of chicken sales to household incomes varied between
households, and appeared to be of particular importance in households with apparent interests in larger
classes of livestock. The first limiting constraint to increasing poultry numbers and output in such
systems was Newcastle disease, followed by the availability of feed for poultry.
More intensive systems of poultry production varied in scale, the size of the operation partly
determining whether the enterprise contributed to or was the sole means of income for a household.
Such systems, even comparatively small operations, frequently employed labour. Over 90% of
operations kept laying birds although over 70% also kept meat birds. Feed and feed prices were
identified as one of the most important constraints to business. Perceptions of the importance of disease
and the maintenance of health varied between regions. The results suggested that the producers around
Accra had achieved control over major diseases but these continued to be of concern for producers
around Kumasi. A majority of respondents (70%) sold their products to traders or middlemen, the low
prices obtained being of concern.
Longitudinal surveys examined factors contributing to the gross margins of broiler producers. Higher
gross margins were consistently a result of both lower costs and higher income per bird. Feed costs
were the major cost but all producers paid similar prices for feed. Higher prices per bird were the result
of birds being heavier and because of better marketing. Promotion of transferable practices in the
second survey resulted in improved marketing and some producers reducing the length of their
production cycle thereby reducing costs. Participatory budgeting worked well as a practical business
management method for use by and with producers.
Market opportunities for locally produced birds were found to be most promising among caterers and
supermarkets. Both outlets required carcasses of a specific weight range and had other conditions
relating to presentation. Most outlets did not actively seek suppliers.
On-station feeding trials compared a number of diets formulated from predominantly locally available
feedstuffs for layers and broilers. The results contributed to the development of a feeding manual for
local producers which provides formulations of 26 diets for layers and broilers.

ii
Results from the project suggest that attention must be given to protecting free-range village flocks
from Newcastle disease as a first step in increasing productivity. However, the provision of vaccination
must be preceded by the acquisition of a better understanding of how larger more productive flocks
could be maintained. Improvements of livelihoods of producers with intensive systems could be
achieved if producers were to organise themselves effectively into producer associations and to acquire
the skills required to effectively market their products, thus achieving a greater share of the final
product price. Such organisation might also lead to improvements in the supply of inputs such as
vaccines and day-old chicks, both of which are a concern to at least some of the farming community.
1
Background Ghana is one of many countries working through the process of structural adjustment. Major problems
are faced by small producers of agricultural commodities because of the high costs of inputs, while
these high costs are in turn the result of devaluation and import dependency. Producer output prices are
static, the result of the restricted purchasing power of the majority of the population. Those wishing to
move from scavenger or semi-intensive production to small scale commercial poultry production have
increasingly high start up costs. In addition, credit availability is limited as conventional credit
channels fear the “riskiness” of poultry enterprises.
Small peri-urban backyard producers are especially disadvantaged by falling margins, as they cannot
expand (lack of space, lack of cash or credit), they are often more dependent on the market for inputs,
and have higher production costs, in particular feed costs, than rural producers. They must try to
improve efficiency and add value to their products by targeting their markets more effectively,
although they may lack all-year markets and are facing competition from frozen imports. They must
adjust to the forces of market liberalisation if poultry production livelihood opportunities are to be
maintained. The small family producer is unable to adjust to the changing environment because of the
lack of technical knowledge, business planning skills, knowledge of the market chain, and credit.
Unless back-yard producers become more cost-effective, and improve their market, family livelihoods,
and the opportunities they present, in particular for women and young men, will be lost.
Project Purpose The objectives of this work are to:
1. Identify the role and importance of back-yard poultry production to peri-urban livelihoods and
to characterise different peri-urban target groups;
2. Develop appropriate technical interventions and business methods for small-scale backyard
poultry producers to increase productivity, and improve household income generation using
the participatory technology development approach. Specific feed interventions will be
examined in producers flocks;
3. Provide market information to improve market opportunities through product or service
intervention with the objective of assisting market expansion for small producers;
4. To obtain a historical perspective on poultry unit development and to examine the possibilities
of using this experience to assist younger, smaller, scavenger or less intensive systems to
expand or intensify their system.
2
Research Activities: Methods and Results
Free-range Indigenous Chicken Keeping in Peri-urban Accra
1. Introduction The majority of households in Ghana, as in much of Sub-Saharan Africa, keep free-range, indigenous
chickens. The birds contribute food to the household, are sold for cash, and play a social role by
providing a source of gifts, hospitality or tribute. As chickens are mainly cared for by women, they are
often regarded as being a particularly valuable resource in providing cash for family and child welfare.
Village chickens have largely been ignored by national and international agencies until relatively
recently. There is now a growing awareness of their importance to rural livelihoods, although good data
continues to be scarce. The results published here were collected in rural areas of peri-urban Accra,
where poultry keepers may well expect advantages in terms of marketing and availability of inputs
because of the proximity of the city. The objectives of the study were (1) to describe the husbandry of
free-range, indigenous chickens, (2) to establish some knowledge of the chickens’ performance and the
constraints to that performance, (3) to gain some appreciation of the contribution that chickens make to
household livelihoods, and (4) to establish the effectiveness of knowledge and information pathways.
2. Materials and Methods 2.1 Study area
The study was carried out within a perimeter of 60km from Accra. Four of the eight administrative
districts around Accra were selected at random (Tema, Awutu-Efutu-Senya, Ga and Dangme West).
Tema, Ga and Dangme West are in the Greater Accra Region while Awutu-Efutu-Senya (Awutu) is in
the Central Region of Ghana. A list of villages was drawn up with the Agricultural Extension Agent
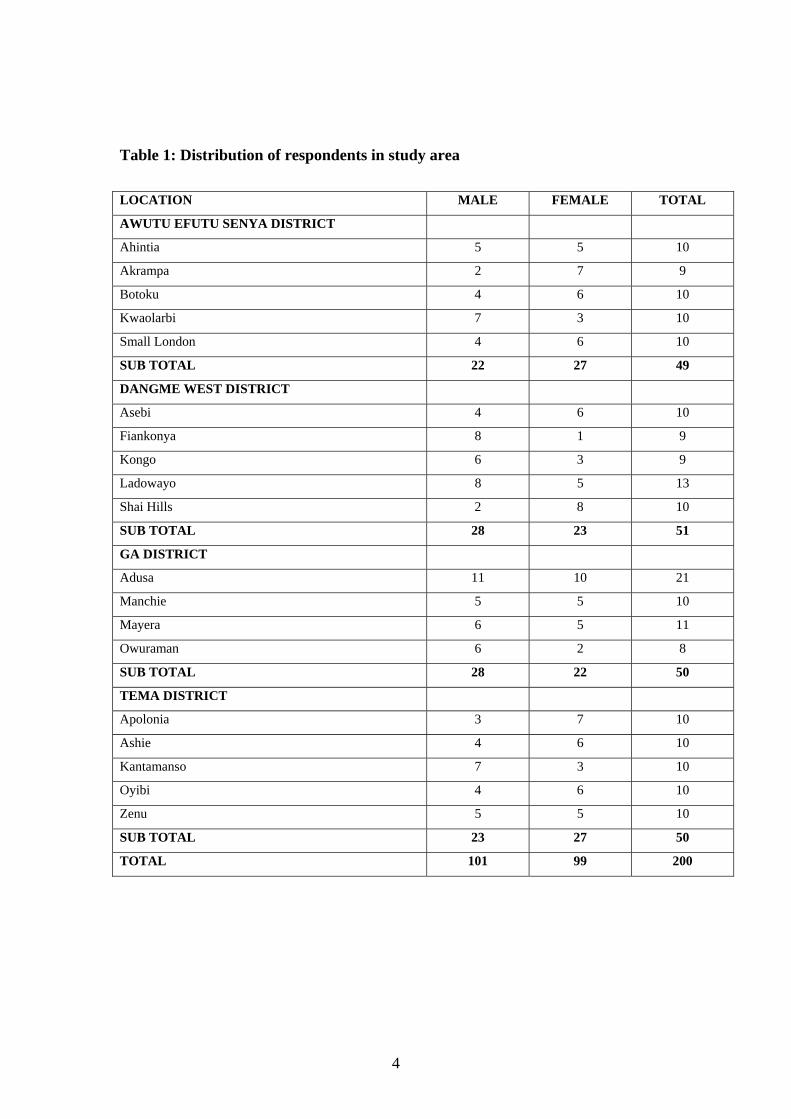
(AEA) and 5 villages (4 in Ga) randomly selected per district. A list of the villages and the number of
farmers interviewed per village is shown in Table 1.
2.2 Data collection
Two methods were used in the collection of data: a rapid appraisal that entailed focus group
discussions, followed by a sample survey. Focus group discussions were held separately with men and
women with 6 to 10 participants in five villages. A semi-structured interview schedule was used that
included such topics as ownership of chickens, feeding and watering of chickens, types of feed, health
of chickens, and labour use among family members. Responses were used in the development of the
questionnaire to be used in the sample survey. The resulting questionnaire was used in a pilot study to
allow testing and further modifications.
3
The questionnaire was designed to maximize the number of closed (categorical) questions in order to
ease data processing, minimize variation and improve precision of responses. In particular, the
questionnaire aimed to investigate relative importance of free-range, indigenous chickens to the welfare
of rural households in close proximity to a large urban centre. Attention was also given to aspects of
animal performance and husbandry. Additional questions covered possible knowledge pathways and
the aspirations of households to increase the contributions made by chickens to income.
Ten enumerators were involved in the administration of the questionnaire. All were given a one-day
training session when they were introduced to the objectives of the study and taken through the
questionnaire. The questionnaire was administered in the local languages that were predominantly
Fante and Ga-Adangme.
Introduction to each village was through the Agricultural Extension Agent. Permission to carry out the
study was sought from the village chief or headman and farmers were forewarned of the study by the
AEA. Random sampling of farmers proved difficult and it became necessary to resort to accidental
sampling. One person per household, male or female, was interviewed with the intention of achieving a
gender balance. Responses were finally obtained from 101 men and 99 women.
1.3 Definition of variables The effects of the following variables were investigated in the analysis: Administrative district (Tema, Awutu, Ga and Dangme West) Gender of respondent Main occupation (categorised as crop farmer, animal farmer, trader, civil servant or other) Number of people in household Acreage of crops Number of livestock other than poultry in the household (defined as livestock units (LU) where 10
sheep or goats are equivalent to 1 cow).
1.4 Data processing and analysis
Dataset files were designed in Microsoft Access to store data on an individual respondent basis. Data
was entered into the files when questionnaires were returned from the field. Data analysis was
performed using SAS. Responses were compared between variables by chi-squared analysis, using
contingency tables where there were several possible outcomes.
4
Table 1: Distribution of respondents in study area
LOCATION MALE FEMALE TOTAL
AWUTU EFUTU SENYA DISTRICT
Ahintia 5 5 10
Akrampa 2 7 9
Botoku 4 6 10
Kwaolarbi 7 3 10
Small London 4 6 10
SUB TOTAL 22 27 49
DANGME WEST DISTRICT
Asebi 4 6 10
Fiankonya 8 1 9
Kongo 6 3 9
Ladowayo 8 5 13
Shai Hills 2 8 10
SUB TOTAL 28 23 51
GA DISTRICT
Adusa 11 10 21
Manchie 5 5 10
Mayera 6 5 11
Owuraman 6 2 8
SUB TOTAL 28 22 50
TEMA DISTRICT
Apolonia 3 7 10
Ashie 4 6 10
Kantamanso 7 3 10
Oyibi 4 6 10
Zenu 5 5 10
SUB TOTAL 23 27 50
TOTAL 101 99 200
5
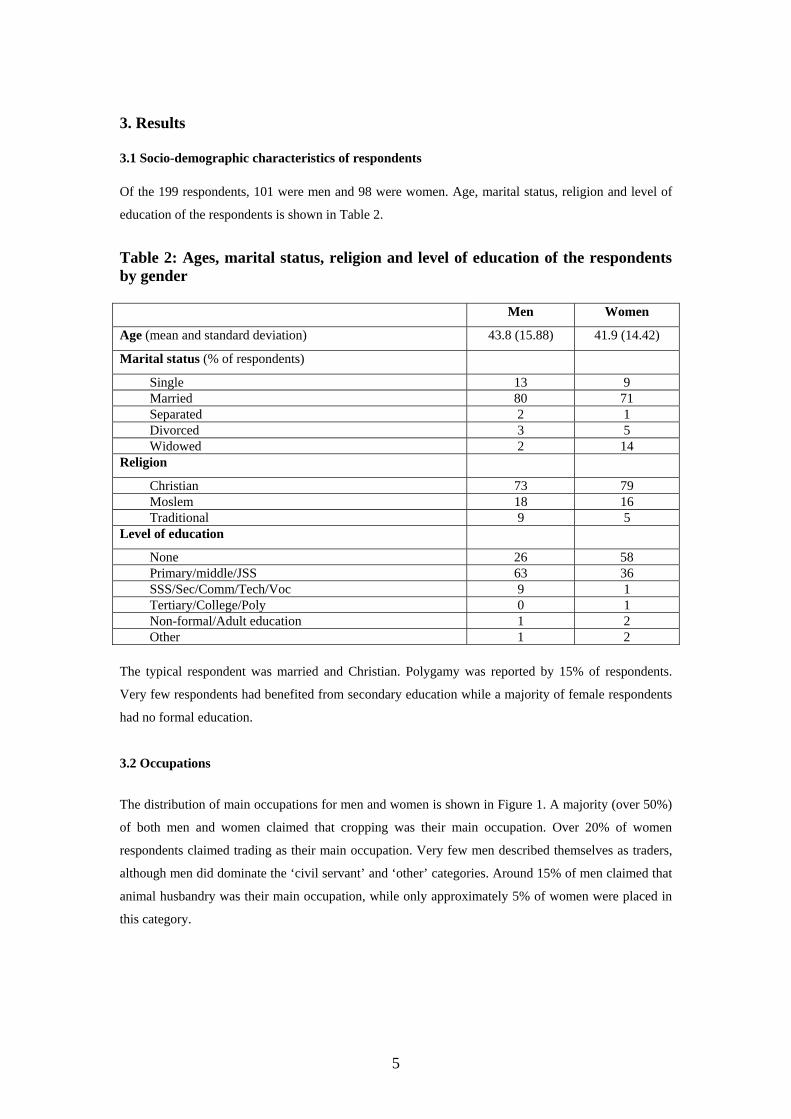
3. Results 3.1 Socio-demographic characteristics of respondents Of the 199 respondents, 101 were men and 98 were women. Age, marital status, religion and level of
education of the respondents is shown in Table 2.
Table 2: Ages, marital status, religion and level of education of the respondents by gender
Men Women
Age (mean and standard deviation) 43.8 (15.88) 41.9 (14.42)
Marital status (% of respondents)
Single 13 9 Married 80 71 Separated 2 1 Divorced 3 5 Widowed 2 14 Religion
Christian 73 79 Moslem 18 16 Traditional 9 5 Level of education
None 26 58 Primary/middle/JSS 63 36 SSS/Sec/Comm/Tech/Voc 9 1 Tertiary/College/Poly 0 1 Non-formal/Adult education 1 2 Other 1 2 The typical respondent was married and Christian. Polygamy was reported by 15% of respondents.
Very few respondents had benefited from secondary education while a majority of female respondents
had no formal education.
3.2 Occupations
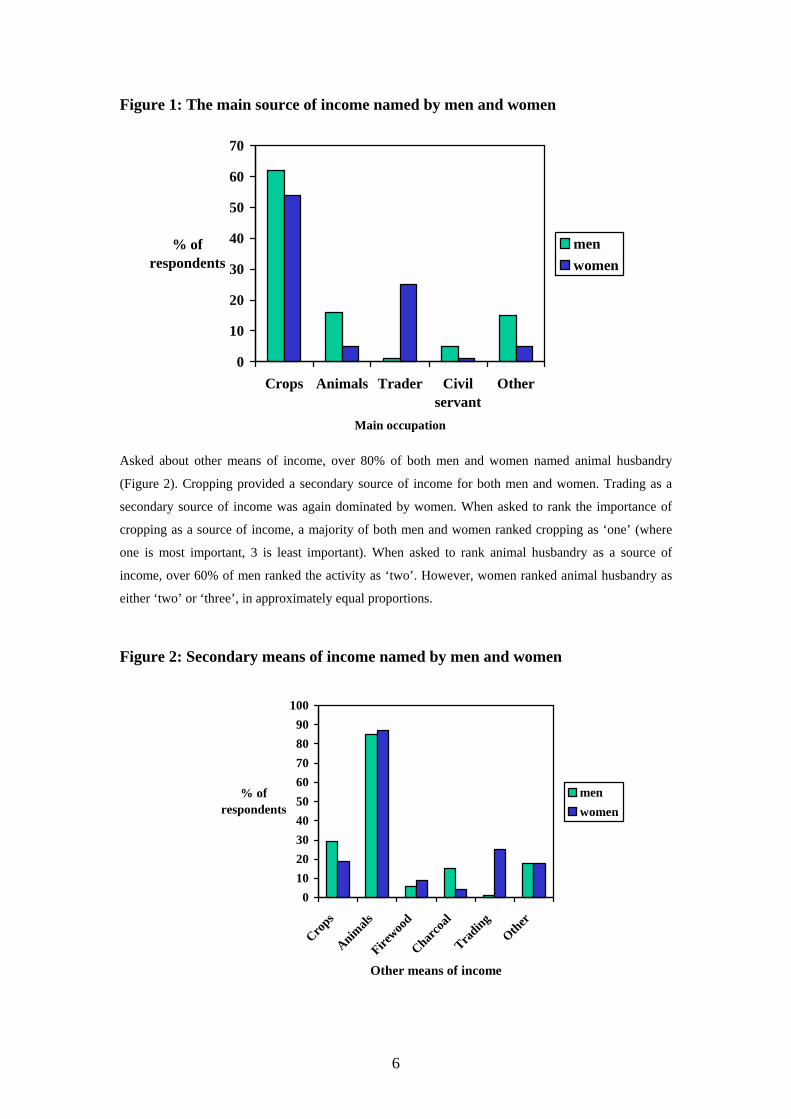
The distribution of main occupations for men and women is shown in Figure 1. A majority (over 50%)
of both men and women claimed that cropping was their main occupation. Over 20% of women
respondents claimed trading as their main occupation. Very few men described themselves as traders,
although men did dominate the ‘civil servant’ and ‘other’ categories. Around 15% of men claimed that
animal husbandry was their main occupation, while only approximately 5% of women were placed in
this category.
6
Figure 1: The main source of income named by men and women
Asked about other means of income, over 80% of both men and women named animal husbandry
(Figure 2). Cropping provided a secondary source of income for both men and women. Trading as a
secondary source of income was again dominated by women. When asked to rank the importance of
cropping as a source of income, a majority of both men and women ranked cropping as ‘one’ (where
one is most important, 3 is least important). When asked to rank animal husbandry as a source of
income, over 60% of men ranked the activity as ‘two’. However, women ranked animal husbandry as
either ‘two’ or ‘three’, in approximately equal proportions. Figure 2: Secondary means of income named by men and women
0
10
20
30
40
50
60
70
Crops Animals Trader Civilservant
Other
Main occupation
% of respondents
menwomen
0102030405060708090
100
Crops
Animals
Firewoo
d
Charco
al
Trading
Other
Other means of income
% of respondents
menwomen

7
3.3 Characteristics of administrative areas The means and standard deviations of the number of people in a household, the acreage cultivated by
the household, and the number of LUs other than poultry kept by the household in each of the four
administrative districts represented in the study is shown in Table 3. Dangme West had the largest farm
areas, large numbers of livestock and the largest average number of people in the household. Awutu
had the second largest farm areas but very little livestock. Ga and Tema had the smallest farm areas.
However, while Ga had few livestock, Tema had the largest number of livestock of all four districts.
The large standard deviations for LUs reflect the great range of livestock numbers between households.
Table 3: Means and standard deviations of the number of people in a household, the acreage cultivated by the household, and the number of Livestock Units other than poultry kept by the household in each of the four administrative districts Administrative district Awutu Dangme
West
Ga Tema
No. people in household 6.9 (2.90) 8.3 (4.57) 5.9 (3.48) 6.1 (3.56)
Acreage cultivated by the
household
5.2 (3.91) 9.0 (8.49) 3.3 (3.18) 3.7 (3.60)
No. of Livestock Units per
household
0.53 (0.646) 21.05
(73.981)
0.91 (1.110) 26.21
(45.526)
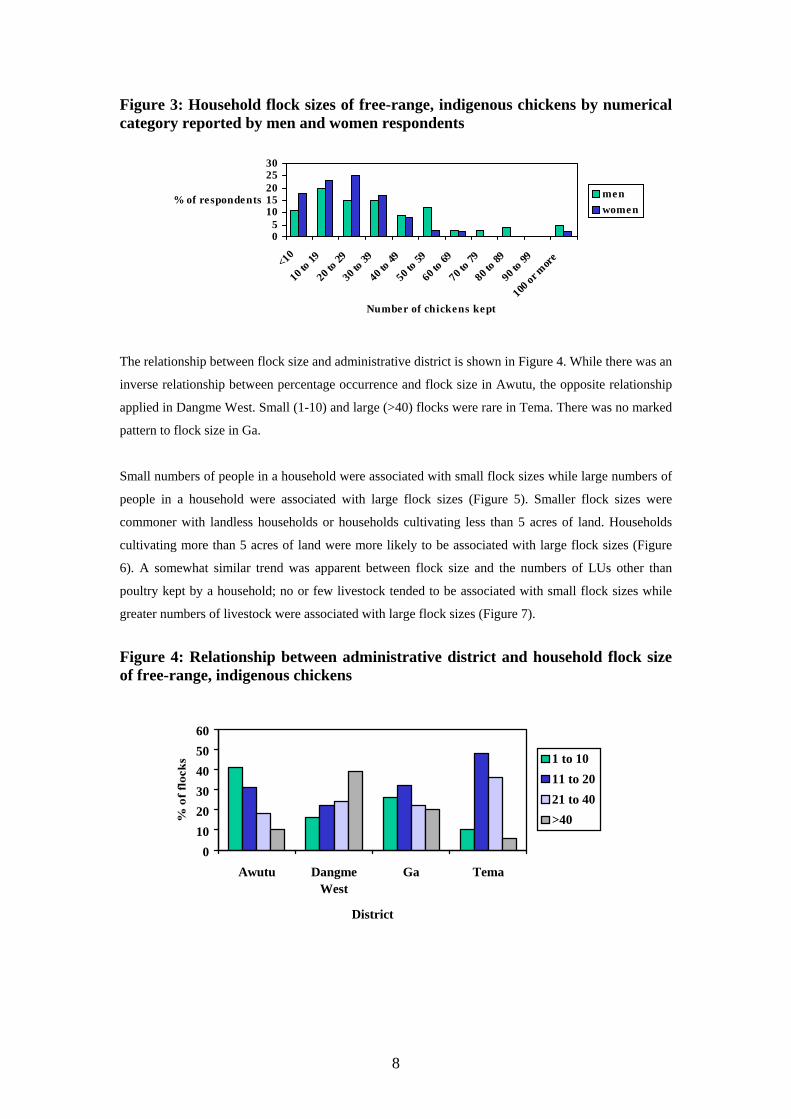
3.4 Numbers of free-range, indigenous chickens kept per household The distribution of household flock sizes of free-range, indigenous chickens by numerical category
reported by men and women respondents is shown in Figure 3. Although flock sizes of over 100 birds
were reported, the majority of household flocks numbered less than 50. Gender of the respondent was
significantly associated with flock size (Chi-square = 15.336; P=0.002). Most women claimed flock
sizes of less than 40, while a substantial proportion of male respondents (30%) claimed flock sizes of
over 40 birds. Factors affecting household flock size included administrative district (Chi-square =
38.292; P<0.0001), number of people in the household (Chi-square = 19.390; P=0.022), the area of
land cultivated by the household (Chi-square = 23.739; P=0.001), and the number of livestock other
than poultry kept by the household (Chi-square = 24.269; P=0.004).
8
Figure 3: Household flock sizes of free-range, indigenous chickens by numerical category reported by men and women respondents
The relationship between flock size and administrative district is shown in Figure 4. While there was an
inverse relationship between percentage occurrence and flock size in Awutu, the opposite relationship
applied in Dangme West. Small (1-10) and large (>40) flocks were rare in Tema. There was no marked
pattern to flock size in Ga.
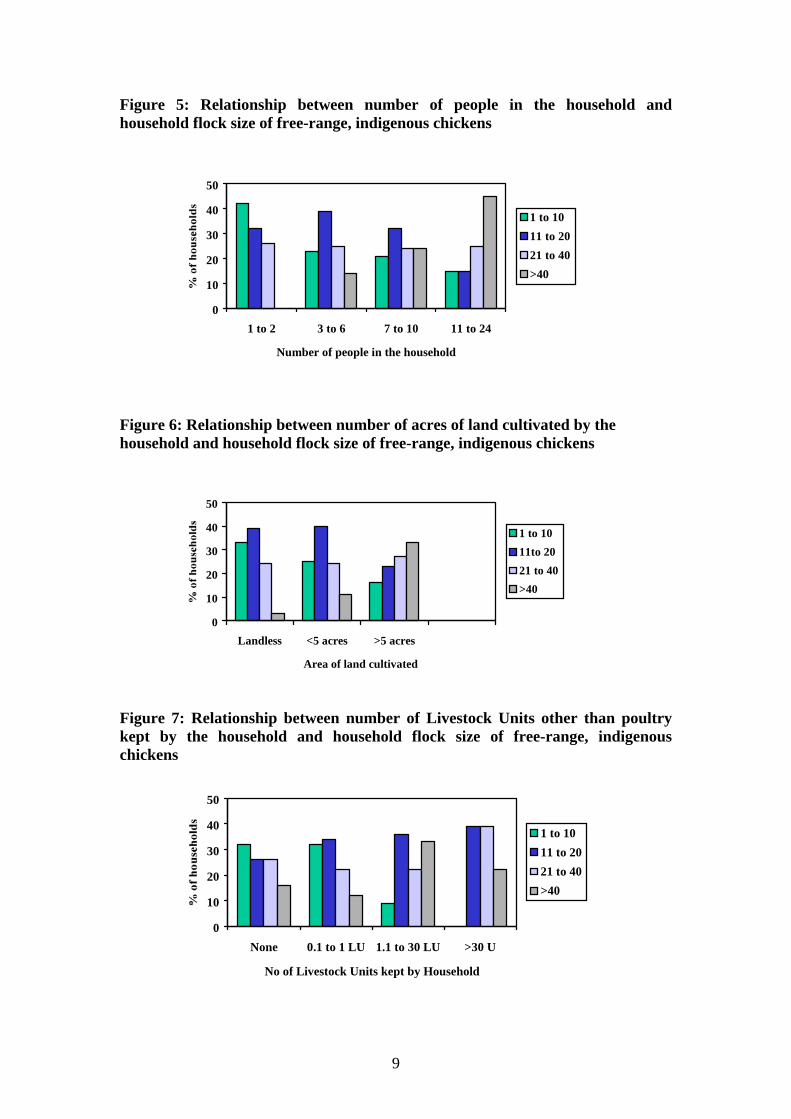
Small numbers of people in a household were associated with small flock sizes while large numbers of
people in a household were associated with large flock sizes (Figure 5). Smaller flock sizes were
commoner with landless households or households cultivating less than 5 acres of land. Households
cultivating more than 5 acres of land were more likely to be associated with large flock sizes (Figure
6). A somewhat similar trend was apparent between flock size and the numbers of LUs other than
poultry kept by a household; no or few livestock tended to be associated with small flock sizes while
greater numbers of livestock were associated with large flock sizes (Figure 7).
Figure 4: Relationship between administrative district and household flock size of free-range, indigenous chickens
05
1015202530
<10
10 to 19
20 to 29
30 to 39
40 to 49
50 to 59
60 to 69
70 to 79
80 to 89
90 to 99
100 or m
ore
Number of chickens kept
% of respondents menwomen
0102030405060
Awutu DangmeWest
Ga Tema
District
1 to 1011 to 2021 to 40>40
9
Figure 5: Relationship between number of people in the household and household flock size of free-range, indigenous chickens
Figure 6: Relationship between number of acres of land cultivated by the household and household flock size of free-range, indigenous chickens
Figure 7: Relationship between number of Livestock Units other than poultry kept by the household and household flock size of free-range, indigenous chickens
0
10
20
30
40
50
Landless <5 acres >5 acres
Area of land cultivated
1 to 1011to 2021 to 40>40
0
10
20
30
40
50
None 0.1 to 1 LU 1.1 to 30 LU >30 U
No of Livestock Units kept by Household
1 to 1011 to 2021 to 40>40
0
10
20
30
40
50
1 to 2 3 to 6 7 to 10 11 to 24
Number of people in the household
1 to 1011 to 2021 to 40>40
10
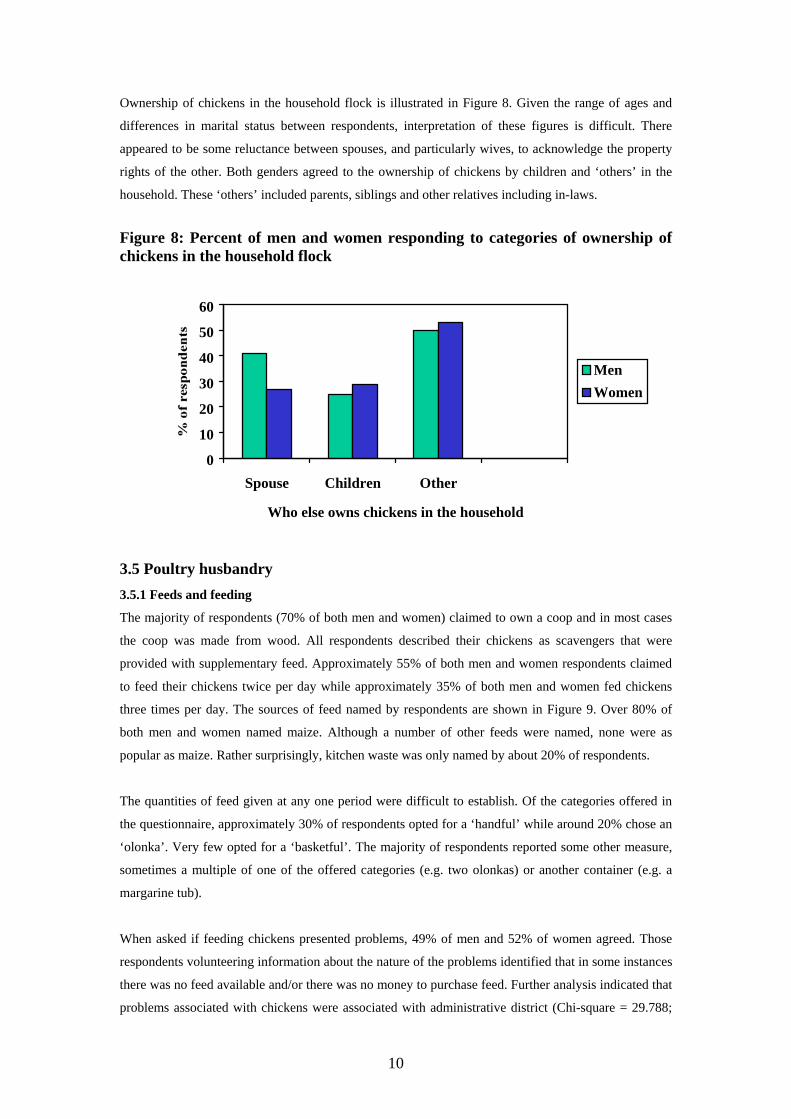
Ownership of chickens in the household flock is illustrated in Figure 8. Given the range of ages and
differences in marital status between respondents, interpretation of these figures is difficult. There
appeared to be some reluctance between spouses, and particularly wives, to acknowledge the property
rights of the other. Both genders agreed to the ownership of chickens by children and ‘others’ in the
household. These ‘others’ included parents, siblings and other relatives including in-laws.
Figure 8: Percent of men and women responding to categories of ownership of chickens in the household flock
3.5 Poultry husbandry 3.5.1 Feeds and feeding The majority of respondents (70% of both men and women) claimed to own a coop and in most cases
the coop was made from wood. All respondents described their chickens as scavengers that were
provided with supplementary feed. Approximately 55% of both men and women respondents claimed
to feed their chickens twice per day while approximately 35% of both men and women fed chickens
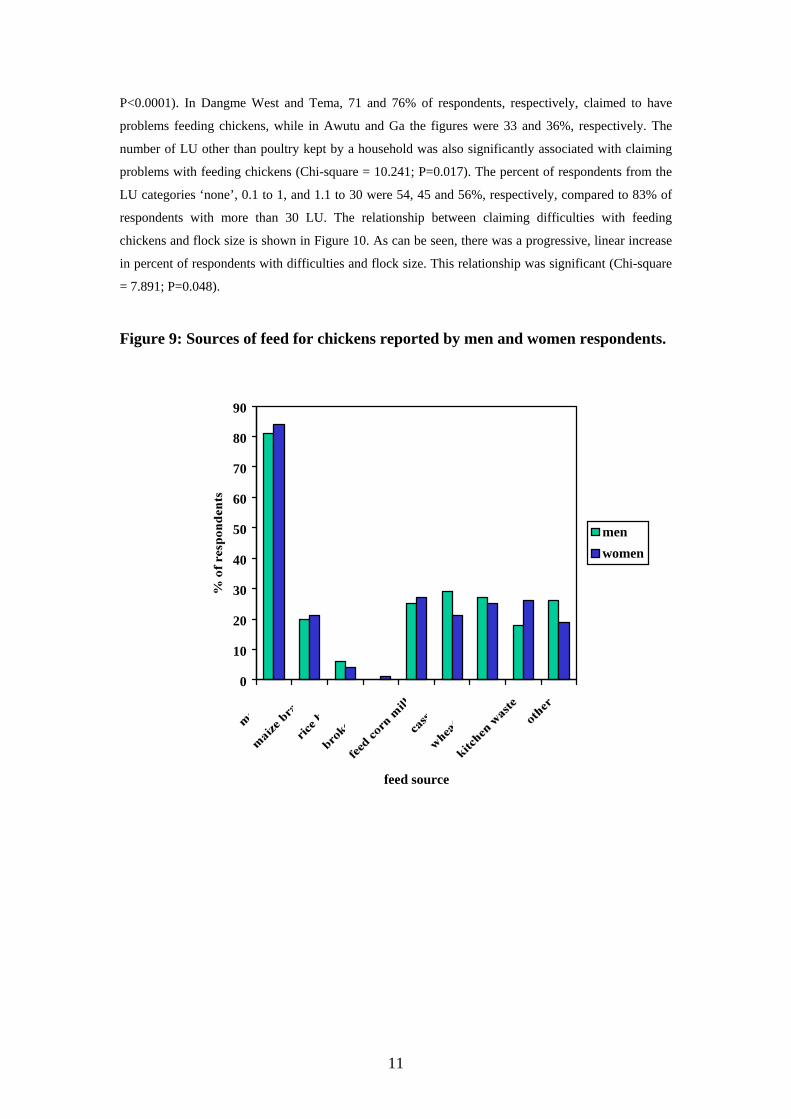
three times per day. The sources of feed named by respondents are shown in Figure 9. Over 80% of
both men and women named maize. Although a number of other feeds were named, none were as
popular as maize. Rather surprisingly, kitchen waste was only named by about 20% of respondents.
The quantities of feed given at any one period were difficult to establish. Of the categories offered in
the questionnaire, approximately 30% of respondents opted for a ‘handful’ while around 20% chose an
‘olonka’. Very few opted for a ‘basketful’. The majority of respondents reported some other measure,
sometimes a multiple of one of the offered categories (e.g. two olonkas) or another container (e.g. a
margarine tub).
When asked if feeding chickens presented problems, 49% of men and 52% of women agreed. Those
respondents volunteering information about the nature of the problems identified that in some instances
there was no feed available and/or there was no money to purchase feed. Further analysis indicated that
problems associated with chickens were associated with administrative district (Chi-square = 29.788;
0
10
20
30
40
50
60
Spouse Children Other
Who else owns chickens in the household
MenWomen
11
P<0.0001). In Dangme West and Tema, 71 and 76% of respondents, respectively, claimed to have
problems feeding chickens, while in Awutu and Ga the figures were 33 and 36%, respectively. The
number of LU other than poultry kept by a household was also significantly associated with claiming
problems with feeding chickens (Chi-square = 10.241; P=0.017). The percent of respondents from the
LU categories ‘none’, 0.1 to 1, and 1.1 to 30 were 54, 45 and 56%, respectively, compared to 83% of
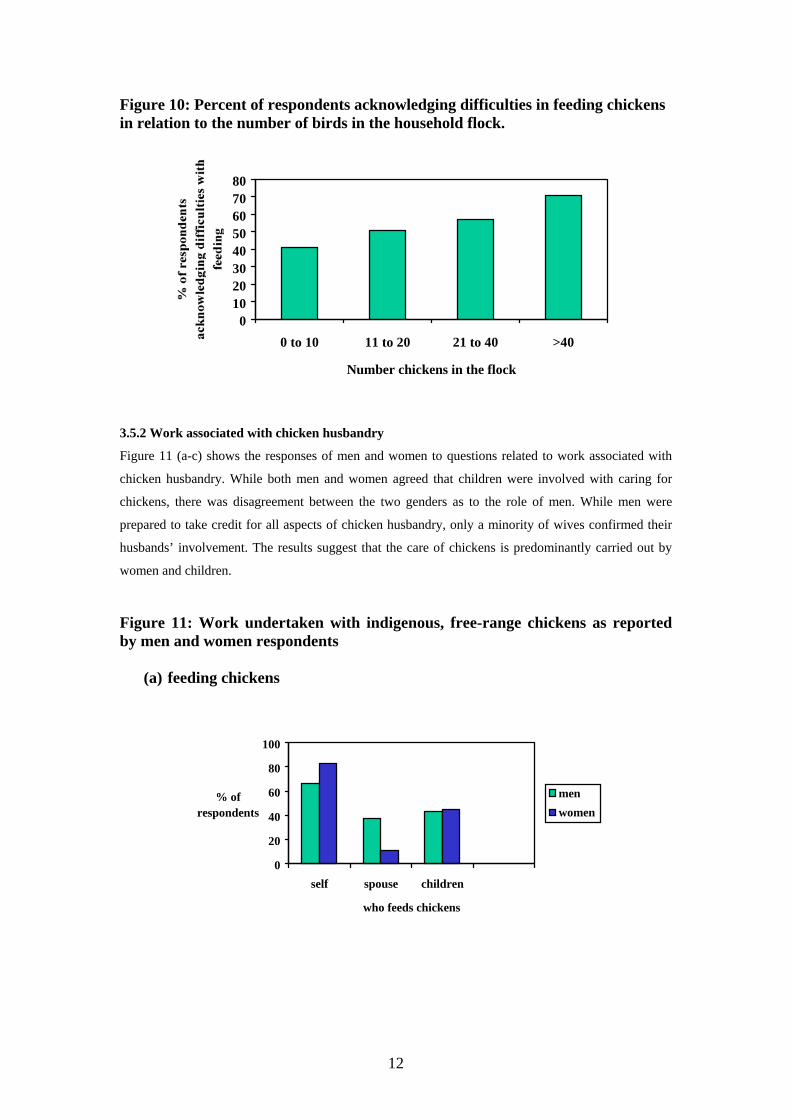
respondents with more than 30 LU. The relationship between claiming difficulties with feeding
chickens and flock size is shown in Figure 10. As can be seen, there was a progressive, linear increase
in percent of respondents with difficulties and flock size. This relationship was significant (Chi-square
= 7.891; P=0.048).
Figure 9: Sources of feed for chickens reported by men and women respondents.
0
10
20
30
40
50
60
70
80
90
feed source
menwomen
12
Figure 10: Percent of respondents acknowledging difficulties in feeding chickens in relation to the number of birds in the household flock.
3.5.2 Work associated with chicken husbandry Figure 11 (a-c) shows the responses of men and women to questions related to work associated with
chicken husbandry. While both men and women agreed that children were involved with caring for
chickens, there was disagreement between the two genders as to the role of men. While men were
prepared to take credit for all aspects of chicken husbandry, only a minority of wives confirmed their
husbands’ involvement. The results suggest that the care of chickens is predominantly carried out by
women and children.
Figure 11: Work undertaken with indigenous, free-range chickens as reported by men and women respondents
(a) feeding chickens
0
20
40
60
80
100
self spouse children
who feeds chickens
% of respondents
menwomen
01020304050607080
0 to 10 11 to 20 21 to 40 >40
Number chickens in the flock
13
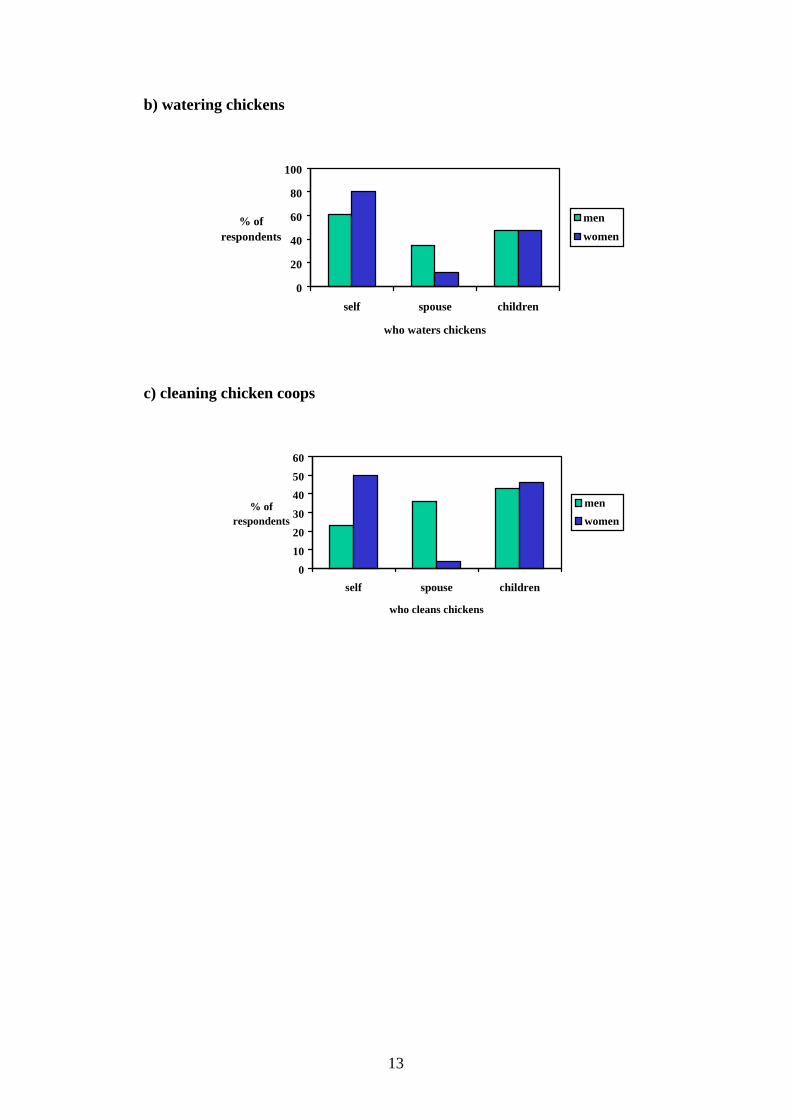
b) watering chickens
c) cleaning chicken coops
0
20
40
60
80
100
self spouse children
who waters chickens
% of respondents
menwomen
0
10
20
30
40
50
60
self spouse children
who cleans chickens
% of respondents
menwomen
14
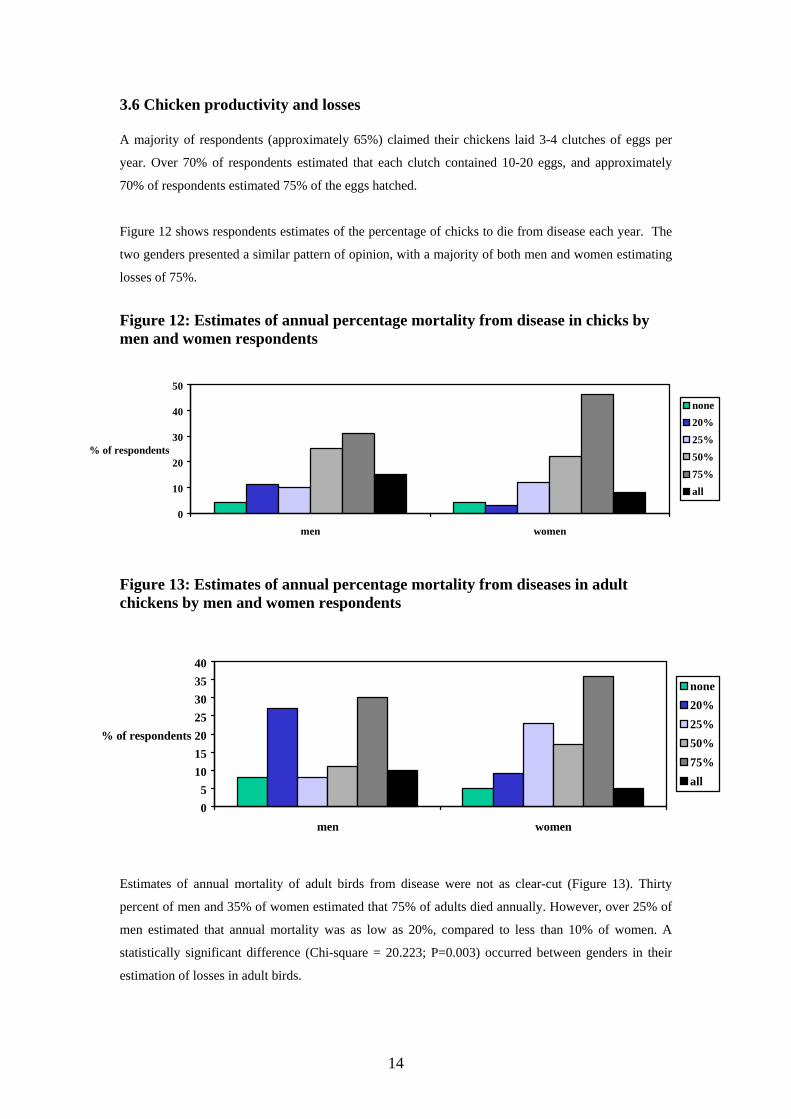
3.6 Chicken productivity and losses A majority of respondents (approximately 65%) claimed their chickens laid 3-4 clutches of eggs per
year. Over 70% of respondents estimated that each clutch contained 10-20 eggs, and approximately
70% of respondents estimated 75% of the eggs hatched.
Figure 12 shows respondents estimates of the percentage of chicks to die from disease each year. The
two genders presented a similar pattern of opinion, with a majority of both men and women estimating
losses of 75%. Figure 12: Estimates of annual percentage mortality from disease in chicks by men and women respondents
Figure 13: Estimates of annual percentage mortality from diseases in adult chickens by men and women respondents
Estimates of annual mortality of adult birds from disease were not as clear-cut (Figure 13). Thirty
percent of men and 35% of women estimated that 75% of adults died annually. However, over 25% of
men estimated that annual mortality was as low as 20%, compared to less than 10% of women. A
statistically significant difference (Chi-square = 20.223; P=0.003) occurred between genders in their
estimation of losses in adult birds.
0
10
20
30
40
50
men women
% of respondents
none20%25%50%75%all
05
10152025303540
men women
% of respondents
none20%25%50%75%all
15
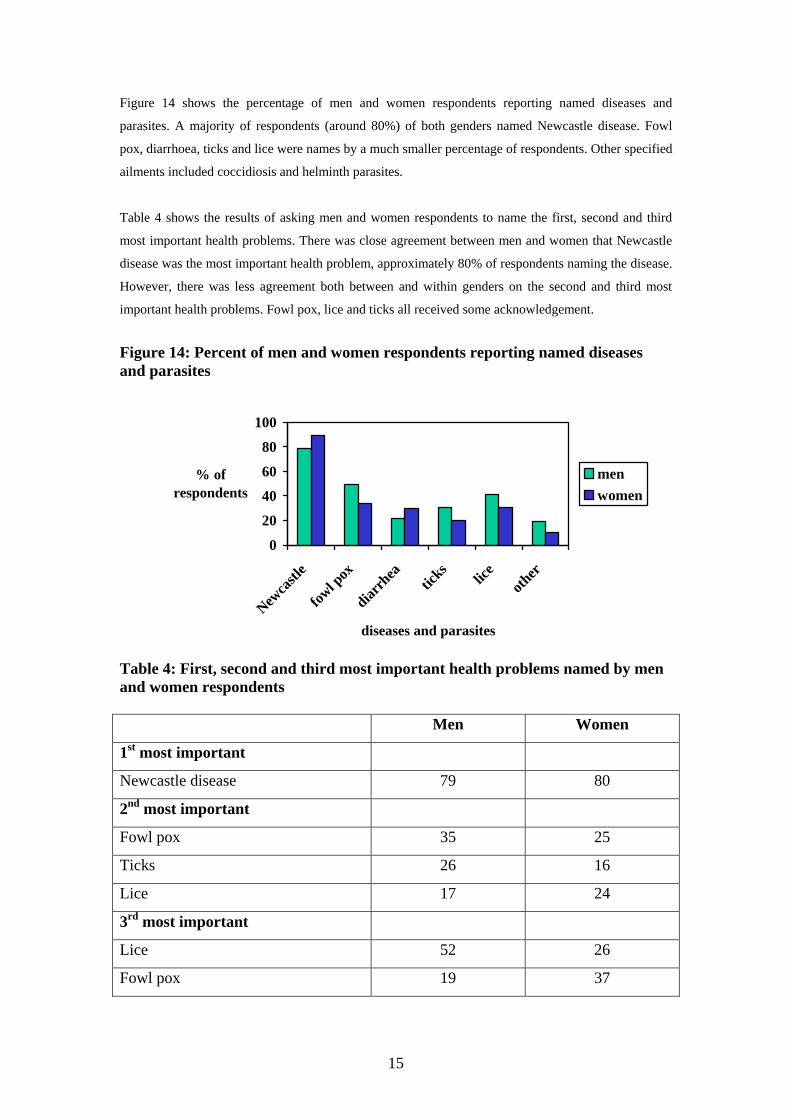
Figure 14 shows the percentage of men and women respondents reporting named diseases and
parasites. A majority of respondents (around 80%) of both genders named Newcastle disease. Fowl
pox, diarrhoea, ticks and lice were names by a much smaller percentage of respondents. Other specified
ailments included coccidiosis and helminth parasites.
Table 4 shows the results of asking men and women respondents to name the first, second and third
most important health problems. There was close agreement between men and women that Newcastle
disease was the most important health problem, approximately 80% of respondents naming the disease.
However, there was less agreement both between and within genders on the second and third most
important health problems. Fowl pox, lice and ticks all received some acknowledgement. Figure 14: Percent of men and women respondents reporting named diseases and parasites
Table 4: First, second and third most important health problems named by men and women respondents Men Women
1st most important
Newcastle disease 79 80
2nd most important
Fowl pox 35 25
Ticks 26 16
Lice 17 24
3rd most important
Lice 52 26
Fowl pox 19 37
0
20
40
60
80
100
Newca
stle
fowl p
ox
diarrh
eatic
kslic
eoth
er
diseases and parasites
% of respondents
menwomen
16
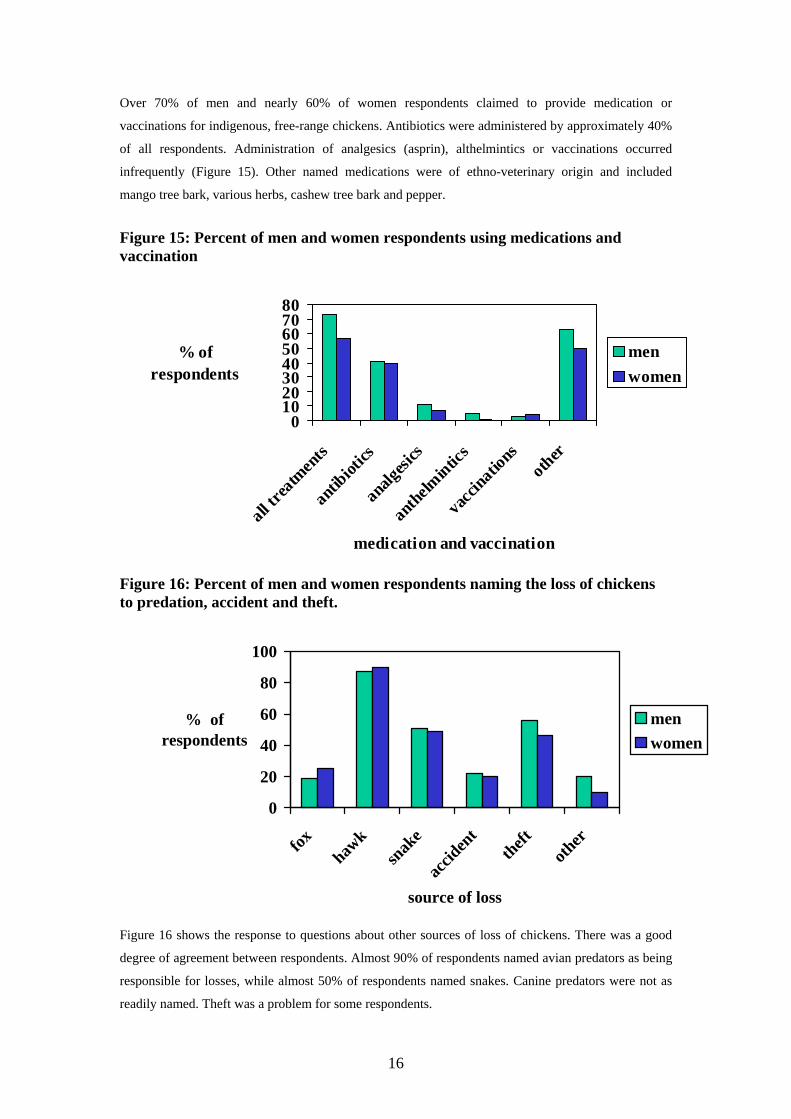
Over 70% of men and nearly 60% of women respondents claimed to provide medication or
vaccinations for indigenous, free-range chickens. Antibiotics were administered by approximately 40%
of all respondents. Administration of analgesics (asprin), althelmintics or vaccinations occurred
infrequently (Figure 15). Other named medications were of ethno-veterinary origin and included
mango tree bark, various herbs, cashew tree bark and pepper.
Figure 15: Percent of men and women respondents using medications and vaccination
Figure 16: Percent of men and women respondents naming the loss of chickens to predation, accident and theft.
Figure 16 shows the response to questions about other sources of loss of chickens. There was a good
degree of agreement between respondents. Almost 90% of respondents named avian predators as being
responsible for losses, while almost 50% of respondents named snakes. Canine predators were not as
readily named. Theft was a problem for some respondents.
01020304050607080
all tr
eatm
ents
antibiot
ics
analge
sics
anthelm
intics
vaccin
ations
other
medication and vaccination
% of respondents
menwomen
0
20
40
60
80
100
foxhaw
ksn
ake
accid
ent
theftoth
er
source of loss
% of respondents
menwomen
17
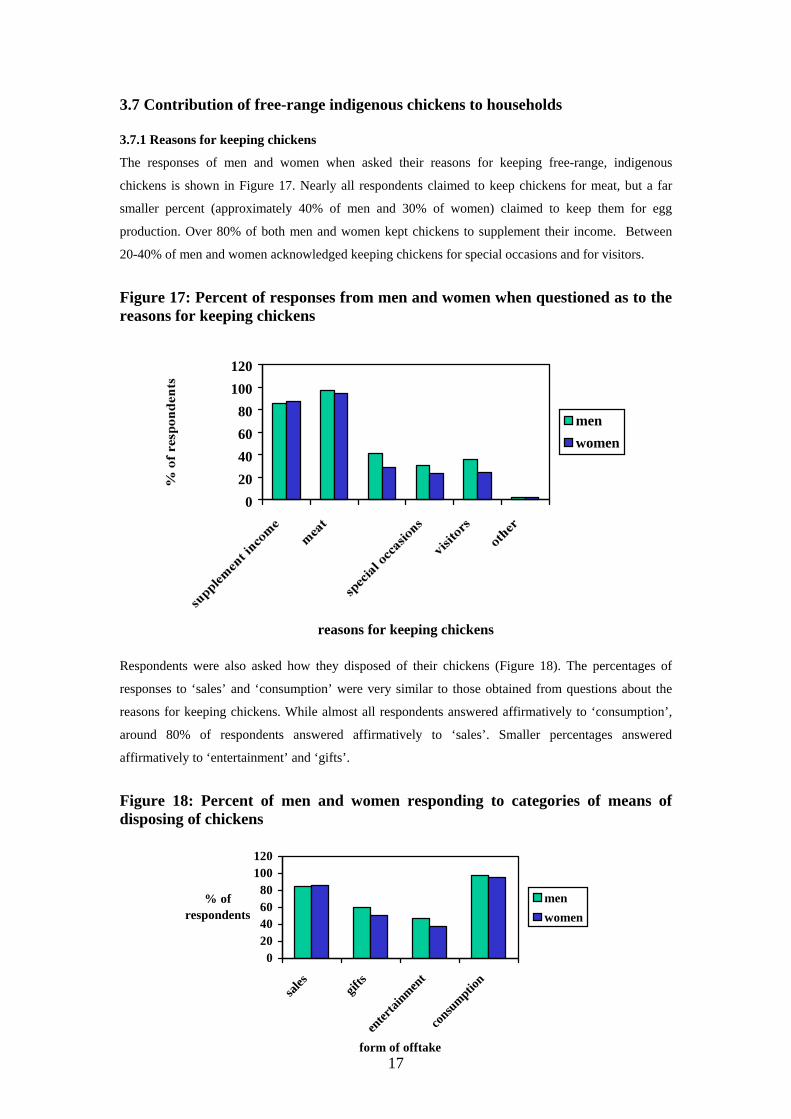
3.7 Contribution of free-range indigenous chickens to households 3.7.1 Reasons for keeping chickens
The responses of men and women when asked their reasons for keeping free-range, indigenous
chickens is shown in Figure 17. Nearly all respondents claimed to keep chickens for meat, but a far
smaller percent (approximately 40% of men and 30% of women) claimed to keep them for egg
production. Over 80% of both men and women kept chickens to supplement their income. Between
20-40% of men and women acknowledged keeping chickens for special occasions and for visitors.
Figure 17: Percent of responses from men and women when questioned as to the reasons for keeping chickens
Respondents were also asked how they disposed of their chickens (Figure 18). The percentages of
responses to ‘sales’ and ‘consumption’ were very similar to those obtained from questions about the
reasons for keeping chickens. While almost all respondents answered affirmatively to ‘consumption’,
around 80% of respondents answered affirmatively to ‘sales’. Smaller percentages answered
affirmatively to ‘entertainment’ and ‘gifts’.
Figure 18: Percent of men and women responding to categories of means of disposing of chickens
020406080
100120
reasons for keeping chickens
menwomen
020406080
100120
sales
gifts
enter
tainmen
t
consu
mption
form of offtake
% of respondents
menwomen
18
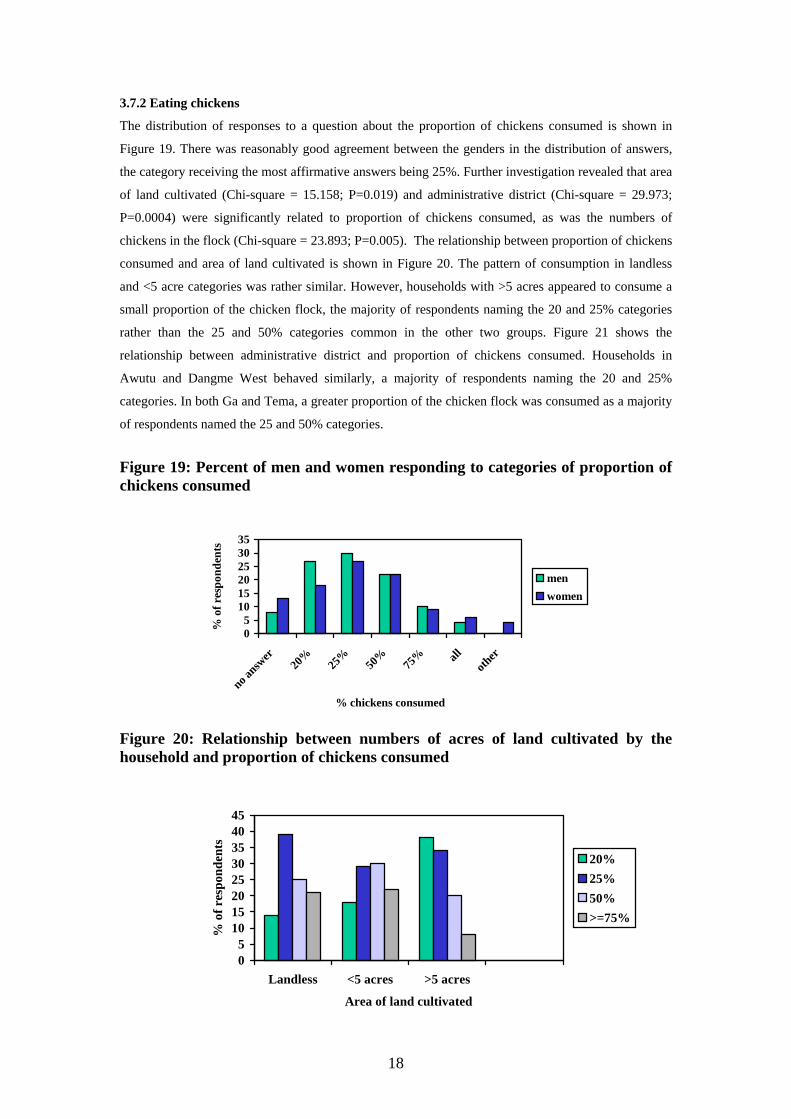
3.7.2 Eating chickens
The distribution of responses to a question about the proportion of chickens consumed is shown in
Figure 19. There was reasonably good agreement between the genders in the distribution of answers,
the category receiving the most affirmative answers being 25%. Further investigation revealed that area
of land cultivated (Chi-square = 15.158; P=0.019) and administrative district (Chi-square = 29.973;
P=0.0004) were significantly related to proportion of chickens consumed, as was the numbers of
chickens in the flock (Chi-square = 23.893; P=0.005). The relationship between proportion of chickens
consumed and area of land cultivated is shown in Figure 20. The pattern of consumption in landless
and <5 acre categories was rather similar. However, households with >5 acres appeared to consume a
small proportion of the chicken flock, the majority of respondents naming the 20 and 25% categories
rather than the 25 and 50% categories common in the other two groups. Figure 21 shows the
relationship between administrative district and proportion of chickens consumed. Households in
Awutu and Dangme West behaved similarly, a majority of respondents naming the 20 and 25%
categories. In both Ga and Tema, a greater proportion of the chicken flock was consumed as a majority
of respondents named the 25 and 50% categories. Figure 19: Percent of men and women responding to categories of proportion of chickens consumed
Figure 20: Relationship between numbers of acres of land cultivated by the household and proportion of chickens consumed
05
101520253035
no answ
er20
%25
%50
%75
% alloth
er
% chickens consumed
% o
f res
pond
ents
menwomen
05
1015202530354045
Landless <5 acres >5 acres
Area of land cultivated
% o
f res
pond
ents
20%25%50%>=75%
19
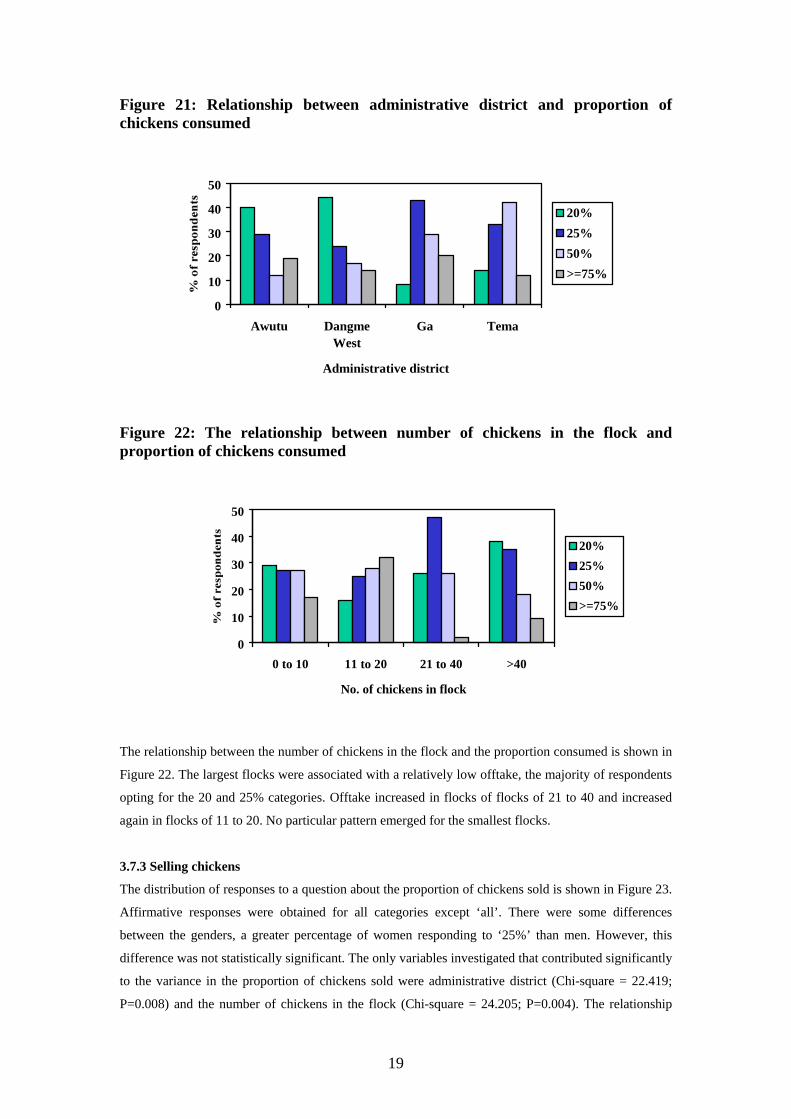
Figure 21: Relationship between administrative district and proportion of chickens consumed
Figure 22: The relationship between number of chickens in the flock and proportion of chickens consumed
The relationship between the number of chickens in the flock and the proportion consumed is shown in
Figure 22. The largest flocks were associated with a relatively low offtake, the majority of respondents
opting for the 20 and 25% categories. Offtake increased in flocks of flocks of 21 to 40 and increased
again in flocks of 11 to 20. No particular pattern emerged for the smallest flocks.
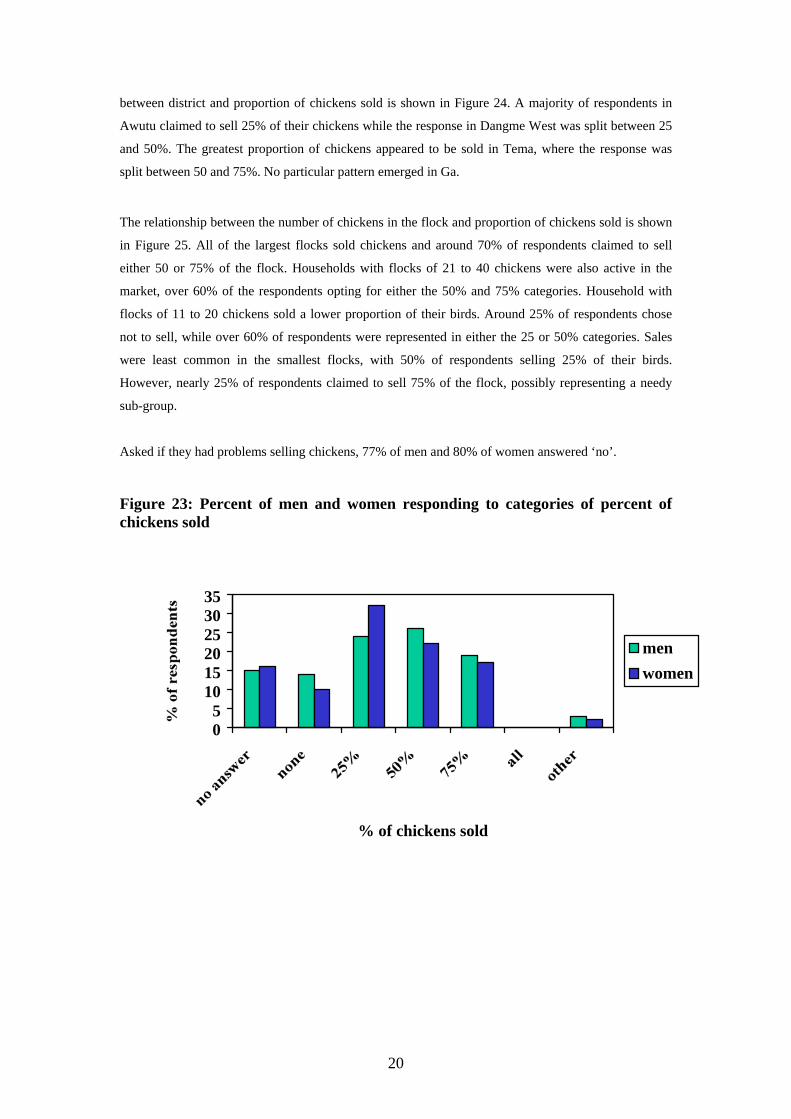
3.7.3 Selling chickens
The distribution of responses to a question about the proportion of chickens sold is shown in Figure 23.
Affirmative responses were obtained for all categories except ‘all’. There were some differences
between the genders, a greater percentage of women responding to ‘25%’ than men. However, this
difference was not statistically significant. The only variables investigated that contributed significantly
to the variance in the proportion of chickens sold were administrative district (Chi-square = 22.419;
P=0.008) and the number of chickens in the flock (Chi-square = 24.205; P=0.004). The relationship
0
10
20
30
40
50
Awutu DangmeWest
Ga Tema
Administrative district
20%25%50%>=75%
0
10
20
30
40
50
0 to 10 11 to 20 21 to 40 >40
No. of chickens in flock
20%25%50%>=75%
20
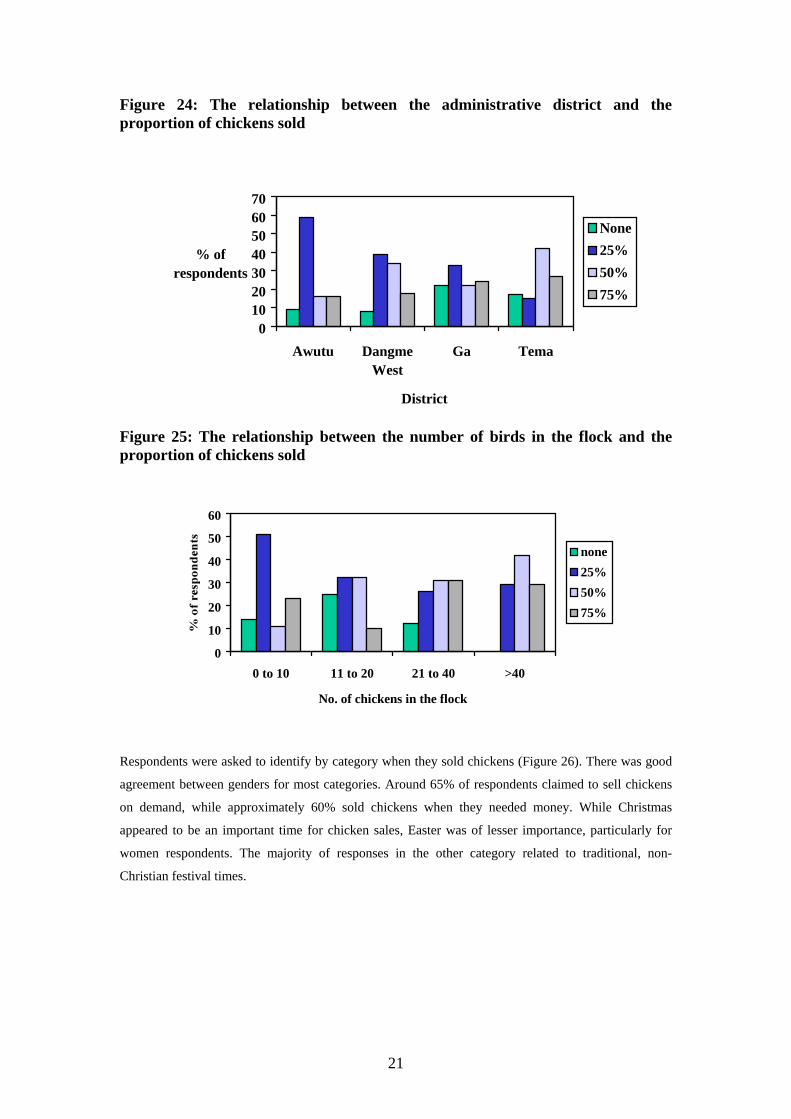
between district and proportion of chickens sold is shown in Figure 24. A majority of respondents in
Awutu claimed to sell 25% of their chickens while the response in Dangme West was split between 25
and 50%. The greatest proportion of chickens appeared to be sold in Tema, where the response was
split between 50 and 75%. No particular pattern emerged in Ga.
The relationship between the number of chickens in the flock and proportion of chickens sold is shown
in Figure 25. All of the largest flocks sold chickens and around 70% of respondents claimed to sell
either 50 or 75% of the flock. Households with flocks of 21 to 40 chickens were also active in the
market, over 60% of the respondents opting for either the 50% and 75% categories. Household with
flocks of 11 to 20 chickens sold a lower proportion of their birds. Around 25% of respondents chose
not to sell, while over 60% of respondents were represented in either the 25 or 50% categories. Sales
were least common in the smallest flocks, with 50% of respondents selling 25% of their birds.
However, nearly 25% of respondents claimed to sell 75% of the flock, possibly representing a needy
sub-group.
Asked if they had problems selling chickens, 77% of men and 80% of women answered ‘no’.
Figure 23: Percent of men and women responding to categories of percent of chickens sold
05
101520253035
% of chickens sold
menwomen
21
Figure 24: The relationship between the administrative district and the proportion of chickens sold
Figure 25: The relationship between the number of birds in the flock and the proportion of chickens sold
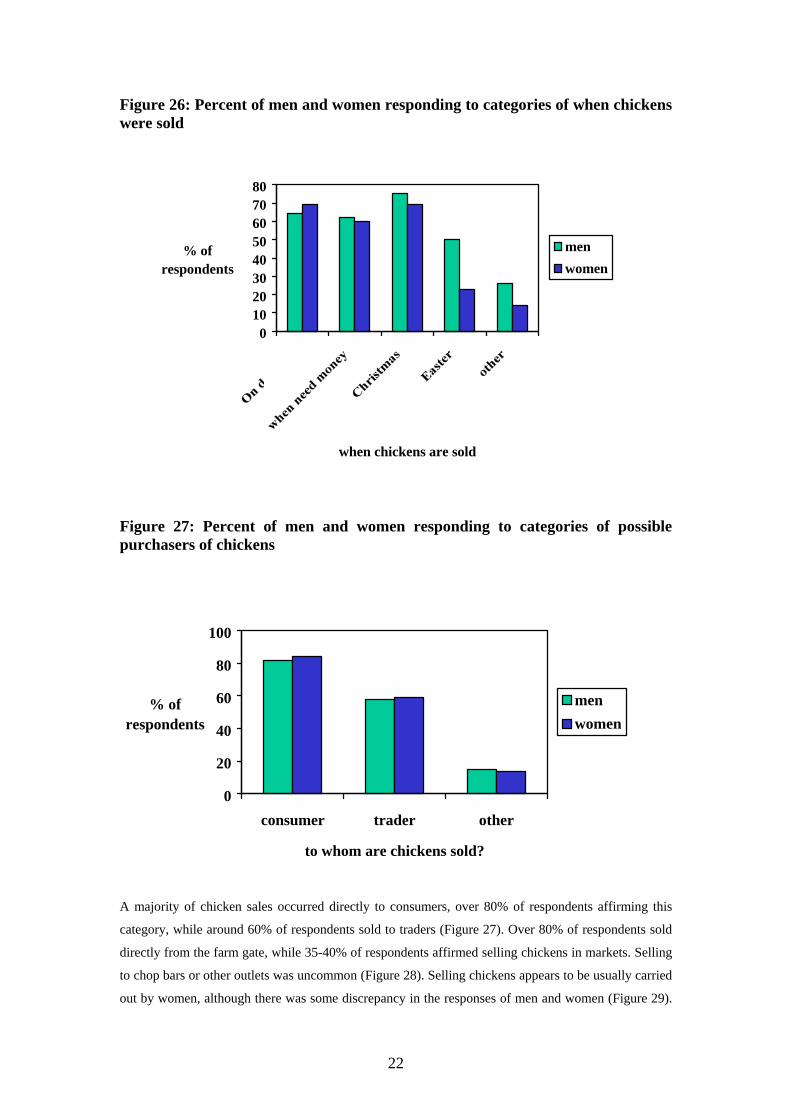
Respondents were asked to identify by category when they sold chickens (Figure 26). There was good
agreement between genders for most categories. Around 65% of respondents claimed to sell chickens
on demand, while approximately 60% sold chickens when they needed money. While Christmas
appeared to be an important time for chicken sales, Easter was of lesser importance, particularly for
women respondents. The majority of responses in the other category related to traditional, non-
Christian festival times.
010203040506070
Awutu DangmeWest
Ga Tema
District
% of respondents
None25%50%75%
0
10
20
30
40
50
60
0 to 10 11 to 20 21 to 40 >40
No. of chickens in the flock
none25%50%75%
22
Figure 26: Percent of men and women responding to categories of when chickens were sold
Figure 27: Percent of men and women responding to categories of possible purchasers of chickens
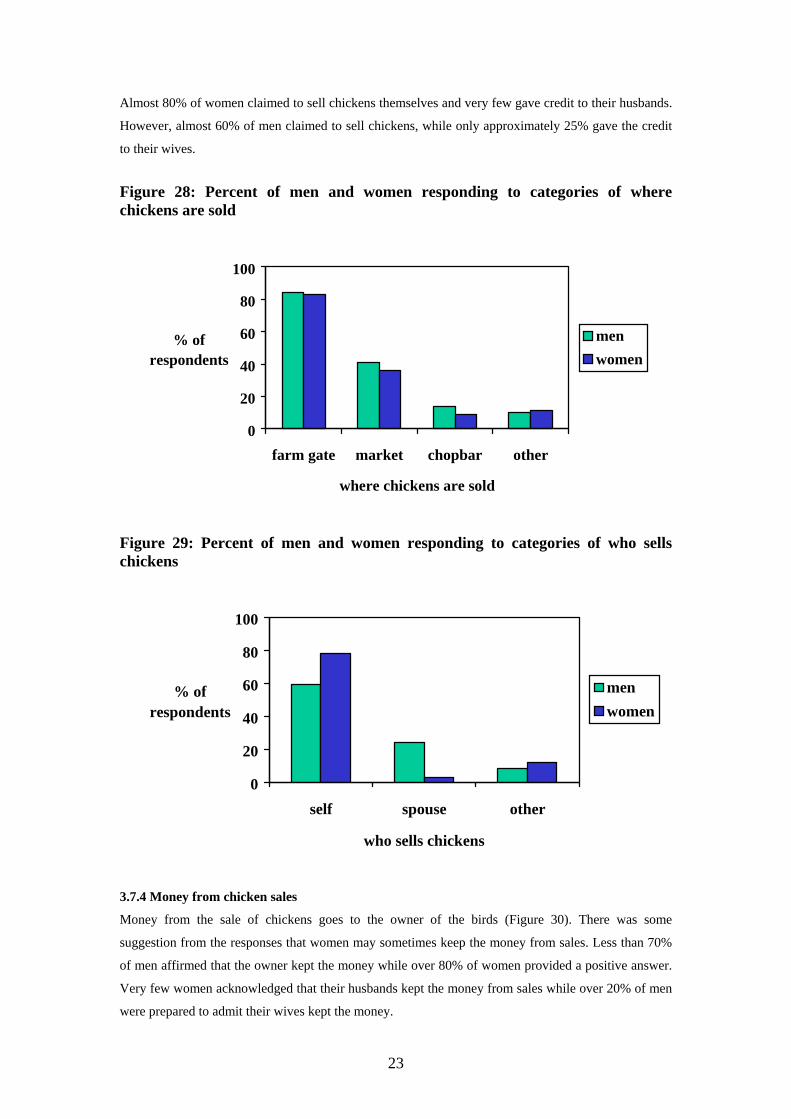
A majority of chicken sales occurred directly to consumers, over 80% of respondents affirming this
category, while around 60% of respondents sold to traders (Figure 27). Over 80% of respondents sold
directly from the farm gate, while 35-40% of respondents affirmed selling chickens in markets. Selling
to chop bars or other outlets was uncommon (Figure 28). Selling chickens appears to be usually carried
out by women, although there was some discrepancy in the responses of men and women (Figure 29).
01020304050607080
when chickens are sold
% of respondents
menwomen
0
20
40
60
80
100
consumer trader other
to whom are chickens sold?
% of respondents
menwomen
23
Almost 80% of women claimed to sell chickens themselves and very few gave credit to their husbands.
However, almost 60% of men claimed to sell chickens, while only approximately 25% gave the credit
to their wives.
Figure 28: Percent of men and women responding to categories of where chickens are sold
Figure 29: Percent of men and women responding to categories of who sells chickens
3.7.4 Money from chicken sales
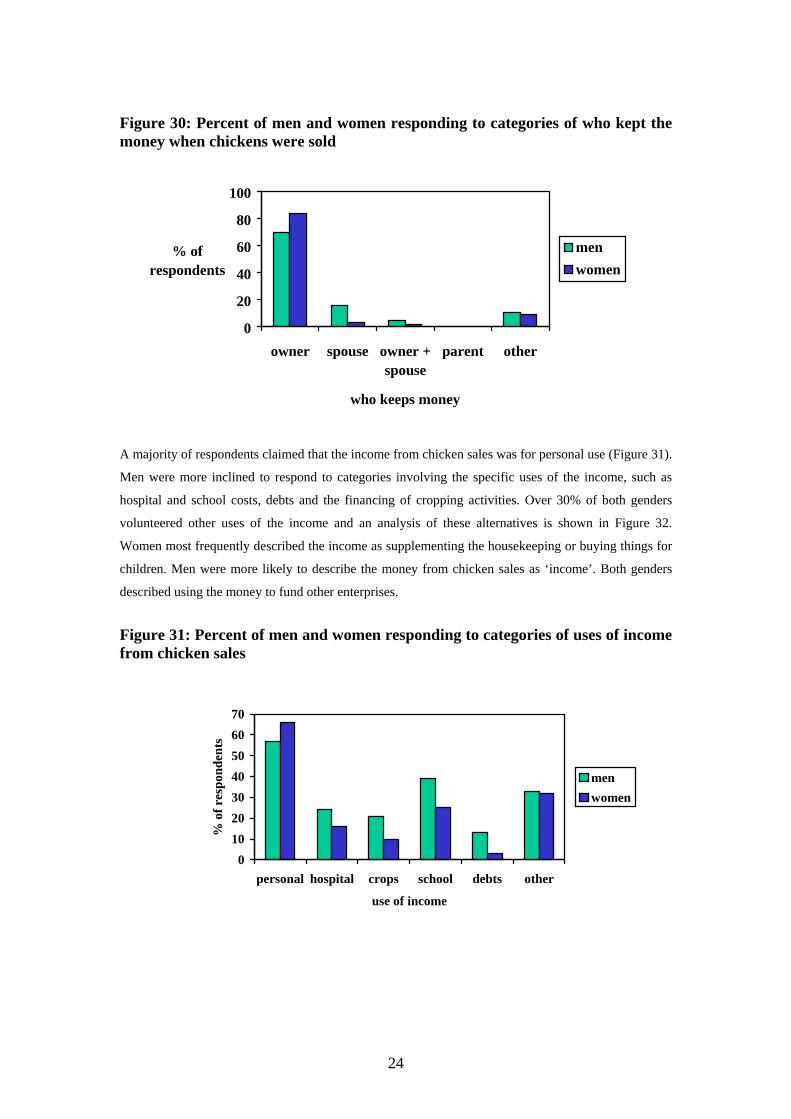
Money from the sale of chickens goes to the owner of the birds (Figure 30). There was some
suggestion from the responses that women may sometimes keep the money from sales. Less than 70%
of men affirmed that the owner kept the money while over 80% of women provided a positive answer.
Very few women acknowledged that their husbands kept the money from sales while over 20% of men
were prepared to admit their wives kept the money.
0
20
40
60
80
100
farm gate market chopbar other
where chickens are sold
% of respondents
menwomen
0
20
40
60
80
100
self spouse other
who sells chickens
% of respondents
menwomen
24
Figure 30: Percent of men and women responding to categories of who kept the money when chickens were sold
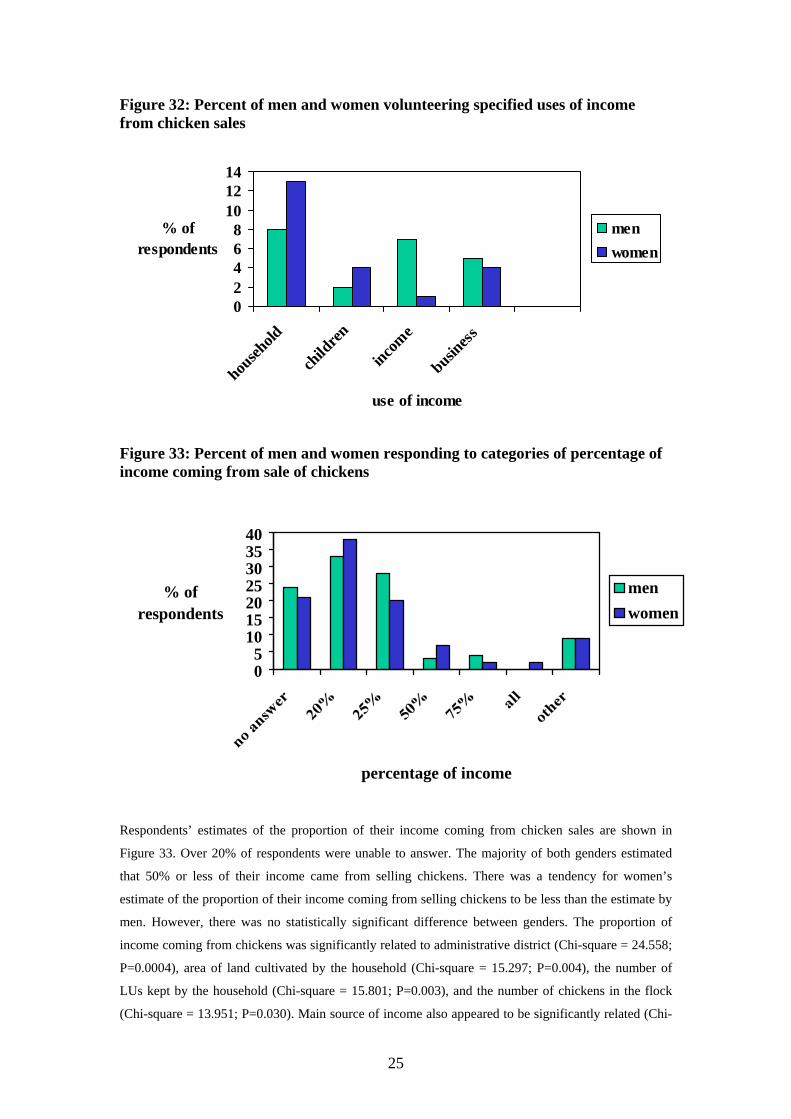
A majority of respondents claimed that the income from chicken sales was for personal use (Figure 31).
Men were more inclined to respond to categories involving the specific uses of the income, such as
hospital and school costs, debts and the financing of cropping activities. Over 30% of both genders
volunteered other uses of the income and an analysis of these alternatives is shown in Figure 32.
Women most frequently described the income as supplementing the housekeeping or buying things for
children. Men were more likely to describe the money from chicken sales as ‘income’. Both genders
described using the money to fund other enterprises.
Figure 31: Percent of men and women responding to categories of uses of income from chicken sales
0
20
40
60
80
100
owner spouse owner +spouse
parent other
who keeps money
% of respondents
menwomen
010203040506070
personal hospital crops school debts other
use of income
% o
f res
pond
ents
menwomen
25
Figure 32: Percent of men and women volunteering specified uses of income from chicken sales Figure 33: Percent of men and women responding to categories of percentage of income coming from sale of chickens
Respondents’ estimates of the proportion of their income coming from chicken sales are shown in
Figure 33. Over 20% of respondents were unable to answer. The majority of both genders estimated
that 50% or less of their income came from selling chickens. There was a tendency for women’s
estimate of the proportion of their income coming from selling chickens to be less than the estimate by
men. However, there was no statistically significant difference between genders. The proportion of
income coming from chickens was significantly related to administrative district (Chi-square = 24.558;
P=0.0004), area of land cultivated by the household (Chi-square = 15.297; P=0.004), the number of
LUs kept by the household (Chi-square = 15.801; P=0.003), and the number of chickens in the flock
(Chi-square = 13.951; P=0.030). Main source of income also appeared to be significantly related (Chi-
05
10152025303540
percentage of income
% of respondents
menwomen
02468
101214
househ
old
child
ren
income
business
use of income
% of respondents
menwomen
26
square = 10.303: P = 0.036) although there were few respondents in the ‘animals’ category and
therefore the result must be treated with caution.
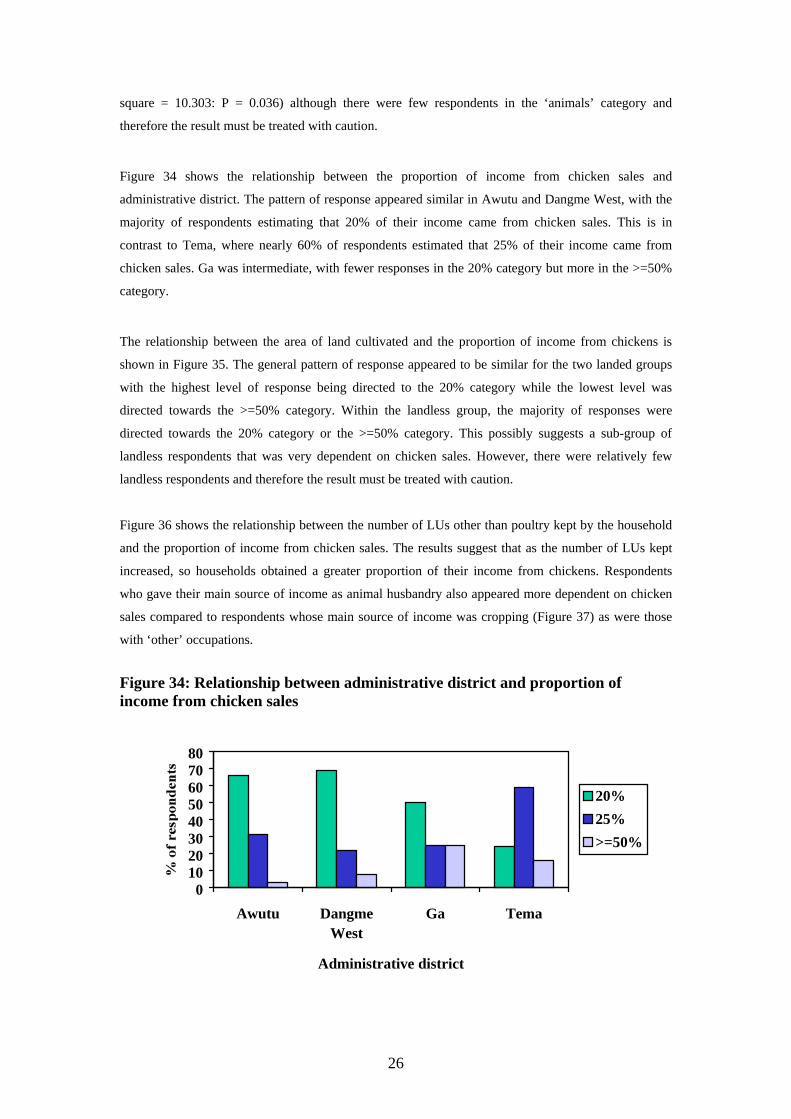
Figure 34 shows the relationship between the proportion of income from chicken sales and
administrative district. The pattern of response appeared similar in Awutu and Dangme West, with the
majority of respondents estimating that 20% of their income came from chicken sales. This is in
contrast to Tema, where nearly 60% of respondents estimated that 25% of their income came from
chicken sales. Ga was intermediate, with fewer responses in the 20% category but more in the >=50%
category.
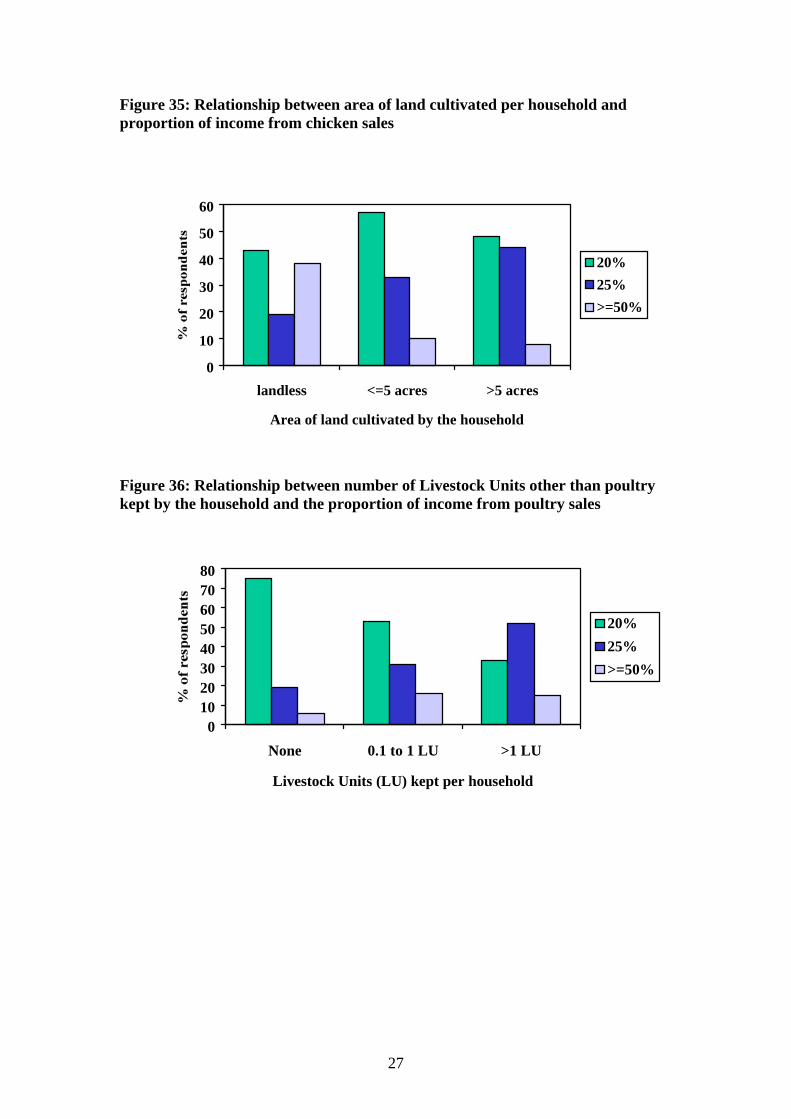
The relationship between the area of land cultivated and the proportion of income from chickens is
shown in Figure 35. The general pattern of response appeared to be similar for the two landed groups with the highest level of response being directed to the 20% category while the lowest level was
directed towards the >=50% category. Within the landless group, the majority of responses were
directed towards the 20% category or the >=50% category. This possibly suggests a sub-group of
landless respondents that was very dependent on chicken sales. However, there were relatively few
landless respondents and therefore the result must be treated with caution.
Figure 36 shows the relationship between the number of LUs other than poultry kept by the household
and the proportion of income from chicken sales. The results suggest that as the number of LUs kept
increased, so households obtained a greater proportion of their income from chickens. Respondents
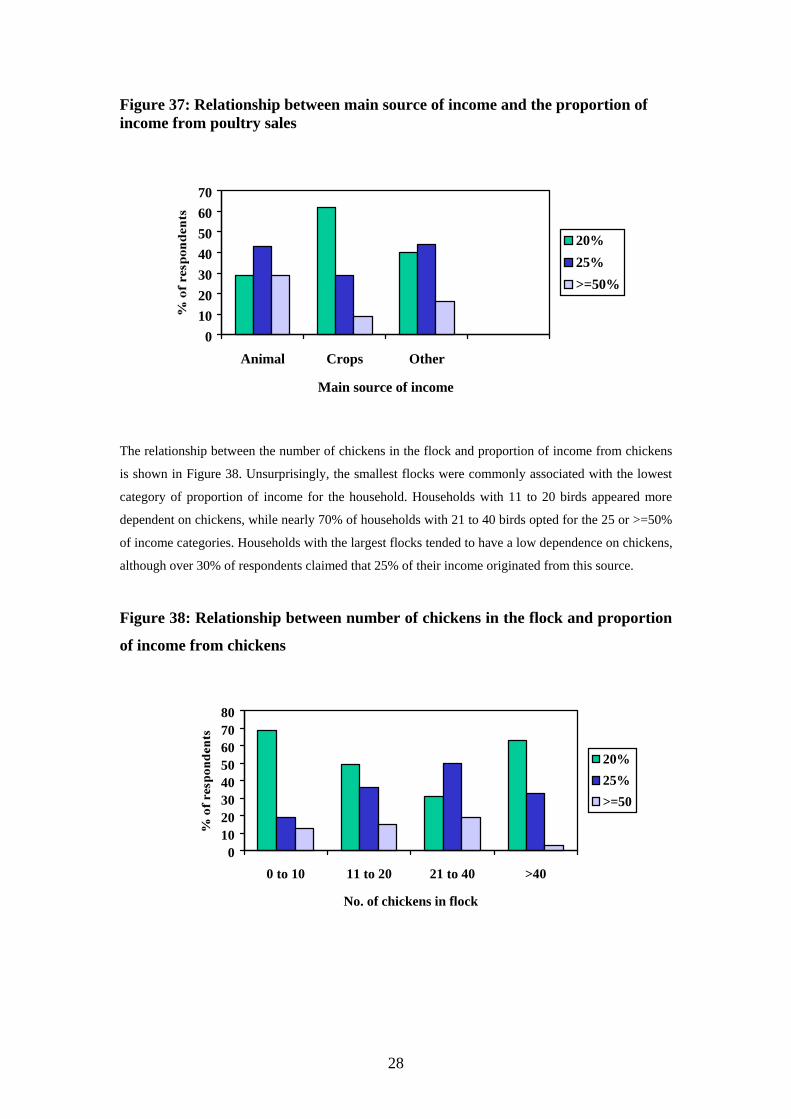
who gave their main source of income as animal husbandry also appeared more dependent on chicken
sales compared to respondents whose main source of income was cropping (Figure 37) as were those
with ‘other’ occupations. Figure 34: Relationship between administrative district and proportion of income from chicken sales
01020304050607080
Awutu DangmeWest
Ga Tema
Administrative district
20%25%>=50%
27
Figure 35: Relationship between area of land cultivated per household and proportion of income from chicken sales
Figure 36: Relationship between number of Livestock Units other than poultry kept by the household and the proportion of income from poultry sales
0
10
20
30
40
50
60
landless <=5 acres >5 acres
Area of land cultivated by the household
20%25%>=50%
01020304050607080
None 0.1 to 1 LU >1 LU
Livestock Units (LU) kept per household
20%25%>=50%
28
Figure 37: Relationship between main source of income and the proportion of income from poultry sales
The relationship between the number of chickens in the flock and proportion of income from chickens
is shown in Figure 38. Unsurprisingly, the smallest flocks were commonly associated with the lowest
category of proportion of income for the household. Households with 11 to 20 birds appeared more
dependent on chickens, while nearly 70% of households with 21 to 40 birds opted for the 25 or >=50%
of income categories. Households with the largest flocks tended to have a low dependence on chickens,
although over 30% of respondents claimed that 25% of their income originated from this source.
Figure 38: Relationship between number of chickens in the flock and proportion
of income from chickens
010203040506070
Animal Crops Other
Main source of income
20%25%>=50%
01020304050607080
0 to 10 11 to 20 21 to 40 >40
No. of chickens in flock
20%25%>=50
29
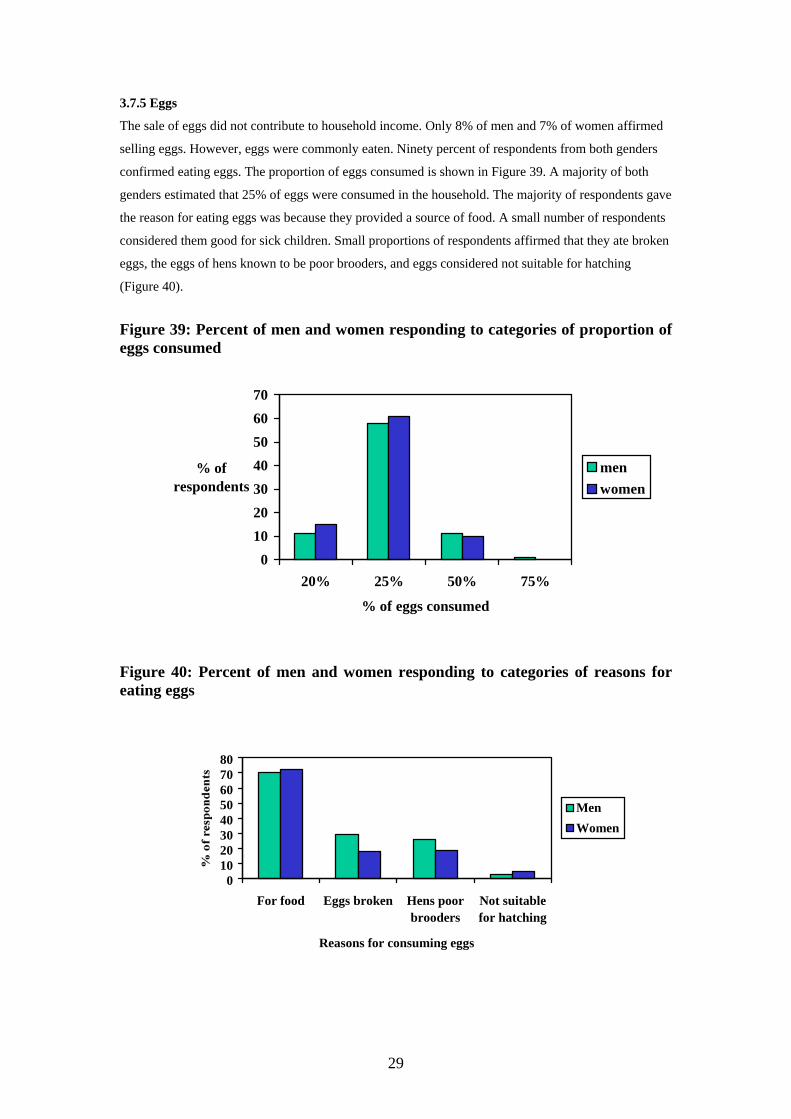
3.7.5 Eggs
The sale of eggs did not contribute to household income. Only 8% of men and 7% of women affirmed
selling eggs. However, eggs were commonly eaten. Ninety percent of respondents from both genders
confirmed eating eggs. The proportion of eggs consumed is shown in Figure 39. A majority of both
genders estimated that 25% of eggs were consumed in the household. The majority of respondents gave
the reason for eating eggs was because they provided a source of food. A small number of respondents
considered them good for sick children. Small proportions of respondents affirmed that they ate broken
eggs, the eggs of hens known to be poor brooders, and eggs considered not suitable for hatching
(Figure 40). Figure 39: Percent of men and women responding to categories of proportion of eggs consumed
Figure 40: Percent of men and women responding to categories of reasons for eating eggs
010203040506070
20% 25% 50% 75%
% of eggs consumed
% of respondents
menwomen
01020304050607080
For food Eggs broken Hens poorbrooders
Not suitablefor hatching
Reasons for consuming eggs
MenWomen
30
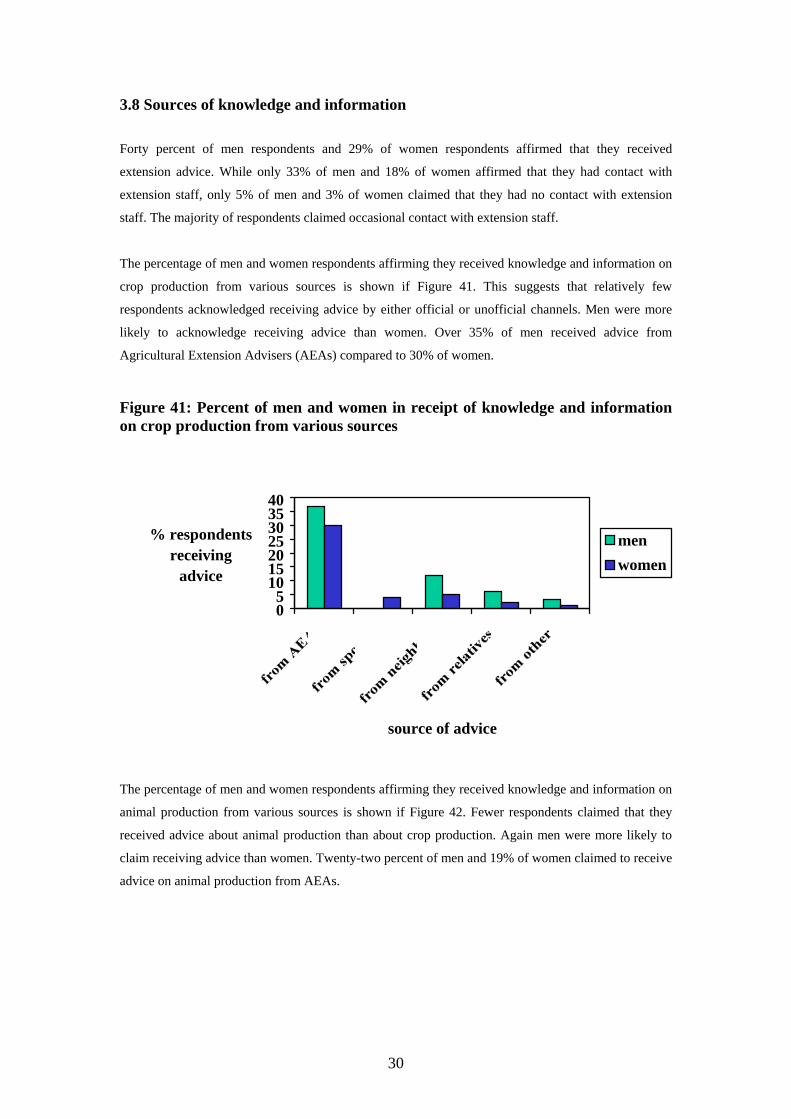
3.8 Sources of knowledge and information Forty percent of men respondents and 29% of women respondents affirmed that they received
extension advice. While only 33% of men and 18% of women affirmed that they had contact with
extension staff, only 5% of men and 3% of women claimed that they had no contact with extension
staff. The majority of respondents claimed occasional contact with extension staff.
The percentage of men and women respondents affirming they received knowledge and information on
crop production from various sources is shown if Figure 41. This suggests that relatively few
respondents acknowledged receiving advice by either official or unofficial channels. Men were more
likely to acknowledge receiving advice than women. Over 35% of men received advice from
Agricultural Extension Advisers (AEAs) compared to 30% of women.
Figure 41: Percent of men and women in receipt of knowledge and information on crop production from various sources
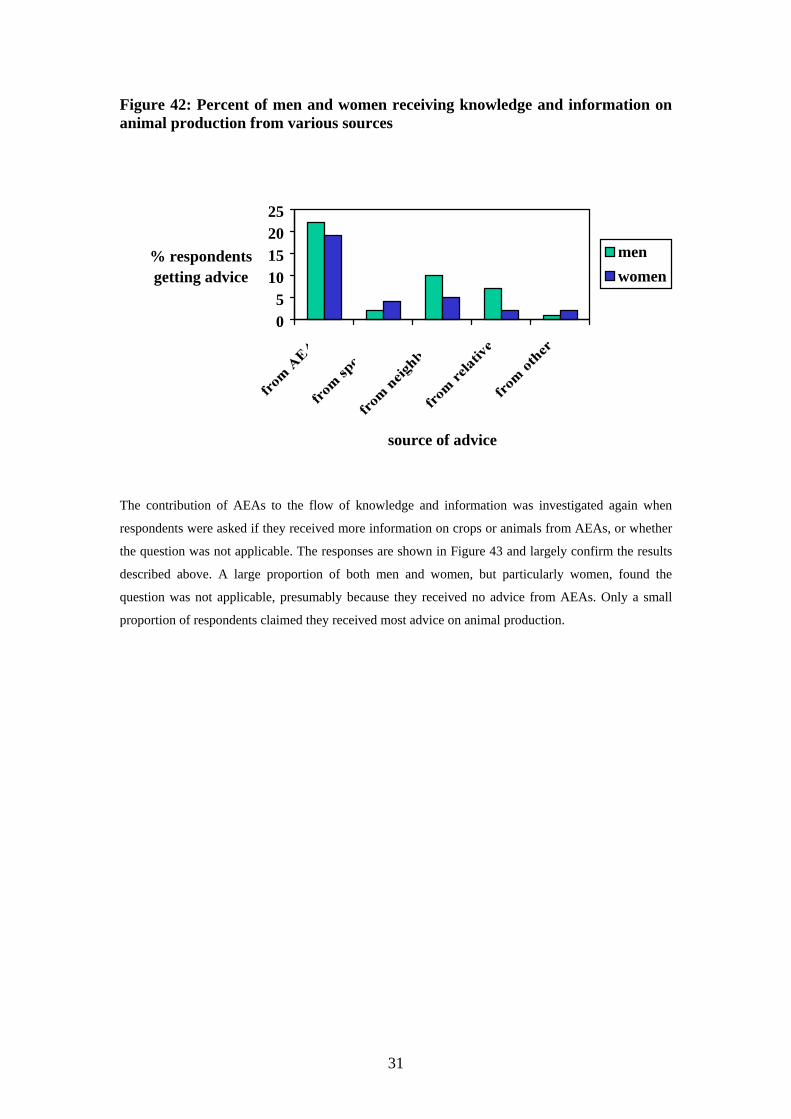
The percentage of men and women respondents affirming they received knowledge and information on
animal production from various sources is shown if Figure 42. Fewer respondents claimed that they
received advice about animal production than about crop production. Again men were more likely to
claim receiving advice than women. Twenty-two percent of men and 19% of women claimed to receive
advice on animal production from AEAs.
05
10152025303540
source of advice
% respondents receiving
advice
menwomen
31
Figure 42: Percent of men and women receiving knowledge and information on animal production from various sources
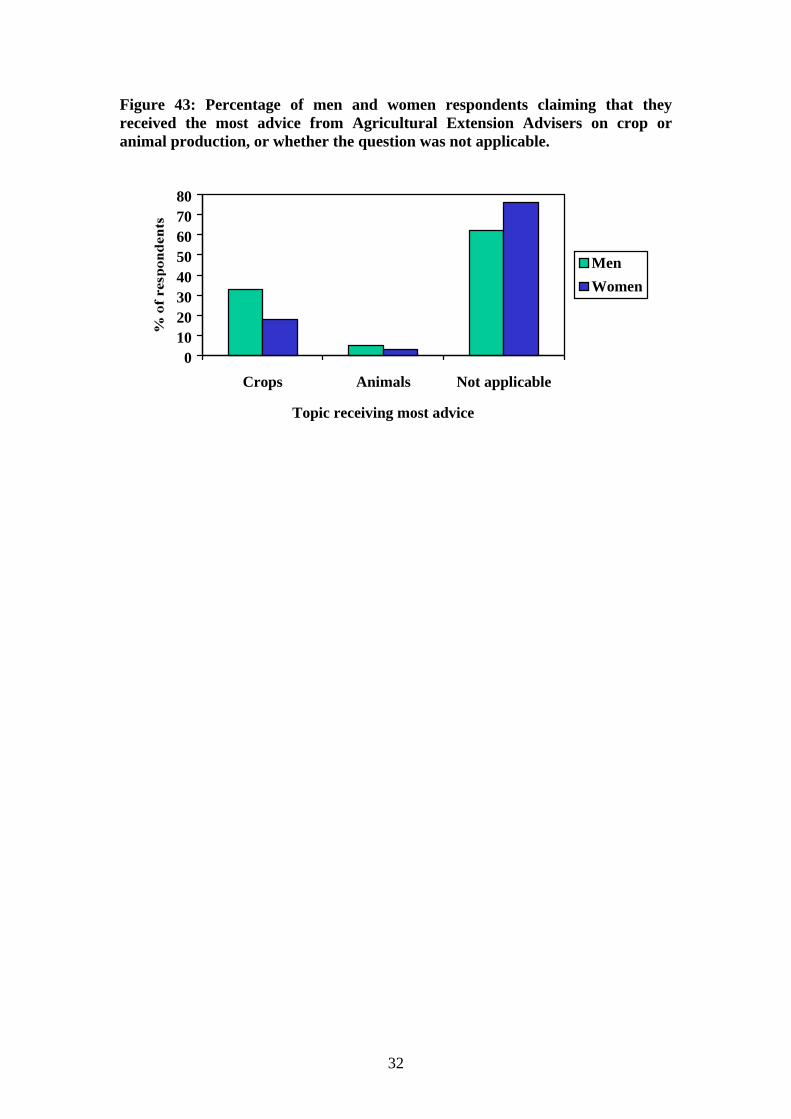
The contribution of AEAs to the flow of knowledge and information was investigated again when
respondents were asked if they received more information on crops or animals from AEAs, or whether
the question was not applicable. The responses are shown in Figure 43 and largely confirm the results
described above. A large proportion of both men and women, but particularly women, found the
question was not applicable, presumably because they received no advice from AEAs. Only a small
proportion of respondents claimed they received most advice on animal production.
05
10152025
source of advice
% respondents getting advice
menwomen
32
Figure 43: Percentage of men and women respondents claiming that they received the most advice from Agricultural Extension Advisers on crop or animal production, or whether the question was not applicable.
01020304050607080
Crops Animals Not applicable
Topic receiving most advice
MenWomen
33
3.9 Perceived constraints to increasing the number of free-range, indigenous chickens kept The responses to questions directed at increasing flock size are shown in Table 5. The majority
questioned provided answers to these questions. The vast majority (99% of the sample of women) said
that they would like to keep more chickens. Approximately three-quarters of respondents affirmed that
they had tried to increase the numbers of chickens kept. The vast majority of those responding
positively had been unsuccessful.
Table 5: Percent response of men and women to questions relating to increasing the number of chickens kept Men Women Do you want more chickens? Yes 94 99 No 4 1 Have you tried to increase the number of chickens? Yes 77 75 No 19 19 If yes, was it successful? Yes 13 3 No 85 96
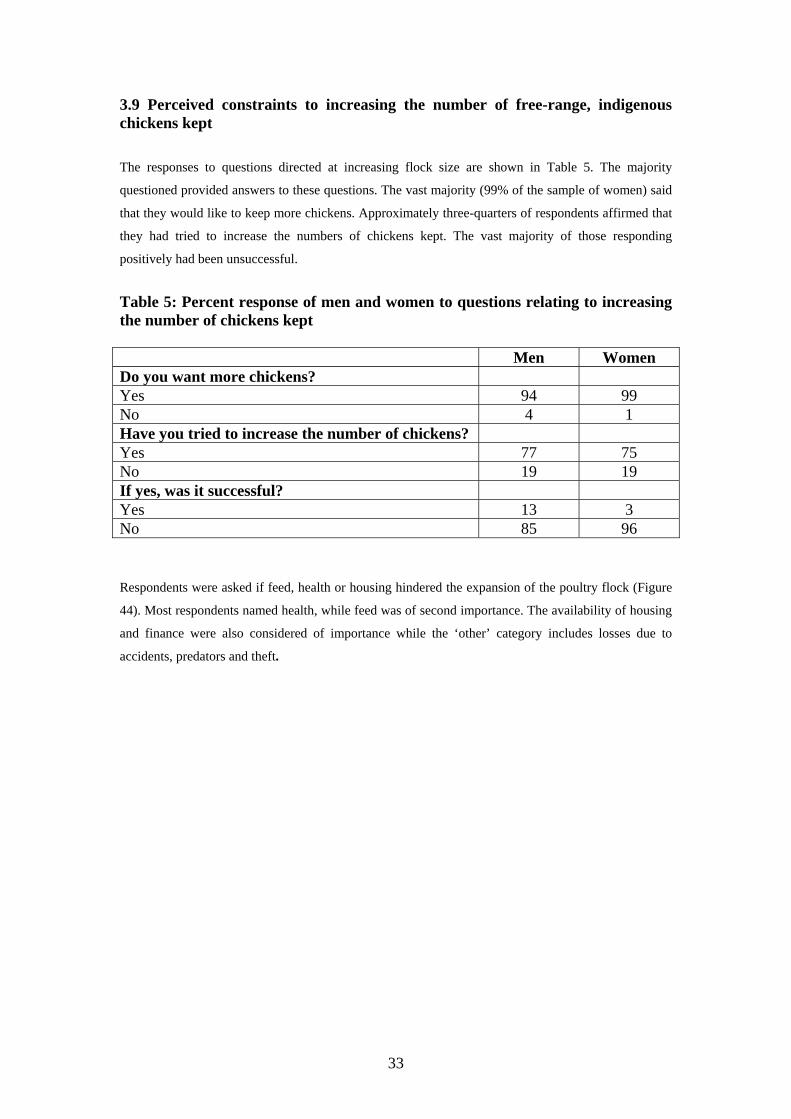
Respondents were asked if feed, health or housing hindered the expansion of the poultry flock (Figure
44). Most respondents named health, while feed was of second importance. The availability of housing
and finance were also considered of importance while the ‘other’ category includes losses due to
accidents, predators and theft.
34
Figure 44: Percent of men and women responding to categories of perceived constraints to increasing chicken numbers
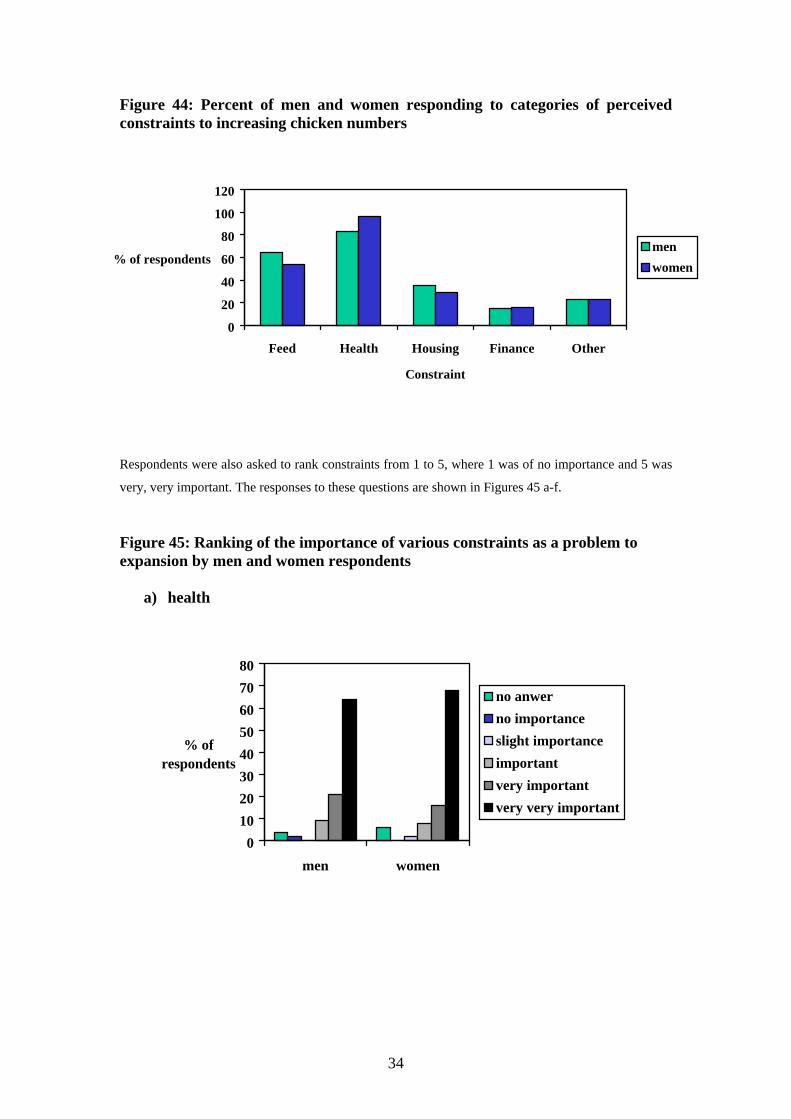
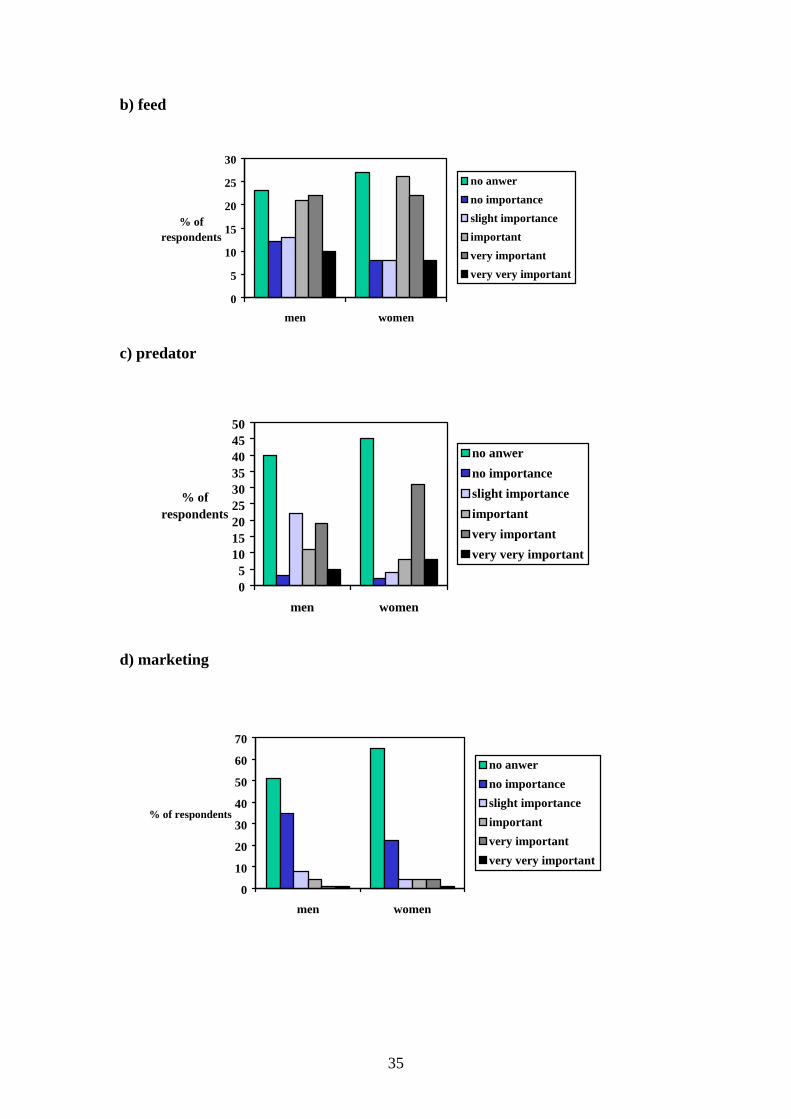
Respondents were also asked to rank constraints from 1 to 5, where 1 was of no importance and 5 was
very, very important. The responses to these questions are shown in Figures 45 a-f.
Figure 45: Ranking of the importance of various constraints as a problem to expansion by men and women respondents
a) health
01020304050607080
men women
% of respondents
no anwerno importanceslight importanceimportantvery importantvery very important
0
20
40
60
80
100
120
Feed Health Housing Finance Other
Constraint
% of respondentsmenwomen
35
b) feed
c) predator
d) marketing
0
5
10
15
20
25
30
men women
% of respondents
no anwerno importanceslight importanceimportantvery importantvery very important
0
10
20
30
40
50
60
70
men women
% of respondents
no anwerno importanceslight importanceimportantvery importantvery very important
05
101520253035404550
men women
% of respondents
no anwerno importanceslight importanceimportantvery importantvery very important
36
e) credit
f) information
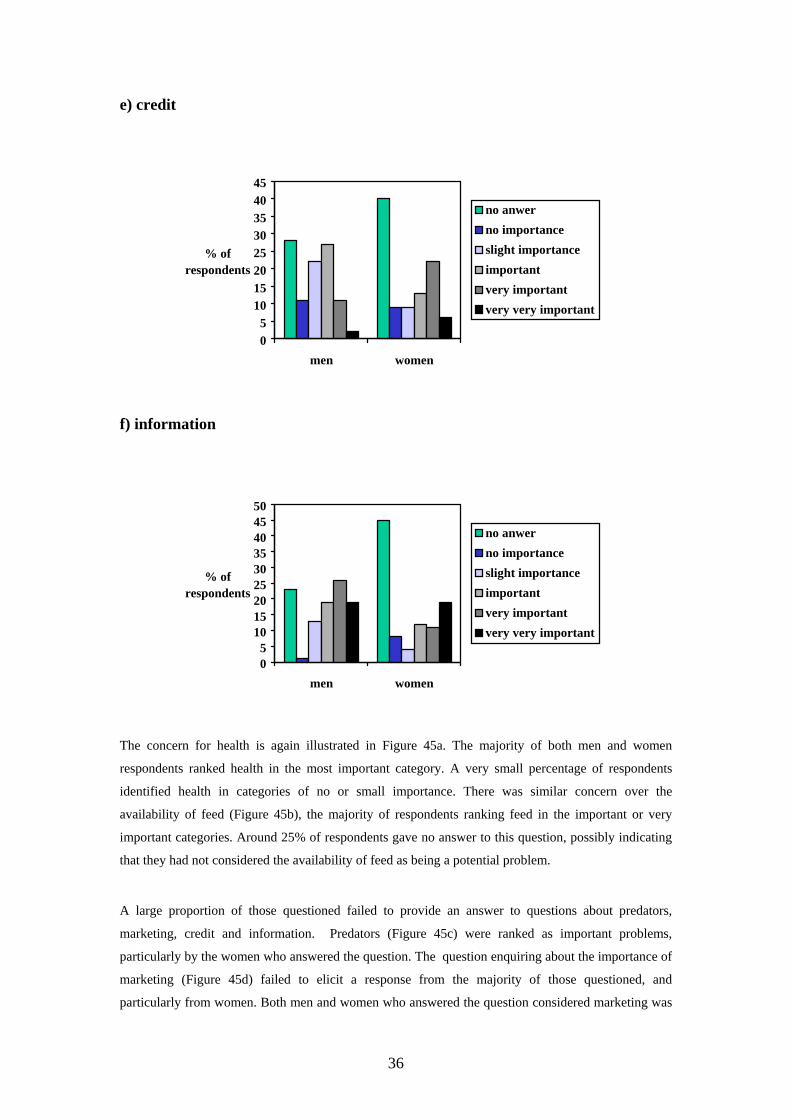
The concern for health is again illustrated in Figure 45a. The majority of both men and women
respondents ranked health in the most important category. A very small percentage of respondents
identified health in categories of no or small importance. There was similar concern over the
availability of feed (Figure 45b), the majority of respondents ranking feed in the important or very
important categories. Around 25% of respondents gave no answer to this question, possibly indicating
that they had not considered the availability of feed as being a potential problem.
A large proportion of those questioned failed to provide an answer to questions about predators,
marketing, credit and information. Predators (Figure 45c) were ranked as important problems,
particularly by the women who answered the question. The question enquiring about the importance of
marketing (Figure 45d) failed to elicit a response from the majority of those questioned, and
particularly from women. Both men and women who answered the question considered marketing was
05
101520253035404550
men women
% of respondents
no anwerno importanceslight importanceimportantvery importantvery very important
05
1015202530354045
men women
% of respondents
no anwerno importanceslight importanceimportantvery importantvery very important

37
of little importance. Questioning about the importance of the availability of credit drew a mixed
response (Figure 45e). A much larger proportion of women than men did not answer the question,
possibly indicating many women had not considered looking for credit to support their chicken-keeping
activities. However, those men and women who answered the question generally felt that getting credit
was an important issue. A greater proportion of women than men did not answer the question on the
importance of information (Figure 45f). There was a tendency amongst the women who answered the
question to see the lack of information as an important constraint. Men tended to have an opposite
view.
38
Smallscale Chicken Keeping in Peri-Urban Accra and Kumasi
1. Introduction
Small-holder poultry production where highly selected birds are managed under relatively intensive
conditions for the purpose of producing either meat or eggs is one of the livestock enterprises associated
with the peri-urban agricultural systems that have become a feature of urbanisation in many countries in the
developing world. Few studies have been made of these businesses. This study was conducted in peri-urban
Accra and Kumasi Metropolitan areas with the following objectives:
1. To identify the role and importance of backyard poultry production to peri-urban livelihoods
2. To examine the business decision making processes for improvement
3. To identify the factors that limit the marketing of peri-urban poultry produce
4. To identify the constraints to backyard poultry production and the interventions required to
eliminate them
47
2. Methodology
2.1 Study sites
The studies were carried out in the Accra-Tema and Kumasi metropolitan areas. The Accra
administrative districts were Ga, Awutu-Efutu-Senya (AES) and Gamoa. The districts covered by the
study in the Kumasi area were Atwima, Sekere West, Kumasi Metropolitan Area (KMA) and Kwabre.
Small scale poultry farmers in these districts were identified with the aid of Agricultural Extension
Agents and purposive sampling employed to establish the study group.
2.2 Data collection
Two methods were employed in the collection of data: a rapid appraisal that entailed focus group
discussions, followed by a sample survey. Focus group discussions were help separately with men and
women with 5 to 12 participants from Winneba, Abokobi, Pokuase, Awutu and Kasoa. A semi-
structured interview schedule was used that included such topics as demographic and household
characteristics, poultry housing and husbandry, and business records. Responses were used in the
development of the questionnaire to be used in the sample survey. The resulting questionnaire was used
in a 1. pilot study to allow testing and further modifications.
The questionnaire was designed to maximise the number of closed (categorical) questions in order to
ease data processing, minimise variation and improve precision of responses. In particular, the
questionnaire aimed to characterise the socio-demographic characteristics of small scale poultry
keepers, their farm facilities and labour use, issues relating to poultry husbandry, poultry health and
record keeping, their knowledge pathways, marketing, and their perceived constraints to profitability.
Ten enumerators were involved in the administration of the questionnaire. All were given a one-day
training session when they were introduced to the objectives of the study and taken through the
questionnaire. The questionnaire was administered in the local languages that were predominantly Twi,
Fante and Ga-Adangme.
48
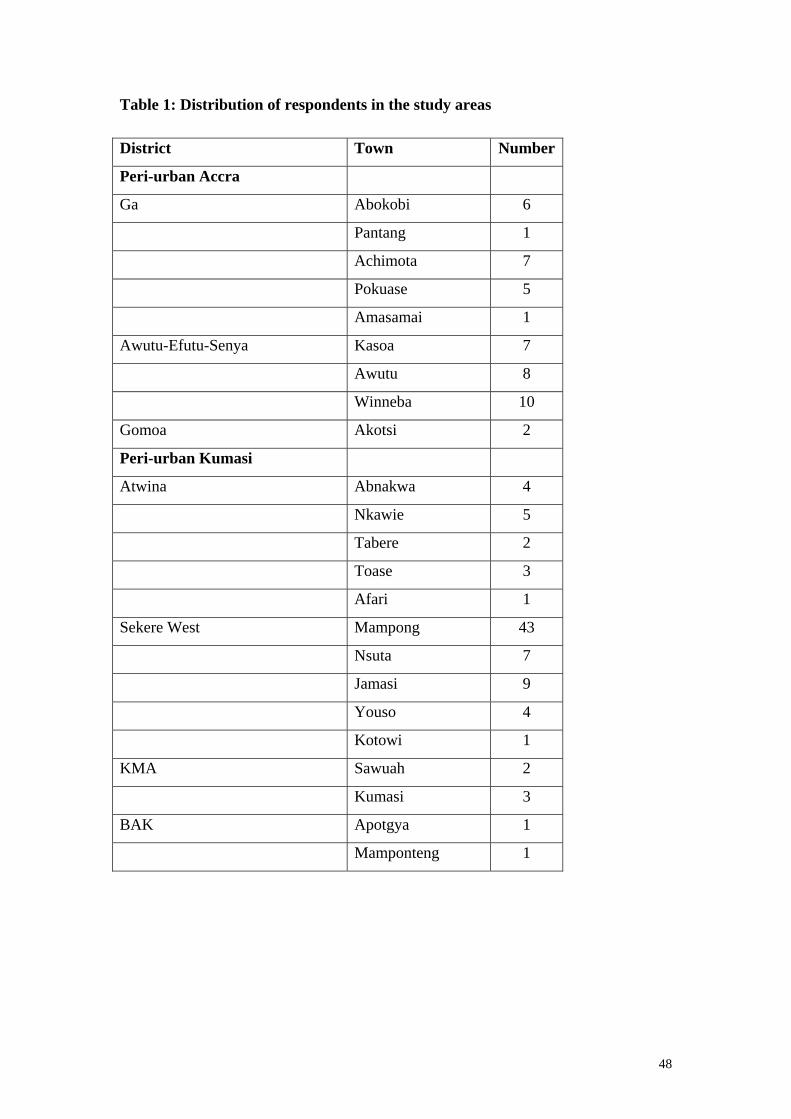
Table 1: Distribution of respondents in the study areas District Town Number
Peri-urban Accra
Ga Abokobi 6
Pantang 1
Achimota 7
Pokuase 5
Amasamai 1
Awutu-Efutu-Senya Kasoa 7
Awutu 8
Winneba 10
Gomoa Akotsi 2
Peri-urban Kumasi
Atwina Abnakwa 4
Nkawie 5
Tabere 2
Toase 3
Afari 1
Sekere West Mampong 43
Nsuta 7
Jamasi 9
Youso 4
Kotowi 1
KMA Sawuah 2
Kumasi 3
BAK Apotgya 1
Mamponteng 1
49
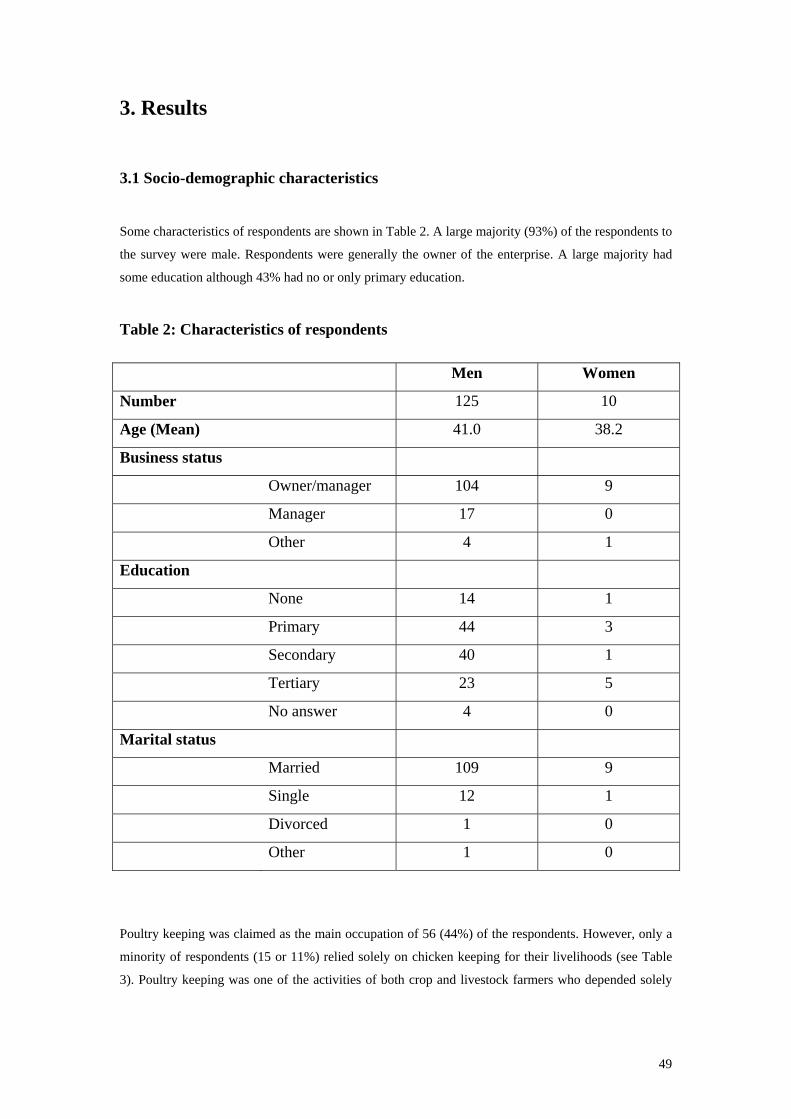
3. Results
3.1 Socio-demographic characteristics
Some characteristics of respondents are shown in Table 2. A large majority (93%) of the respondents to
the survey were male. Respondents were generally the owner of the enterprise. A large majority had
some education although 43% had no or only primary education.
Table 2: Characteristics of respondents Men Women
Number 125 10
Age (Mean) 41.0 38.2
Business status
Owner/manager 104 9
Manager 17 0
Other 4 1
Education
None 14 1
Primary 44 3
Secondary 40 1
Tertiary 23 5
No answer 4 0
Marital status
Married 109 9
Single 12 1
Divorced 1 0
Other 1 0
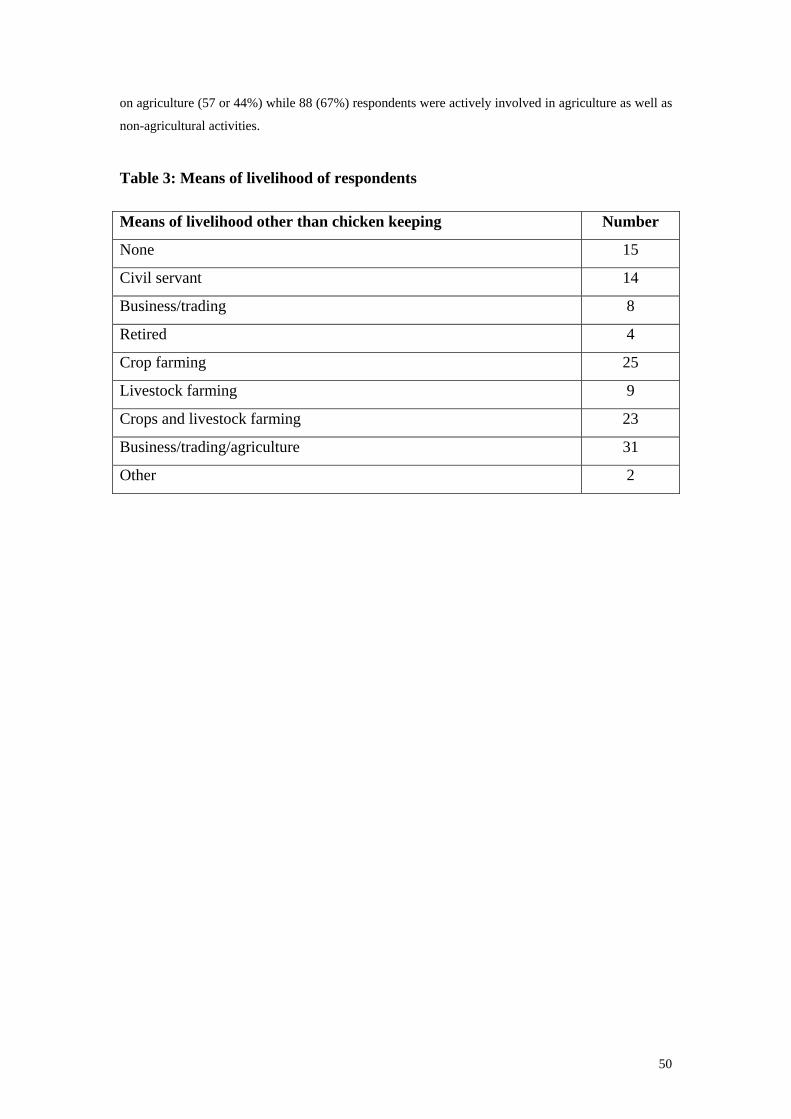
Poultry keeping was claimed as the main occupation of 56 (44%) of the respondents. However, only a
minority of respondents (15 or 11%) relied solely on chicken keeping for their livelihoods (see Table
3). Poultry keeping was one of the activities of both crop and livestock farmers who depended solely
50
on agriculture (57 or 44%) while 88 (67%) respondents were actively involved in agriculture as well as
non-agricultural activities.
Table 3: Means of livelihood of respondents Means of livelihood other than chicken keeping Number
None 15
Civil servant 14
Business/trading 8
Retired 4
Crop farming 25
Livestock farming 9
Crops and livestock farming 23
Business/trading/agriculture 31
Other 2
51
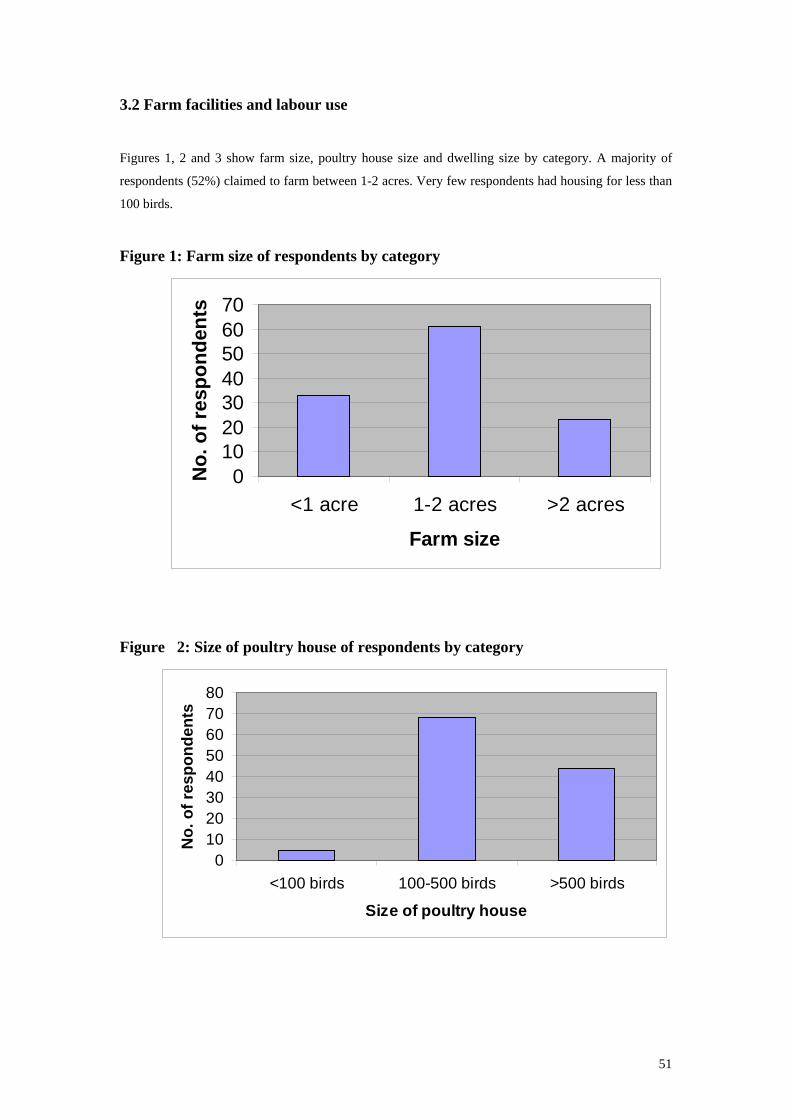
3.2 Farm facilities and labour use
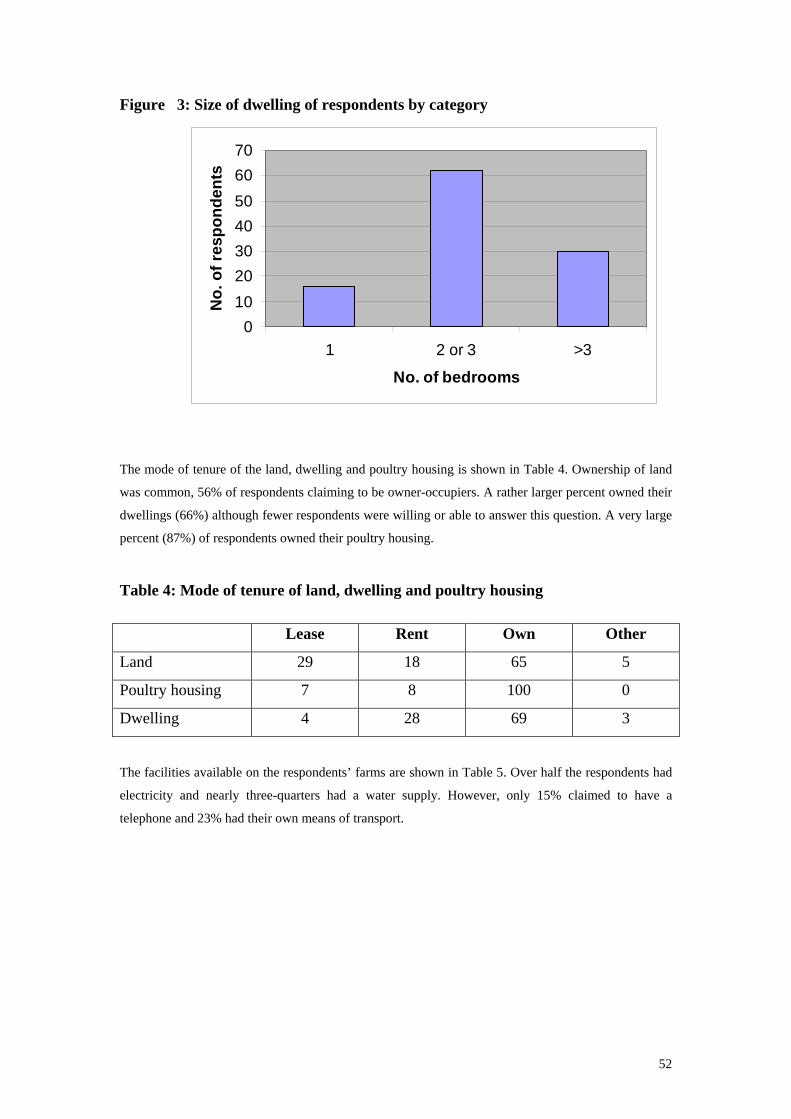
Figures 1, 2 and 3 show farm size, poultry house size and dwelling size by category. A majority of
respondents (52%) claimed to farm between 1-2 acres. Very few respondents had housing for less than
100 birds.
Figure 1: Farm size of respondents by category
010203040506070
<1 acre 1-2 acres >2 acres
Farm size
No.
of r
espo
nden
ts
Figure 2: Size of poultry house of respondents by category
01020304050607080
<100 birds 100-500 birds >500 birds
Size of poultry house
No.
of r
espo
nden
ts
52
Figure 3: Size of dwelling of respondents by category
010203040506070
1 2 or 3 >3
No. of bedrooms
No.
of r
espo
nden
ts
The mode of tenure of the land, dwelling and poultry housing is shown in Table 4. Ownership of land
was common, 56% of respondents claiming to be owner-occupiers. A rather larger percent owned their
dwellings (66%) although fewer respondents were willing or able to answer this question. A very large
percent (87%) of respondents owned their poultry housing.
Table 4: Mode of tenure of land, dwelling and poultry housing Lease Rent Own Other
Land 29 18 65 5
Poultry housing 7 8 100 0
Dwelling 4 28 69 3
The facilities available on the respondents’ farms are shown in Table 5. Over half the respondents had
electricity and nearly three-quarters had a water supply. However, only 15% claimed to have a
telephone and 23% had their own means of transport.
53
Table 5: Facilities available on farms: number (%) of respondents with
electricity, telephone, water and own means of transportation
Facility No. (%)
Electricity 74 (56)
Telephone 20 (15)
Water 99 (74)
Own transport 28 (23)
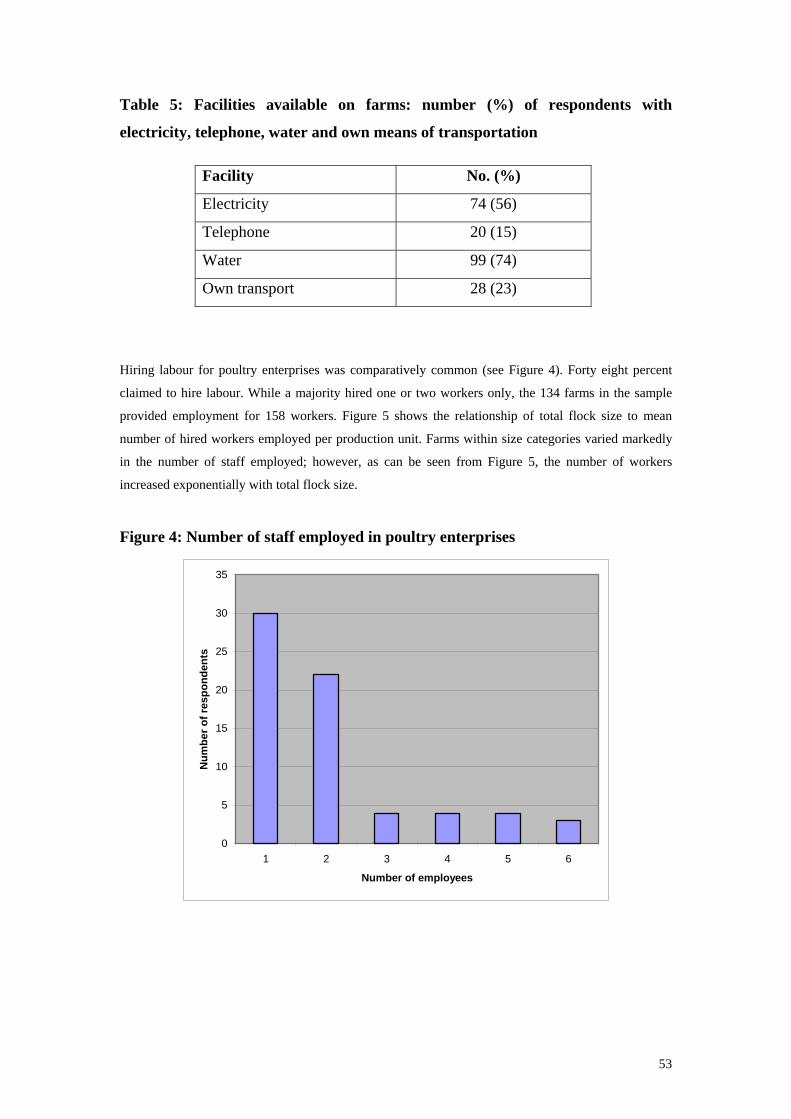
Hiring labour for poultry enterprises was comparatively common (see Figure 4). Forty eight percent
claimed to hire labour. While a majority hired one or two workers only, the 134 farms in the sample
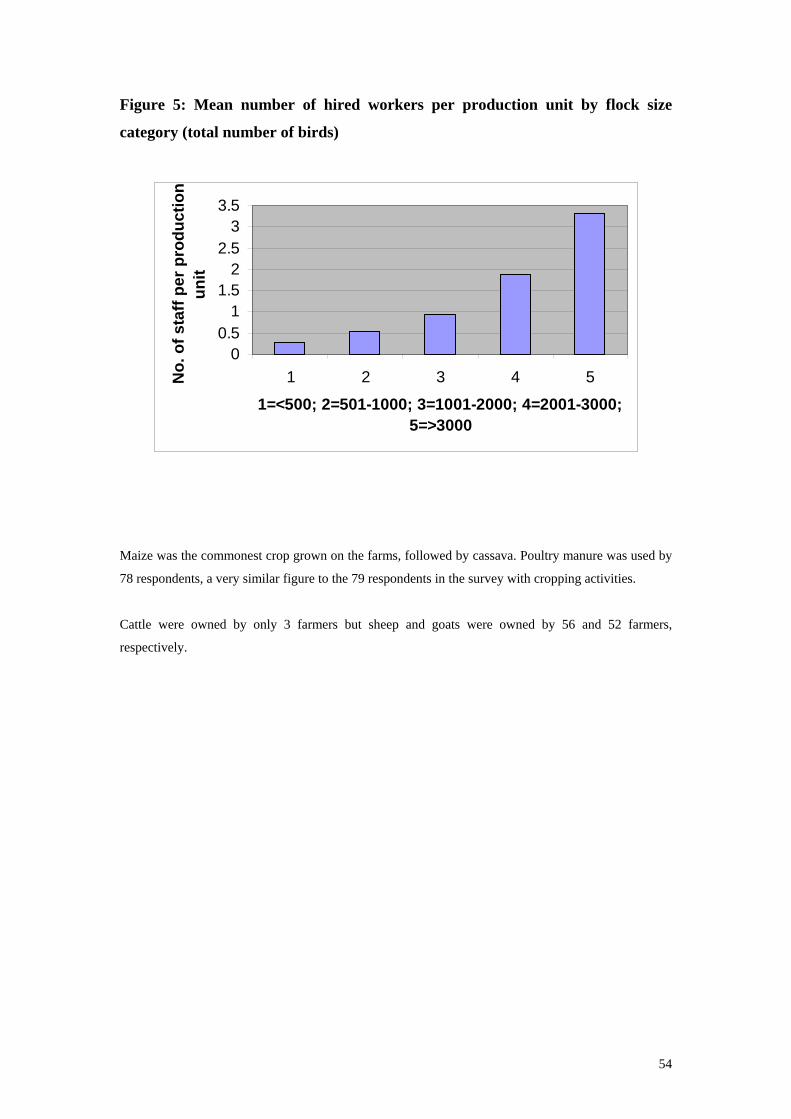
provided employment for 158 workers. Figure 5 shows the relationship of total flock size to mean
number of hired workers employed per production unit. Farms within size categories varied markedly
in the number of staff employed; however, as can be seen from Figure 5, the number of workers
increased exponentially with total flock size.
Figure 4: Number of staff employed in poultry enterprises
0
5
10
15
20
25
30
35
1 2 3 4 5 6
Number of employees
Num
ber o
f res
pond
ents
54
Figure 5: Mean number of hired workers per production unit by flock size
category (total number of birds)
00.5
11.5
22.5
33.5
1 2 3 4 5
1=<500; 2=501-1000; 3=1001-2000; 4=2001-3000; 5=>3000
No.
of s
taff
per p
rodu
ctio
n un
it
Maize was the commonest crop grown on the farms, followed by cassava. Poultry manure was used by
78 respondents, a very similar figure to the 79 respondents in the survey with cropping activities.
Cattle were owned by only 3 farmers but sheep and goats were owned by 56 and 52 farmers,
respectively.
55
3.3 Numbers of poultry kept
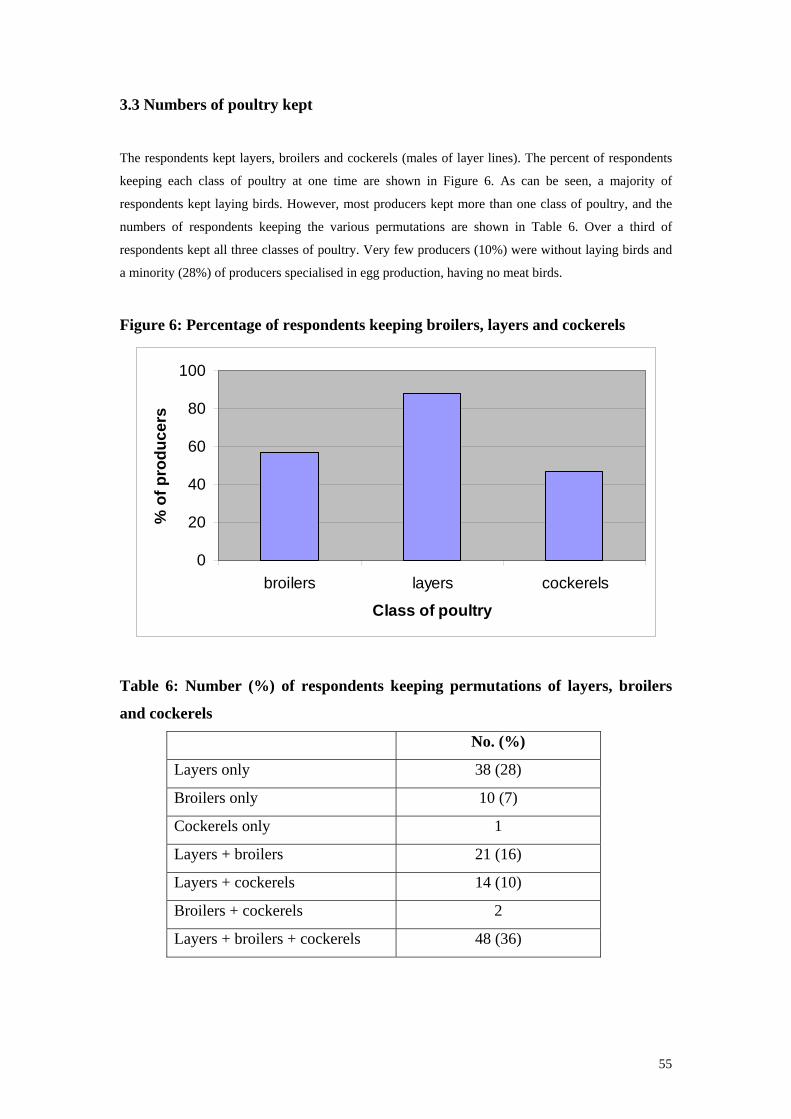
The respondents kept layers, broilers and cockerels (males of layer lines). The percent of respondents
keeping each class of poultry at one time are shown in Figure 6. As can be seen, a majority of
respondents kept laying birds. However, most producers kept more than one class of poultry, and the
numbers of respondents keeping the various permutations are shown in Table 6. Over a third of
respondents kept all three classes of poultry. Very few producers (10%) were without laying birds and
a minority (28%) of producers specialised in egg production, having no meat birds.
Figure 6: Percentage of respondents keeping broilers, layers and cockerels
0
20
40
60
80
100
broilers layers cockerels
Class of poultry
% o
f pro
duce
rs
Table 6: Number (%) of respondents keeping permutations of layers, broilers
and cockerels
No. (%)
Layers only 38 (28)
Broilers only 10 (7)
Cockerels only 1
Layers + broilers 21 (16)
Layers + cockerels 14 (10)
Broilers + cockerels 2
Layers + broilers + cockerels 48 (36)
56
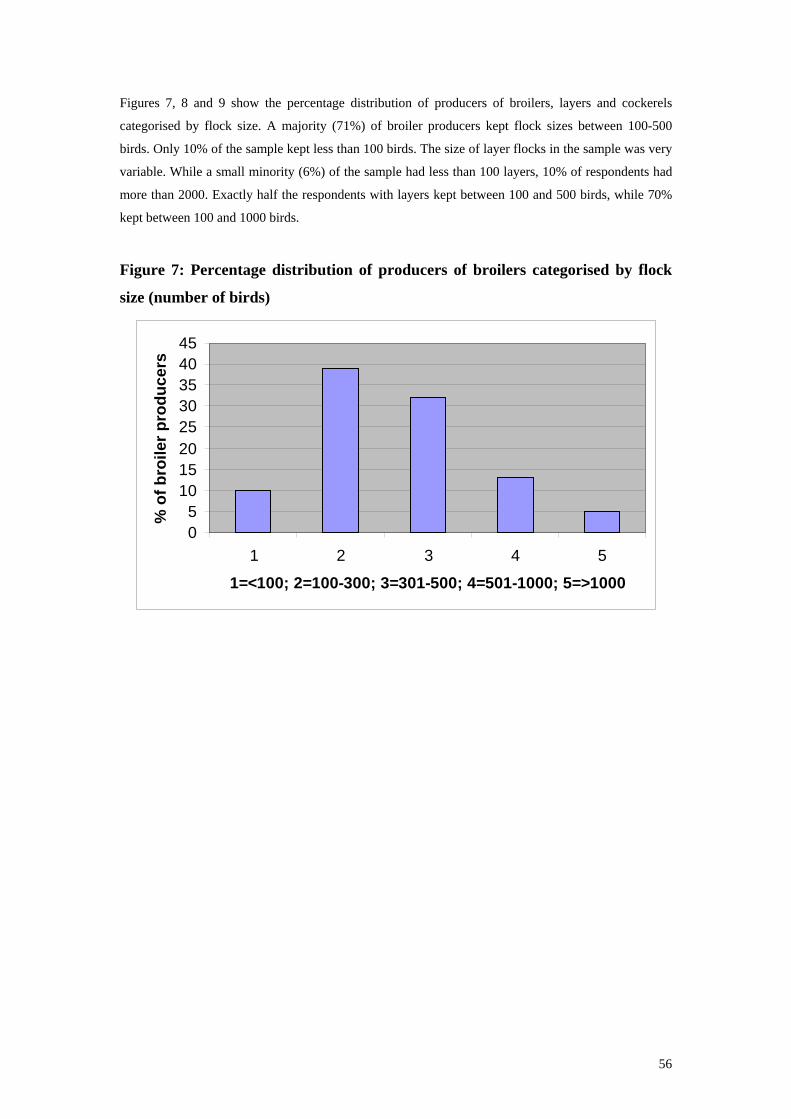
Figures 7, 8 and 9 show the percentage distribution of producers of broilers, layers and cockerels
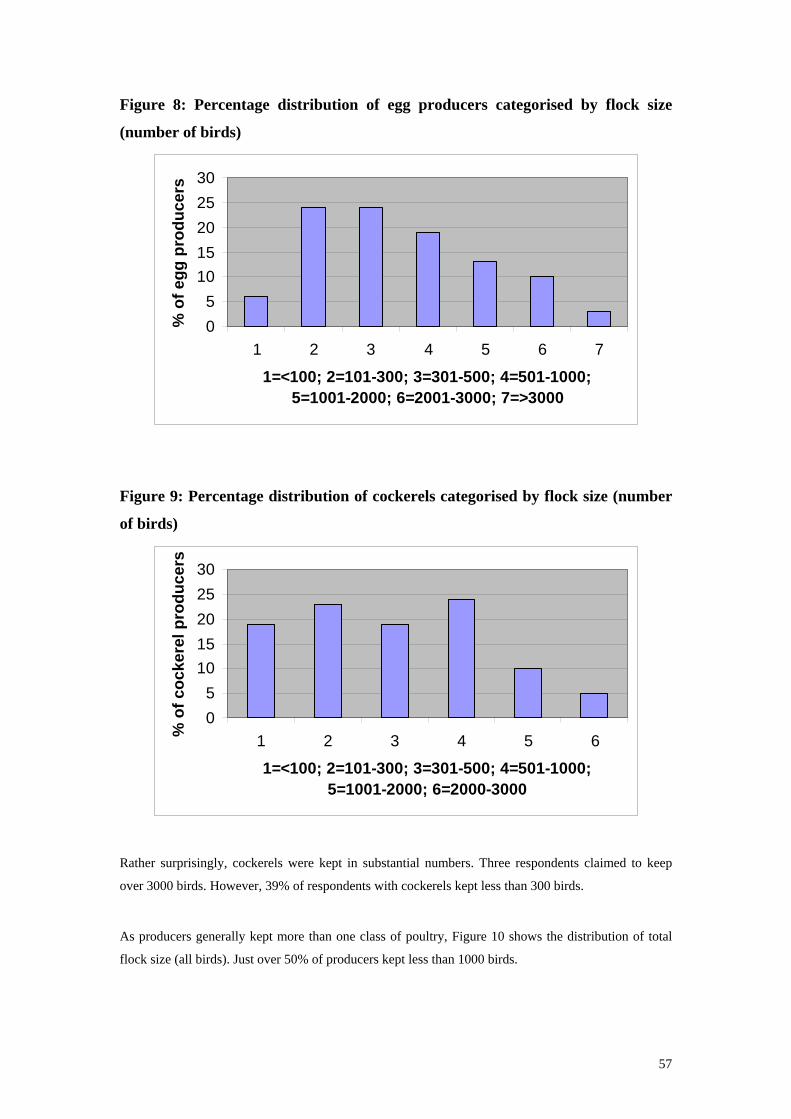
categorised by flock size. A majority (71%) of broiler producers kept flock sizes between 100-500
birds. Only 10% of the sample kept less than 100 birds. The size of layer flocks in the sample was very
variable. While a small minority (6%) of the sample had less than 100 layers, 10% of respondents had
more than 2000. Exactly half the respondents with layers kept between 100 and 500 birds, while 70%
kept between 100 and 1000 birds.
Figure 7: Percentage distribution of producers of broilers categorised by flock
size (number of birds)
05
1015202530354045
1 2 3 4 5
1=<100; 2=100-300; 3=301-500; 4=501-1000; 5=>1000
% o
f bro
iler p
rodu
cers
57
Figure 8: Percentage distribution of egg producers categorised by flock size
(number of birds)
05
1015202530
1 2 3 4 5 6 7
1=<100; 2=101-300; 3=301-500; 4=501-1000; 5=1001-2000; 6=2001-3000; 7=>3000
% o
f egg
pro
duce
rs
Figure 9: Percentage distribution of cockerels categorised by flock size (number
of birds)
05
1015202530
1 2 3 4 5 6
1=<100; 2=101-300; 3=301-500; 4=501-1000; 5=1001-2000; 6=2000-3000
% o
f coc
kere
l pro
duce
rs
Rather surprisingly, cockerels were kept in substantial numbers. Three respondents claimed to keep
over 3000 birds. However, 39% of respondents with cockerels kept less than 300 birds.
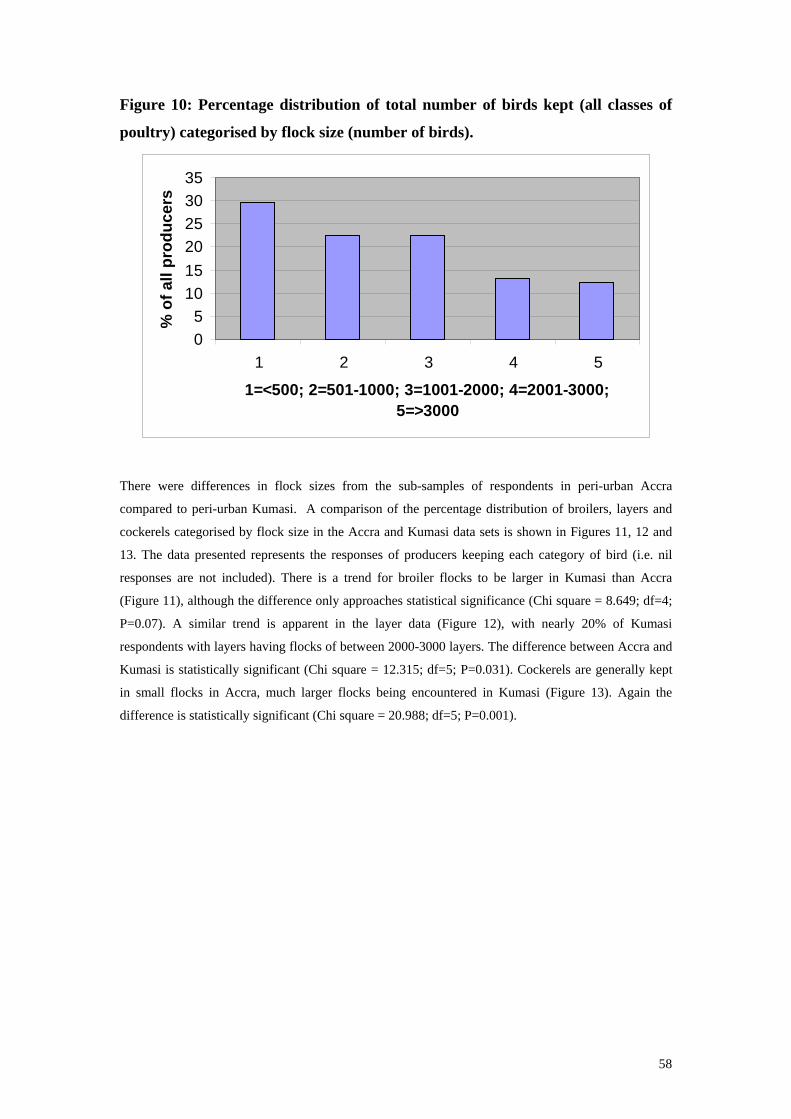
As producers generally kept more than one class of poultry, Figure 10 shows the distribution of total
flock size (all birds). Just over 50% of producers kept less than 1000 birds.
58
Figure 10: Percentage distribution of total number of birds kept (all classes of
poultry) categorised by flock size (number of birds).
05
101520253035
1 2 3 4 5
1=<500; 2=501-1000; 3=1001-2000; 4=2001-3000; 5=>3000
% o
f all
prod
ucer
s
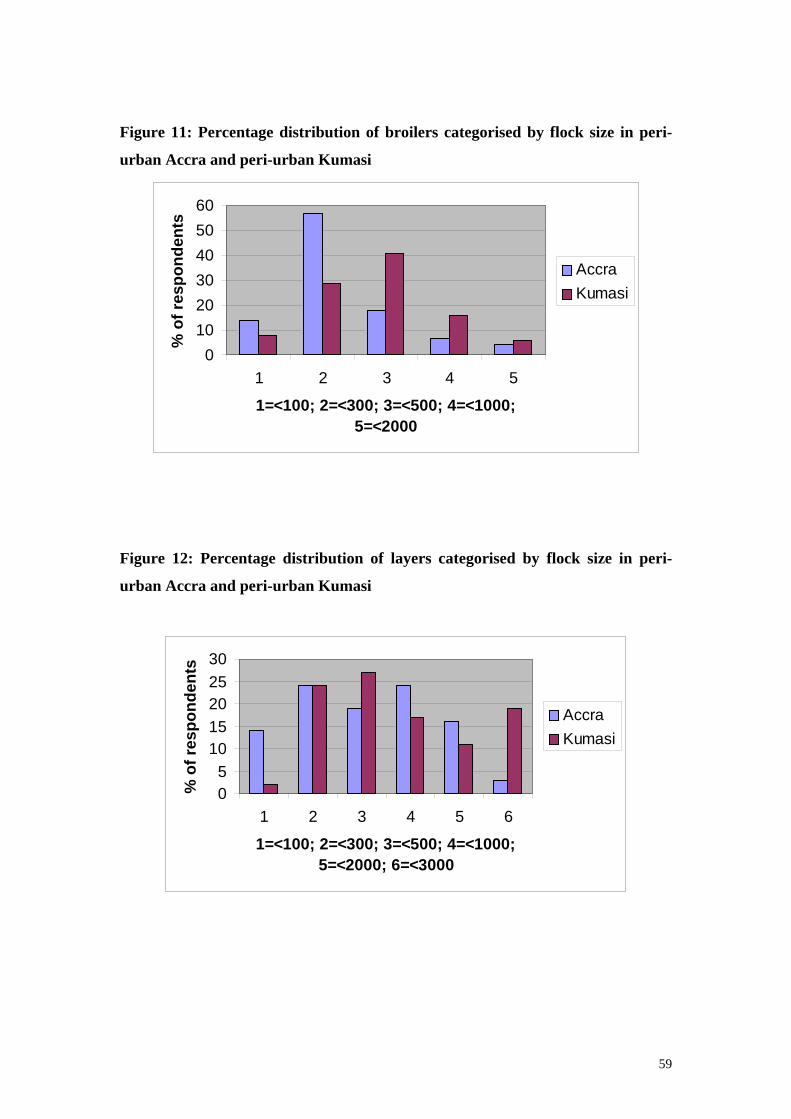
There were differences in flock sizes from the sub-samples of respondents in peri-urban Accra
compared to peri-urban Kumasi. A comparison of the percentage distribution of broilers, layers and
cockerels categorised by flock size in the Accra and Kumasi data sets is shown in Figures 11, 12 and
13. The data presented represents the responses of producers keeping each category of bird (i.e. nil
responses are not included). There is a trend for broiler flocks to be larger in Kumasi than Accra
(Figure 11), although the difference only approaches statistical significance (Chi square = 8.649; df=4;
P=0.07). A similar trend is apparent in the layer data (Figure 12), with nearly 20% of Kumasi
respondents with layers having flocks of between 2000-3000 layers. The difference between Accra and
Kumasi is statistically significant (Chi square = 12.315; df=5; P=0.031). Cockerels are generally kept
in small flocks in Accra, much larger flocks being encountered in Kumasi (Figure 13). Again the
difference is statistically significant (Chi square = 20.988; df=5; P=0.001).
59
Figure 11: Percentage distribution of broilers categorised by flock size in peri-
urban Accra and peri-urban Kumasi
0102030405060
1 2 3 4 5
1=<100; 2=<300; 3=<500; 4=<1000; 5=<2000
% o
f res
pond
ents
AccraKumasi
Figure 12: Percentage distribution of layers categorised by flock size in peri-
urban Accra and peri-urban Kumasi
05
1015202530
1 2 3 4 5 6
1=<100; 2=<300; 3=<500; 4=<1000; 5=<2000; 6=<3000
% o
f res
pond
ents
AccraKumasi
60
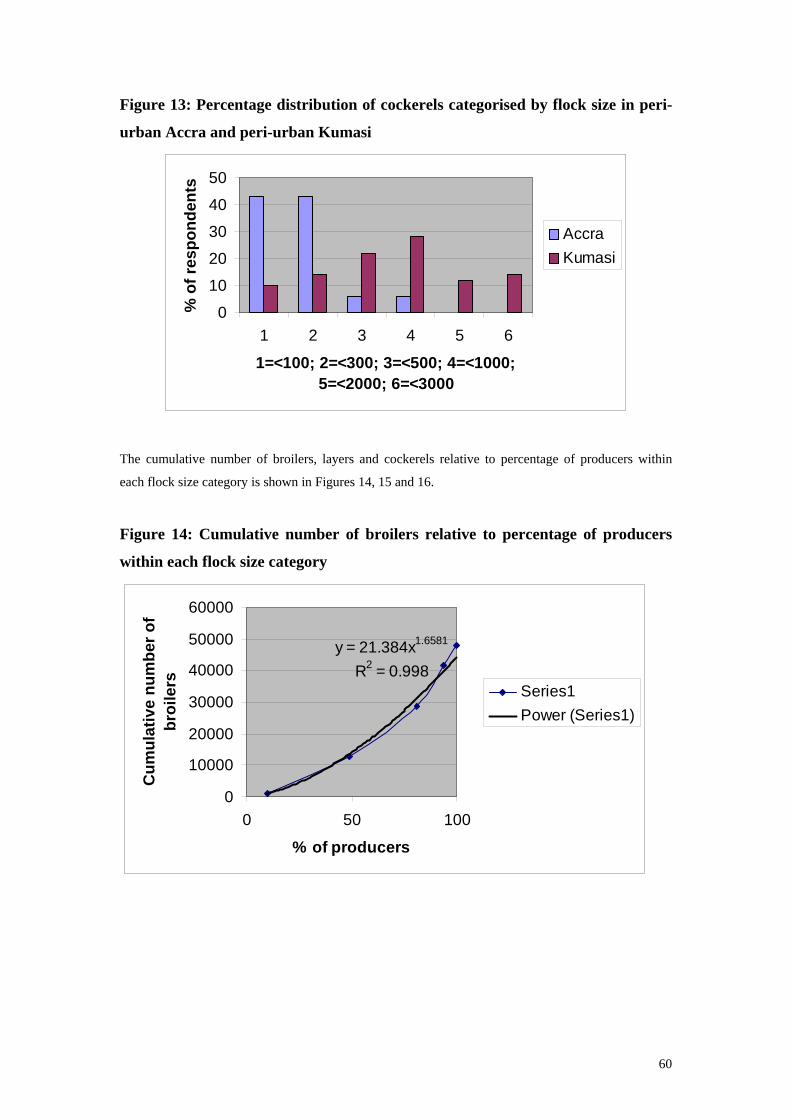
Figure 13: Percentage distribution of cockerels categorised by flock size in peri-
urban Accra and peri-urban Kumasi
0
10
20
30
40
50
1 2 3 4 5 6
1=<100; 2=<300; 3=<500; 4=<1000; 5=<2000; 6=<3000
% o
f res
pond
ents
AccraKumasi
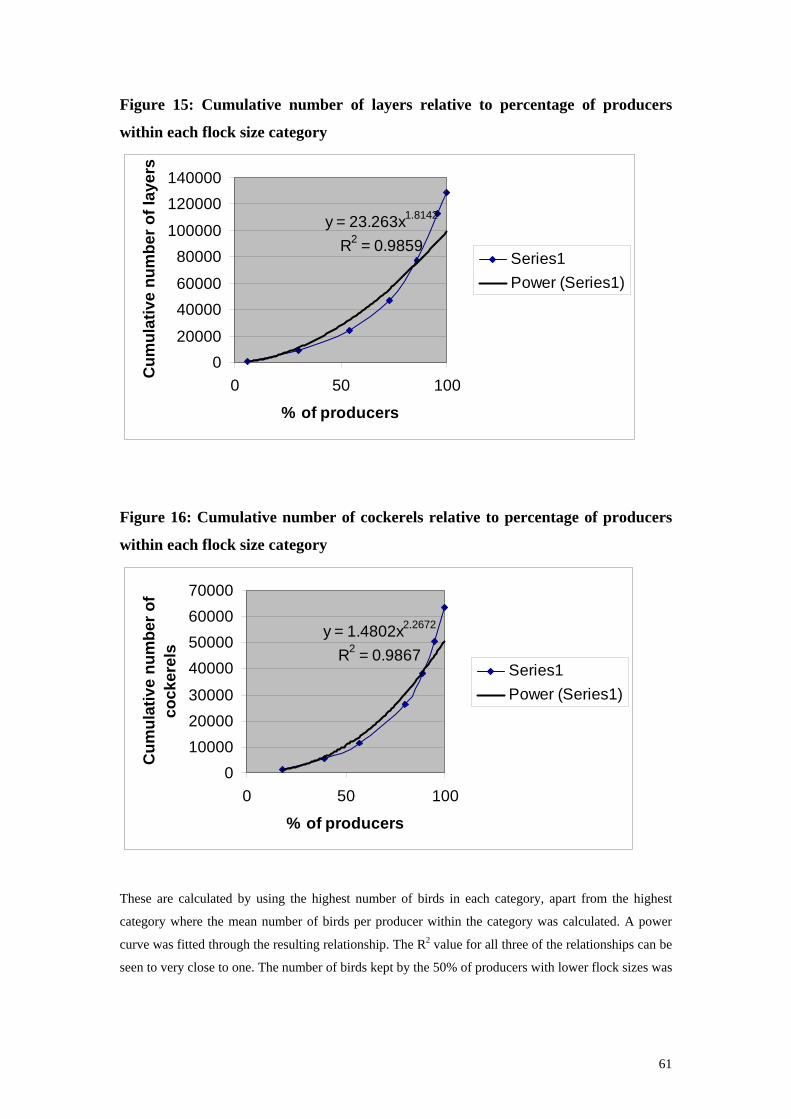
The cumulative number of broilers, layers and cockerels relative to percentage of producers within
each flock size category is shown in Figures 14, 15 and 16.
Figure 14: Cumulative number of broilers relative to percentage of producers
within each flock size category
y = 21.384x1.6581
R2 = 0.998
0
10000
20000
30000
40000
50000
60000
0 50 100
% of producers
Cum
ulat
ive
num
ber o
f br
oile
rs Series1Power (Series1)
61
Figure 15: Cumulative number of layers relative to percentage of producers
within each flock size category
y = 23.263x1.8142
R2 = 0.9859
020000
4000060000
80000100000
120000140000
0 50 100
% of producers
Cum
ulat
ive
num
ber o
f lay
ers
Series1Power (Series1)
Figure 16: Cumulative number of cockerels relative to percentage of producers
within each flock size category
y = 1.4802x2.2672
R2 = 0.9867
0100002000030000
40000500006000070000
0 50 100
% of producers
Cum
ulat
ive
num
ber o
f co
cker
els
Series1Power (Series1)
These are calculated by using the highest number of birds in each category, apart from the highest
category where the mean number of birds per producer within the category was calculated. A power
curve was fitted through the resulting relationship. The R2 value for all three of the relationships can be
seen to very close to one. The number of birds kept by the 50% of producers with lower flock sizes was

62
calculated. These numbers represented 32, 28 and 21% of all birds kept by all producers for broilers,
layers and cockerels, respectively.
Free-range indigenous chickens were kept by 51 of the respondents, usually in flocks of 10-30.
63
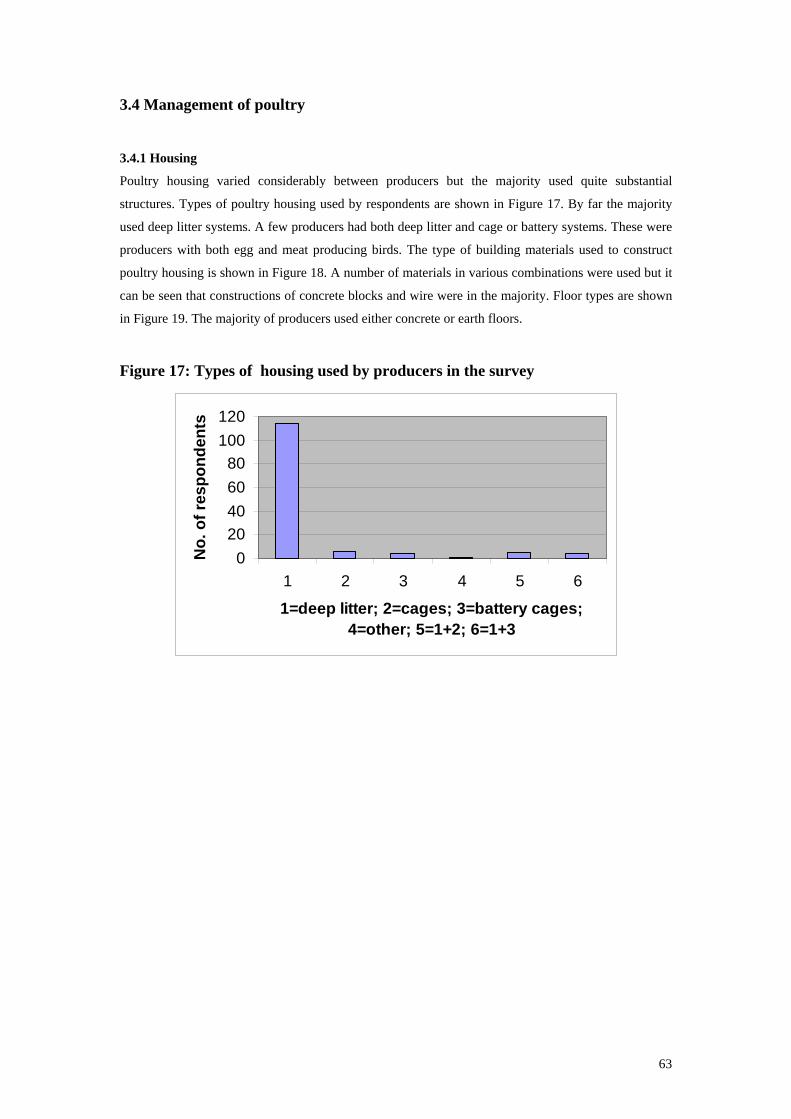
3.4 Management of poultry
3.4.1 Housing
Poultry housing varied considerably between producers but the majority used quite substantial
structures. Types of poultry housing used by respondents are shown in Figure 17. By far the majority
used deep litter systems. A few producers had both deep litter and cage or battery systems. These were
producers with both egg and meat producing birds. The type of building materials used to construct
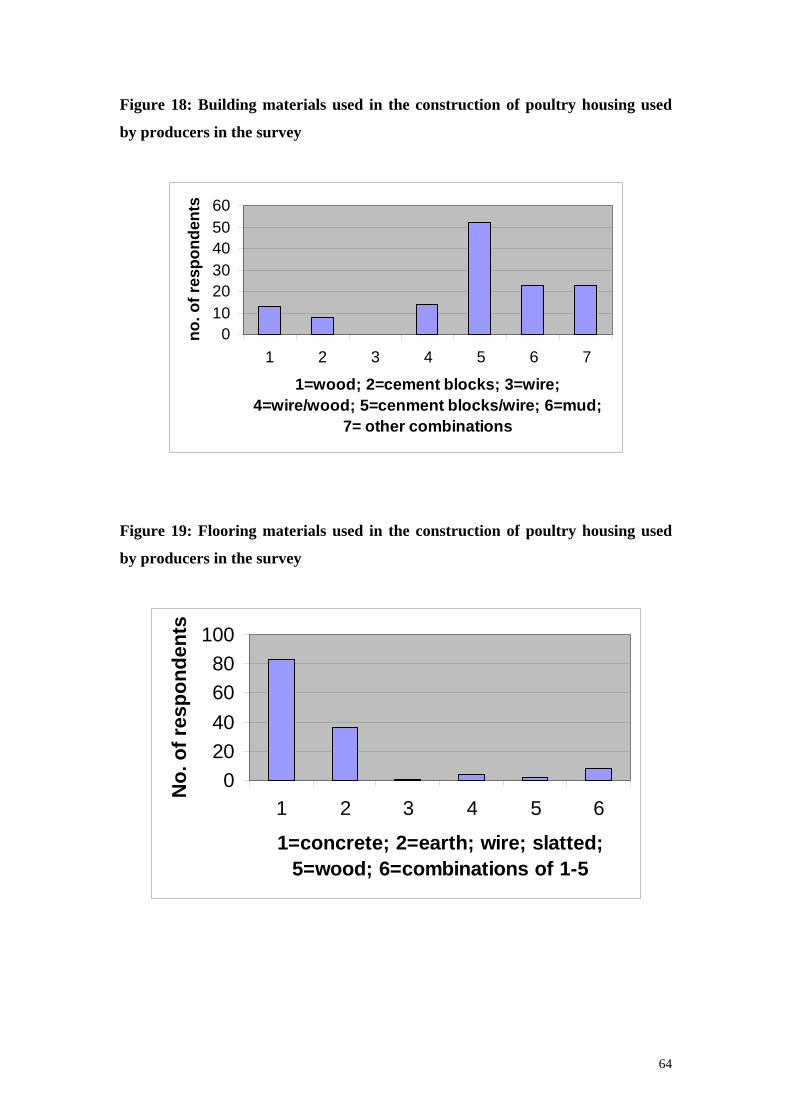
poultry housing is shown in Figure 18. A number of materials in various combinations were used but it
can be seen that constructions of concrete blocks and wire were in the majority. Floor types are shown
in Figure 19. The majority of producers used either concrete or earth floors.
Figure 17: Types of housing used by producers in the survey
020406080
100120
1 2 3 4 5 6
1=deep litter; 2=cages; 3=battery cages; 4=other; 5=1+2; 6=1+3
No.
of r
espo
nden
ts
64
Figure 18: Building materials used in the construction of poultry housing used
by producers in the survey
0102030405060
1 2 3 4 5 6 7
1=wood; 2=cement blocks; 3=wire; 4=wire/wood; 5=cenment blocks/wire; 6=mud;
7= other combinations
no. o
f res
pond
ents
Figure 19: Flooring materials used in the construction of poultry housing used
by producers in the survey
020406080
100
1 2 3 4 5 6
1=concrete; 2=earth; wire; slatted; 5=wood; 6=combinations of 1-5
No.
of r
espo
nden
ts
65
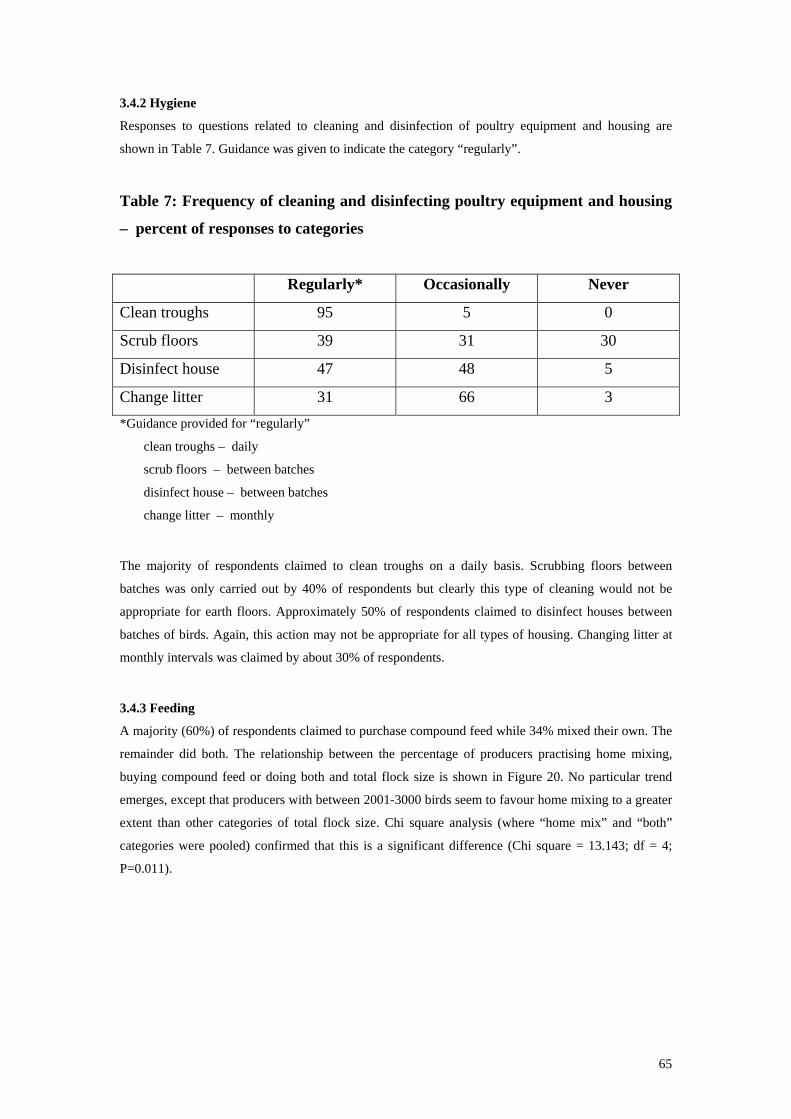
3.4.2 Hygiene
Responses to questions related to cleaning and disinfection of poultry equipment and housing are
shown in Table 7. Guidance was given to indicate the category “regularly”.
Table 7: Frequency of cleaning and disinfecting poultry equipment and housing
– percent of responses to categories
Regularly* Occasionally Never
Clean troughs 95 5 0
Scrub floors 39 31 30
Disinfect house 47 48 5
Change litter 31 66 3 *Guidance provided for “regularly”
clean troughs – daily
scrub floors – between batches
disinfect house – between batches
change litter – monthly The majority of respondents claimed to clean troughs on a daily basis. Scrubbing floors between
batches was only carried out by 40% of respondents but clearly this type of cleaning would not be
appropriate for earth floors. Approximately 50% of respondents claimed to disinfect houses between
batches of birds. Again, this action may not be appropriate for all types of housing. Changing litter at
monthly intervals was claimed by about 30% of respondents.
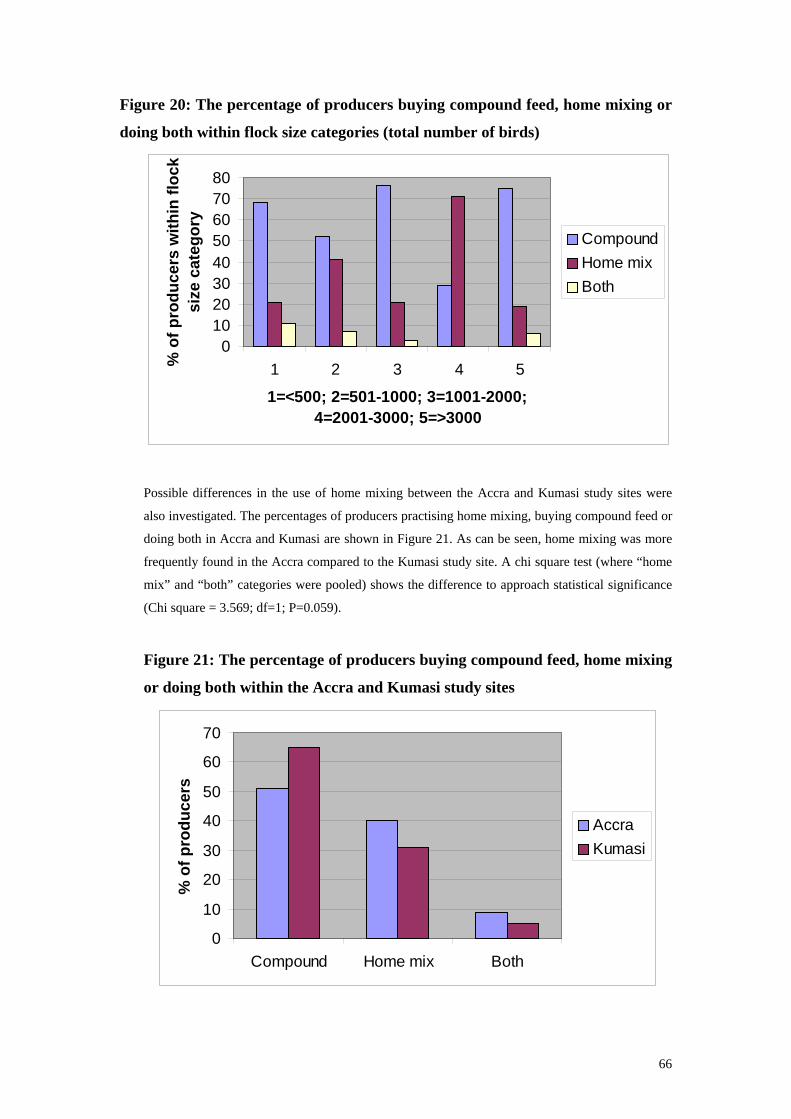
3.4.3 Feeding
A majority (60%) of respondents claimed to purchase compound feed while 34% mixed their own. The
remainder did both. The relationship between the percentage of producers practising home mixing,
buying compound feed or doing both and total flock size is shown in Figure 20. No particular trend
emerges, except that producers with between 2001-3000 birds seem to favour home mixing to a greater
extent than other categories of total flock size. Chi square analysis (where “home mix” and “both”
categories were pooled) confirmed that this is a significant difference (Chi square = 13.143; df = 4;
P=0.011).
66
Figure 20: The percentage of producers buying compound feed, home mixing or
doing both within flock size categories (total number of birds)
01020304050607080
1 2 3 4 5
1=<500; 2=501-1000; 3=1001-2000; 4=2001-3000; 5=>3000
% o
f pro
duce
rs w
ithin
floc
k si
ze c
ateg
ory
CompoundHome mixBoth
Possible differences in the use of home mixing between the Accra and Kumasi study sites were
also investigated. The percentages of producers practising home mixing, buying compound feed or
doing both in Accra and Kumasi are shown in Figure 21. As can be seen, home mixing was more
frequently found in the Accra compared to the Kumasi study site. A chi square test (where “home
mix” and “both” categories were pooled) shows the difference to approach statistical significance
(Chi square = 3.569; df=1; P=0.059).
Figure 21: The percentage of producers buying compound feed, home mixing
or doing both within the Accra and Kumasi study sites
0
10
20
30
40
50
60
70
Compound Home mix Both
% o
f pro
duce
rs
AccraKumasi
67
When asked about ration formulation, 50 respondents in addition to those claiming to home mix
volunteered ration formulations, all of which included a purchased concentrate. Therefore the
numbers of producers that practice home-mixing in some form rises to 104, 78% of respondents.
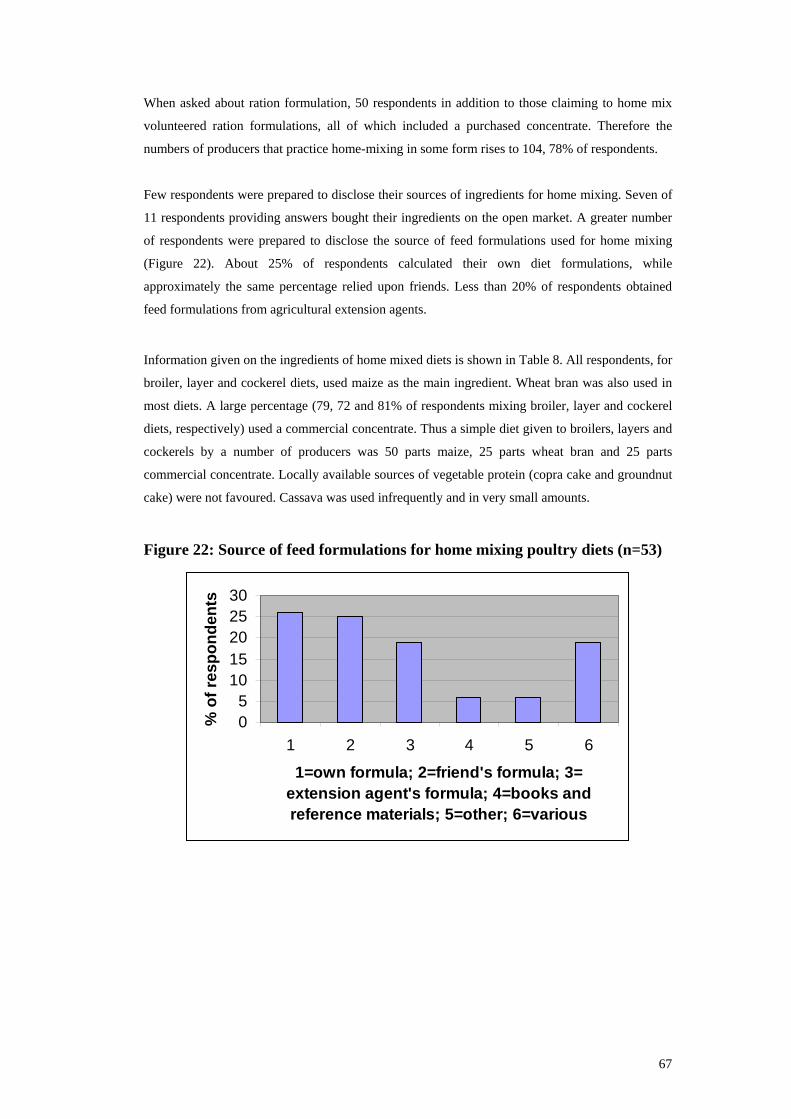
Few respondents were prepared to disclose their sources of ingredients for home mixing. Seven of
11 respondents providing answers bought their ingredients on the open market. A greater number
of respondents were prepared to disclose the source of feed formulations used for home mixing
(Figure 22). About 25% of respondents calculated their own diet formulations, while
approximately the same percentage relied upon friends. Less than 20% of respondents obtained
feed formulations from agricultural extension agents.
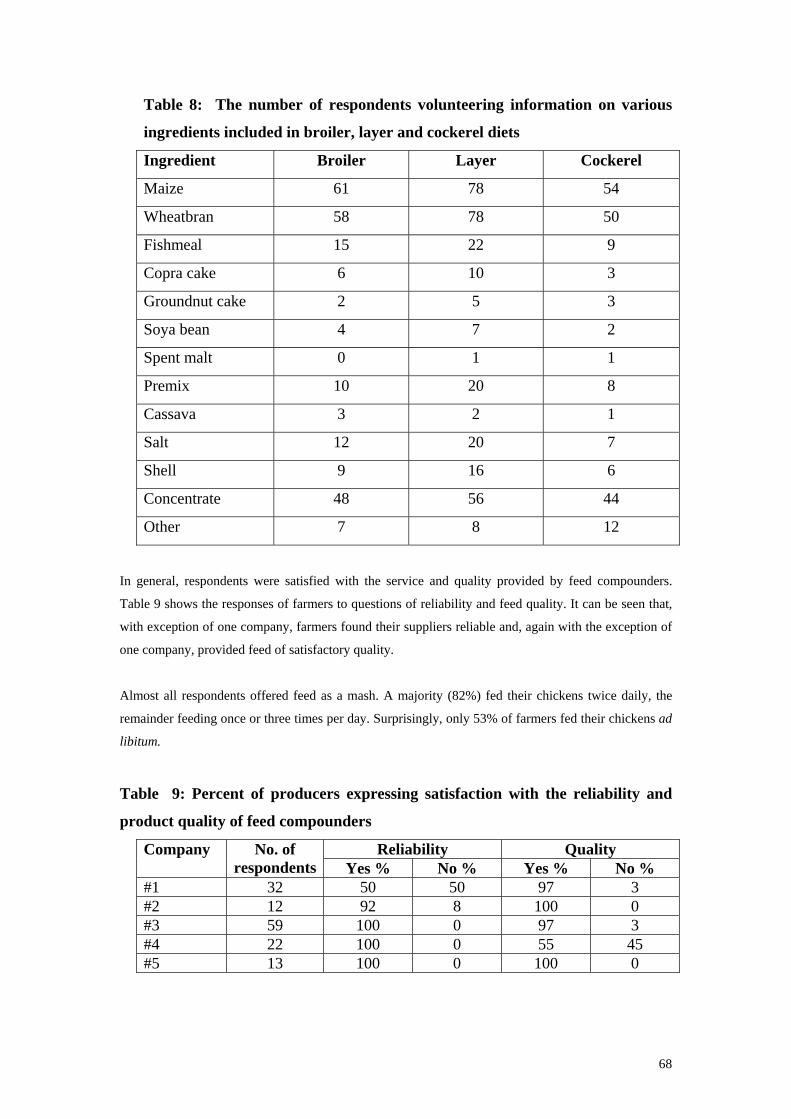
Information given on the ingredients of home mixed diets is shown in Table 8. All respondents, for
broiler, layer and cockerel diets, used maize as the main ingredient. Wheat bran was also used in
most diets. A large percentage (79, 72 and 81% of respondents mixing broiler, layer and cockerel
diets, respectively) used a commercial concentrate. Thus a simple diet given to broilers, layers and
cockerels by a number of producers was 50 parts maize, 25 parts wheat bran and 25 parts
commercial concentrate. Locally available sources of vegetable protein (copra cake and groundnut
cake) were not favoured. Cassava was used infrequently and in very small amounts.
Figure 22: Source of feed formulations for home mixing poultry diets (n=53)
05
1015202530
1 2 3 4 5 6
1=own formula; 2=friend's formula; 3= extension agent's formula; 4=books and reference materials; 5=other; 6=various
% o
f res
pond
ents
68
Table 8: The number of respondents volunteering information on various
ingredients included in broiler, layer and cockerel diets
Ingredient Broiler Layer Cockerel
Maize 61 78 54
Wheatbran 58 78 50
Fishmeal 15 22 9
Copra cake 6 10 3
Groundnut cake 2 5 3
Soya bean 4 7 2
Spent malt 0 1 1
Premix 10 20 8
Cassava 3 2 1
Salt 12 20 7
Shell 9 16 6
Concentrate 48 56 44
Other 7 8 12
In general, respondents were satisfied with the service and quality provided by feed compounders.
Table 9 shows the responses of farmers to questions of reliability and feed quality. It can be seen that,
with exception of one company, farmers found their suppliers reliable and, again with the exception of
one company, provided feed of satisfactory quality.
Almost all respondents offered feed as a mash. A majority (82%) fed their chickens twice daily, the
remainder feeding once or three times per day. Surprisingly, only 53% of farmers fed their chickens ad
libitum.
Table 9: Percent of producers expressing satisfaction with the reliability and
product quality of feed compounders
Reliability Quality Company No. of respondents Yes % No % Yes % No %
#1 32 50 50 97 3 #2 12 92 8 100 0 #3 59 100 0 97 3 #4 22 100 0 55 45 #5 13 100 0 100 0
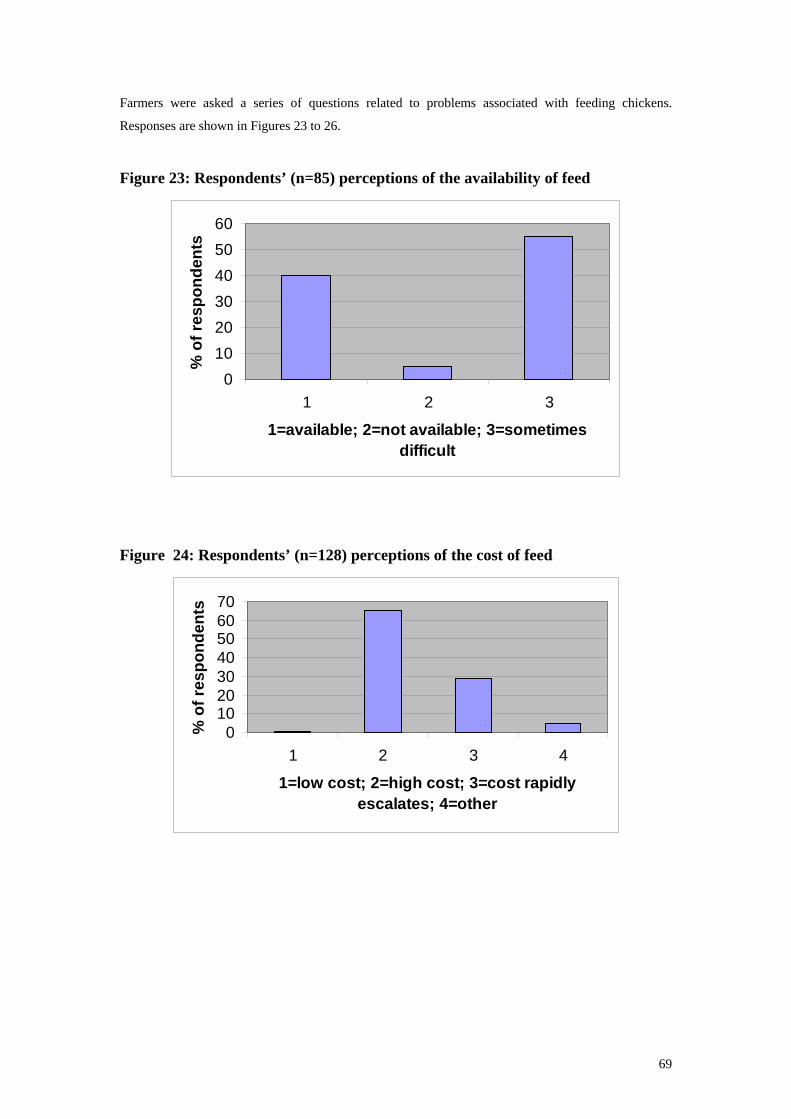
69
Farmers were asked a series of questions related to problems associated with feeding chickens.
Responses are shown in Figures 23 to 26.
Figure 23: Respondents’ (n=85) perceptions of the availability of feed
0102030405060
1 2 3
1=available; 2=not available; 3=sometimes difficult
% o
f res
pond
ents
Figure 24: Respondents’ (n=128) perceptions of the cost of feed
010203040506070
1 2 3 4
1=low cost; 2=high cost; 3=cost rapidly escalates; 4=other
% o
f res
pond
ents
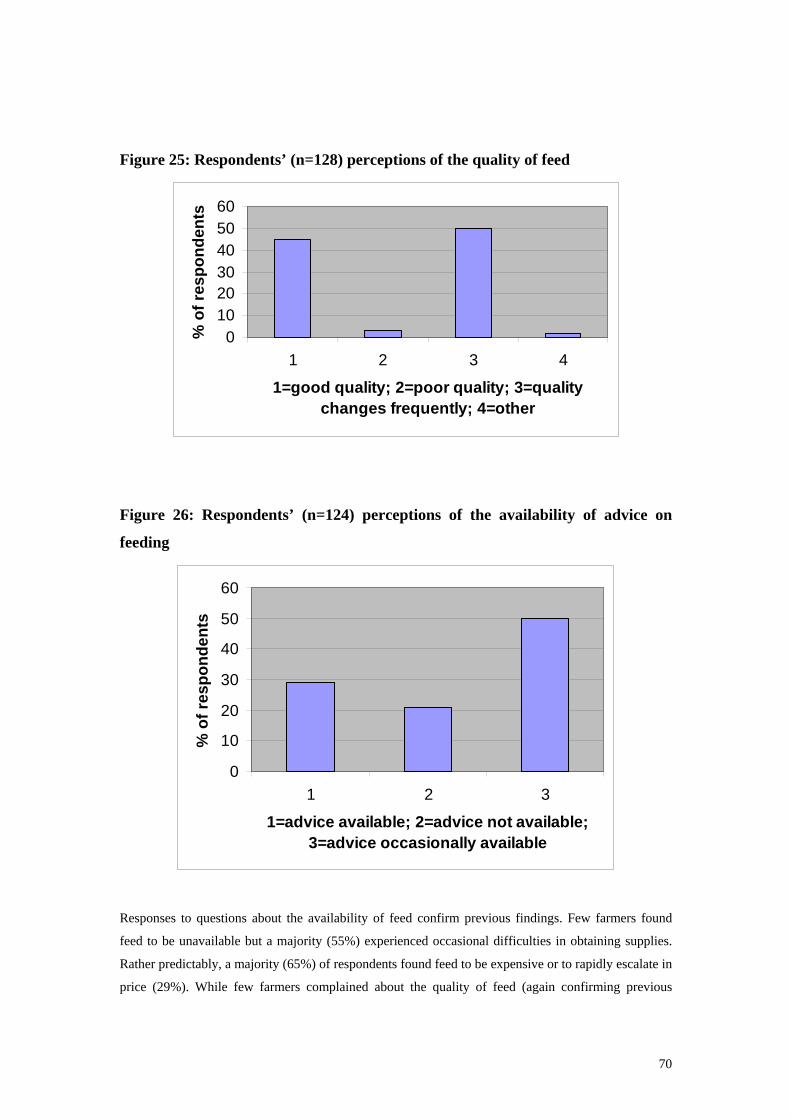
70
Figure 25: Respondents’ (n=128) perceptions of the quality of feed
0102030405060
1 2 3 4
1=good quality; 2=poor quality; 3=quality changes frequently; 4=other
% o
f res
pond
ents
Figure 26: Respondents’ (n=124) perceptions of the availability of advice on
feeding
0
10
20
30
40
50
60
1 2 3
1=advice available; 2=advice not available; 3=advice occasionally available
% o
f res
pond
ents
Responses to questions about the availability of feed confirm previous findings. Few farmers found
feed to be unavailable but a majority (55%) experienced occasional difficulties in obtaining supplies.
Rather predictably, a majority (65%) of respondents found feed to be expensive or to rapidly escalate in
price (29%). While few farmers complained about the quality of feed (again confirming previous
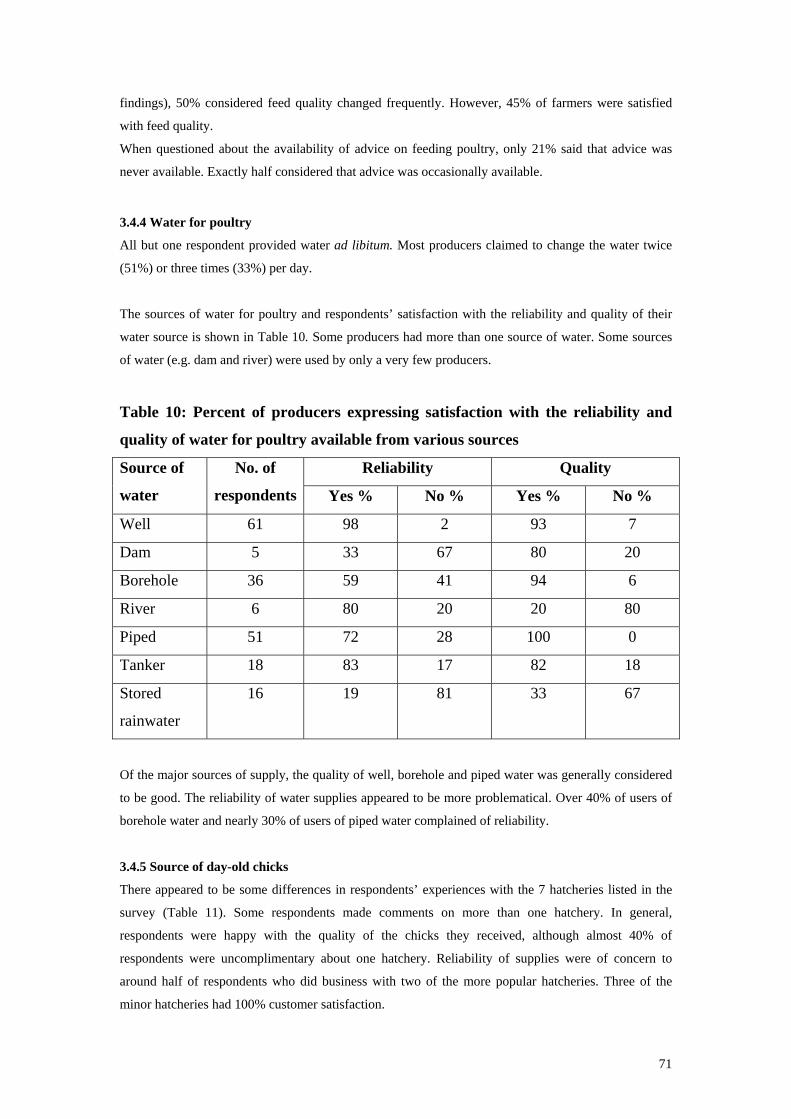
71
findings), 50% considered feed quality changed frequently. However, 45% of farmers were satisfied
with feed quality.
When questioned about the availability of advice on feeding poultry, only 21% said that advice was
never available. Exactly half considered that advice was occasionally available.
3.4.4 Water for poultry
All but one respondent provided water ad libitum. Most producers claimed to change the water twice
(51%) or three times (33%) per day.
The sources of water for poultry and respondents’ satisfaction with the reliability and quality of their
water source is shown in Table 10. Some producers had more than one source of water. Some sources
of water (e.g. dam and river) were used by only a very few producers.
Table 10: Percent of producers expressing satisfaction with the reliability and
quality of water for poultry available from various sources
Reliability Quality Source of
water
No. of
respondents Yes % No % Yes % No %
Well 61 98 2 93 7
Dam 5 33 67 80 20
Borehole 36 59 41 94 6
River 6 80 20 20 80
Piped 51 72 28 100 0
Tanker 18 83 17 82 18
Stored
rainwater
16 19 81 33 67
Of the major sources of supply, the quality of well, borehole and piped water was generally considered
to be good. The reliability of water supplies appeared to be more problematical. Over 40% of users of
borehole water and nearly 30% of users of piped water complained of reliability.
3.4.5 Source of day-old chicks
There appeared to be some differences in respondents’ experiences with the 7 hatcheries listed in the
survey (Table 11). Some respondents made comments on more than one hatchery. In general,
respondents were happy with the quality of the chicks they received, although almost 40% of
respondents were uncomplimentary about one hatchery. Reliability of supplies were of concern to
around half of respondents who did business with two of the more popular hatcheries. Three of the
minor hatcheries had 100% customer satisfaction.
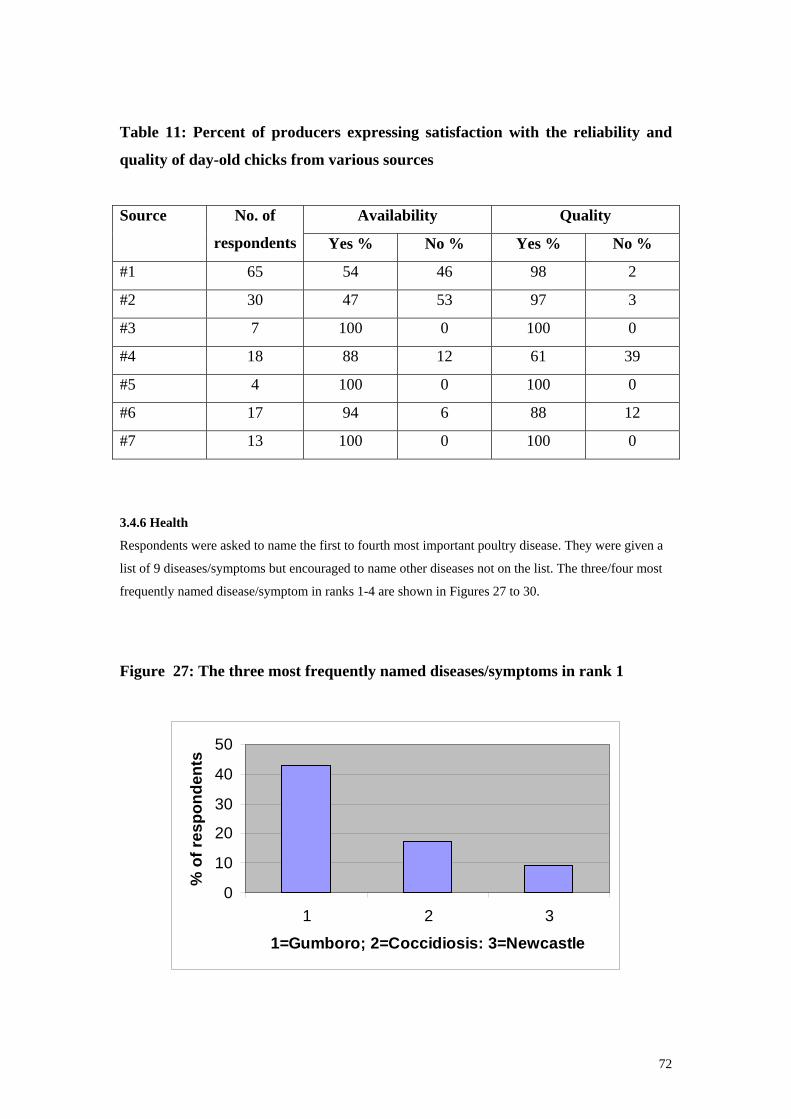
72
Table 11: Percent of producers expressing satisfaction with the reliability and
quality of day-old chicks from various sources
Availability Quality Source No. of
respondents Yes % No % Yes % No %
#1 65 54 46 98 2
#2 30 47 53 97 3
#3 7 100 0 100 0
#4 18 88 12 61 39
#5 4 100 0 100 0
#6 17 94 6 88 12
#7 13 100 0 100 0
3.4.6 Health
Respondents were asked to name the first to fourth most important poultry disease. They were given a
list of 9 diseases/symptoms but encouraged to name other diseases not on the list. The three/four most
frequently named disease/symptom in ranks 1-4 are shown in Figures 27 to 30.
Figure 27: The three most frequently named diseases/symptoms in rank 1
0
10
20
30
40
50
1 2 3
1=Gumboro; 2=Coccidiosis: 3=Newcastle
% o
f res
pond
ents
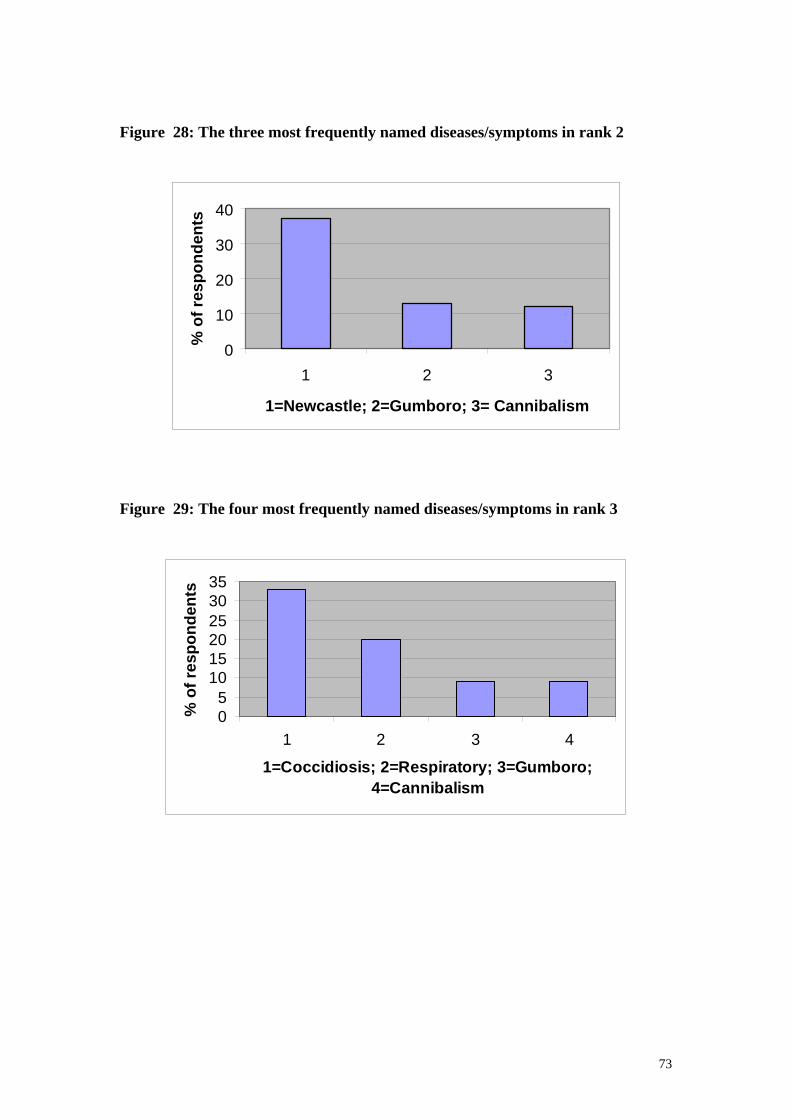
73
Figure 28: The three most frequently named diseases/symptoms in rank 2
0
10
20
30
40
1 2 3
1=Newcastle; 2=Gumboro; 3= Cannibalism
% o
f res
pond
ents
Figure 29: The four most frequently named diseases/symptoms in rank 3
05
101520253035
1 2 3 4
1=Coccidiosis; 2=Respiratory; 3=Gumboro; 4=Cannibalism
% o
f res
pond
ents
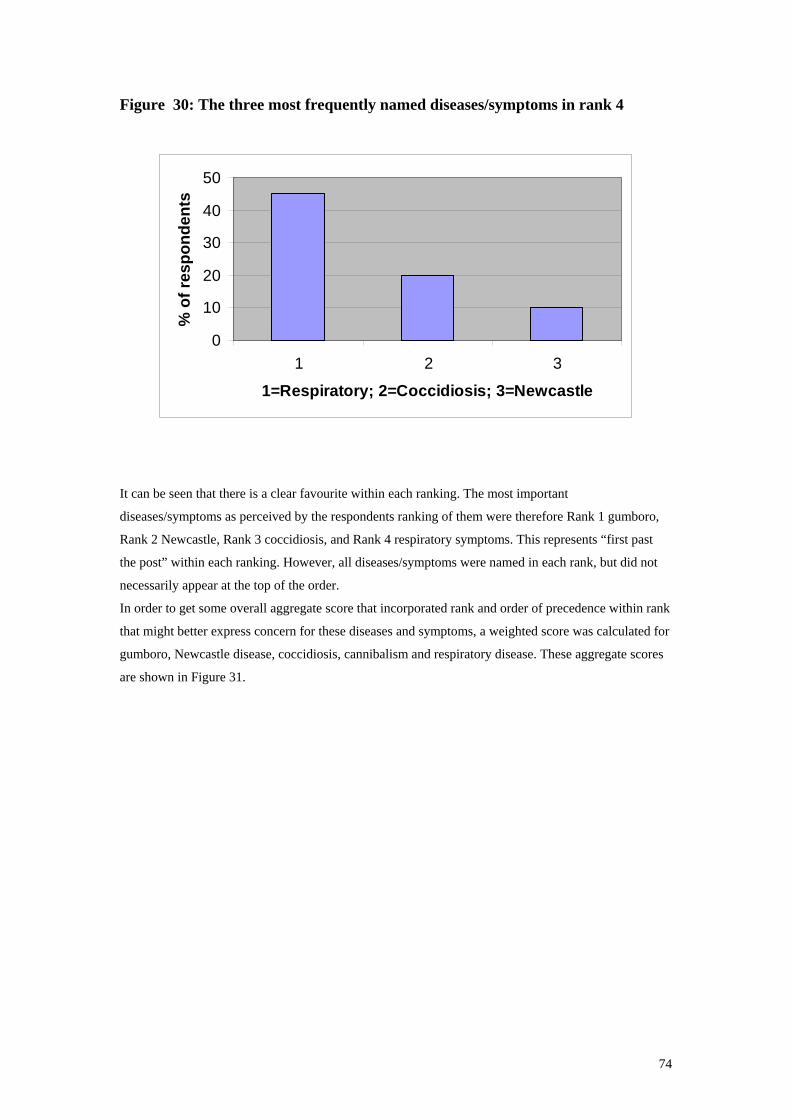
74
Figure 30: The three most frequently named diseases/symptoms in rank 4
0
10
20
30
40
50
1 2 3
1=Respiratory; 2=Coccidiosis; 3=Newcastle
% o
f res
pond
ents
It can be seen that there is a clear favourite within each ranking. The most important
diseases/symptoms as perceived by the respondents ranking of them were therefore Rank 1 gumboro,
Rank 2 Newcastle, Rank 3 coccidiosis, and Rank 4 respiratory symptoms. This represents “first past
the post” within each ranking. However, all diseases/symptoms were named in each rank, but did not
necessarily appear at the top of the order.
In order to get some overall aggregate score that incorporated rank and order of precedence within rank
that might better express concern for these diseases and symptoms, a weighted score was calculated for
gumboro, Newcastle disease, coccidiosis, cannibalism and respiratory disease. These aggregate scores
are shown in Figure 31.
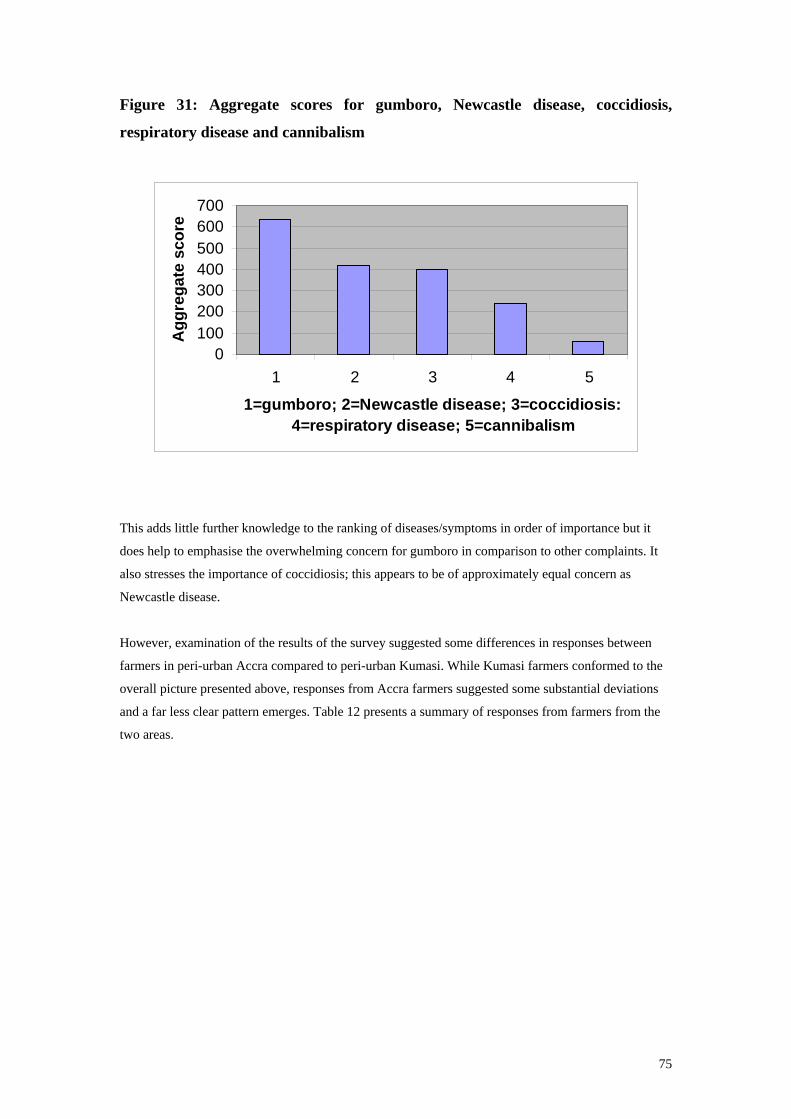
75
Figure 31: Aggregate scores for gumboro, Newcastle disease, coccidiosis,
respiratory disease and cannibalism
0100200300400500600700
1 2 3 4 5
1=gumboro; 2=Newcastle disease; 3=coccidiosis: 4=respiratory disease; 5=cannibalism
Agg
rega
te s
core
This adds little further knowledge to the ranking of diseases/symptoms in order of importance but it
does help to emphasise the overwhelming concern for gumboro in comparison to other complaints. It
also stresses the importance of coccidiosis; this appears to be of approximately equal concern as
Newcastle disease.
However, examination of the results of the survey suggested some differences in responses between
farmers in peri-urban Accra compared to peri-urban Kumasi. While Kumasi farmers conformed to the
overall picture presented above, responses from Accra farmers suggested some substantial deviations
and a far less clear pattern emerges. Table 12 presents a summary of responses from farmers from the
two areas.
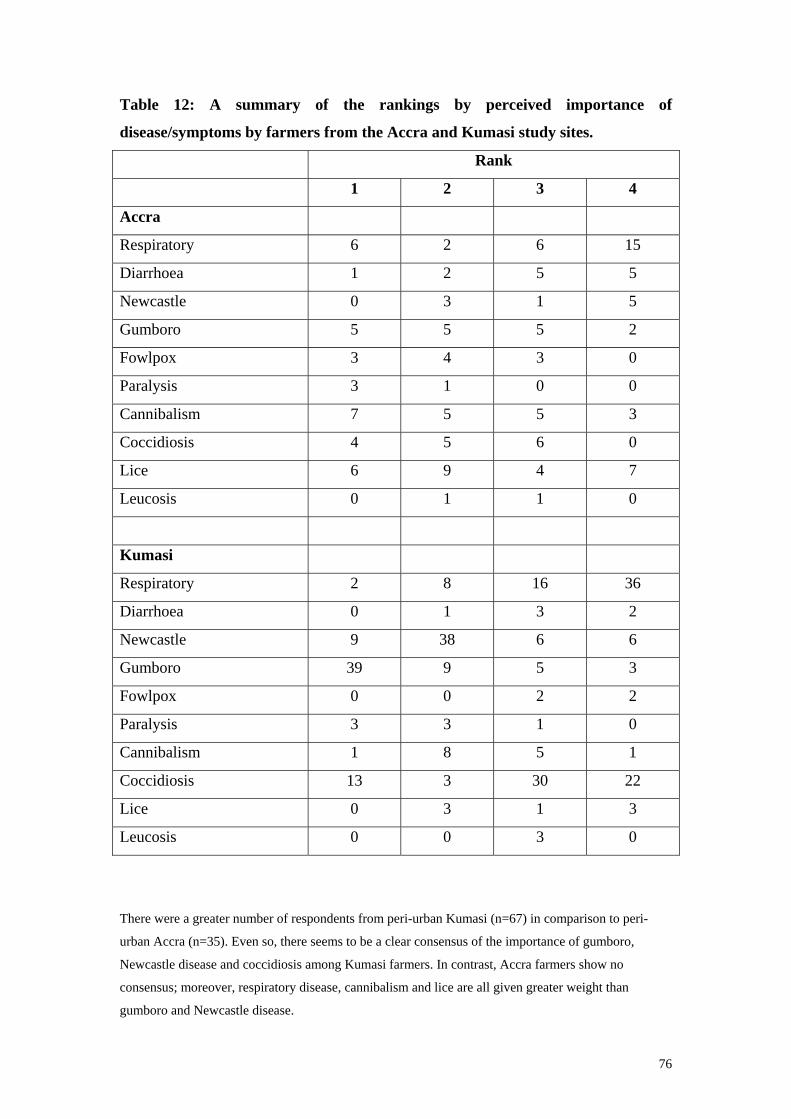
76
Table 12: A summary of the rankings by perceived importance of
disease/symptoms by farmers from the Accra and Kumasi study sites.
Rank
1 2 3 4
Accra
Respiratory 6 2 6 15
Diarrhoea 1 2 5 5
Newcastle 0 3 1 5
Gumboro 5 5 5 2
Fowlpox 3 4 3 0
Paralysis 3 1 0 0
Cannibalism 7 5 5 3
Coccidiosis 4 5 6 0
Lice 6 9 4 7
Leucosis 0 1 1 0
Kumasi
Respiratory 2 8 16 36
Diarrhoea 0 1 3 2
Newcastle 9 38 6 6
Gumboro 39 9 5 3
Fowlpox 0 0 2 2
Paralysis 3 3 1 0
Cannibalism 1 8 5 1
Coccidiosis 13 3 30 22
Lice 0 3 1 3
Leucosis 0 0 3 0
There were a greater number of respondents from peri-urban Kumasi (n=67) in comparison to peri-
urban Accra (n=35). Even so, there seems to be a clear consensus of the importance of gumboro,
Newcastle disease and coccidiosis among Kumasi farmers. In contrast, Accra farmers show no
consensus; moreover, respiratory disease, cannibalism and lice are all given greater weight than
gumboro and Newcastle disease.
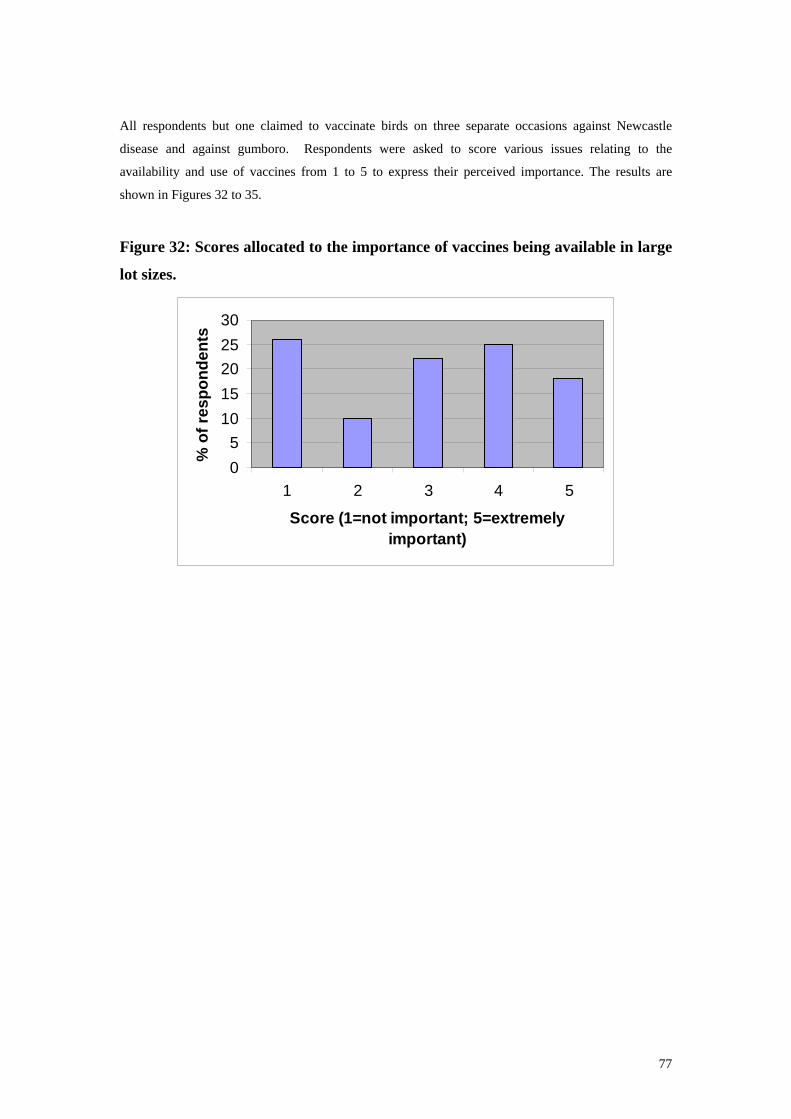
77
All respondents but one claimed to vaccinate birds on three separate occasions against Newcastle
disease and against gumboro. Respondents were asked to score various issues relating to the
availability and use of vaccines from 1 to 5 to express their perceived importance. The results are
shown in Figures 32 to 35.
Figure 32: Scores allocated to the importance of vaccines being available in large
lot sizes.
05
1015202530
1 2 3 4 5
Score (1=not important; 5=extremely important)
% o
f res
pond
ents
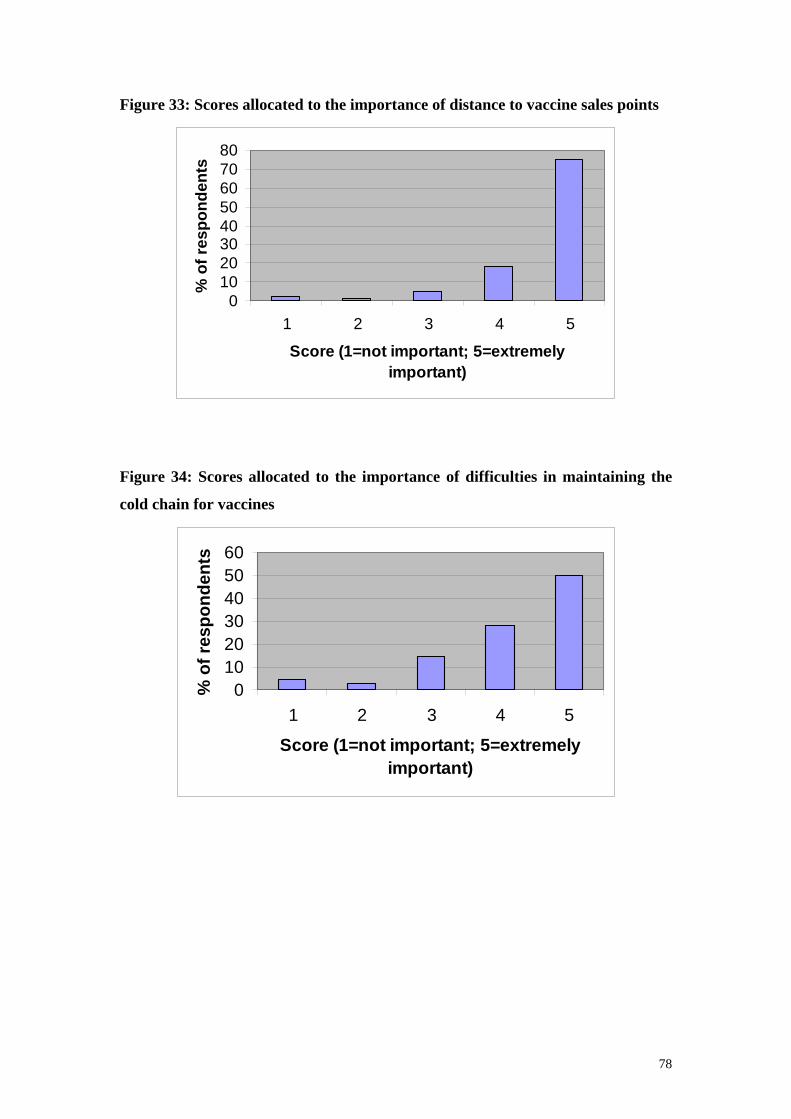
78
Figure 33: Scores allocated to the importance of distance to vaccine sales points
01020304050607080
1 2 3 4 5
Score (1=not important; 5=extremely important)
% o
f res
pond
ents
Figure 34: Scores allocated to the importance of difficulties in maintaining the
cold chain for vaccines
0102030405060
1 2 3 4 5
Score (1=not important; 5=extremely important)
% o
f res
pond
ents
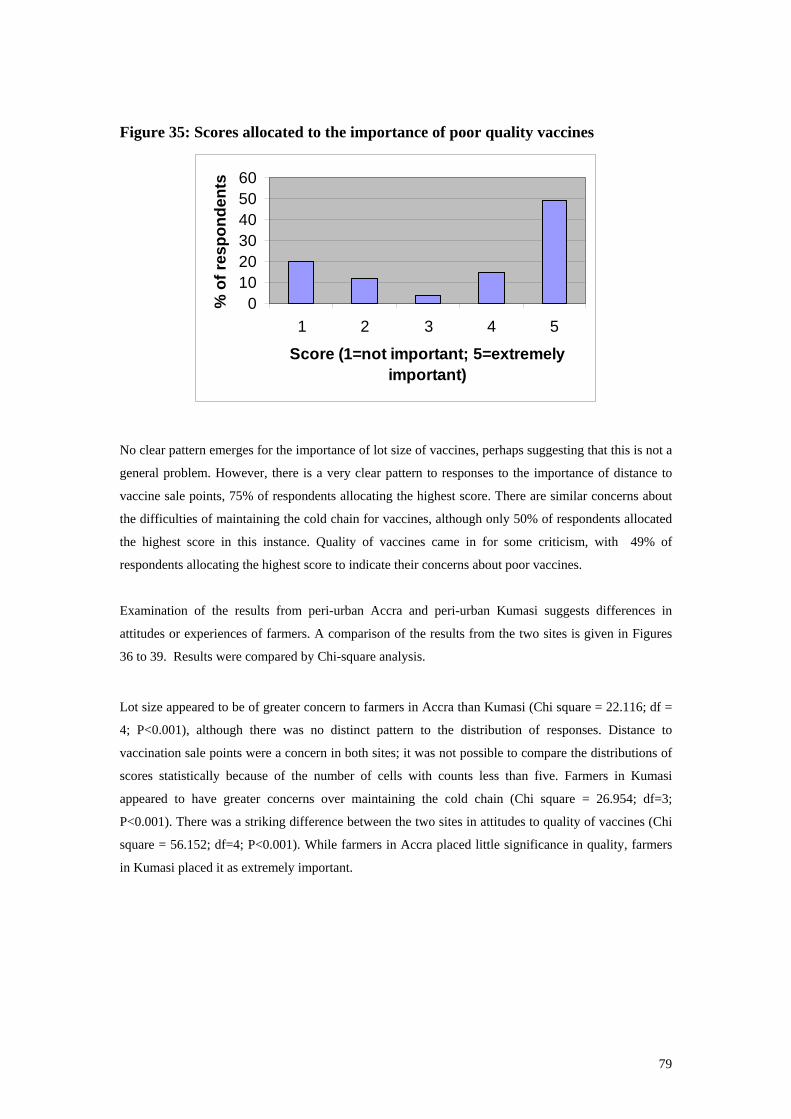
79
Figure 35: Scores allocated to the importance of poor quality vaccines
0102030405060
1 2 3 4 5
Score (1=not important; 5=extremely important)
% o
f res
pond
ents
No clear pattern emerges for the importance of lot size of vaccines, perhaps suggesting that this is not a
general problem. However, there is a very clear pattern to responses to the importance of distance to
vaccine sale points, 75% of respondents allocating the highest score. There are similar concerns about
the difficulties of maintaining the cold chain for vaccines, although only 50% of respondents allocated
the highest score in this instance. Quality of vaccines came in for some criticism, with 49% of
respondents allocating the highest score to indicate their concerns about poor vaccines.
Examination of the results from peri-urban Accra and peri-urban Kumasi suggests differences in
attitudes or experiences of farmers. A comparison of the results from the two sites is given in Figures
36 to 39. Results were compared by Chi-square analysis. Lot size appeared to be of greater concern to farmers in Accra than Kumasi (Chi square = 22.116; df =
4; P<0.001), although there was no distinct pattern to the distribution of responses. Distance to
vaccination sale points were a concern in both sites; it was not possible to compare the distributions of
scores statistically because of the number of cells with counts less than five. Farmers in Kumasi
appeared to have greater concerns over maintaining the cold chain (Chi square = 26.954; df=3;
P<0.001). There was a striking difference between the two sites in attitudes to quality of vaccines (Chi
square = 56.152; df=4; P<0.001). While farmers in Accra placed little significance in quality, farmers
in Kumasi placed it as extremely important.
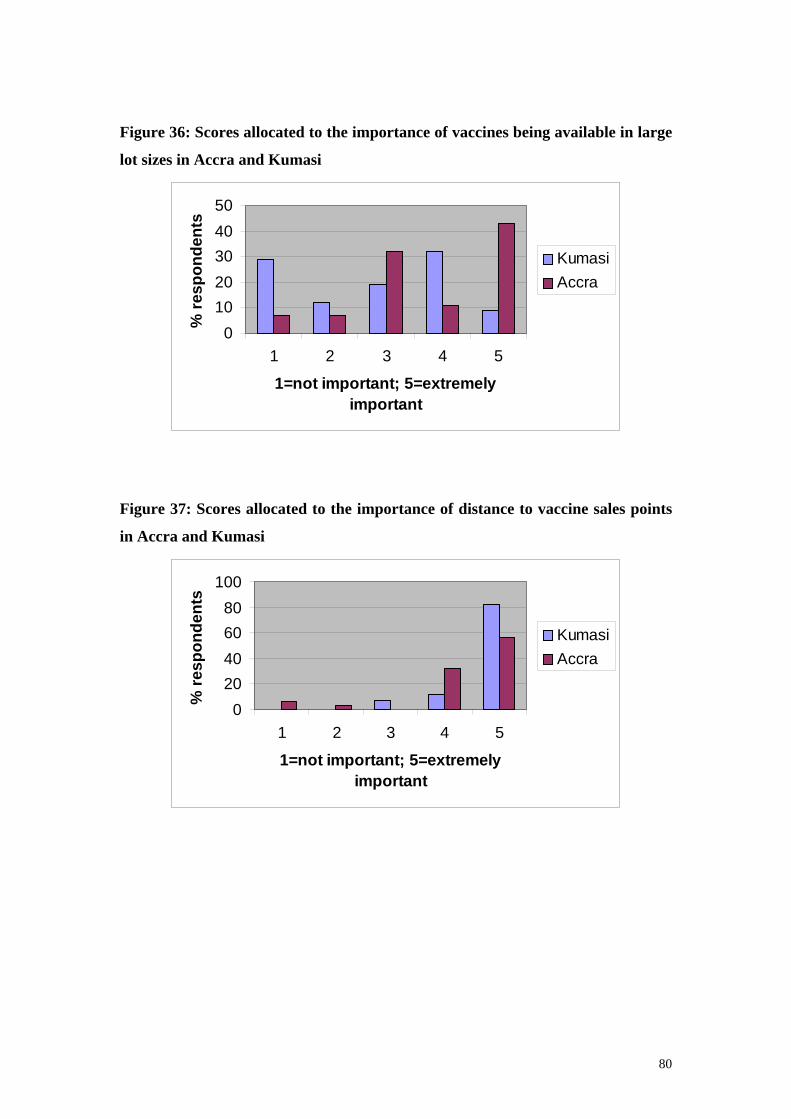
80
Figure 36: Scores allocated to the importance of vaccines being available in large
lot sizes in Accra and Kumasi
01020304050
1 2 3 4 5
1=not important; 5=extremely important
% re
spon
dent
s
KumasiAccra
Figure 37: Scores allocated to the importance of distance to vaccine sales points
in Accra and Kumasi
020406080
100
1 2 3 4 5
1=not important; 5=extremely important
% re
spon
dent
s
KumasiAccra
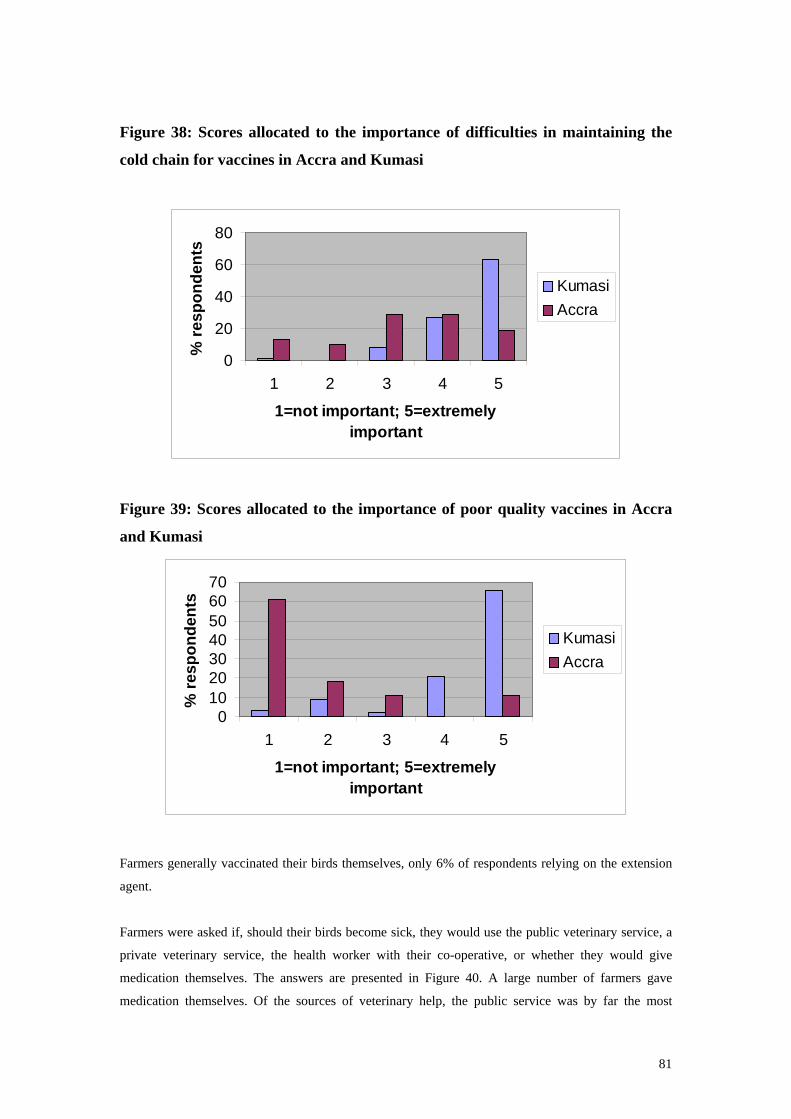
81
Figure 38: Scores allocated to the importance of difficulties in maintaining the
cold chain for vaccines in Accra and Kumasi
0
20
40
60
80
1 2 3 4 5
1=not important; 5=extremely important
% re
spon
dent
s
KumasiAccra
Figure 39: Scores allocated to the importance of poor quality vaccines in Accra
and Kumasi
010203040506070
1 2 3 4 5
1=not important; 5=extremely important
% re
spon
dent
s
KumasiAccra
Farmers generally vaccinated their birds themselves, only 6% of respondents relying on the extension
agent.
Farmers were asked if, should their birds become sick, they would use the public veterinary service, a
private veterinary service, the health worker with their co-operative, or whether they would give
medication themselves. The answers are presented in Figure 40. A large number of farmers gave
medication themselves. Of the sources of veterinary help, the public service was by far the most
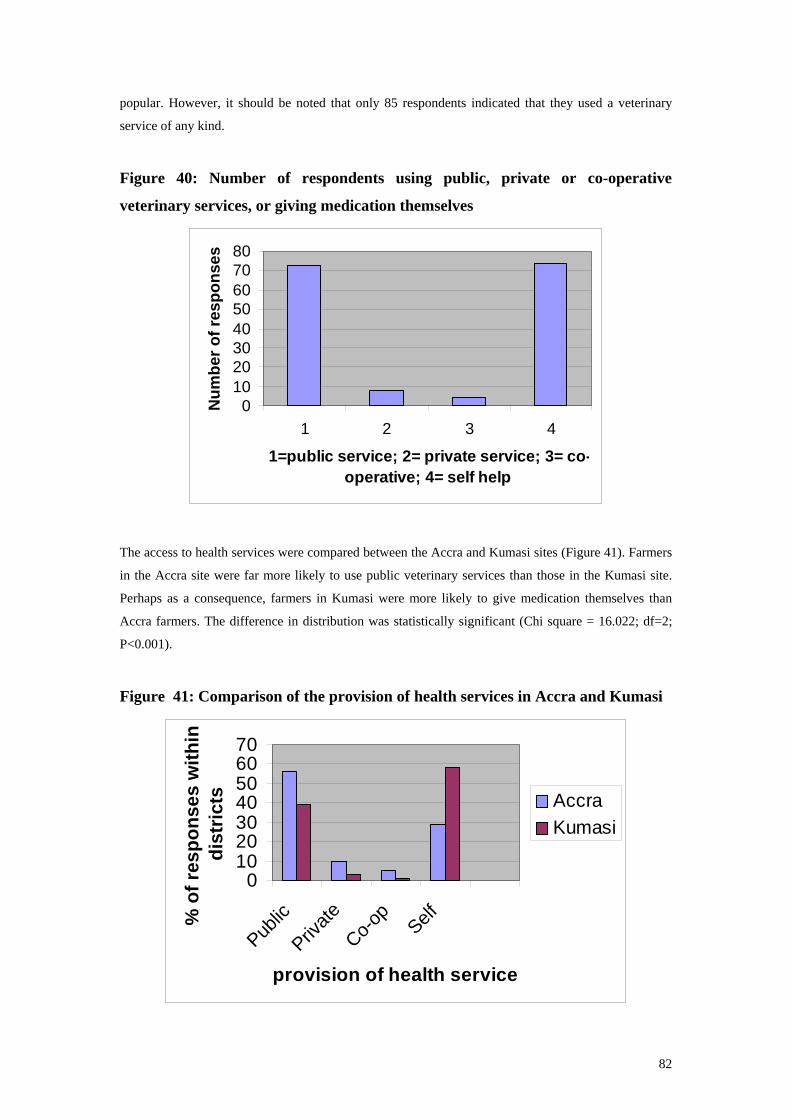
82
popular. However, it should be noted that only 85 respondents indicated that they used a veterinary
service of any kind.
Figure 40: Number of respondents using public, private or co-operative
veterinary services, or giving medication themselves
01020304050607080
1 2 3 4
1=public service; 2= private service; 3= co-operative; 4= self help
Num
ber o
f res
pons
es
The access to health services were compared between the Accra and Kumasi sites (Figure 41). Farmers
in the Accra site were far more likely to use public veterinary services than those in the Kumasi site.
Perhaps as a consequence, farmers in Kumasi were more likely to give medication themselves than
Accra farmers. The difference in distribution was statistically significant (Chi square = 16.022; df=2;
P<0.001).
Figure 41: Comparison of the provision of health services in Accra and Kumasi
010203040506070
Public
Private
Co-op
Self
provision of health service
% o
f res
pons
es w
ithin
di
stric
ts AccraKumasi
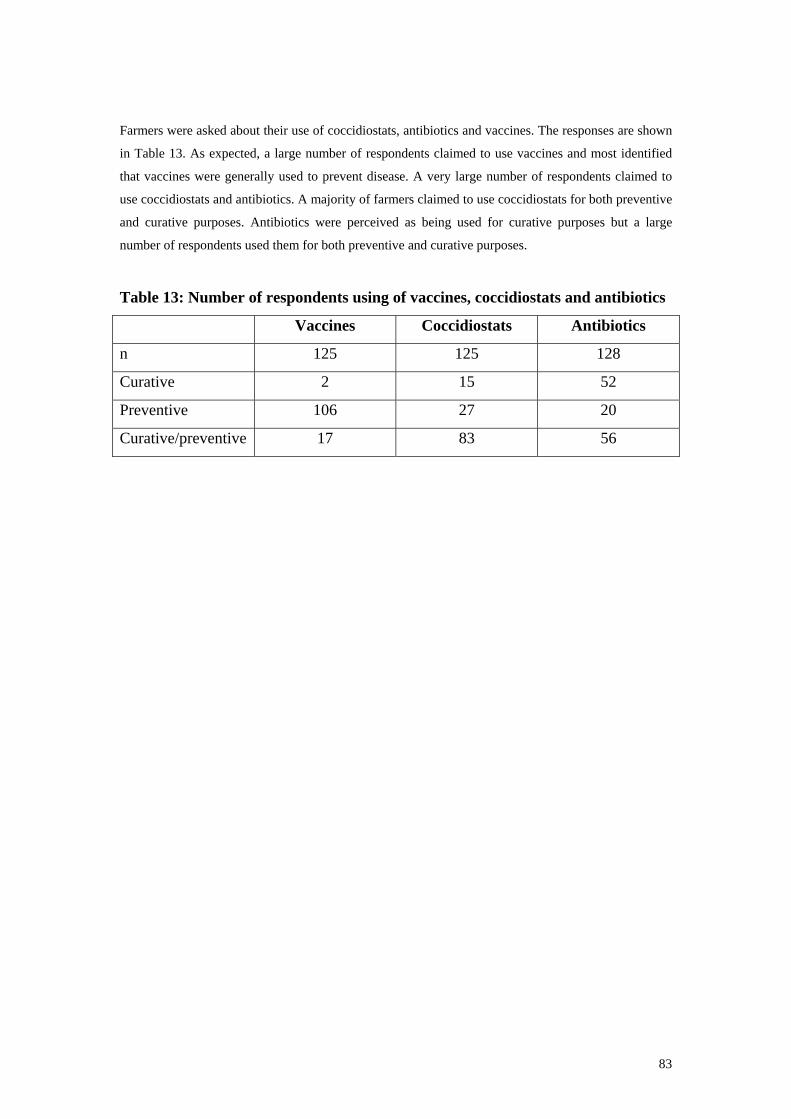
83
Farmers were asked about their use of coccidiostats, antibiotics and vaccines. The responses are shown
in Table 13. As expected, a large number of respondents claimed to use vaccines and most identified
that vaccines were generally used to prevent disease. A very large number of respondents claimed to
use coccidiostats and antibiotics. A majority of farmers claimed to use coccidiostats for both preventive
and curative purposes. Antibiotics were perceived as being used for curative purposes but a large
number of respondents used them for both preventive and curative purposes.
Table 13: Number of respondents using of vaccines, coccidiostats and antibiotics
Vaccines Coccidiostats Antibiotics
n 125 125 128
Curative 2 15 52
Preventive 106 27 20
Curative/preventive 17 83 56
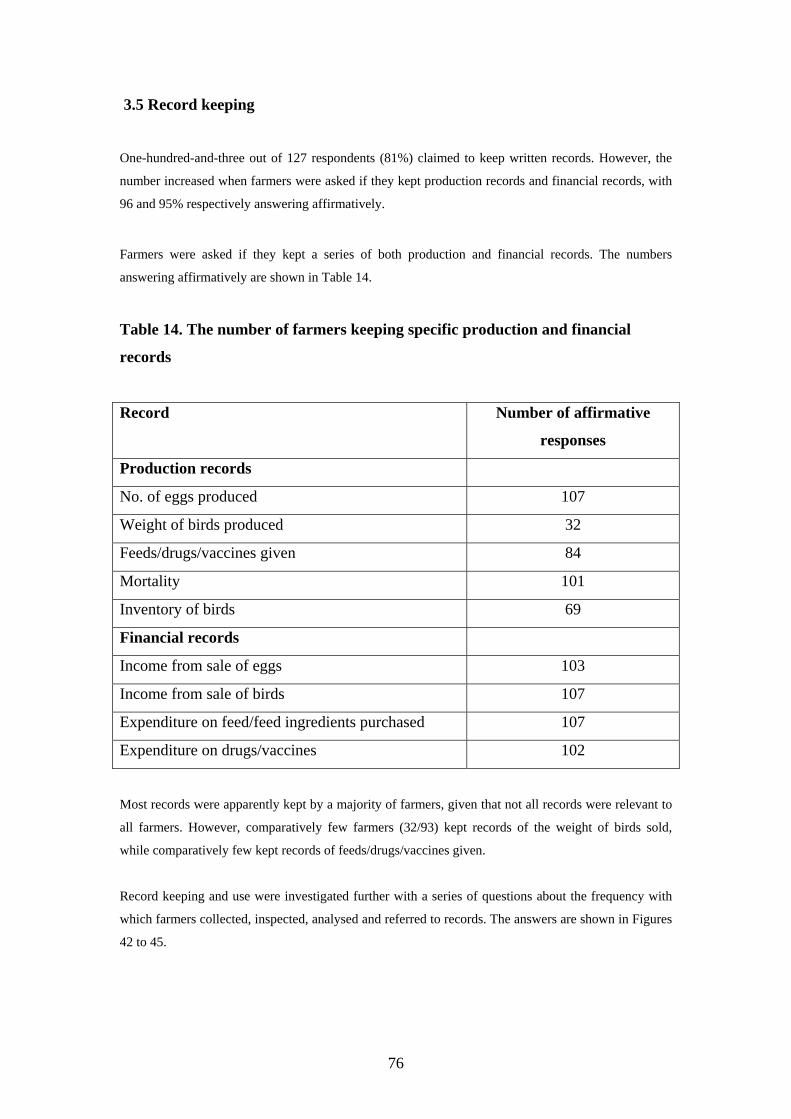
76
3.5 Record keeping
One-hundred-and-three out of 127 respondents (81%) claimed to keep written records. However, the
number increased when farmers were asked if they kept production records and financial records, with
96 and 95% respectively answering affirmatively.
Farmers were asked if they kept a series of both production and financial records. The numbers
answering affirmatively are shown in Table 14.
Table 14. The number of farmers keeping specific production and financial
records
Record Number of affirmative
responses
Production records
No. of eggs produced 107
Weight of birds produced 32
Feeds/drugs/vaccines given 84
Mortality 101
Inventory of birds 69
Financial records
Income from sale of eggs 103
Income from sale of birds 107
Expenditure on feed/feed ingredients purchased 107
Expenditure on drugs/vaccines 102
Most records were apparently kept by a majority of farmers, given that not all records were relevant to
all farmers. However, comparatively few farmers (32/93) kept records of the weight of birds sold,
while comparatively few kept records of feeds/drugs/vaccines given.
Record keeping and use were investigated further with a series of questions about the frequency with
which farmers collected, inspected, analysed and referred to records. The answers are shown in Figures
42 to 45.

77
Figure 42: Number of respondents (n=124) collecting records daily, weekly, monthly or never
020406080
100
1 2 3 4 5
(1=never; 2=daily; 3=weekly; 4=monthly; 5=other)
No.
of r
espo
nden
ts
Figure 43: Number of respondents (n=118) inspecting records daily, weekly, monthly or never
0102030405060
1 2 3 4 5
1= never; 2=daily; 3=weekly; 4=monthly; 5=other
No.
of r
espo
nden
ts
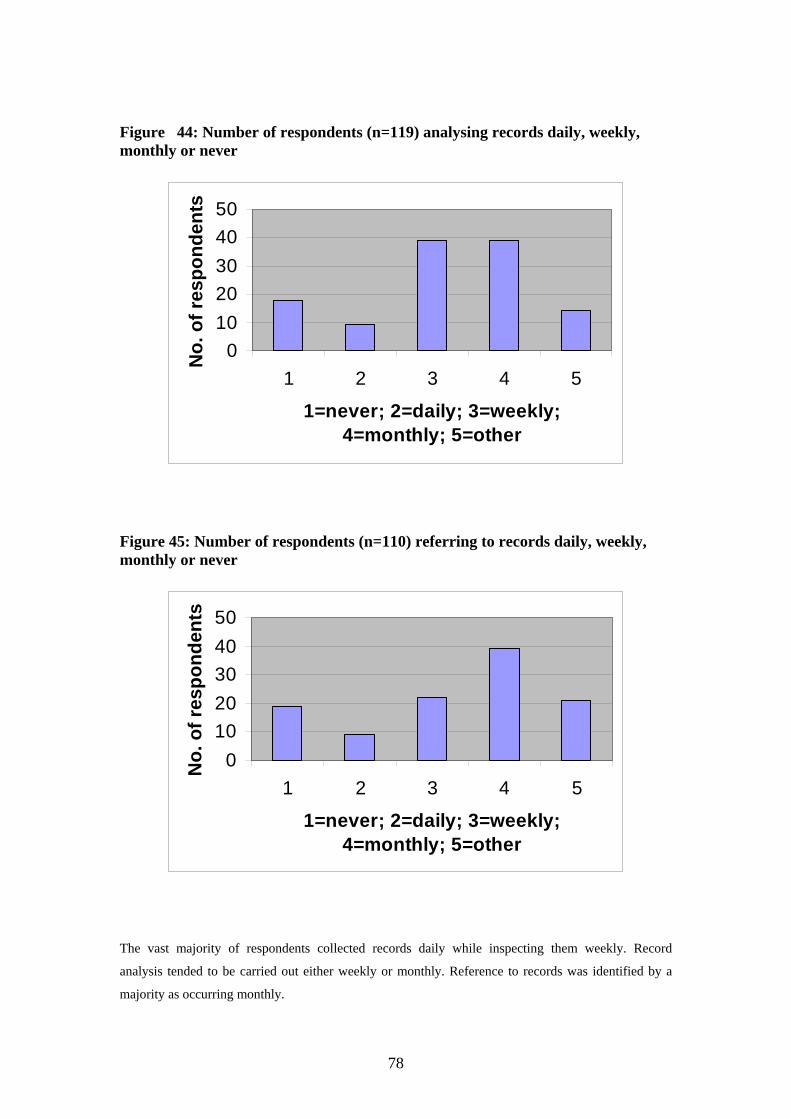
78
Figure 44: Number of respondents (n=119) analysing records daily, weekly, monthly or never
01020304050
1 2 3 4 5
1=never; 2=daily; 3=weekly; 4=monthly; 5=other
No.
of r
espo
nden
ts
Figure 45: Number of respondents (n=110) referring to records daily, weekly, monthly or never
01020304050
1 2 3 4 5
1=never; 2=daily; 3=weekly; 4=monthly; 5=other
No.
of r
espo
nden
ts
The vast majority of respondents collected records daily while inspecting them weekly. Record
analysis tended to be carried out either weekly or monthly. Reference to records was identified by a
majority as occurring monthly.
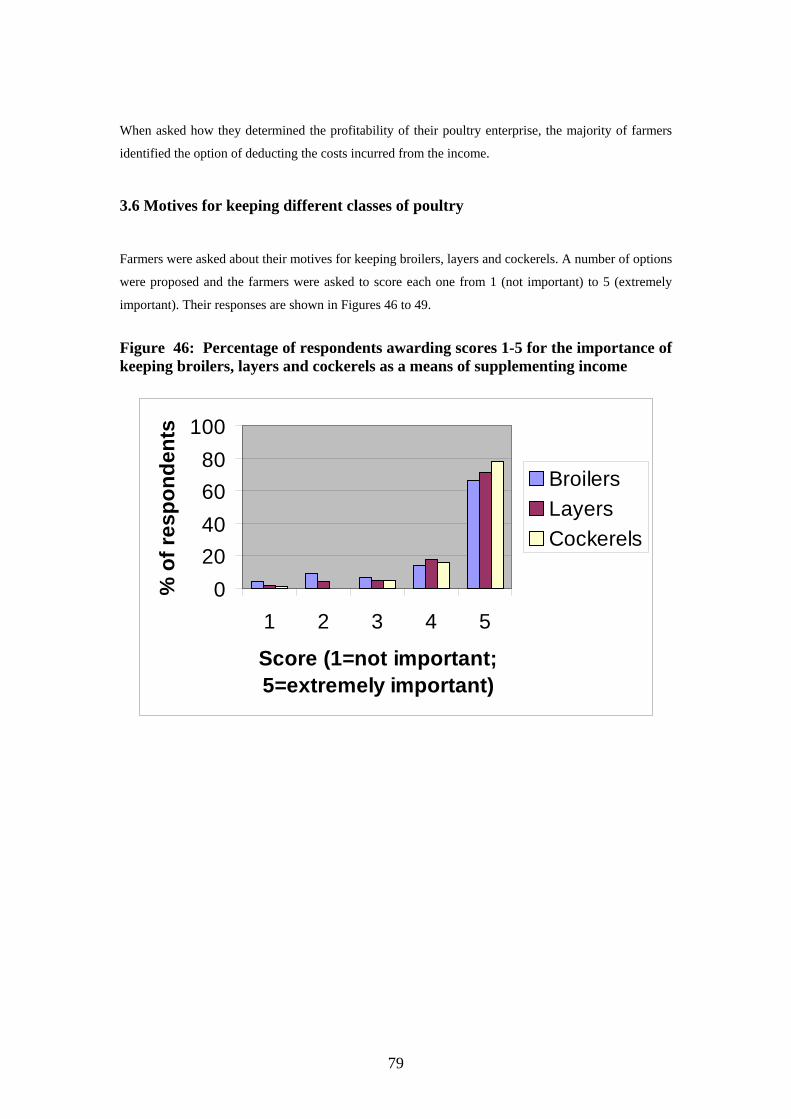
79
When asked how they determined the profitability of their poultry enterprise, the majority of farmers
identified the option of deducting the costs incurred from the income.
3.6 Motives for keeping different classes of poultry
Farmers were asked about their motives for keeping broilers, layers and cockerels. A number of options
were proposed and the farmers were asked to score each one from 1 (not important) to 5 (extremely
important). Their responses are shown in Figures 46 to 49.
Figure 46: Percentage of respondents awarding scores 1-5 for the importance of keeping broilers, layers and cockerels as a means of supplementing income
020406080
100
1 2 3 4 5
Score (1=not important; 5=extremely important)
% o
f res
pond
ents
BroilersLayersCockerels
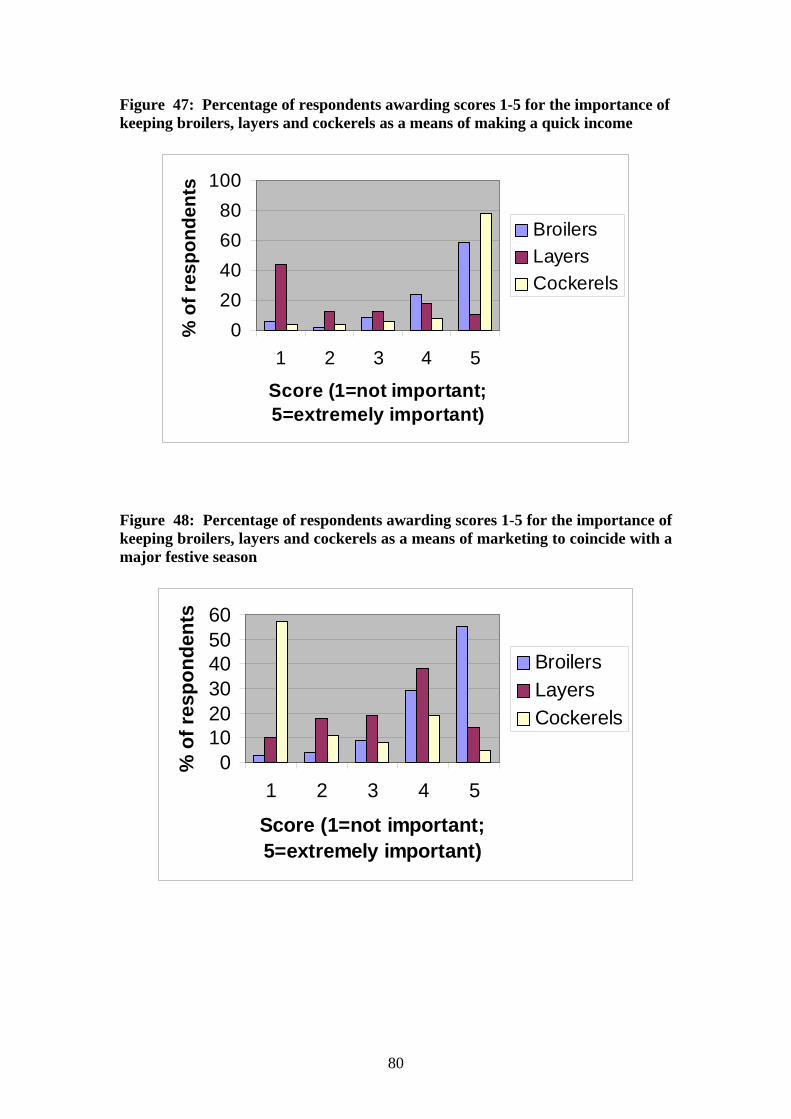
80
Figure 47: Percentage of respondents awarding scores 1-5 for the importance of keeping broilers, layers and cockerels as a means of making a quick income
020406080
100
1 2 3 4 5
Score (1=not important; 5=extremely important)
% o
f res
pond
ents
BroilersLayersCockerels
Figure 48: Percentage of respondents awarding scores 1-5 for the importance of keeping broilers, layers and cockerels as a means of marketing to coincide with a major festive season
0102030405060
1 2 3 4 5
Score (1=not important; 5=extremely important)
% o
f res
pond
ents
BroilersLayersCockerels
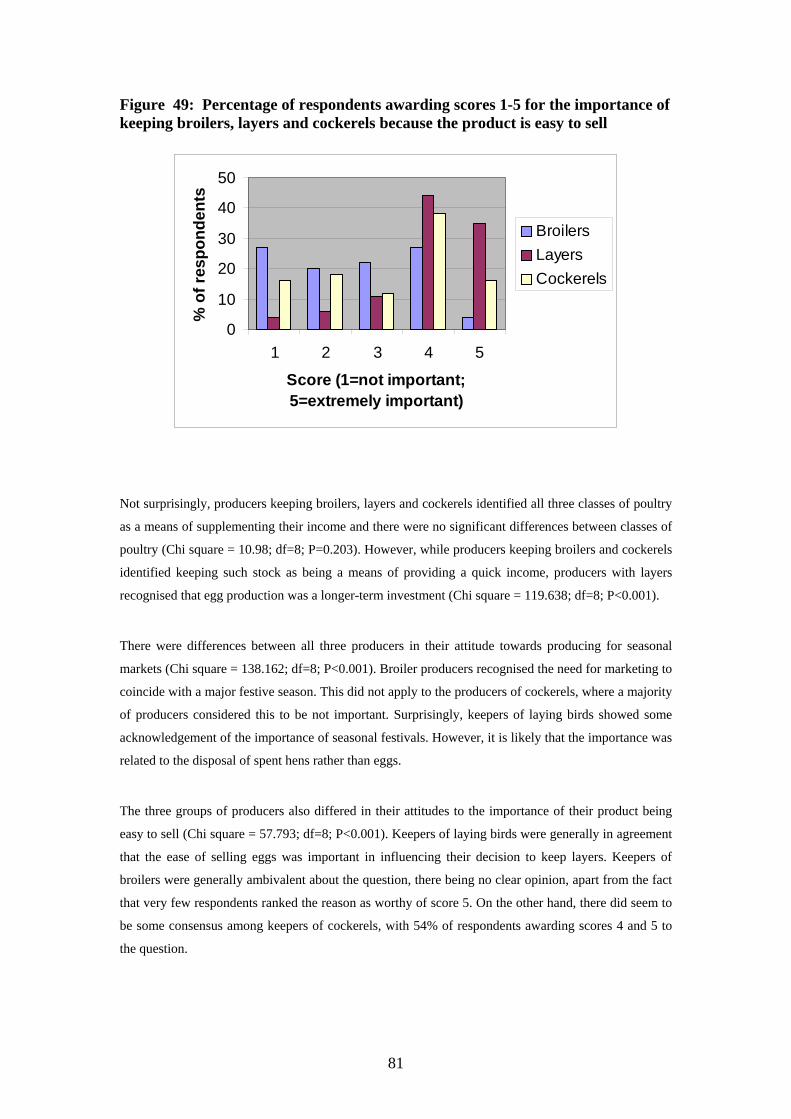
81
Figure 49: Percentage of respondents awarding scores 1-5 for the importance of keeping broilers, layers and cockerels because the product is easy to sell
0
10
20
30
40
50
1 2 3 4 5
Score (1=not important; 5=extremely important)
% o
f res
pond
ents
BroilersLayersCockerels
Not surprisingly, producers keeping broilers, layers and cockerels identified all three classes of poultry
as a means of supplementing their income and there were no significant differences between classes of
poultry (Chi square = 10.98; df=8; P=0.203). However, while producers keeping broilers and cockerels
identified keeping such stock as being a means of providing a quick income, producers with layers
recognised that egg production was a longer-term investment (Chi square = 119.638; df=8; P<0.001).
There were differences between all three producers in their attitude towards producing for seasonal
markets (Chi square = 138.162; df=8; P<0.001). Broiler producers recognised the need for marketing to
coincide with a major festive season. This did not apply to the producers of cockerels, where a majority
of producers considered this to be not important. Surprisingly, keepers of laying birds showed some
acknowledgement of the importance of seasonal festivals. However, it is likely that the importance was
related to the disposal of spent hens rather than eggs.
The three groups of producers also differed in their attitudes to the importance of their product being
easy to sell (Chi square = 57.793; df=8; P<0.001). Keepers of laying birds were generally in agreement
that the ease of selling eggs was important in influencing their decision to keep layers. Keepers of
broilers were generally ambivalent about the question, there being no clear opinion, apart from the fact
that very few respondents ranked the reason as worthy of score 5. On the other hand, there did seem to
be some consensus among keepers of cockerels, with 54% of respondents awarding scores 4 and 5 to
the question.
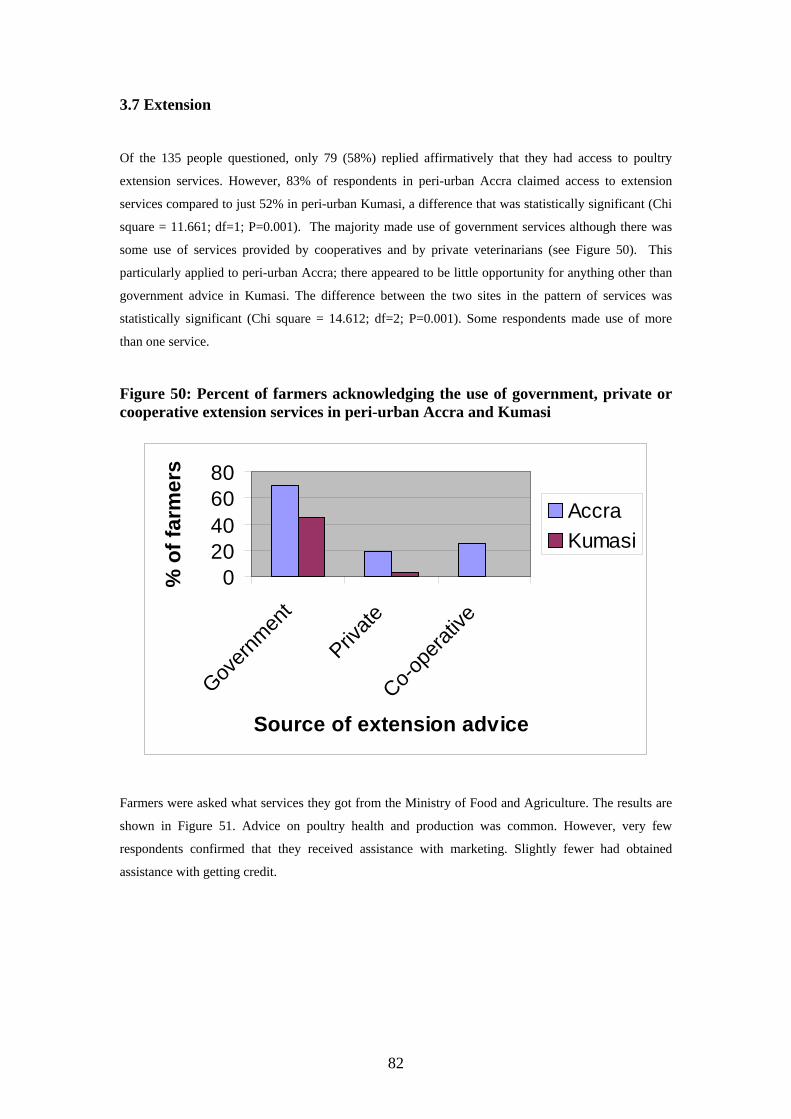
82
3.7 Extension
Of the 135 people questioned, only 79 (58%) replied affirmatively that they had access to poultry
extension services. However, 83% of respondents in peri-urban Accra claimed access to extension
services compared to just 52% in peri-urban Kumasi, a difference that was statistically significant (Chi
square = 11.661; df=1; P=0.001). The majority made use of government services although there was
some use of services provided by cooperatives and by private veterinarians (see Figure 50). This
particularly applied to peri-urban Accra; there appeared to be little opportunity for anything other than
government advice in Kumasi. The difference between the two sites in the pattern of services was
statistically significant (Chi square = 14.612; df=2; P=0.001). Some respondents made use of more
than one service.
Figure 50: Percent of farmers acknowledging the use of government, private or cooperative extension services in peri-urban Accra and Kumasi
020406080
Govern
ment
Private
Co-ope
rative
Source of extension advice
% o
f far
mer
s
AccraKumasi
Farmers were asked what services they got from the Ministry of Food and Agriculture. The results are
shown in Figure 51. Advice on poultry health and production was common. However, very few
respondents confirmed that they received assistance with marketing. Slightly fewer had obtained
assistance with getting credit.
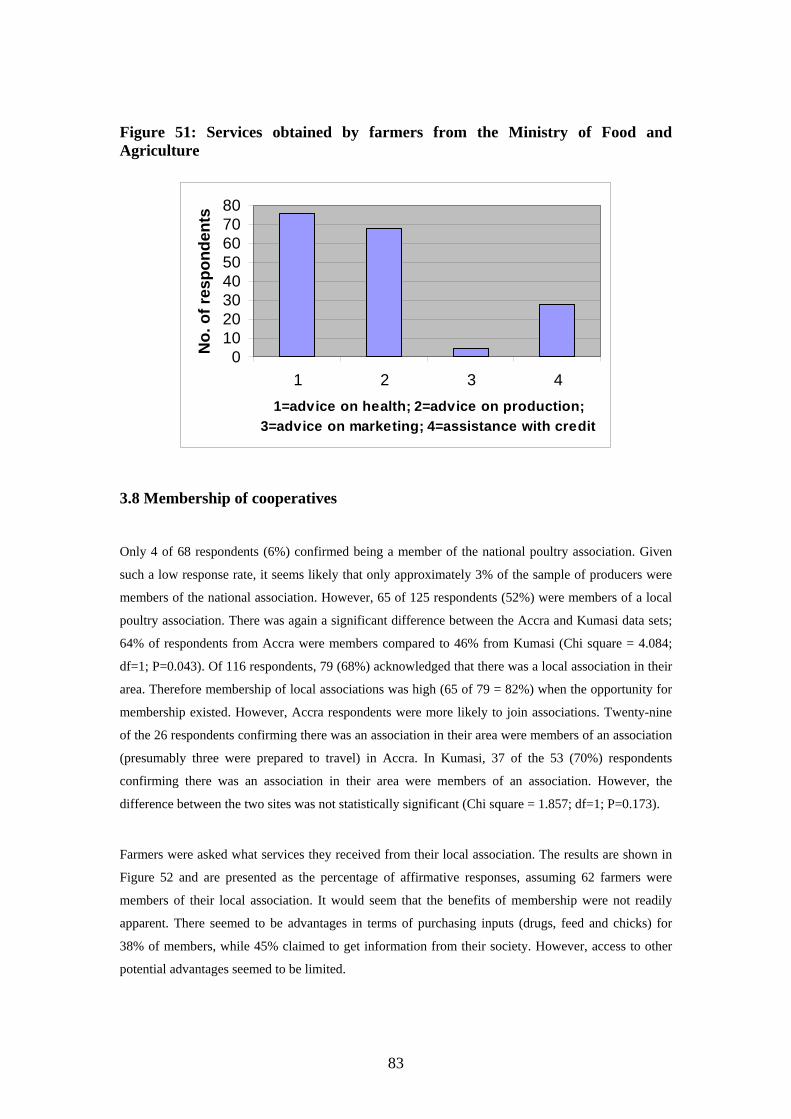
83
Figure 51: Services obtained by farmers from the Ministry of Food and Agriculture
01020304050607080
1 2 3 41=advice on health; 2=advice on production;
3=advice on marketing; 4=assistance with credit
No.
of r
espo
nden
ts
3.8 Membership of cooperatives
Only 4 of 68 respondents (6%) confirmed being a member of the national poultry association. Given
such a low response rate, it seems likely that only approximately 3% of the sample of producers were
members of the national association. However, 65 of 125 respondents (52%) were members of a local
poultry association. There was again a significant difference between the Accra and Kumasi data sets;
64% of respondents from Accra were members compared to 46% from Kumasi (Chi square = 4.084;
df=1; P=0.043). Of 116 respondents, 79 (68%) acknowledged that there was a local association in their
area. Therefore membership of local associations was high (65 of 79 = 82%) when the opportunity for
membership existed. However, Accra respondents were more likely to join associations. Twenty-nine
of the 26 respondents confirming there was an association in their area were members of an association
(presumably three were prepared to travel) in Accra. In Kumasi, 37 of the 53 (70%) respondents
confirming there was an association in their area were members of an association. However, the
difference between the two sites was not statistically significant (Chi square = 1.857; df=1; P=0.173).
Farmers were asked what services they received from their local association. The results are shown in
Figure 52 and are presented as the percentage of affirmative responses, assuming 62 farmers were
members of their local association. It would seem that the benefits of membership were not readily
apparent. There seemed to be advantages in terms of purchasing inputs (drugs, feed and chicks) for
38% of members, while 45% claimed to get information from their society. However, access to other
potential advantages seemed to be limited.
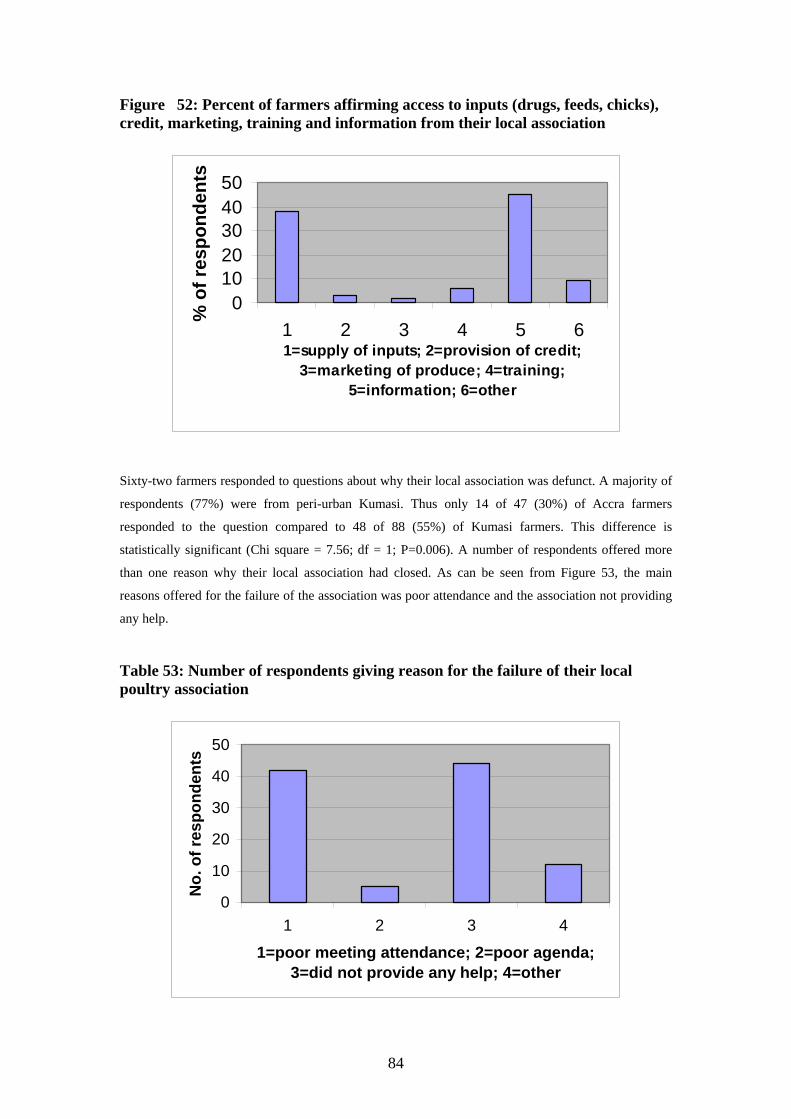
84
Figure 52: Percent of farmers affirming access to inputs (drugs, feeds, chicks), credit, marketing, training and information from their local association
01020304050
1 2 3 4 5 61=supply of inputs; 2=provision of credit;
3=marketing of produce; 4=training; 5=information; 6=other
% o
f res
pond
ents
Sixty-two farmers responded to questions about why their local association was defunct. A majority of
respondents (77%) were from peri-urban Kumasi. Thus only 14 of 47 (30%) of Accra farmers
responded to the question compared to 48 of 88 (55%) of Kumasi farmers. This difference is
statistically significant (Chi square = 7.56; df = 1; P=0.006). A number of respondents offered more
than one reason why their local association had closed. As can be seen from Figure 53, the main
reasons offered for the failure of the association was poor attendance and the association not providing
any help.
Table 53: Number of respondents giving reason for the failure of their local poultry association
0
10
20
30
40
50
1 2 3 4
1=poor meeting attendance; 2=poor agenda; 3=did not provide any help; 4=other
No.
of r
espo
nden
ts
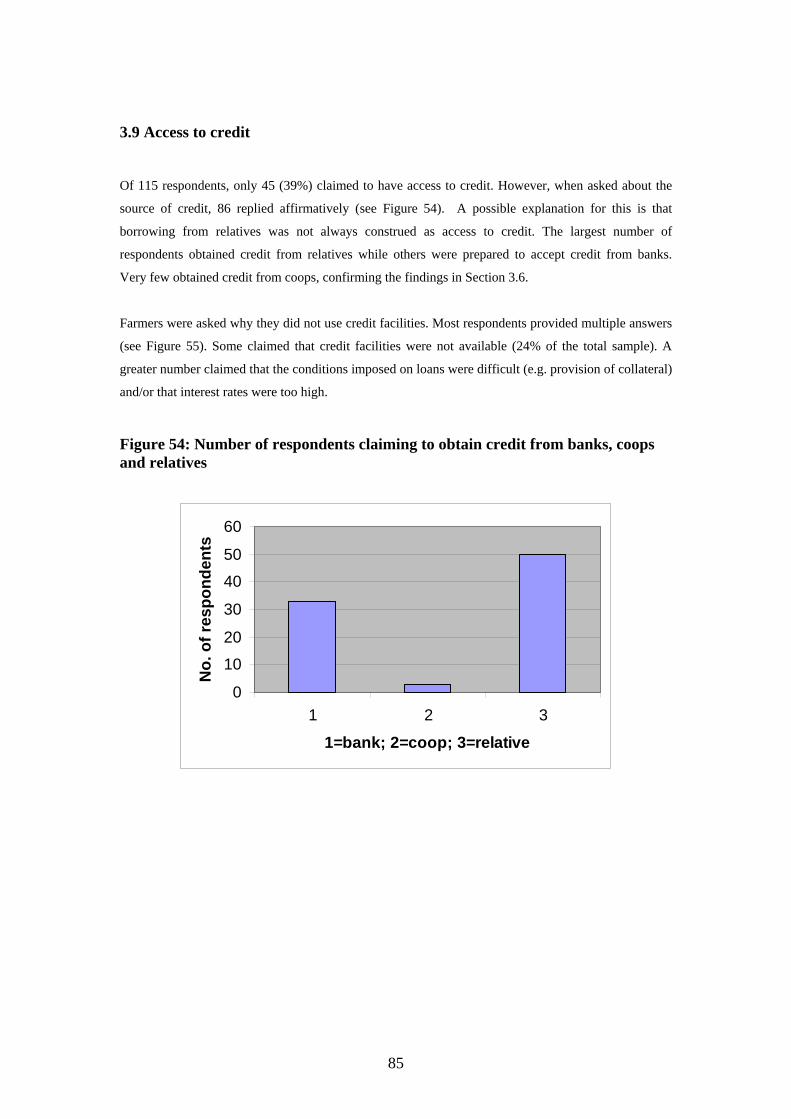
85
3.9 Access to credit
Of 115 respondents, only 45 (39%) claimed to have access to credit. However, when asked about the
source of credit, 86 replied affirmatively (see Figure 54). A possible explanation for this is that
borrowing from relatives was not always construed as access to credit. The largest number of
respondents obtained credit from relatives while others were prepared to accept credit from banks.
Very few obtained credit from coops, confirming the findings in Section 3.6.
Farmers were asked why they did not use credit facilities. Most respondents provided multiple answers
(see Figure 55). Some claimed that credit facilities were not available (24% of the total sample). A
greater number claimed that the conditions imposed on loans were difficult (e.g. provision of collateral)
and/or that interest rates were too high.
Figure 54: Number of respondents claiming to obtain credit from banks, coops and relatives
0
10
20
30
40
50
60
1 2 3
1=bank; 2=coop; 3=relative
No.
of r
espo
nden
ts
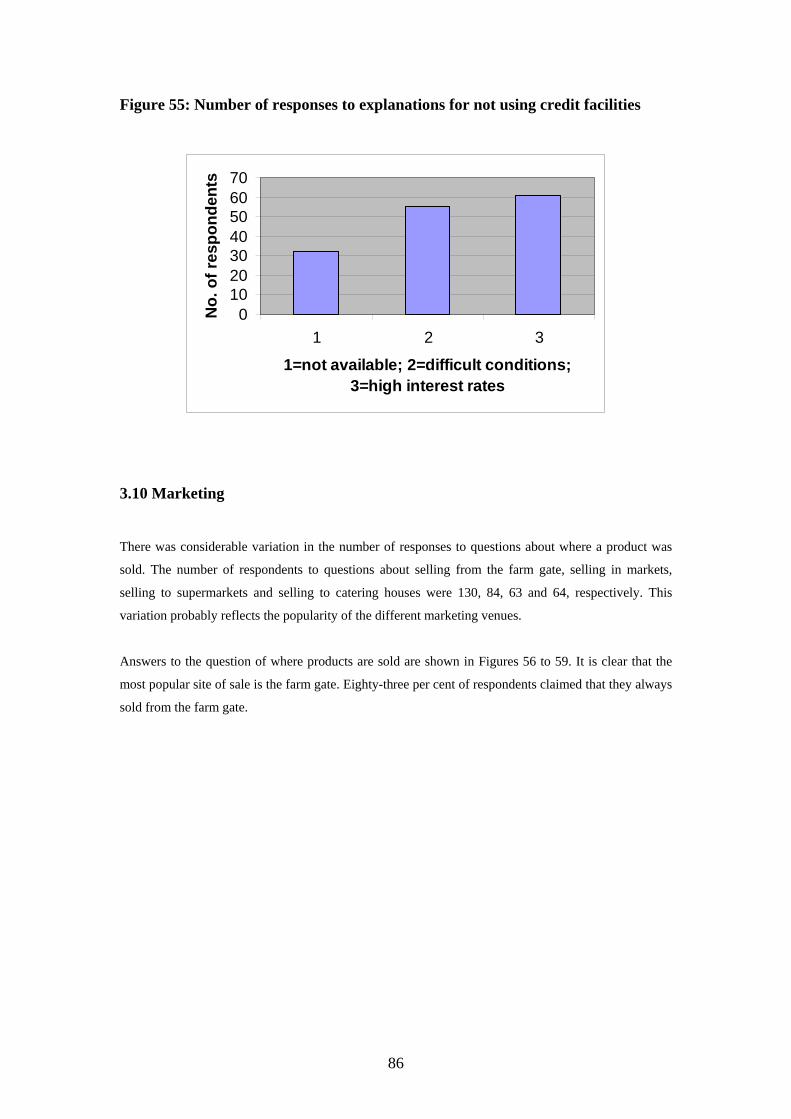
86
Figure 55: Number of responses to explanations for not using credit facilities
010203040506070
1 2 3
1=not available; 2=difficult conditions; 3=high interest rates
No.
of r
espo
nden
ts
3.10 Marketing
There was considerable variation in the number of responses to questions about where a product was
sold. The number of respondents to questions about selling from the farm gate, selling in markets,
selling to supermarkets and selling to catering houses were 130, 84, 63 and 64, respectively. This
variation probably reflects the popularity of the different marketing venues.
Answers to the question of where products are sold are shown in Figures 56 to 59. It is clear that the
most popular site of sale is the farm gate. Eighty-three per cent of respondents claimed that they always
sold from the farm gate.
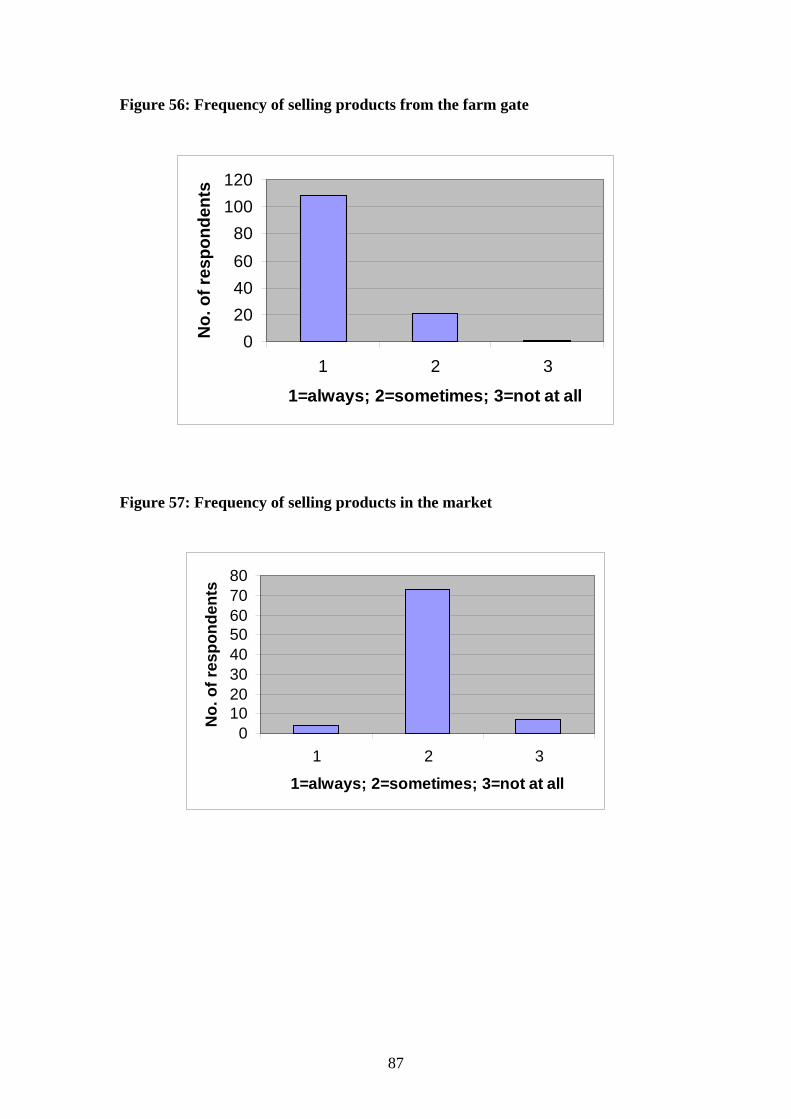
87
Figure 56: Frequency of selling products from the farm gate
020406080
100120
1 2 3
1=always; 2=sometimes; 3=not at all
No.
of r
espo
nden
ts
Figure 57: Frequency of selling products in the market
01020304050607080
1 2 3
1=always; 2=sometimes; 3=not at all
No.
of r
espo
nden
ts
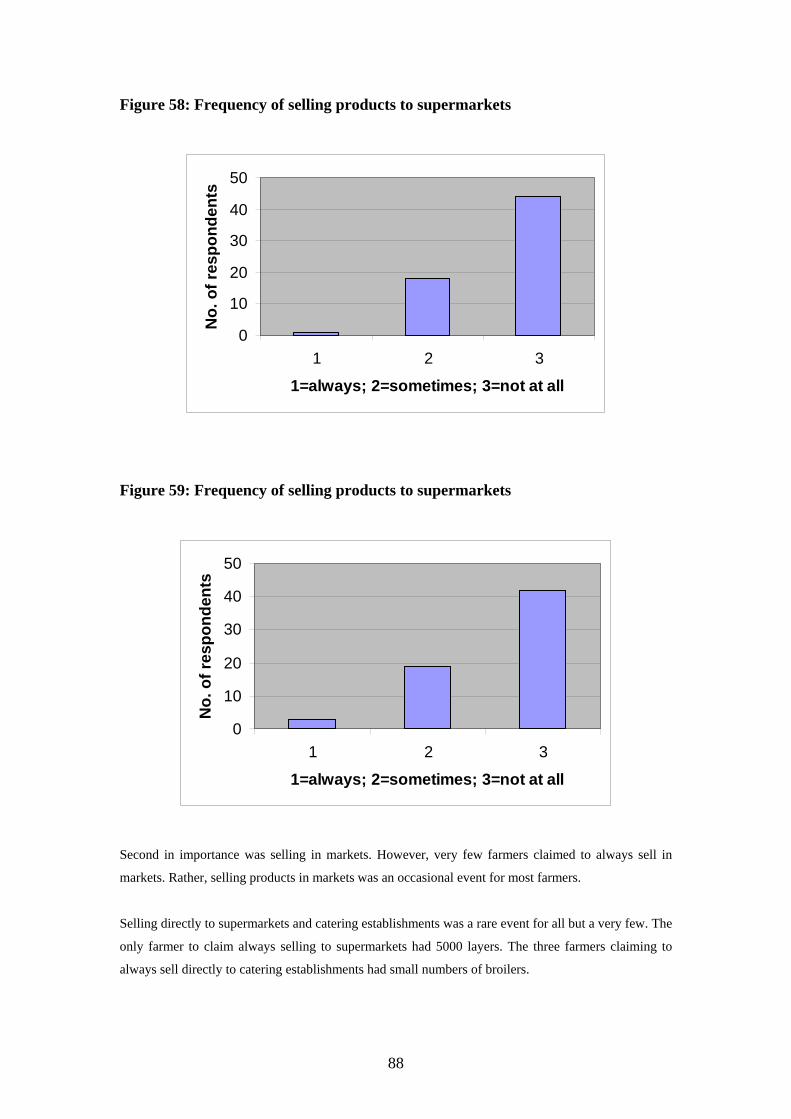
88
Figure 58: Frequency of selling products to supermarkets
0
10
20
30
40
50
1 2 3
1=always; 2=sometimes; 3=not at all
No.
of r
espo
nden
ts
Figure 59: Frequency of selling products to supermarkets
0
10
20
30
40
50
1 2 3
1=always; 2=sometimes; 3=not at all
No.
of r
espo
nden
ts
Second in importance was selling in markets. However, very few farmers claimed to always sell in
markets. Rather, selling products in markets was an occasional event for most farmers.
Selling directly to supermarkets and catering establishments was a rare event for all but a very few. The
only farmer to claim always selling to supermarkets had 5000 layers. The three farmers claiming to
always sell directly to catering establishments had small numbers of broilers.
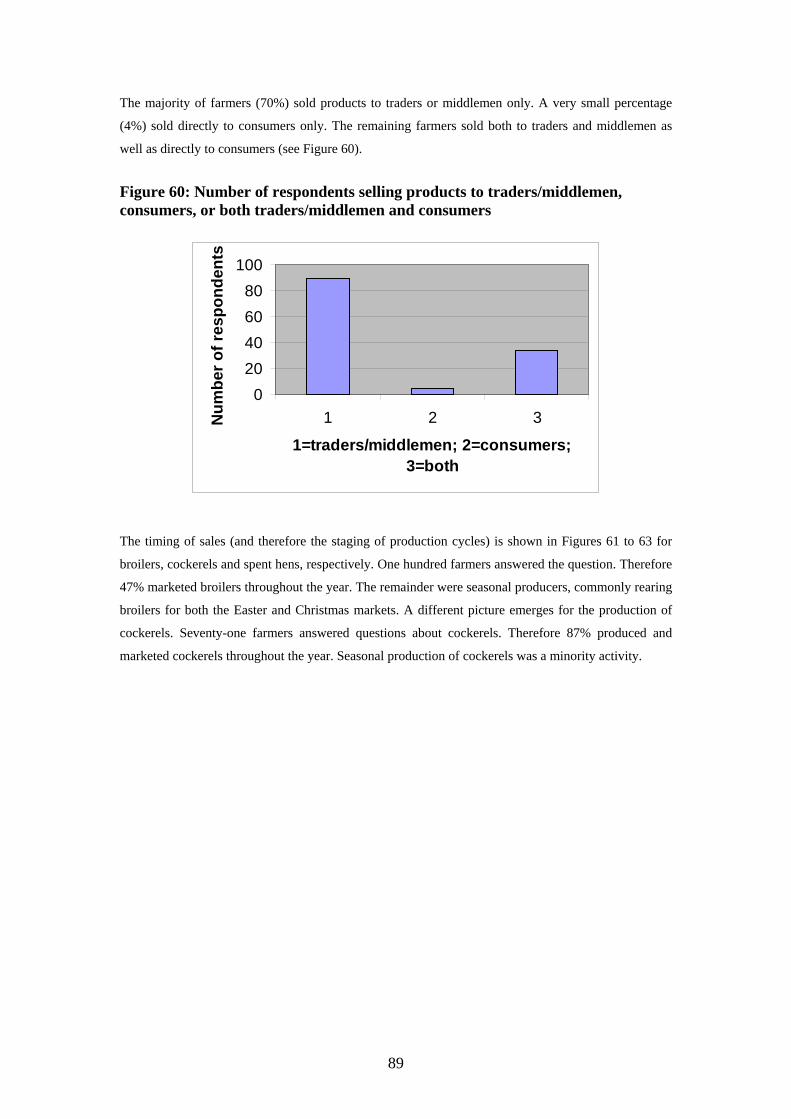
89
The majority of farmers (70%) sold products to traders or middlemen only. A very small percentage
(4%) sold directly to consumers only. The remaining farmers sold both to traders and middlemen as
well as directly to consumers (see Figure 60). Figure 60: Number of respondents selling products to traders/middlemen, consumers, or both traders/middlemen and consumers
020406080
100
1 2 3
1=traders/middlemen; 2=consumers; 3=both
Num
ber o
f res
pond
ents
The timing of sales (and therefore the staging of production cycles) is shown in Figures 61 to 63 for
broilers, cockerels and spent hens, respectively. One hundred farmers answered the question. Therefore
47% marketed broilers throughout the year. The remainder were seasonal producers, commonly rearing
broilers for both the Easter and Christmas markets. A different picture emerges for the production of
cockerels. Seventy-one farmers answered questions about cockerels. Therefore 87% produced and
marketed cockerels throughout the year. Seasonal production of cockerels was a minority activity.
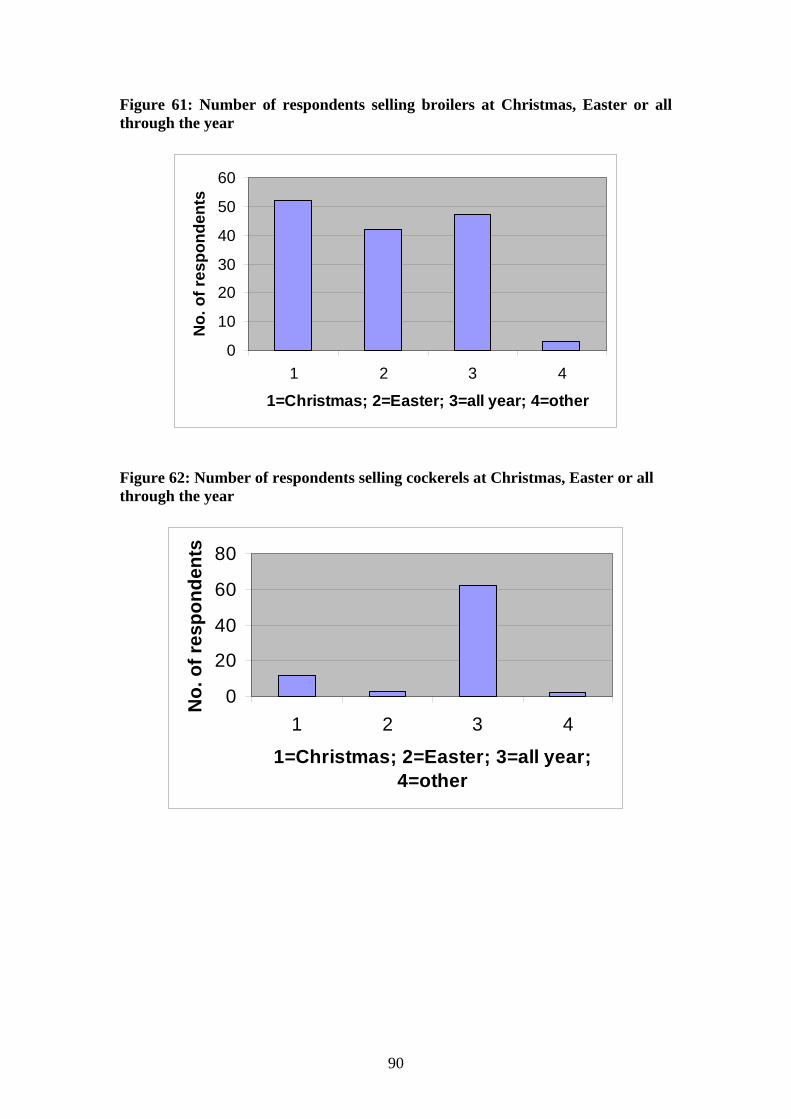
90
Figure 61: Number of respondents selling broilers at Christmas, Easter or all through the year
0
10
20
30
40
50
60
1 2 3 4
1=Christmas; 2=Easter; 3=all year; 4=other
No.
of r
espo
nden
ts
Figure 62: Number of respondents selling cockerels at Christmas, Easter or all through the year
0
20
40
60
80
1 2 3 4
1=Christmas; 2=Easter; 3=all year; 4=other
No.
of r
espo
nden
ts
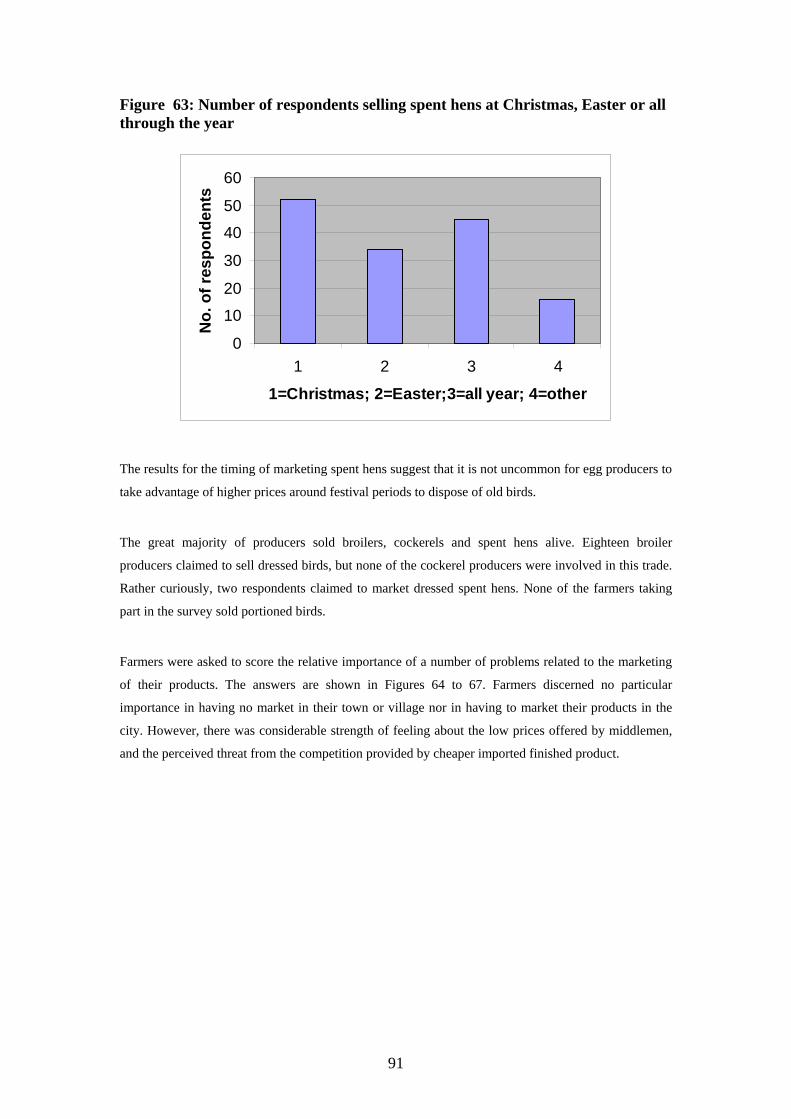
91
Figure 63: Number of respondents selling spent hens at Christmas, Easter or all through the year
0
10
20
30
40
50
60
1 2 3 4
1=Christmas; 2=Easter;3=all year; 4=other
No.
of r
espo
nden
ts
The results for the timing of marketing spent hens suggest that it is not uncommon for egg producers to
take advantage of higher prices around festival periods to dispose of old birds.
The great majority of producers sold broilers, cockerels and spent hens alive. Eighteen broiler
producers claimed to sell dressed birds, but none of the cockerel producers were involved in this trade.
Rather curiously, two respondents claimed to market dressed spent hens. None of the farmers taking
part in the survey sold portioned birds.
Farmers were asked to score the relative importance of a number of problems related to the marketing
of their products. The answers are shown in Figures 64 to 67. Farmers discerned no particular
importance in having no market in their town or village nor in having to market their products in the
city. However, there was considerable strength of feeling about the low prices offered by middlemen,
and the perceived threat from the competition provided by cheaper imported finished product.
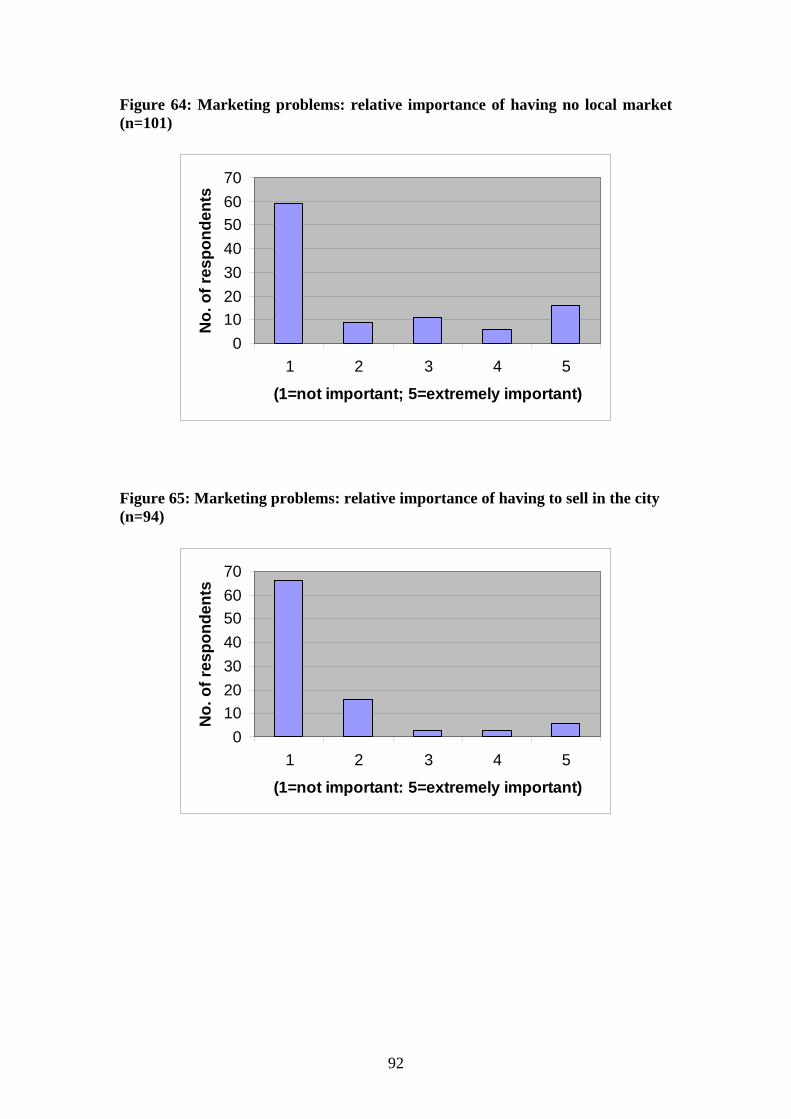
92
Figure 64: Marketing problems: relative importance of having no local market (n=101)
010203040506070
1 2 3 4 5
(1=not important; 5=extremely important)
No.
of r
espo
nden
ts
Figure 65: Marketing problems: relative importance of having to sell in the city (n=94)
010203040506070
1 2 3 4 5
(1=not important: 5=extremely important)
No.
of r
espo
nden
ts
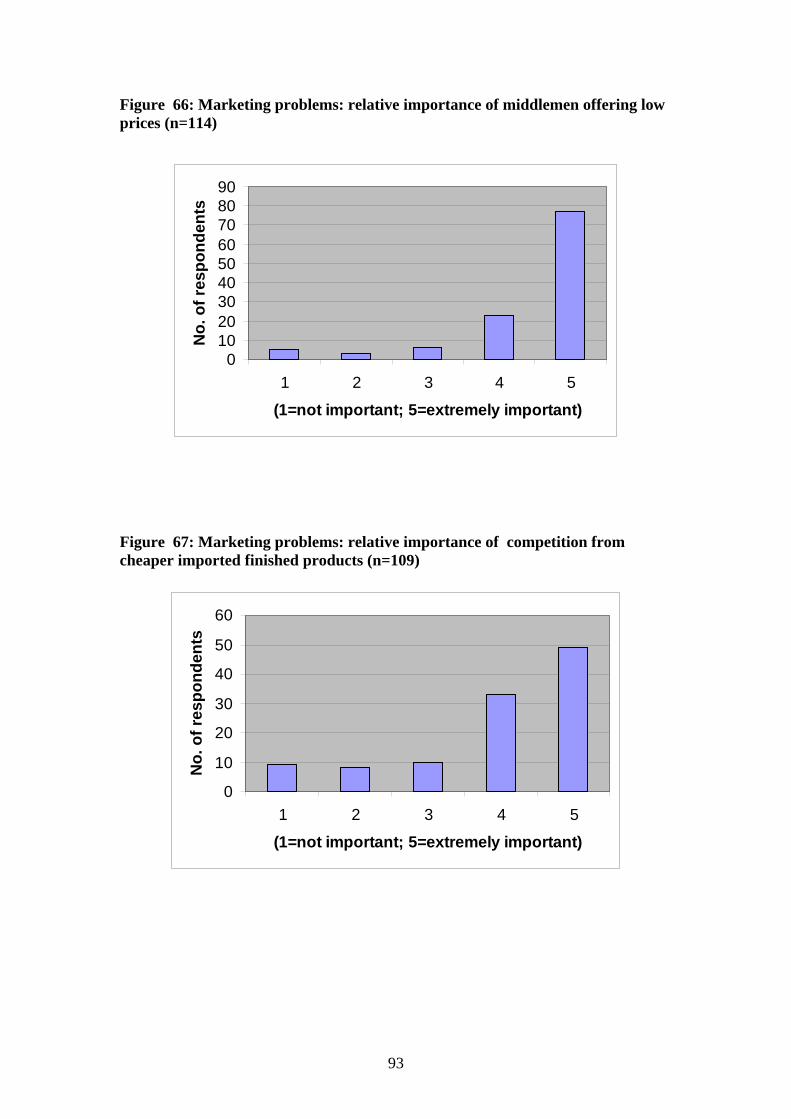
93
Figure 66: Marketing problems: relative importance of middlemen offering low prices (n=114)
0102030405060708090
1 2 3 4 5
(1=not important; 5=extremely important)
No.
of r
espo
nden
ts
Figure 67: Marketing problems: relative importance of competition from cheaper imported finished products (n=109)
0
10
20
30
40
50
60
1 2 3 4 5
(1=not important; 5=extremely important)
No.
of r
espo
nden
ts
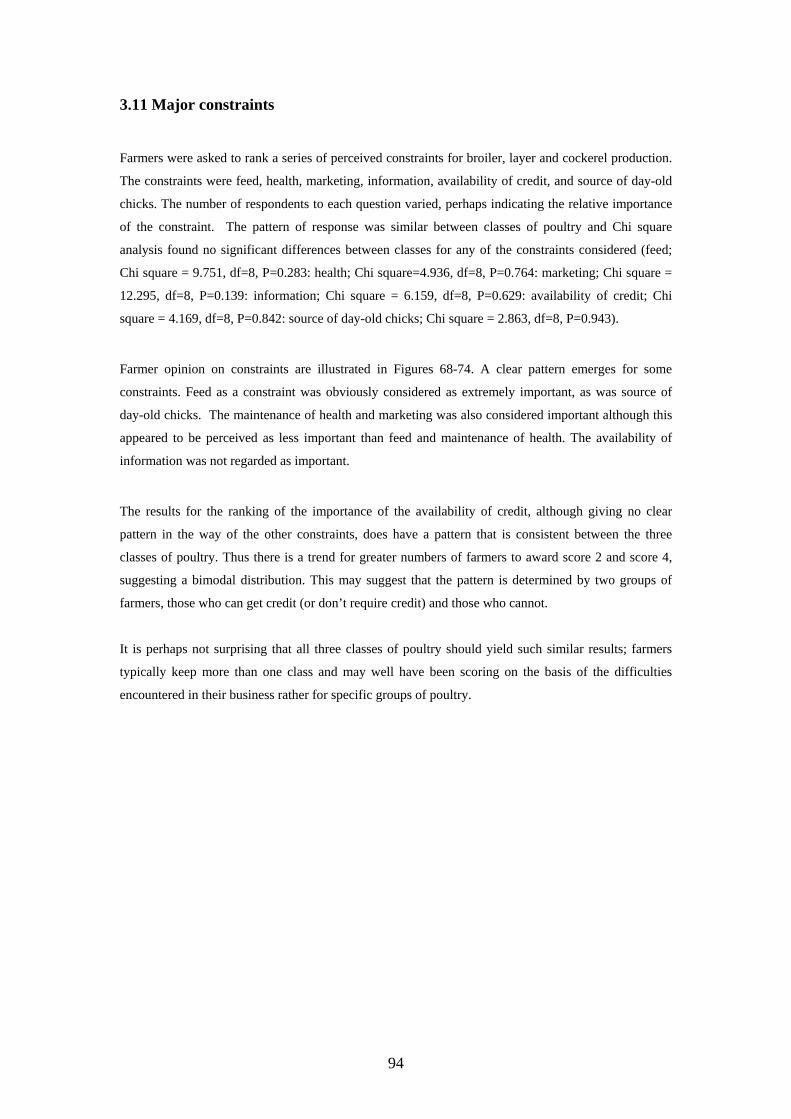
94
3.11 Major constraints
Farmers were asked to rank a series of perceived constraints for broiler, layer and cockerel production.
The constraints were feed, health, marketing, information, availability of credit, and source of day-old
chicks. The number of respondents to each question varied, perhaps indicating the relative importance
of the constraint. The pattern of response was similar between classes of poultry and Chi square
analysis found no significant differences between classes for any of the constraints considered (feed;
Chi square = 9.751, df=8, P=0.283: health; Chi square=4.936, df=8, P=0.764: marketing; Chi square =
12.295, df=8, P=0.139: information; Chi square = 6.159, df=8, P=0.629: availability of credit; Chi
square = 4.169, df=8, P=0.842: source of day-old chicks; Chi square = 2.863, df=8, P=0.943).
Farmer opinion on constraints are illustrated in Figures 68-74. A clear pattern emerges for some
constraints. Feed as a constraint was obviously considered as extremely important, as was source of
day-old chicks. The maintenance of health and marketing was also considered important although this
appeared to be perceived as less important than feed and maintenance of health. The availability of
information was not regarded as important.
The results for the ranking of the importance of the availability of credit, although giving no clear
pattern in the way of the other constraints, does have a pattern that is consistent between the three
classes of poultry. Thus there is a trend for greater numbers of farmers to award score 2 and score 4,
suggesting a bimodal distribution. This may suggest that the pattern is determined by two groups of
farmers, those who can get credit (or don’t require credit) and those who cannot.
It is perhaps not surprising that all three classes of poultry should yield such similar results; farmers
typically keep more than one class and may well have been scoring on the basis of the difficulties
encountered in their business rather for specific groups of poultry.
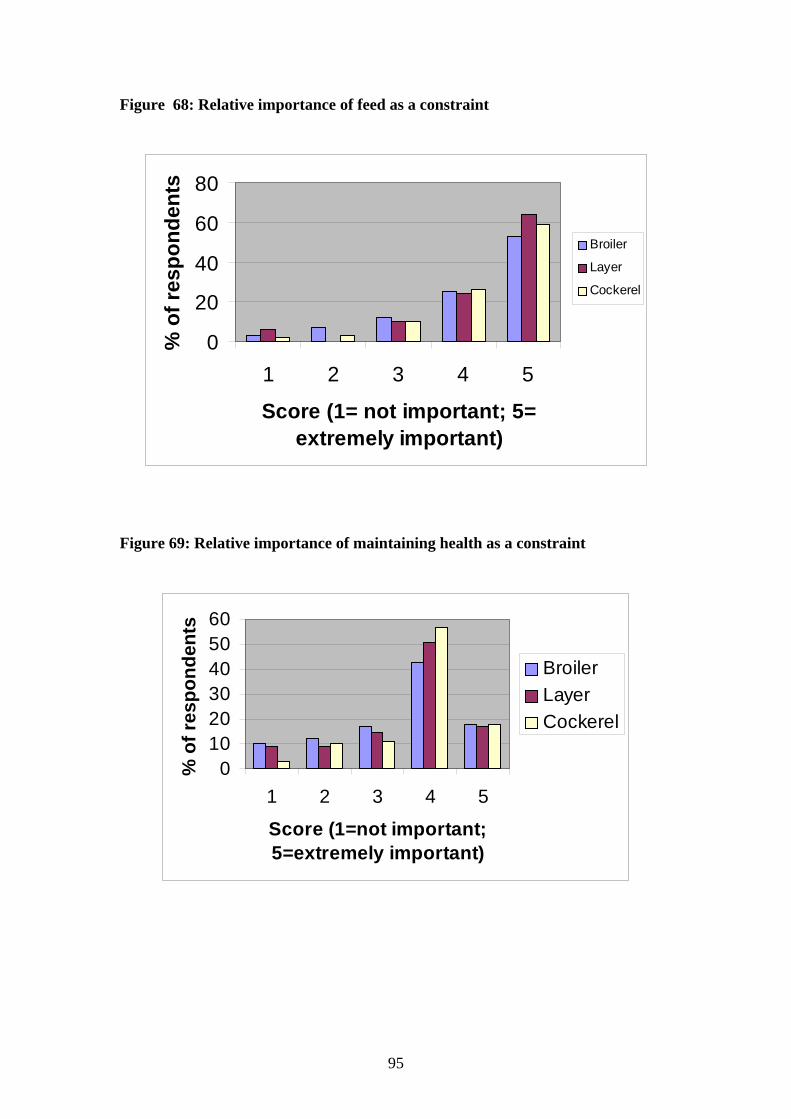
95
Figure 68: Relative importance of feed as a constraint
0
20
40
60
80
1 2 3 4 5
Score (1= not important; 5= extremely important)
% o
f res
pond
ents
Broiler
Layer
Cockerel
Figure 69: Relative importance of maintaining health as a constraint
0102030405060
1 2 3 4 5
Score (1=not important; 5=extremely important)
% o
f res
pond
ents
BroilerLayerCockerel
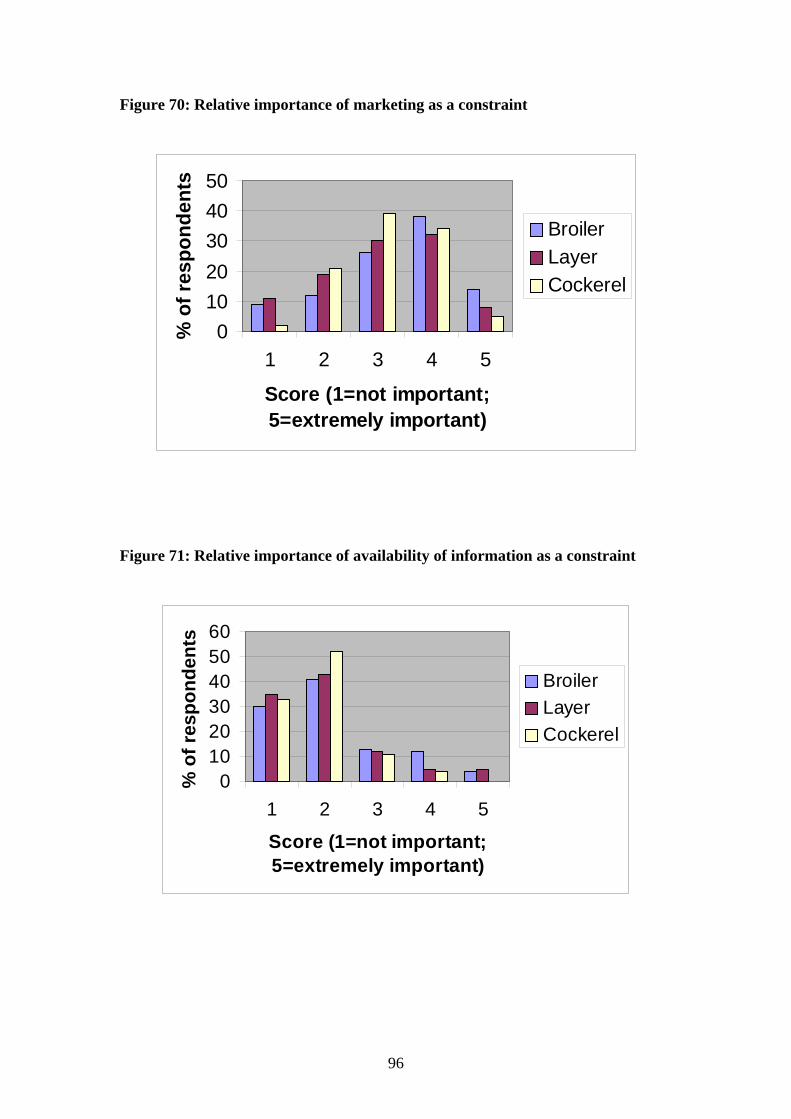
96
Figure 70: Relative importance of marketing as a constraint
01020304050
1 2 3 4 5
Score (1=not important; 5=extremely important)
% o
f res
pond
ents
BroilerLayerCockerel
Figure 71: Relative importance of availability of information as a constraint
0102030405060
1 2 3 4 5
Score (1=not important; 5=extremely important)
% o
f res
pond
ents
BroilerLayerCockerel
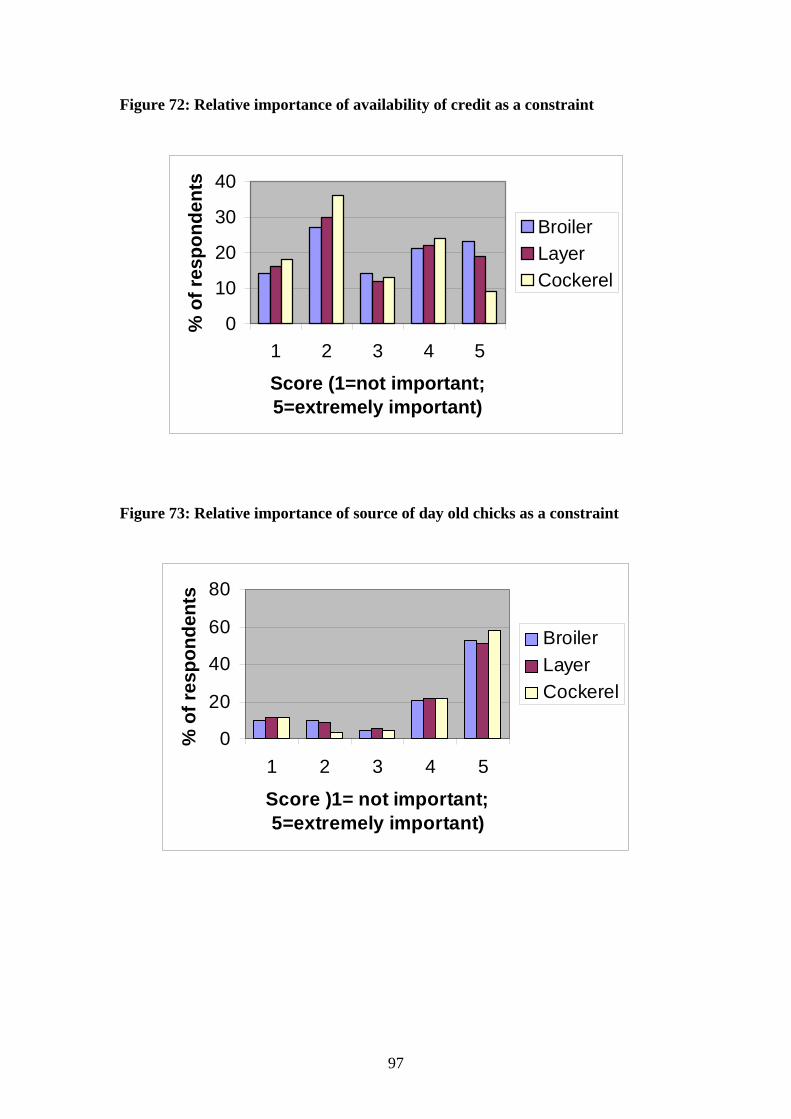
97
Figure 72: Relative importance of availability of credit as a constraint
0
10
20
30
40
1 2 3 4 5
Score (1=not important; 5=extremely important)
% o
f res
pond
ents
BroilerLayerCockerel
Figure 73: Relative importance of source of day old chicks as a constraint
0
20
40
60
80
1 2 3 4 5
Score )1= not important; 5=extremely important)
% o
f res
pond
ents
BroilerLayerCockerel
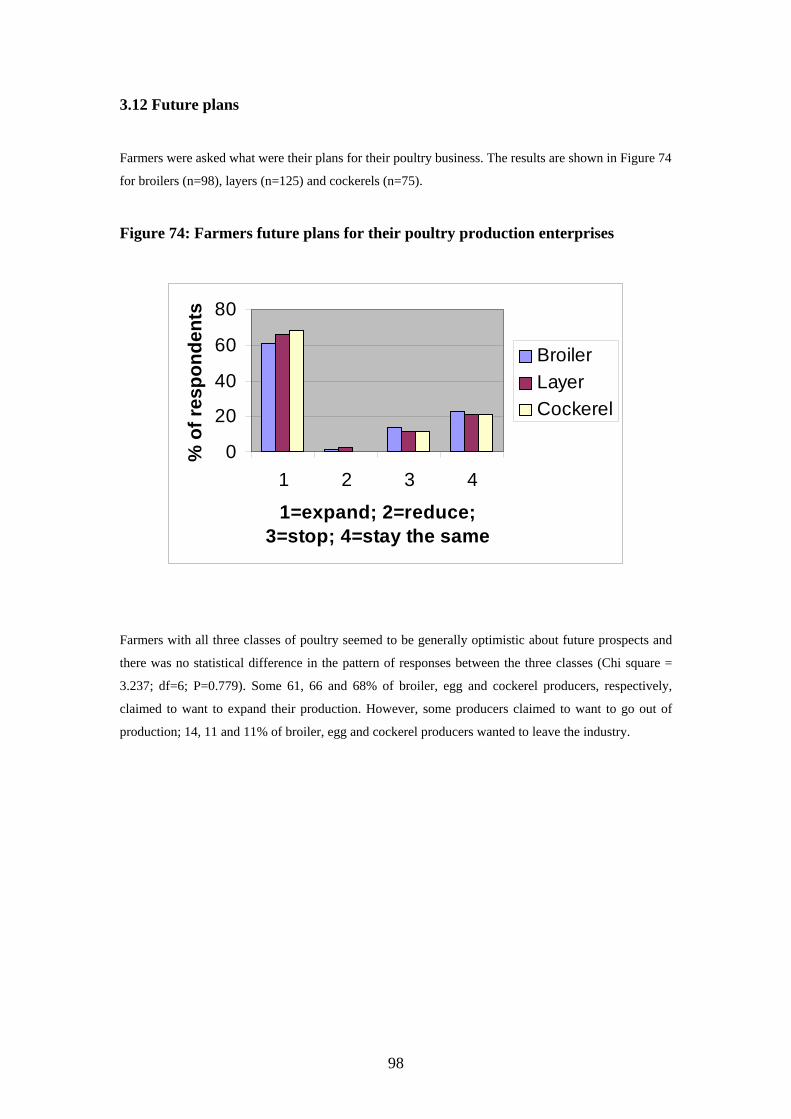
98
3.12 Future plans
Farmers were asked what were their plans for their poultry business. The results are shown in Figure 74
for broilers (n=98), layers (n=125) and cockerels (n=75).
Figure 74: Farmers future plans for their poultry production enterprises
0
20
40
60
80
1 2 3 4
1=expand; 2=reduce; 3=stop; 4=stay the same
% o
f res
pond
ents
BroilerLayerCockerel
Farmers with all three classes of poultry seemed to be generally optimistic about future prospects and
there was no statistical difference in the pattern of responses between the three classes (Chi square =
3.237; df=6; P=0.779). Some 61, 66 and 68% of broiler, egg and cockerel producers, respectively,
claimed to want to expand their production. However, some producers claimed to want to go out of
production; 14, 11 and 11% of broiler, egg and cockerel producers wanted to leave the industry.
99
Baseline Market Information For
The Accra Broiler Market
1. Introduction
1.1 The Ghanaian Broiler Market
The broiler market is an important component of the Ghanaian poultry market and is prominent
especially in the urban and peri-urban areas. Ghana’s total supply of poultry meat was 35,578 metric
tonnes in 1999 (Food and Agricultural Organisation, 2000). This comprised 16,380 tonnes of domestic
production and 19,198 tonnes of imports. The 2.3 million (2,990 tonnes)1 of broilers produced in 1999
(Ghana National Association of Poultry Farmers, 2000), therefore accounted for about 18 percent of
domestic production and about 8 percent of total poultry supply in 1999.
On the Ghanaian market, broilers are sold live, dressed and whole, or dressed and portioned.
Processing beyond portioning is rare. Live birds always come from local sources while dressed and
whole carcasses, and broiler parts emanate from either local or imported sources.
1.2 Marketing Channels Various players participate in the business of producing or importing broilers (and, or, other poultry
products) and getting them to consumers (organisational and household consumers).
The producers include large and small scale ones who may process broilers by dressing and cutting
them for sale to supermarkets, restaurants, and fastfood outlets, canteens, or chopbars. Vendors may
also obtain live birds from these producers and dispose of them in the same form. Importers usually
have coldstores where they store chicken or broiler imports and wholesale or retail them. Traders who
buy from wholesalers usually have smaller freezing units where they in turn store the products for
further retailing. The following figure presents the broiler marketing chain (channels) in Ghana:
1 Converted at 1.3kg dressed weight per bird

100
Figure 1-1 Marketing chain for poultry meat products in Ghana
1.3 Problem Statement The short growing period of broilers makes it a favoured enterprise for some urban and peri-urban
dwellers who want to earn some income aside from their regular ones. However, a few problems have
stemmed the growth of broiler production in the country. Notable among these are high production
cost, high cost of credit (40% in 2001), and competition from less expensive poultry imports.
Researchers have been experimenting with the use of alternative ingredients in a bid to provide less
expensive feed sources and thereby lower cost of production. Government is also maintaining strict
fiscal and monetary discipline, so as to bring the cost of borrowing down. It has been difficult for
government, however, to restrict imports of poultry products because of trade liberalisation policies.
In the face of these problems, it is imperative that market intelligence information is gathered to help
improve the competitiveness of local broiler products. It is important for producers and processors, for
instance, to know the relative shares of various forms of broiler (poultry) meat purchased by various
categories of traders, and final consumers. It is equally useful to ascertain factors that traders and
consumers consider in making purchasing decisions.
Primary level IMPORTERS PRODUCERS
PROCESSORS
Secondary
level COLDSTORES SUPERMARKETS
tertiary level CHOPBARS &
CANTEENS
RESTAURANTS &
FASTFOODS
Final
Consumers HOUSEHOLDS
101
1.4 The objective of the study The primary objective of this study is to provide baseline market information for the improvement of
the broiler market in Ghana. The specific objectives are to
1. estimate the market shares of various forms of broiler meat among traders and consumers.
2. ascertain the preferences of traders and consumers of broiler meat.
3. develop strategies for the improvement of the Ghanaian broiler market.
1.5 Organisation of the study The rest of this study is organised into three chapters. Chapter two (2) outlines the study methodology,
and results are presented in chapter 3. In chapter 4 conclusions are drawn and recommendations made.
102
2.0 Methodology
2.1 Sampling Methodology The study methodology is informed by the rapid market appraisal approach (Holtzman et. al., 1995)
and formal survey techniques. The need for speed and limited resources influenced the sampling
procedure and sample sizes of the various groups. The sample size for each category of respondents
were based on their prominence in broiler marketing as well as how early responses become similar as
interviews progressed (see Scarborough and Kydd, 1992).
A cross-sectional survey of traders and households was conducted during the last quarter of 2001.
Purposive sampling techniques were used (see Chisnail, 1996; Crawford, 1997). The sample was
stratified by trader categories (enterprises) and quotas were allocated to each stratum. Respondents
were selected within the city of Accra. This was done in a manner that allowed coverage of major
geographic areas where specific trader categories were known to be situated. The trader categories
included supermarkets, coldstores, caterers, and vendors, and are defined as follows:
• Supermarkets are large shops which sell a range of products including food and household
goods which customers can pick from shelves themselves and pay at the exit.
• Coldstores are facilities that have freezing units for storing goods usually food for sale.
• Caterers are people or businesses that have specialised in preparing food for sale.
• Vendors sell (retail) goods in the open market or by the road side. Caterers were further divided into four (4) subgroups namely
• fast food outlets,
• canteens,
• restaurants, and
• chopbars.
These were defined according to the parameters shown in Table 2-1.
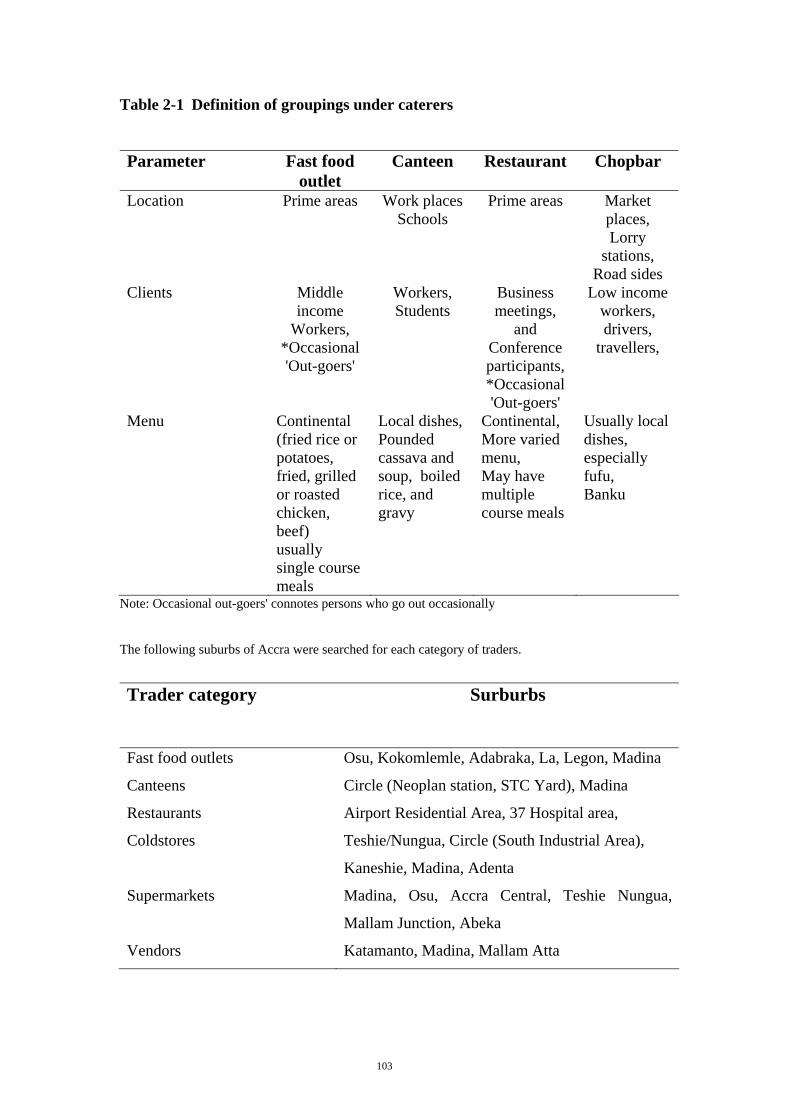
103
Table 2-1 Definition of groupings under caterers
Parameter Fast food outlet
Canteen Restaurant Chopbar
Location Prime areas
Work places Schools
Prime areas Market places, Lorry
stations, Road sides
Clients
Middle income
Workers, *Occasional 'Out-goers'
Workers, Students
Business meetings,
and Conference participants, *Occasional 'Out-goers'
Low income workers, drivers,
travellers,
Menu Continental (fried rice or potatoes, fried, grilled or roasted chicken, beef) usually single course meals
Local dishes, Pounded cassava and soup, boiled rice, and gravy
Continental, More varied menu, May have multiple course meals
Usually local dishes, especially fufu, Banku
Note: Occasional out-goers' connotes persons who go out occasionally
The following suburbs of Accra were searched for each category of traders. Trader category Surburbs
Fast food outlets Osu, Kokomlemle, Adabraka, La, Legon, Madina
Canteens Circle (Neoplan station, STC Yard), Madina
Restaurants Airport Residential Area, 37 Hospital area,
Coldstores Teshie/Nungua, Circle (South Industrial Area),
Kaneshie, Madina, Adenta
Supermarkets Madina, Osu, Accra Central, Teshie Nungua,
Mallam Junction, Abeka
Vendors Katamanto, Madina, Mallam Atta
104
Household consumers were selected such that various income categories were included. This was
achieved by visiting particular places whose income levels were fairly predictable. To reach low
income people, a low income area was chosen and some of the inhabitants were interviewed. To reach
middle income respondents, specific work places were targeted.
2.2 Interview methodology Interviews with traders were done with formal questionnaires. Traders were asked questions pertaining
to their business characteristics, quantities of produce sold, and marketing activities (buying and
selling), including conditions looked out for when buying. Information on the socio-demographic
characteristics, factors considered important in purchasing decisions, quantities purchased among
others were captured in the case of consumers.
2.3 Analysis of data Simple descriptive statistics such as frequencies were used and cross tabulations were employed to
bring out certain relationships among variables.
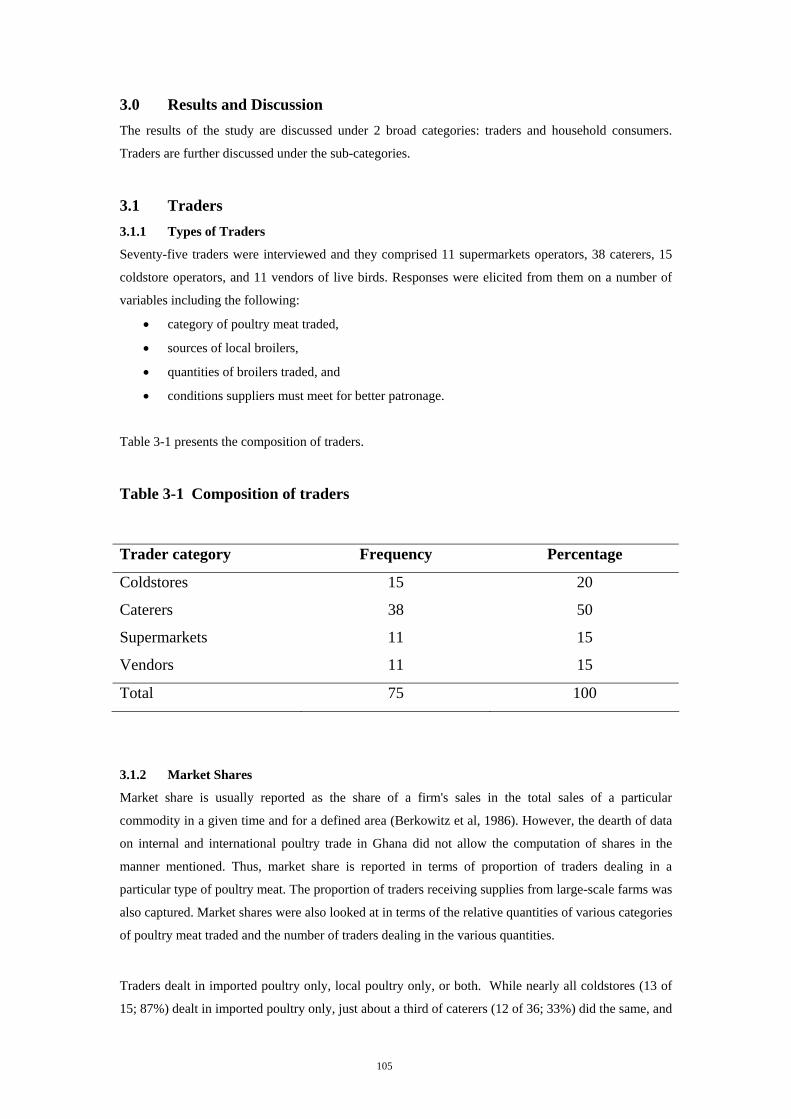
105
3.0 Results and Discussion The results of the study are discussed under 2 broad categories: traders and household consumers.
Traders are further discussed under the sub-categories.
3.1 Traders 3.1.1 Types of Traders
Seventy-five traders were interviewed and they comprised 11 supermarkets operators, 38 caterers, 15
coldstore operators, and 11 vendors of live birds. Responses were elicited from them on a number of
variables including the following:
• category of poultry meat traded,
• sources of local broilers,
• quantities of broilers traded, and
• conditions suppliers must meet for better patronage.
Table 3-1 presents the composition of traders.
Table 3-1 Composition of traders
Trader category Frequency Percentage
Coldstores 15 20
Caterers 38 50
Supermarkets 11 15
Vendors 11 15
Total 75 100
3.1.2 Market Shares
Market share is usually reported as the share of a firm's sales in the total sales of a particular
commodity in a given time and for a defined area (Berkowitz et al, 1986). However, the dearth of data
on internal and international poultry trade in Ghana did not allow the computation of shares in the
manner mentioned. Thus, market share is reported in terms of proportion of traders dealing in a
particular type of poultry meat. The proportion of traders receiving supplies from large-scale farms was
also captured. Market shares were also looked at in terms of the relative quantities of various categories
of poultry meat traded and the number of traders dealing in the various quantities.
Traders dealt in imported poultry only, local poultry only, or both. While nearly all coldstores (13 of
15; 87%) dealt in imported poultry only, just about a third of caterers (12 of 36; 33%) did the same, and
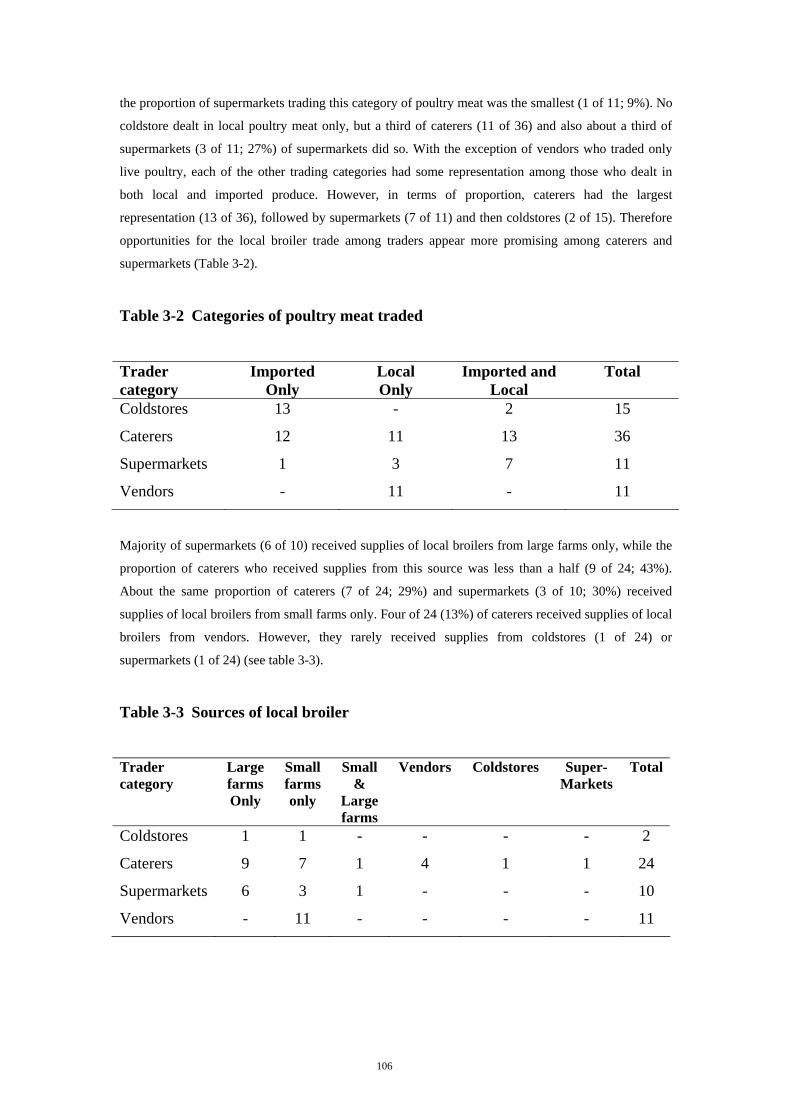
106
the proportion of supermarkets trading this category of poultry meat was the smallest (1 of 11; 9%). No
coldstore dealt in local poultry meat only, but a third of caterers (11 of 36) and also about a third of supermarkets (3 of 11; 27%) of supermarkets did so. With the exception of vendors who traded only
live poultry, each of the other trading categories had some representation among those who dealt in
both local and imported produce. However, in terms of proportion, caterers had the largest
representation (13 of 36), followed by supermarkets (7 of 11) and then coldstores (2 of 15). Therefore
opportunities for the local broiler trade among traders appear more promising among caterers and
supermarkets (Table 3-2).
Table 3-2 Categories of poultry meat traded
Trader category
Imported Only
Local Only
Imported and Local
Total
Coldstores 13 - 2 15
Caterers 12 11 13 36
Supermarkets 1 3 7 11
Vendors - 11 - 11
Majority of supermarkets (6 of 10) received supplies of local broilers from large farms only, while the
proportion of caterers who received supplies from this source was less than a half (9 of 24; 43%).
About the same proportion of caterers (7 of 24; 29%) and supermarkets (3 of 10; 30%) received
supplies of local broilers from small farms only. Four of 24 (13%) of caterers received supplies of local
broilers from vendors. However, they rarely received supplies from coldstores (1 of 24) or
supermarkets (1 of 24) (see table 3-3).
Table 3-3 Sources of local broiler
Trader category
Large farms Only
Small farms only
Small &
Large farms
Vendors Coldstores Super- Markets
Total
Coldstores 1 1 - - - - 2
Caterers 9 7 1 4 1 1 24
Supermarkets 6 3 1 - - - 10
Vendors - 11 - - - - 11
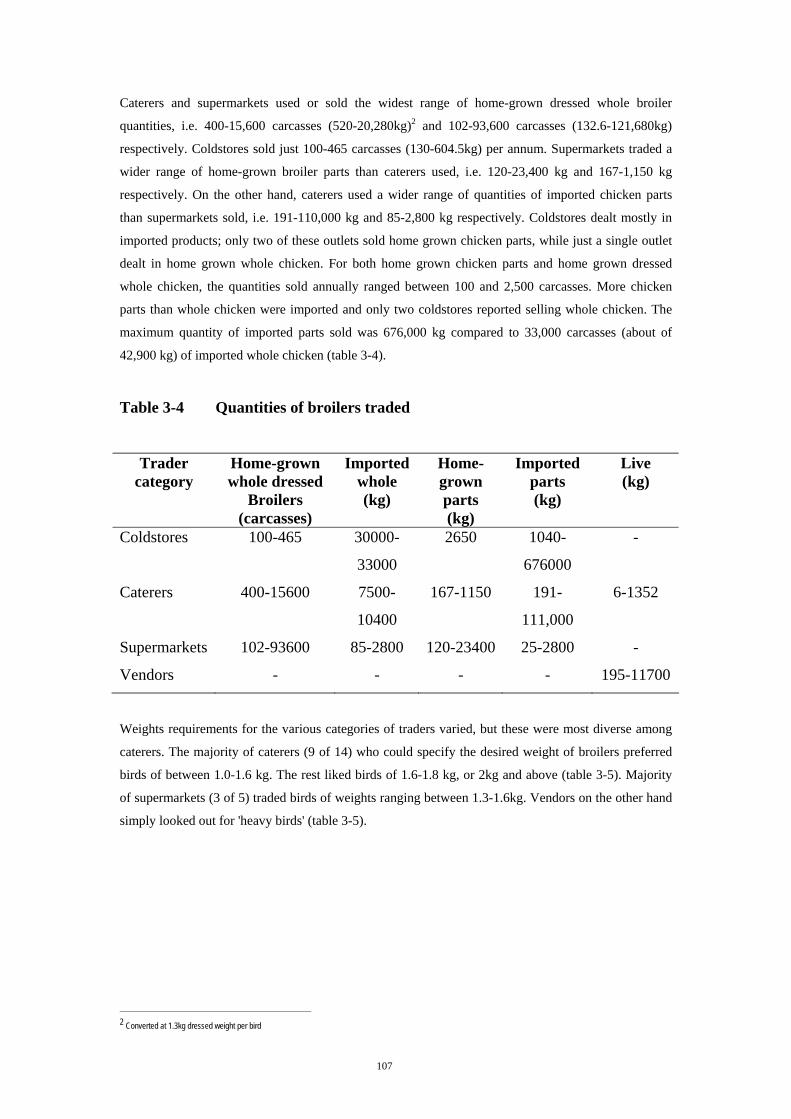
107
Caterers and supermarkets used or sold the widest range of home-grown dressed whole broiler
quantities, i.e. 400-15,600 carcasses (520-20,280kg)2 and 102-93,600 carcasses (132.6-121,680kg)
respectively. Coldstores sold just 100-465 carcasses (130-604.5kg) per annum. Supermarkets traded a
wider range of home-grown broiler parts than caterers used, i.e. 120-23,400 kg and 167-1,150 kg
respectively. On the other hand, caterers used a wider range of quantities of imported chicken parts
than supermarkets sold, i.e. 191-110,000 kg and 85-2,800 kg respectively. Coldstores dealt mostly in
imported products; only two of these outlets sold home grown chicken parts, while just a single outlet
dealt in home grown whole chicken. For both home grown chicken parts and home grown dressed
whole chicken, the quantities sold annually ranged between 100 and 2,500 carcasses. More chicken parts than whole chicken were imported and only two coldstores reported selling whole chicken. The
maximum quantity of imported parts sold was 676,000 kg compared to 33,000 carcasses (about of
42,900 kg) of imported whole chicken (table 3-4).
Table 3-4 Quantities of broilers traded
Trader category
Home-grown whole dressed
Broilers (carcasses)
Imported whole (kg)
Home-grown parts (kg)
Imported parts (kg)
Live (kg)
Coldstores 100-465 30000-
33000
2650 1040-
676000
-
Caterers 400-15600 7500-
10400
167-1150 191-
111,000
6-1352
Supermarkets 102-93600 85-2800 120-23400 25-2800 -
Vendors - - - - 195-11700
Weights requirements for the various categories of traders varied, but these were most diverse among
caterers. The majority of caterers (9 of 14) who could specify the desired weight of broilers preferred
birds of between 1.0-1.6 kg. The rest liked birds of 1.6-1.8 kg, or 2kg and above (table 3-5). Majority
of supermarkets (3 of 5) traded birds of weights ranging between 1.3-1.6kg. Vendors on the other hand
simply looked out for 'heavy birds' (table 3-5).
2 Converted at 1.3kg dressed weight per bird
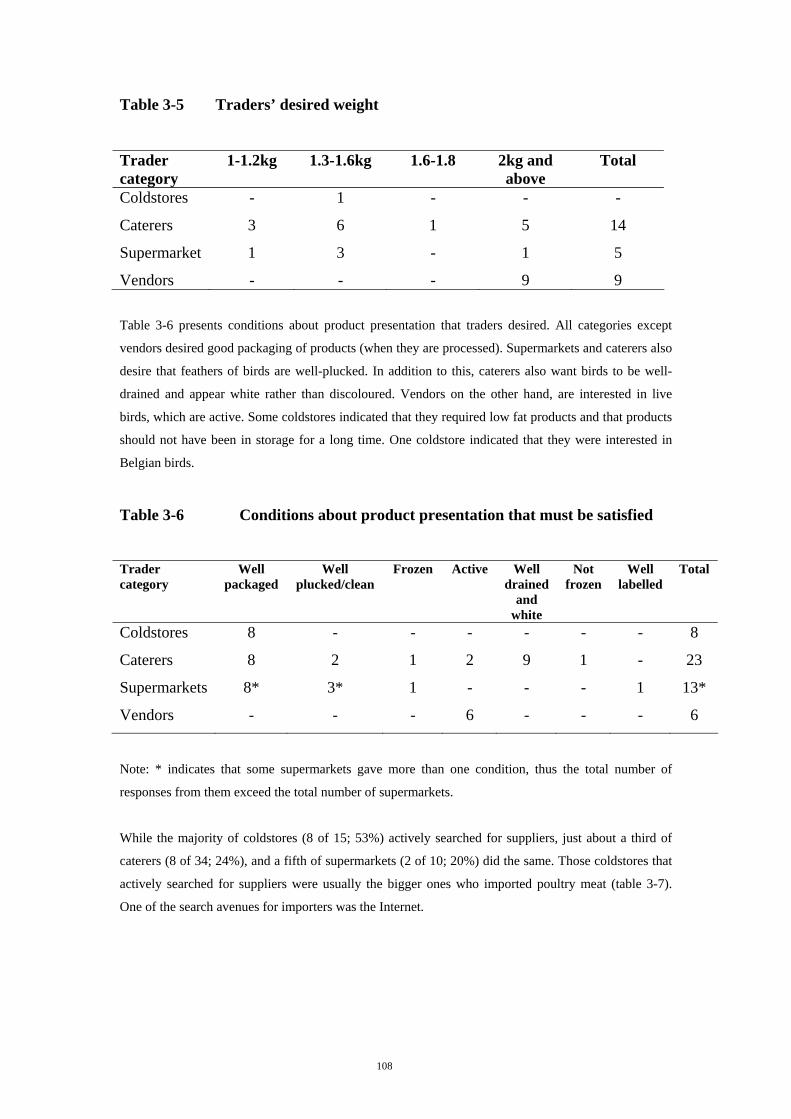
108
Table 3-5 Traders’ desired weight
Trader category
1-1.2kg 1.3-1.6kg 1.6-1.8 2kg and above
Total
Coldstores - 1 - - -
Caterers 3 6 1 5 14
Supermarket 1 3 - 1 5
Vendors - - - 9 9 Table 3-6 presents conditions about product presentation that traders desired. All categories except
vendors desired good packaging of products (when they are processed). Supermarkets and caterers also
desire that feathers of birds are well-plucked. In addition to this, caterers also want birds to be well-
drained and appear white rather than discoloured. Vendors on the other hand, are interested in live
birds, which are active. Some coldstores indicated that they required low fat products and that products
should not have been in storage for a long time. One coldstore indicated that they were interested in
Belgian birds.
Table 3-6 Conditions about product presentation that must be satisfied
Trader category
Well packaged
Well plucked/clean
Frozen Active Well drained
and white
Not frozen
Well labelled
Total
Coldstores 8 - - - - - - 8
Caterers 8 2 1 2 9 1 - 23
Supermarkets 8* 3* 1 - - - 1 13*
Vendors - - - 6 - - - 6
Note: * indicates that some supermarkets gave more than one condition, thus the total number of
responses from them exceed the total number of supermarkets.
While the majority of coldstores (8 of 15; 53%) actively searched for suppliers, just about a third of
caterers (8 of 34; 24%), and a fifth of supermarkets (2 of 10; 20%) did the same. Those coldstores that
actively searched for suppliers were usually the bigger ones who imported poultry meat (table 3-7).
One of the search avenues for importers was the Internet.
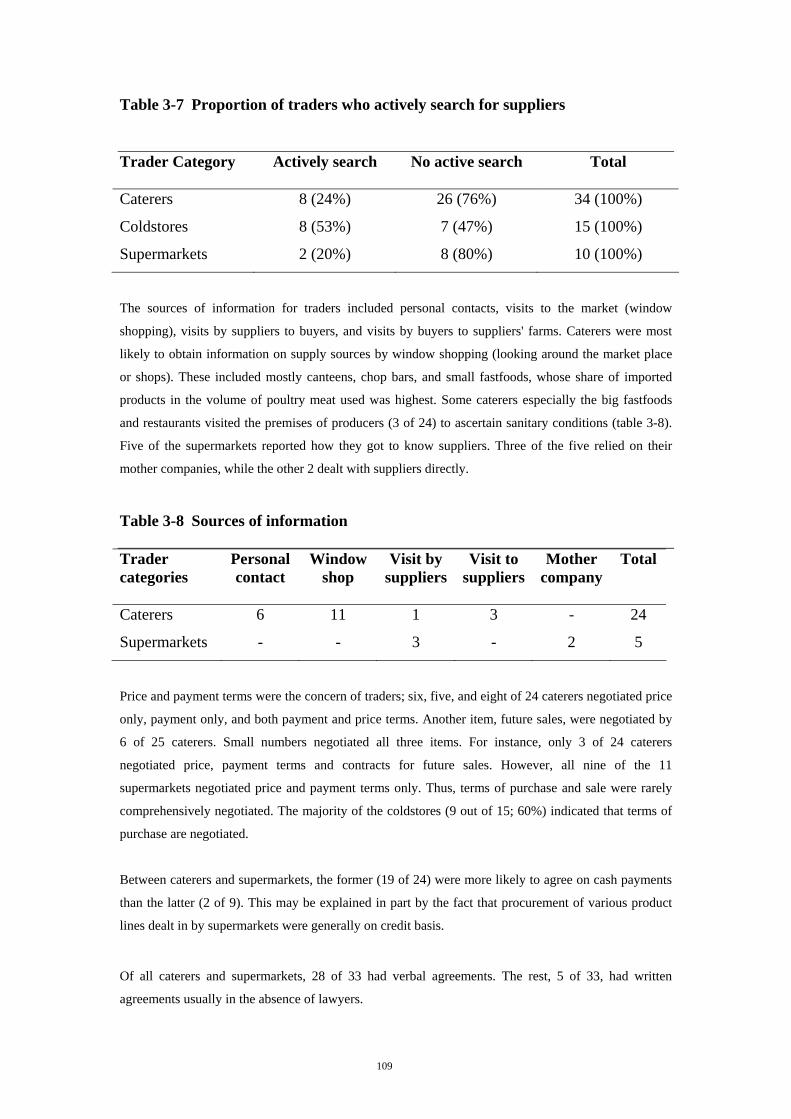
109
Table 3-7 Proportion of traders who actively search for suppliers Trader Category Actively search No active search Total
Caterers 8 (24%) 26 (76%) 34 (100%)
Coldstores 8 (53%) 7 (47%) 15 (100%)
Supermarkets 2 (20%) 8 (80%) 10 (100%)
The sources of information for traders included personal contacts, visits to the market (window
shopping), visits by suppliers to buyers, and visits by buyers to suppliers' farms. Caterers were most
likely to obtain information on supply sources by window shopping (looking around the market place
or shops). These included mostly canteens, chop bars, and small fastfoods, whose share of imported
products in the volume of poultry meat used was highest. Some caterers especially the big fastfoods
and restaurants visited the premises of producers (3 of 24) to ascertain sanitary conditions (table 3-8).
Five of the supermarkets reported how they got to know suppliers. Three of the five relied on their
mother companies, while the other 2 dealt with suppliers directly.
Table 3-8 Sources of information Trader categories
Personal contact
Window shop
Visit by suppliers
Visit to suppliers
Mother company
Total
Caterers 6 11 1 3 - 24
Supermarkets - - 3 - 2 5
Price and payment terms were the concern of traders; six, five, and eight of 24 caterers negotiated price
only, payment only, and both payment and price terms. Another item, future sales, were negotiated by 6 of 25 caterers. Small numbers negotiated all three items. For instance, only 3 of 24 caterers
negotiated price, payment terms and contracts for future sales. However, all nine of the 11
supermarkets negotiated price and payment terms only. Thus, terms of purchase and sale were rarely
comprehensively negotiated. The majority of the coldstores (9 out of 15; 60%) indicated that terms of
purchase are negotiated.
Between caterers and supermarkets, the former (19 of 24) were more likely to agree on cash payments
than the latter (2 of 9). This may be explained in part by the fact that procurement of various product
lines dealt in by supermarkets were generally on credit basis. Of all caterers and supermarkets, 28 of 33 had verbal agreements. The rest, 5 of 33, had written
agreements usually in the absence of lawyers.
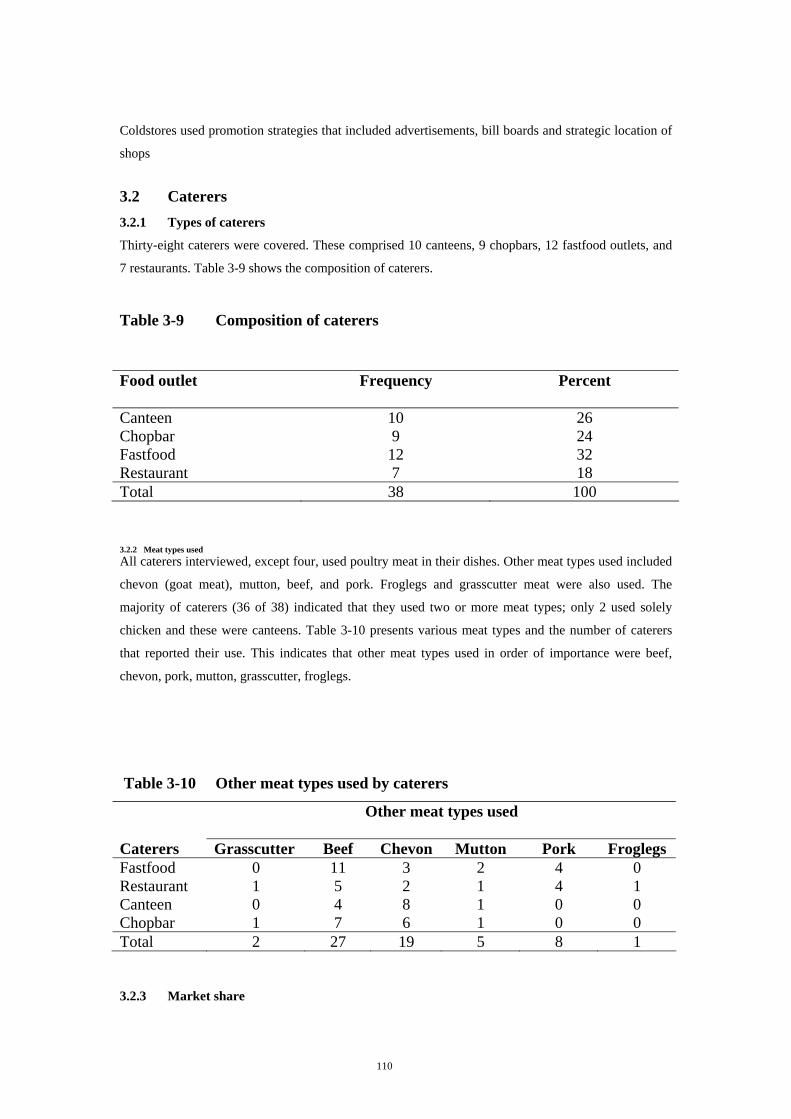
110
Coldstores used promotion strategies that included advertisements, bill boards and strategic location of
shops
3.2 Caterers 3.2.1 Types of caterers
Thirty-eight caterers were covered. These comprised 10 canteens, 9 chopbars, 12 fastfood outlets, and
7 restaurants. Table 3-9 shows the composition of caterers.
Table 3-9 Composition of caterers
Food outlet Frequency Percent
Canteen 10 26 Chopbar 9 24 Fastfood 12 32 Restaurant 7 18 Total 38 100 3.2.2 Meat types used All caterers interviewed, except four, used poultry meat in their dishes. Other meat types used included
chevon (goat meat), mutton, beef, and pork. Froglegs and grasscutter meat were also used. The
majority of caterers (36 of 38) indicated that they used two or more meat types; only 2 used solely
chicken and these were canteens. Table 3-10 presents various meat types and the number of caterers
that reported their use. This indicates that other meat types used in order of importance were beef,
chevon, pork, mutton, grasscutter, froglegs.
Table 3-10 Other meat types used by caterers
Other meat types used
Caterers Grasscutter Beef Chevon Mutton Pork Froglegs Fastfood 0 11 3 2 4 0 Restaurant 1 5 2 1 4 1 Canteen 0 4 8 1 0 0 Chopbar 1 7 6 1 0 0 Total 2 27 19 5 8 1 3.2.3 Market share
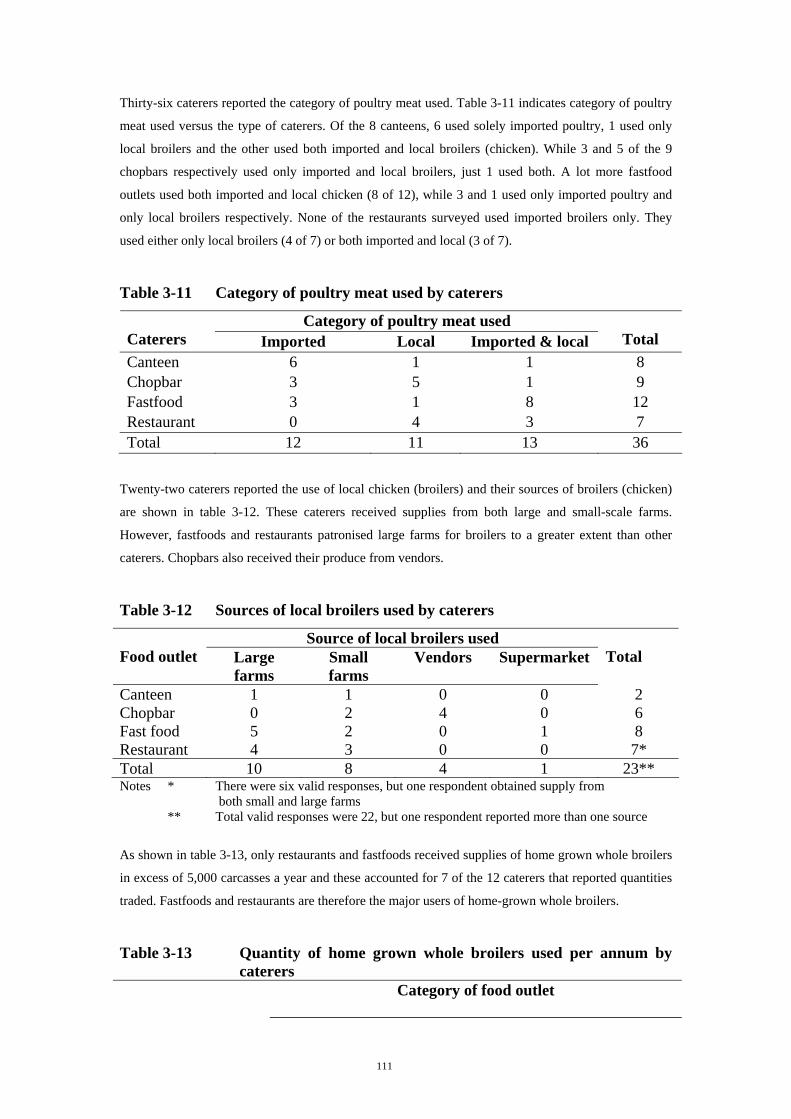
111
Thirty-six caterers reported the category of poultry meat used. Table 3-11 indicates category of poultry
meat used versus the type of caterers. Of the 8 canteens, 6 used solely imported poultry, 1 used only
local broilers and the other used both imported and local broilers (chicken). While 3 and 5 of the 9
chopbars respectively used only imported and local broilers, just 1 used both. A lot more fastfood
outlets used both imported and local chicken (8 of 12), while 3 and 1 used only imported poultry and
only local broilers respectively. None of the restaurants surveyed used imported broilers only. They
used either only local broilers (4 of 7) or both imported and local (3 of 7).
Table 3-11 Category of poultry meat used by caterers
Category of poultry meat used Caterers Imported Local Imported & local
Total
Canteen 6 1 1 8 Chopbar 3 5 1 9 Fastfood 3 1 8 12 Restaurant 0 4 3 7 Total 12 11 13 36
Twenty-two caterers reported the use of local chicken (broilers) and their sources of broilers (chicken)
are shown in table 3-12. These caterers received supplies from both large and small-scale farms.
However, fastfoods and restaurants patronised large farms for broilers to a greater extent than other
caterers. Chopbars also received their produce from vendors.
Table 3-12 Sources of local broilers used by caterers
Source of local broilers used Food outlet Large
farms Small farms
Vendors Supermarket Total
Canteen 1 1 0 0 2 Chopbar 0 2 4 0 6 Fast food 5 2 0 1 8 Restaurant 4 3 0 0 7* Total 10 8 4 1 23** Notes * There were six valid responses, but one respondent obtained supply from
both small and large farms ** Total valid responses were 22, but one respondent reported more than one source
As shown in table 3-13, only restaurants and fastfoods received supplies of home grown whole broilers
in excess of 5,000 carcasses a year and these accounted for 7 of the 12 caterers that reported quantities
traded. Fastfoods and restaurants are therefore the major users of home-grown whole broilers.
Table 3-13 Quantity of home grown whole broilers used per annum by caterers
Category of food outlet
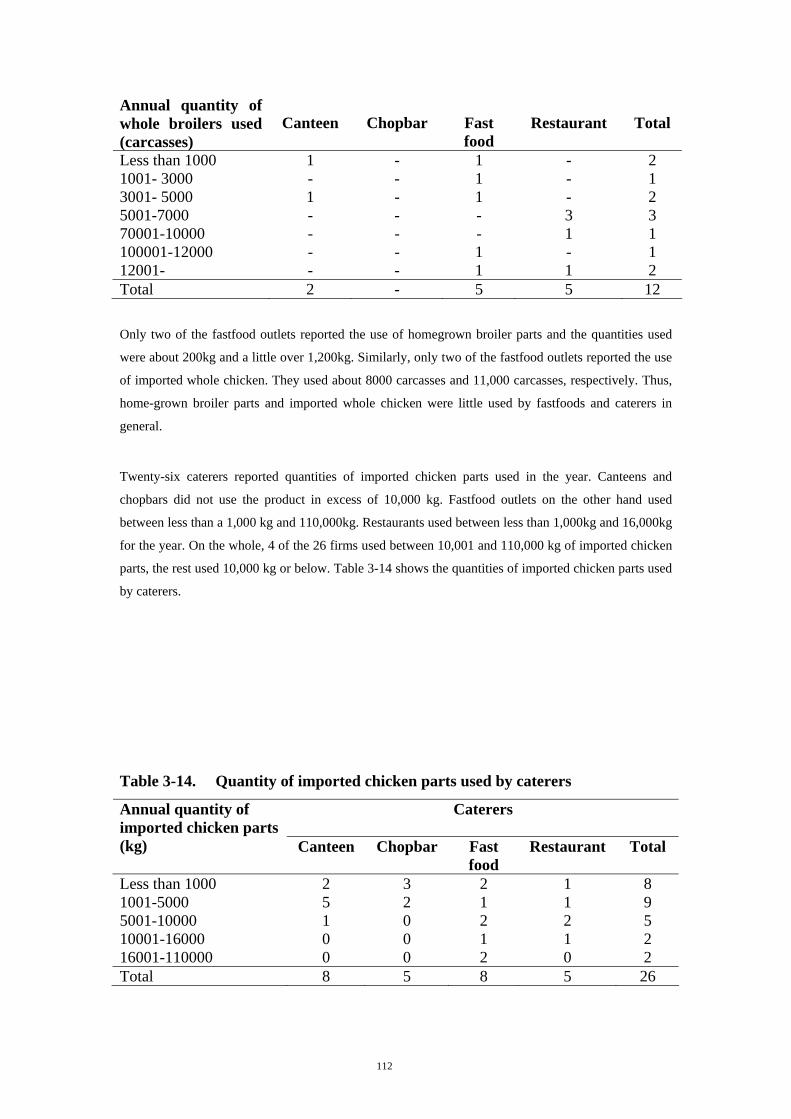
112
Annual quantity of whole broilers used (carcasses)
Canteen
Chopbar
Fast food
Restaurant
Total
Less than 1000 1 - 1 - 2 1001- 3000 - - 1 - 1 3001- 5000 1 - 1 - 2 5001-7000 - - - 3 3 70001-10000 - - - 1 1 100001-12000 - - 1 - 1 12001- - - 1 1 2 Total 2 - 5 5 12 Only two of the fastfood outlets reported the use of homegrown broiler parts and the quantities used
were about 200kg and a little over 1,200kg. Similarly, only two of the fastfood outlets reported the use
of imported whole chicken. They used about 8000 carcasses and 11,000 carcasses, respectively. Thus,
home-grown broiler parts and imported whole chicken were little used by fastfoods and caterers in
general.
Twenty-six caterers reported quantities of imported chicken parts used in the year. Canteens and
chopbars did not use the product in excess of 10,000 kg. Fastfood outlets on the other hand used
between less than a 1,000 kg and 110,000kg. Restaurants used between less than 1,000kg and 16,000kg
for the year. On the whole, 4 of the 26 firms used between 10,001 and 110,000 kg of imported chicken
parts, the rest used 10,000 kg or below. Table 3-14 shows the quantities of imported chicken parts used
by caterers.
Table 3-14. Quantity of imported chicken parts used by caterers
Caterers
Annual quantity of imported chicken parts (kg) Canteen Chopbar Fast
food Restaurant Total
Less than 1000 2 3 2 1 8 1001-5000 5 2 1 1 9 5001-10000 1 0 2 2 5 10001-16000 0 0 1 1 2 16001-110000 0 0 2 0 2 Total 8 5 8 5 26
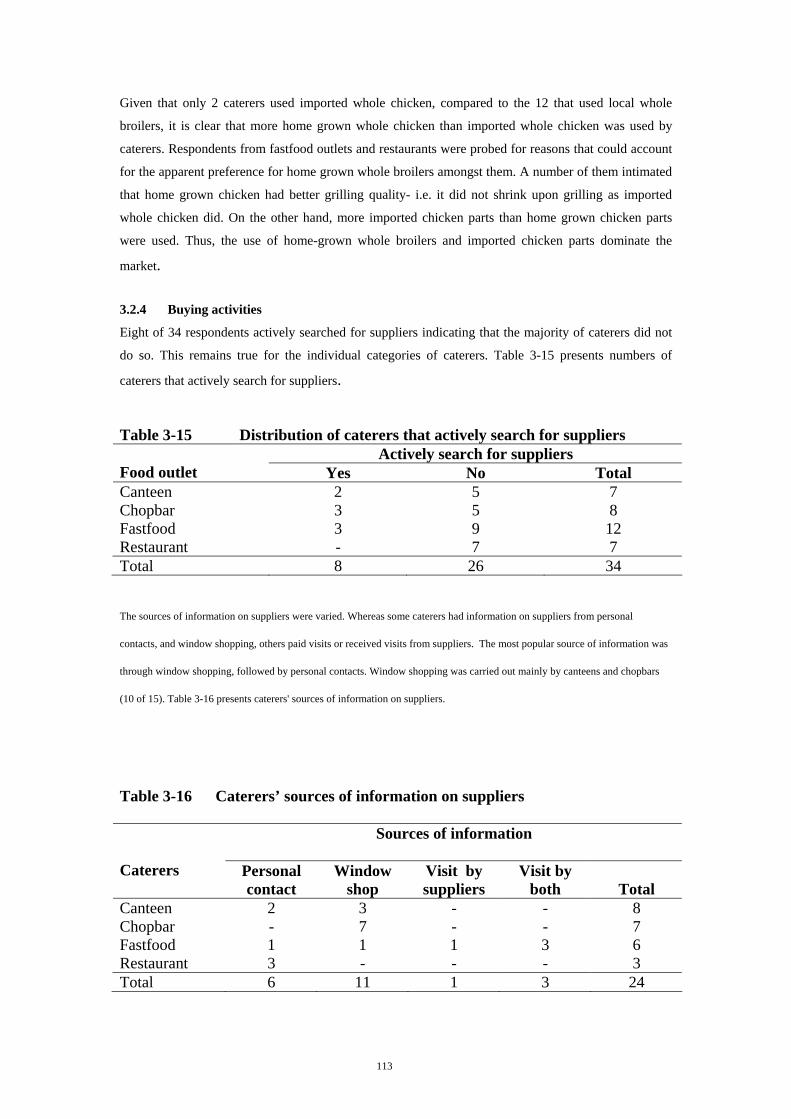
113
Given that only 2 caterers used imported whole chicken, compared to the 12 that used local whole
broilers, it is clear that more home grown whole chicken than imported whole chicken was used by
caterers. Respondents from fastfood outlets and restaurants were probed for reasons that could account
for the apparent preference for home grown whole broilers amongst them. A number of them intimated
that home grown chicken had better grilling quality- i.e. it did not shrink upon grilling as imported
whole chicken did. On the other hand, more imported chicken parts than home grown chicken parts
were used. Thus, the use of home-grown whole broilers and imported chicken parts dominate the
market.
3.2.4 Buying activities
Eight of 34 respondents actively searched for suppliers indicating that the majority of caterers did not
do so. This remains true for the individual categories of caterers. Table 3-15 presents numbers of
caterers that actively search for suppliers.
Table 3-15 Distribution of caterers that actively search for suppliers Actively search for suppliers
Food outlet Yes No Total Canteen 2 5 7 Chopbar 3 5 8 Fastfood 3 9 12 Restaurant - 7 7 Total 8 26 34
The sources of information on suppliers were varied. Whereas some caterers had information on suppliers from personal
contacts, and window shopping, others paid visits or received visits from suppliers. The most popular source of information was
through window shopping, followed by personal contacts. Window shopping was carried out mainly by canteens and chopbars
(10 of 15). Table 3-16 presents caterers' sources of information on suppliers.
Table 3-16 Caterers’ sources of information on suppliers
Sources of information
Caterers Personal
contact Window
shop Visit by suppliers
Visit by both
Total
Canteen 2 3 - - 8 Chopbar - 7 - - 7 Fastfood 1 1 1 3 6 Restaurant 3 - - - 3 Total 6 11 1 3 24
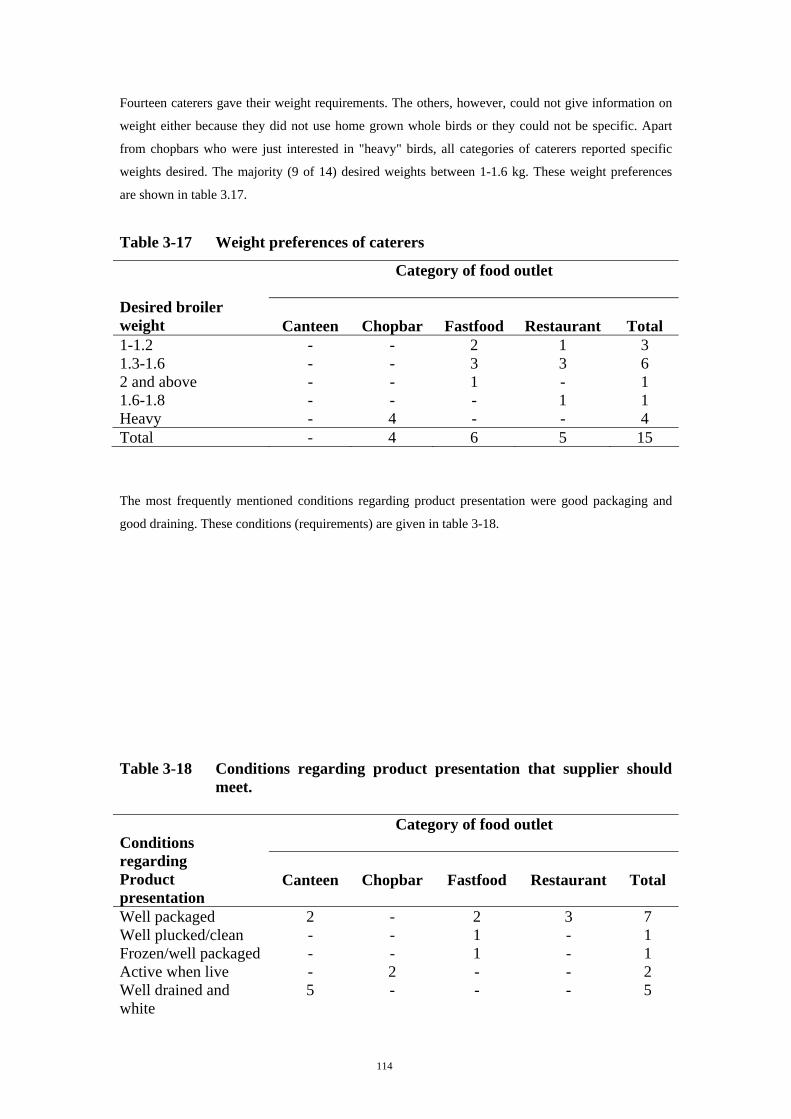
114
Fourteen caterers gave their weight requirements. The others, however, could not give information on
weight either because they did not use home grown whole birds or they could not be specific. Apart
from chopbars who were just interested in "heavy" birds, all categories of caterers reported specific
weights desired. The majority (9 of 14) desired weights between 1-1.6 kg. These weight preferences
are shown in table 3.17.
Table 3-17 Weight preferences of caterers
Category of food outlet
Desired broiler weight
Canteen
Chopbar
Fastfood
Restaurant
Total
1-1.2 - - 2 1 3 1.3-1.6 - - 3 3 6 2 and above - - 1 - 1 1.6-1.8 - - - 1 1 Heavy - 4 - - 4 Total - 4 6 5 15 The most frequently mentioned conditions regarding product presentation were good packaging and
good draining. These conditions (requirements) are given in table 3-18.
Table 3-18 Conditions regarding product presentation that supplier should meet.
Category of food outlet
Conditions regarding Product presentation
Canteen
Chopbar
Fastfood
Restaurant
Total
Well packaged 2 - 2 3 7 Well plucked/clean - - 1 - 1 Frozen/well packaged - - 1 - 1 Active when live - 2 - - 2 Well drained and white
5 - - - 5
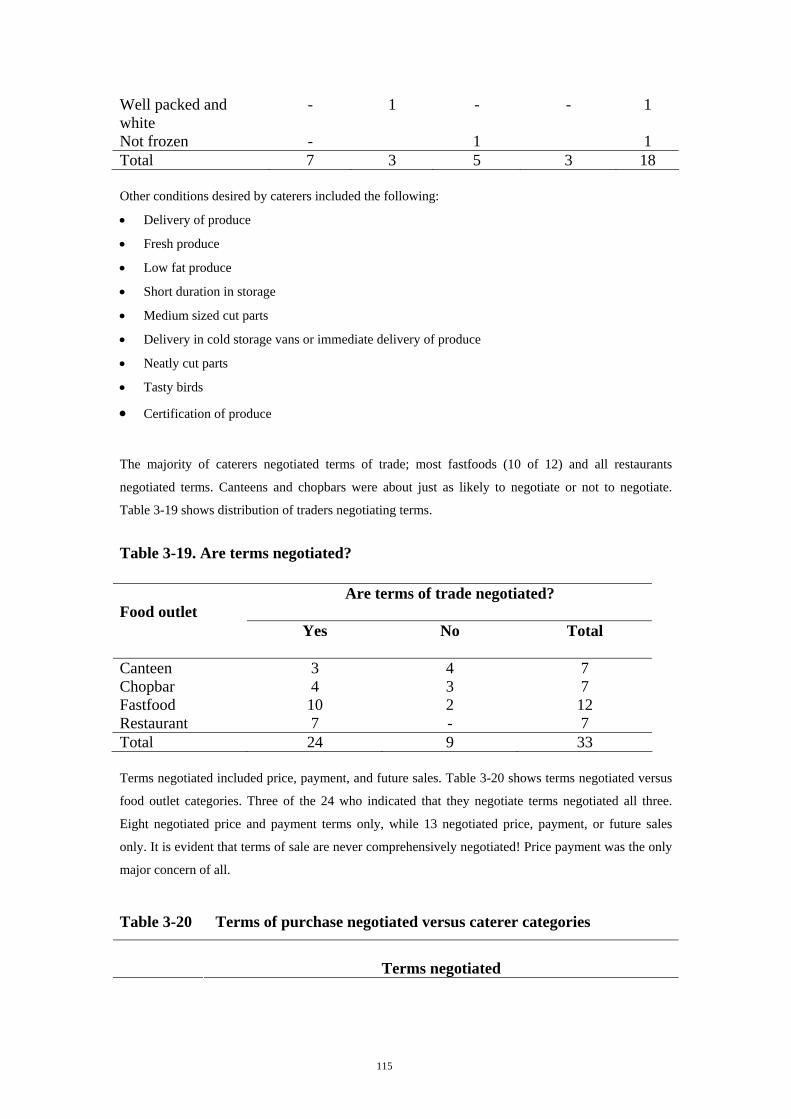
115
Well packed and white
- 1 - - 1
Not frozen - 1 1 Total 7 3 5 3 18 Other conditions desired by caterers included the following:
• Delivery of produce
• Fresh produce
• Low fat produce
• Short duration in storage
• Medium sized cut parts
• Delivery in cold storage vans or immediate delivery of produce
• Neatly cut parts
• Tasty birds
• Certification of produce The majority of caterers negotiated terms of trade; most fastfoods (10 of 12) and all restaurants
negotiated terms. Canteens and chopbars were about just as likely to negotiate or not to negotiate.
Table 3-19 shows distribution of traders negotiating terms.
Table 3-19. Are terms negotiated?
Are terms of trade negotiated?
Food outlet
Yes No Total
Canteen 3 4 7 Chopbar 4 3 7 Fastfood 10 2 12 Restaurant 7 - 7 Total 24 9 33 Terms negotiated included price, payment, and future sales. Table 3-20 shows terms negotiated versus
food outlet categories. Three of the 24 who indicated that they negotiate terms negotiated all three.
Eight negotiated price and payment terms only, while 13 negotiated price, payment, or future sales
only. It is evident that terms of sale are never comprehensively negotiated! Price payment was the only
major concern of all.
Table 3-20 Terms of purchase negotiated versus caterer categories
Terms negotiated
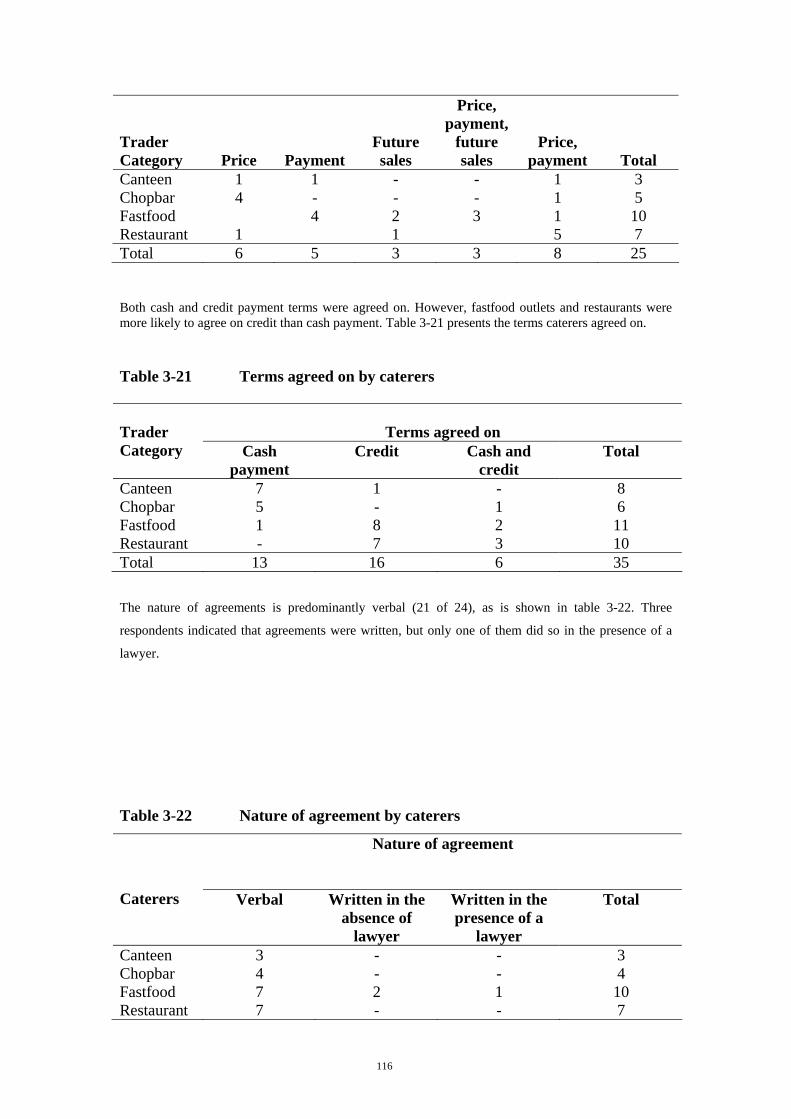
116
Trader Category
Price
Payment
Future sales
Price, payment,
future sales
Price, payment
Total Canteen 1 1 - - 1 3 Chopbar 4 - - - 1 5 Fastfood 4 2 3 1 10 Restaurant 1 1 5 7 Total 6 5 3 3 8 25 Both cash and credit payment terms were agreed on. However, fastfood outlets and restaurants were more likely to agree on credit than cash payment. Table 3-21 presents the terms caterers agreed on. Table 3-21 Terms agreed on by caterers
Terms agreed on
Trader Category Cash
payment Credit Cash and
credit Total
Canteen 7 1 - 8 Chopbar 5 - 1 6 Fastfood 1 8 2 11 Restaurant - 7 3 10 Total 13 16 6 35 The nature of agreements is predominantly verbal (21 of 24), as is shown in table 3-22. Three
respondents indicated that agreements were written, but only one of them did so in the presence of a
lawyer.
Table 3-22 Nature of agreement by caterers
Nature of agreement
Caterers Verbal Written in the
absence of lawyer
Written in the presence of a
lawyer
Total
Canteen 3 - - 3 Chopbar 4 - - 4 Fastfood 7 2 1 10 Restaurant 7 - - 7
117
Total 21 2 1 24 3.3 Consumers
3.3.1 Consumption
Consumption was measured in terms of frequencies of poultry meat purchases and actual quantities
purchased. Generally, respondents found it difficult to recall frequencies of purchases and the
quantities involved. However, more people could state the frequencies of purchase than quantities
purchased.
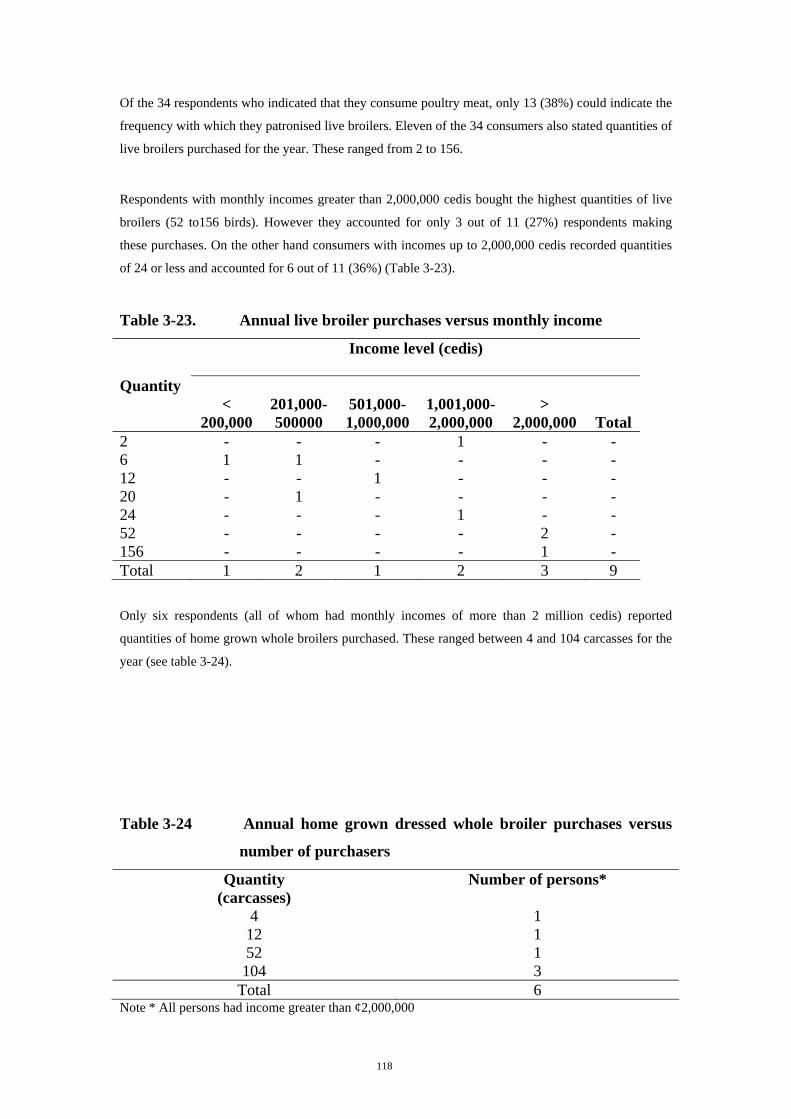
118
Of the 34 respondents who indicated that they consume poultry meat, only 13 (38%) could indicate the
frequency with which they patronised live broilers. Eleven of the 34 consumers also stated quantities of
live broilers purchased for the year. These ranged from 2 to 156. Respondents with monthly incomes greater than 2,000,000 cedis bought the highest quantities of live
broilers (52 to156 birds). However they accounted for only 3 out of 11 (27%) respondents making
these purchases. On the other hand consumers with incomes up to 2,000,000 cedis recorded quantities
of 24 or less and accounted for 6 out of 11 (36%) (Table 3-23).
Table 3-23. Annual live broiler purchases versus monthly income Income level (cedis)
Quantity
< 200,000
201,000-500000
501,000-1,000,000
1,001,000-2,000,000
>
2,000,000
Total 2 - - - 1 - - 6 1 1 - - - - 12 - - 1 - - - 20 - 1 - - - - 24 - - - 1 - - 52 - - - - 2 - 156 - - - - 1 - Total 1 2 1 2 3 9 Only six respondents (all of whom had monthly incomes of more than 2 million cedis) reported
quantities of home grown whole broilers purchased. These ranged between 4 and 104 carcasses for the
year (see table 3-24).
Table 3-24 Annual home grown dressed whole broiler purchases versus
number of purchasers
Quantity (carcasses)
Number of persons*
4 1 12 1 52 1 104 3
Total 6 Note * All persons had income greater than ¢2,000,000
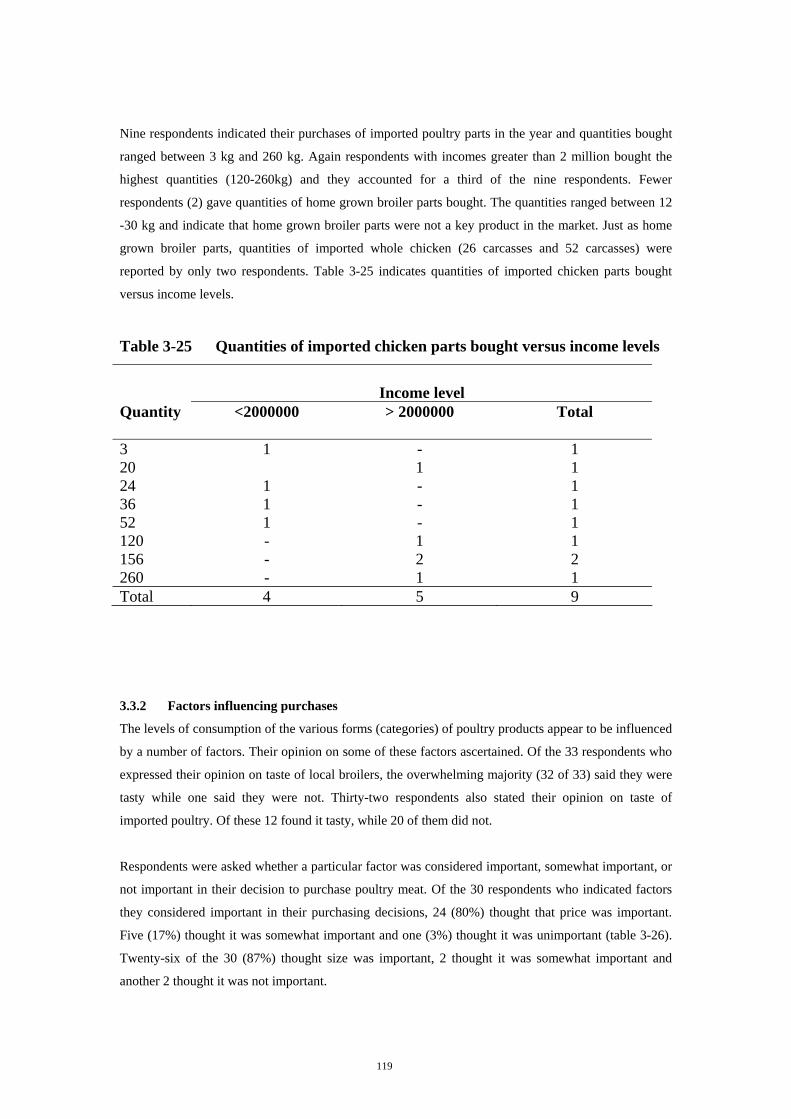
119
Nine respondents indicated their purchases of imported poultry parts in the year and quantities bought
ranged between 3 kg and 260 kg. Again respondents with incomes greater than 2 million bought the
highest quantities (120-260kg) and they accounted for a third of the nine respondents. Fewer
respondents (2) gave quantities of home grown broiler parts bought. The quantities ranged between 12
-30 kg and indicate that home grown broiler parts were not a key product in the market. Just as home
grown broiler parts, quantities of imported whole chicken (26 carcasses and 52 carcasses) were
reported by only two respondents. Table 3-25 indicates quantities of imported chicken parts bought
versus income levels.
Table 3-25 Quantities of imported chicken parts bought versus income levels
Income level
Quantity <2000000
> 2000000 Total
3 1 - 1 20 1 1 24 1 - 1 36 1 - 1 52 1 - 1 120 - 1 1 156 - 2 2 260 - 1 1 Total 4 5 9 3.3.2 Factors influencing purchases
The levels of consumption of the various forms (categories) of poultry products appear to be influenced
by a number of factors. Their opinion on some of these factors ascertained. Of the 33 respondents who
expressed their opinion on taste of local broilers, the overwhelming majority (32 of 33) said they were
tasty while one said they were not. Thirty-two respondents also stated their opinion on taste of
imported poultry. Of these 12 found it tasty, while 20 of them did not.
Respondents were asked whether a particular factor was considered important, somewhat important, or
not important in their decision to purchase poultry meat. Of the 30 respondents who indicated factors
they considered important in their purchasing decisions, 24 (80%) thought that price was important.
Five (17%) thought it was somewhat important and one (3%) thought it was unimportant (table 3-26).
Twenty-six of the 30 (87%) thought size was important, 2 thought it was somewhat important and
another 2 thought it was not important.
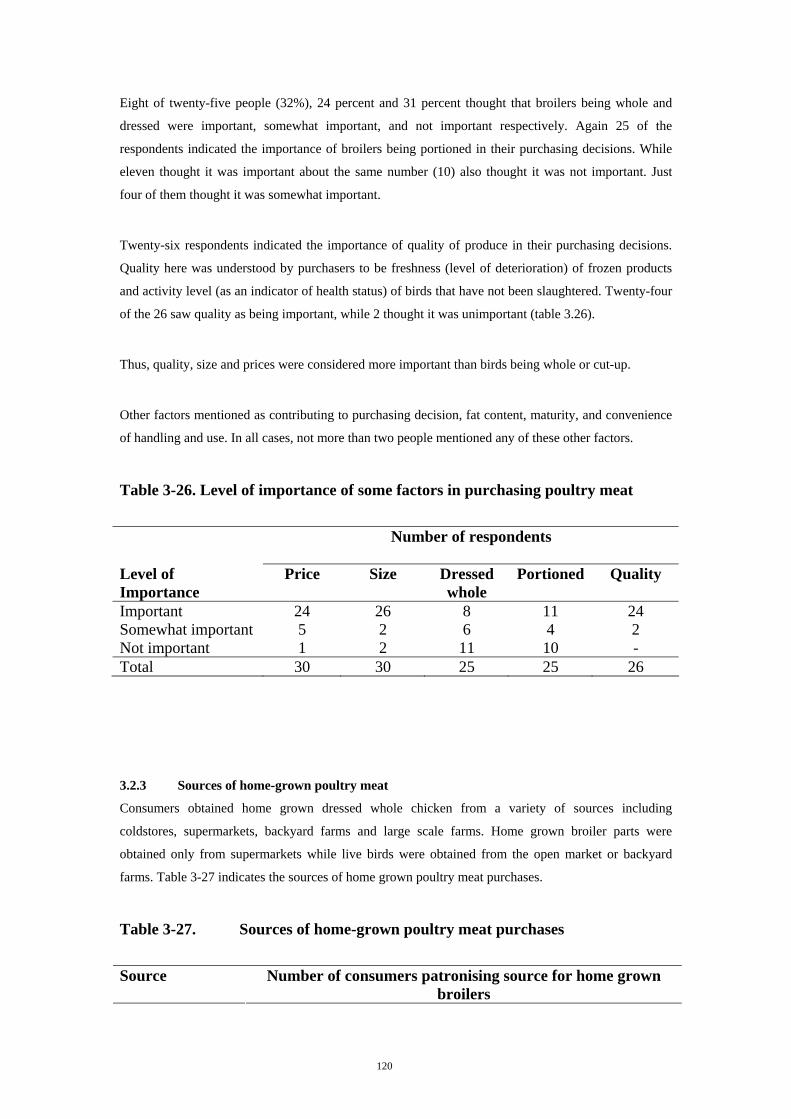
120
Eight of twenty-five people (32%), 24 percent and 31 percent thought that broilers being whole and
dressed were important, somewhat important, and not important respectively. Again 25 of the
respondents indicated the importance of broilers being portioned in their purchasing decisions. While
eleven thought it was important about the same number (10) also thought it was not important. Just
four of them thought it was somewhat important.
Twenty-six respondents indicated the importance of quality of produce in their purchasing decisions.
Quality here was understood by purchasers to be freshness (level of deterioration) of frozen products
and activity level (as an indicator of health status) of birds that have not been slaughtered. Twenty-four
of the 26 saw quality as being important, while 2 thought it was unimportant (table 3.26).
Thus, quality, size and prices were considered more important than birds being whole or cut-up.
Other factors mentioned as contributing to purchasing decision, fat content, maturity, and convenience
of handling and use. In all cases, not more than two people mentioned any of these other factors.
Table 3-26. Level of importance of some factors in purchasing poultry meat
Number of respondents
Level of Importance
Price Size Dressed whole
Portioned Quality
Important 24 26 8 11 24 Somewhat important 5 2 6 4 2 Not important 1 2 11 10 - Total 30 30 25 25 26
3.2.3 Sources of home-grown poultry meat
Consumers obtained home grown dressed whole chicken from a variety of sources including
coldstores, supermarkets, backyard farms and large scale farms. Home grown broiler parts were
obtained only from supermarkets while live birds were obtained from the open market or backyard
farms. Table 3-27 indicates the sources of home grown poultry meat purchases.
Table 3-27. Sources of home-grown poultry meat purchases
Source Number of consumers patronising source for home grown
broilers
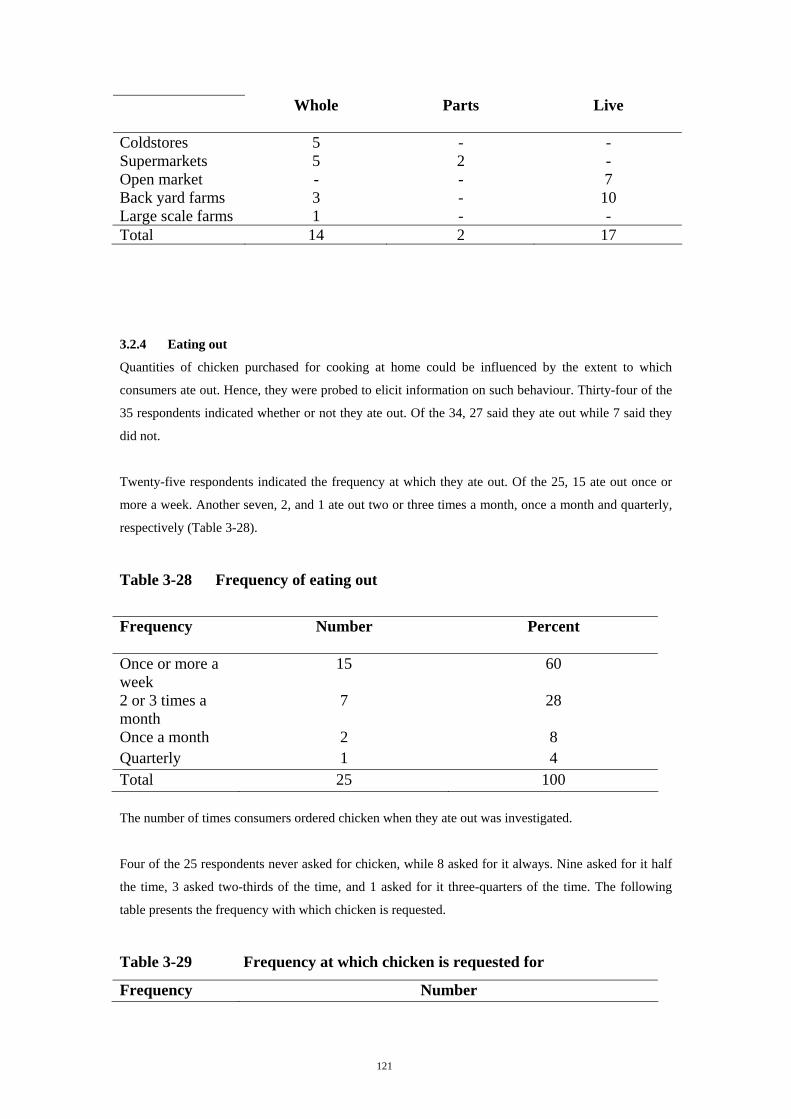
121
Whole Parts Live
Coldstores 5 - - Supermarkets 5 2 - Open market - - 7 Back yard farms 3 - 10 Large scale farms 1 - - Total 14 2 17 3.2.4 Eating out
Quantities of chicken purchased for cooking at home could be influenced by the extent to which
consumers ate out. Hence, they were probed to elicit information on such behaviour. Thirty-four of the
35 respondents indicated whether or not they ate out. Of the 34, 27 said they ate out while 7 said they
did not.
Twenty-five respondents indicated the frequency at which they ate out. Of the 25, 15 ate out once or
more a week. Another seven, 2, and 1 ate out two or three times a month, once a month and quarterly,
respectively (Table 3-28).
Table 3-28 Frequency of eating out
Frequency Number Percent
Once or more a week
15 60
2 or 3 times a month
7 28
Once a month 2 8 Quarterly 1 4 Total 25 100 The number of times consumers ordered chicken when they ate out was investigated.
Four of the 25 respondents never asked for chicken, while 8 asked for it always. Nine asked for it half
the time, 3 asked two-thirds of the time, and 1 asked for it three-quarters of the time. The following
table presents the frequency with which chicken is requested.
Table 3-29 Frequency at which chicken is requested for
Frequency Number
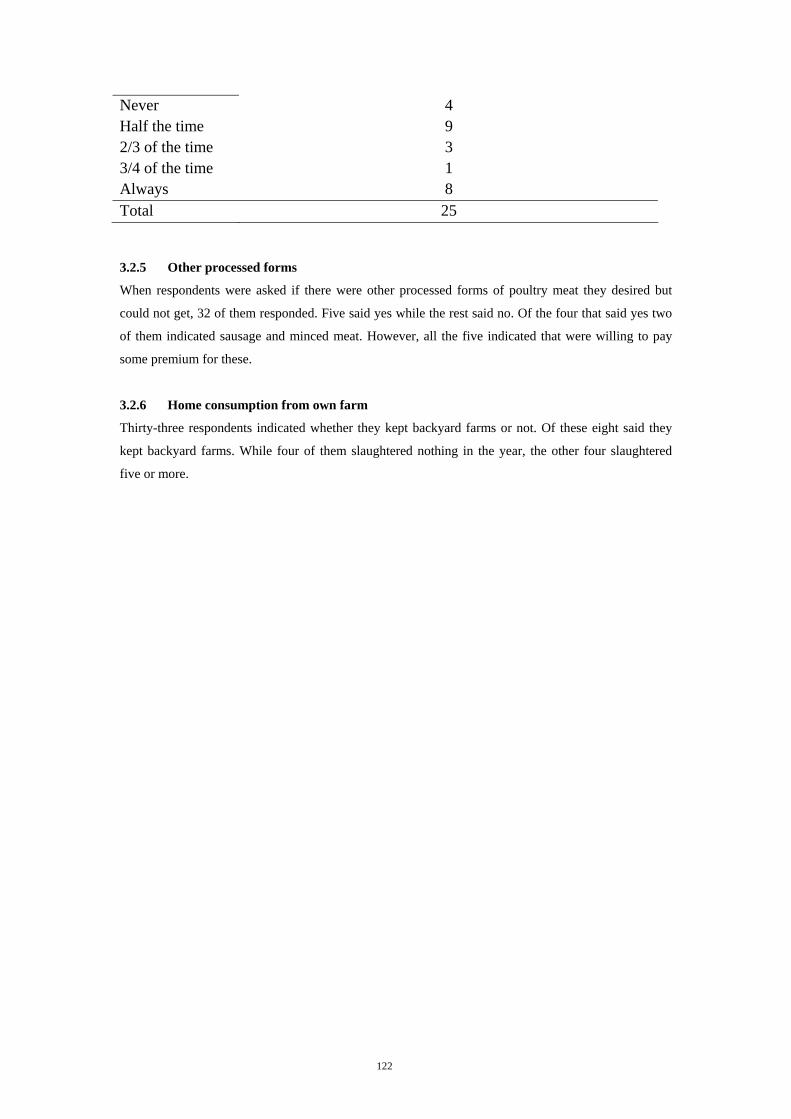
122
Never 4 Half the time 9 2/3 of the time 3 3/4 of the time 1 Always 8 Total 25 3.2.5 Other processed forms
When respondents were asked if there were other processed forms of poultry meat they desired but
could not get, 32 of them responded. Five said yes while the rest said no. Of the four that said yes two
of them indicated sausage and minced meat. However, all the five indicated that were willing to pay
some premium for these.
3.2.6 Home consumption from own farm
Thirty-three respondents indicated whether they kept backyard farms or not. Of these eight said they
kept backyard farms. While four of them slaughtered nothing in the year, the other four slaughtered
five or more.

123

124

124
Smallscale Poultry Broiler Production In Peri-Urban Areas
Of Ghana And The Potential Of Business Management
Methods For Improved Management
125
1. Introduction and objectives
The objectives of the research are as follows:
1. Compare management practices undertaken and assess the transferability of practices
2. Identify, develop and test practical business planning methods and monitoring indicators.
3. Investigate the potential of practical business planning methods as a means of facilitating
extension i.e. of enabling interaction and communication between field extension staff and
broiler producers.
2. Methodology
Business planning methods called Participatory Budgets were adapted for use with poultry enterprises.
Two longitudinal studies of broiler producers were conducted using these methods. Analysis of the first
longitudinal study together with feedback from field staff enabled practical management practices to be
identified. The second longitudinal survey enabled: the transferability of practical management
practices to be explored; the use of business planning methods as a means of facilitating extension and
communication to be investigated; and the business planning and monitoring methods to be evaluated.
Broiler production for the Christmas market was focused on as it forms a large proportion of poultry
keepers in peri-urban areas. Okantah et al (2003) found that 56% of poultry keepers in peri-urban
Accra and Kumasi produced broilers and almost all of these timed production to coincide with the
major festive seasons. Production by farmers over the same period of time was necessary for the two
longitudinal studies and egg producers start much longer production cycles and at different times.
2.1 Longitudinal survey 1
The first longitudinal survey was conducted between September and December 2001 and focused on
smallscale producers of broilers for the Christmas market in four districts near or in Accra: Awutu-
Efutu-Senya; Gomoa; Ga; and Tema; and one district near Kumasi i.e. Sekyere West. With the help of
Agricultural Extension Officers (AEOs) and Research Technical Officers (TOs) in the districts, 69
producers were identified who were willing to participate without receiving technical or financial
assistance.
AEOs and TOs were trained in the use of Participatory Budgeting (see section 3) for poultry
production. Participating broiler producers were met to explain the exercise and then visited fortnightly
throughout the production period. On each visit AEOs and TOs used the Participatory Budget
framework that had been agreed in the training sessions to record the following for each week of
production:
126
• Activities undertaken since last visit
• Inputs used for the activities including quantities
• Costs of each of the inputs
• Outputs i.e. quantities and prices
• Any interesting or unusual broiler producing practices.
Whilst AEOs and TOs asked producers the reasons for particular results e.g. sudden high rates of
mortality, they gave no training or assistance during this first longitudinal survey. Budgets were only
given to, and discussed with, the producers after the production period, in order to avoid influencing
their decisions.
Information obtained from producers was inputted using Excel and analysed to identify and compare
performance in terms of profitability and to explore reasons for differences e.g. in management
practices. Comparative Analysis was conducted to compare the economic and production performances
of more and less successful producers. Comparative Analysis is a widely used approach and is “the
comparison of the performance level of a farm business to the performance level of other similar farms
in the same area, or to other established standards” (Kay, Edwards and Duffy, 2004). In addition AEOs
and TOs were asked to suggest reasons for some farmers performing better including husbandry
practices.
2.2 Longitudinal survey 2
The second longitudinal survey was conducted the following year, again to coincide with broiler
production for the Christmas market (September to December 2002). Summary findings and results
from the first survey were presented to and discussed with producers, AEOs and TOs at the start of the
Christmas broiler production period. In addition to recording data AEOs and TOs had been asked in the
2001 survey to observe farmers’ management practices and to identify any reasons for better/worse
performance and which could be transferred to and implemented in the following season. The
following practices were identified by AEOs and TOs:
• Reducing wastage of feed. Feed little and often rather than twice per day to reduce spoilage.
• Implementing a vaccination programme, including planning and purchasing of the necessary
vaccines at the appropriate times.
• Increasing the frequency of litter changes to reduce disease incidence.
• Improving marketing through e.g. timing of sales, seeking better prices.
Producers identified practices they wished to consider trying and constructed Participatory Budgets
with AEOs and TOs to explore and plan the next production period for their individual production
units.
127
AEOs and TOs then visited producers weekly to assist with: recording information (on the same factors
listed above for longitudinal survey 1) onto Participatory Budgets; comparing them with their planed
budgets; making adjustments to plans; and to provide extension support and advice. Final Participatory
Budgets were completed at the end of the production period with farmers, discussed and then inputted
into Excel for analysis as for longitudinal survey 1.
2.3 Identification, development and evaluation of business planning methods
A research project funded by DFID’s Natural Resources Systems Programme (Project no. R6730)
developed and tested Participatory Budgeting as a farm management method for use by or with
smallholder farmers in developing countries (Galpin et al 2000; Dorward et al 2003). This builds on
concepts from both farm management and Participatory Learning and Action to provide a practical
method that can be used to assist with planning, decision making and control1.
Participatory Budgets (PBs) had successfully been tested and used in Ghana in project R6730 but
mainly with fairly complex cropping systems. At an early stage in project R7631 PBs were used with
layer and broiler producers in Accra to assess their suitability. In addition the training of AEOs and
TOs involved use of PBs with farmers over two days in two districts and enabled some minor
adaptations to be made.
Following longitudinal survey 1, AEOs and TOs were asked for feedback on the use of the PBs for
recording and minor changes were made before they were used for a variety of purposes in longitudinal
survey 2. Farmers as well as AEOs and TOs were asked for feedback (in focus group discussions) on
the PBs following longitudinal survey 2 and prior to production of a final PB format and
guidance notes for dissemination (see Aboe and Dorward, 2003).
2.4 Investigation of the use of business planning methods as a means of
facilitating extension and communication Business planning methods should help farmers in their decision making by assisting with: planning the
next production period; considering the consequences of alternative activities, strategies or even
enterprises (in terms of e.g. resources required and timing); and in considering the effects of
unexpected changes (eg prices) during production and how best to respond. Effective extension should
involve providing farmers with information, techniques etc. relevant to their farming systems and
1 PBs can also be used for identifying constraints and for designing and conducting participatory research.
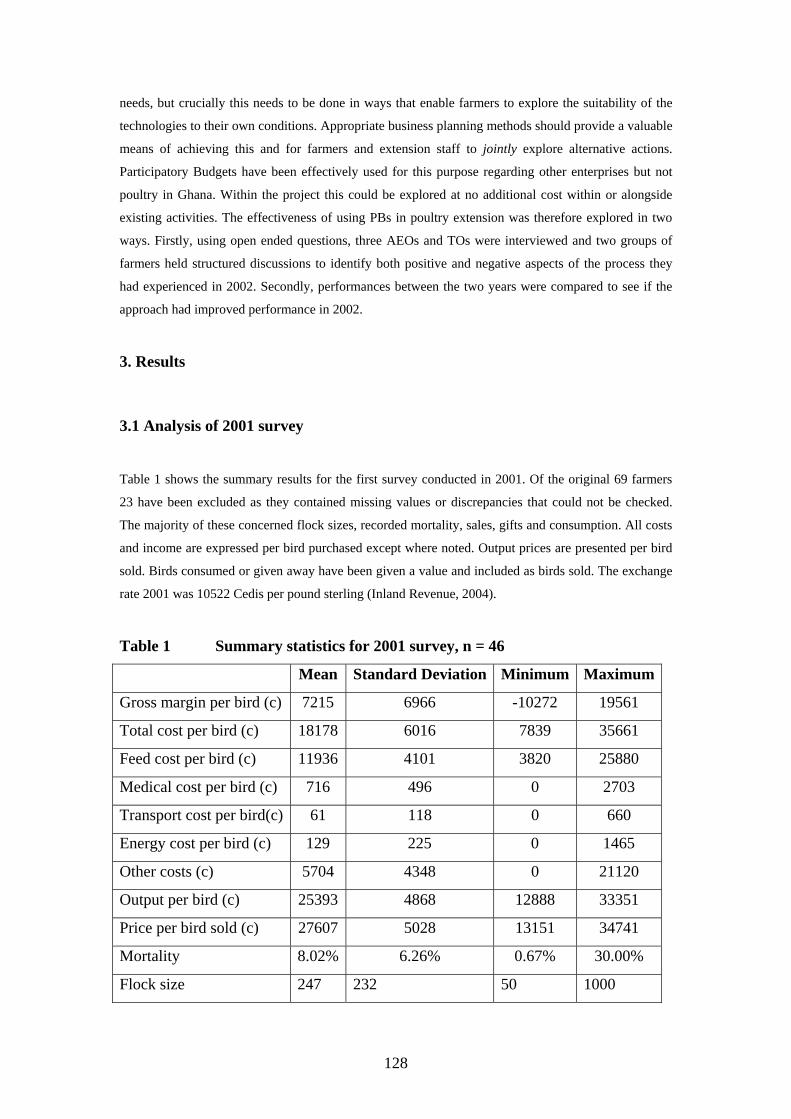
128
needs, but crucially this needs to be done in ways that enable farmers to explore the suitability of the
technologies to their own conditions. Appropriate business planning methods should provide a valuable
means of achieving this and for farmers and extension staff to jointly explore alternative actions.
Participatory Budgets have been effectively used for this purpose regarding other enterprises but not
poultry in Ghana. Within the project this could be explored at no additional cost within or alongside
existing activities. The effectiveness of using PBs in poultry extension was therefore explored in two
ways. Firstly, using open ended questions, three AEOs and TOs were interviewed and two groups of
farmers held structured discussions to identify both positive and negative aspects of the process they
had experienced in 2002. Secondly, performances between the two years were compared to see if the
approach had improved performance in 2002.
3. Results
3.1 Analysis of 2001 survey
Table 1 shows the summary results for the first survey conducted in 2001. Of the original 69 farmers
23 have been excluded as they contained missing values or discrepancies that could not be checked.
The majority of these concerned flock sizes, recorded mortality, sales, gifts and consumption. All costs
and income are expressed per bird purchased except where noted. Output prices are presented per bird
sold. Birds consumed or given away have been given a value and included as birds sold. The exchange
rate 2001 was 10522 Cedis per pound sterling (Inland Revenue, 2004).
Table 1 Summary statistics for 2001 survey, n = 46
Mean Standard Deviation Minimum Maximum
Gross margin per bird (c) 7215 6966 -10272 19561
Total cost per bird (c) 18178 6016 7839 35661
Feed cost per bird (c) 11936 4101 3820 25880
Medical cost per bird (c) 716 496 0 2703
Transport cost per bird(c) 61 118 0 660
Energy cost per bird (c) 129 225 0 1465
Other costs (c) 5704 4348 0 21120
Output per bird (c) 25393 4868 12888 33351
Price per bird sold (c) 27607 5028 13151 34741
Mortality 8.02% 6.26% 0.67% 30.00%
Flock size 247 232 50 1000
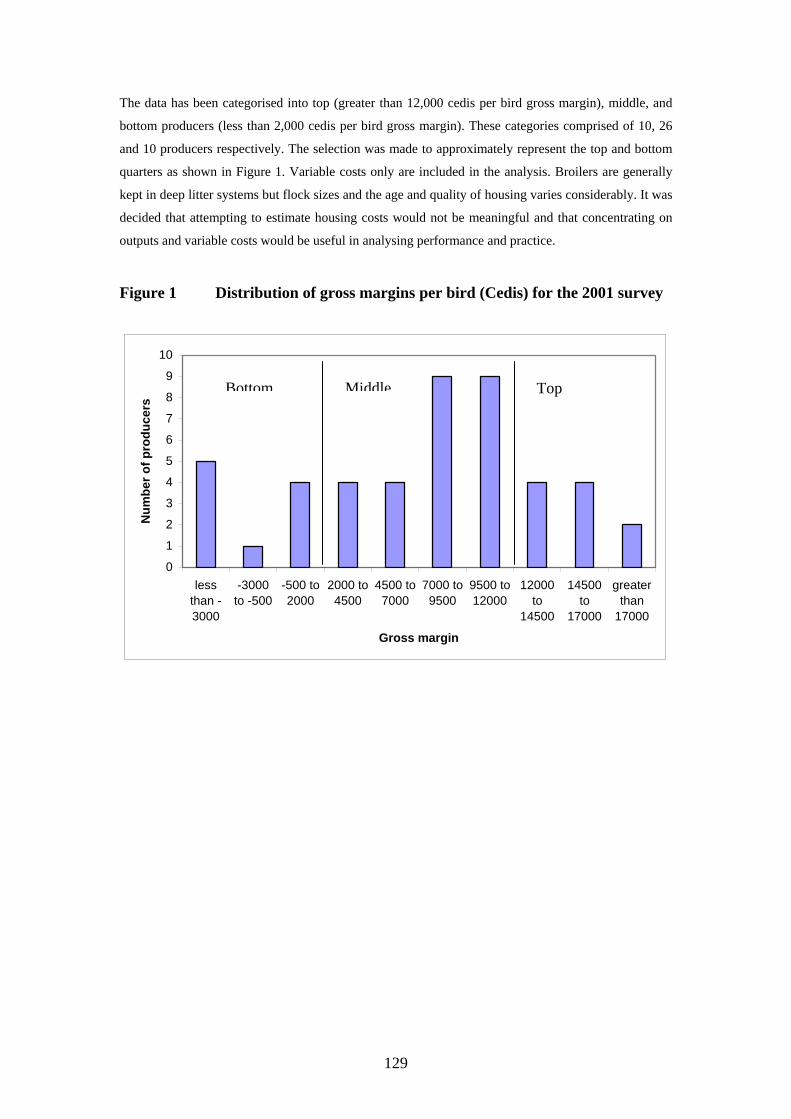
129
The data has been categorised into top (greater than 12,000 cedis per bird gross margin), middle, and
bottom producers (less than 2,000 cedis per bird gross margin). These categories comprised of 10, 26
and 10 producers respectively. The selection was made to approximately represent the top and bottom
quarters as shown in Figure 1. Variable costs only are included in the analysis. Broilers are generally
kept in deep litter systems but flock sizes and the age and quality of housing varies considerably. It was
decided that attempting to estimate housing costs would not be meaningful and that concentrating on
outputs and variable costs would be useful in analysing performance and practice.
Figure 1 Distribution of gross margins per bird (Cedis) for the 2001 survey
0
1
2
3
4
5
6
7
8
9
10
lessthan -3000
-3000to -500
-500 to2000
2000 to4500
4500 to7000
7000 to9500
9500 to12000
12000to
14500
14500to
17000
greaterthan
17000
Gross margin
Num
ber o
f pro
duce
rs
Bottom Middle Top
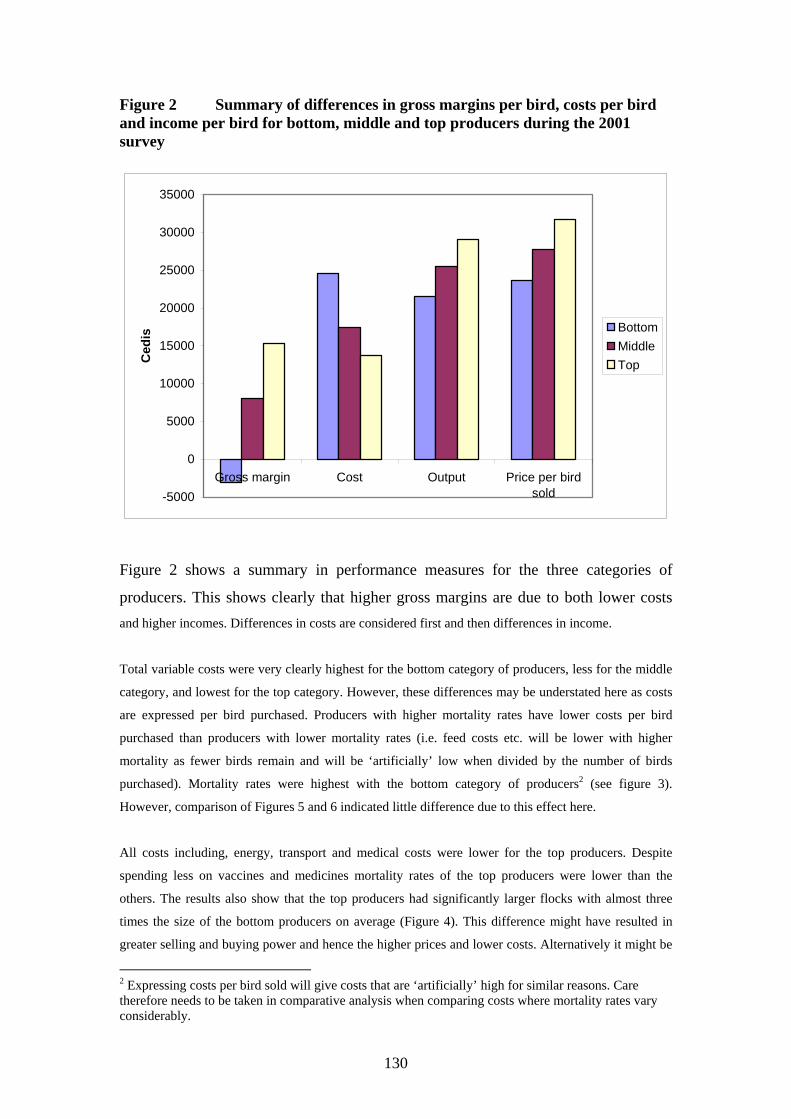
130
Figure 2 Summary of differences in gross margins per bird, costs per bird and income per bird for bottom, middle and top producers during the 2001 survey
-5000
0
5000
10000
15000
20000
25000
30000
35000
Gross margin Cost Output Price per birdsold
Ced
is BottomMiddleTop
Figure 2 shows a summary in performance measures for the three categories of
producers. This shows clearly that higher gross margins are due to both lower costs and higher incomes. Differences in costs are considered first and then differences in income.
Total variable costs were very clearly highest for the bottom category of producers, less for the middle
category, and lowest for the top category. However, these differences may be understated here as costs
are expressed per bird purchased. Producers with higher mortality rates have lower costs per bird
purchased than producers with lower mortality rates (i.e. feed costs etc. will be lower with higher
mortality as fewer birds remain and will be ‘artificially’ low when divided by the number of birds
purchased). Mortality rates were highest with the bottom category of producers2 (see figure 3).
However, comparison of Figures 5 and 6 indicated little difference due to this effect here.
All costs including, energy, transport and medical costs were lower for the top producers. Despite
spending less on vaccines and medicines mortality rates of the top producers were lower than the
others. The results also show that the top producers had significantly larger flocks with almost three
times the size of the bottom producers on average (Figure 4). This difference might have resulted in
greater selling and buying power and hence the higher prices and lower costs. Alternatively it might be
2 Expressing costs per bird sold will give costs that are ‘artificially’ high for similar reasons. Care therefore needs to be taken in comparative analysis when comparing costs where mortality rates vary considerably.
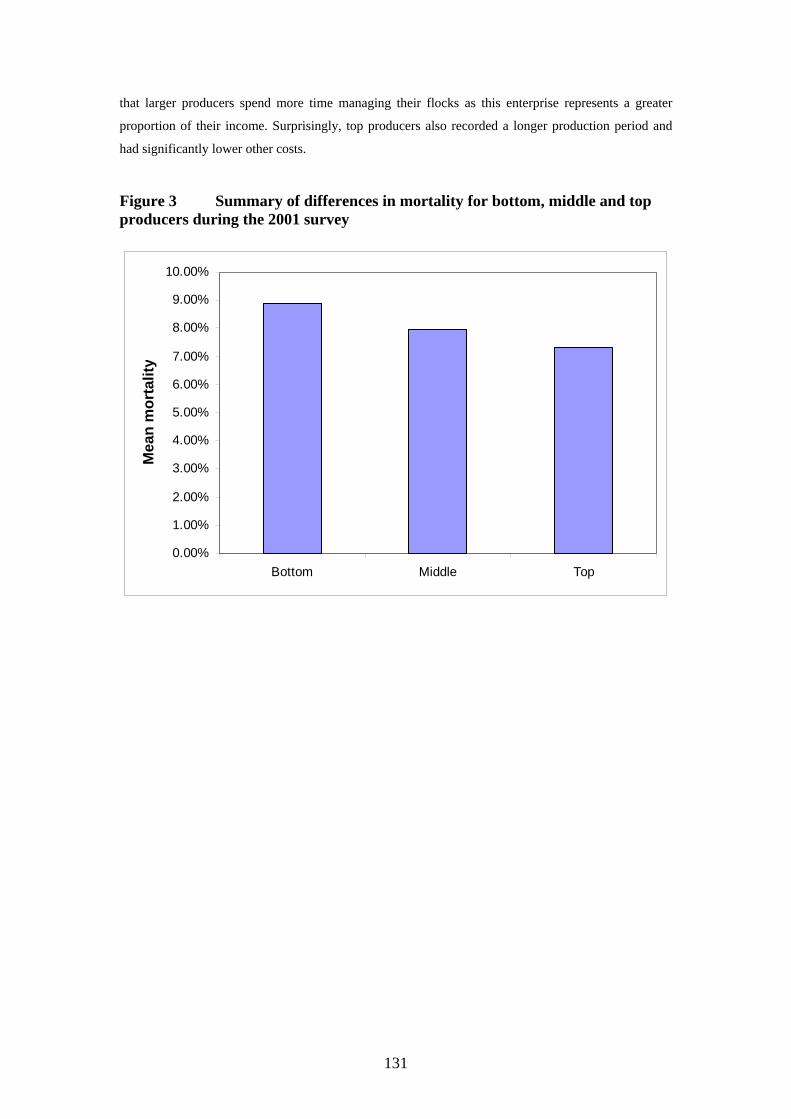
131
that larger producers spend more time managing their flocks as this enterprise represents a greater
proportion of their income. Surprisingly, top producers also recorded a longer production period and
had significantly lower other costs.
Figure 3 Summary of differences in mortality for bottom, middle and top producers during the 2001 survey
0.00%
1.00%
2.00%
3.00%
4.00%
5.00%
6.00%
7.00%
8.00%
9.00%
10.00%
Bottom Middle Top
Mea
n m
orta
lity
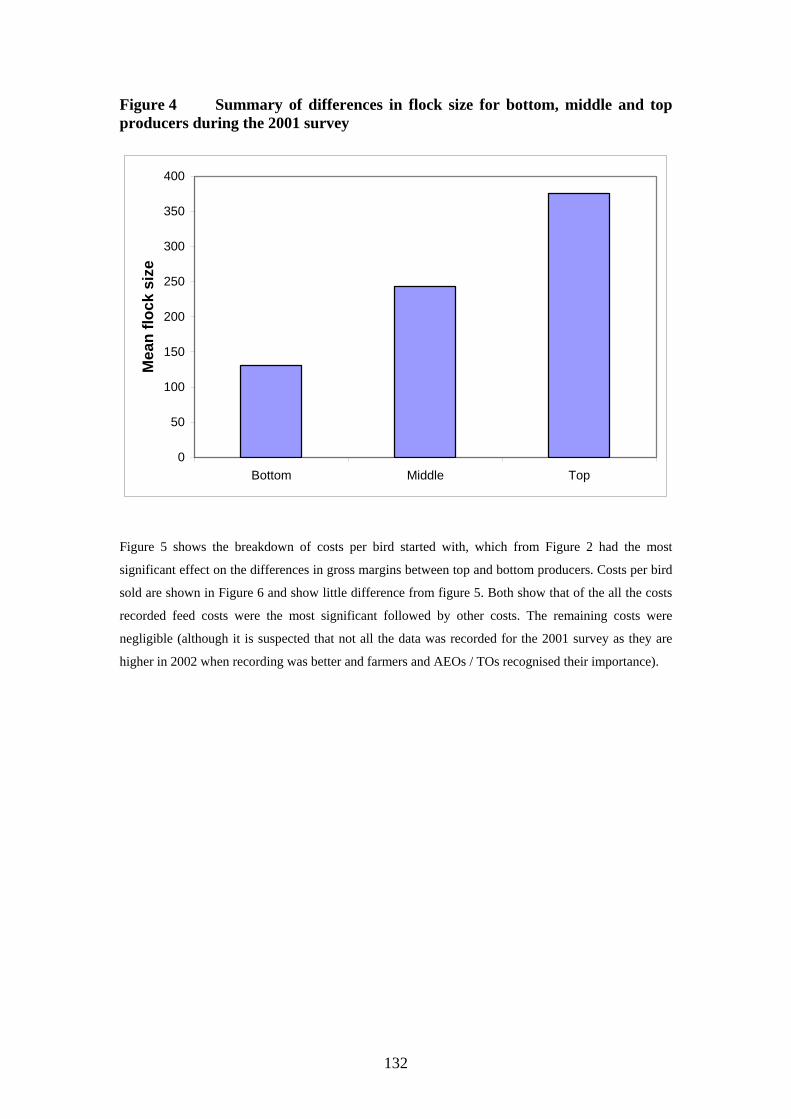
132
Figure 4 Summary of differences in flock size for bottom, middle and top producers during the 2001 survey
0
50
100
150
200
250
300
350
400
Bottom Middle Top
Mea
n flo
ck s
ize
Figure 5 shows the breakdown of costs per bird started with, which from Figure 2 had the most
significant effect on the differences in gross margins between top and bottom producers. Costs per bird
sold are shown in Figure 6 and show little difference from figure 5. Both show that of the all the costs
recorded feed costs were the most significant followed by other costs. The remaining costs were
negligible (although it is suspected that not all the data was recorded for the 2001 survey as they are
higher in 2002 when recording was better and farmers and AEOs / TOs recognised their importance).
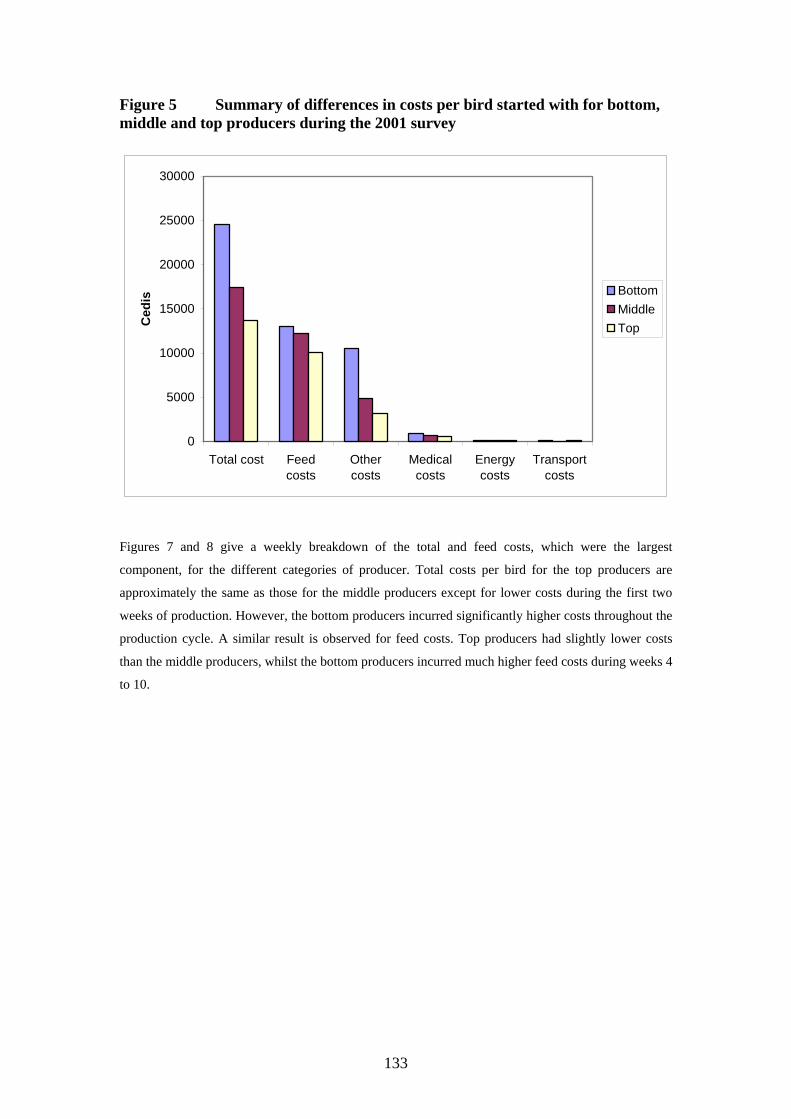
133
Figure 5 Summary of differences in costs per bird started with for bottom, middle and top producers during the 2001 survey
0
5000
10000
15000
20000
25000
30000
Total cost Feedcosts
Othercosts
Medicalcosts
Energycosts
Transportcosts
Ced
is BottomMiddleTop
Figures 7 and 8 give a weekly breakdown of the total and feed costs, which were the largest
component, for the different categories of producer. Total costs per bird for the top producers are
approximately the same as those for the middle producers except for lower costs during the first two
weeks of production. However, the bottom producers incurred significantly higher costs throughout the
production cycle. A similar result is observed for feed costs. Top producers had slightly lower costs
than the middle producers, whilst the bottom producers incurred much higher feed costs during weeks 4
to 10.
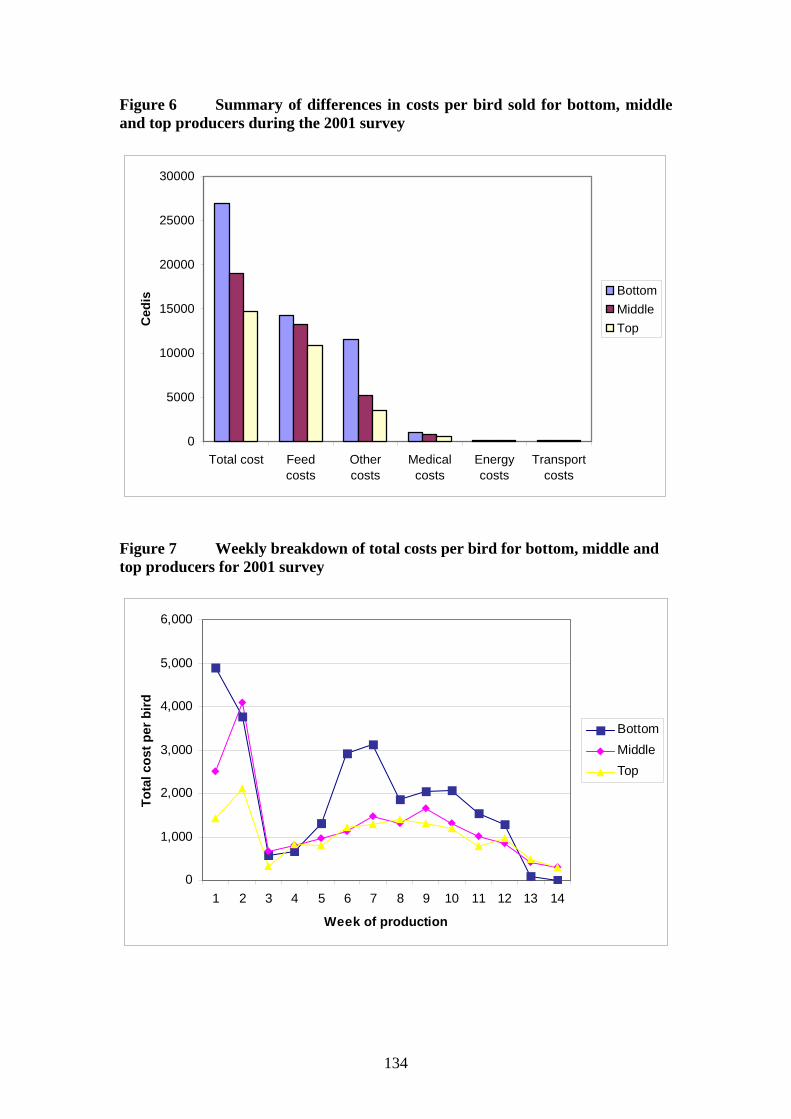
134
Figure 6 Summary of differences in costs per bird sold for bottom, middle and top producers during the 2001 survey
0
5000
10000
15000
20000
25000
30000
Total cost Feedcosts
Othercosts
Medicalcosts
Energycosts
Transportcosts
Ced
is BottomMiddleTop
Figure 7 Weekly breakdown of total costs per bird for bottom, middle and top producers for 2001 survey
0
1,000
2,000
3,000
4,000
5,000
6,000
1 2 3 4 5 6 7 8 9 10 11 12 13 14
Week of production
Tota
l cos
t per
bird
BottomMiddleTop
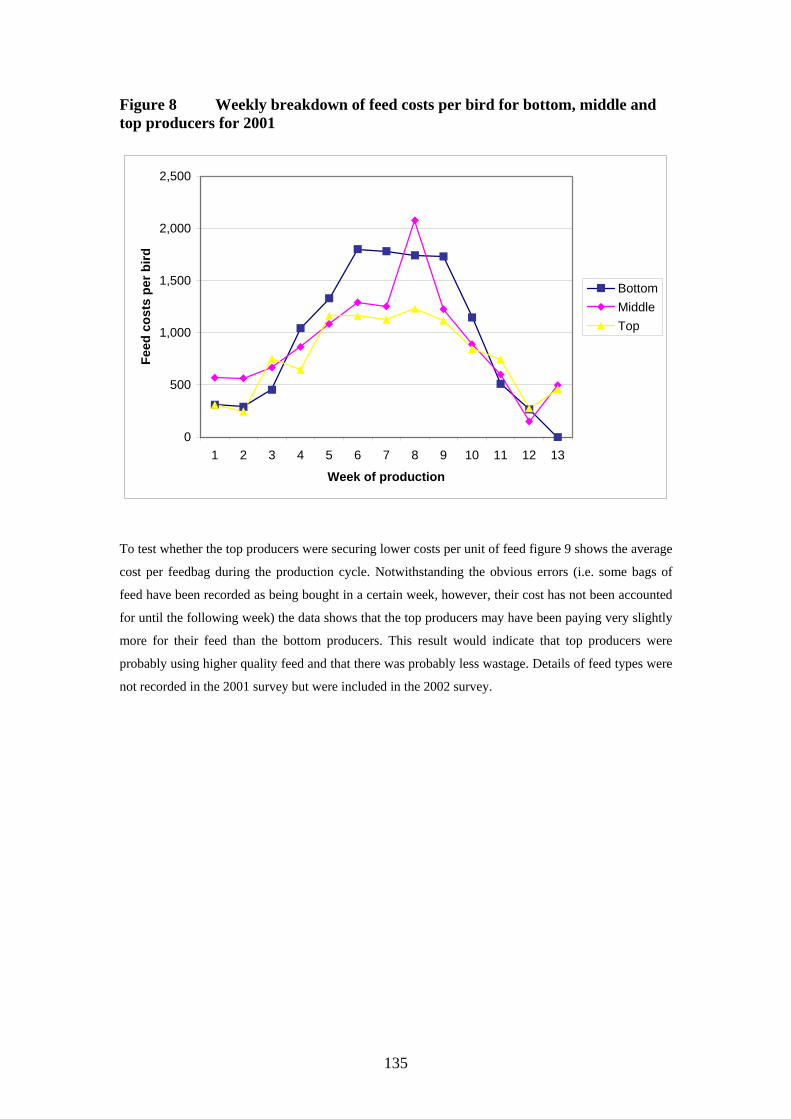
135
Figure 8 Weekly breakdown of feed costs per bird for bottom, middle and top producers for 2001
0
500
1,000
1,500
2,000
2,500
1 2 3 4 5 6 7 8 9 10 11 12 13
Week of production
Feed
cos
ts p
er b
ird
BottomMiddleTop
To test whether the top producers were securing lower costs per unit of feed figure 9 shows the average
cost per feedbag during the production cycle. Notwithstanding the obvious errors (i.e. some bags of
feed have been recorded as being bought in a certain week, however, their cost has not been accounted
for until the following week) the data shows that the top producers may have been paying very slightly
more for their feed than the bottom producers. This result would indicate that top producers were
probably using higher quality feed and that there was probably less wastage. Details of feed types were
not recorded in the 2001 survey but were included in the 2002 survey.
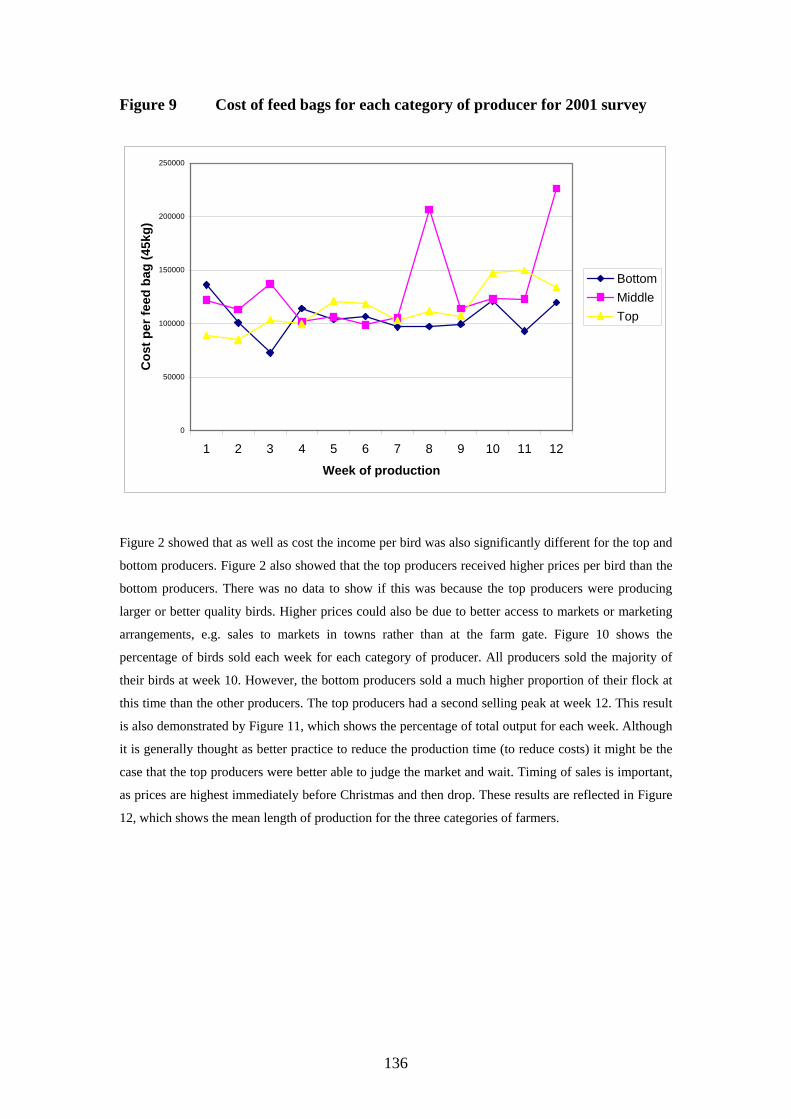
136
Figure 9 Cost of feed bags for each category of producer for 2001 survey
0
50000
100000
150000
200000
250000
1 2 3 4 5 6 7 8 9 10 11 12
Week of production
Cos
t per
feed
bag
(45k
g)
BottomMiddleTop
Figure 2 showed that as well as cost the income per bird was also significantly different for the top and
bottom producers. Figure 2 also showed that the top producers received higher prices per bird than the
bottom producers. There was no data to show if this was because the top producers were producing
larger or better quality birds. Higher prices could also be due to better access to markets or marketing
arrangements, e.g. sales to markets in towns rather than at the farm gate. Figure 10 shows the
percentage of birds sold each week for each category of producer. All producers sold the majority of
their birds at week 10. However, the bottom producers sold a much higher proportion of their flock at
this time than the other producers. The top producers had a second selling peak at week 12. This result
is also demonstrated by Figure 11, which shows the percentage of total output for each week. Although
it is generally thought as better practice to reduce the production time (to reduce costs) it might be the
case that the top producers were better able to judge the market and wait. Timing of sales is important,
as prices are highest immediately before Christmas and then drop. These results are reflected in Figure
12, which shows the mean length of production for the three categories of farmers.
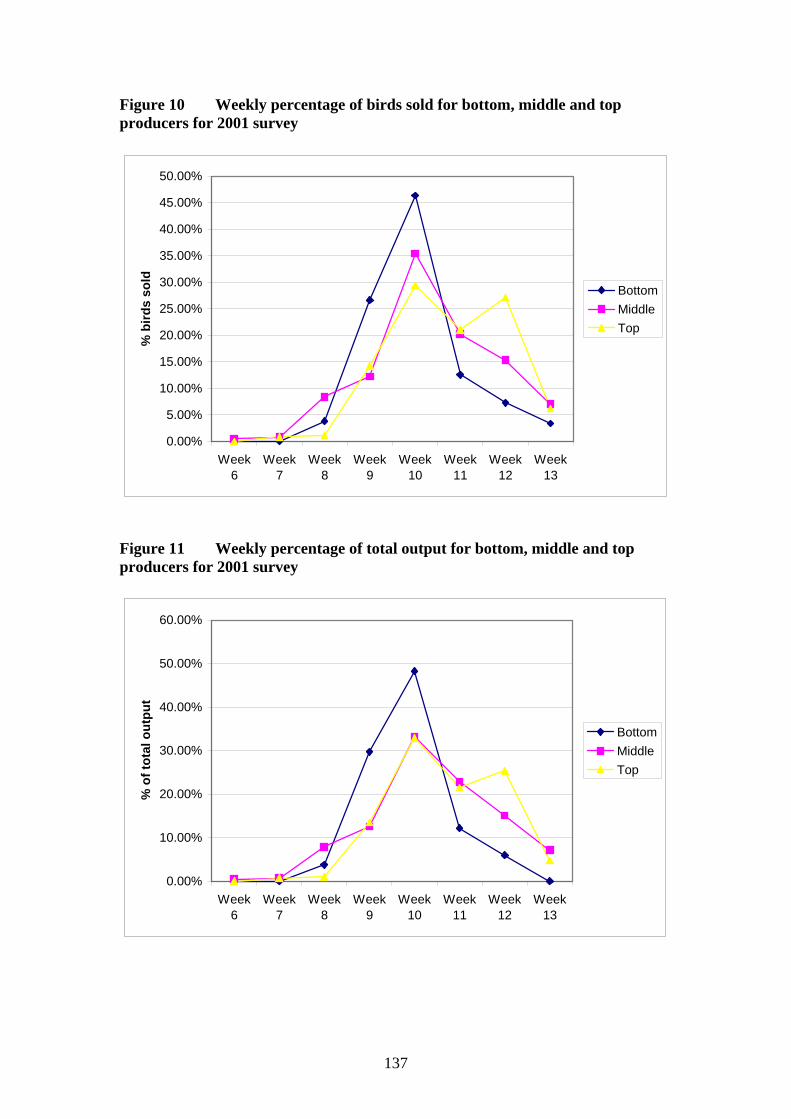
137
Figure 10 Weekly percentage of birds sold for bottom, middle and top producers for 2001 survey
0.00%
5.00%
10.00%
15.00%
20.00%
25.00%
30.00%
35.00%
40.00%
45.00%
50.00%
Week6
Week7
Week8
Week9
Week10
Week11
Week12
Week13
% b
irds
sold
BottomMiddleTop
Figure 11 Weekly percentage of total output for bottom, middle and top producers for 2001 survey
0.00%
10.00%
20.00%
30.00%
40.00%
50.00%
60.00%
Week6
Week7
Week8
Week9
Week10
Week11
Week12
Week13
% o
f tot
al o
utpu
t
BottomMiddleTop
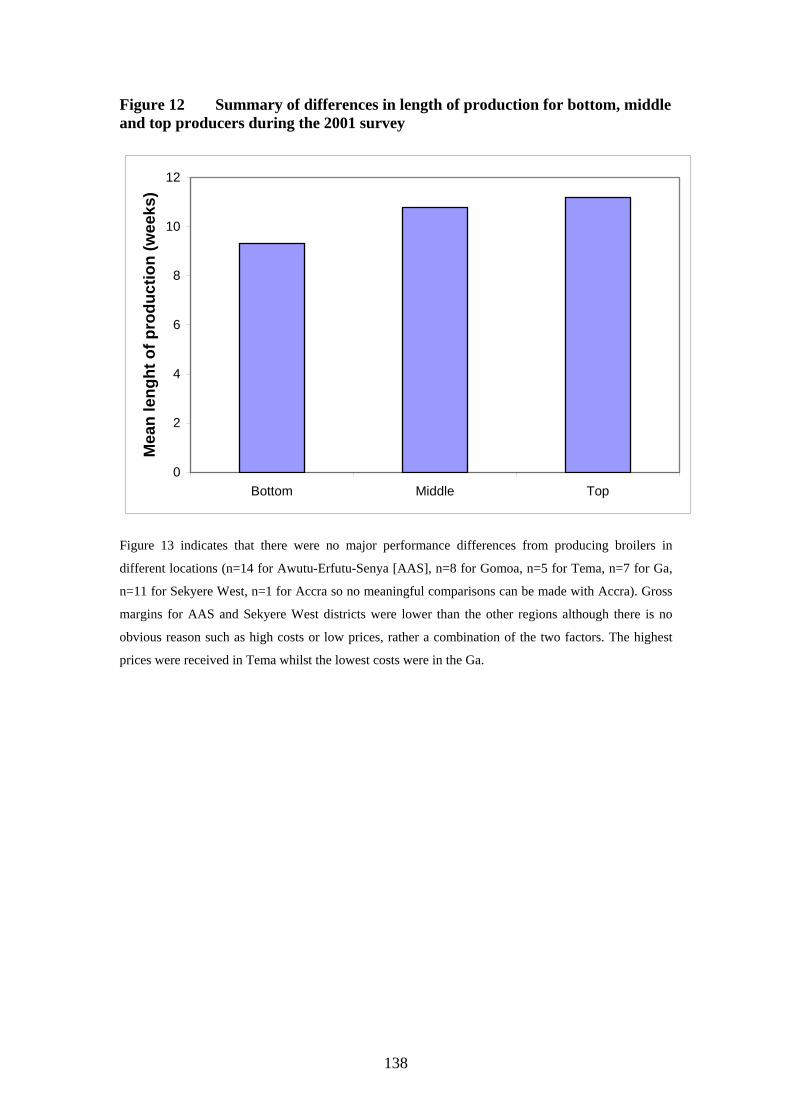
138
Figure 12 Summary of differences in length of production for bottom, middle and top producers during the 2001 survey
0
2
4
6
8
10
12
Bottom Middle Top
Mea
n le
nght
of p
rodu
ctio
n (w
eeks
)
Figure 13 indicates that there were no major performance differences from producing broilers in
different locations (n=14 for Awutu-Erfutu-Senya [AAS], n=8 for Gomoa, n=5 for Tema, n=7 for Ga,
n=11 for Sekyere West, n=1 for Accra so no meaningful comparisons can be made with Accra). Gross
margins for AAS and Sekyere West districts were lower than the other regions although there is no
obvious reason such as high costs or low prices, rather a combination of the two factors. The highest
prices were received in Tema whilst the lowest costs were in the Ga.
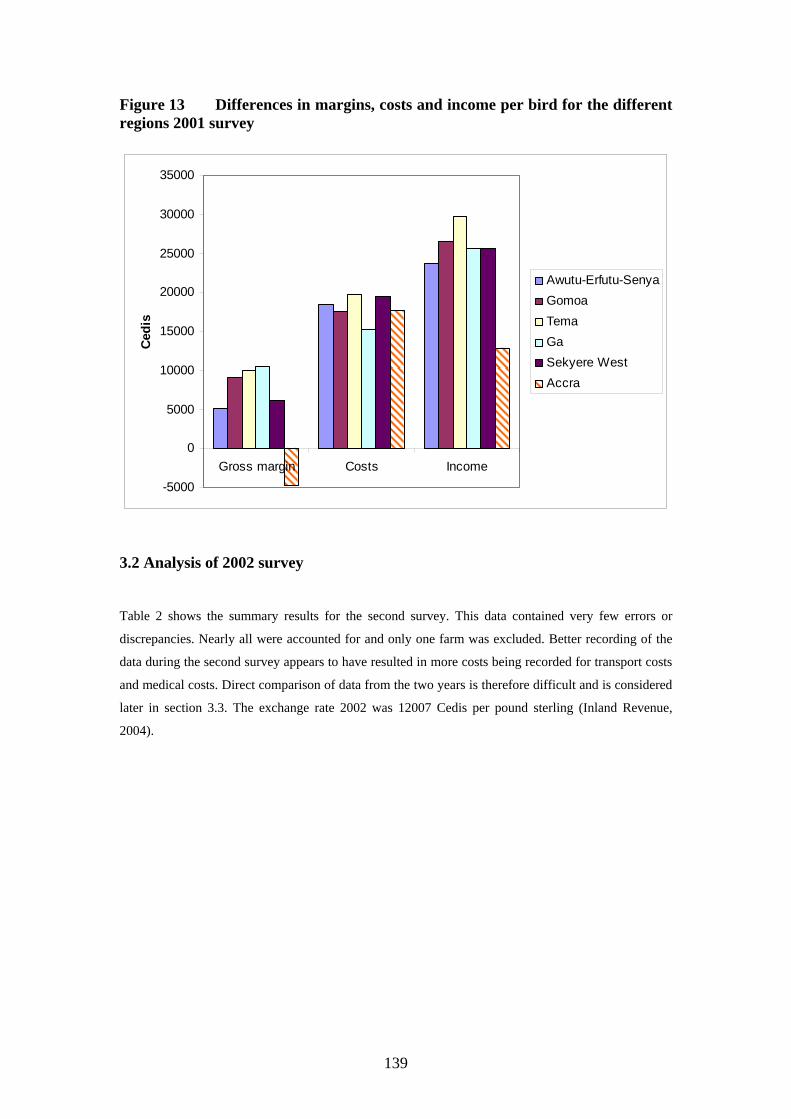
139
Figure 13 Differences in margins, costs and income per bird for the different regions 2001 survey
-5000
0
5000
10000
15000
20000
25000
30000
35000
Gross margin Costs Income
Cedi
s
Awutu-Erfutu-SenyaGomoaTemaGaSekyere WestAccra
3.2 Analysis of 2002 survey
Table 2 shows the summary results for the second survey. This data contained very few errors or
discrepancies. Nearly all were accounted for and only one farm was excluded. Better recording of the
data during the second survey appears to have resulted in more costs being recorded for transport costs
and medical costs. Direct comparison of data from the two years is therefore difficult and is considered
later in section 3.3. The exchange rate 2002 was 12007 Cedis per pound sterling (Inland Revenue,
2004).

140
Table 2 Summary statistics for 2002 survey, n = 35
Mean Standard Deviation Minimum Maximum
Gross margin per bird (c) 5087 5434 -7363 32438
Total cost per bird (c) 23587 46327 12648 32437
Feed cost per bird (c) 12753 3517 1850 20096
Medical cost per bird (c) 1605 1153 56 6233
Transport cost per bird (c) 744 570 0 2010
Energy cost per bird (c) 678 253 0 15191
Other costs (c) 542 1466 0 7124
Output per bird (c) 28674 3600 18525 38284
Price per bird sold (c) 31201 3755 19707 40729
Mortality 8.01% 6.00% 1.12% 24.51%
Flock size 308 241 50 1050
As in the first survey the producers have been split into three categories according to their economic
performance. The top producers contained 9 farmers, the middle producers sixteen and the bottom
category 10 farmers. Again the selection was based on the dividing the farmers into approximately the
top and bottom quarters as shown in Figure 14.
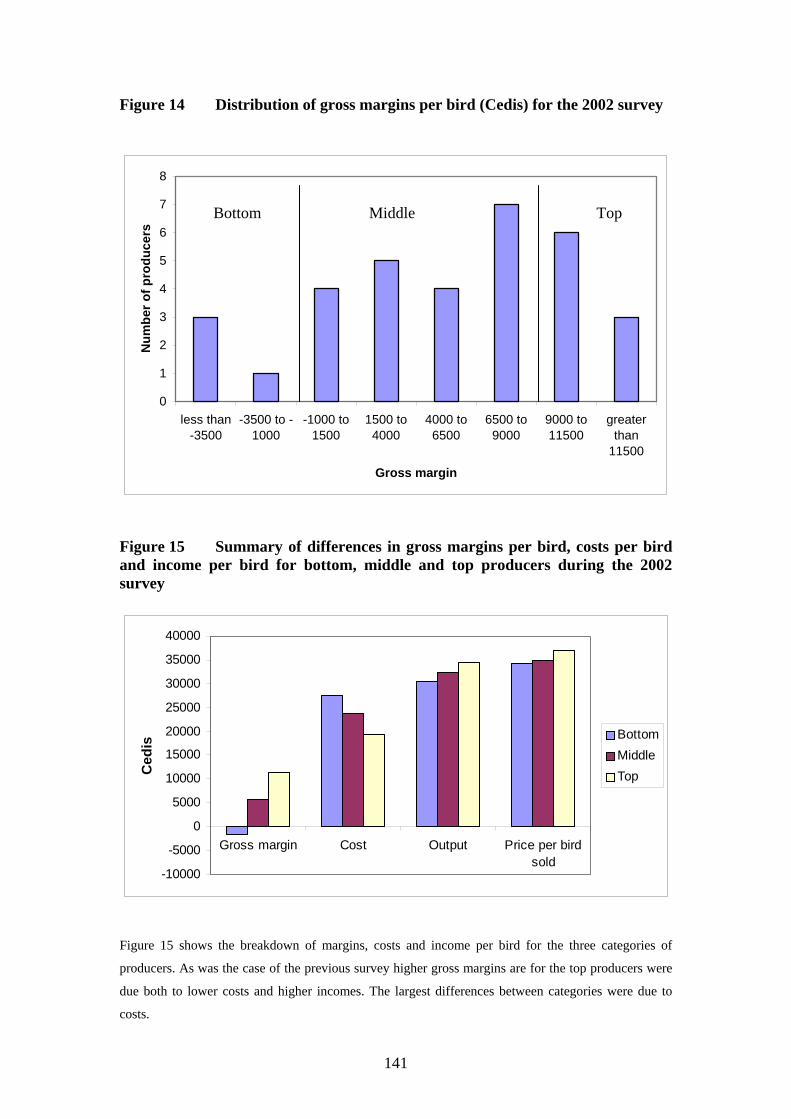
141
Figure 14 Distribution of gross margins per bird (Cedis) for the 2002 survey
0
1
2
3
4
5
6
7
8
less than-3500
-3500 to -1000
-1000 to1500
1500 to4000
4000 to6500
6500 to9000
9000 to11500
greaterthan
11500
Gross margin
Num
ber o
f pro
duce
rs
Figure 15 Summary of differences in gross margins per bird, costs per bird and income per bird for bottom, middle and top producers during the 2002 survey
-10000
-5000
0
5000
10000
15000
20000
25000
30000
35000
40000
Gross margin Cost Output Price per birdsold
Ced
is
BottomMiddleTop
Figure 15 shows the breakdown of margins, costs and income per bird for the three categories of
producers. As was the case of the previous survey higher gross margins are for the top producers were
due both to lower costs and higher incomes. The largest differences between categories were due to
costs.
Bottom Middle Top

142
Figure 16 Summary of differences in costs per bird started with for bottom, middle and top producers during the 2002 survey
0
5000
10000
15000
20000
25000
30000
Total costs Feed costs Medicalcosts
Energycosts
Transportcosts
Othercosts
Ced
is BottomMiddleTop
The distributions of costs are illustrated in Figure 16. As in the previous survey the bottom producers
incurred higher total costs and feed costs. Feed costs were again the most significant contributor to total
costs. There were small differences between the distributions of the medical, energy and transport cost
from the first survey, however, these small differences are most likely due to improved data collection.
The costs per bird sold are shown in Figure 17 and are very similar to those in Figure 16.
The weekly breakdown of total costs, figure 18, shows that the top producers tended to spend less
initially than the other producers. After this the top producers spent marginally less the others. The
weekly feed costs shown in Figure 19 show that again the top producers spent less initially and
thereafter spent marginally less. Low costs in later weeks reflect the shorter length of production of top
producers. This is likely to be a major reason for lower feed costs for top producers. An analysis of
prices paid per feedbag and per feed type showed no differences between the categories of producers.
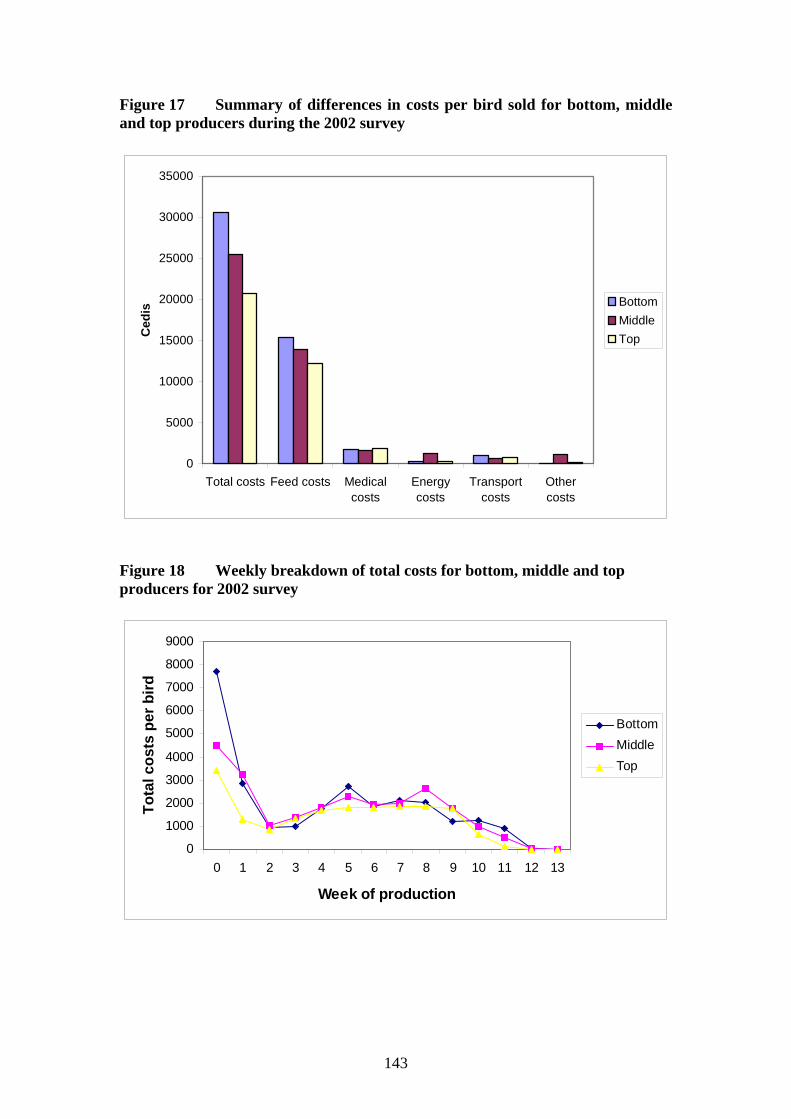
143
Figure 17 Summary of differences in costs per bird sold for bottom, middle and top producers during the 2002 survey
0
5000
10000
15000
20000
25000
30000
35000
Total costs Feed costs Medicalcosts
Energycosts
Transportcosts
Othercosts
Ced
is BottomMiddleTop
Figure 18 Weekly breakdown of total costs for bottom, middle and top producers for 2002 survey
0
1000
2000
3000
4000
5000
6000
7000
8000
9000
0 1 2 3 4 5 6 7 8 9 10 11 12 13
Week of production
Tota
l cos
ts p
er b
ird
BottomMiddleTop
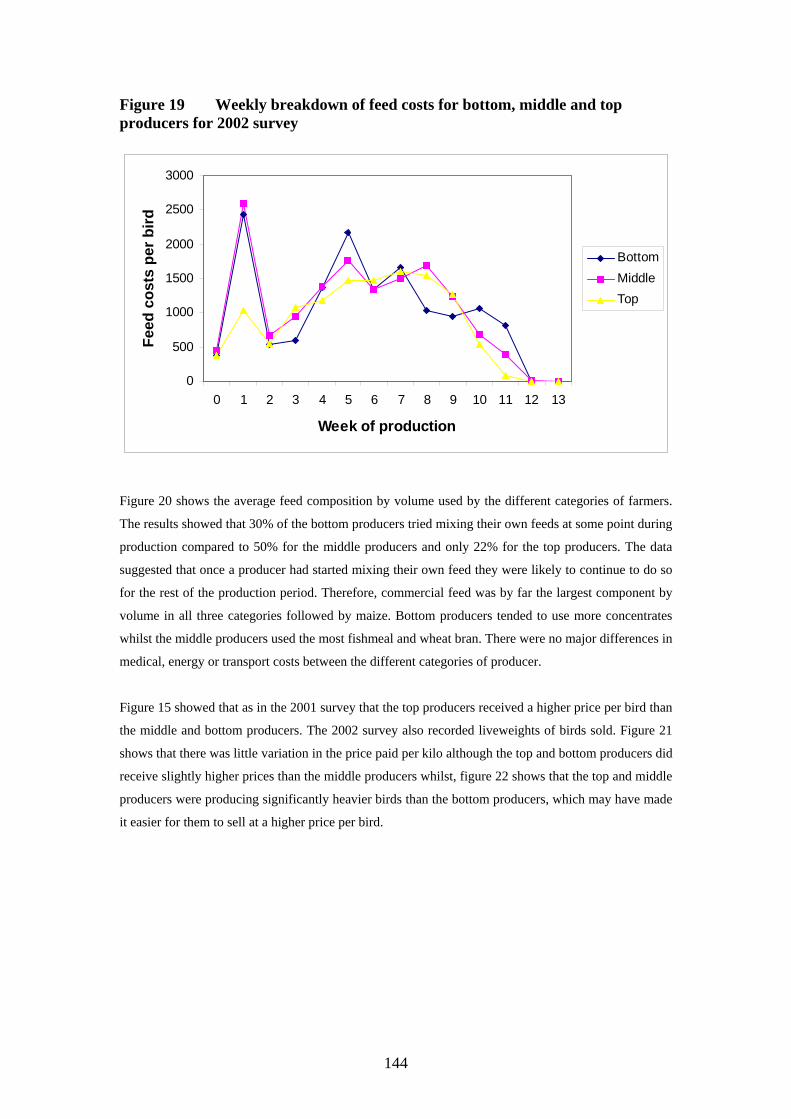
144
Figure 19 Weekly breakdown of feed costs for bottom, middle and top producers for 2002 survey
0
500
1000
1500
2000
2500
3000
0 1 2 3 4 5 6 7 8 9 10 11 12 13
Week of production
Feed
cos
ts p
er b
ird
BottomMiddleTop
Figure 20 shows the average feed composition by volume used by the different categories of farmers.
The results showed that 30% of the bottom producers tried mixing their own feeds at some point during
production compared to 50% for the middle producers and only 22% for the top producers. The data
suggested that once a producer had started mixing their own feed they were likely to continue to do so
for the rest of the production period. Therefore, commercial feed was by far the largest component by
volume in all three categories followed by maize. Bottom producers tended to use more concentrates
whilst the middle producers used the most fishmeal and wheat bran. There were no major differences in
medical, energy or transport costs between the different categories of producer.
Figure 15 showed that as in the 2001 survey that the top producers received a higher price per bird than
the middle and bottom producers. The 2002 survey also recorded liveweights of birds sold. Figure 21
shows that there was little variation in the price paid per kilo although the top and bottom producers did
receive slightly higher prices than the middle producers whilst, figure 22 shows that the top and middle
producers were producing significantly heavier birds than the bottom producers, which may have made
it easier for them to sell at a higher price per bird.
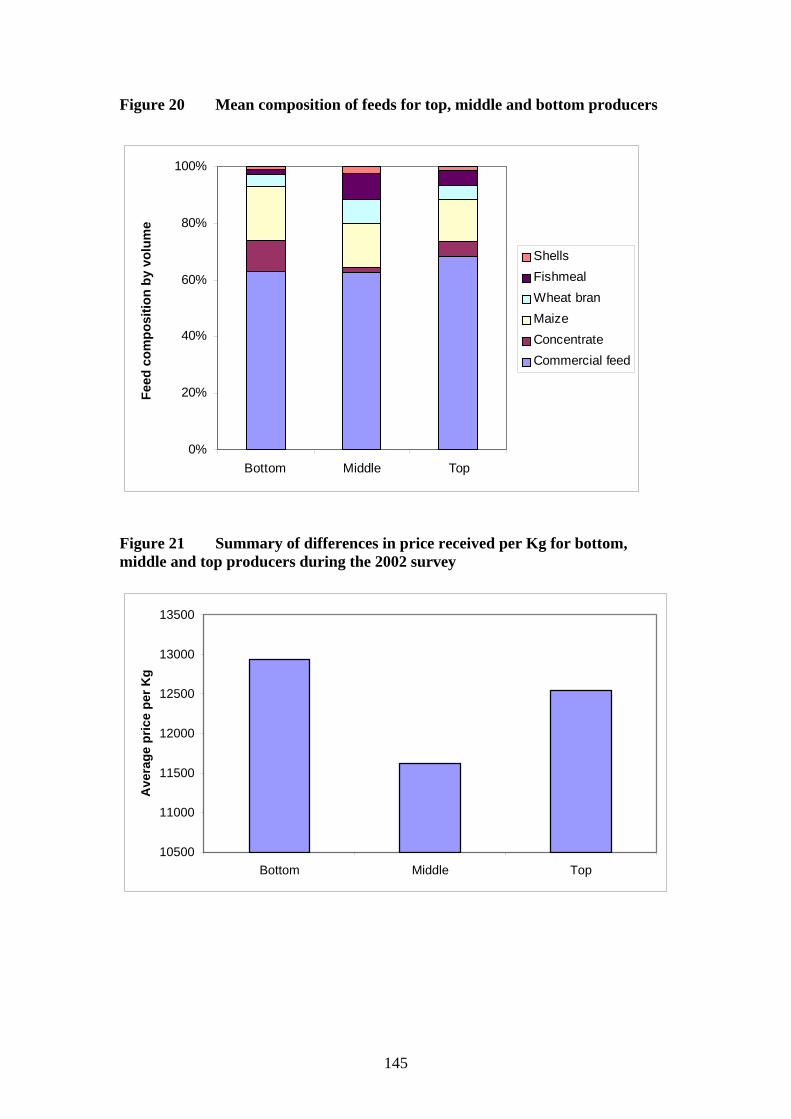
145
Figure 20 Mean composition of feeds for top, middle and bottom producers
0%
20%
40%
60%
80%
100%
Bottom Middle Top
Feed
com
posi
tion
by v
olum
e
ShellsFishmealWheat branMaizeConcentrateCommercial feed
Figure 21 Summary of differences in price received per Kg for bottom, middle and top producers during the 2002 survey
10500
11000
11500
12000
12500
13000
13500
Bottom Middle Top
Ave
rage
pric
e pe
r Kg
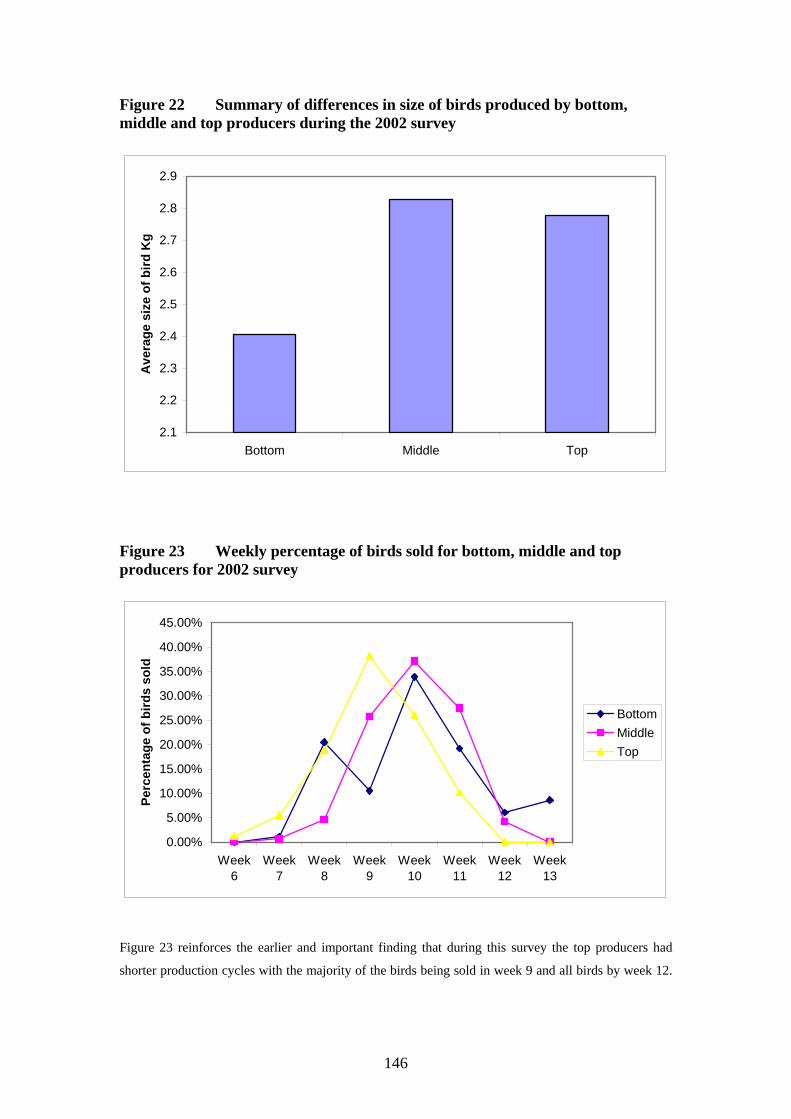
146
Figure 22 Summary of differences in size of birds produced by bottom, middle and top producers during the 2002 survey
2.1
2.2
2.3
2.4
2.5
2.6
2.7
2.8
2.9
Bottom Middle Top
Ave
rage
siz
e of
bird
Kg
Figure 23 Weekly percentage of birds sold for bottom, middle and top producers for 2002 survey
0.00%
5.00%
10.00%
15.00%
20.00%
25.00%
30.00%
35.00%
40.00%
45.00%
Week6
Week7
Week8
Week9
Week10
Week11
Week12
Week13
Perc
enta
ge o
f bird
s so
ld
BottomMiddleTop
Figure 23 reinforces the earlier and important finding that during this survey the top producers had
shorter production cycles with the majority of the birds being sold in week 9 and all birds by week 12.
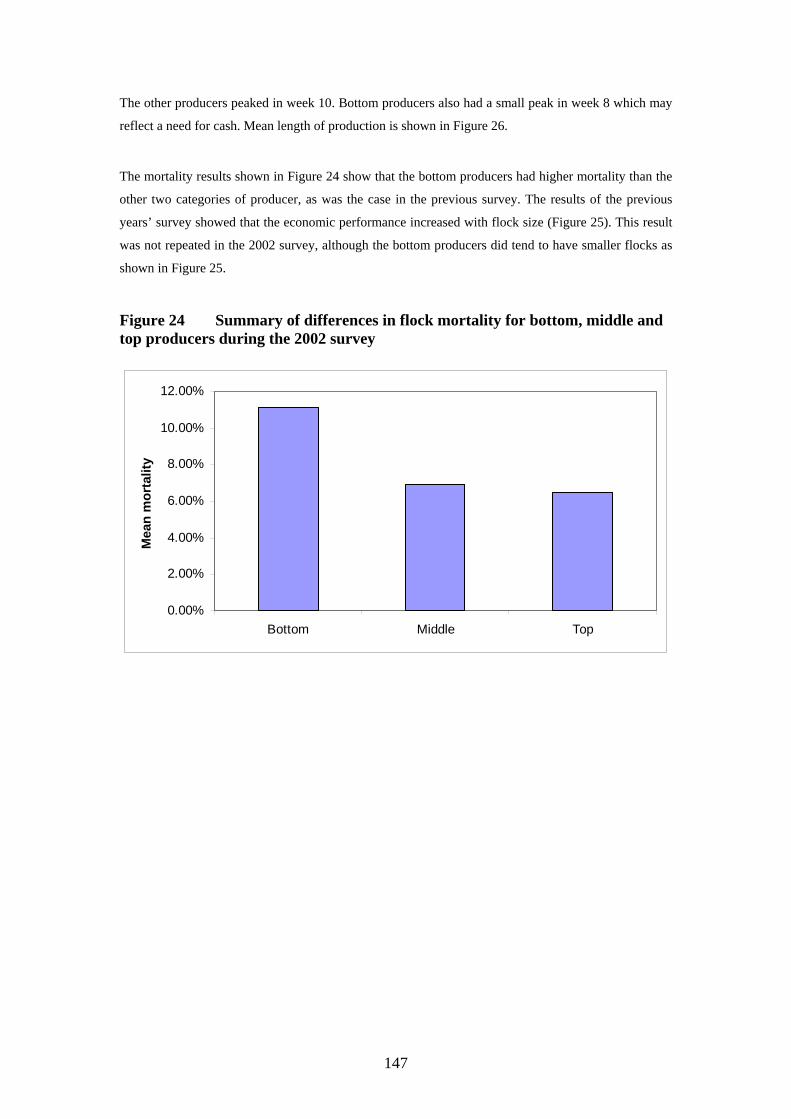
147
The other producers peaked in week 10. Bottom producers also had a small peak in week 8 which may
reflect a need for cash. Mean length of production is shown in Figure 26.
The mortality results shown in Figure 24 show that the bottom producers had higher mortality than the
other two categories of producer, as was the case in the previous survey. The results of the previous
years’ survey showed that the economic performance increased with flock size (Figure 25). This result
was not repeated in the 2002 survey, although the bottom producers did tend to have smaller flocks as
shown in Figure 25.
Figure 24 Summary of differences in flock mortality for bottom, middle and top producers during the 2002 survey
0.00%
2.00%
4.00%
6.00%
8.00%
10.00%
12.00%
Bottom Middle Top
Mea
n m
orta
lity
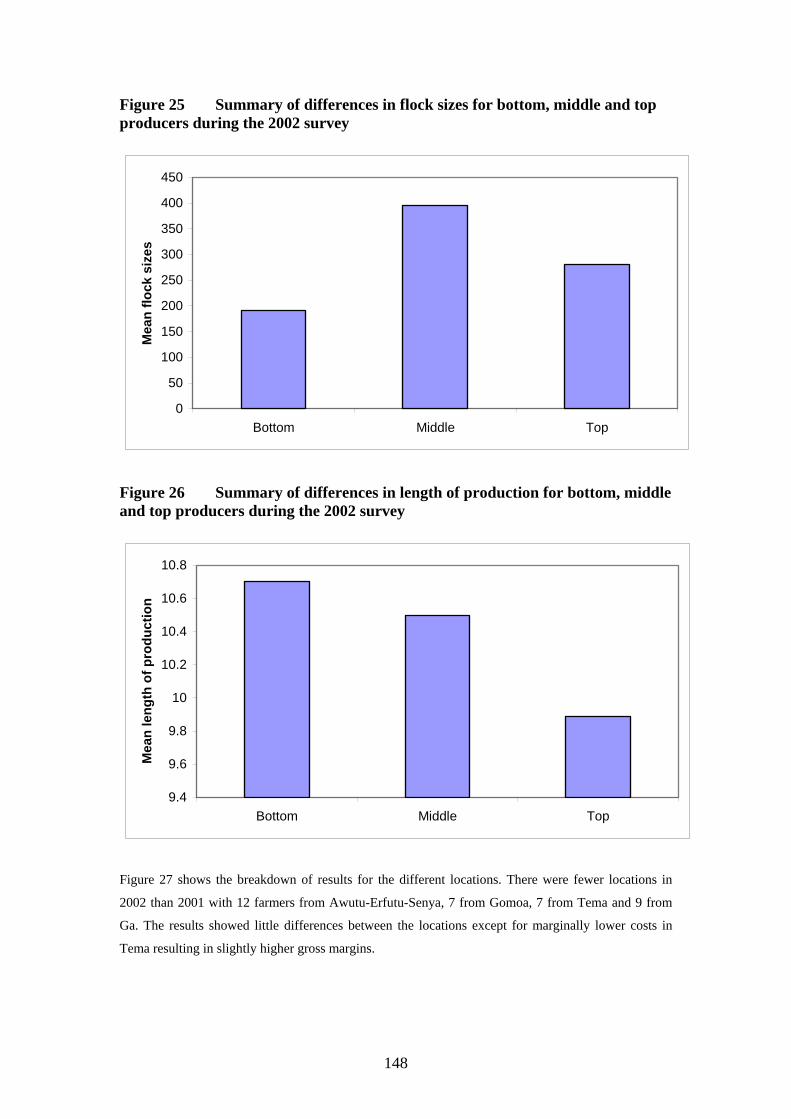
148
Figure 25 Summary of differences in flock sizes for bottom, middle and top producers during the 2002 survey
0
50
100
150
200
250
300
350
400
450
Bottom Middle Top
Mea
n flo
ck s
izes
Figure 26 Summary of differences in length of production for bottom, middle and top producers during the 2002 survey
9.4
9.6
9.8
10
10.2
10.4
10.6
10.8
Bottom Middle Top
Mea
n le
ngth
of p
rodu
ctio
n
Figure 27 shows the breakdown of results for the different locations. There were fewer locations in
2002 than 2001 with 12 farmers from Awutu-Erfutu-Senya, 7 from Gomoa, 7 from Tema and 9 from
Ga. The results showed little differences between the locations except for marginally lower costs in
Tema resulting in slightly higher gross margins.
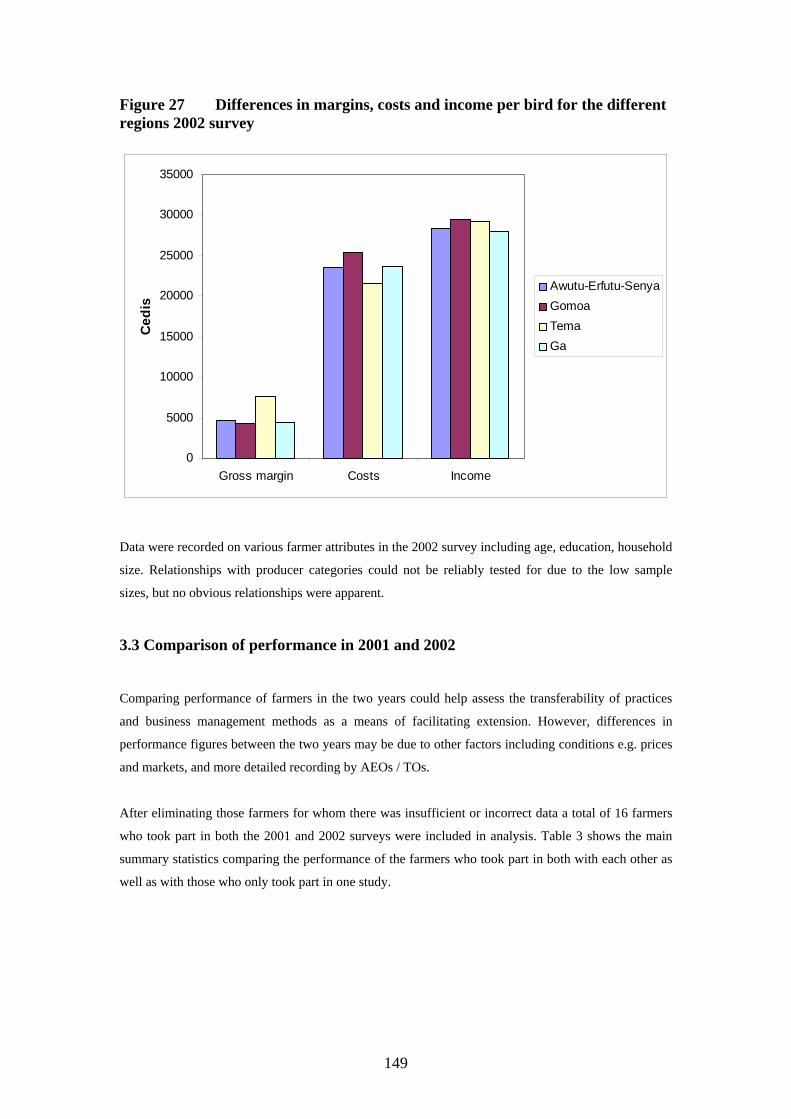
149
Figure 27 Differences in margins, costs and income per bird for the different regions 2002 survey
0
5000
10000
15000
20000
25000
30000
35000
Gross margin Costs Income
Ced
is
Awutu-Erfutu-SenyaGomoaTemaGa
Data were recorded on various farmer attributes in the 2002 survey including age, education, household
size. Relationships with producer categories could not be reliably tested for due to the low sample
sizes, but no obvious relationships were apparent.
3.3 Comparison of performance in 2001 and 2002
Comparing performance of farmers in the two years could help assess the transferability of practices
and business management methods as a means of facilitating extension. However, differences in
performance figures between the two years may be due to other factors including conditions e.g. prices
and markets, and more detailed recording by AEOs / TOs.
After eliminating those farmers for whom there was insufficient or incorrect data a total of 16 farmers
who took part in both the 2001 and 2002 surveys were included in analysis. Table 3 shows the main
summary statistics comparing the performance of the farmers who took part in both with each other as
well as with those who only took part in one study.
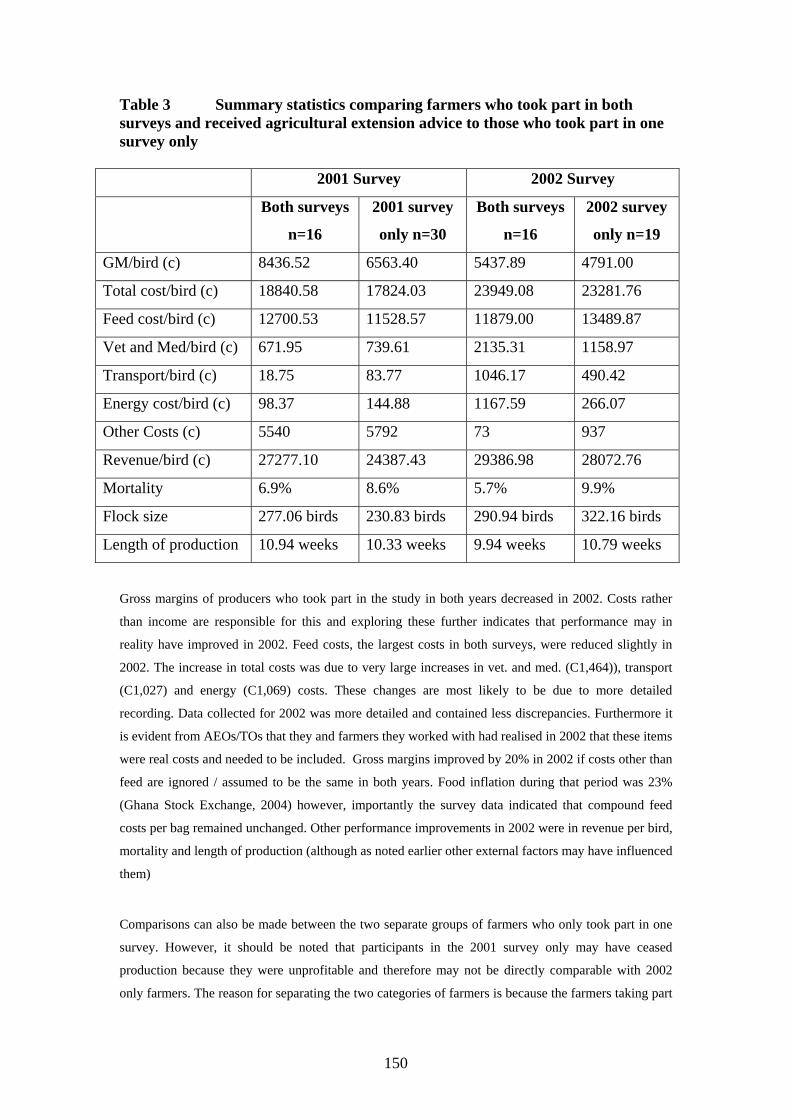
150
Table 3 Summary statistics comparing farmers who took part in both surveys and received agricultural extension advice to those who took part in one survey only
2001 Survey 2002 Survey
Both surveys
n=16
2001 survey
only n=30
Both surveys
n=16
2002 survey
only n=19
GM/bird (c) 8436.52 6563.40 5437.89 4791.00
Total cost/bird (c) 18840.58 17824.03 23949.08 23281.76
Feed cost/bird (c) 12700.53 11528.57 11879.00 13489.87
Vet and Med/bird (c) 671.95 739.61 2135.31 1158.97
Transport/bird (c) 18.75 83.77 1046.17 490.42
Energy cost/bird (c) 98.37 144.88 1167.59 266.07
Other Costs (c) 5540 5792 73 937
Revenue/bird (c) 27277.10 24387.43 29386.98 28072.76
Mortality 6.9% 8.6% 5.7% 9.9%
Flock size 277.06 birds 230.83 birds 290.94 birds 322.16 birds
Length of production 10.94 weeks 10.33 weeks 9.94 weeks 10.79 weeks
Gross margins of producers who took part in the study in both years decreased in 2002. Costs rather
than income are responsible for this and exploring these further indicates that performance may in
reality have improved in 2002. Feed costs, the largest costs in both surveys, were reduced slightly in
2002. The increase in total costs was due to very large increases in vet. and med. (C1,464)), transport
(C1,027) and energy (C1,069) costs. These changes are most likely to be due to more detailed
recording. Data collected for 2002 was more detailed and contained less discrepancies. Furthermore it
is evident from AEOs/TOs that they and farmers they worked with had realised in 2002 that these items
were real costs and needed to be included. Gross margins improved by 20% in 2002 if costs other than
feed are ignored / assumed to be the same in both years. Food inflation during that period was 23%
(Ghana Stock Exchange, 2004) however, importantly the survey data indicated that compound feed
costs per bag remained unchanged. Other performance improvements in 2002 were in revenue per bird,
mortality and length of production (although as noted earlier other external factors may have influenced
them)
Comparisons can also be made between the two separate groups of farmers who only took part in one
survey. However, it should be noted that participants in the 2001 survey only may have ceased
production because they were unprofitable and therefore may not be directly comparable with 2002
only farmers. The reason for separating the two categories of farmers is because the farmers taking part
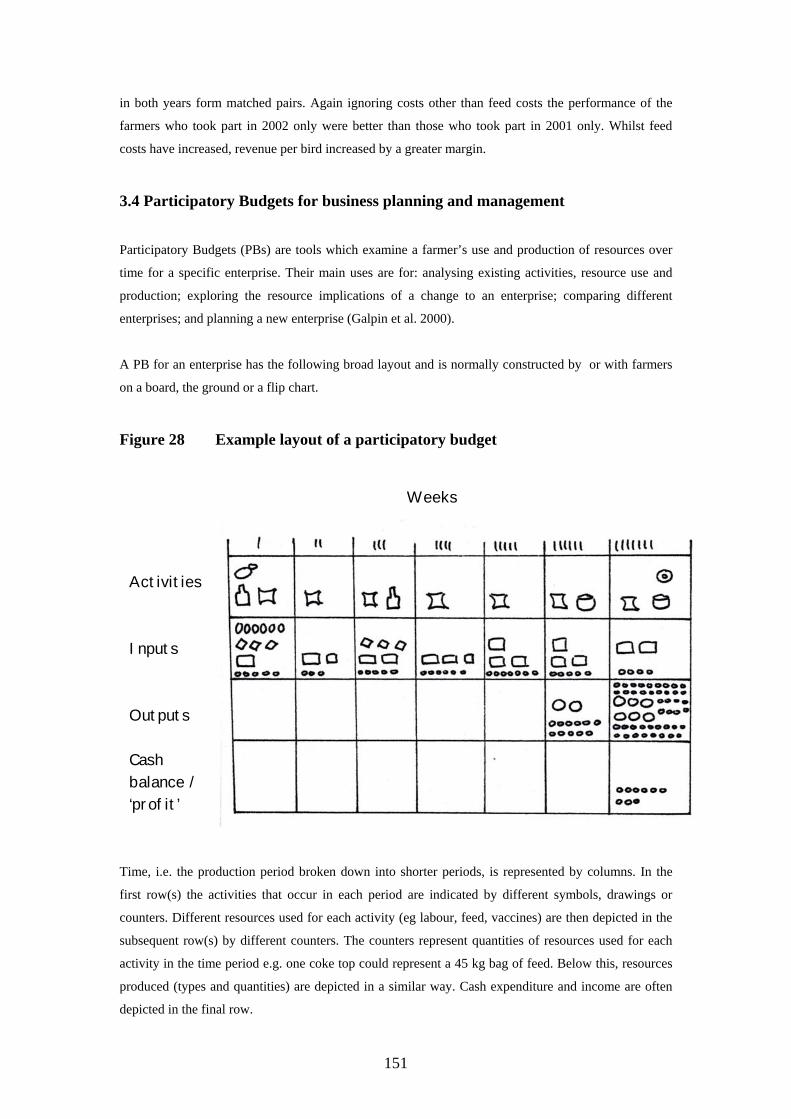
151
in both years form matched pairs. Again ignoring costs other than feed costs the performance of the
farmers who took part in 2002 only were better than those who took part in 2001 only. Whilst feed
costs have increased, revenue per bird increased by a greater margin.
3.4 Participatory Budgets for business planning and management
Participatory Budgets (PBs) are tools which examine a farmer’s use and production of resources over
time for a specific enterprise. Their main uses are for: analysing existing activities, resource use and
production; exploring the resource implications of a change to an enterprise; comparing different
enterprises; and planning a new enterprise (Galpin et al. 2000).
A PB for an enterprise has the following broad layout and is normally constructed by or with farmers
on a board, the ground or a flip chart.
Figure 28 Example layout of a participatory budget
Weeks
Time, i.e. the production period broken down into shorter periods, is represented by columns. In the
first row(s) the activities that occur in each period are indicated by different symbols, drawings or
counters. Different resources used for each activity (eg labour, feed, vaccines) are then depicted in the
subsequent row(s) by different counters. The counters represent quantities of resources used for each
activity in the time period e.g. one coke top could represent a 45 kg bag of feed. Below this, resources
produced (types and quantities) are depicted in a similar way. Cash expenditure and income are often
depicted in the final row.
Activities Inputs Outputs Cash balance / ‘profit’
152
PBs were developed to provide practical management tools which are suitable for farmers in complex,
diverse and risk prone (CDR) environments. They therefore attempt to overcome the limitations of
conventional farm management methods (see Dorward et al, 1997) and to be appropriate to the
practical and management conditions experienced by smallscale farmers operating in CDRs. Key to
this are that they: consider all resources and not just cash or financial profit; take account of time
(smallscale farmers are interested in resource use and production during production as well as the ‘end’
result for decision making e.g. cash or labour may be limited in certain months); are simple and easy to
use and by semi or non literate farmers; do not require support equipment such as calculators or
computers.
In November 2000 PBs were used with several farmers keeping layers to review the previous
production periods and as part of the training of AEOs / TOs in July 2001 with broiler produces at three
locations near Accra (Abokobi, Kasoa, Pokuase). The method worked well and received positive
feedback from most farmers. However farmers from Abokobi who were well educated and some of the
AEOs / TOs felt that the use of symbols and visualisation was not necessary for literate farmers. Both
broiler and layer production involve a large number of activities and inputs regularly. Developing PBs
with farmers for them was therefore fairly time consuming but farmers found the exercise useful and
were clearly interested and sometimes surprised to establish their profitability and particularly the
amounts of resources and cash they had been investing. It was evident, and several farmers commented
that, none of them normally worked out profitability or planned or monitored their enterprises.
PBs formed the basis of the recording sheets developed for the longitudinal surveys in 2001 and 2002.
However, it was necessary to standardise the layout of the PBs and make them paper based for
recording and printing. The 2001 survey was intended to be purely extractive. These factors made them
less accessible to farmers and less easy to use in a participatory way.`At the end of the 2001 survey
some minor changes were made to the recording PBs based on the experience gained by AEOs/TOs
which included clearer specification of various details. In the 2002 survey the revised PBs were used
with and by farmers. Based on feedback on this further minor changes were made and the PB was
made available for and used in wider training and dissemination (see Aboe and Dorward, 2003).
3.5 Feedback from farmers, AEOs, and TOs on business planning methods and
their use in extension
Farmers made the following points when asked to identify positive and negative aspects of the PBs and
of the process of using them with AEOs / TOs:
Farmers from Awutu (7 men and 2 women)
• Estimating costs was helpful. Didn’t do this before.
• Now know how much profit we make. This was haphazard before.
153
• Now know that C1.8 million is needed to pay for the inputs for 100 birds. Felt ‘fear’ when
realised this.
• The plans / budgets reminded one of things that needed to be done.
• Farmers and AEO did the vaccination programme together. Also shared transport for this and
reduced costs.
• PBs were too academic and strict. Too much work – need to remove some of the columns.
• Had difficulty allocating costs e.g. water used for household but some of it for poultry.
• The AEO sometimes took the forms away!
Farmers from Kasua (9 men and 1 woman)
• Helped to know if making a profit and its size. Didn’t before.
• Poultry is a tedious and tiring business so we didn’t keep records before. Regular visits by
AEO helped with the discipline needed for record keeping.
• Helped to plan i.e. what to do and money needed.
• Helped to ‘cut your cloth’ i.e. how much will it cost and can I meet this.
• All costs were included. Formerly many were not.
• Helped to learn from the previous year / production cycle for the next.
• Helped to be alert and to look out for problems.
• Regular individual contact with AEO was useful in that could ask him questions and show
problems.
• Feed formula provided by the AEO was helpful. It was cheaper but can achieve the same bird
weight.
• The print on the PBs was too small.
• PBs are too complex.
AEOs / TOs made the following points when asked to identify positive and negative aspects of the PBs
and of the process of using them with farmers:
AEO / TO 1
• Planning enabled farmers to ensure they had sufficient feed. If necessary they kept fewer
birds. Farmers identified in advance how they would meet cash requirements. Not running out
of feed resulted in birds growing more uniformly and reaching sale weight in fewer weeks.
• Included all costs in budget. Formerly farmers did not think of water, energy etc. as costs.
• Farmers benefited from regular contact.
• Farmers previously wasted money on drugs (giving them too often and sometimes too long).
Vaccination schedules improved this and saved money. Advice on storage of drugs also
helped.
154
• Farmers improved their feeding by feeding little and often and wasted less.
• Litter management improved.
• Advice was given on preparation of own feeds (ie to reduce costs and maintain / improve
quality).
• Farmers were mainly literate but not used to writing records. Contact with the AEO was
beneficial and necessary initially to help but after to 2-3 visits farmers were using the PBs for
recording on their own. AEO / TO 2
• Planning ensured farmers didn’t run out of money during production. Farmers now know that
they need to raise C1.8 – 2 million to run a 100 bird enterprise. The budgeting ‘put fear into
farmers’ as they then realised the need to obtain significant amounts of money for inputs.
• Farmers know what price they need to achieve in order to cover costs and make a profit.
• Farmers can work out and know whether they have made a profit or loss.
• Helped overall with poultry keeping.
• Farmers were still not very confident with the format of the forms. Some felt they should write
something every week and recorded too many purchases.
AEO / TO 3
• Farmers know how much profit they made. Formerly they didn’t.
• Production period was reduced. For 4 of the 9 farmers worked with it was reduced from 12-13
weeks to 7-8 weeks, mainly due to improved feeding practice.
• Farmers now knew when to give vaccines, vitamins and when to change from starter feed.
Vaccinations were given at correct times. • Litter management improved.
• Farmers were fairly well educated. They had no problems using the PBs but were helped by
the AEO initially.
155
On-station Feeding Trials
Introduction Small-scale backyard poultry producers face high production costs, much of which can be set against feed.
A recent survey indicated that these producers typically obtain knowledge about this business including
feed formulations from family members, friends and other poultry producers. Thus, they lack technical
knowledge to enable them adjust to changing environments in particular, seasonal price changes in feed
ingredients to minimize production costs.
The general objective of the above project was to develop and disseminate technical interventions for
backyard poultry producers. The specific objective for the on-station component of the study was to
formulate and test a wide range of diets that maximize profitability at any given time. This will provide
producers greater flexibility in the use of local feed resources. A series of experiments were conducted to
achieve this objective. Experiment 1: Effects of diet and feeding regimen on egg production traits. The aim of this experiment was to demonstrate the effect of frequent changes of dietary formulation during
the laying period on egg production.
1. Materials and Methods Three diets (A, B, and C) were involved in the feeding trial. Diets A and B were least-cost formulated diets
with either maize (A) or cassava (B) as the main energy carrier (Table 1). Diet C was a commercial feed
used by a number of the farmers. Each diet was fed to one hundred and thirty two (132) eight-month old
pullets housed individually in a 2-tier battery cage unit. For the purposes of feed consumption parameters, 3
birds were fed from the same trough, thus allowing for forty- four replicates per diet. Additionally, another
group of 132 pullets were fed diet C. The experiment covered 3 phases, each phase lasting for twelve (12) weeks. During the second phase, one
group of birds receiving Diet C continued to be fed that diet for the remaining two phases. The other group
receiving diet C was switched to diets B and A, those receiving diet B to diets C and A, while those fed diet
A were switched to diets B and C at 12-week intervals. Egg production over the first 12 weeks was used to
compare the three diets. Egg production over the 36 weeks was used to compare the effects of switching
diets. Feed and water were provided for ad libitum consumption.
Primary data collected included daily egg production, 3-weekly feed consumed per replicate, and egg
weight measured for all eggs produced during the last week of each month. Derived parameters included,
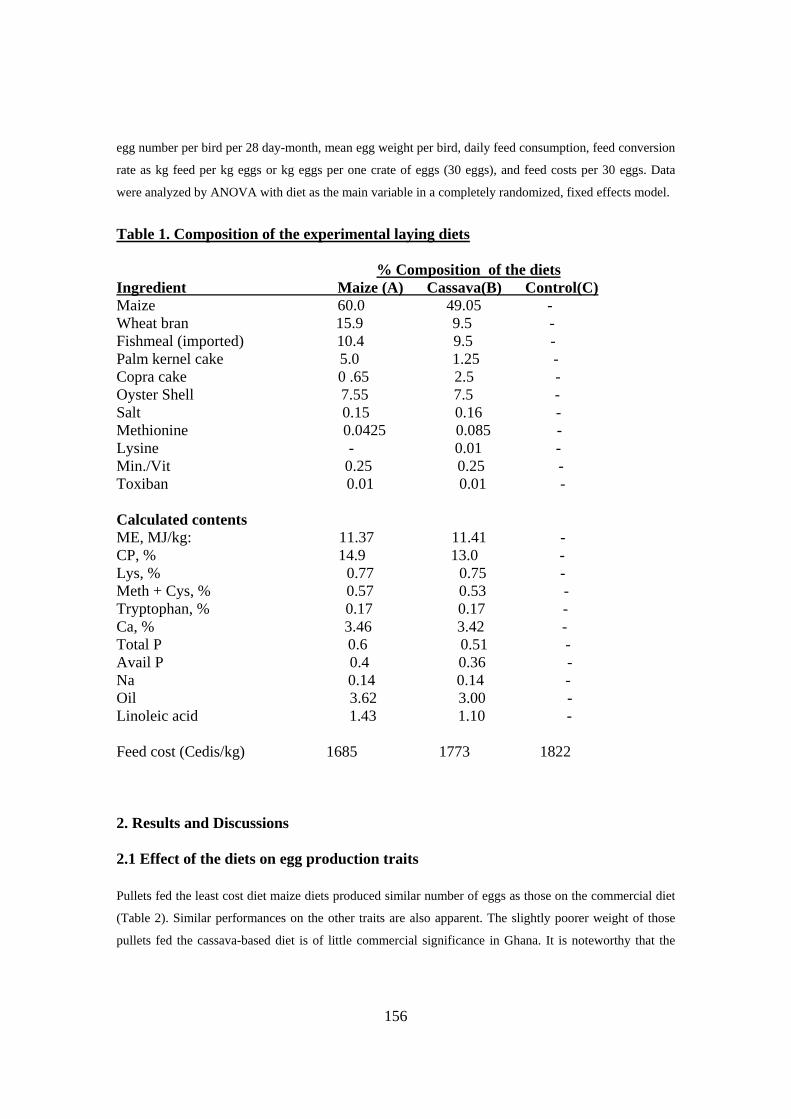
156
egg number per bird per 28 day-month, mean egg weight per bird, daily feed consumption, feed conversion
rate as kg feed per kg eggs or kg eggs per one crate of eggs (30 eggs), and feed costs per 30 eggs. Data
were analyzed by ANOVA with diet as the main variable in a completely randomized, fixed effects model.
Table 1. Composition of the experimental laying diets % Composition of the diets Ingredient Maize (A) Cassava(B) Control(C) Maize 60.0 49.05 - Wheat bran 15.9 9.5 - Fishmeal (imported) 10.4 9.5 - Palm kernel cake 5.0 1.25 - Copra cake 0 .65 2.5 - Oyster Shell 7.55 7.5 - Salt 0.15 0.16 - Methionine 0.0425 0.085 - Lysine - 0.01 - Min./Vit 0.25 0.25 - Toxiban 0.01 0.01 - Calculated contents ME, MJ/kg: 11.37 11.41 - CP, % 14.9 13.0 - Lys, % 0.77 0.75 - Meth + Cys, % 0.57 0.53 - Tryptophan, % 0.17 0.17 - Ca, % 3.46 3.42 - Total P 0.6 0.51 - Avail P 0.4 0.36 - Na 0.14 0.14 - Oil 3.62 3.00 - Linoleic acid 1.43 1.10 - Feed cost (Cedis/kg) 1685 1773 1822 2. Results and Discussions 2.1 Effect of the diets on egg production traits
Pullets fed the least cost diet maize diets produced similar number of eggs as those on the commercial diet
(Table 2). Similar performances on the other traits are also apparent. The slightly poorer weight of those
pullets fed the cassava-based diet is of little commercial significance in Ghana. It is noteworthy that the
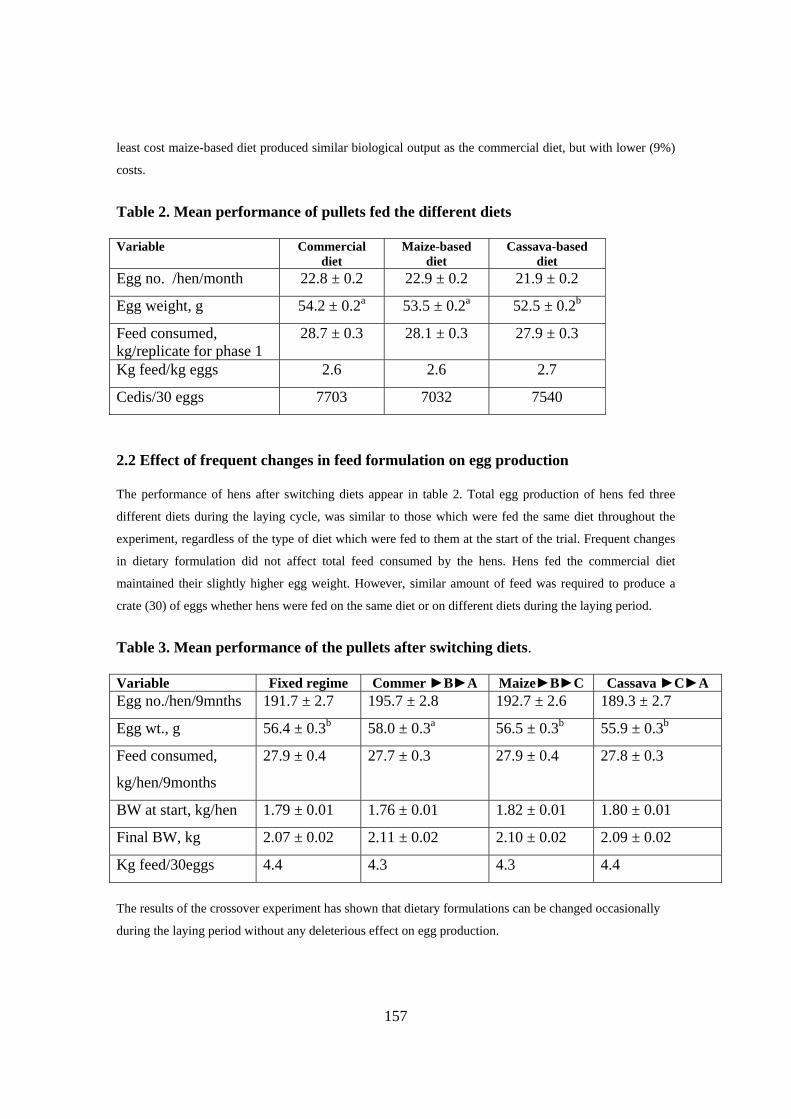
157
least cost maize-based diet produced similar biological output as the commercial diet, but with lower (9%)
costs.
Table 2. Mean performance of pullets fed the different diets Variable Commercial
diet Maize-based
diet Cassava-based
diet Egg no. /hen/month 22.8 ± 0.2 22.9 ± 0.2 21.9 ± 0.2
Egg weight, g 54.2 ± 0.2a 53.5 ± 0.2a 52.5 ± 0.2b
Feed consumed, kg/replicate for phase 1
28.7 ± 0.3 28.1 ± 0.3 27.9 ± 0.3
Kg feed/kg eggs 2.6 2.6 2.7
Cedis/30 eggs 7703 7032 7540
2.2 Effect of frequent changes in feed formulation on egg production The performance of hens after switching diets appear in table 2. Total egg production of hens fed three
different diets during the laying cycle, was similar to those which were fed the same diet throughout the
experiment, regardless of the type of diet which were fed to them at the start of the trial. Frequent changes
in dietary formulation did not affect total feed consumed by the hens. Hens fed the commercial diet
maintained their slightly higher egg weight. However, similar amount of feed was required to produce a
crate (30) of eggs whether hens were fed on the same diet or on different diets during the laying period.
Table 3. Mean performance of the pullets after switching diets. Variable Fixed regime Commer ►B►A Maize►B►C Cassava ►C►A Egg no./hen/9mnths 191.7 ± 2.7 195.7 ± 2.8 192.7 ± 2.6 189.3 ± 2.7
Egg wt., g 56.4 ± 0.3b 58.0 ± 0.3a 56.5 ± 0.3b 55.9 ± 0.3b
Feed consumed,
kg/hen/9months
27.9 ± 0.4 27.7 ± 0.3 27.9 ± 0.4 27.8 ± 0.3
BW at start, kg/hen 1.79 ± 0.01 1.76 ± 0.01 1.82 ± 0.01 1.80 ± 0.01
Final BW, kg 2.07 ± 0.02 2.11 ± 0.02 2.10 ± 0.02 2.09 ± 0.02
Kg feed/30eggs 4.4 4.3 4.3 4.4
The results of the crossover experiment has shown that dietary formulations can be changed occasionally
during the laying period without any deleterious effect on egg production.
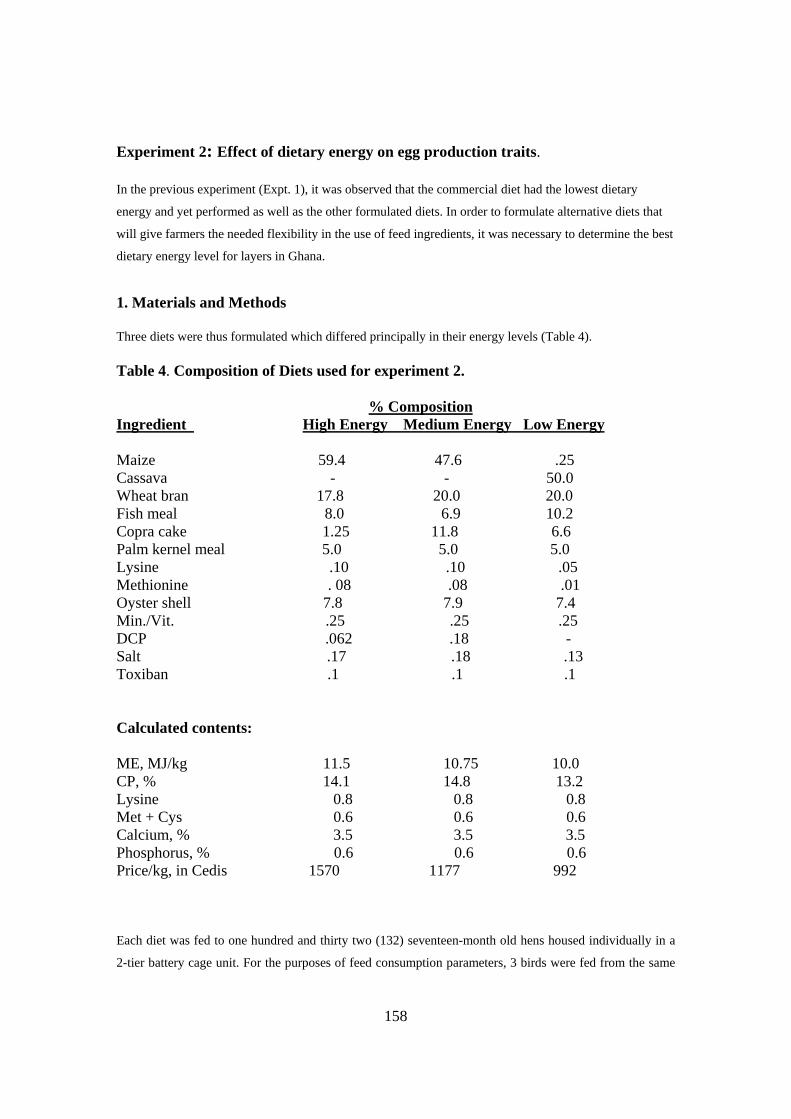
158
Experiment 2: Effect of dietary energy on egg production traits. In the previous experiment (Expt. 1), it was observed that the commercial diet had the lowest dietary
energy and yet performed as well as the other formulated diets. In order to formulate alternative diets that
will give farmers the needed flexibility in the use of feed ingredients, it was necessary to determine the best
dietary energy level for layers in Ghana.
1. Materials and Methods Three diets were thus formulated which differed principally in their energy levels (Table 4). Table 4. Composition of Diets used for experiment 2. % Composition Ingredient High Energy Medium Energy Low Energy Maize 59.4 47.6 .25 Cassava - - 50.0 Wheat bran 17.8 20.0 20.0 Fish meal 8.0 6.9 10.2 Copra cake 1.25 11.8 6.6 Palm kernel meal 5.0 5.0 5.0 Lysine .10 .10 .05 Methionine . 08 .08 .01 Oyster shell 7.8 7.9 7.4 Min./Vit. .25 .25 .25 DCP .062 .18 - Salt .17 .18 .13 Toxiban .1 .1 .1 Calculated contents: ME, MJ/kg 11.5 10.75 10.0 CP, % 14.1 14.8 13.2 Lysine 0.8 0.8 0.8 Met + Cys 0.6 0.6 0.6 Calcium, % 3.5 3.5 3.5 Phosphorus, % 0.6 0.6 0.6 Price/kg, in Cedis 1570 1177 992 Each diet was fed to one hundred and thirty two (132) seventeen-month old hens housed individually in a
2-tier battery cage unit. For the purposes of feed consumption parameters, 3 birds were fed from the same
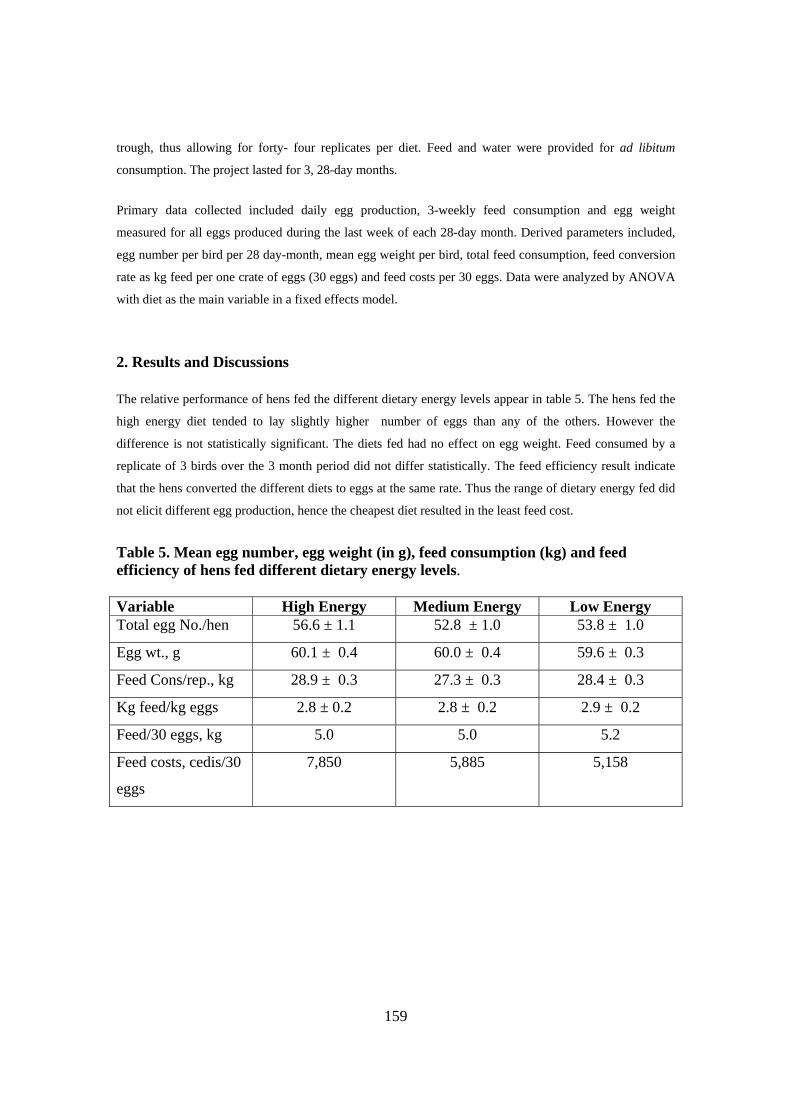
159
trough, thus allowing for forty- four replicates per diet. Feed and water were provided for ad libitum
consumption. The project lasted for 3, 28-day months.
Primary data collected included daily egg production, 3-weekly feed consumption and egg weight
measured for all eggs produced during the last week of each 28-day month. Derived parameters included,
egg number per bird per 28 day-month, mean egg weight per bird, total feed consumption, feed conversion
rate as kg feed per one crate of eggs (30 eggs) and feed costs per 30 eggs. Data were analyzed by ANOVA
with diet as the main variable in a fixed effects model.
2. Results and Discussions The relative performance of hens fed the different dietary energy levels appear in table 5. The hens fed the
high energy diet tended to lay slightly higher number of eggs than any of the others. However the
difference is not statistically significant. The diets fed had no effect on egg weight. Feed consumed by a
replicate of 3 birds over the 3 month period did not differ statistically. The feed efficiency result indicate
that the hens converted the different diets to eggs at the same rate. Thus the range of dietary energy fed did
not elicit different egg production, hence the cheapest diet resulted in the least feed cost.
Table 5. Mean egg number, egg weight (in g), feed consumption (kg) and feed efficiency of hens fed different dietary energy levels. Variable High Energy Medium Energy Low Energy Total egg No./hen 56.6 ± 1.1 52.8 ± 1.0 53.8 ± 1.0
Egg wt., g 60.1 ± 0.4 60.0 ± 0.4 59.6 ± 0.3
Feed Cons/rep., kg 28.9 ± 0.3 27.3 ± 0.3 28.4 ± 0.3
Kg feed/kg eggs 2.8 ± 0.2 2.8 ± 0.2 2.9 ± 0.2
Feed/30 eggs, kg 5.0 5.0 5.2
Feed costs, cedis/30
eggs
7,850 5,885 5,158
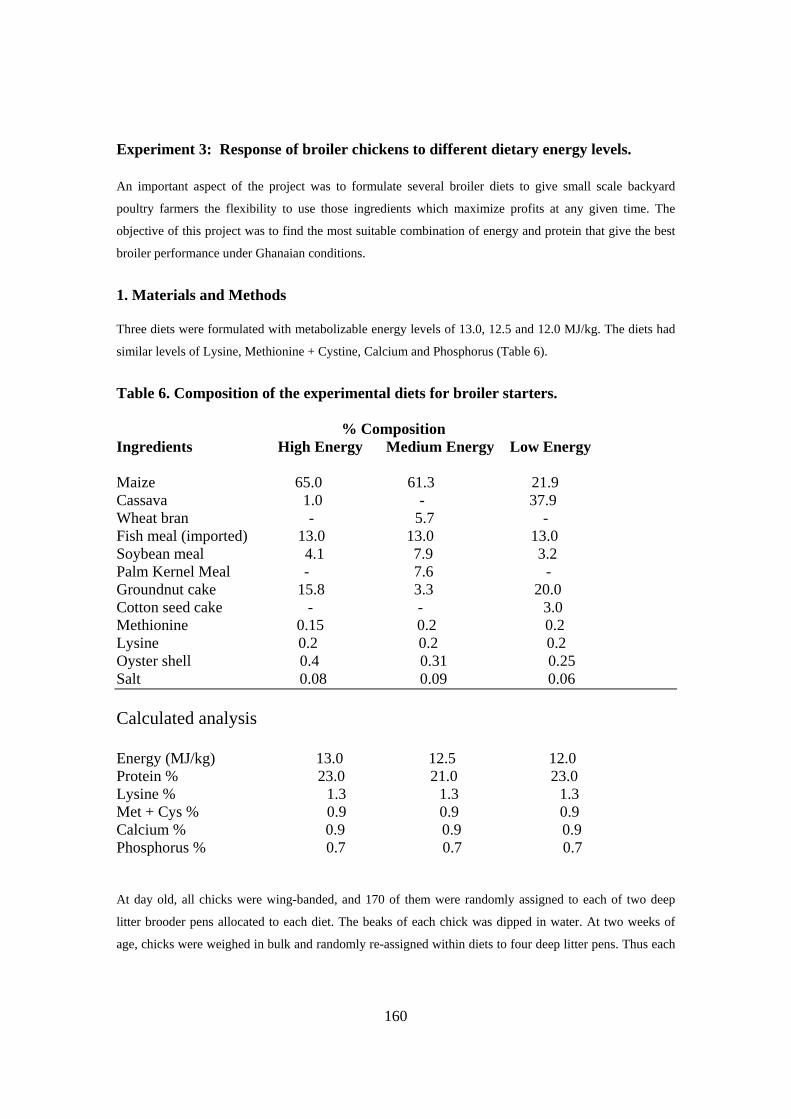
160
Experiment 3: Response of broiler chickens to different dietary energy levels. An important aspect of the project was to formulate several broiler diets to give small scale backyard
poultry farmers the flexibility to use those ingredients which maximize profits at any given time. The
objective of this project was to find the most suitable combination of energy and protein that give the best
broiler performance under Ghanaian conditions.
1. Materials and Methods Three diets were formulated with metabolizable energy levels of 13.0, 12.5 and 12.0 MJ/kg. The diets had
similar levels of Lysine, Methionine + Cystine, Calcium and Phosphorus (Table 6).
Table 6. Composition of the experimental diets for broiler starters. % Composition Ingredients High Energy Medium Energy Low Energy Maize 65.0 61.3 21.9 Cassava 1.0 - 37.9 Wheat bran - 5.7 - Fish meal (imported) 13.0 13.0 13.0 Soybean meal 4.1 7.9 3.2 Palm Kernel Meal - 7.6 - Groundnut cake 15.8 3.3 20.0 Cotton seed cake - - 3.0 Methionine 0.15 0.2 0.2 Lysine 0.2 0.2 0.2 Oyster shell 0.4 0.31 0.25 Salt 0.08 0.09 0.06 Calculated analysis Energy (MJ/kg) 13.0 12.5 12.0 Protein % 23.0 21.0 23.0 Lysine % 1.3 1.3 1.3 Met + Cys % 0.9 0.9 0.9 Calcium % 0.9 0.9 0.9 Phosphorus % 0.7 0.7 0.7 At day old, all chicks were wing-banded, and 170 of them were randomly assigned to each of two deep
litter brooder pens allocated to each diet. The beaks of each chick was dipped in water. At two weeks of
age, chicks were weighed in bulk and randomly re-assigned within diets to four deep litter pens. Thus each
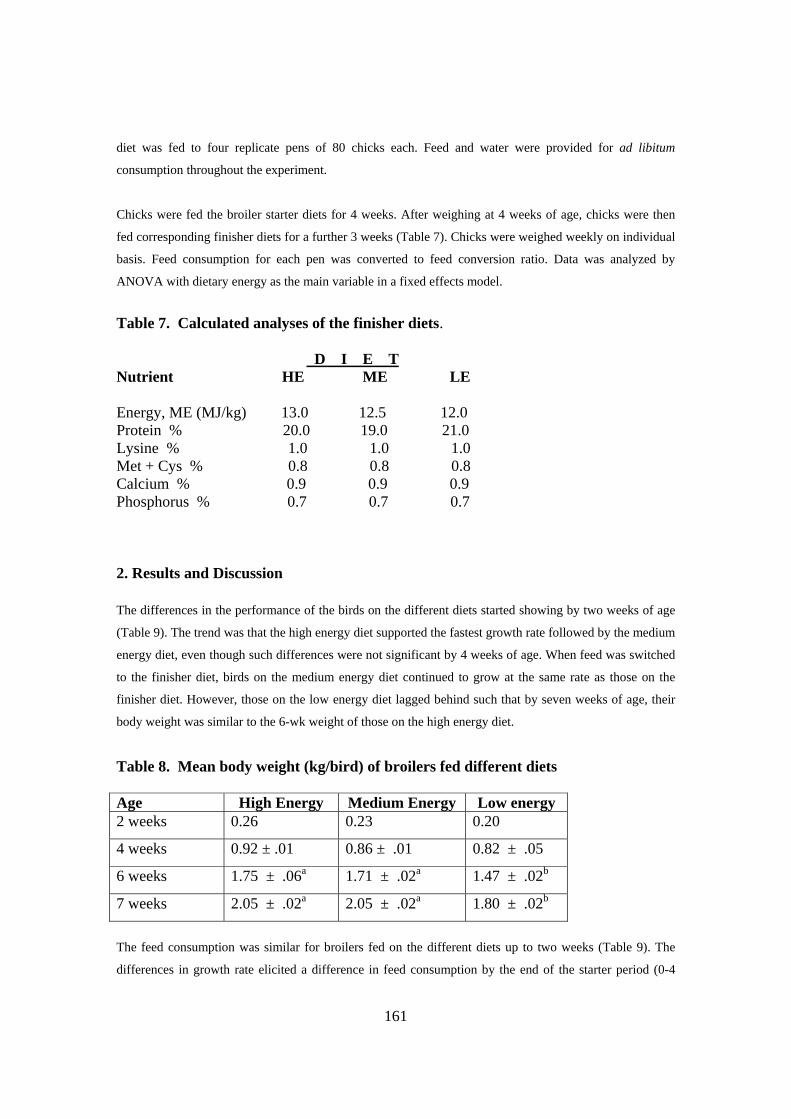
161
diet was fed to four replicate pens of 80 chicks each. Feed and water were provided for ad libitum
consumption throughout the experiment.
Chicks were fed the broiler starter diets for 4 weeks. After weighing at 4 weeks of age, chicks were then
fed corresponding finisher diets for a further 3 weeks (Table 7). Chicks were weighed weekly on individual
basis. Feed consumption for each pen was converted to feed conversion ratio. Data was analyzed by
ANOVA with dietary energy as the main variable in a fixed effects model.
Table 7. Calculated analyses of the finisher diets. D I E T Nutrient HE ME LE Energy, ME (MJ/kg) 13.0 12.5 12.0 Protein % 20.0 19.0 21.0 Lysine % 1.0 1.0 1.0 Met + Cys % 0.8 0.8 0.8 Calcium % 0.9 0.9 0.9 Phosphorus % 0.7 0.7 0.7 2. Results and Discussion The differences in the performance of the birds on the different diets started showing by two weeks of age
(Table 9). The trend was that the high energy diet supported the fastest growth rate followed by the medium
energy diet, even though such differences were not significant by 4 weeks of age. When feed was switched
to the finisher diet, birds on the medium energy diet continued to grow at the same rate as those on the
finisher diet. However, those on the low energy diet lagged behind such that by seven weeks of age, their
body weight was similar to the 6-wk weight of those on the high energy diet.
Table 8. Mean body weight (kg/bird) of broilers fed different diets Age High Energy Medium Energy Low energy 2 weeks 0.26 0.23 0.20
4 weeks 0.92 ± .01 0.86 ± .01 0.82 ± .05
6 weeks 1.75 ± .06a 1.71 ± .02a 1.47 ± .02b
7 weeks 2.05 ± .02a 2.05 ± .02a 1.80 ± .02b
The feed consumption was similar for broilers fed on the different diets up to two weeks (Table 9). The
differences in growth rate elicited a difference in feed consumption by the end of the starter period (0-4
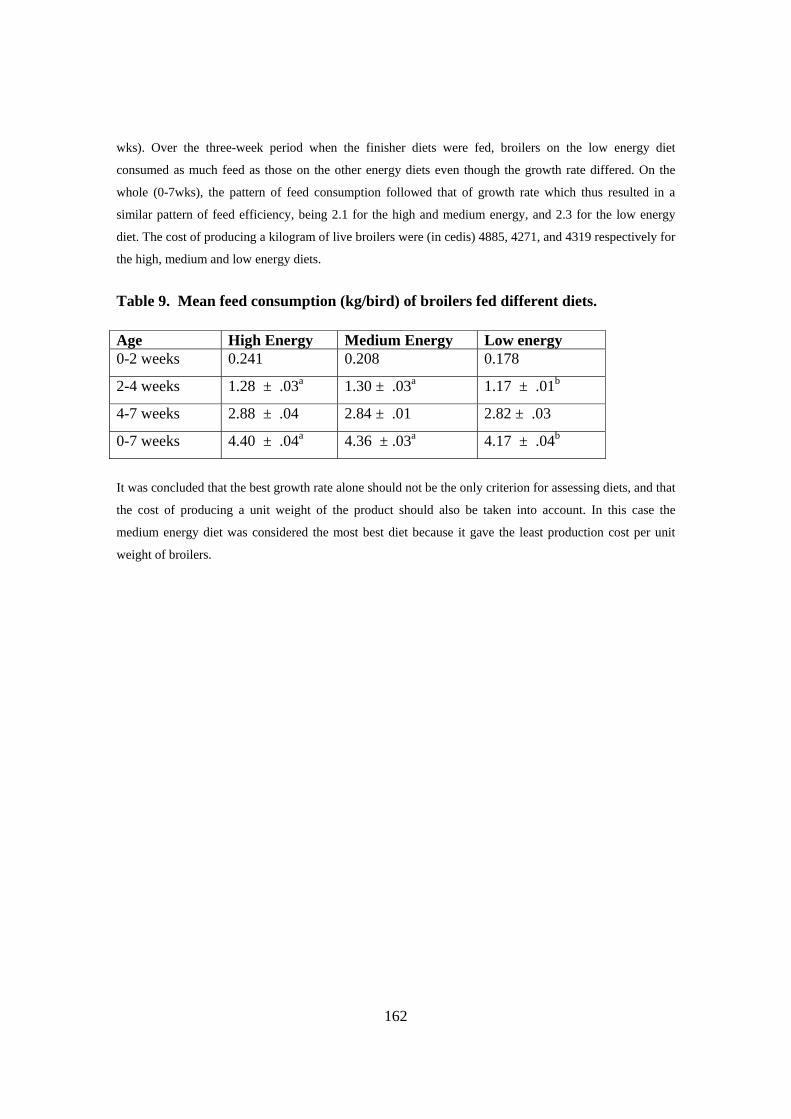
162
wks). Over the three-week period when the finisher diets were fed, broilers on the low energy diet
consumed as much feed as those on the other energy diets even though the growth rate differed. On the
whole (0-7wks), the pattern of feed consumption followed that of growth rate which thus resulted in a
similar pattern of feed efficiency, being 2.1 for the high and medium energy, and 2.3 for the low energy
diet. The cost of producing a kilogram of live broilers were (in cedis) 4885, 4271, and 4319 respectively for
the high, medium and low energy diets.
Table 9. Mean feed consumption (kg/bird) of broilers fed different diets. Age High Energy Medium Energy Low energy 0-2 weeks 0.241 0.208 0.178
2-4 weeks 1.28 ± .03a 1.30 ± .03a 1.17 ± .01b
4-7 weeks 2.88 ± .04 2.84 ± .01 2.82 ± .03
0-7 weeks 4.40 ± .04a 4.36 ± .03a 4.17 ± .04b
It was concluded that the best growth rate alone should not be the only criterion for assessing diets, and that
the cost of producing a unit weight of the product should also be taken into account. In this case the
medium energy diet was considered the most best diet because it gave the least production cost per unit
weight of broilers.
163
Other Activities
Feed Manual
A feed manual was prepared, providing specifications for 10 layer diets, 8 broiler starter diets and 8
broiler finisher diets based on locally available ingredients. The diets have been formulated to allow
farmers to make use of less conventional feed resources, and also allow options to avoid expensive and
sometimes unavailable feed ingredients.
These diets are presented in Appendix 1.
Training Course For Backyard Poultry Farmers
One-day Farmer Training Programmes were conducted at Pokuase, Awutu, and Frafraha in the peri-
urban Accra area between June and August 2003. The fourth Farmer Training Programme was
conducted in Ashanti Mampong in the Kumasi area.
Course objective
The objective of the course was to strengthen bird productivity and business decision making in peri-
urban small-scale poultry flocks in Ghana
It was intended that by the end of the training course, participating backyard farmers would have
acquired
• the necessary knowledge to manage a poultry enterprise profitably through better business
decision making and poultry husbandry
• the necessary knowledge and skills to keep participatory farm budget and records
• the necessary skills to organize a backyard poultry farmers group
Course content
The course is made up of three modules:
• Poultry husbandry
• Participatory farm budgeting
• Cooperative poultry farmer groups
164
Target group The course is aimed at people engaged in small-scale backyard poultry farming in peri-urban areas in
Ghana. At all the sites, Agricultural Extension Agents (AEAs) participated in the course. Course attendance Place Men Women AEAs Total Pokuase 25 3 1 29
Awutu 22 6 2 30
Frafraha 10 2 12
Mampong 19 1 3 23
The resource persons were: Dr. S. A. Okantah, Dr. K. Boa-Amponsem and Mrs. P. A. T. Aboe (Animal
Research Institute).
Dr. Boa-Amponsem gave the farmers practical instruction in poultry husbandry and feed rations. The
feed manual was provided as reference material. Mrs. Aboe gave instructions on the Participatory Farm
Budgeting format developed with farmers during the project. Dr. Okantah took the farmers through the
modalities for formation and running of farmer-based organizations such as a Poultry Farmers
Cooperative or Association. The training material given to the farmers provide guidelines on operation,
management, activities of cooperative to benefit m embers and conduct of meetings. The project had
brought about the establishment of Small-scale poultry Farmers associations in Awutu, Kasoa and
Pokuase. The group in Mampong felt the need to organize themselves into an association following the
training programme.
165
Outputs The outputs considered below are those listed in the project logical framework. The reader is referred
to the sections of the report indicated at the beginning of each output for details of methods and results.
1. Constraints to peri-urban small-holder poultry producers quantified and prioritised
The study gave consideration to two distinct groups of poultry keepers: traditional free-range poultry
keeping and intensive, housed production systems that used exotic strains. Outputs from the two
studies are considered below.
Constraints to traditional free-range poultry keeping
See Project A It must first be acknowledged that free-range indigenous chickens generally represent a minor activity
in most households, although, as described elsewhere, they may play a substantial contribution under
some circumstances. However, the overwhelming response to questions relating to expansion of
chicken flocks was that more chickens were seen as an advantage and most respondents had tried to
increase numbers. The widely acknowledged constraint to village chicken production appears to be Newcastle disease.
Flocks are decimated annually at the beginning of the dry season. The significance of Newcastle
disease was found to be well known to respondents and the disease was ranked as the most important
constraint.
Recent developments in the production of a thermostable vaccine for Newcastle disease offers hope in
achieving a degree of control over disease outbreaks and therefore an increase in flock productivity. To
test the likely consequences of achieving some control over Newcastle disease, a simple spreadsheet
model was developed using data derived from the survey. Bird populations were calculated over a 6-
year period where annual mortality as a result of Newcastle disease is 0, 20, 40, 60 or 80%. The model
assumed a starting flock size of 10 hens. All males were eaten or sold. All females were retained for
breeding. The results in term of numbers of bird in the flock (all ages and sexes) at the end of each year
are shown below:
Mortality from Newcastle disease (%)
Year 1 Year 2 Year 3 Year 4 Year 5 Year 6
0 54 292 1,575 8,503 45,917 247,949
20 43 187 806 3,483 15,046 64,998
40 32 105 340 1,102 3,570 11,568
60 22 47 101 218 470 1,016
80 11 12 13 14 15 16
166
The results suggest that even a limited success achieved by the vaccination programme, as might
happen if only a proportion of birds is vaccinated, could have a big impact on bird populations. This in
turn would have considerable implications for offtake, either resulting in more birds being consumed
by the household or being sold for cash. Significantly, few respondents saw marketing poultry as a
problem, indicating that scope exists for increasing sales. However, it seems unlikely that bird
populations would follow the exponential increase in numbers predicted by the model. The proportion
of the flock taken for consumption and sale would be expected to increase and may include potential
breeding females. Other diseases would probably become of increased significance while the
availability of feed would most certainly become limiting.
All respondents claimed to feed free-range chickens, usually 2 or 3 times daily. The commonest named
feedstuff was maize. However, the quantity of feed given was probably modest. For example,
approximately 30% of respondents gave a handful of grain at each feed. Typically, free-range chickens
would be expected to forage for their feed in the form of seeds and small invertebrates. This has been
described as the Scavenging Feed Resource Base by previous workers and is believed to establish the
carrying capacity of a given area. If the biomass of the flock exceeds the carrying capacity then
mortality, and particularly chick mortality, increases. Additional feeding will reduce the flock’s
dependence on the Scavenging Feed Resource Base. However, respondents to the questionnaire
identified feed as the second limiting factor to expansion of poultry keeping after heath, with over 50%
claiming to have difficulties feeding chickens. In general, those finding difficulties were the
respondents with larger flocks. The present ability of households to support more chickens therefore
comes into question.
Constraints to intensive, housed production systems
See Project B
Hatcheries and day-old chicks
The source of day-old chicks was identified as one of the most important constraints by producers of all
classes of poultry, suggesting a degree of anxiety about this aspect of the production cycle. Producers
appeared to have a choice in the hatcheries they patronised. In general, producers seemed satisfied with
the service and quality of product they purchased. However, there were clearly problems with the
availability of chicks from the two hatcheries favoured by the majority of respondents.
Poultry health
The most striking finding in relation to poultry health was the difference in farmer concerns between
the Accra and Kumasi project sites. The major infectious diseases gumboro and Newcastle disease
preoccupied Kumasi farmers while being of apparently limited concern to Accra farmers. Responses to
questions relating to vaccination confirm and possibly provide some explanation for this dichotomy.
167
Kumasi farmers placed far greater concerns in maintaining cold chains and the quality of vaccines than
Accra farmers. This may suggest that Kumasi farmers have had bad experiences with vaccines,
possibly as a result of difficulties in maintaining cold chains. As a result, they continue to suffer
anxieties in the control of major contagious diseases. Such anxieties do not exist in Accra farmers,
possibly because of high standards of control. It is also noticeable that the use or availability of
veterinary services is more limited in the Kumasi site, a far higher percentage of farmers apparently
treating the birds themselves. It is possible that all these problems are as a result of the greater distance
of farms from the urban centre of Kumasi compared to the situation of farms around Accra.
An alternative explanation may lie in the larger flock sizes comprising the Kumasi sample. Kumasi
farmers may be more experienced and professional, more aware of the dangers of the major contagious
diseases, and therefore give such diseases far higher priority. Their experience may also allow them to
take on more responsibility relating to health care, bypassing professional health care technicians.
Feeds and feeding
Respondents viewed feed as the most important constraint to their activities. Producers seem generally
dependent on the purchase of manufactured feeds. Farmers either (1) purchased manufactured feeds,
(2) purchased compound feeds and then home mixed the compound with a limited range of other
feedstuffs, (3) home-mixed from a range of basic ingredients, or (4) employed a combination of the
foregoing methods. Confusion over the term “compound feed”, which in the terms of the questionnaire
referred to a complete diet and in the minds of some respondents referred to a pre-mix, resulted in
difficulties in quantifying the number of farmers in each of these categories. What is clear, however, is
that those farmers that did home mix were very conservative in their use of ingredients. Maize and
wheat bran appeared to be the staples, with locally available ingredients being used by a very limited
number of respondents. The results available do not allow any further investigation of the reasons for
this. It could be that purchasing complete diets is the most convenient and cost-effective means of
feeding poultry. In general, poultry keepers appeared to be relatively well-served by feed compounders.
Producers appeared to have some choice in the suppliers that they patronised and were, in general,
happy with the service they obtained. Respondents were critical of one company’s reliability while
another company had customers who were unhappy about the quality of the products they purchased.
However, there are underlying problems with feed supply. Price, inevitably, was a frequently cited
problem; rapid price raises were of particular concern. Supplies of feed were sometimes difficult to
obtain and quality changed frequently.
Home-mixing may be an unpopular method of providing feed for poultry because of a lack of
knowledge or difficulties in obtaining the basic ingredients in small quantities and at a suitable price. A
majority of respondents described advice on feeding as being “occasionally” available. Relatively few
producers who were home-mixing obtained feed formulations from their agricultural extension agent.
About 50% had their own formulation or used a friend’s. Availability and price of basic ingredients
may also be a problem; little information was forthcoming on where ingredients were obtained.
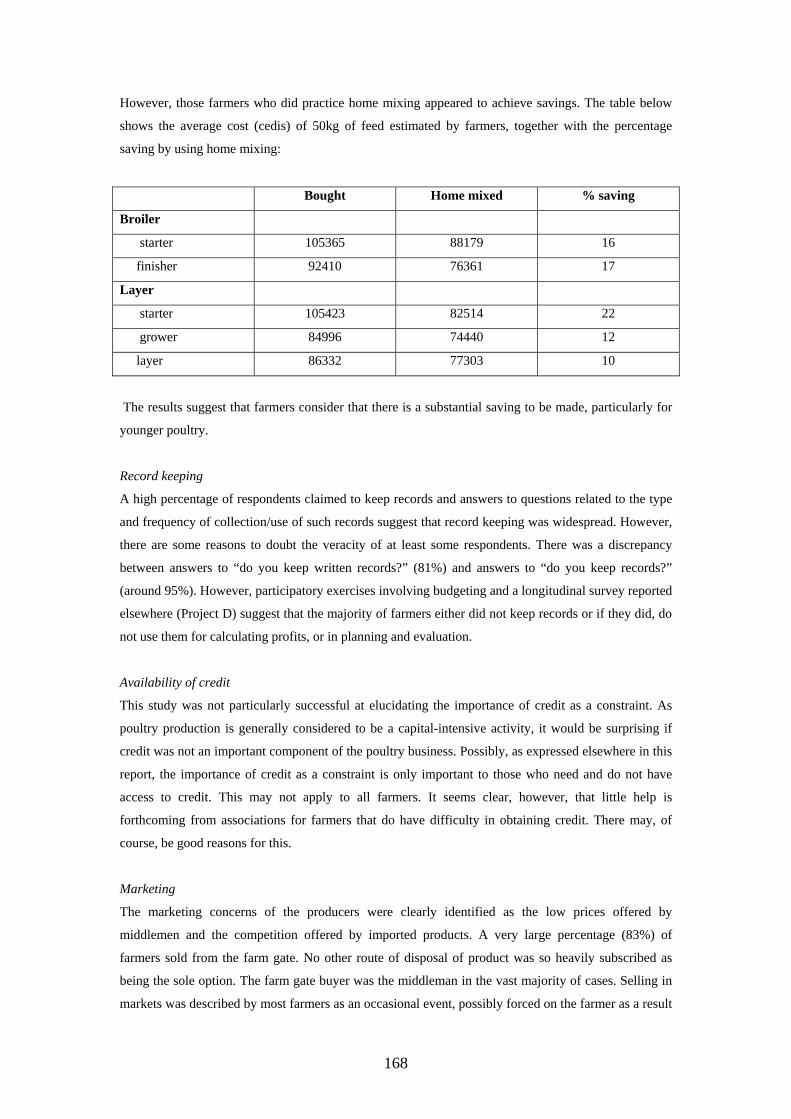
168
However, those farmers who did practice home mixing appeared to achieve savings. The table below
shows the average cost (cedis) of 50kg of feed estimated by farmers, together with the percentage
saving by using home mixing:
Bought Home mixed % saving
Broiler
starter 105365 88179 16
finisher 92410 76361 17
Layer
starter 105423 82514 22
grower 84996 74440 12
layer 86332 77303 10
The results suggest that farmers consider that there is a substantial saving to be made, particularly for
younger poultry.
Record keeping
A high percentage of respondents claimed to keep records and answers to questions related to the type
and frequency of collection/use of such records suggest that record keeping was widespread. However,
there are some reasons to doubt the veracity of at least some respondents. There was a discrepancy
between answers to “do you keep written records?” (81%) and answers to “do you keep records?”
(around 95%). However, participatory exercises involving budgeting and a longitudinal survey reported
elsewhere (Project D) suggest that the majority of farmers either did not keep records or if they did, do
not use them for calculating profits, or in planning and evaluation.
Availability of credit
This study was not particularly successful at elucidating the importance of credit as a constraint. As
poultry production is generally considered to be a capital-intensive activity, it would be surprising if
credit was not an important component of the poultry business. Possibly, as expressed elsewhere in this
report, the importance of credit as a constraint is only important to those who need and do not have
access to credit. This may not apply to all farmers. It seems clear, however, that little help is
forthcoming from associations for farmers that do have difficulty in obtaining credit. There may, of
course, be good reasons for this.
Marketing
The marketing concerns of the producers were clearly identified as the low prices offered by
middlemen and the competition offered by imported products. A very large percentage (83%) of
farmers sold from the farm gate. No other route of disposal of product was so heavily subscribed as
being the sole option. The farm gate buyer was the middleman in the vast majority of cases. Selling in
markets was described by most farmers as an occasional event, possibly forced on the farmer as a result
169
of middlemen failing to take up finished meat birds, a common occurrence according to anecdotal
evidence. Producers were clearly unfamiliar with selling to end users (caterers and supermarkets) and
few relied on selling directly to consumers.
Marketing is clearly an area that deserves attention from producers. Studies of marketing broilers in
Accra that form part of this programme of work (Project C) confirm that caterers and supermarkets are
the most promising outlet for home-produced birds. However, few producers are targeting these sales
outlets and it seems unlikely that individual small producers are well placed to take advantage of such
sales routes. Supplies would have to be regular and supermarkets in particular demand levels of
presentation and packaging that could not be achieved by a small producer acting independently. There
is also a clear demand for chicken portions that is not being met by producers.
Farmer associations would seem to be a way forward to improve farmer share of the final product
price, replacing the present middlemen. As described elsewhere, farmer associations do not involve
themselves with marketing at the present time, although associations are favoured by farmers.
2. Key farmer information or knowledge pathways identified
Traditional free-range poultry keeping
See Project A
Knowledge and information flow may also represent an important constraint to achieving changes in
traditional poultry keeping systems. The majority of farmers, and particularly women, appeared to have
little contact with the extension service, the organisation that inevitably would have to provide the
catalyst for change. However, the results of this work illustrate that in the rural areas of peri-urban
Accra, the role of free-range, indigenous chickens in village livelihoods is likely to vary according to
other household activities and circumstances. Overall, chicken keeping and the contribution that the
chickens make to the household is certainly peripheral to other wealth creating activities. However, in
some circumstances the importance of chickens to livelihoods seems to be enhanced. They seem to be
of particular importance where other livestock are a major feature of the farming system. In such
circumstances farmers may give chickens greater priority, placing greater importance on the feeding of
the flock, for example. It is not clear whether this increased focus on the chicken flock is dictated by
economic necessity or whether there are cultural issues involved. Efforts to increase productivity, for
example by introducing vaccination against Newcastle disease, may be more likely to achieve success
if this more motivated group of farmers are used as pilots for such developments.
170
Intensive, housed systems
See Project B
There was evidence of the availability of extension advice, including health care, from government
sources, from private practitioners, and from farmer co-operatives. However, there were marked
differences in the availability of extension services between the peri-urban Accra and Kumasi sites. All
sources of advice received less acknowledgement from Kumasi respondents compared to Accra
respondents. It is not clear whether this dearth of extension services in Kumasi is the result of (1) the
lack of the support services themselves, (2) a lack of impact by the existing support services, (3) the
lack of suitably knowledgeable extension agents to serve the poultry industry, or (4) whether the larger
producers in peri-urban Kumasi have reached a level of technical knowledge that supersedes the local
extension service. Whatever the explanation, the lack of extension services support for Kumasi farmers
is of concern and the situation is worthy of further investigation.
Where extension services do exist and operate, it seems that the advice on offer was most likely to be
directed at issues relating to health and production. Some help was offered with credit. However,
marketing clearly received little emphasis. Given the generally perceived problems associated with
marketing poultry meat, this seems to be a shortcoming.
The marked contrast between Accra and Kumasi is again apparent in relation to membership of
associations. Farmers in Accra appear to be far more enthusiastic about joining local associations than
did farmers in Kumasi. In Accra, the limit to membership seemed to be the availability of local
associations to join, suggesting that encouragement to form associations would result in many more
farmers joining. However, consideration should be given to the purposes and achievements of such
associations. Existing associations appear to offer advantages in terms of the supply of inputs
(presumably members obtain discount on at least some inputs) and this presumably is a major
inducement for farmers to join such associations. Associations also provide information; this may well
be a valuable function as producers did not regard the availability of information as an important
constraint and must, therefore, be satisfied with the information on offer. There appears to be very
little effort by associations to provide help with credit and marketing.
Never the less, it is clear that associations are not always successful, particularly in Kumasi.
Associations appeared to have closed down because they had little or nothing to offer their members.
This may have resulted in the other main reason for closure, poor attendance at meetings.
Difficulties with marketing, particularly marketing poultry meat, has already been referred to. Farmer
associations should be a means of empowering small farmers, giving them greater influence not only in
obtaining inputs but also in terms of obtaining satisfactory prices for their products. Farmers identified
marketing as an important constraint. The majority sold their products to middlemen and the majority
171
complained about low prices obtained from middlemen. There would seem to be an important role for
associations to acknowledge the difficulties experienced by their small-farmer membership and to
become involved in marketing issues. Extension services could well play a part here, helping
associations to develop the necessary skills to undertake this important role.
3. Technical and business knowledge needs assessed
and
4. Comparison of management practices undertaken and transferability of practices assessed
See Project D
In both surveys carried out in Project D the performance data was used to classify producers as ‘top’,
‘middle’ or ‘bottom’. From the first survey it was clear that in the 2001 Christmas production period
higher gross margins were consistently a result of both lower costs and higher income per bird. Feed
costs were the major cost and were lowest for top producers, second lowest for middle producers and
highest for bottom producers. Feed costs throughout the production period i.e. per week, also showed
this. Information on feed types was not collected but feed costs per bag were very slightly higher for
top producers suggesting that they used higher quality feed and / or used feed more efficiently. Higher
income per bird is likely to be due to better access to markets and possibly the production of larger
birds, although data on bird size was not collected in 2001. Mortality rates were lower with middle
producers than bottom producers and lowest for top producers.
In 2002 the main findings were similar. Again higher gross margins were consistently a result of both
lower costs and higher income per bird. Feed costs were again the major cost but more detailed data
collection in 2002 revealed that producers paid the same prices as each other for various feeds. In
contrast to 2001, top producers sold broilers much earlier than bottom producers, thereby reducing feed
costs particularly. Again mortality rates were lowest for top producers. Higher prices per bird achieved
by top producers were partly due to the production of heavier birds than bottom producers. However
whilst top producers obtained the highest prices per bird, middle producers produced even heavier
birds. Top producers may therefore be achieving higher prices through better marketing e.g. direct to
towns or markets.
Performance varied considerably between the categories of producers identified and furthermore
standard deviations of performance indicators (see tables 1 and 2 in project D) were high, both of
which indicate the potential for many producers to improve their performance. Data entry and analysis
in Ghana for the 2001 survey was not completed in time to allow identification of detailed reasons for
differences and practices that could be transferred, before commencing the 2002 survey and work.
Potential transferable practices (see section 2.2, Project D) were therefore identified on the basis of
preliminary findings and of AEOs and TOs observations. Complete analysis followed by some
interviews with farmers would help clarify detailed reasons for differences.
172
The practices identified at the start of the 2002 survey were introduced to producers at the start of and
during the production period by AEOs and TOs.
Reducing wastage of feed e.g. feed little and often rather than twice per day to reduce spoilage.
Feed is the largest cost and in both years the top producers used it more efficiently. Comparing
performance in the two years the amount of feed fed per bird showed that the farmers taking part in
both surveys fed an average of 0.140 bags of feed per bird in 2001 compared to 0.164 bags in 2002. For
the other farmers the comparison was 0.067 bags per bird in 2001 and 0.198 bags per bird in 2002.
These figures show that rather than decreasing the amount of feed according to the advice of the
extension workers the amount of feed has increased. However, as noted earlier this may be due to
better recording of data in the 2002 survey, especially as the figure of 0.067 bags per bird in 2001
seems too small to be realistic. Advice was also given on the preparation of own feed, and although
there was insufficient data from 2001 to determine the extent of home feed preparation the data from
the 2002 survey showed that many of the farmers were mixing their own feed and that once they had
started to do this they continued to. Implementing a vaccination programme, including planning and purchasing of the necessary vaccines
at the appropriate times.
Advice was also given concerning vaccinations as many farmers observed that they were wasting
money on ineffective drugs. The advice given targeted more effective timing and proper storage with
some farmers working as a group to achieve this. The results in table 3 (Project D) suggest that this
advice was acted upon. Although the costs appear to be higher in the 2002 survey again this is highly
likely to be due to improved data collection. The reduced mortality rates may be partly as a result of
this. Increasing the frequency of litter changes to reduce disease incidence.
Another factor thought to effect hygiene was the frequency that litter (normally wood shavings) was
changed. This particular aspect was only recorded in the 2002 survey. However, the results showed that
the average cost per bird for shavings were 134, 135 and 105 Cedis for bottom, middle and top
producers respectively. Frequency of changing shavings did vary a little between groups with the
bottom producers changing their litter every 3.9 weeks on average, the middle producers 5.2 weeks and
the top producers every 4.7 weeks. This would appear to be more frequently than normal in that a
recent survey in the same area (Okantah et al, 2003) reported that only 31% of poultry producers
claimed to change litter monthly and the remainder ‘occasionally’ or ‘never’. This may also have
improved mortality rates. Improving marketing through e.g. timing of sales, seeking better prices.
Top producers consistently obtained higher prices. In 2002 it was evident that this was not just due to
the production of larger birds which suggests better marketing strategies such as selling in towns or
173
markets rather than at the farm gate. Interestingly there is less variation in bird prices in 2002 between
producers than in 2001. Whilst this may be a reflection of the market it could be due to producers
paying more attention to marketing. The length of production reduced considerably in 2002 and top
producers sold the majority of their birds much earlier than bottom producers. This is to be expected as
maintaining poultry once they are ready for sale is a waste of resources. TOs and AEOs working with
producers will have emphasised the importance of this and indeed reported successes regarding
improved production times. Two of the three AEOs / TOs interviewed specifically mentioned
improved feeding practice / formulations resulting in shorter production periods and with one claiming
that production periods of four farmers were reduced from 12 / 13 weeks to 7-8 weeks largely through
improved feeding practice (see section 3.5, Project D). Improved feed formulas and practices may have
enabled some farmers to reduce their production periods. However, the extent of the change between
2001 and 2002 is not likely to be just due to this and it is possible that some producers deliberately
delayed sales in 2001 to obtain better prices, which was a successful strategy that year.
In conclusion, clear differences in performance were evident between the different categories of
producer and whilst further enquiry would have been helpful, broad reasons for these are evident.
Practices introduced and encouraged by AEOs and TOs working with farmers in 2002 were on the
whole successful and therefore ‘transferable’.
5. Factors encouraging /discouraging intensification and expansion and improved sustainability identified
No formal information was collected on this topic.
6. Practical business planning methods and monitoring indicators, identified, developed and tested by producers
See Project D Participatory Budgets worked well as practical business management methods for use by and with
producers. The feedback from them and AEOs / TOs (section 3.5, Project D) clearly showed that they
had been used in planning and to make better informed decisions. Previously producers had not
planned in detail or calculated profitability. Detailed planning had resulted in producers considering
changes in practice and then implementing those they favoured. Calculating both planned and actual
profitability had resulted in producers changing practices and being able to see their effects. In addition
to the obvious benefits of this for management, producers and AEOs / TOs also reported other ways
that this had assisted including learning from the previous years experience and improved timing of
activities.
The ways that PBs aim to improve on conventional budgeting methods noted in section 3.4 were useful
in the context of broiler production. ‘Taking account of time’ i.e. breaking the production down into
weeks and being able to consider activities and their implications during the period was essential to
174
their success. However, the PBs used in this project used written text and were therefore less visual and
accessible to semi or non literate producers than PBs normally. They were also standardised (ie all had
the same content and layout) which reduced scope for flexibility and may have lead to them being
introduced and used in ways that are less interactive and participatory by AEOs / TOs. Furthermore
they were very detailed which reduced their ease of use. These factors were due partly to the project’s
need for data and the resulting emphasis on recording and collection of comparable data from
participants and partly because the PBs used in the 2002 longitudinal survey had been developed from
those used in 2001 when the aim was purely data collection. Some AEOs / TOs also felt more
comfortable using methods that were text rather than picture based. These aspects could easily be
addressed in future work and it is important to note that for PBs to be used effectively as business
management methods does not require detailed recording or data analysis. AEOs / TOs could for
example develop PBs with producers more visually and in a more interactive and flexible way using
flip charts. To assist with management decisions PBs can be developed and used in planning and at the
end of production periods but also on an ad hoc basis to explore management options.
As noted earlier monitoring indicators have been produced based on the data collected and could be
used to compare producers plans and performance. However it should be noted that there is
considerable variation in conditions from year to year which will affect performance. Encouraging
farmers to work out their own costs and outputs is time consuming although probably more useful for
management decision making than use of standard figures. Control has been defined as “the process of
monitoring progress of a farm business and taking corrective action when desired performance levels
are not being met” (Kay et al, 2004). PBs prepared as plans by producers provide a means of
monitoring progress and therefore a basis to compare actual progress with performance during the
season and when there is the opportunity to take corrective action.
7. Simple adaptive feed interventions identified, selected and tested on-farm by participants
and
8. Simplified ration formulation spread sheet produced for costing alternative diets and providing alternative costed diets
See Project E and Feed Manual
9. Improved market opportunities for broiler output investigated and information available for market planning
See Project C
Conclusions from this study were: • The share of imported poultry in total poultry meat traded or consumed was very high.
• Imported poultry meat traded was mostly parts (thighs and wings).
• Market opportunities for local (home-grown) broilers are more promising among caterers and
supermarkets.
• Large farms supply the largest proportion of local broiler parts to supermarkets.
175
• Caterers and supermarkets use or sell more home-grown dressed whole broilers than home-
grown broiler parts.
• Majority of caterers who were particular about weight preferred birds of 1.0-1.6kg.
Supermarkets also desired weights of between 1kg and 1.6kg.
• Conditions regarding product presentation desired by traders included good packaging, well-
plucked birds, non-discoloured (white) birds. Supermarkets also mentioned good labelling.
• Most caterers and supermarkets did not actively seek suppliers. Sources of information
included personal contacts, window shopping, visits by suppliers to traders, and visits to
suppliers by producers.
• Terms of trade were rarely comprehensively negotiated. Most traders agreed on only price and
payment terms and most agreements were verbal.
• Incomes influence broiler consumption to a large extent.
• Product freshness, perception about health, size and price also affect consumption of broilers.
10. Producer workshop to disseminate results, with training sessions for producers
See Training
11. Uptake and adoption of interventions by trained producers and those taking part in studies assessed and financial, social and technical impacts quantified
This activity was not undertaken because of lack of time.
12. Potential users /disseminators of this work informed of findings in a workshop. Final stakeholder meeting.
176
Contribution of outputs 1. Constraints to peri-urban small-holder poultry producers quantified and prioritised
Constraints to traditional free-range poultry keeping
See Project A It seems that vaccination against Newcastle disease alone is unlikely to give the benefits hoped for or at
best will give only a proportion of those benefits. As with most biological systems, modification of a
single factor is unlikely to perturb the equilibrium of the population substantially as a second factor
will arise to moderate population growth. This suggests that poultry keepers who adopt vaccination
must be provided with knowledge and information to support greater numbers of chickens and allow
the poultry keepers to reap the benefits that could be conferred by vaccination. However, this suggests
that the means of increasing chicken flocks becomes much more complex than simply controlling a
major disease. Such complexity, together with the need for increasing resources such as feed, may not
be appropriate for a minority household activity such as the chicken flock.
However, the priorities of households must be taken into account. The results of this study illustrate
that in the rural areas of peri-urban Accra, the role of free-range, indigenous chickens in village
livelihoods is likely to vary according to other household activities and circumstances. Overall, chicken
keeping and the contribution that the chickens make to the household is certainly peripheral to other
wealth creating activities. However, in some circumstances the importance of chickens to livelihoods
seems to be enhanced. They seem to be of particular importance where other livestock are a major
feature of the farming system. In such circumstances farmers may give chickens greater priority,
placing greater importance on the feeding of the flock, for example. It is not clear whether this
increased focus on the chicken flock is dictated by economic necessity or whether there are cultural
issues involved. Efforts to increase productivity, for example by introducing vaccination against
Newcastle disease, may be more likely to achieve success if this more motivated group of farmers are
used as pilots for such developments.
Constraints to intensive, housed production systems
See Projects B and C
Perhaps one of the most important changes that could be achieved by smallscale producers is to
organise themselves effectively into producer associations and to acquire the skills required to
effectively market their products, thus achieving a greater share of the final product price. Such
organisation might also lead to improvements in the supply of inputs such as vaccines and day-old
chicks, both of which are a concern to at least some of the farming community. Large, powerful
associations may also be able to hire specialist advisors, or at least provide the incentive for the
development of private practitioners. The state sector is perhaps best advised to encourage and hasten
177
this development by advising and helping small farmers to set up and organise such associations. Given
that such associations have not always been successful in the past, firm guidance from the state sector
would seem to be essential.
4. Comparison of management practices undertaken and transferability of practices assessed
and
6. Practical business planning methods and monitoring indicators, identified, developed and tested by producers See Project D
The potential for PBs to facilitate extension, mainly by enabling farmers and extension staff to plan
enterprises, identify how to make improvements and consider their implications in terms of activities
and resources, was outlined in section 2.4. PBs were used in this way alongside the longitudinal survey.
AEOs and TOs helped producers to plan their enterprise at the start of the production period, explore
the potential effects of implementing improved management practices and reviewed performance
during and after the production period.
The feedback from farmers, AEOs and TOs demonstrated that farmers found the process beneficial and
that it had improved both their practices and their understanding. Of particular note from these
comments was that producers and extension staff had understood better the relationship between
management practices and profitability and farmers were able to improve their decision making. For
example AEO / TO 2 reported that “planning ensured farmers didn’t run out of money during
production” and “farmers know what price they need to achieve in order to cover costs and make a
profit”. Differences in performance between 2002 (when producers started worked with farmers using PBs)
and 2001 were explored in section 3.3 (project D). The performance of producers who had taken part in
both surveys appeared to have improved after taking into account the effects of more detailed record
keeping). Whilst the use of PBs in extension is likely to have contributed to the improvement it is not
possible to identify what its contribution is compared to that of others, such as the introduction of
specific transferable practices, increased contact with extension staff, and variations in external factors
between the years (markets, prices, disease outbreaks). The feedback from farmers and extension staff
together with observations of the project staff indicated that PBs were providing a constructive tool and
framework for extension staff and producers to use, although some extension staff still tended to use
them in a rather ‘top down’ i.e. to inform producers what would be best practices rather than jointly
exploring the likely consequences of implementing them.
These observations agree with those on the use of PBs with farmers for other enterprises and in other
locations e.g. Galpin et al (2000) on tomato producers in Ghana and Dorward (1999) on a variety of
enterprises in Zimbabwe where farmers’ feedback was again positive. A limitation of the use of PBs in
the project the Ghana poultry project was the large amount of extension and other staff time it took. It

178
is important to note that the detailed record keeping and collection and analysis of data (as part of the
2002 longitudinal survey), which was responsible for this, was necessary for other aspects of the
research. PBs could successfully be used in extension without detailed record keeping or analysis. PBs
could be drawn up with producers before the start of the season and management options explored.
Extension staff would need to give some support to farmers in using their PBs, perhaps through two or
three visits early in the season, and then results could be explored jointly at the end of the production
period. Certainly weekly visits would not be necessary. AEOs could put more input into a group of
producers in their first year of using PBs and less in subsequent years. PBs could also be used usefully
in one-off sessions with farmers to explain and explore the likely effects of changing management
practices.
179
REFERENCES
Aboe P. and Dorward, P. (2003) Budgeting to Improve Broiler production. The University of Reading,
U.K. and the Animal Resarch Institute, Ghana.
Berkowitz E.N., R.H. Kerin, S.W. Hartley, and W. Rudelius (1986). Marketing. Boston, New York,
USA: McGraw-Hill.
Chisnail, P.M. (1996). The Essence of Marketing Research. New Delhi: Prentice-Hall of India Private
Limited.
Crawford I. M. (1997). Agricultural and Food Marketing Management. Rome: Food and Agriculture
Organisation.
Dorward, P. (1999) Participatory Farm Management Methods for Improved Agricultural Extension
with Smallholder Farmers in Zimbabwe. PhD Thesis. The University of Reading.
Dorward, P., Shepherd, D. D. and Wolmer, W. (1997) Developing Farm Management Type Methods
for Participatory Needs Assessment. Agricultural Systems 55, 2: 239-256.
Food and Agriculture Organisation (2000). FAOSTAT. Rome, Italy.
Galpin, M., Dorward, P. and Shepherd, D.D. (2000) Participatory Farm Management Methods for
Research and Extension. A Training Manual. DFID and the University of Reading.
Ghana Poultry Farmers' Association. (2000). Broiler Revitalisation Programme.
Ghana Stock Exchange (2004) National Consumer Price Index & Other Inflation Rates 2001 (online).
Accra: Ghana Stock Exchange. Available from http://www.gse.com.gh/econs/infl.asp?year=2001
Holtzman J.S., F.A. Lichte, and F. Tefft. (1995). Using Rapid Appraisal to Examine Coarse Grain
Processing and Utilisation in Mali. In G.J. Scott (ed.) Prices, Products and People. Colorado, USA:
Lynne Reinner Publishers in Cooperation with International Potato Center (CIP), Peru.
Inland Revenue (2004) Ghana Exchange Rates (online). London: Inland Revenue. Available from:
http://www.inlandrevenue.gov.uk/exrate/01_0041_ERL.htm (Accessed 3 August 2004).
Kay, D., Edwards, W. M. & Duffy, P. A. (2004) Farm Management. Fifth edition. New York, McGraw
Hill.

180
Okantah, S. A., Aboe, P. A. T., Boa-Amponsem, K., Dorward, P. T. and Bryant, M. J. (2003)
Smallscale Chicken Keeping in Peri-Urban Accra and Kumasi. The University of Reading, U.K. and
the Animal Resarch Institute, Ghana.
Scarborough, V. and Kydd, J. (1992). Economic Analysis of Agricultural Markets: A Manual.
Chatham, U.K: Natural Resources Institute
181
PUBLICATIONS ABOE, P.A.T., BOA-AMPONSEM, K., OKANTAH, S.A., BUTLER, E.A., DORWARD, P.T. and BRYANT, M.J. (2003). Free-range indigenous chickens: their husbandry and contribution to village livelihoods in peri-urban Accra. Animal Research Institute, Council for Scientific and Industrial Research, PO Box AH20, Achimota, Ghana/Department of Agriculture, The University of Reading, PO Box 236, Reading RG6 6AT, UK. 63 pp. AMELEKE, G., BOA-AMPONSEM, K., ABOE, P.A.T. and OKANTAH, S.A. (2003). Baseline information for the Accra broiler market. Animal Research Institute, Council for Scientific and Industrial Research, PO Box AH20, Achimota, Ghana. 38 pp. BOA-AMPONSEM, K., OKANTAH, S.A., ABOE, P.A.T. and MACHIN, D.H. (2003). Diets for layers and broilers: a manual for smallholder poultry farmers. Animal Research Institute, Council for Scientific and Industrial Research, PO Box AH20, Achimota, Ghana/Department of Agriculture, The University of Reading, PO Box 236, Reading RG6 6AT, UK. 63 pp. OKANTAH, S.A., ABOE, P.A.T., BOA-AMPONSEM, K., DORWARD, P.T. and BRYANT, M.J. (2003). Smallscale chicken keeping in peri-urban Accra and Kumasi. Animal Research Institute, Council for Scientific and Industrial Research, PO Box AH20, Achimota, Ghana/Department of Agriculture, The University of Reading, PO Box 236, Reading RG6 6AT, UK. 63 pp. YATES, C.M., DORWARD, P.T. and ABOE, P. (2004). Smallscale poultry broiler production in peri-urban areas of Ghana and the potential of business management methods for improved management. Animal Research Institute, Council for Scientific and Industrial Research, PO Box AH20, Achimota, Ghana/Department of Agriculture, The University of Reading, PO Box 236, Reading RG6 6AT, UK. 41 pp.
182
Annex:
Poultry Diets
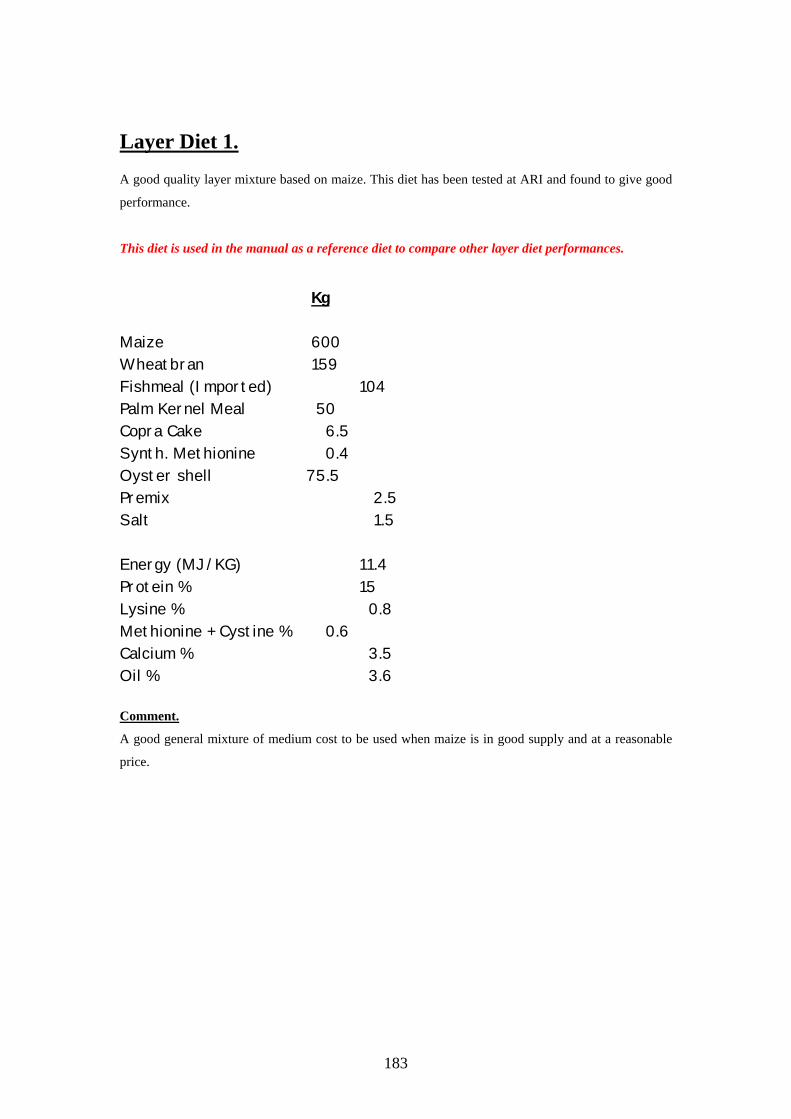
183
Layer Diet 1. A good quality layer mixture based on maize. This diet has been tested at ARI and found to give good
performance.
This diet is used in the manual as a reference diet to compare other layer diet performances.
Kg Maize 600 Wheatbran 159 Fishmeal (Imported) 104 Palm Kernel Meal 50 Copra Cake 6.5 Synth. Methionine 0.4 Oyster shell 75.5 Premix 2.5 Salt 1.5 Energy (MJ/KG) 11.4 Protein % 15 Lysine % 0.8 Methionine + Cystine % 0.6 Calcium % 3.5 Oil % 3.6 Comment.
A good general mixture of medium cost to be used when maize is in good supply and at a reasonable
price.
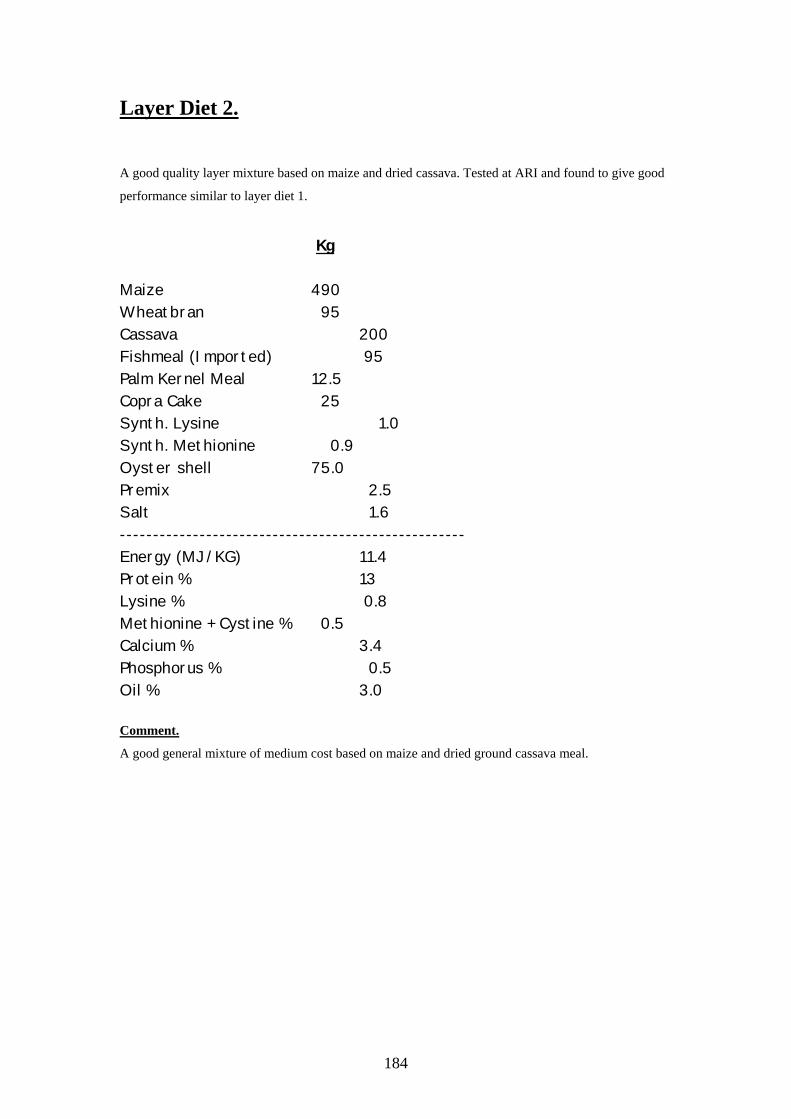
184
Layer Diet 2. A good quality layer mixture based on maize and dried cassava. Tested at ARI and found to give good
performance similar to layer diet 1.
Kg
Maize 490 Wheatbran 95 Cassava 200 Fishmeal (Imported) 95 Palm Kernel Meal 12.5 Copra Cake 25 Synth. Lysine 1.0 Synth. Methionine 0.9 Oyster shell 75.0 Premix 2.5 Salt 1.6 ---------------------------------------------------- Energy (MJ/KG) 11.4 Protein % 13 Lysine % 0.8 Methionine + Cystine % 0.5 Calcium % 3.4 Phosphorus % 0.5 Oil % 3.0 Comment.
A good general mixture of medium cost based on maize and dried ground cassava meal.

185
Layer Diet 3.
A high quality layer mixture of high energy concentration based on maize and tested at ARI. Found to
give good performance similar to layer diet 1.
Kg
Maize 594 Wheatbran 178 Fishmeal (Imported) 80 Palm Kernel Meal 50 Copra Cake 12.5 Synth. Lysine 1.8 Synth. Methionine 0.8 DCP 0.6 Oyster shell 78 Premix 2.5 Salt 1.7 -------------------------------------------------- Energy (MJ/KG) 11.5 Protein % 14 Lysine % 0.8 Methionine + Cystine % 0.6 Calcium % 3.5 Phosphorus % 0.6 Oil % 3.6 Comment.
A high quality mixture of higher cost but high performance. Use when maize is in good supply and a
reasonable price and a full range of other ingredients are available.
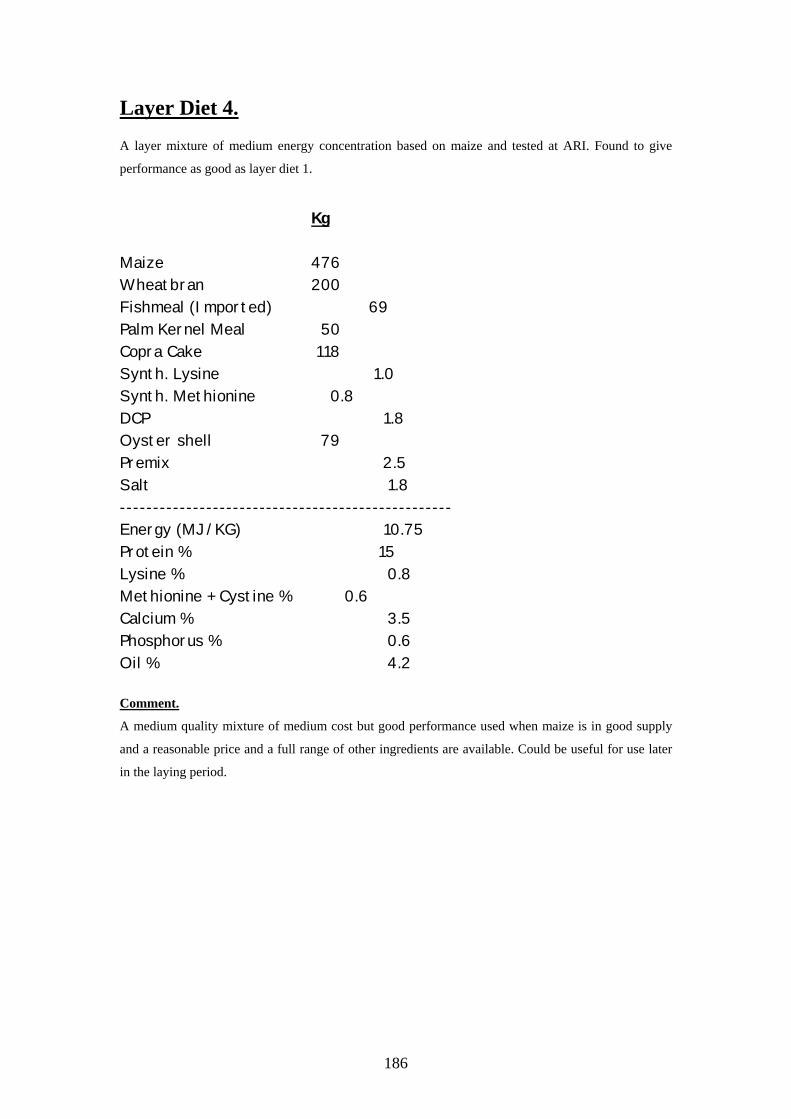
186
Layer Diet 4. A layer mixture of medium energy concentration based on maize and tested at ARI. Found to give
performance as good as layer diet 1.
Kg
Maize 476 Wheatbran 200 Fishmeal (Imported) 69 Palm Kernel Meal 50 Copra Cake 118 Synth. Lysine 1.0 Synth. Methionine 0.8 DCP 1.8 Oyster shell 79 Premix 2.5 Salt 1.8 -------------------------------------------------- Energy (MJ/KG) 10.75 Protein % 15 Lysine % 0.8 Methionine + Cystine % 0.6 Calcium % 3.5 Phosphorus % 0.6 Oil % 4.2 Comment.
A medium quality mixture of medium cost but good performance used when maize is in good supply
and a reasonable price and a full range of other ingredients are available. Could be useful for use later
in the laying period.
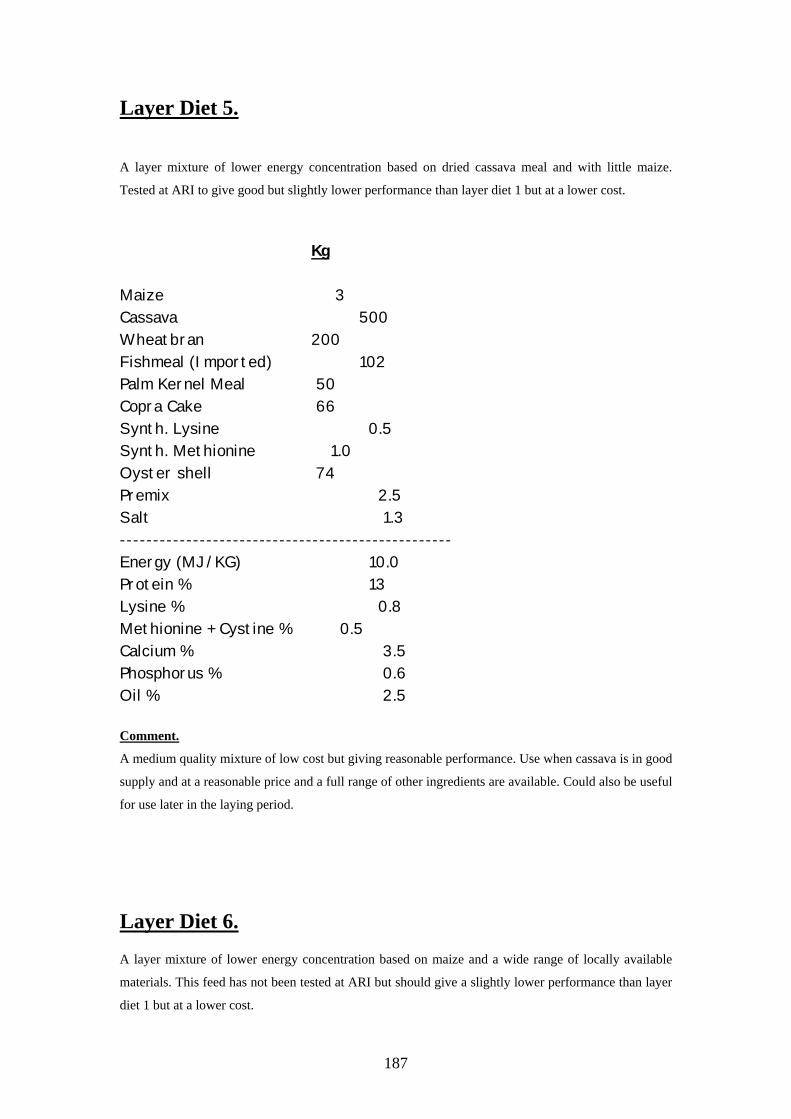
187
Layer Diet 5. A layer mixture of lower energy concentration based on dried cassava meal and with little maize.
Tested at ARI to give good but slightly lower performance than layer diet 1 but at a lower cost.
Kg Maize 3 Cassava 500 Wheatbran 200 Fishmeal (Imported) 102 Palm Kernel Meal 50 Copra Cake 66 Synth. Lysine 0.5 Synth. Methionine 1.0 Oyster shell 74 Premix 2.5 Salt 1.3 -------------------------------------------------- Energy (MJ/KG) 10.0 Protein % 13 Lysine % 0.8 Methionine + Cystine % 0.5 Calcium % 3.5 Phosphorus % 0.6 Oil % 2.5 Comment.
A medium quality mixture of low cost but giving reasonable performance. Use when cassava is in good
supply and at a reasonable price and a full range of other ingredients are available. Could also be useful
for use later in the laying period.
Layer Diet 6. A layer mixture of lower energy concentration based on maize and a wide range of locally available
materials. This feed has not been tested at ARI but should give a slightly lower performance than layer
diet 1 but at a lower cost.
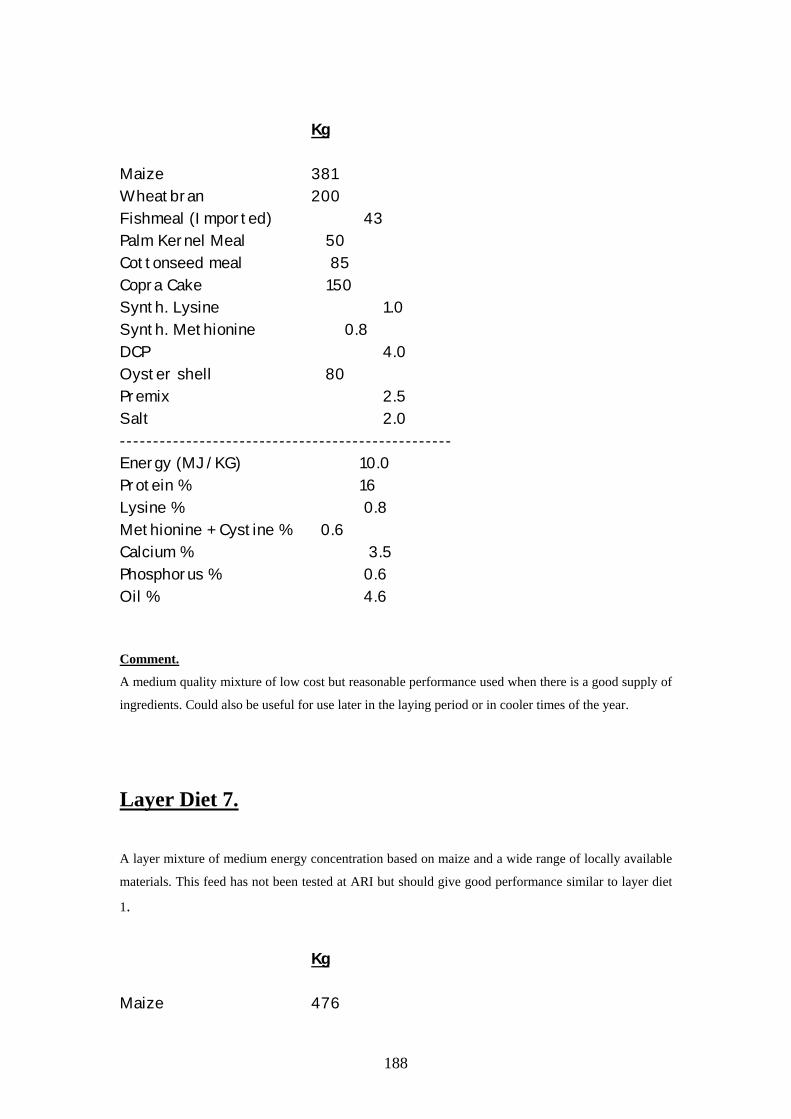
188
Kg
Maize 381 Wheatbran 200 Fishmeal (Imported) 43 Palm Kernel Meal 50 Cottonseed meal 85 Copra Cake 150 Synth. Lysine 1.0 Synth. Methionine 0.8 DCP 4.0 Oyster shell 80 Premix 2.5 Salt 2.0 -------------------------------------------------- Energy (MJ/KG) 10.0 Protein % 16 Lysine % 0.8 Methionine + Cystine % 0.6 Calcium % 3.5 Phosphorus % 0.6 Oil % 4.6 Comment.
A medium quality mixture of low cost but reasonable performance used when there is a good supply of
ingredients. Could also be useful for use later in the laying period or in cooler times of the year.
Layer Diet 7. A layer mixture of medium energy concentration based on maize and a wide range of locally available
materials. This feed has not been tested at ARI but should give good performance similar to layer diet
1.
Kg
Maize 476
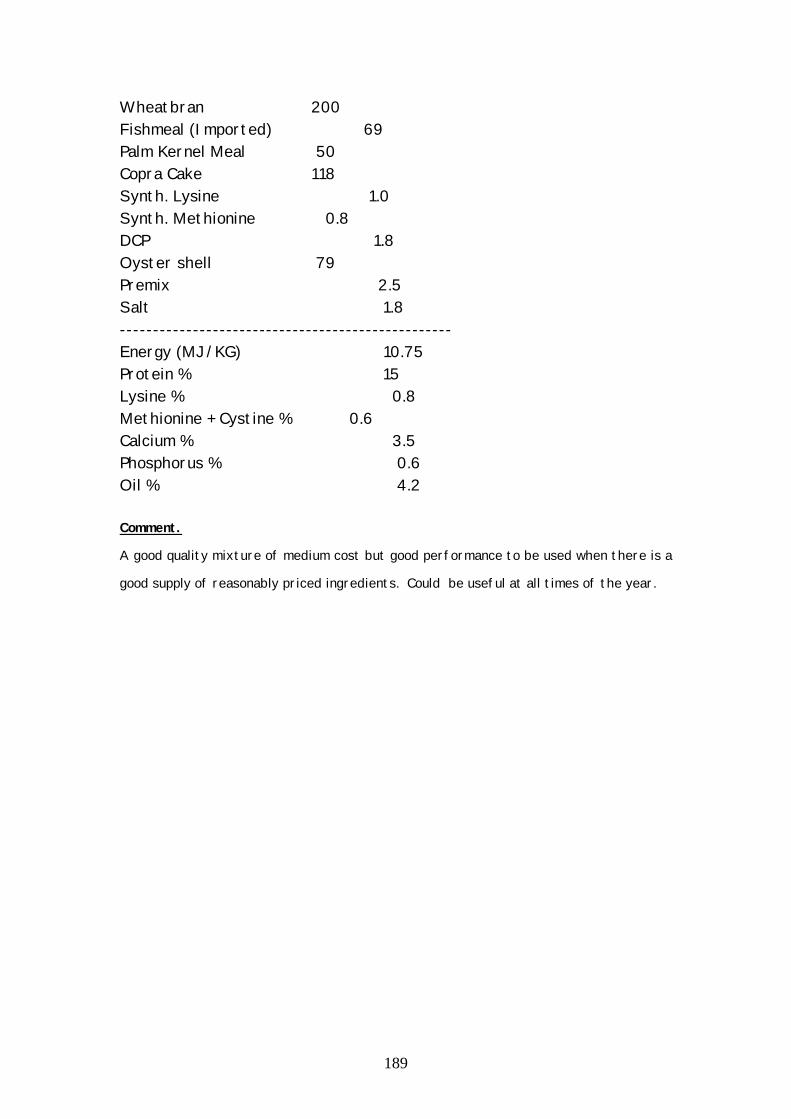
189
Wheatbran 200 Fishmeal (Imported) 69 Palm Kernel Meal 50 Copra Cake 118 Synth. Lysine 1.0 Synth. Methionine 0.8 DCP 1.8 Oyster shell 79 Premix 2.5 Salt 1.8 -------------------------------------------------- Energy (MJ/KG) 10.75 Protein % 15 Lysine % 0.8 Methionine + Cystine % 0.6 Calcium % 3.5 Phosphorus % 0.6 Oil % 4.2 Comment.
A good quality mixture of medium cost but good performance to be used when there is a
good supply of reasonably priced ingredients. Could be useful at all times of the year.
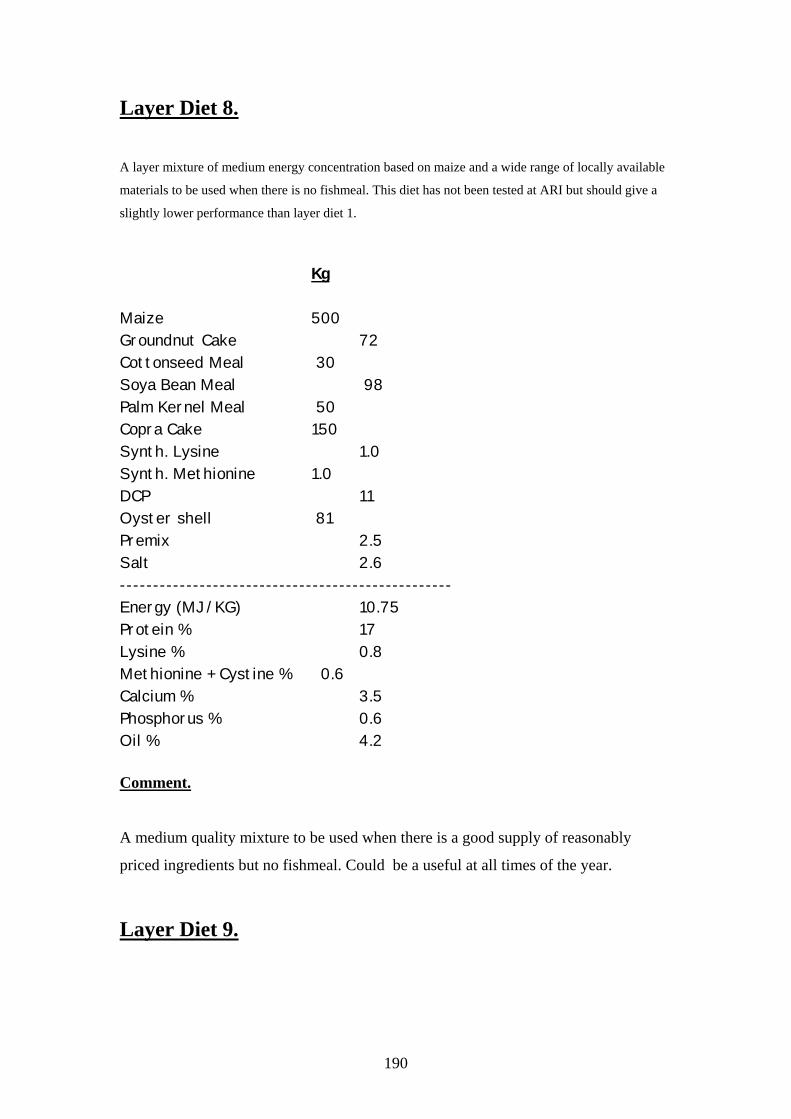
190
Layer Diet 8. A layer mixture of medium energy concentration based on maize and a wide range of locally available
materials to be used when there is no fishmeal. This diet has not been tested at ARI but should give a
slightly lower performance than layer diet 1.
Kg Maize 500 Groundnut Cake 72 Cottonseed Meal 30 Soya Bean Meal 98 Palm Kernel Meal 50 Copra Cake 150 Synth. Lysine 1.0 Synth. Methionine 1.0 DCP 11 Oyster shell 81 Premix 2.5 Salt 2.6 -------------------------------------------------- Energy (MJ/KG) 10.75 Protein % 17 Lysine % 0.8 Methionine + Cystine % 0.6 Calcium % 3.5 Phosphorus % 0.6 Oil % 4.2 Comment.
A medium quality mixture to be used when there is a good supply of reasonably
priced ingredients but no fishmeal. Could be a useful at all times of the year.
Layer Diet 9.
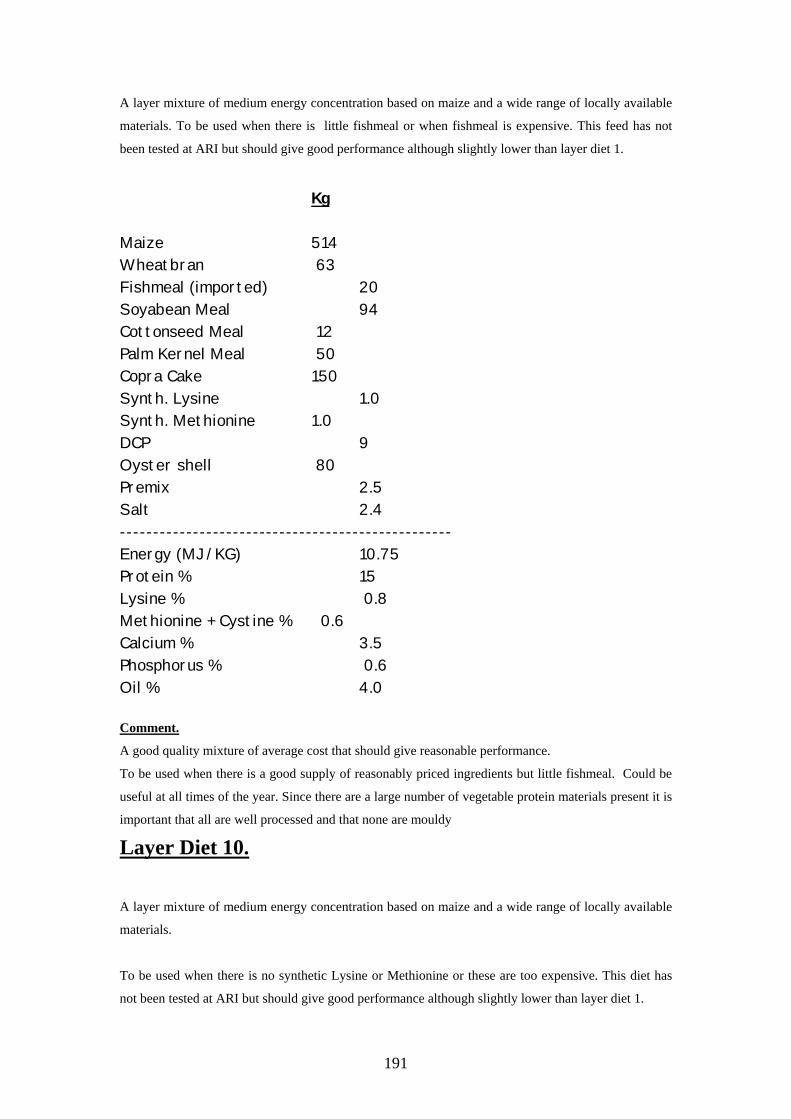
191
A layer mixture of medium energy concentration based on maize and a wide range of locally available
materials. To be used when there is little fishmeal or when fishmeal is expensive. This feed has not
been tested at ARI but should give good performance although slightly lower than layer diet 1.
Kg
Maize 514 Wheatbran 63 Fishmeal (imported) 20 Soyabean Meal 94 Cottonseed Meal 12 Palm Kernel Meal 50 Copra Cake 150 Synth. Lysine 1.0 Synth. Methionine 1.0 DCP 9 Oyster shell 80 Premix 2.5 Salt 2.4 -------------------------------------------------- Energy (MJ/KG) 10.75 Protein % 15 Lysine % 0.8 Methionine + Cystine % 0.6 Calcium % 3.5 Phosphorus % 0.6 Oil % 4.0 Comment.
A good quality mixture of average cost that should give reasonable performance. To be used when there is a good supply of reasonably priced ingredients but little fishmeal. Could be
useful at all times of the year. Since there are a large number of vegetable protein materials present it is
important that all are well processed and that none are mouldy
Layer Diet 10. A layer mixture of medium energy concentration based on maize and a wide range of locally available
materials.
To be used when there is no synthetic Lysine or Methionine or these are too expensive. This diet has
not been tested at ARI but should give good performance although slightly lower than layer diet 1.
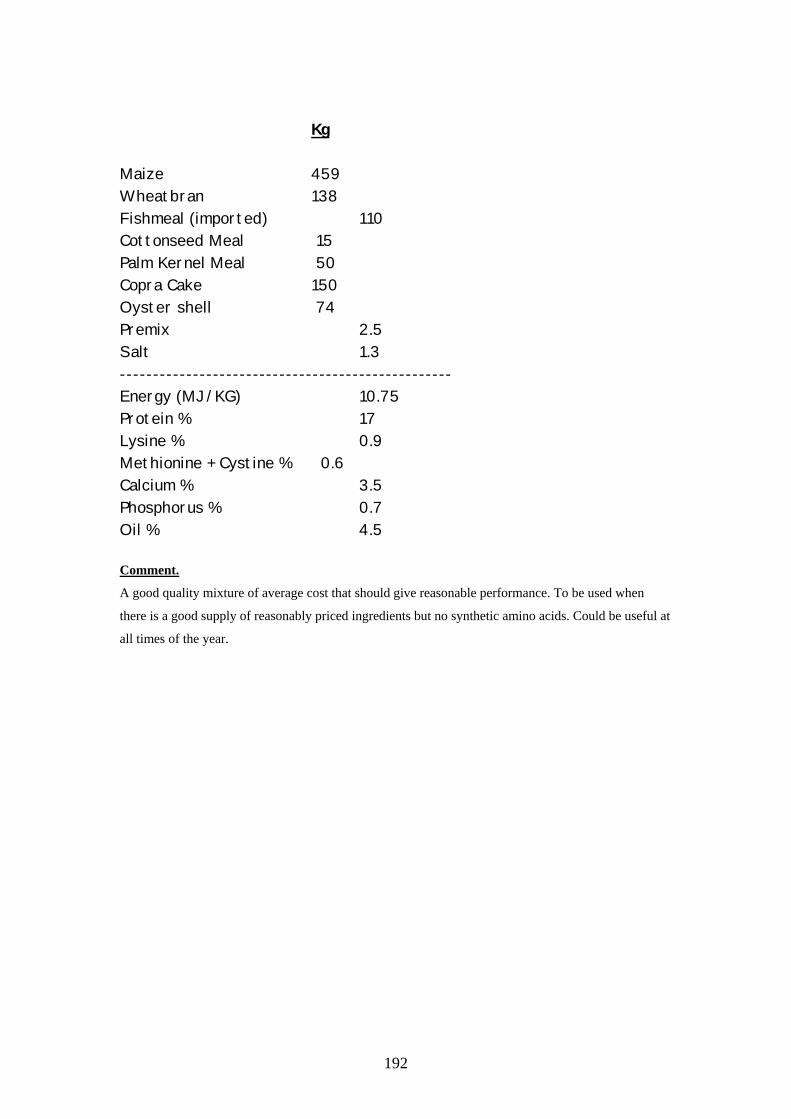
192
Kg
Maize 459 Wheatbran 138 Fishmeal (imported) 110 Cottonseed Meal 15 Palm Kernel Meal 50 Copra Cake 150 Oyster shell 74 Premix 2.5 Salt 1.3 -------------------------------------------------- Energy (MJ/KG) 10.75 Protein % 17 Lysine % 0.9 Methionine + Cystine % 0.6 Calcium % 3.5 Phosphorus % 0.7 Oil % 4.5 Comment.
A good quality mixture of average cost that should give reasonable performance. To be used when
there is a good supply of reasonably priced ingredients but no synthetic amino acids. Could be useful at
all times of the year.
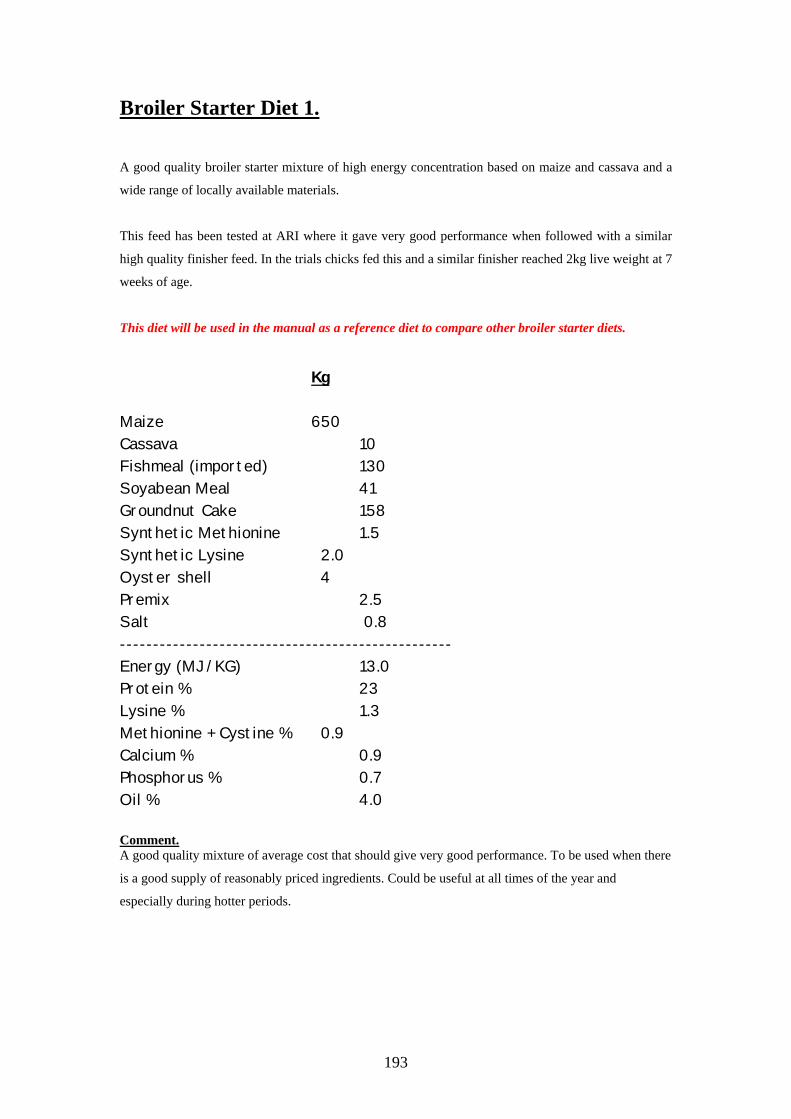
193
Broiler Starter Diet 1. A good quality broiler starter mixture of high energy concentration based on maize and cassava and a
wide range of locally available materials.
This feed has been tested at ARI where it gave very good performance when followed with a similar
high quality finisher feed. In the trials chicks fed this and a similar finisher reached 2kg live weight at 7
weeks of age.
This diet will be used in the manual as a reference diet to compare other broiler starter diets.
Kg Maize 650 Cassava 10 Fishmeal (imported) 130 Soyabean Meal 41 Groundnut Cake 158 Synthetic Methionine 1.5 Synthetic Lysine 2.0 Oyster shell 4 Premix 2.5 Salt 0.8 -------------------------------------------------- Energy (MJ/KG) 13.0 Protein % 23 Lysine % 1.3 Methionine + Cystine % 0.9 Calcium % 0.9 Phosphorus % 0.7 Oil % 4.0 Comment. A good quality mixture of average cost that should give very good performance. To be used when there
is a good supply of reasonably priced ingredients. Could be useful at all times of the year and
especially during hotter periods.
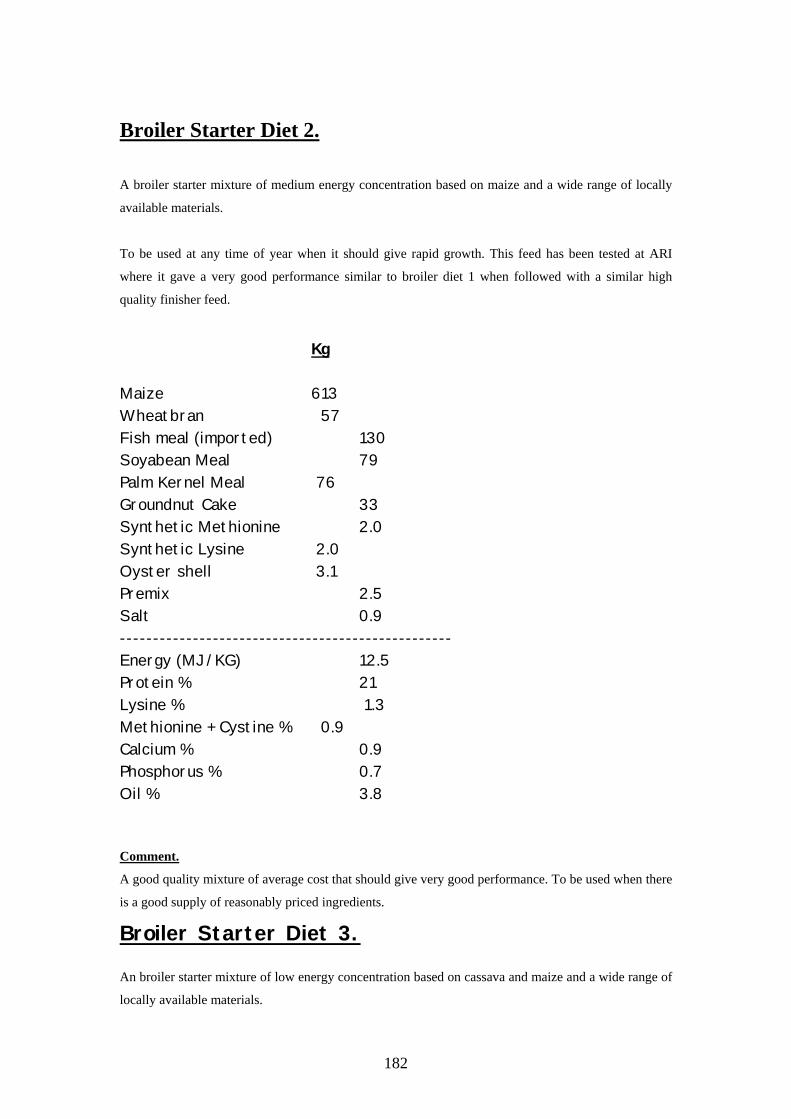
182
Broiler Starter Diet 2.
A broiler starter mixture of medium energy concentration based on maize and a wide range of locally
available materials.
To be used at any time of year when it should give rapid growth. This feed has been tested at ARI
where it gave a very good performance similar to broiler diet 1 when followed with a similar high
quality finisher feed.
Kg
Maize 613 Wheatbran 57 Fish meal (imported) 130 Soyabean Meal 79 Palm Kernel Meal 76 Groundnut Cake 33 Synthetic Methionine 2.0 Synthetic Lysine 2.0 Oyster shell 3.1 Premix 2.5 Salt 0.9 -------------------------------------------------- Energy (MJ/KG) 12.5 Protein % 21 Lysine % 1.3 Methionine + Cystine % 0.9 Calcium % 0.9 Phosphorus % 0.7 Oil % 3.8 Comment.
A good quality mixture of average cost that should give very good performance. To be used when there
is a good supply of reasonably priced ingredients.
Broiler Starter Diet 3. An broiler starter mixture of low energy concentration based on cassava and maize and a wide range of
locally available materials.
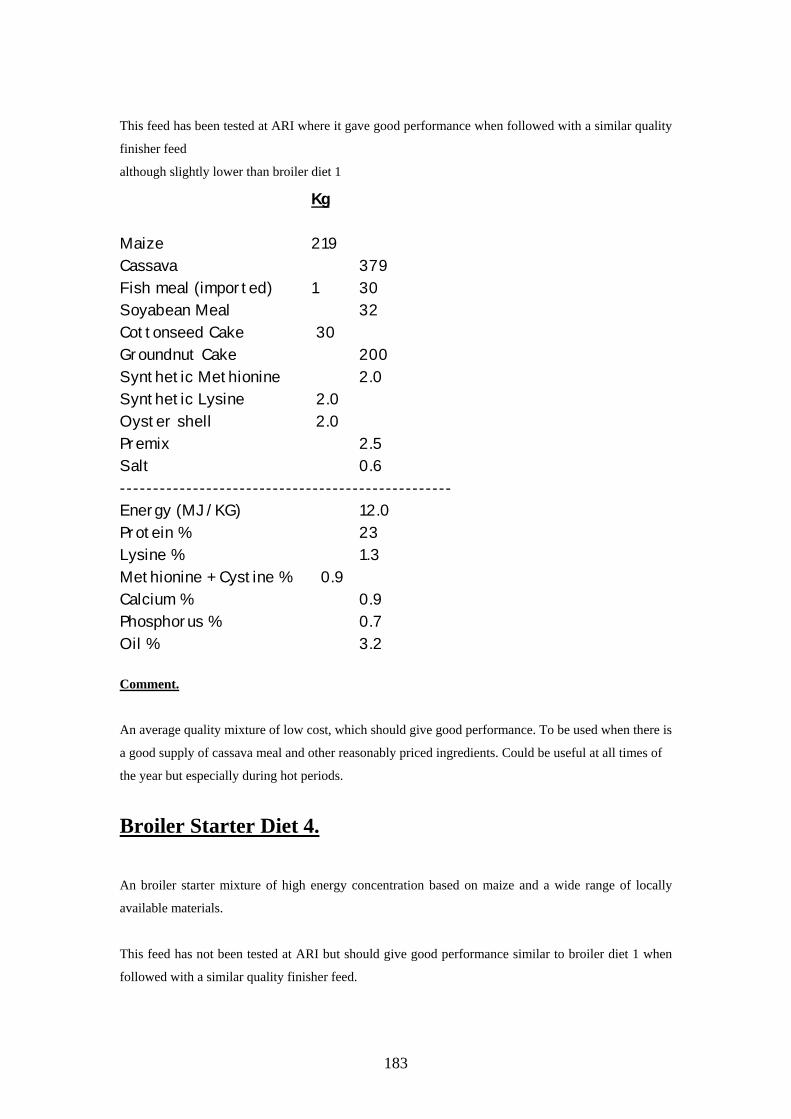
183
This feed has been tested at ARI where it gave good performance when followed with a similar quality
finisher feed
although slightly lower than broiler diet 1
Kg Maize 219 Cassava 379 Fish meal (imported) 1 30 Soyabean Meal 32 Cottonseed Cake 30 Groundnut Cake 200 Synthetic Methionine 2.0 Synthetic Lysine 2.0 Oyster shell 2.0 Premix 2.5 Salt 0.6 -------------------------------------------------- Energy (MJ/KG) 12.0 Protein % 23 Lysine % 1.3 Methionine + Cystine % 0.9 Calcium % 0.9 Phosphorus % 0.7 Oil % 3.2 Comment.
An average quality mixture of low cost, which should give good performance. To be used when there is
a good supply of cassava meal and other reasonably priced ingredients. Could be useful at all times of
the year but especially during hot periods.
Broiler Starter Diet 4. An broiler starter mixture of high energy concentration based on maize and a wide range of locally
available materials.
This feed has not been tested at ARI but should give good performance similar to broiler diet 1 when
followed with a similar quality finisher feed.

184
Kg Maize 650 Wheatbran 3 Fish meal (imported) 130 Soyabean Meal 33 Groundnut Cake 173 Synthetic Methionine 1.4 Synthetic Lysine 2.0 Oyster shell 3.5 Premix 2.5 Salt 0.8 -------------------------------------------------- Energy (MJ/KG) 13.0 Protein % 23 Lysine % 1.3 Methionine + Cystine % 0.9 Calcium % 0.9 Phosphorus % 0.7 Oil % 4.1 Comment.
A high quality mixture of reasonable cost, which should give good performance. To be used when
there is a good supply of reasonably priced ingredients. Could be useful at all times of the year but
especially during hot periods.
Broiler Starter Diet 5. A broiler starter mixture of medium energy concentration based on maize and a wide range of locally
available materials.
To be used at any time of year when it should give good growth. This feed has not been tested at ARI
but it should give good performance, similar to broiler diet 1 when followed with a similar quality
finisher feed, though at a slightly lower cost.
Kg
Maize 596 Wheatbran 47

185
Fish meal (imported) 130 Soyabean Meal 80 Groundnut Cake 30 Palm Kernel Cake 107 Synthetic Methionine 2.0 Synthetic Lysine 2.0 Oyster shell 3.0 Premix 2.5 Salt 0.8 -------------------------------------------------- Energy (MJ/KG) 12.4 Protein % 21 Lysine % 1.3 Methionine + Cystine % 0.9 Calcium % 0.9 Phosphorus % 0.7 Oil % 3.9 Comment.
A good quality mixture of reasonable cost that should give good performance. To be used when there is
a good supply of reasonably priced ingredients.
Broiler Starter Diet 6. A broiler starter mixture of medium energy concentration based on maize and a wide range of locally available materials. To be used when there is no fishmeal or when fishmeal is too expensive. Can be used at any time of year when the diet should give good growth. This feed has not been tested at ARI but should give good performance, though slightly lower than broiler diet 1, when followed with a similar quality finisher feed.
Kg Maize 550 Wheatbran 1.3 Soyabean Meal 264 Groundnut Cake 151 Synthetic Methionine 2.0 Synthetic Lysine 2.0 Oyster shell 10.7 Premix 2.5 DCP 13.5

186
Salt 2.3 -------------------------------------------------- Energy (MJ/KG) 12.1 Protein % 24 Lysine % 1.3 Methionine + Cystine % 0.9 Calcium % 0.9 Phosphorus % 0.7 Oil % 3.2 Comment.
An average quality mixture of reasonable cost which should give good performance. To be used when
there is a good supply of reasonably priced ingredients but no fishmeal.
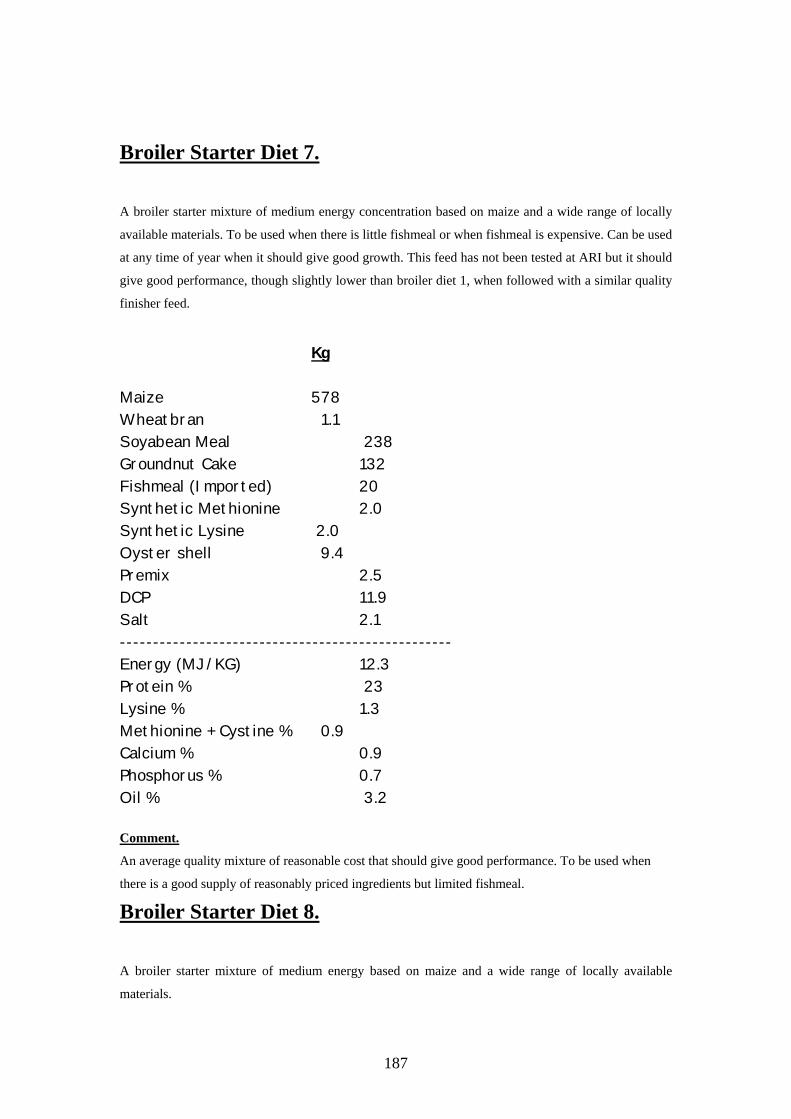
187
Broiler Starter Diet 7. A broiler starter mixture of medium energy concentration based on maize and a wide range of locally
available materials. To be used when there is little fishmeal or when fishmeal is expensive. Can be used
at any time of year when it should give good growth. This feed has not been tested at ARI but it should
give good performance, though slightly lower than broiler diet 1, when followed with a similar quality
finisher feed.
Kg
Maize 578 Wheatbran 1.1 Soyabean Meal 238 Groundnut Cake 132 Fishmeal (Imported) 20 Synthetic Methionine 2.0 Synthetic Lysine 2.0 Oyster shell 9.4 Premix 2.5 DCP 11.9 Salt 2.1 -------------------------------------------------- Energy (MJ/KG) 12.3 Protein % 23 Lysine % 1.3 Methionine + Cystine % 0.9 Calcium % 0.9 Phosphorus % 0.7 Oil % 3.2 Comment.
An average quality mixture of reasonable cost that should give good performance. To be used when
there is a good supply of reasonably priced ingredients but limited fishmeal.
Broiler Starter Diet 8. A broiler starter mixture of medium energy based on maize and a wide range of locally available
materials.
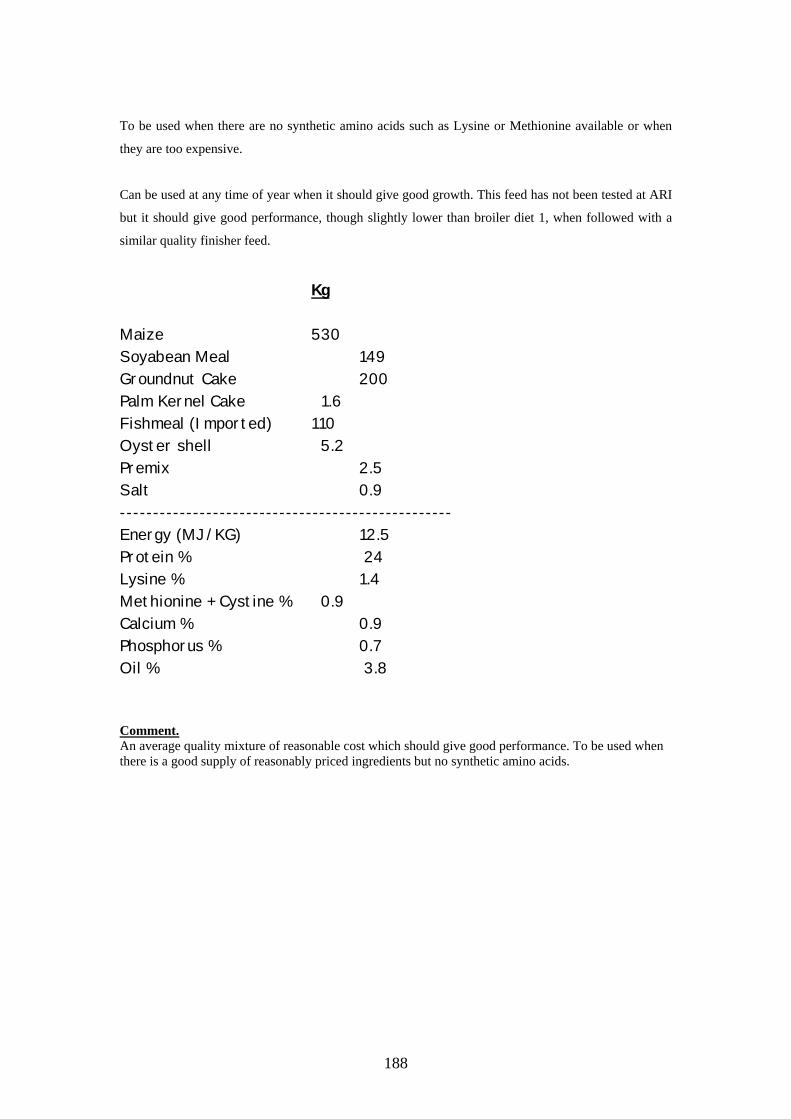
188
To be used when there are no synthetic amino acids such as Lysine or Methionine available or when
they are too expensive.
Can be used at any time of year when it should give good growth. This feed has not been tested at ARI
but it should give good performance, though slightly lower than broiler diet 1, when followed with a
similar quality finisher feed.
Kg
Maize 530 Soyabean Meal 149 Groundnut Cake 200 Palm Kernel Cake 1.6 Fishmeal (Imported) 110 Oyster shell 5.2 Premix 2.5 Salt 0.9 -------------------------------------------------- Energy (MJ/KG) 12.5 Protein % 24 Lysine % 1.4 Methionine + Cystine % 0.9 Calcium % 0.9 Phosphorus % 0.7 Oil % 3.8 Comment. An average quality mixture of reasonable cost which should give good performance. To be used when there is a good supply of reasonably priced ingredients but no synthetic amino acids.
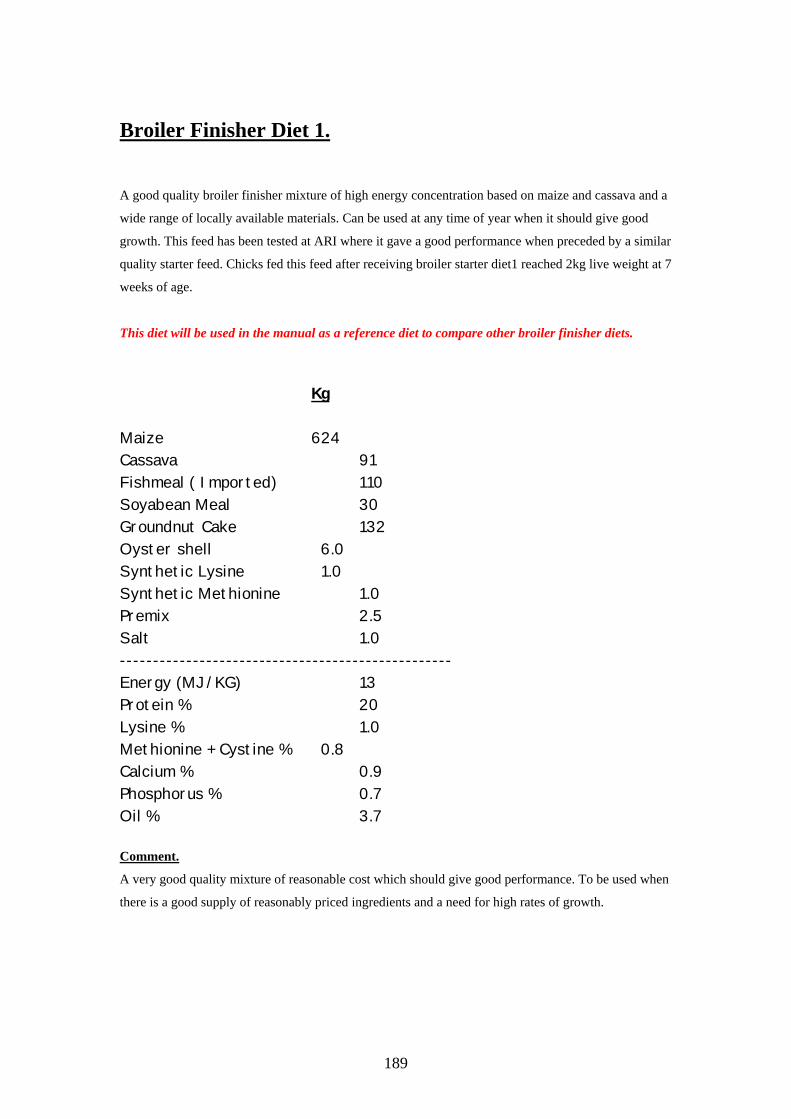
189
Broiler Finisher Diet 1. A good quality broiler finisher mixture of high energy concentration based on maize and cassava and a
wide range of locally available materials. Can be used at any time of year when it should give good
growth. This feed has been tested at ARI where it gave a good performance when preceded by a similar
quality starter feed. Chicks fed this feed after receiving broiler starter diet1 reached 2kg live weight at 7
weeks of age.
This diet will be used in the manual as a reference diet to compare other broiler finisher diets.
Kg Maize 624 Cassava 91 Fishmeal ( Imported) 110 Soyabean Meal 30 Groundnut Cake 132 Oyster shell 6.0 Synthetic Lysine 1.0 Synthetic Methionine 1.0 Premix 2.5 Salt 1.0 -------------------------------------------------- Energy (MJ/KG) 13 Protein % 20 Lysine % 1.0 Methionine + Cystine % 0.8 Calcium % 0.9 Phosphorus % 0.7 Oil % 3.7 Comment.
A very good quality mixture of reasonable cost which should give good performance. To be used when
there is a good supply of reasonably priced ingredients and a need for high rates of growth.
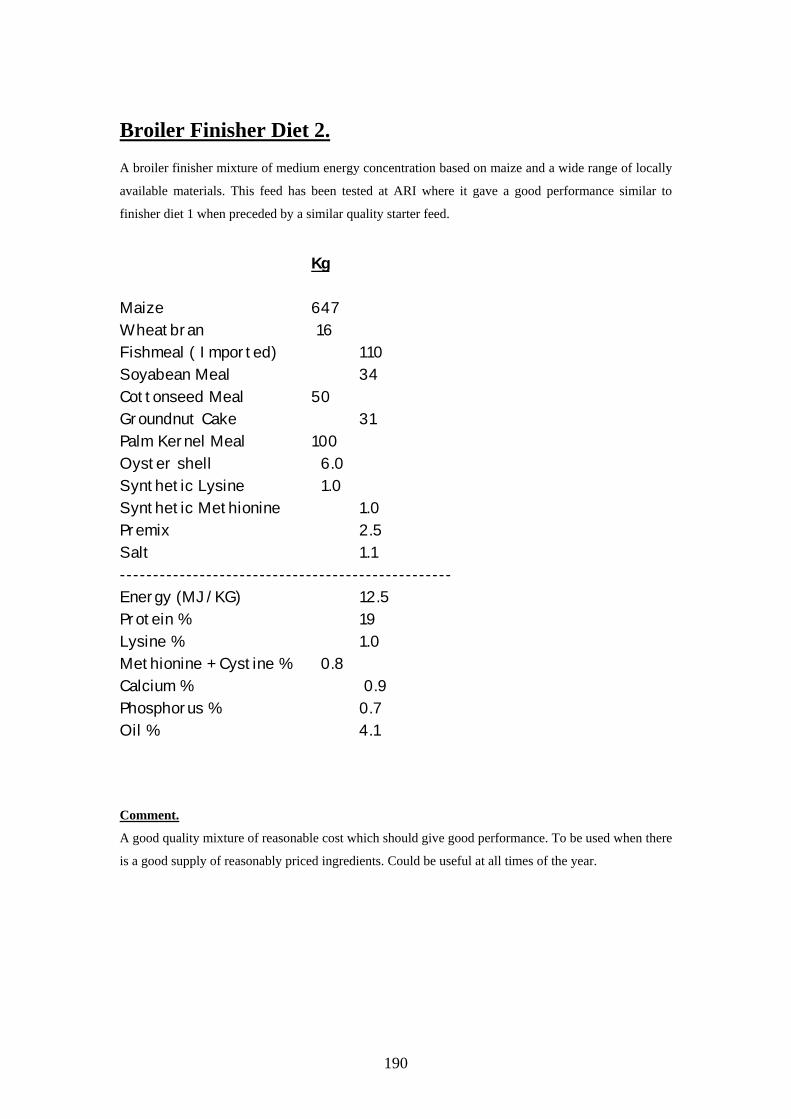
190
Broiler Finisher Diet 2. A broiler finisher mixture of medium energy concentration based on maize and a wide range of locally
available materials. This feed has been tested at ARI where it gave a good performance similar to
finisher diet 1 when preceded by a similar quality starter feed.
Kg
Maize 647 Wheatbran 16 Fishmeal ( Imported) 110 Soyabean Meal 34 Cottonseed Meal 50 Groundnut Cake 31 Palm Kernel Meal 100 Oyster shell 6.0 Synthetic Lysine 1.0 Synthetic Methionine 1.0 Premix 2.5 Salt 1.1 -------------------------------------------------- Energy (MJ/KG) 12.5 Protein % 19 Lysine % 1.0 Methionine + Cystine % 0.8 Calcium % 0.9 Phosphorus % 0.7 Oil % 4.1 Comment.
A good quality mixture of reasonable cost which should give good performance. To be used when there
is a good supply of reasonably priced ingredients. Could be useful at all times of the year.
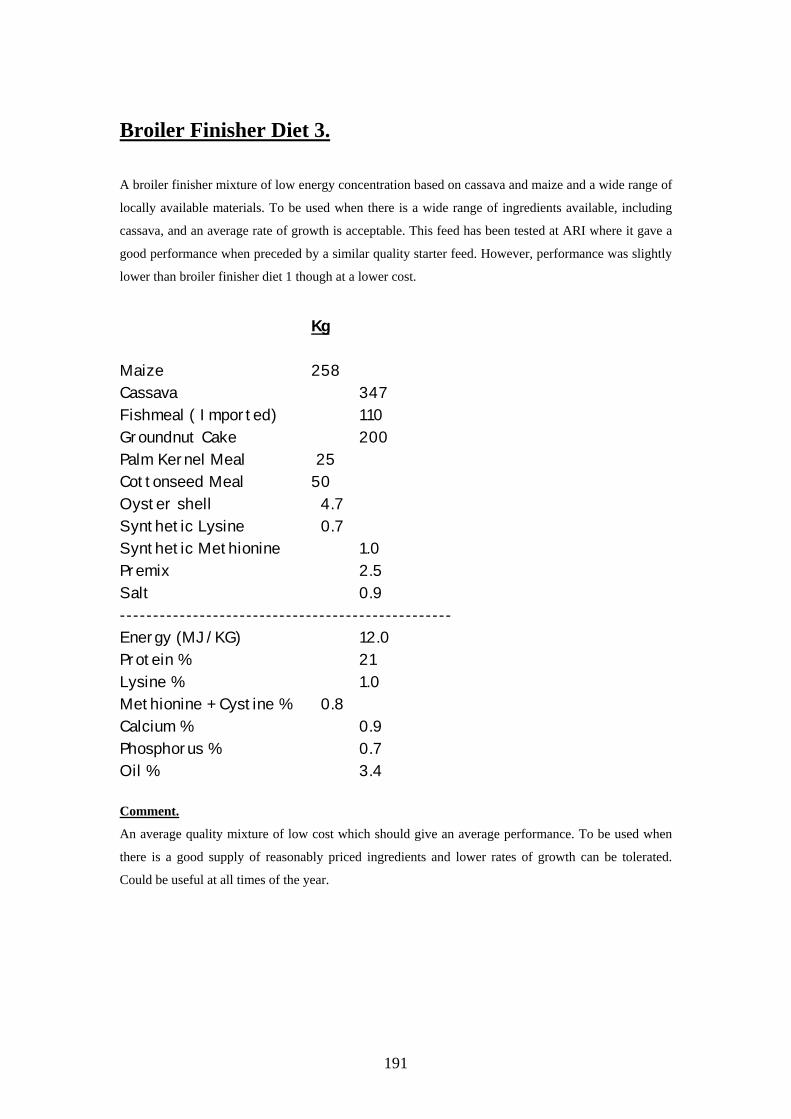
191
Broiler Finisher Diet 3.
A broiler finisher mixture of low energy concentration based on cassava and maize and a wide range of
locally available materials. To be used when there is a wide range of ingredients available, including
cassava, and an average rate of growth is acceptable. This feed has been tested at ARI where it gave a
good performance when preceded by a similar quality starter feed. However, performance was slightly
lower than broiler finisher diet 1 though at a lower cost.
Kg
Maize 258 Cassava 347 Fishmeal ( Imported) 110 Groundnut Cake 200 Palm Kernel Meal 25 Cottonseed Meal 50 Oyster shell 4.7 Synthetic Lysine 0.7 Synthetic Methionine 1.0 Premix 2.5 Salt 0.9 -------------------------------------------------- Energy (MJ/KG) 12.0 Protein % 21 Lysine % 1.0 Methionine + Cystine % 0.8 Calcium % 0.9 Phosphorus % 0.7 Oil % 3.4 Comment.
An average quality mixture of low cost which should give an average performance. To be used when
there is a good supply of reasonably priced ingredients and lower rates of growth can be tolerated.
Could be useful at all times of the year.
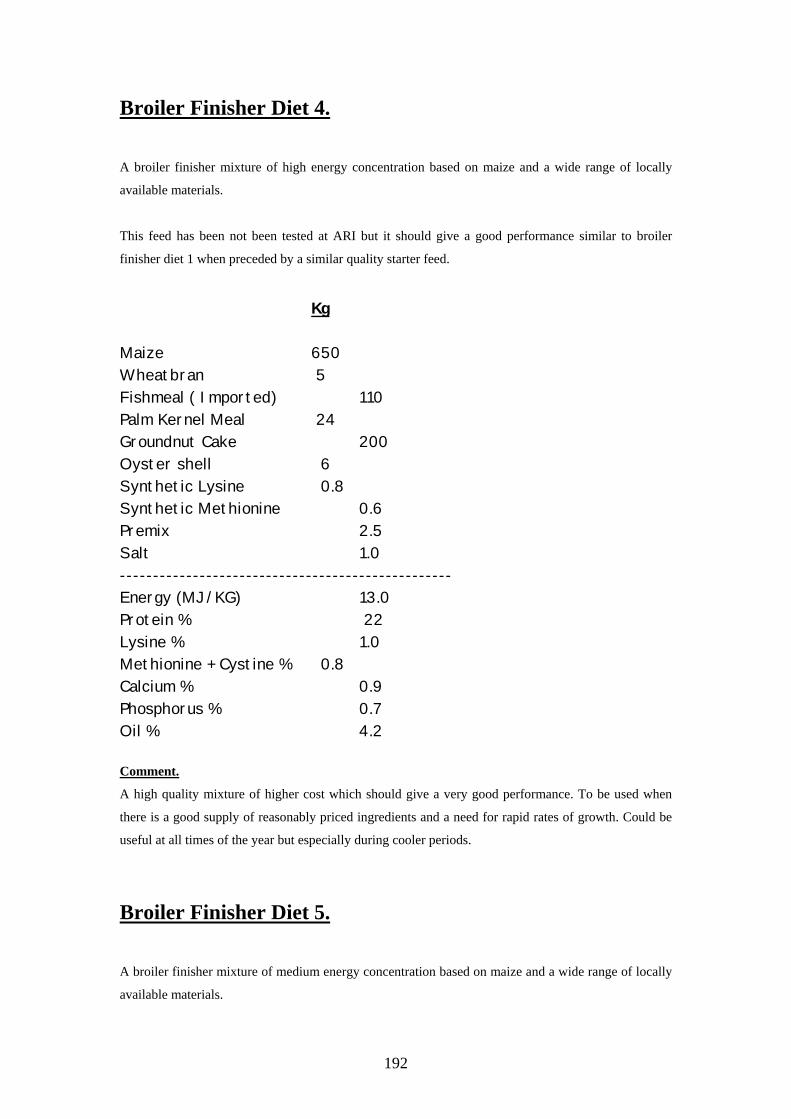
192
Broiler Finisher Diet 4. A broiler finisher mixture of high energy concentration based on maize and a wide range of locally
available materials.
This feed has been not been tested at ARI but it should give a good performance similar to broiler
finisher diet 1 when preceded by a similar quality starter feed.
Kg
Maize 650 Wheatbran 5 Fishmeal ( Imported) 110 Palm Kernel Meal 24 Groundnut Cake 200 Oyster shell 6 Synthetic Lysine 0.8 Synthetic Methionine 0.6 Premix 2.5 Salt 1.0 -------------------------------------------------- Energy (MJ/KG) 13.0 Protein % 22 Lysine % 1.0 Methionine + Cystine % 0.8 Calcium % 0.9 Phosphorus % 0.7 Oil % 4.2 Comment.
A high quality mixture of higher cost which should give a very good performance. To be used when
there is a good supply of reasonably priced ingredients and a need for rapid rates of growth. Could be
useful at all times of the year but especially during cooler periods.
Broiler Finisher Diet 5. A broiler finisher mixture of medium energy concentration based on maize and a wide range of locally
available materials.
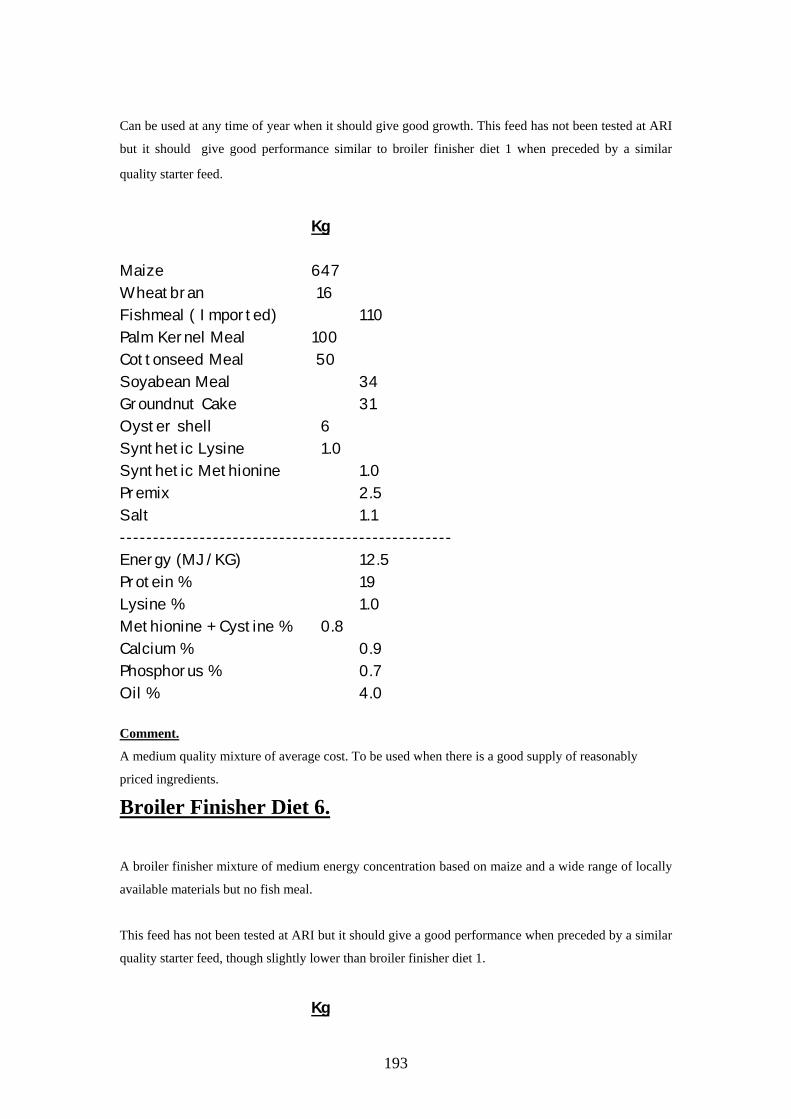
193
Can be used at any time of year when it should give good growth. This feed has not been tested at ARI
but it should give good performance similar to broiler finisher diet 1 when preceded by a similar
quality starter feed.
Kg
Maize 647 Wheatbran 16 Fishmeal ( Imported) 110 Palm Kernel Meal 100 Cottonseed Meal 50 Soyabean Meal 34 Groundnut Cake 31 Oyster shell 6 Synthetic Lysine 1.0 Synthetic Methionine 1.0 Premix 2.5 Salt 1.1 -------------------------------------------------- Energy (MJ/KG) 12.5 Protein % 19 Lysine % 1.0 Methionine + Cystine % 0.8 Calcium % 0.9 Phosphorus % 0.7 Oil % 4.0 Comment.
A medium quality mixture of average cost. To be used when there is a good supply of reasonably
priced ingredients.
Broiler Finisher Diet 6. A broiler finisher mixture of medium energy concentration based on maize and a wide range of locally
available materials but no fish meal.
This feed has not been tested at ARI but it should give a good performance when preceded by a similar
quality starter feed, though slightly lower than broiler finisher diet 1.
Kg
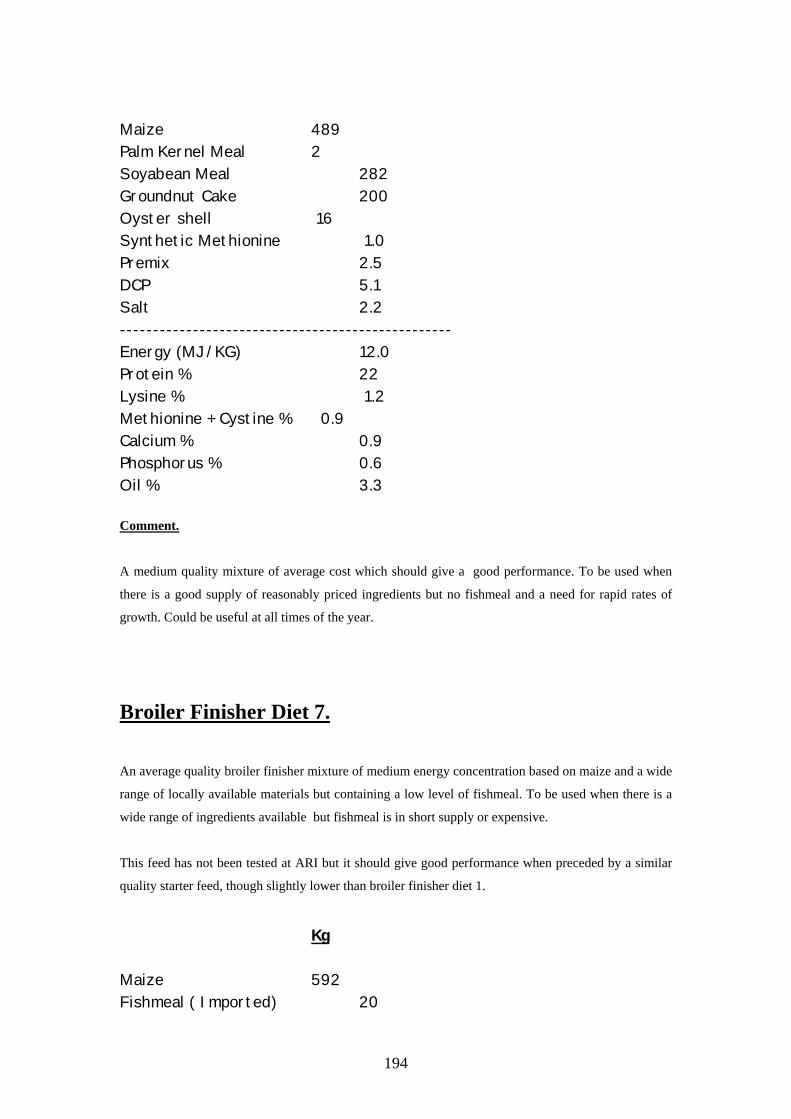
194
Maize 489 Palm Kernel Meal 2 Soyabean Meal 282 Groundnut Cake 200 Oyster shell 16 Synthetic Methionine 1.0 Premix 2.5 DCP 5.1 Salt 2.2 -------------------------------------------------- Energy (MJ/KG) 12.0 Protein % 22 Lysine % 1.2 Methionine + Cystine % 0.9 Calcium % 0.9 Phosphorus % 0.6 Oil % 3.3 Comment.
A medium quality mixture of average cost which should give a good performance. To be used when
there is a good supply of reasonably priced ingredients but no fishmeal and a need for rapid rates of
growth. Could be useful at all times of the year.
Broiler Finisher Diet 7. An average quality broiler finisher mixture of medium energy concentration based on maize and a wide
range of locally available materials but containing a low level of fishmeal. To be used when there is a
wide range of ingredients available but fishmeal is in short supply or expensive.
This feed has not been tested at ARI but it should give good performance when preceded by a similar
quality starter feed, though slightly lower than broiler finisher diet 1.
Kg
Maize 592 Fishmeal ( Imported) 20
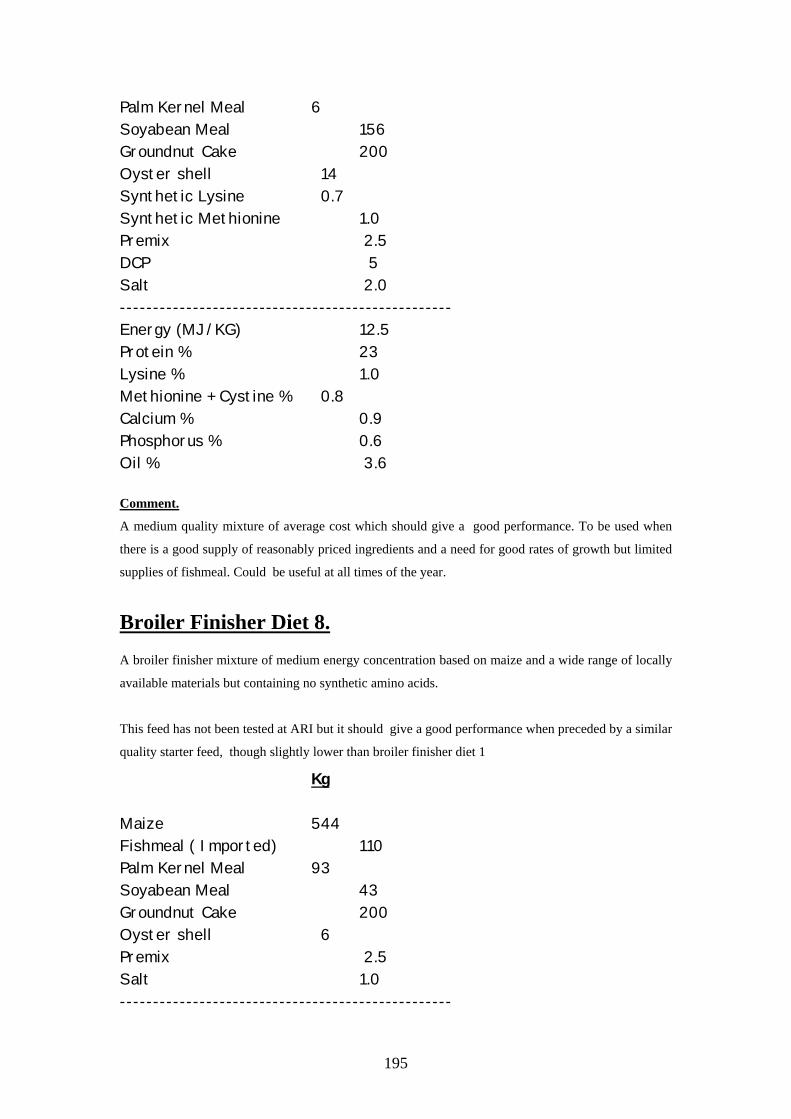
195
Palm Kernel Meal 6 Soyabean Meal 156 Groundnut Cake 200 Oyster shell 14 Synthetic Lysine 0.7 Synthetic Methionine 1.0 Premix 2.5 DCP 5 Salt 2.0 -------------------------------------------------- Energy (MJ/KG) 12.5 Protein % 23 Lysine % 1.0 Methionine + Cystine % 0.8 Calcium % 0.9 Phosphorus % 0.6 Oil % 3.6 Comment.
A medium quality mixture of average cost which should give a good performance. To be used when
there is a good supply of reasonably priced ingredients and a need for good rates of growth but limited
supplies of fishmeal. Could be useful at all times of the year.
Broiler Finisher Diet 8. A broiler finisher mixture of medium energy concentration based on maize and a wide range of locally
available materials but containing no synthetic amino acids.
This feed has not been tested at ARI but it should give a good performance when preceded by a similar
quality starter feed, though slightly lower than broiler finisher diet 1
Kg Maize 544 Fishmeal ( Imported) 110 Palm Kernel Meal 93 Soyabean Meal 43 Groundnut Cake 200 Oyster shell 6 Premix 2.5 Salt 1.0 --------------------------------------------------
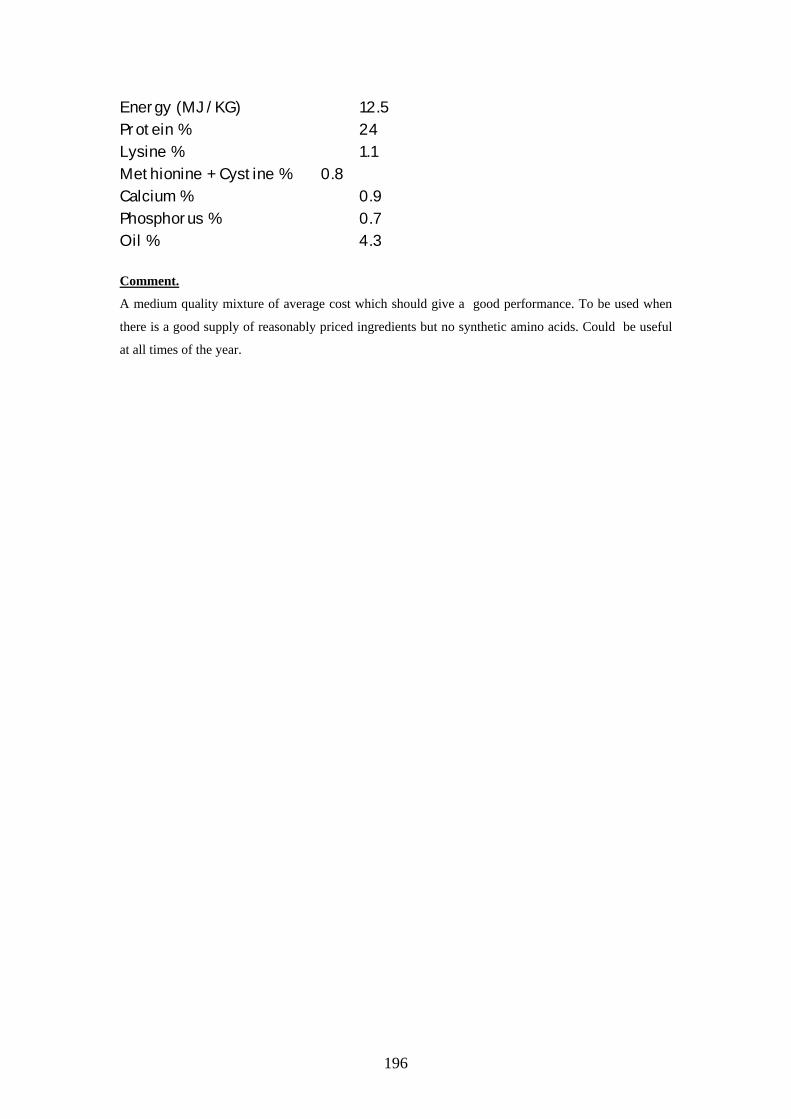
196
Energy (MJ/KG) 12.5 Protein % 24 Lysine % 1.1 Methionine + Cystine % 0.8 Calcium % 0.9 Phosphorus % 0.7 Oil % 4.3 Comment.
A medium quality mixture of average cost which should give a good performance. To be used when
there is a good supply of reasonably priced ingredients but no synthetic amino acids. Could be useful
at all times of the year.