strategies for monitoring the performance of dnapl source zone remedies
TRANSCRIPT

Strategies for Monitoring the Performance of DNAPL Source Zone Remedies
Prepared byThe Interstate Technology & Regulatory Council
Dense Nonaqueous-Phase Liquids Team
August 2004
Technical/Regulatory Guidelines
ABOUT ITRC
Established in 1995, the Interstate Technology & Regulatory Council (ITRC) is a state-led, nationalcoalition of personnel from the environmental regulatory agencies of some 40 states and the Districtof Columbia; three federal agencies; tribes; and public and industry stakeholders. The organizationis devoted to reducing barriers to, and speeding interstate deployment of, better, more cost-effective,innovative environmental techniques. ITRC operates as a committee of the Environmental ResearchInstitute of the States (ERIS), a Section 501©)(3) public charity that supports the EnvironmentalCouncil of the States (ECOS) through its educational and research activities aimed at improving theenvironment in the United States and providing a forum for state environmental policy makers. Moreinformation about ITRC and its available products and services can be found on the Internet atwww.itrcweb.org.
DISCLAIMER
This document is designed to help regulators and others develop a consistent approach to theirevaluation, regulatory approval, and deployment of specific technologies at specific sites. Althoughthe information in this document is believed to be reliable and accurate, this document and allmaterial set forth herein are provided without warranties of any kind, either express or implied,including but not limited to warranties of the accuracy or completeness of information contained inthe document. The technical implications of any information or guidance contained in this documentmay vary widely based on the specific facts involved and should not be used as a substitute forconsultation with professional and competent advisors. Although this document attempts to addresswhat the authors believe to be all relevant points, it is not intended to be an exhaustive treatise onthe subject. Interested readers should do their own research, and a list of references may be providedas a starting point. This document does not necessarily address all applicable heath and safety risksand precautions with respect to particular materials, conditions, or procedures in specificapplications of any technology. Consequently, ITRC recommends also consulting applicablestandards, laws, regulations, suppliers of materials, and material safety data sheets for informationconcerning safety and health risks and precautions and compliance with then-applicable laws andregulations. The use of this document and the materials set forth herein is at the user’s own risk.ECOS, ERIS, and ITRC shall not be liable for any direct, indirect, incidental, special, consequential,or punitive damages arising out of the use of any information, apparatus, method, or processdiscussed in this document. This document may be revised or withdrawn at any time without priornotice.
ECOS, ERIS, and ITRC do not endorse the use of, nor do they attempt to determine the merits of,any specific technology or technology provider through publication of this guidance document orany other ITRC document. The type of work described in this document should be performed bytrained professionals, and federal, state, and municipal laws should be consulted. ECOS, ERIS, andITRC shall not be liable in the event of any conflict between this guidance document and such laws,regulations, and/or ordinances. Mention of trade names or commercial products does not constituteendorsement or recommendation of use by ECOS, ERIS, or ITRC.
Strategies for Monitoring the Performance of DNAPLSource Zone Remedies
August 2004
Prepared byThe Interstate Technology & Regulatory Council
Dense Nonaqueous-Phase Liquids Team
Copyright 2004 Interstate Technology & Regulatory Council

i
ACKNOWLEDGMENTS
The members of the Interstate Technology & Regulatory Council (ITRC) DNAPLs Team wish toacknowledge the individuals, organizations, and agencies that contributed to this document. TheDNAPLs Team effort, as part of the broader ITRC effort, is funded primarily by the United StatesDepartment of Energy (DOE). Additional funding and support have been provided by the UnitedStates Department of Defense (DoD) and the United States Environmental Protection Agency(USEPA). Administrative support for grants is provided by the Environmental Research Instituteof the States (ERIS), a nonprofit educational subsidiary of the Environmental Council of the States(ECOS). The Western Governors’ Association (WGA) and Southern States Energy Board (SSEB),who previously held secretariat duties for ITRC, remain involved.
The team recognizes the efforts of the following state environmental personnel who contributed tothis document:
Eric Hausamann - New York State Department of Environmental ConservationNaji Akladiss - Maine Department of Environmental ProtectionDoug Bradford - Louisiana Department of Environmental QualitySupalak (Sue) Rogers - Texas Commission on Environmental QualityMichael Smith - Vermont Department of Environmental ConservationJim Ussery - Georgia Department of Environmental Protection
We also wish to thank the following participants representing various federal agencies:
Tom Early - Oak Ridge National LaboratoryLinda Fiedler - U.S. Environmental Protection AgencyLaurie Haines - U.S. Army Environmental CenterKira Lynch - U.S. Army Corps of EngineersBeth Moore - U.S. Department of EnergyMarta Richards - U.S. Environmental Protection AgencyHans Stroo - SERDP/ESTCPMarvin Unger - SERDP/ESTCPLaura Yeh - Naval Facilities Engineering Services Center
Finally, the work team recognizes the efforts of members representing industry and nongovernmententities who contributed to this document:
Anne Callison - Barbour CommunicationsMichael Kavanaugh - Malcolm PirnieWilson Clayton - Aquifer Solutions, Inc.David Fleming - Thermal Remediation Services, Inc.Konstantinos Kostarelos - Polytechnic UniversityHans Meinardus - Intera, Inc.Steve Shoemaker - DuPont, Inc.Julie WestHoff - Prairie Environmental, LLCRyan Wymore - North Wind Environmental, Inc.

iii
EXECUTIVE SUMMARY
Introduction
The environmental problems associated with DNAPLs (dense, nonaqueous-phase liquids) are wellknown—they can be extremely difficult to locate in the subsurface; small amounts of DNAPL cancontaminate large volumes of an aquifer; they are not amenable to conventional groundwaterextraction technologies (e.g., “pump and treat”); restoration of DNAPL sites to drinking waterstandards or maximum contaminant levels is considered unattainable. These problems are thefoundation of many technical and regulatory barriers to DNAPL cleanup attempts. Since 1999, theDNAPLs Team has been trying to ease some of these barriers by informing the regulatorycommunity of developments in innovative approaches to DNAPL source zone characterization andremediation. To this end we have written four guidance documents that provide an overview of theproblem and guide the reader through the process of site characterization, technology selection, andimplementation. This, our fifth document, provides guidance on assessing the performance ofDNAPL source zones remedies.
DNAPLs can be treated by implementing one of several or a combination of aggressive in situtechnologies, including surfactant/cosolvent flushing, in situ chemical oxidation, and in situ thermalremediation. Less aggressive technologies for treating DNAPLs, such as bioremediation, aretypically designed to address the dissolved plume but show some promise in treating sources.Although the long-term containment option will likely remain a viable remedial strategy at mostcomplex DNAPL sites, the advent of aggressive source zone treatment technologies has caused areevaluation of the conventional wisdom that significant source removal is “technicallyimpracticable” at all DNAPL sites. Despite the ever-increasing number of field applications ofDNAPL removal technologies, many unanswered questions remain regarding the effectiveness ofthese technologies and how best to measure their performance with respect to site-specific remedialobjectives. Furthermore, there is no consensus on the most appropriate set of performance metricswith which to evaluate the benefits of mass removal from the DNAPL source zone, particularly theshort and long-term impacts on the rate of contaminant mass discharge or flux emanating from thesource zone.
This document is intended for regulators and others interested in learning about approaches toperformance monitoring while implementing various in situ technologies for the treatment ofDNAPLs. In this document, we present a number of ways in which the success or failure in treatinga DNAPL source zone has been measured. Because the vast majority of experience in DNAPLsource zone remediation has been in unconsolidated geologies, such as sands and silts, many of theconclusions, recommendations, and lessons learned presented in this document do not necessarilytransfer to performance assessment in fractured bedrock, karst, or other consolidated geologies.
What Is Performance Assessment?
The task of evaluating the efficiency and effectiveness of a remedial action in meeting theremediation and operational objectives established for the project is termed “performanceassessment.” System effectiveness is the ability of the system to achieve remediation goals at agiven site, while “efficiency” refers to the optimization of time, energy, and cost toward the

iv
achievement of effectiveness. The EPA defines performance monitoring as “the periodicmeasurement of physical and/or chemical parameters to evaluate whether a remedy is performingas expected.” In terms of DNAPL source zone treatment, performance assessment involves thecollection and evaluation of conditions following treatment and the comparison of that informationto pretreatment or baseline conditions.
Measuring performance can be a difficult undertaking, particularly when clear, measurable goalsor metrics are not specified. According to the National Research Council (NRC), verifying theeffectiveness of a remedial action typically involves quantifying reductions in “contaminant mass,concentration, mobility, and/or toxicity” following implementation and evaluating whether theperformance objectives established for the project were achieved. Consistent with the NRC’sdefinition of technical performance, we consider effectiveness to be the degree to which atechnology application achieves risk reduction goals by reducing contaminant mass, concentration,mobility, and/or toxicity while preventing the uncontrolled mobilization or further spread ofcontaminants.
Establishing Performance Goals
Goals for a DNAPL source zone cleanup generally fall into three categories: short-term,intermediate, and long-term performance goals. Short-term goals focus on controlling DNAPLmobility and mitigating the potential for further contaminant migration. Long-term goals typicallytarget the achievement of compliance with regulatory criteria applicable to contaminated media atthe site, such as restoration of groundwater to drinking water standards. Intermediate performancegoals are appropriate when guiding cleanup at a DNAPL source zone, where complete removal ofthe source in one aggressive remedial effort is typically not feasible yet the levels of contaminationleft behind are unacceptable. Examples of intermediate performance goals might include depletingthe source sufficiently to allow for natural attenuation, preventing the migration of contaminatedfluids beyond the treatment zone, reducing dissolved-phased concentrations outside the source zone,or reducing the mass discharge rate or flux emanating from the source. According to EPA, a“phased approach” to site cleanup generally accelerates risk reduction and achievement of long-termgoals. For each phase, performance goals should be selected to guide the interim remedial action.Selection of an appropriate set of performance goals is discussed in Section 3 of the document.
Categories of Performance Metrics
Depending on the goals of the remedial project, different field parameters or metrics are measuredand used to confirm attainment of those objectives or to evaluate progress. Typically, this processinvolves collecting groundwater or soil samples before and after treatment and comparingcontaminant concentration levels. Applying these metrics and designing a performance monitoringprogram are discussed in Section 4. Although concentration data are useful, there are seriousdeficiencies to relying solely on such point measurements to evaluate the effectiveness of a sourcezone remedy. Fortunately, there are numerous other metrics for measuring performance which arediscussed in terms of their utility in estimating source treatment progress, source mass reduction,and source treatment impact. Each metric has its advantages and limitations; no one metric isappropriate for all cases. To offset the limitations and uncertainties in relying on any one measureof success, it is suggested that several lines of evidence be used.

v
Estimates of DNAPL Source Treatment Impact (4.4)
Decrease in Toxicity (4.4.1)
Contaminant analysis:• Soil cores• Groundwater
Decrease in Mobility (4.4.2)
Determine NAPL Saturation:• Soil core analysis• PITT
Decrease in Plume Loading (4.4.3)
Measure mass flux:• Transect of wells and
multi-level samplers• Tubingen integrated
pumping tests• Transect of borehole flux
meters
Estimates of DNAPL Source Treatment Progress (4.2)
Decrease in Soil Conc. (4.2.1)
Measure contaminants in soil cores
Decr. in Groundwater Conc. (4.2.2)
Measure contaminants in groundwater samples
Estimates of DNAPL Source Mass Reduction1 (4.3)
Mass Extracted (4.3.1)
Ex situ measurement of wastestreams:• Vapor• NAPL• Groundwater
Mass Destroyed In Situ (4.3.2)
Indicators of breakdown products in groundwater:• Increase in chloride• Change in C-14• Change in Cl-isotopes
Mass Remaining (4.3.3)
Measure before/after masses:
• Soil Cores
• PITT
Potential Metrics for Performance Assessment of DNAPL Zone Treatment
Decrease in Soil Vapor Conc. (4.2.3)
Measure contaminants in soil vapor samples
Figure 4-1 in the document (reproduced below) illustrates the various categories of performancemetrics for assessment of DNAPL source zone treatment and directs the reader to the applicablesection of the document where further details and references can be found.
Performance Monitoring Tools
Although standard protocols for measuring the performance of DNAPL source zone treatmenttechnologies have not been established, a variety of assessment tools have been applied to makingperformance measurements and are the focus of this document. Groundwater sampling, soil coreanalysis, and partitioning tracer tests are just a few examples of methods currently being used toevaluate the effectiveness of source treatment. These tools yield information about changes in theconcentration of contaminants in groundwater or the amount of mass remaining in the source zonefollowing treatment, but they do not provide direct evaluation of the flux of contaminants beingreleased from the source following treatment. Attempts to determine this latter property have ledto a new type of performance measure—contaminant mass flux—that currently is the subject ofintensive research, development, and field evaluation.

vi
Technology-Specific Monitoring Considerations
Ideally, the effectiveness of any one DNAPL remediation technology should be evaluated using thesame performance goals and metrics as other technologies being considered so their relativeperformance and benefits can be evaluated independent of the technology. Methods for monitoringsystem efficiency, however, must address technology-specific considerations. For instance, theeffectiveness of a thermal technology like steam injection should be judged based on technology-independent criteria such as how much the source strength was depleted or how much contaminantmass was removed from the ground, but the program for monitoring system efficiency must betechnology specific.
Section 5 provides a brief description of some technologies employed for DNAPL source zoneremediation and offers some suggestions on the types of monitoring that may be appropriate for eachtechnology. The information in Section 5 is intended as “suggested monitoring requirements” forplanning purposes—actual monitoring varies depending on site-specific conditions and thetechnology being deployed.
Case Studies
Appendix B is intended to highlight the various approaches to performance assessment being usedto measure success at some recent DNAPL source zone treatment projects. It contains severalsuccinct case studies that cover remedial goals and objectives, performance monitoring andverification, and lessons learned. The reader is encouraged to contact the technical or regulatoryperson listed at the end of each case study for more detailed information.
Summary
Currently, there is no clear consensus based on objective guidelines as to the best way to evaluatetreatment performance and balance performance objectives against site-specific stratigraphy,measurement uncertainties, regulatory acceptance, and cost. At present, the best approach is for siteowners, regulators, and stakeholders to understand the options available and the benefits andlimitations of each so that informed decisions can be made. The primary purpose of this documentis to provide that knowledge base.
It is essential to recognize that development of effective DNAPL source treatment assessment toolsis a work in progress. Every assessment tool discussed in this document has both strengths andweaknesses that must be considered when selecting a performance assessment strategy for a site.There is a significant amount of research currently under way at the federal level, much of it fundedthrough the Department of Defense’s Strategic Environmental Research and Development Program,which is focused on developing assessment tools for measuring the impacts of DNAPL source zonetreatment that cut across technologies and allow objective comparisons of performance and costamong remedial alternatives to be made.

vii
TABLE OF CONTENTS
1.0 INTRODUCTION . . . . . . . . . . . . . . . . . . . . . . . . . . . . . . . . . . . . . . . . . . . . . . . . . . . . . . . 11.1 Problem Statement . . . . . . . . . . . . . . . . . . . . . . . . . . . . . . . . . . . . . . . . . . . . . . . . . 11.2 Scope of Document . . . . . . . . . . . . . . . . . . . . . . . . . . . . . . . . . . . . . . . . . . . . . . . . 11.3 Defining Performance Assessment . . . . . . . . . . . . . . . . . . . . . . . . . . . . . . . . . . . . 21.4 Goals and Outcomes of Performance Assessment . . . . . . . . . . . . . . . . . . . . . . . . . 4
2.0 THE CONCEPTUAL SITE MODEL AND DNAPL ZONE DYNAMICS . . . . . . . . . . . 72.1 Key Concepts Relating to DNAPLs . . . . . . . . . . . . . . . . . . . . . . . . . . . . . . . . . . . 72.2 Changes in DNAPL Zone Resulting from Treatment . . . . . . . . . . . . . . . . . . . . . 122.3 Addressing Rebound . . . . . . . . . . . . . . . . . . . . . . . . . . . . . . . . . . . . . . . . . . . . . . 162.4 Difficulty Treating and Assessing Performance at Complex DNAPL Sites . . . . 17
3.0 PERFORMANCE ASSESSMENT STRATEGIES . . . . . . . . . . . . . . . . . . . . . . . . . . . . . 193.1 Defining Performance Goals and Metrics . . . . . . . . . . . . . . . . . . . . . . . . . . . . . . 203.2 Developing a Strategy for Completion and Optimization . . . . . . . . . . . . . . . . . . 233.3 Data Quality Considerations . . . . . . . . . . . . . . . . . . . . . . . . . . . . . . . . . . . . . . . . 243.4 Keeping an Eye Toward Site Closure . . . . . . . . . . . . . . . . . . . . . . . . . . . . . . . . . 28
4.0 QUANTIFYING PERFORMANCE WITH FIELD METRICS . . . . . . . . . . . . . . . . . . . 294.1 Categories of Performance Metrics . . . . . . . . . . . . . . . . . . . . . . . . . . . . . . . . . . . 334.2 Estimates of Source Treatment Progress . . . . . . . . . . . . . . . . . . . . . . . . . . . . . . . 354.3 Estimates of Source Mass Reduction . . . . . . . . . . . . . . . . . . . . . . . . . . . . . . . . . . 454.4 Estimates of Source Treatment Impact . . . . . . . . . . . . . . . . . . . . . . . . . . . . . . . . 50
5.0 TECHNOLOGY-SPECIFIC MONITORING CONSIDERATIONS . . . . . . . . . . . . . . . 575.1 Remedial Effectiveness and System Efficiency Monitoring . . . . . . . . . . . . . . . . 585.2 Conventional Source Zone Remedies . . . . . . . . . . . . . . . . . . . . . . . . . . . . . . . . . 585.3 Thermally Enhanced Remediation . . . . . . . . . . . . . . . . . . . . . . . . . . . . . . . . . . . . 615.4 Surfactant/Cosolvent Flushing . . . . . . . . . . . . . . . . . . . . . . . . . . . . . . . . . . . . . . . 675.5 In Situ Chemical Oxidation . . . . . . . . . . . . . . . . . . . . . . . . . . . . . . . . . . . . . . . . . 695.6 Enhanced In Situ Bioremediation . . . . . . . . . . . . . . . . . . . . . . . . . . . . . . . . . . . . 73
6.0 OTHER ISSUES . . . . . . . . . . . . . . . . . . . . . . . . . . . . . . . . . . . . . . . . . . . . . . . . . . . . . . . 766.1 Health and Safety . . . . . . . . . . . . . . . . . . . . . . . . . . . . . . . . . . . . . . . . . . . . . . . . . 766.2 Decision Support: Forecasting Performance . . . . . . . . . . . . . . . . . . . . . . . . . . . . 776.3 Regulatory Concerns . . . . . . . . . . . . . . . . . . . . . . . . . . . . . . . . . . . . . . . . . . . . . . 806.4 Stakeholder/Public Involvement . . . . . . . . . . . . . . . . . . . . . . . . . . . . . . . . . . . . . 82
7.0 REFERENCES . . . . . . . . . . . . . . . . . . . . . . . . . . . . . . . . . . . . . . . . . . . . . . . . . . . . . . . . 84

viii
LIST OF TABLES
Table 2-1. Summary of Conditions at DNAPL Sites . . . . . . . . . . . . . . . . . . . . . . . . . . . . . . 19Table 4-1. Comparisons of Approaches for Evaluating Performance . . . . . . . . . . . . . . . . . . 31Table 4-2. Number of Sample Points Required to Detect Target Area . . . . . . . . . . . . . . . . . 36Table 5-1. Co-Boiling Points of Common Solvents . . . . . . . . . . . . . . . . . . . . . . . . . . . . . . . 61Table 5-2. Performance Monitoring Parameters for Thermally Enhanced Remediation . . . 65Table 5-3. Performance Monitoring Parameters for Surfactant/Cosolvent Flushing . . . . . . 68Table 5-4. Performance Monitoring Parameters for In Situ Chemical Oxidation . . . . . . . . 71Table 5-5. Performance Monitoring Parameters for In Situ Bioremediation of CVOCs . . . 75
LIST OF FIGURES
Figure 2-1. Conceptual Model of a DNAPL Source Within the Saturated Zone . . . . . . . . . . . . . 8Figure 2-2. Partitioning of Contaminant in Subsurface . . . . . . . . . . . . . . . . . . . . . . . . . . . . . . . . 10Figure 4-1. Categories of Performance Metrics for DNAPL Zone Treatment . . . . . . . . . . . . . . 34Figure 4-2. Concept of Mass Flux/Discharge and Source Strength . . . . . . . . . . . . . . . . . . . . . . 53
APPENDICES
Appendix A. List of AcronymsAppendix B. Case StudiesAppendix C. Role of Pilot Tests and Technology DemonstrationsAppendix D. Statistical Approaches to Evaluating PerformanceAppendix E. Responses to CommentsAppendix F. DNAPLs Team Contacts, ITRC Fact Sheet, and Product List

1
STRATEGIES FOR MONITORING THE PERFORMANCE OF DNAPL SOURCEZONE REMEDIES
1.0 INTRODUCTION
This document describes various performance assessment strategies and methods being used in fieldsituations to measure the performance of in situ DNAPL source zone remediation systems. Inaddition, it presents new tools and approaches under development to measure the site-specificimpacts of source treatment on contaminants emanating from the source zone.
1.1 Problem Statement
In recent years, technologies for treating DNAPL (dense, nonaqueous-phase liquid) sources havebeen employed under a variety of scenarios (demonstrations, pilot scale, and full scale) and geologicconditions. As a result of this experience, many lessons have been learned and useful informationobtained on how to design, construct, and operate these systems. Despite the number ofdeployments, many unanswered questions remain regarding the effectiveness of these technologiesand how best to measure their performance. There is no consensus on the most appropriate set ofmetrics with which to gauge success or the benefits of DNAPL source zone remediation, particularlyits impact on mitigating the environmental problem at hand (Rao, et al. 2001; SERDP, 2002a).
DNAPLs are defined as separate-phase, slightly water-soluble liquids having a specific densitygreater than 1 (meaning they will sink in water). Examples of DNAPLs include chlorinatedsolvents, coal tar, creosote, and polychlorinated biphenyls (PCBs). This document is intended forthe reader who is familiar with DNAPLs and their physical characteristics.
Every DNAPL site is different and requires tailoring a site-specific approach to implementing aneffective treatment technology and verifying its performance. It is recommended that as newadvances in treatment technologies are published, the reader continue to explore these newtechnologies. Studies are being conducted that constantly improve upon current understandings ofhow DNAPLs can be treated.
1.2 Scope of Document
1.2.1 Intent
This document is intended for regulators and others with an interest in learning about performanceverification as applied to the treatment of DNAPLs and the strategies used in designing aremediation performance monitoring program. It is assumed that a decision to implement some typeof source zone remedy has already been made or is being considered and that the reader is interestedin developing an appropriate DNAPL removal performance monitoring program. Although someof the methods may be applicable to source containment remedies, our focus is on measuringperformance of source treatment technologies, particularly in unconsolidated sediments within thesaturated zone.

ITRC – Strategies for Monitoring the Performance of DNAPL Source Zone Remedies August 2004
2
It is important to note that we are not attempting to predict the effectiveness of a particular sourcezone reduction technology or forecast its performance. Answers to questions such as, “ShouldDNAPL source zone mass removal be attempted?”, “Will reducing source strength by removingmass be beneficial?”, or “What are the limitations of X technology?” can be answered only throughcareful analysis of site-specific conditions and may require numerical modeling. We will, however,discuss possible alternatives to the question “How can performance be verified?”and provideguidance on developing a system performance monitoring program tailored to a specific source massreduction approach.
While this document does describe several performance assessment approaches and methodologies,including a discussion of their applicability and limitations, its purpose is not to define orrecommend standard protocols for measuring performance of in situ remediation technologies.Source zone treatment technologies are, in many cases, still under development, and there are noguarantees with any of the current technologies that DNAPL will be completely removed. Likewise,none of the performance assessment technologies described in this document can completely removeall the uncertainty associated with measuring performance or gauging success.
1.2.2 Organization
This document is organized into seven major sections. This section (Section 1) introduces the topicof remedial performance and stresses the importance of performance assessment. Section 2 definessome fundamental concepts relating to DNAPL source zone remediation that must be consideredwhen designing or approving a performance monitoring program. In Section 3, some basicstrategies for performance assessment are covered, including establishing performance goals andmetrics, attaining data quality objectives, and developing an exit strategy. Section 4 describesvarious measures of success that have been used to evaluate DNAPL source treatment progress andimpact, while Section 5 presents technology-specific monitoring parameters and tools. Section 6discusses other issues that must be considered or may be encountered when designing or approvingplans for a DNAPL source zone remediation. Finally, Section 7 lists references used in developingthis document.
In addition, there are six appendices: a list of acronyms (Appendix A); several case studieshighlighting performance monitoring approaches (Appendix B); discussion on the role of pilotstudies (Appendix C); the use of statistics (Appendix D); responses to reviewers’ comments(Appendix E); and Interstate Technology & Regulatory Council (ITRC) contacts (Appendix F).
1.3 Defining Performance Assessment
Performance can be perceived differently depending on the “eye of the beholder.” For example, toa regulator charged with protecting public health and the environment, performance may be basedstrictly on whether the project conforms to applicable state and federal rules and regulations. Toproperty owners responsible for reducing risk and future liability, performance is not only a measureof technical success of a technology but also defined by a business decision that allows them to cost-effectively achieve regulatory criteria and successfully manage risk. Depending on the contract

ITRC – Strategies for Monitoring the Performance of DNAPL Source Zone Remedies August 2004
3
mechanism and method of payment, remedial contractors responsible for building and operating atreatment system are interested in achieving performance specifications goals as outlined in theircontract. They may also want to achieve regulatory criteria to facilitate future businessopportunities. Public stakeholders may define performance based on other concerns such as thepotential for disruption to the community, the production of secondary emissions, or avoidance ofpost-remediation land use controls.
There are two primary criteria to be addressed in a remediation performance assessment:effectiveness and efficiency. Box 1-1 presents some terminology used in this document that mayhelp the reader to, among other things, discern between measurements used for assessing remedialeffectiveness and those for optimizing system efficiency.
1.3.1 Effectiveness
System effectiveness refers to the ability of the system to achieve remediation goals at a given site.For example, if plume remediation is the primary goal for the site, system effectiveness may bedetermined by the cumulative mass of contaminant removed from the aquifer or a permanentdecrease in contaminant concentrations observed at specified compliance monitoring wells. Orwhere reduction in DNAPL mobility is the goal, effectiveness may be expressed in terms of whethercontinued DNAPL migration has been halted as a result of source treatment.
Measuring performance in terms of effectiveness can be a difficult undertaking, particularly whenclear, measurable goals or metrics are not specified. According to the National Research Council’s(NRC’s) 1997 report, verifying the effectiveness of a remedial action typically involves quantifyingreductions in contaminant mass, concentration, mobility, and/or toxicity following implementationand evaluating whether the performance objectives established for the project were achieved (NRC,1997). Consistent with the NRC’s definition of technical performance, we consider effectivenessto be the degree to which a technology application achieves risk reduction goals by reducingcontaminant mass, concentration, mobility, and/or toxicity while preventing the uncontrolledmobilization or further spread of contaminants.
“Given the unknowns in fully defining the human health and environmental effectof contaminants in ground water and soil, the dilemma is how to define
remediation technology performance in a way that is both quantifiable andrelevant to the goal of preventing adverse effects.” - NRC, 1997
1.3.2 Efficiency
System efficiency refers to the optimization of time, energy, and costs toward the achievement ofremediation effectiveness using a specific technology. Efficiency is typically assessed by comparingsystem operating parameters to design specifications. For example, an in situ chemical oxidationsystem may be effective at reducing contaminant concentrations initially, but the rate of reductioncan become successively lower and less efficient with each injection, in terms of the time, energy,and money expended. Collecting and analyzing system operation and process data to monitorsystem efficiency is a standard practice at remediation projects.

ITRC – Strategies for Monitoring the Performance of DNAPL Source Zone Remedies August 2004
4
Box 1-1. Terminology Used in Evaluating Performance
intermediate performance goals: facility-specific goals established for source zones aspart of a “phased approach” to cleanup to monitor progress toward final cleanup goalsfor the site. May include removing DNAPL to the extent feasible, preventing themigration of DNAPL constituents, meeting certain numerical cleanup criteria, ormitigating the risk of exposure.
operational objectives: objectives describing what is to be achieved by the processutilized to effect remediation. These objectives focus on the efficiency of the engineeredsystem.
performance assessment: the task of evaluating the efficiency and effectiveness of aremedial action in meeting the remediation and operational objectives established for theproject.
performance metrics: environmental conditions and parameters monitored to evaluateprogress or measured to confirm attainment of response objectives and criteria.
performance monitoring: monitoring conducted specifically to collect data in supportof the performance assessment program. EPA defines performance monitoring as “theperiodic measurement of physical and/or chemical parameters to evaluate whether aremedy is performing as expected.”
performance standards: the predicted level of performance achievable undercontrolled conditions by a particular technology based on experience in fieldapplications. Performance standards are useful for estimating costs and in makingcomparisons among remedial alternatives.
response boundary: the point or plane at which a facility is expected to monitor andachieve response objectives (e.g., media-specific cleanup levels). Also referred to as a“control plane.”
response objectives: qualitative and quantitative objectives describing what is to beachieved by a particular operation. Data collected during effectiveness monitoring areevaluated to assess attainment of these objectives.
termination criteria: measurable, technology-specific parameters used to gaugewhether or not the current remedial phase is complete and the system is ready to beshut down or transitioned to the next phase. Termination criteria are typically based onnumerical targets or endpoints to which operational monitoring data are compared.
1.4 Goals and Outcomes of Performance Assessment
Below are listed some of the ways performance monitoring data are used. These examples areintended to stress the importance of having an adequate performance assessment plan.

ITRC – Strategies for Monitoring the Performance of DNAPL Source Zone Remedies August 2004
5
To Optimize System Operation
By monitoring the efficiency and effectiveness of a unit operation or process, the system can beoptimized and the site cleaned up faster and/or cheaper. Performance monitoring may also be usefulwhen evaluating whether advances in technologies or implementation approaches could improve theability of a remedy to achieve cleanup goals, to detect changes in environmental conditions that mayreduce the efficacy of the remedy, or to detect conditions in the environment that could impact theeffectiveness of the remedy.
When the data indicate that remedial progress has stalled or has reached a point of diminishingreturns and simple adjustments in system operating parameters do not improve performance, theproject team should consider a remedial process optimization (RPO) evaluation. Guidance onperforming RPO evaluations is contained in the Remedial Process Optimization Handbook,produced by the Air Force Center for Environmental Excellence (AFCEE, 2001), as well as theITRC’s RPO Team document (ITRC, in preparation).
To Confirm Effectiveness of Cleanup
Confirming effectiveness of the DNAPL treatment technology can be based on achieving regulatorycriteria in soil and/or groundwater at predetermined, site-specific points of compliance. Typically,these points of compliance are located well beyond the area undergoing active remediation and maynot respond immediately to a reduction in source mass. A long-term monitoring program istherefore usually required once active source zone remediation has ceased to evaluate whethercompliance has been achieved in the affected aquifer. Modeling can also be used to predict thedecrease in plume longevity if plume restoration is a long-term goal. Assessment of effectivenesscan also be based on achieving intermediate performance goals at a control plane or responseboundary located within or just beyond the treatment area as part of a phased cleanup.
To Monitor Potential Impacts Beyond the Treatment Zone
The potential for contaminants to migrate beyond the treatment zone during aggressive sourceremoval actions is a concern expressed by regulators and the public at many DNAPL projects. Bymonitoring pertinent parameters (e.g., groundwater or vapor contaminant concentrations) at theperimeter of the treatment zone, project managers can verify that no unacceptable exposure to down-gradient receptors is occurring. In this way, potential impacts to the environment as a result oftreatment can be assessed and timely action taken to prevent further migration or possible exposureduring remediation efforts. Performance monitoring data can also be used to identify any potentiallytoxic and/or mobile transformation products that may have formed and verify that the environmentalproblem is not being exacerbated.

ITRC – Strategies for Monitoring the Performance of DNAPL Source Zone Remedies August 2004
6
To Facilitate Efficient Coupling of Remediation Technologies
Evaluation of performance monitoring data gives the remediation professional feedback to determinewhether the remedial system is progressing as intended and when it may be time to transition toanother technology if necessary. Many of the source zone technologies may be combined in a“treatment train” approach, either sequentially or contemporaneously, to more efficiently reducesource strength or longevity. For instance, cosolvent flushing of a chlorinated solvent source zonewith ethanol coupled with enhanced bioremediation at the periphery of the source zone has beendemonstrated (Jawitz, et al., 2000). Another example is the coupling of chemical oxidation andbioremediation.
For these and many other combinations, performance assessment is needed on an ongoing basis tooptimize the synergy and/or transition between technologies. This optimization can include eithermanaging the application of specific amendments or determining an appropriate time to transitionfrom one coupled treatment process to the other. Knowing when and where to implement specifictechnologies and approaches requires close monitoring of performance data.
To Implement Performance-Based Contracts
There is typically a trade-off between an investment of resources for assessing performance and thatfor conducting remedial efforts. A cost-benefit analysis can be performed to evaluate this trade-off.When considering remedial alternatives, the availability of performance guarantees included withinthe price of technology application may be relevant. Such performance-based contracts are designedto encourage innovation and transfer the financial risk of source zone treatment by making thevendor responsible for meeting performance objectives. The contracted vendor will likely increasethe price as appropriate for the level of risk that is being assumed. These types of contracts havebeen commonly used for in situ thermal treatment to allow greater flexibility in operations and toacknowledge the inherent uncertainties involved in subsurface DNAPL remediation. A decision asto who is responsible for conducting the performance evaluation should be stated contractually inadvance, as well as how payment schedules will be impacted by objectives that are not fully met.
To Support the Decision to Close a Site
Site closure is the process of obtaining release from remedial responsibilities under the operableregulatory driver. A regulatory decision supporting “no further action” (NFA) is commonly aconditional release from further remedial requirements based on an agency’s determination that thesite does not constitute a threat to human health and the environment for the known environmentalconditions and for a specified type of land use. Thus, the conditions of NFA decisions are highlysite-specific.
Performance assessment results are components of the NFA decision. An assessment may show thatwhile some source mass remains in place, the impact on the dissolved plume does not constitute asignificant risk. For example, a former manufacturing facility in Skokie, Illinois performedremediation of DNAPL using electrical resistance heating (EPA, 2003a). Performance assessment

ITRC – Strategies for Monitoring the Performance of DNAPL Source Zone Remedies August 2004
7
demonstrated that groundwater concentrations were reduced to below the Illinois EPA Tier IIIgroundwater cleanup levels but that residual DNAPL remained in place. Illinois EPA granted anNFA letter based on the performance assessment results, which included total mass removed inextracted vapor and condensate, and a comparison of post-remediation groundwater concentrationsto Tier III cleanup levels.
2.0 THE CONCEPTUAL SITE MODEL AND DNAPL ZONE DYNAMICS
We cannot stress enough the importance of understanding the site’s history and contaminantdistribution/behavior and having a robust performance assessment plan based on that understandingbefore attempting to remediate a DNAPL source zone. Typically, this process is completed in aninteractive manner involving the responsible party, regulators, and public stakeholders. Theresulting conceptual site model (CSM), based on a detailed characterization of baseline conditionsin the source zone and potential paths of exposure, should help identify the environmental matricesto be monitored, the targeted treatment area, remedial action objectives, and a preliminary list ofperformance goals and metrics.
The EPA Region VI Corrective Action Strategy (EPA, 2000a) defines the CSM as a “three-dimensional ‘picture’ of site conditions” that “conveys what is known or suspected about a facility,releases, release mechanisms, contaminant fate and transport, exposure pathways, potentialreceptors, and risks.” In this context, the CSM serves as the basis for conducting a risk evaluationwhere potential human and environmental receptors are identified, the potential for completeexposure pathways is determined, exposure point concentrations are estimated, and risk estimatesare developed. From this evaluation, critical receptors and exposure pathways are identified alongwith chemicals of concern, and the need for remedial action is defined based on current or likelyfuture risk potential. In this way, the CSM and risk evaluation are translated into appropriateremedial action objectives.
This section discusses, on an introductory level, some core concepts relating to DNAPL behaviorand distribution in the subsurface as they pertain to in situ source zone remediation involvingmultiphase fluid flow.
2.1 Key Concepts Relating to DNAPLs
Key concepts described in this section include the physical behavior of DNAPLs, the definition ofa source zone, contaminant-phase distribution, nonaqueous-phase liquid (NAPL) saturation, and howremediation technologies change the source zone architecture in order to enhance DNAPL recoveryor treatment.
The area targeted for application of an in situ DNAPL remediation technology is often synonymouswith the term “source zone.” EPA defines the DNAPL zone as “that portion of the subsurface whereimmiscible liquids (free-phase or residual DNAPL) are present either above or below the watertable” (EPA, 1996a). The DNAPL source zone encompasses the entire subsurface volume in which

ITRC – Strategies for Monitoring the Performance of DNAPL Source Zone Remedies August 2004
8
Sou
rce:
B. K
uepe
r, pe
rs. c
omm
., 20
04
DNAPL is present either at residual saturation or as “pools” of accumulation above confining units(Mackay and Cherry, 1989; Cohen and Mercer, 1993; Rao, et al., 2001). In addition, the DNAPLsource zone includes regions that have come into contact with DNAPL that may be storingcontaminant mass as a result of diffusion into the soil matrix. Figure 2-1 depicts a schematicconceptual model of a DNAPL source within the saturated zone.
2.1.1 Physical Behavior of DNAPLs in the Subsurface
DNAPLs include common chlorinated solvents, such as tetrachloroethene (PCE) and trichloroethene(TCE), as well as other hazardous substances such as creosote and coal tar (Cohen and Mercer,1993). Generally DNAPLs are hydrophobic (not very soluble in water); however, some are solubleenough to present risks to human health or the environment. Many DNAPL compounds, like TCE,are also volatile and may cause vapor intrusion concerns.
Figure 2-1. Conceptual Model of a DNAPL Source Within the Saturated Zone
Like all fluids, DNAPLs move along paths of least resistance. When released in sufficient quantitiesto the subsurface soil, DNAPLs move downward, primarily due to gravity but also by infiltration,through the vadose zone and usually into the saturated zone. In addition to gravitational forces, themovement of DNAPL in the subsurface is influenced by geologic variations and whether theDNAPL is in an air-NAPL (vadose zone) or water-NAPL (saturated zone) environment. In thevadose zone, DNAPL typically is the wetting fluid so that when a fine-grain unit is encountered, itis preferentially imbibed into the small pore spaces. In the saturated zone, water generally is thewetting phase, although research has shown that many creosotes are actually the wetting phase withrespect to water (Davis, E., personal communication, 2004; Powers et al., 1996). When achlorinated solvent DNAPL encounters a fine-grain unit in this environment, it tends to collect on

ITRC – Strategies for Monitoring the Performance of DNAPL Source Zone Remedies August 2004
9
the top surface of this unit and spread laterally. This accumulated solvent is often called a “pool,”though the term is somewhat misleading. The accumulated DNAPL in these “pools” is often on theorder of centimeters thick and occupies pores that may still be predominately filled with water. Inthe majority of field investigations, large, thick DNAPL “pools” are rarely encountered. If sufficientvertical accumulation and head are able to develop, the DNAPL may overcome the pore entrypressure requirements and penetrate the fine-grained material.
In the subsurface, DNAPL can also be distributed as a discontinuous mass of globules or ganglia,referred to as “residual DNAPL.” Residual DNAPL is distinguished from “pools” by (1) theirdiscontinuous and immobile nature; (2) their relatively small size; and (3) the dominance ofcapillary, rather than hydrostatic, forces in determining the shape and location of their free surfaces.Although residual DNAPL is immobile under normal subsurface conditions, it can act as a long-termsource for continuing dissolution of contaminants into water or air flowing through the saturated andvadose zones, respectively. DNAPL pools also act as long-term sources for contaminants thatpartition themselves into air and/or soil.
There are many excellent books and articles that describe the physics of DNAPL subsurfacebehavior and migration. For more information, see Pankow and Cherry, 1996; Hunt, et al., 1988;and McWhorter and Kueper, 1996.
2.1.2 DNAPL Source Zone Architecture
Source zone architecture generally refers to the spatial distribution of DNAPL within the volumeof impacted soil. More specifically, it refers to the distribution of contaminant mass among thevarious subsurface phases (e.g., vapor, dissolved, adsorbed, and free phase) and the hydrodynamicinteractions between the DNAPL and the more permeable regions of the aquifer with which it makescontact. Source zone architecture determines the extent to which the DNAPL mass is subject toaqueous dissolution and thus, impacts the source strength, the nature of the dissolved plume, and theefficiency of remediation (Kavanaugh, et al., 2003).
Partitioning Theory
Characterization of the distribution of contaminant mass at a site using partitioning theory is usefulin further understanding the source zone architecture. Contaminants introduced into the subsurfacecan be distributed (partitioned) among four physical phases: air, soil, water, and NAPL. Each NAPLcomponent (i.e., each compound originally in the NAPL) is distributed among these phasesaccording to thermodynamic equilibrium principles and mass transfer kinetic factors. Equilibriumin the system is reached when the chemical potential of each component is equal in every phase.The resulting distribution of the total contaminant mass can therefore be estimated by knowing eachcomponent’s chemical phase partitioning behavior. Figure 2-2 presents a schematic depiction ofcontaminant mass partitioned into the four phases found within a vadose zone.
NAPL-water partitioning depends on the aqueous solubility of the specific NAPL component inquestion, and on the concentrations of the other components (if any) found in the NAPL. The

ITRC – Strategies for Monitoring the Performance of DNAPL Source Zone Remedies August 2004
10
Mod
ified
from
Sut
hers
an, 1
996
relationship between aqueous solubility and mole fraction of a component in the NAPL is analogousto Raoult’s law for ideal gas mixtures in that the equilibrium aqueous concentration is equal to thepure-phase aqueous solubility of the component multiplied by the mole fraction of the componentin the NAPL mixture.
Air-water partitioning between the aqueous and vapor phases of a NAPL component is controlledby Henry’s law. The equilibrium air-water relationship is linear and is a function of the Henry’sconstant, which can be calculated from a component’s vapor pressure, its molecular weight, and itsaqueous solubility. Henry’s constants for NAPL components are available in the literature.
Figure 2-2. Partitioning of Contaminant in Subsurface
Soil-water partitioning is controlled by sorption to organic matter found within the sediment. In thecontext of most DNAPL source zones, sorption can be described by a linear function of the aqueouscontaminant concentration, the mass fraction of natural organic carbon (foc), and the organic carbonto water partition coefficient (Koc) for the compound in question. The mass fraction of naturalorganic carbon can be measured, and partitioning coefficients for specific compounds are availablein the literature.
Using these partitioning relationships and the concepts of the conservation of mass and volume, theamount of each component in each of the four phases (air, soil, water, and NAPL) can be estimated,assuming equilibrium conditions have been met (Feenstra, et al., 1991). Not only is this useful fordeveloping an understanding of how contaminant mass is distributed at a site, but it can also aid inidentifying and quantifying the presence of DNAPL in soil samples. Soil-chemical data can beanalyzed and interpreted using numerical tools developed to determine NAPL saturation of soilcores containing organic contaminants. These tools begin with the partitioning calculationsdiscussed above and then proceed to solving the equations of the conservation of mass and volume,thereby obtaining an estimated value of NAPL saturation, and calculating the composition of theNAPL from the soil chemical analysis.

ITRC – Strategies for Monitoring the Performance of DNAPL Source Zone Remedies August 2004
11
Saturation Concepts
Saturation is defined as the percentage of the pore space occupied by a fluid. The fluid could be aliquid or a gas, as is the case when moist soil contains both water and air within the pore spaces.For the water/air example, the water saturation (Sw) could vary between 0% (for dry soil) and 100%(for completely saturated soil). Furthermore, the liquid phase could consist of immiscible liquids,such as when both water and DNAPL occupy the soil pores together. Following the definition, theDNAPL saturation (SDNAPL) is the ratio of DNAPL volume within the pore space to the total porevolume. The water saturation (Sw) is the ratio of the volume of pore water to the total pore volume.The air saturation (Sair) is defined similarly. The following equation reflects the sum of the threesaturations:
Sw + SDNAPL + Sair = 100%
“Residual saturation” refers to a specific condition regarding the fluids within pore spaces that arisesfrom the interfacial tension between fluids. Interfacial tension causes “trapping” of fluids withinpore spaces such that one fluid can not be easily removed from the pores. For example, if water isused to push DNAPL from the pore spaces, some of the DNAPL becomes trapped and is verydifficult to remove. This condition indicates residual saturation of the DNAPL. Depending on thetype and size of the soil grains and the interfacial tension between fluids, residual DNAPL saturationvalues in the vadose zone can range between 10% and 20%; saturation values in the saturated zoneare typically higher than those in the vadose zone and range between 10% and 50% (Cohen andMercer, 1993).
2.1.3 Modeling the DNAPL Source Zone
The complexity of DNAPL source zones makes each impacted site unique and a well-groundedCSM incorporating the source zone can bring into focus features of the site that warrant the mostattention. The site-specific nature of the DNAPL problem dictates that the performance assessmentstrategies and methodologies employed be highly tailored to conditions found at a particular site.Therefore, it is vital to know the general location of the DNAPL zone or zones and its interactionswith the local groundwater flow regime. As is the case for conventional dissolved plumeremediation, the volume and extent of the impacted area must be adequately delineated to providea sufficient design basis for both the remedy and the performance assessment program. In practice,however, it is very difficult to precisely locate where DNAPL is present in the subsurface (ITRC,2003a).
CSM development for a DNAPL source zone should include detailed studies of the site geology andhydrogeology. The study of the site-specific geology and hydrogeology is essential because of therole geology plays in the movement of DNAPLs. In sedimentary terrains, determining andunderstanding the environment of deposition affords the opportunity to build conceptualizations ofthe heterogeneities and structures that control the distribution of DNAPL in the subsurface.Geologic barriers and their orientation may provide clues to preferential flow pathways for DNAPL

ITRC – Strategies for Monitoring the Performance of DNAPL Source Zone Remedies August 2004
12
or indicate where DNAPL may accumulate. Small changes in subsurface grain size, shape,distribution, and depositional sequences may influence where residual DNAPLs will be found.
Present and past land use at the site and surrounding areas is also critical to CSM development. Ifnonaqueous-phase chemicals were used or stored at a site, it is highly possible that releasesoccurred. Therefore, the type of chemicals that may have been used on site or are known to be usedby industries associated with the site will help to focus the investigation. In addition to the typesand quantities of chemicals used on the site, it is important to understand the processes andoperations that used these chemicals. For example, past vapor degreasing operations typicallyresulted in the generation and release of low-viscosity solvents laden with oil and grease. Theresulting multicomponent DNAPLs typically have physical and chemical properties that aremarkedly different from those of the chlorinated hydrocarbons manufactured and sold for degreasinguse. On-site construction and other disturbances of the subsurface can affect DNAPL migration bycreating preferential pathways and barriers to flow. The ITRC document An Introduction toCharacterizing Sites Contaminated with DNAPLs (ITRC, 2003a) discusses these issues in moredetail and provides references pertaining to DNAPL site characterization issues.
Assessment methods that can potentially be used to estimate the vertical and areal extent of aDNAPL source zone and supply data for the CSM are described in Pankow and Cherry (1996) andITRC (2003a). These include environmental sampling, geophysical methods (such as ground-penetrating radar and vertical induction profiling), soil gas measurements, fluorescence, reactionswith hydrophobic dye, and olfactory or visual evidence. Because of uncertainties inherent withusing any one analytical method for detecting DNAPLs, the distribution of DNAPL is best definedby the use of “converging lines of evidence,” rather than just a single measurement or observation.
Information obtained following implementation of pilot studies can be invaluable. Appendix Cdescribes the role pilot studies and technology demonstrations play in refining the CSM and indeveloping a performance assessment program. For instance, if performance data collected duringthe pilot study indicate that DNAPLs have been mobilized as a result of treatment and have migratedbeneath an assumed confining layer, the CSM and monitoring plan should be revised to account forthis apparent “hole” in the stratigraphy.
2.2 Changes in DNAPL Zone Resulting from Treatment
Most aggressive technologies involve the injection of fluids, such as surfactants, cosolvents, steam,or oxidants, into the formation under engineered hydraulic gradients. These fluids not only alter theproperties of the DNAPL but can also change the flow field, displacing contaminated fluids withclean fluids for a relatively short period of time. As treatment continues, changes occur in the sourcezone architecture that can improve removal or destruction efficiencies. Thermal technologies, forinstance, are designed to add large amounts of heat to the subsurface, which (in addition toenhancing the recovery of DNAPL by affecting its vapor pressure, viscosity, and solubility) has beenshown in laboratory experiments to agitate the soil microstructures and release trapped DNAPL.These changes occur primarily where advective processes dominate as a function of heterogeneity.The resultant localized changes in source zone architecture in turn change the mass flux (defined

ITRC – Strategies for Monitoring the Performance of DNAPL Source Zone Remedies August 2004
13
as mass per unit area per unit time) emanating from the source. The degree of the change in massflux is in part a function of the magnitude and nature of formation heterogeneity and the distributionof DNAPL within the formation.
It is important to recognize that the implementation of DNAPL source zone treatment technologieswill likely result in physiochemical subsurface changes. As long as these changes are anticipated,the remediation project manager can judiciously plan for design and operational considerations sothat these changes might benefit the remediation effort. Such subsurface changes resulting fromtreatment include the following.
Redistribution of DNAPL
Treatment technologies that modify DNAPL or interfacial properties or alter the subsurface structurewill likely mobilize and redistribute previously immobile DNAPL. This redistribution can createa more extensive source zone. For example, the physical properties of neutral-density NAPLcomponents can significantly vary with temperature (or other influences), and the impact of thesechanges on treatment design, operation, and monitoring must be considered. Consequently,monitoring and effective containment of DNAPL during remediation is of paramount importance.Knowledge of the rate and extent of this redistribution can help in the design of subsequent remedialsteps.
If the remediation team does not account for mobility and potential redistribution, adverse riskconsequences may result. Various source reduction techniques, such as via injection of oxidants orsteam without regard to the resulting advective flow, addition of microbial substrates, or via gasesformed as a result of in situ oxidation, could actually displace DNAPL as well as dissolved-phasecontaminants. Finally, technologies such as thermal treatment and surfactant flooding causephysical changes that may mobilize DNAPL beyond the treatment zone. In all of these cases, it isimperative to ensure adequate perimeter monitoring and, if necessary, a means to intercept mobilizedcontaminants.
Increase in Vapor Pressure and Volatilization
Some thermal technologies are designed to increase subsurface temperatures to the boiling point ofwater, thereby increasing the rate of contaminant removal by two primary mechanisms: increasedvolatilization and steam stripping. Contaminant vapor pressure and the corresponding rate ofcontaminant extraction increase by a factor of about 30 as the subsurface is heated to boiling (Heronet al., 2000).
Once subsurface heating starts, the boiling points of various volatile organic compound (VOC)/watermixtures are reached in the following order: separate-phase NAPL in contact with water or moistsoil first, dissolved VOCs next, and then uncontaminated groundwater. This phenomenon isadvantageous for remediation because contaminated water tends to boil off before uncontaminatedwater, reducing the time and energy required to complete treatment. All boiling points increase withpressure, so higher temperatures are required to create boiling conditions with increasing depth

ITRC – Strategies for Monitoring the Performance of DNAPL Source Zone Remedies August 2004
14
below the groundwater table. A phenomenon called “co-boiling”, which occurs when twoimmiscible liquids are present, is discussed in Section 5.3.
Increase in Solubility or Dissolved-Phase Constituents
Remedial technologies designed to enhance removal of DNAPL can result in elevatedconcentrations of dissolved-phase contaminants during or immediately after treatment. Thesetemporary contaminant concentration increases are commonly observed with the more aggressivesource zone treatment technologies, such as thermally enhanced remediation, carbon substrateadditions, and chemical oxidation. Dissolved-phase constituents are then available for furthertreatment via a wide range of well-established and accepted dissolved-phase remediationtechnologies, including permeable reactive barriers, air sparging, biostimulation, monitored naturalattenuation, and bioaugmentation.
Impact on Microbial Populations
There are various DNAPL source zone treatment technologies that are designed to enhance aspecific microbial group or species. Such biostimulation techniques involve the addition of carbonas an electron donor, with the goal of increasing the population of organisms capable of achievingreductive dechlorination. Alternatively, selected source reduction technologies (e.g., thermal) canproduce more available organic carbon or increase kinetic rates, thereby stimulating microbialactivities. Other DNAPL source zone treatment technologies, particularly in situ chemical oxidation(ISCO), create conditions (e.g., oxygen, heat) that increase and support other microbialcommunities.
DNAPL source reduction technologies can also negatively impact ambient microbial populationsand alter the community structure by changing biochemical conditions (e.g., electron acceptors,substrate bioavailability, temperature, biotoxicants). These changes could disrupt natural attenuationprocesses that were in place prior to treatment.
Alteration of Subsurface Structure
Some of the more aggressive DNAPL source zone treatment technologies alter the subsurfacestructure either by their inherent design (e.g., forced introduction of treatment substrate into thesubsurface) or through by-products, such as gas evolution during the reaction process (e.g., injectionof hydrogen peroxide). Such subsurface alterations can enhance the mixing process and allowpreviously unavailable DNAPL to be treated. Methods used to achieve subsurface alteration/mixinginclude multiple injections in the same or different locations over time, injections in multiplescreened intervals at one location, and high-pressure liquid or vapor injection to induce subsurfacefracturing.

ITRC – Strategies for Monitoring the Performance of DNAPL Source Zone Remedies August 2004
15
Preferential Flow
Geologic heterogeneities in the source can create zones of preferential flow. In addition, gasesevolved during DNAPL source treatment (in particular, from thermal treatment or in situ oxidationusing hydrogen peroxide) can lead to gas entrapment in porous media and a commensurate reductionin permeability along selected subsurface zones. These conditions, in turn, promote the formationof macrochannels, wherein preferential flow might occur. Such preferential flow areas can reducethe effectiveness of the source reduction delivery system. The use of mobility control agents (i.e.,foams and gelants injected into the pore spaces) may mitigate the effect of preferential flowpathways and improve the delivery of remedial agents and the sweep efficiency. Pulsed operationof the system can also minimize the formation of channelized flow.
Precipitation/Clogging
An in situ source reduction technology like permanganate injection can precipitate particles byaltering the existing geochemistry, and thereby affecting clays, or by yielding reaction products suchas manganese dioxide nodules that can lead to plugging of the soil matrix. In addition, biotreatmentor bioaugmentation techniques may promote the formation of organic biofilms that can also plugsoil pores and reduce permeability. Plugging may reduce the effectiveness of future treatments. Bymonitoring pressure drops in the injection and extraction lines, operators can monitor and addressthe impacts of precipitate clogging.
Secondary Water Impact
Aggressive DNAPL source reduction technologies may alter the subsurface geochemical conditionsand consequently result in deleterious impact to groundwater from contaminants apart from DNAPLconstituents. If not carefully controlled, changes in subsurface redox can create conditionsconducive to the formation of aldehydes, ketones, and mercaptans. In addition, technologies markedby decreasing pH conditions can potentially mobilize naturally occurring metals. Finally, sourcereduction technologies may generate surfactant-like compounds resulting in a “soil washing” effectthat could result in contaminant displacement from soil particles. Monitoring of groundwatergeochemistry during remediation will allow these secondary impacts to be measured and theirimpacts minimized.
VOC Off-Gassing
Some source reduction techniques may result in the generation of potentially explosive gases.Reductive dechlorination could promote conditions favoring the formation of methane, hydrogensulfide, or ammonia. In addition, the implementation of in situ chemical oxidation may result inexothermic conditions, which in turn, may result in the stripping of VOCs from solution.Monitoring for VOC off-gassing can indicate both health and safety concerns as well as thepossibility of contaminant loss via volatilization.

ITRC – Strategies for Monitoring the Performance of DNAPL Source Zone Remedies August 2004
16
2.3 Addressing Rebound
“Rebound” is a term applied to contaminant concentrations measured near a source area whichdecrease following initiation of source treatment operations but, after the system has been shutdown, increase to levels at or just below pretreatment concentrations. The phenomenon iscommonly associated with vapor or groundwater extraction technologies whose contaminant massremoval rates are initially controlled by advection but reach a point during the removal processwhere diffusion processes dominate and mass removal rates decrease dramatically. Rebound doesnot necessarily indicate failure of the technology; in many cases it can be considered a measure ofprogress because it indicates transfer of the contaminant to air-filled pore spaces or water-bearingunits that can be accessed for the application of additional treatment.
Rebound of vapor concentrations implies that either dilution or rate-limited mass transfer isoccurring during soil venting. For example, if air extraction rates exceed the rate of diffusive masstransfer from within the pore water to the air-water interface and then into the flowing air stream,contaminant concentrations in the extracted air can diminish without removing all of thecontaminant from the pore water. When extraction stops, the diffusion process continues, andeventually the concentration(s) within the soil pores that are most conductive to air begin to rise.If a soil gas sample is collected or extraction begins again, then the contaminant concentrations willhave rebounded (USACE, 2002).
Rebound of dissolved-phase concentrations following in situ treatment can imply that treatment wasnot complete and that there is a nearby unremediated source of contamination. In the case ofgroundwater pump and treat, rebound can imply that the rate of groundwater extraction exceeds thediffusive mass transfer rate from the sorbed phase to the dissolved phase; it is essentially a functionof dilution. Box 2-1 presents an example of rebound from a site in California where permanganatewas used to treat a TCE source zone.
Box 2-1. Example of Rebound at a DNAPL Site in Irvine, California
In situ oxidation through injection of a permanganate solution was proposed as analternative to vapor extraction and groundwater recovery at the BMC Olen site in Irvine,California. In situ oxidation has been “successful” at this site in terms of achieving theremedial objectives of turning off the active remediation systems and reducing theaverage TCE concentrations by approximately 60%. However, even after nine separateinjection events were performed, concentrations of chlorinated solvents initiallydecreased after injection and then increased after the permanganate was consumed. Monitoring evidence showed that permanganate persisted for an average of 2.5 months,after which the dissolved TCE concentrations rapidly rebounded.
Although rebound cannot be prevented at every site, its potential occurrence can be anticipated andaccounted for with an appropriate, long-term monitoring program. Thus, its impact on the progress

ITRC – Strategies for Monitoring the Performance of DNAPL Source Zone Remedies August 2004
17
and outcome of the remediation can be mitigated as long as the monitoring period following systemshutdown is of a sufficient duration to account for potential rebound.
There are many potential causes for rebound. First and foremost is the failure to remediate theDNAPL source generating the contamination. Factors that effect the ability to more completelyremediate the source resulting in rebound include the following:
• composition of remedial fluid,• duration of the remedial activities,• external stresses placed on the aquifer or vadose zone changing flow during remedial
activities,• failure to fully characterize or understand the source zone (inadequate design basis),• misapplication of the technology,• proximity of the treatment area to other hydraulically connected source zones,• partitioning from adjacent contaminated units with low hydraulic conductivity, and,• heterogeneity of the aquifer and back-diffusion.
Depending on the severity of rebound, it is commonly addressed by continued application oroperation of the same remedial technology, either in a pulsed mode or optimized in some manner,or application of a different technology.
2.4 Difficulty Treating and Assessing Performance at Complex DNAPL Sites
In 1994, and again in 1997, the NRC published reports that addressed the progress with andchallenges for cleanup of soil and groundwater for a wide variety of contaminants as a function ofhydrogeologic conditions (NRC, 1994, 1997). Both reports emphasize the difficulty of remediatingDNAPL sources in the subsurface, especially in heterogeneous and complex hydrogeologic settings.Since the second report was published, there has been significant progress in treating DNAPLsources resulting from a great expansion of pilot- and full-scale treatment investigations in a varietyof geologic media. However, challenges remain.
Building on the assessments in the NRC reports and incorporating results from more recentinvestigations, the current difficulty of DNAPL treatment under different site conditions can besummarized. In general, coarse-grained unconsolidated media are easier to treat and monitor thanfine-grained or highly heterogeneous material. DNAPL contamination in clay and fractured bedrockis even more difficult. Likewise, treatment of VOC contamination within the vadose zone generallyis easier than in the saturated zone for the equivalent medium. To a large extent this latterobservation is the result of the great success of soil vapor extraction (SVE) for removing volatileDNAPL contaminants (less volatile contaminants are more difficult). Through summer 2000, over17% of the Superfund Records of Decision (RODs) include SVE treatment for removal of thecommon chlorinated solvents from the subsurface (EPA, 2000b). Methods for the assessment ofSVE performance in the vadose zone are presented in EPA guidance (EPA, 2001a).

ITRC – Strategies for Monitoring the Performance of DNAPL Source Zone Remedies August 2004
18
Complex hydrogeologic settings (e.g., tight soils, fractured bedrock, karst) represent significanttechnical challenges and increased costs for treatment design, implementation, and performanceassessment. The presence of surface and subsurface obstructions can also complicate efforts toremediate the site. In addition, some EPA documents (EPA, 1995a, 1996a) encourage the use ofTechnical Impracticability (TI) waivers in complex settings, creating a disincentive for addressingDNAPL contamination under these conditions. Currently, there is no definitive consensus as towhen source treatment is necessary. Regardless, the fundamental technical difficulties ofcost-effectively treating DNAPL sources in complex settings remain a largely unresolved problem.
Other factors that impact treatment difficulty and cost include depth of contamination and theproperties of the DNAPL present. Depth is primarily a cost factor influencing all phases of the workfrom characterization and monitoring to treatment implementation and efficiency monitoring.Although direct-push methods can be used to collect soil and groundwater samples and often aresuitable for installing treatment facilities (e.g., chemical injection wells), such methods are notappropriate at many deep sites or at locations where penetration of bedrock is required. Thephysiochemical properties of the DNAPL also influences the type and efficiency of the treatmentmethod(s) employed. For instance, the relatively low volatility of wood treatment chemicals limitthe types of remediation technologies that are suitable for this type of contamination.
In the more than 10 years of experience in developing and implementing innovative technologiesfor DNAPL source remediation, a significant fraction of treatment investigations to date has takenplace within less complex settings. Therefore, our DNAPL source treatment experience is mostclosely associated with a relatively narrow subset of the full spectrum of possible site conditions.If our treatment and performance assessment experience is biased by the choice of remediation sitesthat are less complex and shallow, then how do these site conditions compare to the actualbreakdown of geologic settings for DNAPL sources across the United States? In 1998, the U.S.Department of Energy (DOE) compiled information for its DNAPL sites (Early, T.O., personalcommunication, 2004). Approximately 25–30 sites are represented by the data, yielding theinformation summarized in the third column of Table 2-1.
More recently, Lebron (2004) reported the results of an extensive survey sponsored by the Chief ofNaval Operations in which information from 118 locations (all but one within North America) wasobtained. The Navy survey focused on sites where source treatment technology applications eitherhad been completed or were in progress. Within the contiguous 48 states, approximately two-thirdsof the sites in the survey are located east of the Mississippi River (most within Atlantic coastalstates) and one-third are to the west (dominated by sites in California). Relevant site informationis presented in the right-most column of Table 2-1.
The details of the data collected in the two surveys are somewhat different, but it is apparent thatsimilarities exist in the nature of contaminants and the maximum depth of contamination observed.The DOE survey results tend to include a larger proportion of bedrock sites than those of the Navysurvey, but this difference may reflect the fact that the DOE results attempted to identify all DNAPLsources on DOE sites rather than just those where technology applications are in progress or have

ITRC – Strategies for Monitoring the Performance of DNAPL Source Zone Remedies August 2004
19
been completed. The perceived difficulty in treating DNAPL in bedrock could account for the lowerproportion of these sites in the Navy survey.
These data provide a rough estimate of the breakdown of DNAPL site conditions both at DOEfacilities and the locations included in the Navy survey. Collectively, these sites are widelydistributed across the United States and located within a diverse range of physiographic provinces.Both surveys, unfortunately, focus on chlorinated solvents and not on contaminants generally foundat manufactured gas plants and wood treatment facilities.
What should be obvious from this discussion is the likelihood that our experiential database forassessing DNAPL source treatment effectiveness is biased and under-represents deeper and/or morechallenging hydrogeologic settings.
Table 2-1. Summary of Conditions at DNAPL Sites
Condition DOE Complex(Early, 2004)
Navy Survey(Lebron, 2004)
Contaminants Order of prevalence TCE >PCE >CCl 4 >Other
Cl-ethenes >Cl-ethanes >Cl-methanes >Cl-benzene
Contaminated media Unconsolidated sediments1 65% 89%
Fractured bedrock 35% 11%
Hydrogeologic zonewith DNAPL source
Vadose zone 40%Not reported
Saturated zone 60%
Maximum depth ofDNAPL2
Less than 100 ft 71% 88%
Greater than 100 ft 29% 12%
1. Composed of approximately 25% low-permeability, 25% medium-high-permeability,and 50% heterogeneous materials.
2. Forty-three of 118 sites in Navy survey did not report the maximum depth of DNAPL.
3.0 PERFORMANCE ASSESSMENT STRATEGIES
A well-designed performance assessment program for a DNAPL source zone remediation projectshould be capable of cost-effectively monitoring progress toward the site-specific treatment goals.Like many aspects of site cleanup, such as setting cleanup goals or selecting a remedy, aperformance monitoring program must be based on a valid conceptual model of the site and specificremediation objectives or risk reduction targets. Pilot studies, discussed in Appendix C, can beuseful when the response of the subsurface to treatment is not well understood and a design basisneeds to be developed. Consideration should also be given to collecting decision-quality data,

ITRC – Strategies for Monitoring the Performance of DNAPL Source Zone Remedies August 2004
20
optimizing the technology, protecting nearby human and environmental receptors, and hastening theoverall closure of the site.
Planning a performance assessment program should begin as soon as remedial objectives for aproject are set and the approach to treating the source zone is determined. The ability to measurethe performance of a remediation technology should be taken into consideration during the remedyselection process when comparing technologies. Before a performance assessment program can bedeveloped for a project, a set of overall remedial objectives and a CSM must be agreed upon by theproject team. Guidance on establishing performance objectives and metrics was covered in Section2.
In addition to technical and hydrogeologic considerations that govern the design of a performanceassessment program, there are other important factors to consider when planning a performanceassessment program. Too often, especially in full-scale applications, an insufficient portion of theproject’s resources are devoted to assessing performance. This could be the result of budgetaryconstraints, inadequate planning, a lack of appreciation for performance assessment, or a lack ofavailable technical expertise. Whatever the cause, improper planning can result in a project teamlacking the capability and technical know-how to design and implement a robust performanceassessment program.
3.1 Defining Performance Goals and Metrics
Performance goals can be quantitative or qualitative in nature. They should at least be measurableso that progress can be monitored objectively and transition criteria developed. Each performancegoal should have its own set of performance metrics or criteria by which success can be measuredand performance verified.
In keeping with the overriding goal of most state and federal regulatory programs (e.g., ResourceConservation and Recovery Act [RCRA], Comprehensive Environmental Restoration and CleanupLiability Act [CERCLA]) to protect human health and the environment, performance goals can bespecified in terms of the project’s effectiveness in reducing risk to human health and theenvironment. Generally this approach involves setting site-specific remedial action objectives(RAOs) based on definable risk reduction targets. Within this framework, DNAPL source reductionmay be considered as an early or interim remedial action as part of a phased risk reduction strategy.The accompanying performance assessment is focused on verifying attainment of interimperformance goals and whether the RAOs ultimately are achieved through DNAPL source reduction,either as a stand-alone strategy or in concert with other measures.
3.1.1 Building on the Conceptual Site Model
Before realistic performance goals can be set for a DNAPL project, a valid CSM must be developedwhich adequately defines the geosystem and the problem at hand. Ideally, by the time a source zoneremedy is being considered or has been selected, both the regulators and the remedial design teamwill have a fairly good understanding of the site history, contaminant distribution, and exposure

ITRC – Strategies for Monitoring the Performance of DNAPL Source Zone Remedies August 2004
21
potential: the foundation for a detailed CSM. By incorporating a risk management strategy, theCSM should evolve to provide a clear vision of the desired end state for the site.
3.1.2 Phase-Specific Performance Goals
Once a decision has been made to address the DNAPL source zone, three types of performance goalsmay present themselves, depending on the complexity of the site (Gavaskar, 2002):
Short-term goals for DNAPL source zone remediation typically involve the mitigation ofimmediate risks to humans or natural resources and the prevention of further expansion of the sourcezone. Often this goal is addressed through some form of mass removal or containment to minimizefurther mobilization of a mobile DNAPL mass. Short-term goals for a source zone might include
• recovering mobile DNAPL,• mitigating the potential for vapor intrusion, and,• preventing further migration of DNAPL.
Intermediate-term goals target the achievement of desired cleanup levels at a response boundaryor, depending on the performance assessment methodology, a series of control planes. It may takea year or several years to make a determination that the target cleanup level has been achieved at aresponse boundary. Long-term monitoring is required to ascertain that the cleanup levels aresustainable and are not subject to a rebound in groundwater contaminant concentrations oncepost-treatment equilibrium is established in the aquifer.
According to EPA, a “phased approach” to site cleanup, in which long-term risk managementdecisions are based on information obtained during removal or interim actions, generally acceleratesrisk reduction (EPA, 1997). Especially at complex DNAPL sites, where complete removal of thesource in one aggressive remedial effort is typically not feasible and the levels of contamination leftbehind may still cause groundwater to exceed final cleanup goals for the site, there is a benefit toselecting interim remediation goals and objectives to guide the cleanup (NRC, 1994). In its recentonline groundwater handbook, EPA uses the term “intermediate performance goals” to describethese interim, phase-specific goals (EPA, 2002a). Intermediate performance goals might include:
• depleting the source sufficiently to allow for natural attenuation,• reducing dissolved-phased concentrations outside the source zone,• reducing the mass discharge rate or flux from the source,• reducing the DNAPL source mass or volume to the extent practicable, and,• preventing the migration of remediation fluids beyond the treatment zone.
Long-term goals, as defined here, target the achievement of compliance with regulatory criteriaapplicable to all contaminated media at the site (e.g., groundwater, soil, vapor). For groundwater,achievement of regulatory criteria may lead to the discontinuation of the long-term monitoringprogram or plume control measures. If the target (regulation-mandated or risk-based) cleanup levelis not achieved or achievable in the long-term, a secondary treatment may be required. Examples

ITRC – Strategies for Monitoring the Performance of DNAPL Source Zone Remedies August 2004
22
of secondary treatments may include natural attenuation, groundwater extraction, or supplementalsource treatment (like enhanced bioremediation or ISCO).
In summary, the basic premise is that a CSM is developed as a framework to evaluate risk posed bythe DNAPL source to nearby receptors under current and future conditions. The results of thisevaluation are used to determine the need for remedial action to address potential exposure pathwaysand to set specific risk-based RAOs for the remediation. Performance metrics are in turn developedand measured to evaluate the success of DNAPL source reduction in meeting these objectives. Inmany cases, these metrics may encompass other performance measures, such as mass removal.However, risk reduction goals provide a basis for objectivity in the assessment and site closureprocess.
3.1.3 Performance Metrics and Criteria
Performance metrics for DNAPL source zone remediation are response-specific parameters definedin terms of (1) the overall RAOs, (2) the particular technology being employed, (3) the location ofpotentially exposed receptors, and (4) the expected response of the geosystem to treatment.
There are many ways to gauge progress of a source remediation project and numerous metrics thatcan be applied. The process of deciding which metrics are appropriate at a given site should involvediscussions among the regulators, the public, and the technical team to avoid potentialmisunderstandings and delays when the performance data become available and decisions are made.It requires that the expected response of the geosystem to treatment be thoroughly understood. Itrequires that potentially exposed populations be identified and controls put in place to protect themfrom risk. Results of pilot studies can be valuable in assessing what parameters to monitor in full-scale implementation.
Establishing Baseline Conditions
Provisions for measuring and evaluating preremediation conditions should be included in thepredesign work planning. The resulting baseline is an essential component of measuring theperformance of any remedial action. Since many performance metrics are based on measuringchanges in environmental conditions as treatment ensues (operational or process criteria may notinclude environmental media), it is very important to establish accurate baseline conditions for theseparameters prior to treatment.
Determining the Response Boundary or Control Plane
Selecting appropriate points or planes at which to measure and achieve response objectives is animportant element of the overall performance assessment program. In other words, “Where shouldsuccess be measured?” The response boundary should not be confused with the term “point ofcompliance,” which EPA defines as the point where media-specific standards (e.g., maximumcontaminant levels [MCLs], risk-based cleanup goals) must be achieved (EPA, 2002a). The locationof the response boundary or control plane should be chosen based on the baseline configuration of

ITRC – Strategies for Monitoring the Performance of DNAPL Source Zone Remedies August 2004
23
the contaminant plume and on the locations where changes in the plume are anticipated, notnecessarily the point at which compliance with drinking water or other regulatory standards isrequired.
3.2 Developing a Strategy for Completion and Optimization
A completion strategy represents consensus among the stakeholders on what conditions or criteriamust be met to satisfy short-term, intermediate, and long-term goals. In the absence of a completionstrategy, the source treatment phase can be unnecessarily prolonged by disputes over whether theremedy has achieved the stated goals. A completion strategy should also incorporate systemoptimization plans, which the project manager can use to expedite cleanup and reduce operatingcosts. A completion strategy is consistent with what the DOE terms an “exit strategy” and includesmany of the same elements, as described in Box 3-1.
A completion or optimization strategy is sometimes mistakenly developed only after the remedialaction phase has begun and signs of failure or diminishing returns begin to emerge. Developmentof a strategy for system shutdown and termination (or transition to another technology) should occurearly in the remedial design stage. The technical team should also have a contingency plan thatallows them to change course and implement a backup remedy should performance monitoringindicate that the remediation is not progressing as expected and the system is not optimized.
Box 3-1. Elements of An Exit Strategy
According to DOE guidance, an exit strategy should consist of these four elements(DOE, 2002):
response objectives: clear statements of short-term, intermediate and long-termremedial goals and objectives. These should include operational and overall remedialobjectives.
performance model: a description of the expected performance or response of the siteto the remedial technology over time.
performance metrics and end points: definition of the performance metrics, includingthe environmental parameters, a sampling and analysis plan, and how the data will beinterpreted and used to monitor progress.
contingency plan: a plan that provides general response actions to address new orpreviously unidentified site conditions, or poor performance of the remedial system.
The completion strategy can often be effectively documented using a decision tree or flow chart thatpresents decision points in implementing the exit strategy in terms of “if/then/because” options. Inother words, the exit strategy should specify the metrics for evaluating cleanup progress and thesteps to follow depending on the system response. Examples of these may be achieving specific

ITRC – Strategies for Monitoring the Performance of DNAPL Source Zone Remedies August 2004
24
concentrations in target monitoring wells within a certain time frame, percentage declines inextracted air or groundwater contaminant concentrations, cumulative DNAPL mass removed, aspecified period of time during which dissolved contaminant concentrations are static or belowtargeted levels at the response boundary, or similar parameters. Failure to achieve predeterminedmetrics that measure the expected progress should trigger contingency actions to correct the courseof the remedial action or to reassess the performance goals.
The exit strategy should include a specific approach to tailoring necessary monitoring frequency,location, and analyses as site conditions change. As the remediation progresses, operatingconditions will become more stable and the rate of change of most parameters will decrease.Therefore, it may be cost-effective to reduce the frequency of system efficiency monitoring overtime. There are exceptions to this trend of decreasing monitoring scope with duration, however.For instance, in terms of determining when to end active treatment, the monitoring needs maysignificantly increase as the remediation approaches the end point in order to confirm that continuingthe remediation would have diminishing returns. In addition, at sites where emerging issues (i.e.,based on improving knowledge about chemical toxicity, fate, migration, or technical advances thatallow refined detection of DNAPLs) expand the source zone or the exposure pathways of concern,there may be a need for provisions for increased monitoring in the event unexpected conditions areencountered.
The exit strategy also should include provisions for monitoring of response of the subsurface to thecessation of any remediation activity for some period of time (i.e., rebound monitoring). Thereshould be contingency provisions for restart of the remediation process if some undesirable responseis observed (ITRC Remedial Process Optimization Team, Remediation Process Optimization:Identifying Opportunities for Enhanced and More Efficient Site Remediation, in process).
Each site-specific strategy also should be compatible with the facility-wide closure strategy toensure consistency of assumptions, objectives, and any administrative and engineered controls.Various remediation activities (e.g., extraction from specific wells, use of a particular abovegroundtreatment process, or in situ treatment of a source area) may be reduced or eliminated prior to siteclosure or attainment of long-term goals when continuation of these activities no longer contributessignificantly to progress toward the remedial objectives. The decisions as to when and how toimplement these interim changes should be made in a technically sound manner based on reasonablemetrics (e.g., “triggers”). Site closure is discussed in Section 3.4.
3.3 Data Quality Considerations
Performance monitoring data acquisition associated with DNAPL source zone remediation can besubject to significant sampling and analytical error, like any data collection exercise involving ahighly variable and heterogeneous matrix. Because decisions concerning the effectiveness ofDNAPL source zone remedies can affect public health and involve considerable risk and cost, it isimperative that the uncertainty of the data, on which such decisions are made, is understood andmanaged. There have been several papers published that discuss the issues of managing uncertainty(Crumbling, et al., 2001) and the representativeness of environmental data (Crumbling, 2002).

ITRC – Strategies for Monitoring the Performance of DNAPL Source Zone Remedies August 2004
25
In cooperation with ITRC and other federal agencies, EPA has developed a work strategy frameworkcoined the “Triad.” The Triad approach embraces scientific and process improvements in threeareas: systematic project planning, dynamic work strategies, and real-time measurementtechnologies. The Triad work strategy approach can be used to help teams develop performancemonitoring strategies that manage decision uncertainty and increase the effectiveness and qualityof DNAPL source zone remedies. The ITRC has published a technical/regulatory guidelinedocument that describes the Triad approach in detail (ITRC, 2003c).
3.3.1 Setting Data Quality Objectives
Data quality objectives (DQOs) define what you are going to measure and how critical the qualityof the data to be generated is. According to EPA, “the DQO Process is a strategic planning approachbased on the Scientific Method to prepare for a data collection activity. It provides a systematicprocedure for defining the criteria that a data collection design should satisfy, including when tocollect samples, where to collect samples, the tolerable level of decision error for the study, and howmany samples to collect, balancing risk and cost in an acceptable manner” (EPA, 1996b).
Use of the DQO process ensures that the environmental data (type, quantity, and quality) used indecision making will be appropriate for the intended application, resulting in decisions that aretechnically and scientifically sound and defensible.
For source zone sampling activities, attaining data of high analytical quality from individual pointsmay not be as important as in a dissolved contaminant investigation where detection levels must bevery low, the tolerance for error is often more critical, and decisions about whether or not toremediate more often impact public health.
3.3.2 Use of Statistics
The use of statistical analyses of the data is an important tool in evaluating performance andmanaging uncertainty. Data generated from remediation sites are often full of good information butsometimes too complex to easily see system trends and may require sophisticated statistical and datamodeling procedures to evaluate. For instance, assessing the degree of change in contaminant levelsbetween pre- and post-treatment may require a modeling procedure or established methods that canaccount for temporal and/or spatial data correlation.
It is easy for a project manager to get lost in the world of statistics and modeling, for some of theconcepts and literature in the field is quite obscure. Fortunately, there are numerous tools andguidance available to help. Appendix D contains a discussion of statistical approaches applicableto designing a performance assessment program.
3.3.3 Systematic Planning
It is critical that a systematic planning process be used to clearly layout monitoring objectives andbuild team consensus on how to manage the uncertainty associated with assessing performance. A

ITRC – Strategies for Monitoring the Performance of DNAPL Source Zone Remedies August 2004
26
systematic project planning process should always be utilized to define site-specific performanceassessment objectives and the associated sampling and analytical strategy. The team used to developthe performance objectives must be knowledgeable not only about the characteristics of the site andthe remedial objectives but also about the technology being employed. Outputs of the systematicplanning process should include
• consensus on the CSM and desired outcome or goal for the performance assessment,• a preliminary performance expectation from existing information,• a list of the various regulatory, scientific and engineering decisions that must be made
in order to achieve the desired outcome,• a list of the unknowns that stand in the way of making those decisions,• strategies to eliminate or “manage around” those unknowns,• explicit control over the greatest sources of uncertainty in performance data (i.e.,
sampling-related variables such as sample volume, sampling frequency, whether grabsamples or time-integrated samples are used, etc.), and,
• an atmosphere of trust, open communication, and cooperation between parties workingtoward a protective, yet cost-effective resolution of the “problem”.
An effective systematic planning process will result in clear communication on the performancemetrics and an understanding of how different project stakeholders will be evaluating success. Thesystematic planning process is the foundation that allows the team to effectively modify theperformance monitoring strategy as treatment is taking place as described in the Fort Lewis examplebelow.
3.3.4 Dynamic Work Strategies and Real-Time Measurement Technologies
Work planning documents written in a dynamic or flexible mode guide the course of the project toadapt in real time as new information becomes available, allowing preliminary CSMs to be testedand evolved to maturity (i.e., sufficiently complete to support the desired level of decisionconfidence) in real time, saving significant time and money while supporting better resolution ofuncertainties. A valuable aspect of dynamic work strategies, effective process quality control (QC)in real time, makes QC procedures more relevant and powerful than what is possible with workplans written in a static mode. Dynamic work strategies can be used for developing performancemonitoring approaches that enable the technical team to decide on the location and frequency ofmonitoring based on meeting clearly defined project monitoring objectives.
Real-time measurement technologies make dynamic work strategies possible by gathering,interpreting, and sharing data fast enough to support real-time decisions. The range of technologiessupporting real-time measurements includes field analytical instrumentation, in situ sensing systems,geophysics, on-site gas chromatography/mass spectrometry (GC/MS), rapid turnaround fromtraditional laboratories, and computer systems that assist project planning, and store, display, map,manipulate, and share data.

ITRC – Strategies for Monitoring the Performance of DNAPL Source Zone Remedies August 2004
27
Box 3-2 describes how the Triad work strategy is being employed at the Fort Lewis Logistics Centerin Washington State.
3.3.5 Benefits of Utilizing Triad Approach for DNAPL Performance Assessment
Triad’s emphasis on systematic planning to manage the full range of uncertainties (i.e., to clarifyproject goals and concerns through open discussion and documentation) creates an atmosphereconducive to trust and cooperative negotiations among all involved parties. If the technical issuesare out in the open and stakeholders are assured that resource limitations and scientific uncertaintiesare being fairly balanced in relation with their concerns, there is a stronger foundation fornegotiating parties to communicate over the more thorny and value-laden social issues.
Box 3-2. Use of Triad Strategy for Monitoring Performance at the Fort LewisLogistics Center Superfund Site
The Fort Lewis Logistics Center Superfund site is using a Triad work strategy forperformance monitoring associated with an in situ electrical resistance heating NAPLsource remediation project. An on-site GC/MS is being used to produce air and waterdata within 24 hours of sample collection, and project data are posted to a Web site. Theon-site GC/MS allows for analysis of samples covering a large concentration range andis being used for compliance (i.e., stack emission and reinjection criteria), operational,and performance monitoring. Specific benefits of utilizing the Triad include the following:
Better control. Hydraulic, vapor, and thermal control of the treated region aremaintained more effectively by interpreting groundwater concentration, temperature, andhydraulic gradient data “on-the-fly” and making adjustments in extraction and reinjectionrates dynamically.
More efficient energy distribution. Dynamic sampling has enabled the team to altersystem monitoring strategies to collect data supporting a decision to redirect energyinput from zones that have met contract-defined temperatures and show diminishingreturns of chlorinated solvent mass recovery to zones requiring additional energy input.
Quicker system shakedown. During system startup, dynamic sampling allowed rapidfine-tuning of the treatment system to ensure mass destruction was optimized andcontaminant discharge criteria were being met.
Minimal contaminant migration. If temperature data indicate that heated water isleaving the treatment area, sampling frequency of the effected exterior monitoring wellsis increased to ensure that contaminants are not also being lost from the site.
Other specific benefits include the following:
• flexibility in sample collection location and frequency allows for optimization of above-and belowground remedial system operations,

ITRC – Strategies for Monitoring the Performance of DNAPL Source Zone Remedies August 2004
28
• uncertainty in the data being used for performance and compliance monitoring can belowered,
• analytical approach can be flexible to allow for detection of secondary contaminants ofconcern,
• data reporting requirements and QC protocols can be developed to specifically meet theneeds of the data use,
• systematic planning encourages the team to determine whether analyte specific data isreally required or whether a less expensive surrogate contaminant method like totalorganic carbon (TOC) could be used,
• having the performance data available in a timely fashion allows contract requirementsto be assessed while in the field and corrective actions implemented rapidly, if required,and,
• use of Triad supports the concepts of adaptive DNAPL site management (discussed inSection 3.4.2).
3.4 Keeping an Eye Toward Site Closure
The closure process is part of the life cycle of DNAPL site cleanup, which may include discovery,characterization, remedy selection, remedial action construction, operation and maintenance, andlong-term monitoring.
3.4.1 What Does Site Closure Mean?
Site closure is the process of obtaining release from responsibilities under the operable regulatorydriver. The operable regulations may include CERCLA, RCRA Corrective Action, state Superfund,brownfield or voluntary cleanup programs, and the Leaking Underground Storage Tank (LUST)program, to name a few.
Elements of each program may vary according to specific state and federal regulations but generallyhave a similar path that leads to site closure provided applicable regulatory conditions have beenmet. Regulatory condition elements may include setting risk-based cleanup goals, addressing sourceremoval, post-remedial monitoring, and the determination from data collected that remedial goalshave been met or that additional remediation is warranted.
3.4.2 Making Decisions about Continued Operation
The decision-making process involved in selecting the appropriate remedy or chain of remedies fora contaminated site is driven by a mix of technical, regulatory, and economic factors that isdetermined on a site-specific basis. These same factors must be reconsidered after the remedialsystem is up and running, and a decision must be made whether to cease treatment or transition toanother technology or remedial approach. Objective measures of remedial performance that assessboth the efficiency and effectiveness of the remedy are crucial at these transition points.

ITRC – Strategies for Monitoring the Performance of DNAPL Source Zone Remedies August 2004
29
Closure with Long-Term Management
There are two possible end states for a DNAPL site: the regulatory agency issues an NFA letter orsome equivalent certification of closure, or the site is placed in a long-term management program.If the groundwater impacted by a site is restored to its highest beneficial use, the site can be closedin an absolute sense. Ideally, if a source reduction or depletion action meets the final cleanup goals,the site closure process may go through a period of long-term monitoring followed bydecommissioning of the sampling well locations. However, where complete groundwater restorationis not achieved following several attempts at remediation, or if waste or hazardous constituentsremain on site after completing the action, long-term management requirements will likely benecessary. This is the likely scenario for sites which have completed a remedial action but whereconcentrations have reached asymptotic levels or residual DNAPL remains in a source area andthere is no unacceptable risk.
Adaptive Site Management
Adaptive site management refers to a comprehensive, flexible approach, outlined in a recentNational Research Council report (NRC, 2003), for dealing with hydrogeologically complex sitesthat are difficult to remediate. The goals of adaptive site management are to facilitate decisionmaking over the long-term when the effectiveness of the remedy reaches an asymptote prior toreaching cleanup goals.
Decision making at these complex sites, which includes many DNAPL sites, does not fit easily intothe linear, “Superfund-style” model where a site is characterized, a remedy is selected andimplemented, cleanup goals are attained and verified, and the site is closed. A more iterative andadaptive approach to DNAPL source zone remediation may be more appropriate—one thatrecognizes that the performance of most in situ technologies, particularly in complex situations, isnot known with a great degree of certainty and one that encourages adaptation as the remedial actionprogresses and new information is processed. This broad systems approach to site remediation isdiscussed in more detail in the NRC report Environmental Cleanup at Navy Facilities: Adaptive SiteManagement (NRC, 2003).
4.0 QUANTIFYING PERFORMANCE WITH FIELD METRICS
In most DNAPL remedial situations, the same difficulties and technological limitations that arefaced when using conventional site investigation techniques to characterize a DNAPL sourceresurface when verifying a technology’s performance or effectiveness. ITRC and others havepreviously discussed the difficulties in characterizing the subsurface distribution of DNAPL(Pankow and Cherry, 1996; ITRC, 2003a). For this reason, it is recommended that a “converginglines of evidence” approach be used to evaluate performance, combining several techniques.

ITRC – Strategies for Monitoring the Performance of DNAPL Source Zone Remedies August 2004
30
“No single metric by itself is likely to be adequate for assessingthe performance and potential benefits of source depletion
technologies; thus, conjunctive use of multiple metrics should beused to evaluate performance.” (Kavanaugh, et al., 2003)
This section describes various performance metrics (or measures of success) that have been used orconsidered to assess the effectiveness of specific in situ DNAPL source zone technologies. Eachinvolves monitoring changes in some environmental parameter or condition in an attempt todemonstrate a reduction in contaminant mass, concentration, mobility, or toxicity. Box 4-1highlights some of the findings from a recent survey of DNAPL projects by LeBron (2004) thatprovide insight into the metrics being employed in the field.
Box 4-1. Summary of Performance Metrics From Recent Survey
In 2003, the Chief of Naval Operations sponsored a project to document informationabout DNAPL site conditions, source treatment, and performance assessment forlocations throughout the United States (Lebron, 2004). The survey collected data from118 different treatment locations. Of these treatment projects, Lebron compiledperformance assessment information on 53 DNAPL source zone technology applicationsthat have been completed and provided a summary of the results.
In general, three types of quantifiable performance metrics were evaluated in this surveythat can provide some insights into how well treatment worked: mass removal, decreases in mass flux, and observation of contaminant rebound.
Of the 20 locations that measured mass removal, more than half reported more than90% DNAPL mass reduction; nearly 20% of these 20 locations claim to have removed100% of the source DNAPL. The methodology used by the sites to obtain theseestimates is not provided by the survey.
Approximately half of the locations in the survey where treatment applications hadoccurred evaluated reduction of mass flux as a measure of source treatmentperformance. Almost 57% of the sites using mass flux measurements report in excessof 80% reduction as a result of source treatment. In contrast, 19% of the users of thismetric report only a small reduction in flux (i.e., less than 20%).
One-third of the 21 locations making measurements of post-treatment changes incontaminant rebound in groundwater observed some rebound; two-thirds did not. Atpresent, it is not possible to determine what threshold was used by respondents to thesurvey used to make this determination, nor is the magnitude of the rebound known. Perhaps a follow-up survey will yield answers to these questions.
Table 4-1 provides a summary of the various methods described in this section and their relativeapplicability.

31
Tabl
e 4-
1.C
ompa
rison
s of
App
roac
hes
for E
valu
atin
g P
erfo
rman
ce
App
licab
leR
emed
ial M
etric
Perf
orm
ance
Ass
essm
ent
Met
hod
Mea
sure
dPa
ram
eter
Der
ived
Para
met
erR
elat
ive
Com
plex
ityR
elat
ive
Acc
urac
ySe
ctio
nR
efer
ence
Adso
rbed
-pha
sere
duct
ion
Soi
l cor
ing
Soi
l con
cent
ratio
nS
orbe
d co
ncen
tratio
nLo
w to
inte
rmed
iate
:op
erat
iona
l met
ric;
may
requ
irest
atis
tical
ana
lysi
s
Inte
rmed
iate
: dep
ends
on s
tatis
tical
use
of d
ata
4.2.
1
Dis
solv
ed-p
hase
redu
ctio
nG
roun
dwat
ersa
mpl
ing
Aque
ous
conc
entra
tion
• Plu
me
exte
nt• C
hang
e in
DN
APL
com
posi
tion
Low
: ope
ratio
nal
and
rem
edia
lm
etric
Inte
rmed
iate
to h
igh
4.2.
2
Sou
rce
mas
sex
tract
edE
fflue
nt s
ampl
ing
Vol
umes
and
con
c. o
fex
tract
ed fl
uids
Con
tam
inan
t mas
sre
mov
edLo
w: o
pera
tiona
lan
d re
med
ial
met
ric
Hig
h: d
epen
ds o
nfre
quen
cy o
f mon
itorin
g4.
3.1
Sou
rce
mas
sde
stro
yed
Gro
undw
ater
sam
plin
gC
once
ntra
tion
ofbr
eakd
own
prod
ucts
(e.g
.,chl
orid
e)
Mas
s of
DN
AP
Lde
stro
yed
in s
ituIn
term
edia
te:
inte
nsiv
e sa
mpl
ing
and
stoi
chio
met
rican
alys
is re
quire
d
Low
: diff
icul
t to
atta
inm
ass
bala
nce
(e.g
.,ot
her s
ourc
es o
fch
lorid
e)
4.3.
2
Sou
rce
mas
sre
mai
ning
Soil
corin
gSo
il co
ncen
tratio
n an
dvi
sual
obs
erva
tion
• DN
AP
L di
strib
utio
n• S
orbe
d m
ass
Inte
rmed
iate
:in
tens
ive
sam
plin
gw
ith g
eost
atis
tical
anal
ysis
requ
ired
Low
to in
term
edia
te:
incr
ease
s w
ithin
crea
sing
den
sity
of
poin
t mea
sure
men
ts
4.3.
3
Trac
er te
sts
Con
cent
ratio
n of
trace
rs• N
AP
L vo
lum
e• S
atur
atio
nH
igh:
mat
hem
atic
alan
alys
is a
ndpu
mpi
ng /
inje
ctio
npr
ogra
m re
quire
d
Inte
rmed
iate
to h
igh:
pote
ntia
l lim
itatio
nsba
sed
on D
NAP
Lar
chite
ctur
e
Gro
undw
ater
sam
plin
gAq
ueou
s co
ncen
tratio
nAq
ueou
sco
ncen
tratio
nIn
term
edia
te:
inte
nsiv
e sa
mpl
ing
with
num
eric
alm
odel
ing
requ
ired
Low
: cor
rela
tion
with
sour
ce m
ass
redu
ctio
nis
unc
erta
in

App
licab
leR
emed
ial M
etric
Perf
orm
ance
Ass
essm
ent
Met
hod
Mea
sure
dPa
ram
eter
Der
ived
Para
met
erR
elat
ive
Com
plex
ityR
elat
ive
Acc
urac
ySe
ctio
nR
efer
ence
32
Mob
ility
redu
ctio
nSo
il co
ring
Soil
conc
entra
tion
and
visu
al o
bser
vatio
nN
APL
pres
ence
and
satu
ratio
nLo
w to
inte
rmed
iate
Low
: cor
rela
tion
with
redu
ced
mob
ility
unce
rtain
4.4.
1
Pro
duct
gau
ging
NA
PL
thic
knes
sN
AP
L th
ickn
ess
Low
Low
: cor
rela
tion
with
redu
ced
mob
ility
unce
rtain
Toxi
city
redu
ctio
nSo
il co
ring
Adso
rbed
conc
entra
tion
DN
AP
L co
mpo
sitio
n4.
4.2
Gro
undw
ater
sam
plin
gA
queo
us c
once
ntra
tion
Con
cent
ratio
ns o
fto
xic
para
met
ers
Mas
s flu
x/m
ass
disc
harg
e re
duct
ion
Wel
l tra
nsec
tsa
mpl
ing
• Aqu
eous
con
c.• H
yd. c
ondu
ctiv
ity• H
yd. g
radi
ent
• Dar
cy fl
ux• M
ass
flux
• Mas
s di
scha
rge
Inte
rmed
iate
:in
tens
ive
sam
plin
gw
ith c
lose
wel
lsp
acin
g pr
efer
red
Inte
rmed
iate
:in
crea
ses
with
incr
easi
ng d
ensi
ty o
fpo
int m
easu
rem
ents
4.4.
3
Flux
met
ertra
nsec
ts• M
ass
of re
side
nttra
cer r
etai
ned
onso
rben
t• M
ass
of c
onta
min
ant
reta
ined
on
sorb
ent
• Dar
cy fl
ux• M
ass
flux
• Mas
s di
scha
rge
Inte
rmed
iate
:in
tens
ive
sam
plin
gw
ith c
lose
wel
lsp
acin
g pr
efer
red
Unt
este
d in
U.S
.re
gula
tory
env
ironm
ent
Inte
gral
pum
ping
test
sC
once
ntra
tions
-tim
ese
ries
sam
plin
g fro
mex
tract
ion
wel
l
• Mas
s di
scha
rge
• Ave
rage
plu
me
conc
.
Hig
h: n
umer
ical
anal
ysis
requ
ired;
no c
omm
erci
also
ftwar
e; p
umpi
ngpr
ogra
m re
quire
d
Unt
este
d in
U.S
.re
gula
tory
env
ironm
ent

ITRC – Strategies for Monitoring the Performance of DNAPL Source Zone Remedies August 2004
33
4.1 Categories of Performance Metrics
There are three broad categories of performance metrics that capture the principal types ofevaluation tools most frequently being used to measure success of DNAPL source treatment:
• qualitative estimates of the degree of progress towards source treatment,• quantitative estimates of DNAPL source mass reduction, and,• quantitative estimates of the impact of source treatment on factors such as toxicity,
mobility, and plume strength.
Figure 4-1 illustrates these three classes of metrics and lists specific evaluation methodsencompassed by them. Each evaluation tool is cross-referenced to a specific part of this sectionwhere more detailed information is provided. The metrics presented in Figure 4-1 are applicableto DNAPL sources in the vadose and saturated zones where soils and unconsolidated media areinvolved. Although the metrics could be modified for bedrock conditions, we have only limitedexperience in treating DNAPL sources in consolidated media and in designing appropriateperformance assessment strategies. For these reasons, the performance measures outlined in Figure4-1 are most applicable to DNAPLs in unconsolidated media.
It is important to recognize that these metrics are neither equivalent to nor interchangeable with oneanother. They address different types of performance measures and range from qualitative indicatorsof treatment progress to quantitative measures of specific impacts. Furthermore, there is littleconsensus within the technical community as to which metric or combination of metrics is mostappropriate for evaluating the effectiveness of DNAPL source treatment. Many factors are involvedin this decision. This section is designed to raise awareness of the spectrum of possible performancemetrics and the primary strengths and limitations of each.
The qualitative tools, such as general decreases in soil or groundwater concentrations followingtreatment, typically give only an indication that progress is being made toward source cleanupwithout any objective way of quantifying the degree of cleanup or the long-term implications of thechanges. In contrast, measures of source mass reduction and mass flux yield quantitative estimatesof impacts of source treatment that frequently are required for remediation projects.
There are several methods by which DNAPL source mass can be determined, although currently itis not possible to translate the percentage of mass removed into an estimate of projected impact onplume concentrations. Mass flux measurements ideally provide insights to how source treatmentis associated with decreased source loading to a plume as a function of the amount of DNAPL massremoved. Such measurements provide a snapshot of mass flux, but not necessarily an indication oflong-term improvements.
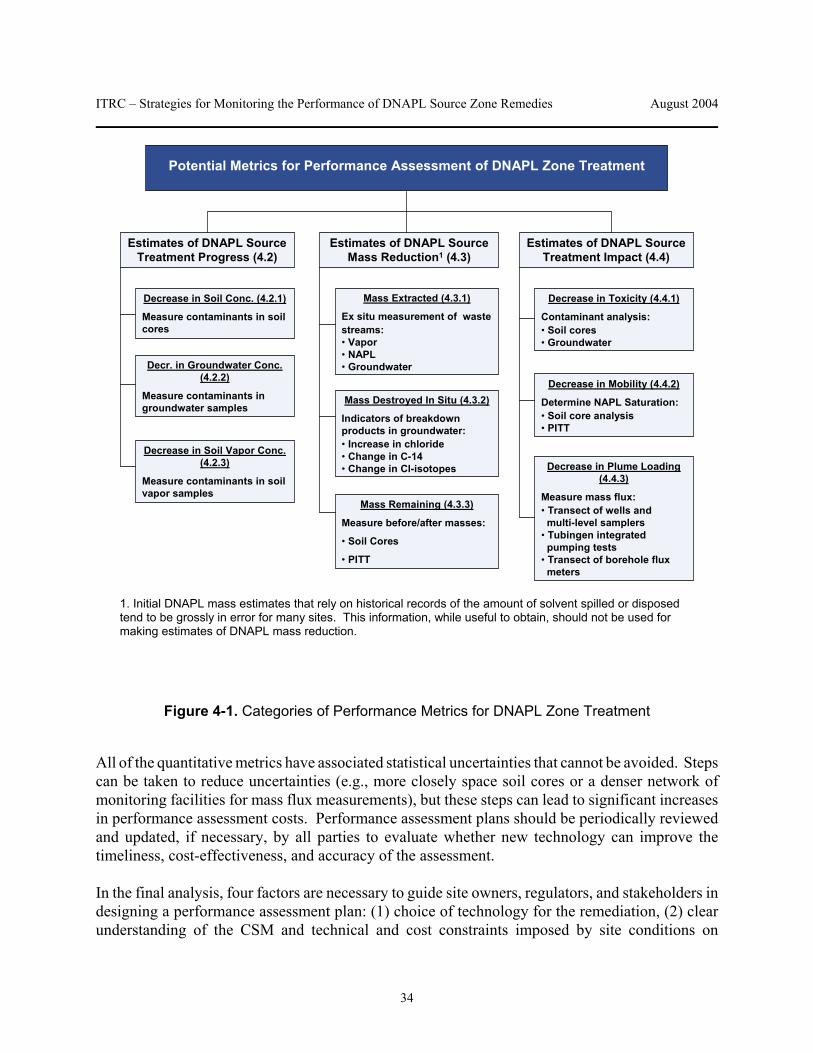
ITRC – Strategies for Monitoring the Performance of DNAPL Source Zone Remedies August 2004
34
Estimates of DNAPL Source Treatment Impact (4.4)
Decrease in Toxicity (4.4.1)
Contaminant analysis:• Soil cores• Groundwater
Decrease in Mobility (4.4.2)
Determine NAPL Saturation:• Soil core analysis• PITT
Decrease in Plume Loading (4.4.3)
Measure mass flux:• Transect of wells and
multi-level samplers• Tubingen integrated
pumping tests• Transect of borehole flux
meters
Estimates of DNAPL Source Treatment Progress (4.2)
Decrease in Soil Conc. (4.2.1)
Measure contaminants in soil cores
Decr. in Groundwater Conc. (4.2.2)
Measure contaminants in groundwater samples
Estimates of DNAPL Source Mass Reduction1 (4.3)
Mass Extracted (4.3.1)
Ex situ measurement of wastestreams:• Vapor• NAPL• Groundwater
Mass Destroyed In Situ (4.3.2)
Indicators of breakdown products in groundwater:• Increase in chloride• Change in C-14• Change in Cl-isotopes
Mass Remaining (4.3.3)
Measure before/after masses:
• Soil Cores
• PITT
Potential Metrics for Performance Assessment of DNAPL Zone Treatment
Decrease in Soil Vapor Conc. (4.2.3)
Measure contaminants in soil vapor samples
1. Initial DNAPL mass estimates that rely on historical records of the amount of solvent spilled or disposedtend to be grossly in error for many sites. This information, while useful to obtain, should not be used formaking estimates of DNAPL mass reduction.
Figure 4-1. Categories of Performance Metrics for DNAPL Zone Treatment
All of the quantitative metrics have associated statistical uncertainties that cannot be avoided. Stepscan be taken to reduce uncertainties (e.g., more closely space soil cores or a denser network ofmonitoring facilities for mass flux measurements), but these steps can lead to significant increasesin performance assessment costs. Performance assessment plans should be periodically reviewedand updated, if necessary, by all parties to evaluate whether new technology can improve thetimeliness, cost-effectiveness, and accuracy of the assessment.
In the final analysis, four factors are necessary to guide site owners, regulators, and stakeholders indesigning a performance assessment plan: (1) choice of technology for the remediation, (2) clearunderstanding of the CSM and technical and cost constraints imposed by site conditions on

ITRC – Strategies for Monitoring the Performance of DNAPL Source Zone Remedies August 2004
35
monitoring, (3) a realistic set of performance objectives consistent with the CMS, and (4)recognition of the limitations of each of the performance assessment metrics to be applied.
4.2 Estimates of Source Treatment Progress
A remediation goal often stated in decision documents is to attain some numeric soil cleanup levelor groundwater concentration at a point of compliance. The view that treatment of a DNAPL sourcezone was successful is often linked to a decrease in the average concentration of a contaminant insoil, groundwater, or vapor. Indeed, progress monitoring at DNAPL projects usually involves someform of sample collection and chemical analysis to evaluate changes in soil or groundwaterconcentration over time.
As discussed in Section 1.3.1, preventing further migration or possible exposure during remediationefforts is a primary concern expressed by regulators and the public. This concern can be addressedthrough monitoring groundwater or vapor contaminant concentrations at the perimeter of thetreatment zone to verify that no unacceptable exposure to down-gradient receptors is occurring.Preventing contaminant migration through hydraulic control of the treatment zone is therefore animportant, but sometimes overlooked, objective.
4.2.1 Decrease in Soil Concentration
Applicability and Use
Data collection methods for soil sample collection, handling, and analysis are widely known andgenerally accepted by regulators. The use of soil sampling for confirmation of cleanup mustconsider the heterogeneous distribution of contamination at a site and the uncertainties associatedwith sampling soils for VOCs, for instance. Soil sampling to confirm cleanup should be based ona statistical sampling design to quantify the certainty of achieving goals. Sampling design andprotocols are discussed in guidance produced by the U.S. Army Corps of Engineers (USACE, 2002).
Pre- and post-treatment soil data can be analyzed in numerous ways, depending on the remediationobjective and statistical approach. Discrete soil data points can be compared directly to numericalsoil cleanup criteria established for the specific site or can be averaged geospatially to evaluateoverall decreases in contaminant concentration to gauge performance. As discussed in Section 4.3,soil concentration data are also commonly used to derive estimates of in situ contaminant mass inorder to compare the total mass before treatment to the mass remaining after treatment.
Selecting Sample Size
We can examine the difficulty in detecting a target (i.e., the DNAPL) within a site using simplifiedprobability theory. If the DNAPL is represented by a target area AT, within a site of area AS, thenthe probability of random detection (PD) using N attempts is found by:
PD = 1 - (1 - AT/AS)N

ITRC – Strategies for Monitoring the Performance of DNAPL Source Zone Remedies August 2004
36
Using some reasonable values for both the target area and site area, we can see that our probabilityof finding the DNAPL is very low. It increases, of course, if more than one location is sampled.Table 4-2 shows the number of samples required to find the DNAPL for different ratios of AT to ASand probabilities of detection. The example illustrates that a large number of samples is requiredto find a target, such as a source zone, using randomly chosen locations. Better results can beobtained by selecting sampling locations based on an adequate conceptual site model which accountsfor knowledge of the site’s history, locations of buried utility lines and conduits, and the subsurfacegeology.
Table 4-2. Number of Sample Points Required to Detect Target Area
Probability ofdetection
Number of random samples required where:
AS/AT = 10 AS/AT = 100 AS/AT = 1000
98% 38 390 3,950
90% 22 230 2,400
75% 14 138 1,390
50% 7 70 700
30% 4 36 360
Source: Daniel, 1992.
Soil Sample Collection Methods
Soil sampling is most commonly performed while drilling although direct-push technologies arebecoming more widely used for soil sample collection. Drilling in source zones should proceedcautiously inward from outside of the suspected source area and should be conducted with the properprecautions for protecting the integrity of capillary barriers. When drilling within the DNAPLsource zone, extreme care should be taken to ensure that conduits for vertical migration are notcreated. If the sampling is not conducted properly, the DNAPL and/or the dissolved plume couldbe spread. Abandoned soil borings must be properly sealed to mitigate the potential for verticalmigration. Surface casing may be used to seal off an upper contaminated zone from uncontaminatedlower zones in a multilayered source zone.
Selection of the appropriate sampling devices to recover soil samples from a DNAPL zone dependsmainly on the type of soil to be sampled. The objective is to choose a sampler that will maximizethe recovery of soil and retain as much of the fluid in the pore spaces as possible. When samplingsoil containing chlorinated solvent VOCs, for example, the manner in which a recovered core ishandled and sampled can impact the extent of volatile losses. Loss of volatile compounds is not aconcern when sampling semivolatile VOCs (SVOCs) like semivolatile creosote and coal tarDNAPLs. The rapid loss of volatile DNAPL components (up to three orders of magnitude) during

ITRC – Strategies for Monitoring the Performance of DNAPL Source Zone Remedies August 2004
37
standard sample handling and preparation has been well documented and has given rise to thepractice of performing solvent extractions in the field (Hewitt, et al., 1995). Quickly placing aportion of the soil from the sampler directly into a solvent (usually methanol) at the logging tablepreserves the volatile compounds in the resulting sample by lowering their partial vapor pressures.Field preservation of soil samples with solvent is highly recommended when the objective is toobtain meaningful analytical results from a DNAPL zone.
Although there are a wide variety of drilling methods, many are not appropriate for DNAPL zones,especially if the ultimate objective is to quantify NAPL saturations. For many DNAPL sites inunconsolidated sediments, drilling with a hollow-stem auger (HSA) is the preferred method,however direct-push technologies are also appropriate and may provide less-disturbed samples forVOC analyses. Direct-push methods for sampling soil are discussed in greater detail on EPA’s FieldAnalytics Technologies Web site (http://fate.clu-in.org/direct_push/soilandsoilgassamp.asp).Segments of the borehole can be cased off to protect uncontaminated zones by driving larger-diameter surface casing to the necessary depth, and the auger itself acts as a protective casing forthe sampler installed just slightly ahead of the auger bit. Also, a variety of efficient samplingsystems (e.g., wireline) and sampling tools are available for use with HSA. Wash rigs and mudrotary methods may displace significant amounts of DNAPL ahead of the bit due to the delivery andrecirculation of drilling fluids through the stem. Similarly, the use of air to evacuate cuttings fromaround the drill bit can volatilize DNAPL components in a manner equivalent to soil vaporextraction. Rotosonic drilling is an excellent method for continuous sampling and provides a largevolume of core in a manner that minimizes the risk of compromising the integrity of capillarybarriers. Rotosonic drilling, also known as “vibratory drilling,” uses an oscillating drill head or corebarrel to quickly advance through the subsurface. Drill cuttings are limited and are forced into thewalls of the borehole.
Measuring Soil Contaminant Concentration
The concentration of organic compounds in soil samples can be quantified in a laboratory using astandard laboratory method (e.g., EPA Method 8260 for volatile organics) or estimated usingimmunoassay test kits or direct reading instruments such as the membrane interface probe (MIP)attached to various down-hole tools. Use of an on-site laboratory in conjunction with direct-pushtechnologies should be considered when possible to provide real-time chemical analysis andimprove the effectiveness of the investigation.
In addition to the total concentration of chemical constituents, DNAPL saturation estimates requirethat soil samples be collected for determination of foc and bulk density. As described in Section2.1.2, the fraction of organic carbon in soil affects contaminant and surfactant sorption in thesubsurface. Samples for foc should be collected from areas with little or no contamination. The soilsamples should be measured for TOC. The TOC results are then converted to foc by dividing themeasured TOC by the mass fraction of dry soil.

ITRC – Strategies for Monitoring the Performance of DNAPL Source Zone Remedies August 2004
38
Limitations
Potential problems and challenges with using soil concentration data to verify performance include(1) the need for large numbers of samples to address site heterogeneities and temporal and spatialvariability, (2) the potential for large measurement errors with some chemicals in some media (e.g.,VOCs in soil), (3) the potential errors in interpolation methods used to estimate contaminant levelsat locations without measurements, and (4) the fact that concentration changes may not be due toin situ treatment (e.g., changes could be due to redistribution of mass during in situ flushing orthermal technologies).
Another aspect of the difficulty of detecting DNAPLs is that soil sampling is inherently destructive.Once a sample is obtained from a location, subsequent sampling must be made in a new location thatmay or may not contain DNAPL. If the goal is to assess performance of a remediation technology,a direct comparison of conditions before and after treatment cannot be made.
Furthermore, soil collection methods used in the field sometimes yield lower soil concentrationsbecause samples are sometimes combined with regard to the vertical location. Field collectionmethods often lead to soil from several-foot intervals being combined either intentionally oraccidentally, so that the chemical analysis of the soil samples truly represents a vertically averagedand perhaps lower value.
In the saturated zone, when an upper concentration limit or threshold value is used to distinguishbetween DNAPL and dissolved-phase contaminant, lower soil concentrations can be misrepresentedas dissolved-phase contaminant and not DNAPL. Conversely, a higher soil concentration can bemisrepresented as a DNAPL source zone instead of a dissolved phase. Establishing a thresholdvalue can be very complicated since the computation must consider the chemical properties of theDNAPL constituents, the properties of the soil, and other site-specific data, which is hard to obtainin many cases. In the absence of analytical problems, the primary reason for false positives wouldbe inadequate information about DNAPL composition, soil organic carbon content, or thepartitioning behavior of the DNAPL constituents with the soil.
Losses of DNAPL during soil collection can also significantly reduce the concentration and yieldlower than actual soil concentrations. Losses can occur simply from volatilization during thesampling event. Verschueren (1983) states that half the TCE will evaporate from a 1-mg/L aqueoussolution at 25°C in 19–24 minutes. Clearly, a significant amount of a DNAPL can be lost duringor after the sampling if care is not exercised to prevent volatilization. Sample handling andpreservation techniques recommended by EPA to minimize loss of VOCs from soil samples includeon-site methanol or water preservation and the use of a headspace-free, gas-tight sampling device(Encore™ or SoilCore™).
Another consideration with respect to the soil collection method is whether the volume of soil isadequate to determine whether any DNAPL is present. Based on calculations of the “representativeelementary volume” (the smallest sample volume from which derived data can be extrapolated torepresent the remaining untested soils at the site) for a complex, highly heterogeneous DNAPL site,

ITRC – Strategies for Monitoring the Performance of DNAPL Source Zone Remedies August 2004
39
a soil sample volume of up to 0.3 ft3 (2.2 gal) may be required to determine the presence of DNAPLin soil. Since a typical soil sample size is on the order of 10 mg with a volume of approximately0.003 ft3, it is quite possible to miss DNAPL simply because the volume collected is inadequate.
For a variety of reasons, soil concentration data can easily be misinterpreted with regard to thepresence or absence of DNAPL. These problems and challenges can be overcome, at least in part,by careful and integrated use of modern sampling and analyses methods, field analytical methods,innovative sensor technologies, and geostatistical modeling methods (Siegrist and Satijn, 2002).Triad work strategies can be used to assist teams with developing strategies to manage theuncertainty associated with complex DNAPL characterization efforts (ITRC, 2004).
4.2.2 Decrease in Dissolved Concentration
Techniques for monitoring groundwater concentrations are well known and will not be describedin detail here. This section describes several enhancements to conventional monitoring schemes thatmay be applicable to DNAPL sites.
Applicability and Use
Improving groundwater quality at a DNAPL site is a commonly stated response objective. Acommon approach to measuring success at these sites, therefore, has been to monitor improvementsin groundwater quality. This process usually involves installing a network of monitoring wellswithin or down-gradient from the DNAPL source area to detect changes in contaminantconcentrations during or following treatment. Although theoretically this approach more closelyrepresents the actual exposure to groundwater contamination (i.e., direct ingestion of groundwatercontaining VOCs) than comparisons of DNAPL mass before and after treatment, there are seriouslimits to relying on dissolved concentration data collected from discrete wells.
Purging Considerations
The purpose of purging is to ensure that water samples collected from a monitoring well arerepresentative of in situ groundwater conditions that exist in the portion of the aquifer beingsampled. Water in the screened portion and filter pack of a conventional well is generally in aconstant state of flux as groundwater passes through the well. However, water in the well boreabove the screened section is relatively isolated and becomes stagnant. Because stagnant water issubject to different physiochemical conditions than the surrounding aquifer, it is important thatspecific purging guidelines and techniques be followed to avoid collecting a sample biased bystagnant water. In addition, when considering changing the purging methods, it is important toevaluate if a change in analytical values results because of changing purging methods by performinga comparison of results from each method.
A nonrepresentative water sample can also result from overpumping the well. Stratification of thecompounds may occur, or denser compounds may sink to the lower portions of the aquifer.

ITRC – Strategies for Monitoring the Performance of DNAPL Source Zone Remedies August 2004
40
Excessive pumping during the purging of a monitoring well can dilute or increase the contaminantconcentrations from what is representative of the sampling point (EPA, 2002c).
There are a number of different devices available to purge and sample a well. The device usedshould not change the geochemistry or physical properties of the sample. It also should not increaseturbidity. Minimizing agitation of the water column helps prevent increases in turbidity,volatilization, and dissolved oxygen in the water. For these reasons, low-flow submersible orpositive-displacement pumps that can control flow rates are recommended for purging and sampling.The low-flow purge-and-sample method results in a more rapid stabilization of turbidity and otherfield-measured parameters (e.g., pH, temperature, dissolved oxygen, oxidation-reduction potential[ORP], specific conductivity, and turbidity) and a more representative sample of conditions in theformation. Purging continues in a well until purge criteria are reached (commonly eitherstabilization of purge parameters or a set number of well volumes). Another advantage to a low-flow purge-and-sample technique is that the amount of purge water removed from the well isminimized, which means less water may need to be containerized, treated, stored, and disposed.
Other considerations during purging are placement of pump intake relative to the depth of water inthe well and the well screen interval. Low-permeability formations that cannot support a pump willrequire alternative means of sampling, such as bailers. As stated above, deciding the appropriatepurging technique must be based on site-specific conditions and objectives. Techniques for purgingare described in greater detail in numerous technical journals and EPA guidance documents, suchas Groundwater Sampling Guidelines for Superfund and RCRA Project Managers (EPA, 2002c).
Monitoring Well Network Design and Installation
Performance monitoring wells should be located up-gradient, within, and down-gradient of thesource reduction zone and aligned parallel to the direction of groundwater flow. These wells areintended to monitor changing groundwater chemistry over time along the groundwater flow path asan estimation of DNAPL source reduction progress. Cross-gradient well locations may also beneeded to define the lateral extent of treatment and provide for greater accuracy in mappinghydraulic gradients.
Selecting the depth at which to set the well intake and the proper length of the screened interval areimportant considerations when designing and constructing a well network. This is a challengingaspect of monitoring well design and placement; one which requires a detailed understanding ofsubsurface conditions (as embodied in the CSM) and an appreciation for the DQOs and specificmonitoring needs of the project. Generally, screen lengths should not exceed 10 ft. Highlyheterogeneous formations may warrant shorter well screens to allow sampling of discrete portionsof the formation that can serve as contaminant migration pathways. Even in fairly simple geologies,the use of shorter well screens may be necessary to detect contaminants concentrated at particulardepths because of its physical/chemical properties or site-specific hydrogeology. A long well screencan permit excessive amounts of uncontaminated formation water to dilute the contaminatedgroundwater entering the well. The use of shorter well screens reduces excessive dilution and, when

ITRC – Strategies for Monitoring the Performance of DNAPL Source Zone Remedies August 2004
41
properly placed (at depths of predicted preferential flow), are more effective in monitoring discreteportions of the aquifer and the impacts of source mass depletion (EPA, 1992).
In the event of a flat groundwater gradient, it should be recognized that dissolved-phase DNAPLconstituents can spread laterally in more than one direction. Greater density of monitoring may beneeded to adequately define impacts and ensure protection of sensitive areas. In fact, it may beprudent to include monitoring immediately after shutdown of source treatment operations as wellas extend post-treatment monitoring after shutdown to account for changing hydrogeologic patterns.
In relatively large DNAPL source areas, it may be difficult to identify an optimal location for wellplacement. An absence of hydraulic isolation may preclude measuring any rebound in the treateddemonstration area and complicates any assessment of the technology because the mass moving intoor out of the treatment area cannot be known. Numerical simulation to locate wells should beconsidered when there is a question about well placement.
Groundwater monitoring wells can be installed using standard drilling methods (e.g., HSA) or,where appropriate, direct-push technologies. Direct-push methods for sampling groundwater arediscussed in greater detail on EPA’s Field Analytics Technologies Web site(http://fate.clu-in.org/direct_push/dpp.asp). Direct-push well technology is also the subject of aguidance document being produced by the ITRC’s Sampling, Characterization, and Monitoring(SCM) Team.
Multilevel Sampling
One way to enhance the conventional use of dissolved concentrations as a performance metric is toincorporate multilevel sampling into a monitoring program. Conventional groundwater monitoringis conducted using dedicated equipment to collect samples that represent an average measure fromeach well. In contrast, multilevel sampling systems are designed to collect depth-discrete samplesover a single vertical profile of the subsurface.
A wide variety of systems and methods have been developed for this purpose, with complexity andexpense of these systems generally increasing with depth. Examples of simple and inexpensivemethods and systems that may be appropriate for monitoring sites with relatively shallowgroundwater include direct-push technologies, closely spaced well clusters, and piezometer nests.Examples of multilevel systems that may be appropriate for assessing more complex sites withdeeper groundwater contamination include the Waterloo Multilevel System™ (www.solinst.com),Continuous Multichannel Tubing™ (www.solinst.com), Westbay MP® (www.westbay.com), andWater FLUTe™ (www.flut.com) systems. In cases where wells are installed in an area where it isknown with certainty that no DNAPL exists, collecting a profile of the groundwater quality withstrategic placement of bailers, submersible pumps, or diffusion samplers if appropriate may providevery useful information about the groundwater quality profile that may help describe DNAPLdistribution elsewhere in the aquifer.

ITRC – Strategies for Monitoring the Performance of DNAPL Source Zone Remedies August 2004
42
It is important to stress that multilevel wells or wells with long screens should not be installed inareas where DNAPLs are expected as these wells can act as conduits for DNAPLs to migrate tolower portions of the aquifer. Although multilevel samplers placed within a single borehole maybe appropriate for dissolved-phase measurements, it should be noted that long well screens can allowdissolved-phase contamination to migrate up or down in the aquifer, depending on the hydraulichead distribution. In order to obtain depth-specific information on DNAPL distribution within anarea undergoing treatment, it may be necessary to construct a multilevel cluster of independent wellsin close proximity.
Data generated by multilevel sampling systems can provide insight into the three-dimensionalgroundwater plume configuration before, during, and after DNAPL remediation. Particularly forheterogeneous formations where layering is suspected, the data can be used to assess the effects ofsource remediation on discrete vertical horizons of the dissolved-phase plume. Multilevel samplingitself is not the same as directly measuring mass flux or plume loading per se (described in Section4.4.3); however, if the monitoring wells are properly distributed cross-gradient along the controlplane (lateral extent), then data generated by a network of multilevel samplers can be used toestimate contaminant mass flux for different depths along the control plane, assuming groundwaterflux is also known.
Use of Passive Diffusion Bag Samplers
Passive diffusion bag (PDB) sampling is an accurate and cost-effective alternative to standard (orlow-flow) purge-and-sample techniques for collecting dissolved VOC data at monitoring wells(ITRC, 2004). The PDB sampler is a low-density polyethylene bag or diffusive-membrane capsulefilled with deionized water that is sealed and mounted in a suspension device and lowered to aspecified depth in a monitoring well to passively collect groundwater samples. PDB samplers relyon the free movement of groundwater from the aquifer or water-bearing zone through the wellscreen.
PDB samplers are relatively inexpensive and reduce or eliminate the amount of purge waterassociated with sampling. The samplers are easy to use and require a minimal amount of fieldequipment. Multiple PDB samplers can be distributed vertically within the screened interval to helplocate the zone of highest concentration in the well. The membrane prevents sediments fromentering the bag, so there is no interference from turbidity.
Limitations to the use of PDBs at DNAPL sites include the following:
• PDB samplers are not currently recommended for use in low-permeability formations.As a general rule, diffusion sampling should not be used in water-bearing zones with ahydraulic conductivity of less than 1 x 10⁻⁶ cm/s.
• PDB samplers integrate concentrations over time, which may be a limitation if the goalof the sampling event is to collect a representative sample at a point in time. This

ITRC – Strategies for Monitoring the Performance of DNAPL Source Zone Remedies August 2004
43
characteristic may be a limitation if VOC concentrations in the aquifer are known tochange over time.
• PDB samplers are useful with only a certain suite of organic compounds.
More information about PDBs can be obtained at the ITRC Diffusion Sampler Information CenterWeb site, which is linked from the ITRC main page (or go to diffusionsampler.itrcweb.org).
Limitations
Potential problems and challenges with using dissolved contaminant concentration as a performancemetric include the high variability, both temporally and spatially, in groundwater concentrationsand the fact that these changes may not be due to in situ treatment. For example, changes indissolved concentrations could be due to rate-limited processes and dilution effects during in situflushing or extraction technologies. These problems and challenges can be overcome, at least inpart, by careful and integrated use of modern sampling and analyses methods, field analyticalmethods, down-hole sensor technologies, and geostatistical modeling methods (Siegrist and Satijn,2002).
The plume’s response to source zone treatment is difficult to assess and may not be immediatelyevident, as discussed in Section 1.5. Contaminant concentrations observed in monitoring wells nearthe source may decrease immediately following treatment, as desired, but may rebound topretreatment levels after some period of equilibration. This effect may be due to the continuedpresence of residual DNAPL in the saturated zone and the slow release and dissolution of thesecontaminants into the dissolved-phase (Sale and McWhorter, 2001). Dissolved concentrations mayalso increase during treatment as the solubility of the DNAPL constituents increases. Dependingon the location of the monitoring network, these trends could indicate that the technology is workingproperly (i.e., contaminants are being dissolved into the groundwater and captured according toplan) or that contamination is spreading beyond the monitored treatment zone. An example of howgroundwater concentrations can be used to assess performance at a in situ thermal remediationproject is presented in Box 4-2.
Monitoring wells located immediately adjacent to the remaining DNAPL may not reflect the overallimpact of the remediation as hydraulic gradients return to near preremediation conditions.Depending on the degree of heterogeneity, groundwater flow rates, and the size of the treated area,it may take years for the groundwater to completely flush all of the regions invaded by the remedialfluids and migrate past the monitoring point. During this time, water samples obtained for post-treatment performance assessment may contain water or other fluids injected as part of the remedialprocess. Lower concentrations of contaminant may be measured than the new quasi–steady statecondition. Because “dilution” can impact groundwater concentrations, the number or fraction ofpore volumes of water added during remedial operations should be taken into account whenevaluating groundwater concentrations. Groundwater concentrations in down-gradient wells couldalso be higher prior to equilibration due to water passing through a more highly contaminated sourcezone or perhaps the presence of residual remedial agents that enhance solubility.

ITRC – Strategies for Monitoring the Performance of DNAPL Source Zone Remedies August 2004
44
Although it is important to monitor groundwater quality inside and outside the source area duringenhanced recovery or treatment operations, it is not recommended that groundwater concentrationdata alone be used to assess performance because of the uncertainties described above.
Box 4-2. Bhow Changes in Groundwater Concentrations Are Used to AssessPerformance of an In Situ Thermal Project at a TCE-contaminated Site in Oregon
The ICN Pharmaceuticals, Inc. (ICN) site is located in Portland, Oregon. In December1992, ICN joined Oregon's Voluntary Cleanup Program to continue an environmentalinvestigation initiated by the City of Portland. The presumed DNAPL zone (primarilyTCE) extends approximately 120 ft to the south of the dry well with a width of about 80 ftand starting at about 20 ft below ground surface (bgs). A former dry well reportedlyextends to a depth of 20 ft bgs. The water table is encountered in the silts atapproximately 8 ft bgs.
The RAOs were to prevent migration of DNAPL and reduce contaminant concentrationsin groundwater to levels that indicate DNAPL has been removed or treated, to the extentpracticable. The selected remedial technology was to heat the subsurface usingelectrical resistance heating (ERH). The system was placed into operation in May 2000and was shut down in December 2001.
Performance monitoring of contaminant concentrations in groundwater within, below,and surrounding the DNAPL zone was conducted during the ERH application. Based ongroundwater monitoring data, concentration reductions up to three to four orders ofmagnitude have been observed in the former DNAPL zone. The highest concentrationsremaining in the groundwater are on the order of 1 ppm total VOCs and represent asmall portion of the originally contaminated area. Analytical results for groundwatersamples collected from many site monitoring locations indicate levels of chlorinatedsolvents are approximately at or below drinking water MCLs. VOC concentrations in therecovered air stream generally reflected expected trends with vinyl chloride andcis-dichloroethene concentrations peaking first, followed by TCE concentrations.
4.2.3 Decrease in Soil Vapor Concentration
Applicability and Use
When the remediation calls for removing volatile DNAPLs from the vadose zone (using SVE), avery common method for assessing the performance is to monitor the vapor-phase concentrationsof contaminants in both in the extracted vapor stream and in the vapors remaining in the subsurface.Assessment of SVE remedial effectiveness involves two phases.
The first phase is during active SVE operation. The concentration of contaminants in the SVEeffluent must be monitored frequently to assess how the remediation is progressing. Theconcentration of contaminants in the soil vapor must also be monitored in the subsurface over thearea of the soil gas plume to ensure that the remediation is addressing the entire plume. At some

ITRC – Strategies for Monitoring the Performance of DNAPL Source Zone Remedies August 2004
45
point during the remediation, the concentration of contaminants in the soil vapor effluent eitherdecreases to nondetectable or reaches an asymptotic point below which concentrations appear notto decrease. Either condition may indicate that the remediation is complete or that it has reacheda point where the remediation is diffusion rate limited.
The second phase is to then turn off the SVE system and monitor the concentrations of contaminantsin the soil vapor over time and over the area of the plume. If the remediation has not removed allof the DNAPL from the subsurface, there is a rebound in soil vapor concentrations. If theremediation has been successful, the soil vapor either remains at concentrations below acceptabledetection levels or remains at or below concentrations set as remediation goals. It is important toremember that rebound may not be immediate depending on the geology, the contaminant, and thesize and distribution of the contaminant.
Limitations
Potential problems and challenges with using vapor concentration data to estimate source treatmentprogress include the high variability, both temporally and spatially, in in situ vapor concentrationsand the fact that concentration changes may not be due to in situ treatment (e.g., changes could bedue to rate-limited processes and dilution effects). These problems can be overcome, at least in part,by employing statistically sound trend analysis and using a converging lines of evidence approach.
4.3 Estimates of Source Mass Reduction
Three types of metrics require estimating mass: mass extracted, mass destroyed, and massremaining.
4.3.1 Mass Extracted
Source zone remediation technologies commonly use “mass removal percentage” or the fraction ofDNAPL extracted as a measure of success. This approach relies on developing a fairly accurateestimate of the contaminant mass present in the ground and establishing a defensible baseline beforetreatment begins.
For a groundwater pumping operation, a simple estimate of mass extracted can be made byintegrating the concentration history. The history is a plot of groundwater concentration versuscumulative groundwater pumped. The area under the curve represents the mass of contaminantremoved. Determining the mass of DNAPL brought to the surface by an SVE is also relativelystraightforward. DNAPL content and the concentrations of site contaminants in extracted water andvapor are typically measured as part of normal operational or monitoring procedures, and thereforemass removed (e.g., pounds of contaminant removed per day) is typically reported.

ITRC – Strategies for Monitoring the Performance of DNAPL Source Zone Remedies August 2004
46
4.3.2 Mass Destroyed In Situ
The amount of mass destroyed in situ through oxidation or biodegradation is much more difficultto estimate and is usually based on concentrations of indicator parameters measured in groundwater.
Increase in Chloride
If chemical oxidation using potassium permanganate (KMnO4) is the chosen remedy for DNAPLsource remediation of chlorinated solvents, contaminant mass reduction can be estimated by usingchloride (Cl-) concentrations in groundwater samples. Chloride concentrations in groundwatershould be collected during all stages of the remediation (before, during, and after). As an example,the chemical reaction between KMnO4 and dissolved-phase TCE is shown as follows:
2KMnO4 + C2HCl3 º 2CO2 + 2MnO2 + 3Cl- + H+ + 2K+
Based on the above stoichiometric equation, the oxidation of 1 pound (lb.) of TCE produces0.81 lbs. of chloride. By measuring the amount of chloride generated from the oxidation process,the amount of TCE destroyed by potassium permanganate can be calculated using the followingformula:
Mass of TCE destroyed (lbs.) = Mass of chloride generated (lbs.) ÷ 0.81
Considerable information on the hydrogeology and geology and DNAPL distribution is necessaryto accurately predict mass using the above calculations. Comparing chloride concentrations beforeand after injections and knowing whether biodegradation is occurring allow for the determinationof whether the chloride is generated by chemical oxidation or other subsurface reactions. Whilechloride concentrations may initially be a sensitive monitoring parameter, interpretation of Cl- datacan become ambiguous after a large amount of Cl- has accumulated because concentration changesmay be due to the movement of fluids with different Cl- levels induced by oxidant injection anddensity gradients (Hunkeler and Parker, 2002).
Ratios of Carbon Isotopes
Isotopes of carbon have been used as an indicator of the oxidation of chlorinated ethenes (Hunkelerand Parker, 2002). Molecules of chlorinated solvents are composed of both light (12C) and heavy(13C) carbon atoms. Because there is a slight difference in the reaction rates of 12C and 13C, achlorinated solvent mixture undergoing oxidation becomes enriched in 13C over time. The 12C/13Cratio can be calculated and monitored to gauge the effectiveness of oxidation process. Thistechnique has been used at a site in Florida as described in Box 4-3. (Also see Case Study 7.)
Also, some have suggested using changes in the isotopic composition of chlorine. The logic issimilar to that using carbon: the Cl isotopic ratio in chlorinated VOCs differs from that in naturalgroundwater.

ITRC – Strategies for Monitoring the Performance of DNAPL Source Zone Remedies August 2004
47
This same technology can be used to monitor the progress of reductive dechlorination of chlorinatedethenes. Molecules with the lighter isotopes (12C) tend to be transformed more quickly, resultingin enrichment of 13C in the residual reactant and of 12C in the initial product. This technology hasbeen used to monitor reductive dechlorination of a TCE residual source area at the Test Area NorthSite (Song, et al., 2002). It should be noted that although this technology can be used to monitorprogress of these processes, it cannot be used by itself to generate estimates of mass of contaminantdestroyed for either chemical oxidation or bioremediation.
Box 4-3. Changes in Stable Carbon Isotope Ratios Used to Demonstrate In SituTCE Destruction at a Site in Broward County, Florida
Concentrations of TCE and chloride (Cl-) were monitored within a distance of 1.5 m ofthe permanganate solution injection points utilizing multilevel sampling methods. Between February and July 2000, the concentration of TCE decreased at some of themonitoring points while it increased at others. Between July and December 2000, itdecreased to relatively low concentrations at all monitoring points. The Cl- concentrationincreased at depths >17 m bgs between February and July 2000, but no further increasewas observed between July 2000 and December 2000 (except at the deepest monitoringpoint) despite a strong decrease in TCE concentrations. These data make it difficult todemonstrate TCE oxidation between July and December 2000 using Cl- concentrations.
Carbon isotope ratios were also measured at two sampling points with the highest initialTCE concentration. While the d13C of TCE remained the same at the upper samplingpoint between February and July 2000, a strong increase in the d13C can be observed atthe lower sampling point, clearly indicating TCE destruction by oxidation withpermanganate. Between July 2000 and December 2000, when a decrease in TCEconcentration was observed without an increase of Cl-, again d13C values provide clearevidence for TCE oxidation. At the upper sampling point, the d13C increased from–27.5% to –4.4%, indicating TCE oxidation; at the lower sampling point, an increasefrom +32.9% to +38.5% could be observed. The Cl- produced by TCE oxidation hadmigrated to greater depths, explaining the elevated Cl- concentration at >20 m. Parker,et al. (2002) conclude that this site has only small dispersed globules of DNAPL causingchloride tracking to be less sensitive for remediation assessment. Twenty-one weeksafter the last permanganate injection, the d13C values of TCE were close to the initiald13C values representative of the TCE source. The reverse trend towards the initial d13Cvalue of TCE can be explained by desorption or dissolution of small amounts of TCE stillpresent in the aquifer.
4.3.3 Mass Remaining
Estimating the mass of DNAPL remaining in the ground after treatment is important if the remedialobjective is based on removing a certain fraction of the mass; however, it is a difficult undertaking.

ITRC – Strategies for Monitoring the Performance of DNAPL Source Zone Remedies August 2004
48
Estimating Mass Remaining
Soil cores. Soil samples can be collected and analyzed for the DNAPL components to quantify thecontaminant mass present before and after treatment. As discussed in Section 4.2.1, there are anumber of different techniques to collect soil samples for chemical analysis from the DNAPL sourcearea; each technique has its benefits and limitations. Contaminant mass remaining within a sourcezone is typically calculated from soil core data by multiplying the contaminant concentration in asoil sample by the density of the soil and the source zone volume (Siegrist and Satijn, 2002).Contaminant mass reduction is then estimated by comparing the estimated mass present before andafter treatment. The mass calculation requires that the volume and density of the media be knownand that these properties are homogeneous throughout the source zone.
Tracer tests. A partitioning interwell tracer test (PITT) can be used to better evaluate the volumeand spatial distribution of DNAPL within the subsurface. Several studies have concluded that a soilcoring program alone is unlikely to provide reliable estimates of the volume of DNAPL at the field-scale (Mayer and Miller, 1992; Bedient, et al., 1999). PITTs can be used as remediationperformance assessment tools to determined system effectiveness by measuring the mass of DNAPLremaining in the subsurface (Meinardus, et al., 2002).
Field implementation of a PITT consists of the injection of a suite of conservative andnonconservative tracers into one or more wells and the subsequent recovery of the tracers from oneor more nearby extraction wells. PITTs conducted in the saturated zone use groundwater as thecarrier fluid, while air is used as the carrier for PITTs conducted in the vadose zone. Thenonpartitioning (conservative) tracers pass unhindered through the DNAPL zone, while transportof the partitioning tracers is retarded by interaction with the DNAPL. After the tracer slug isinjected, potable water is injected to drive the tracers across the zone of interest. The tracerresponses at monitoring and extraction wells are used to estimate the average DNAPL saturation,the swept pore volume, and the total volume of DNAPL in the subsurface. The experimental andtheoretical basis for the use of partitioning tracers is presented in detail in Jin (1995), Jin, et al.(1995), and Dwarakanath (1997). The execution of a PITT requires the completion of a series oftasks, including tracer selection, design simulations, implementation, and analyses.
Groundwater data. Estimates of contaminant mass remaining may also be derived by collectinggroundwater data subsequent to a source treatment operation. This method is much more prone toerror and uncertainty than other methods. Ideally, chemical analytical data collected from anadequate number of monitoring wells across the site on several separate occasions is available.Along with site-specific hydraulic conductivity and groundwater flow data, a numerical model isthen used to duplicate the monitoring well data by assuming a location and mass of DNAPL. Otherobservations may be used to help locate the DNAPL zone, such as soil analytical data. If such dataare not available, contaminant mass estimates from groundwater data would be rough guesses atbest.

ITRC – Strategies for Monitoring the Performance of DNAPL Source Zone Remedies August 2004
49
Limitations
All methods of DNAPL mass estimation have associated uncertainties, so mass reduction should beregarded as only one of several measures of performance and perhaps not even the most important.It is very difficult to estimate the mass of DNAPL in the subsurface due to the mechanics of DNAPLflow in the vadose and saturated zones. (Some claim that it is essentially impossible to find all ofthe DNAPL in the subsurface).
A number of issues need to be considered when verifying contaminant mass remaining. The dataset needs to be of an adequate size to properly characterize site conditions, such as soil heterogeneityand extent of DNAPL contamination. Other problems when trying to quantify in situ mass (Siegristand Satijn, 2002) can include (1) the complex distribution of DNAPL in both the horizontal andvertical dimensions, (2) the potential for errors in measurement data in certain media (e.g., VOCsin soil), (3) the potential for inaccurate interpolation when estimating levels where measurement dataare not available, and (4) the possibility that subsurface conditions can change after in situremediation has been applied and that contaminant mass may not have actually been destroyed, onlymobilized away from area of treatment.
Soil concentration data. Potential problems and challenges with quantifying contaminant massremaining using soil concentration data include all of difficulties discussed in Section 4.2 whenattempting to quantify average contaminant concentrations. Removing 90% or 95% of the mass fromthe ground sounds good and would probably be declared a success, but the level of confidence withwhich statements like these can be made when based upon inaccurate initial estimates of mass isquestionable.
Tracer tests. Because PITT is a relatively new and innovative technology, it is useful to be awareof its limitations and some of the consequences associated with improper tracer test design and/orimplementation. Differences in media permeability can have a dramatic effect on the sweepefficiency of the tracers. Typically a “slug” of tracer, about half the swept pore volume, is used inPITTs. Because the tracer moves preferentially through the most permeable zones, much less thanone pore volume goes through the low-permeabilty regions. The flow rate of the tracer movingthrough the low-permeability zones may be 10 or even 100 times lower than through the morepermeable layers. Thus, the DNAPL mass located in the lower-permeability zones is often notdetected using the PITT due to low sweep efficiency. Nelson, et al. (1999), for example, showedin an intermediate-scale flow cell that the presence of porous media heterogeneities and variableDNAPL distribution greatly reduced the accuracy of PITT in predicting DNAPL saturation. Methods to improve sweep efficiency exist for these cases, such as using viscosifiers and foam. Aviscosifier has the effect of distributing the injected tracer better across heterogeneous layers,improving the sweep efficiency. Foam can also help by blocking off high-permeability zones,forcing injected tracer into lower-permeability zones.
Groundwater concentration data. Determining the DNAPL mass remaining following treatmentbased on groundwater concentration data is a difficult calculation to make, requiring the use ofnumerical modeling tools and professional judgment. Also, contaminant concentrations found in

ITRC – Strategies for Monitoring the Performance of DNAPL Source Zone Remedies August 2004
50
the immediate vicinity of the DNAPL zone are commonly one to two orders of magnitude belowtheir aqueous solubilities because the NAPL dissolution phenomena that control these aqueousconcentrations depend on a number of system parameters including the following (Meinardus, et al.,2002):
• aqueous-phase velocity,• NAPL saturation,• NAPL composition,• heterogeneity,• length scale, and,• aspect ratio (between the monitoring well and the NAPL zone).
Consequently, the use of groundwater contaminant concentrations to draw conclusions about thevolume, mass, or saturation of the NAPL zone involves an ill-posed inverse problem, for which nounique solution exists even for the simplest of cases.
4.4 Estimates of Source Treatment Impact
4.4.1 Decrease in DNAPL Toxicity
For some multicomponent DNAPLs, mass reduction may not be the relevant objective; the removalof certain target components from the DNAPL mixture to reduce the overall toxicity may be moreappropriate. For example, thermal or flushing technologies can generally lead to selective removalof the more soluble or more volatile components, which may be more toxic, leaving behind the lesstoxic components as residuals.
Performance goals for evaluating the effectiveness of treatments designed to decrease theconcentration of the toxic components in a DNAPL mixture can be set to some target concentrationlevel within the DNAPL zone for those toxic components. By targeting the removal of the moretoxic components from a complex DNAPL mixture, the remaining less toxic components may meetthe risk-based objectives even when the concentration of those remaining components is high.Because toxicity is difficult to measure directly, concentration levels of certain target constituentsthat exhibit toxic effects are monitored.
In addition to the problems and challenges associated with quantifying concentrations or mass in thesubsurface, there can be questions about verifying long-term stability of the observed toxicityreduction effect. This task requires long-term testing or sufficient fundamental understanding topredict long-term effects with certainty (Siegrist and Satijn, 2002).
4.4.2 Decrease in DNAPL Mobility
Mitigating the further spread of the source by decreasing DNAPL mobility is another often-citedobjective of DNAPL source remediation. The goal in such a case is to deplete the sourcesufficiently to reduce DNAPL to a point of relative stability. In theory, that point occurs once

ITRC – Strategies for Monitoring the Performance of DNAPL Source Zone Remedies August 2004
51
residual saturation is reached (see Section 2.1.2). However, it should be noted that reaching residualsaturation does not always equate to reaching a point of immobility. Immobilized DNAPL is heldin place by a balance of dynamic forces which can be upset easily by minor changes in groundwaterflow, tidal effects, earth pressure, and ground vibration, for example. A change in mobility isultimately a matter of observing a change in the rate of DNAPL movement.
Measuring NAPL Saturation
Saturation is a description of the volume of DNAPL in the subsurface, and as such, is a more directmeasure for assessing DNAPL source removal effectiveness than either soil or groundwaterconcentration. Because source removal operations inherently decrease saturation (by removingmass), this parameter can be an important one for assessing the effectiveness of such remedialactions. Although comparing NAPL saturations before and after treatment provides usefulinformation, it should be noted that determining saturation is subject to many of the same limitationsas measuring soil concentrations.
When designing an approach to measure NAPL saturation, it is important to consider factors thatcan influence NAPL saturation measurements such as the measurement technique used by thelaboratory and biases introduced during sample collection. When collecting samples from locationswith mobile NAPL, it may be very difficult to obtain a representative sample for NAPL saturationbecause very often NAPL drains from the sampler as the core is brought to the surface, yielding lowestimates of NAPL saturation from the sample actually sent to the lab.
Laboratory Analysis of Soil Samples
Laboratory analyses of soil samples collected from the DNAPL source zone yield a measurementof the total concentration of each constituent in all phases—adsorbed, dissolved, vapor, and NAPL—detected in the soil sample. These results can then be used to calculate NAPL saturation in thesubsurface. Feenstra, et al. (1991) provide the methodology for performing this calculation basedon equilibrium partitioning theory. Mariner, et al. (1997) extended the calculation tomulticomponent NAPL and developed a computer code for making the computations called“NAPLANAL.” NAPLANAL distributes the measured total VOC concentrations in a sampleamong the various fluid and solid phases present. If the calculations indicate that aqueous VOCconcentrations exceed solubility constraints, the NAPLANAL algorithm determines that DNAPLis present in the sample and automatically includes DNAPL as one of the partitioning phases.
For the VOC data acquired from the laboratory to be entered into NAPLANAL, the VOCconcentration in the solvent extract must be converted to a concentration per soil mass (mg/kg). Thisstep is accomplished using the jar, methanol, and soil weights recorded in the field and using thedensity of the soil and the solvent. A value for foc, soil bulk density, and the porosity of the soil mustalso be entered. Other input parameters are obtained from a database of physical and chemicalconstants, which is incorporated in NAPLANAL.

ITRC – Strategies for Monitoring the Performance of DNAPL Source Zone Remedies August 2004
52
The NAPLANAL output includes calculations of the concentrations of VOCs in each phase and thesample NAPL saturation (volume of DNAPL per volume of pore space). If no DNAPL is present,a dilution factor is calculated to provide a measure of how much more concentrated the VOCs mustbe before a DNAPL would be predicted to exist in the sample (Jackson and Mariner, 1995).
Tracer Tests
Tracer tests such as PITT can also be used to estimate NAPL saturation. The application andlimitations of PITTs was described in Section 4.3.3.
4.4.3 Decrease in Source Mass Flux
In many cases, the most important characteristic of the source zone from a risk perspective is themass it is contributing to the much larger dissolved phase plume. This “source strength” (or plumeload) can be defined as the mass discharge rate at steady state from a DNAPL source to thesurrounding groundwater. The total mass discharge (mass per unit time) can be obtained byintegrating localized mass flux across the entire source zone. Mass flux is defined here as the “rateper unit area at which solute mass in the groundwater crosses a spatial plane oriented at a right angleto the direction of groundwater flow” (Rao, et al., 2003). Figure 4-2 illustrates the complexity ofmass flux in a heterogeneous subsurface and the value of mass flux and mass discharge as metricsin source remediation.
Source strength is only partly a function of the total mass present and can be strongly affected bythe distribution of DNAPL in the subsurface as well as the hydrodynamic structure. Decreases insource mass may not produce correspondingly large decreases in source strength. Measuring thesource strength directly can therefore provide more accurate information on the risk reduction dueto source depletion and the ability of natural processes to contain the remaining mass.
Applicability and Use
The goals of removing mass from a source zone include reducing the risks of contaminant migration(via either the dissolved or vapor phase), reducing plume longevity, reducing overall remediationcosts, accelerating the natural attenuation of any remaining mass, and speeding the transition to morepassive technologies. Mass flux or discharge can be a meaningful metric in assessing progresstowards these goals, if properly measured and calculated. Using source strength as a measure ofsuccess, shutdown of the remedial system could be considered when the mass release rate from thesource to the groundwater (mass discharge) falls below the assimilative capacity or “naturalattenuation capacity” of the aquifer. Natural attenuation capacity can be defined for groundwatersystems as a measure of its ability to lower contaminant concentrations along aquifer flowpaths.The natural attenuation capacity of groundwater systems depends upon hydrologic (dispersion andadvection) and biological (biodegradation rates) factors and can be assessed using quantitativemodels (USGS, 2003).

ITRC – Strategies for Monitoring the Performance of DNAPL Source Zone Remedies August 2004
53
Figure 4-2. Concept of Mass Flux/Discharge and Source Strength
Measuring Mass Flux and Mass Discharge
Mass flux can be measured along one or more planes oriented perpendicular to the flow direction.Measurements near the source zone will provide an estimate of source strength. Most of themethods discussed below also allow mass flux measurements down-gradient, providing valuabledata on the rates of attenuation and plume response to source treatment.
There are four methods available to estimate mass flux or mass discharge:
• measure contaminant concentrations in samples recovered during continuousgroundwater extraction,
• measure contaminant concentrations and groundwater velocity during short-term pumptests (“integrated pump tests”),
• measure contaminant concentrations at multiple locations across a transect of multilevelsamplers, and,
• measure contaminant concentrations and groundwater velocities at multiple locations anddepths using passive borehole flux meters.
Each of these methods is described briefly in the following sections.
Mod
ified
from
Woo
d, e
t al.
2004

ITRC – Strategies for Monitoring the Performance of DNAPL Source Zone Remedies August 2004
54
Continuous pumping from an extraction well. Perhaps the most direct method to estimate sourcestrength involves capturing the entire plume using one or more extraction wells pumping at acontinuous rate. By analyzing steady-state concentrations and flows, the plume load can becalculated directly. This approach can be cost-effective where there is an existing hydrauliccontainment system in place. The robustness of this technique also assumes that the entire plumeis “captured” by the extraction well or wells. Where there is an existing plume containment system,the current contribution of the source to the existing pump and treat system can be valuableinformation for assessing the benefits and costs of treating sources. Extrapolating the results tounstressed source zones may be difficult, however.
Integrated pump tests. A technique known as the Tübingen integrated pump test is another methodof estimating contaminant mass flux based on short-term, active pumping of wells located in atransect across the contaminant plume. This technique, developed by researchers at the Universityof Tübingen, Germany (Teutsch, et al., 2001; Bockelmann, et al., 2001), relies on capturing all ofthe contaminated groundwater flowing within the plume. An advantage of this method is that it doesnot require interpolation of contaminant concentrations between monitoring points as is the casewith transects of multilevel monitoring wells (described below). One or several extraction wells canbe used for this purpose, the number depending on the known or presumed hydrogeologic propertiesof the media and distribution of contaminants. The wells are pumped until the entire mass dischargeat the transect location is known or assumed to be extracted, at which point the contaminantconcentrations are measured in the effluent from the wells. In this case, contaminant mass discharge(Md) is calculated as follows:
∑=
=n
iiid CQM
1
where
Md = contaminant mass discharge (mass/time),Qi = extraction rate from well I (volume/time),Ci = contaminant concentration measured in effluent from well I (mass/volume).
For this basic method to work, one must achieve steady-state capture of the contaminant massdischarge, a goal that may be difficult to achieve in heterogeneous media and/or where plumes arisefrom spatially complex sources. Also, the operation of the extraction wells necessarily alters theplume itself, with potential unanticipated or undesirable impacts. Furthermore, steady-state captureof a contaminant plume can generate a very large amount of contaminated water, which wouldsubsequently need to be treated or disposed of. For these and other reasons, Schwarz, et al. (1998)have explored the application of this approach to estimating mass discharge via shorter durationnon-steady-state extraction tests. However, such tests also would be confounded by heterogeneitiesin flow field and source characteristics.

ITRC – Strategies for Monitoring the Performance of DNAPL Source Zone Remedies August 2004
55
Multilevel sampling along transect of wells. The most common approach to measuring mass flux,at least until recently, has been the use of multilevel samplers. Multilevel sampling was discussedpreviously in Section 4.2.2. By collecting groundwater from numerous, closely spaced samplingpoints along a transect of wells intersecting the plume and aligned perpendicular to the groundwaterflow direction, a geostatistical average concentration can be calculated. The development ofdirect-push multilevel sampling tools has allowed such high-density sampling at many sites. Thisapproach can be useful, although the in situ heterogeneity may be so great that the resultingestimates are highly uncertain. Large numbers of analyses can be required, and it can be difficultor very expensive to obtain sufficient numbers of samples in some subsurface environments.
Passive borehole flux meter. The passive borehole flux meter, a new technology for direct in situmeasurement of both cumulative subsurface and contaminant fluxes, is currently being validatedthrough demonstrations at several contamination sites. It is a self-contained permeable unit that isinserted into a well or boring so that it intercepts groundwater flow but does not retain it. Theinterior composition of the meter is a matrix of hydrophobic and hydrophilic permeable sorbents thatretain dissolved organic and inorganic contaminants present in fluid intercepted by the unit. Thesorbent matrix is also impregnated with known amounts of one or more fluid-soluble “residenttracers.” These tracers are leached from the sorbent at rates proportional to the fluid flux.
Following exposure to groundwater flow for a period ranging from days to months, the meter isremoved and sorbent carefully extracted to quantify the mass of all contaminants intercepted andthe residual masses of all resident tracers. The contaminants’ masses are used to calculatetime-averaged contaminant mass fluxes, while residual resident tracers masses are used to calculatecumulative fluid flux (Environmental Security Technology Certification Program [ESTCP], 2003).
Box 4-4 describes a mass flux study conducted at Hill AFB, showing results from both borehole fluxmeters and integral pump tests conducted before and after remediation of a source zone. Boreholeflux meters are also being used in demonstrations at the Fort Lewis Logistics Center to measure theimpacts of both biological and thermal in situ treatments.
As a tool for long-term monitoring, a fence row of flux meters installed immediately down-gradientfrom a groundwater contaminant source can be used to characterize source strength. The spatialdistribution of measured fluxes, when integrated over the fencerow, produces estimates ofcontaminant mass loadings to groundwater. Because water and contaminant flux measurementsreflect cumulative values, reliable time-averaged fluxes can be calculated. Thus, it is possible tocalculate monthly and annual contaminant mass loadings to an aquifer.
Limitations
All of these methods have limitations, and these are generally noted in the descriptions. This sectiondiscusses some of the more general limitations of mass flux measurement.

ITRC – Strategies for Monitoring the Performance of DNAPL Source Zone Remedies August 2004
56
Sou
rce:
Hat
field
, et a
l., 2
003
Box 4-4. Mass Flux Measurements at Hill Air Force Base, Utah
Both the borehole flux meter and integrated pump test methods were used at Hill AFBbefore and after source depletion (using surfactant flushing). For the flux meter tests,specially treated carbon-filled socks were deployed in monitoring wells. The sockscontained granular activated carbon preequilibrated with four alcohol tracers. Thesetracers leach from the socks as groundwater flows through the devices, allowingcalculation of the cumulative or time-averaged groundwater velocity by measurement ofthe tracer desorption. At the same time, the mass of TCE and other solvents that sorbedto the activated carbon was measured. From the measured mass of TCE and othersolvents sorbed, the cumulative or time-averaged contaminant mass flux wasdetermined. By suspending these flux meters at several depths in each monitoring well,the total water and contaminant mass flux could be estimated.
The integrated pump test was also used before and after treatment, using differentpumping durations (Enfield, et al., in preparation). Preliminary mass flux estimates fromthe minimum and maximum pumping durations are shown below, along with theestimates from the flux meter testing. All of the results indicate considerable reductionsin mass flux after treatment, and the comparisons suggest that the results from the twomethods were at least similar.
Subsurface heterogeneity. Measuring mass flux is inherently difficult because of the heterogeneitythat occurs in the subsurface, especially near a DNAPL source. DNAPL distribution is often patchy,and its presence is difficult to predict or detect. The flux from a source can be visualized as anetwork of stream tubes, with water in some stream tubes moving much more quickly than insmaller or more tortuous ones. Similarly, contaminant concentrations can vary greatly betweenstream tubes, depending on its interactions with DNAPL accumulations and distance away fromDNAPL sources.
As a result, the vast majority of the contaminant flux can be in a very small proportion of thevolume, and the flux can vary tremendously between sampling locations. A very dense network of

ITRC – Strategies for Monitoring the Performance of DNAPL Source Zone Remedies August 2004
57
monitoring points is therefore required to ensure that most high-flux areas are sampled and that theresults are representative of the actual distribution of flow velocities and concentrations. Theuncertainty can be high, and it is recommended that the uncertainty be explicitly estimated whenreporting flux estimates to aid in interpretation and decision making. Statistical analyses of theresults from multilevel well or passive flux meter investigations should also be performed andreported because of the importance of the inherent variability.
The two active mass flux measurement techniques, continuous extraction and integrated pump testmethods, attempt to overcome this limitation by capturing all of the water and analyzing the resultsover time to estimate steady-state flux. Careful analysis is required to compare these results to thoseobtained by other mass flux methods or to results at other times or locations. The results are alsoobtained under stressed conditions which then have to be extrapolated to flux under the existingconditions. These techniques may also be cost-prohibitive for sites without an existing infrastructureto pump and treat the extracted groundwater.
Emerging technologies. These approaches to mass flux estimation, particularly the passive fluxmeters and integrated pump tests, are relatively new. Development and testing are ongoing, andthere is little experience to use as guidance at this point.
Regulatory uncertainty. Mass flux can be a difficult metric to use from a regulatory perspective.Mass flux can be a regulatory goal in some cases, such as flux to surface waters. However,groundwater criteria are usually based on point concentrations, and they may be difficult to modifyfor a specific site. The most common approach is probably to set flux criteria at a responseboundary located near the source based on the capacity of the aquifer to naturally attenuate theremaining mass before the groundwater reaches a down-gradient compliance point.
5.0 TECHNOLOGY-SPECIFIC MONITORING CONSIDERATIONS
Ideally, the remedial effectiveness of all DNAPL source zone depletion technologies underconsideration should be evaluated consistently using the same metrics. However, methods formonitoring remedial progress and system efficiency must address technology-specificconsiderations. For instance, heat-based technologies like steam injection provide unique challengeswhen evaluating progress, from collecting and handling hot soil and groundwater samples toselecting well construction materials that enable groundwater monitoring. Monitoring programsdesigned for technologies that enhance the mobility of DNAPLs, such as surfactant flushing, mustaccount for potential mobilization of DNAPL due to decreased surface tension and loweredviscosity.
ITRC reviewed emerging and innovative technologies for DNAPL remediation in a previouspublication (ITRC, 2000) and identified the lack of performance data as a barrier to using thesetechnologies in a subsequent document (ITRC, 2002). The information in this section is intendedas “suggested monitoring requirements” for planning purposes—actual monitoring varies dependingon site-specific conditions and the technology being deployed.

ITRC – Strategies for Monitoring the Performance of DNAPL Source Zone Remedies August 2004
58
5.1 Remedial Effectiveness and System Efficiency Monitoring
As mentioned previously, there are two types of performance monitoring: remedial effectivenessmonitoring and system efficiency monitoring. By collecting performance data in accordance witha well-thought-out, systematic plan, decisions concerning continued operation or shutdown of aremedial system can be made. Planning for performance assessment and uses of performance datawere discussed in Section 1.4.
“Remedial effectiveness” refers to the ability of the system to achieve remediation goals at a givensite. As stated in Section 1.3, we consider effectiveness to be the degree to which a technologyapplication achieves risk reduction goals or response objectives by reducing contaminant mass,concentration, mobility, and/or toxicity while preventing the uncontrolled mobilization or furtherspread of contaminants. Effectiveness monitoring is typically done after a remedial action has beencompleted and the project team wishes to verify that the response objectives have been met bycomparing post-treatment conditions to baseline conditions. If continued operation is warranted,effectiveness monitoring may be repeated once it appears that the objectives have been met or adecision to cease active remediation is made.
“System efficiency” monitoring is intended to optimize treatment efficiency by maintaining specificdesign conditions within the remediation system. These conditions could include appropriate rangesof temperature, pressure, flow rate, pH, dissolved oxygen (DO), ORP, or TOC. This processinvolves monitoring the reaction zone, including any injection wells, treatment zone monitoringwells, and other subsurface probes. Sample protocols should be specific to the source reductiontechnology with special attention given to conditions favoring VOC losses (e.g., thermal treatment).
The frequency of efficiency monitoring should be a function of system operation. More frequentmonitoring is required earlier in the process; less frequent efficiency monitoring is typically requiredas the system stabilizes at close-to-optimum conditions. Efficiency monitoring frequency may beas often as weekly to biweekly during the first few months of testing, diminishing to monthly orquarterly for the remainder of the system operation. It is also desirable to schedule monitoring tooccur between active source reduction events (e.g., injections) so that the results of fieldmeasurements can be used to refine injection or extraction parameters during subsequent events.This reduction of system efficiency monitoring over time should go hand in hand with a shift ofresources toward remedial effectiveness monitoring tasks such as soil confirmation sampling,groundwater sampling, or groundwater flux measurements.
5.2 Conventional Source Zone Remedies
Although conventional source zone technologies are not innovative, we include them here to allowa comparison of performance monitoring strategies.

ITRC – Strategies for Monitoring the Performance of DNAPL Source Zone Remedies August 2004
59
5.2.1 DNAPL Recovery
Direct removal of DNAPL from the subsurface via pumping can be an effective means of massremoval and may be the simplest to implement, assuming that a mobile mass or pool of DNAPL hasbeen intercepted by a well. Consequently, such actions are typically initiated soon after the problemis discovered without extensive analysis or development of performance criteria. Pumping orbailing is often continued until the efficiency of DNAPL recovery decreases over time or until amore aggressive technological approach is designed and implemented. Efficiency is therefore afunction of the rate of DNAPL mass or volume recovered.
The effectiveness of direct removal is more difficult to assess and depends on the remedial goal forthe project. Effectiveness can be measured by reductions in residual NAPL saturations or mobility,not just the mass of NAPL removed. In terms of reducing mobility, it is certainly beneficial toreduce the head or driving pressure atop a DNAPL pool to minimize the potential for furthermigration, but the effect that removing small quantities of DNAPL from a single well has on down-gradient groundwater or vapor quality remains uncertain.
It should be noted that aggressive pumping from individual wells is apt to cut off flow paths ofDNAPL and reduce the ability to recover additional DNAPL. With hydraulic recovery, it is veryimportant to enhance the DNAPL flow paths to the point of extraction and not just remove theexisting DNAPL from the well as it returns to the well.
5.2.2 Soil Vapor Extraction
If the DNAPL is volatile and located in the vadose zone or in the capillary zone, SVE is often aneffective remedial technology provided that the air permeability of the zone is sufficient to allowadvective air flow. In this technique, vapor extraction wells are drilled near the DNAPL sourceareas in the vadose zone. Soil vapor is then extracted from the subsurface by applying a vacuum tothe extraction wells. As the air advection through the unsaturated porous media travels towards theextraction wells, the DNAPL constituents volatilize. The volatilized DNAPL constituents migratethrough the air-filled pores in the unsaturated zone by diffusion into the advective air flow andsubsequently into the extraction wells, and are then removed from the subsurface. The extractedvapors are generally treated to remove the volatilized DNAPL constituents from the gas stream priorto discharge to the atmosphere.
SVE is a viable remedial technology option and is simpler and lower in cost than many otherremedial options for DNAPL in vadose zone soils. Because SVE is dependant on volatilization fromthe DNAPL and aqueous phases, it is applicable only to compounds with sufficient vapor pressureand Henry’s constants. One potential problem associated with SVE is with soils havingheterogeneous distributions of air permeabilities. Because air flow in the vadose zone flowpreferentially through soils with the greatest air permeabilities, those zones with lower airpermeabilities have limited treatment effectiveness. As gas-phase diffusion is the controllingmechanism for the removal of volatilized DNAPL constituents from lower-air-permeability zones,particularly in layered heterogeneous systems, these zones may take significantly longer to be

ITRC – Strategies for Monitoring the Performance of DNAPL Source Zone Remedies August 2004
60
treated by SVE. Once the more-volatile DNAPL constituents have been removed by SVE,adsorbed-phase compounds may take considerably longer to be removed from soils. Both diffusionand mass transfer processes are usually responsible for the asymptotic mass removal rates observedin many SVE systems.
Methods for assessing SVE performance in the vadose zone are presented in EPA guidance (EPA,2001a) and guidance produced by the U.S. Army Corps of Engineers (USACE, 2002).
5.2.3 Air Sparging
Air sparging involves the injection of air into the saturated zone below the water table. Thetreatment mechanisms primarily include stripping of volatile organics and creation of oxygenatedconditions favorable to aerobic biodegradation. In the case of chlorinated solvents, which are notreadily aerobically biodegradable without a cometabolic substrate, the primary treatment mechanismis volatile stripping. However, air sparging can also be used to deliver alternative gas mixtures foreither chemical or biological treatment. Depending on the treatment mechanisms desired, thesegases can include a cometabolic substrate (such as propane), an oxidant (such as ozone), or areductant (such as hydrogen sulfide).
Where volatile stripping is the primary air sparging treatment mechanism, SVE is typically used toremove the organic vapors from the subsurface. In cases where biodegradation or other treatmentmechanisms are primary, SVE is often not included. In this case, the air sparging flow rates mustby minimized to prevent excessive generation of organic vapors in soil gas or nearby receptors.
Air sparging creates a zone of partial gas saturation within the groundwater zone. This region ofpartial gas saturation involves various capillary-hydraulic multiphase flow mechanisms, includingwater displacement by air, variable fluid permeability functions with respect to fluid saturation, andcapillary forces which effect both of these mechanisms. The overall effect of subsurfaceheterogeneity is that the injected air develops fingered flow patterns, at both the pore andstratigraphic scales. The development of fingered preferential air flow paths has a limiting effecton air sparging because some regions of the subsurface may not be effectively contacted by theinjected air. This condition can result in uneven treatment of DNAPL source zones. Despite thislimitation, air sparging has been found to be effective for treatment of volatile DNAPL source zonesat many sites.
The successful application of air sparging for DNAPL sources zones is dependent on meetingseveral fundamental criteria. The air sparging well spacing and vertical intervals must be properlydesigned to ensure adequate overlap of the zone of influence for each well. Research has found thatair sparging in coarse-grained materials leads to the smallest radius of influence because the air canreadily move upward under buoyancy, while air sparging in uniform fine sands or silty fine sandscreates the largest lateral radius of influence because the upward buoyant force on air flow is lessdominant. In general, mild stratigraphic heterogeneity can increase the lateral radius of influenceby further minimizing the dominance of upward air flow. However, substantial heterogeneity leadsto the development of preferential air flow paths, which limit the treatment effectiveness.

ITRC – Strategies for Monitoring the Performance of DNAPL Source Zone Remedies August 2004
61
5.3 Thermally Enhanced Remediation
Three major types of thermally enhanced remediation technologies are currently available fortreatment of DNAPL sources. They differ in terms of the process used to deliver thermal energy tothe subsurface. The three delivery mechanisms are direct heating by injection of steam or hot air,heating resulting from the natural resistance of the geologic medium to passage of an electricalcurrent, and heating by conduction from electrically powered thermal wells or thermal blankets.
In situ thermal technologies can accelerate DNAPL remediation by several mechanisms. In general,for DNAPLs such as TCE or PCE located below the water table, as heating progresses, atemperature is reached at which the VOC begins to boil. Boiling occurs when the sum of the vaporpressures of VOC and water exceed the ambient pressure. The boiling points of most commonVOCs are either below or just slightly above the boiling point of water (100°C at sea level pressureconditions). Deeper within the saturated zone, where the ambient pressure is greater than 1 atm, therespective boiling points of TCE-water and water are increased. However, the boiling point of aVOC DNAPL that is immersed or dissolved in water is depressed. As described by Dalton’s lawof partial pressure, a low-solubility VOC in contact with water boils when the vapor pressure of theVOC plus the vapor pressure of water is equal to the ambient pressure. Using TCE as an example,the boiling point of the pure phase at 1 atm pressure is 87°C. Below the water table, however, thetemperature of first boiling is about 73°C. The vapor formed is about 65% TCE and 35% water byvolume. Boiling continues at this temperature until all residual TCE DNAPL is vaporized; thetemperature continues to rise until the boiling point of water (100°C) is reached. Continued boilingof groundwater is desirable because it creates an environment where steam stripping occurs andprovides sustained treatment of contaminated groundwater. Table 5-1 lists the boiling points andco-boiling points of three common chlorinated solvent DNAPLs.
Table 5-1. Co-Boiling Points of Common Solvents
Contaminant Boiling Point (°C) Co-Boiling Point (°C)
PCE 121 88
TCE 87 74
Chlorobenzene 132 92
1. Davis, E., personal communication, 2004.
Davis (1997) describes these and other mechanisms in great detail. In collaboration with EPA andITRC, the U.S. Army Corps of Engineers (USACE) is in the process of publishing a deploymentguide on in situ thermal remediation (ISTR) which covers aspects of overseeing the design andoperation of a thermal remediation project from a regulatory oversight perspective and covers thetopic in much greater detail than can be presented here (USACE, in preparation).

ITRC – Strategies for Monitoring the Performance of DNAPL Source Zone Remedies August 2004
62
5.3.1 Steam-Enhanced Extraction
Thermal remediation by steam injection is deployed under a variety of names such as steam-enhanced extraction (SEE), dynamic underground stripping (DUS), steam-enhanced recoveryprocess, steam injection and vacuum extraction, and others (USACE, in preparation). Common toall of these processes, steam (generated in a boiler at the surface) is injected into the subsurface,migrates through permeable media within the vadose or saturated zone and directly heats thegeologic media and groundwater sufficiently to vaporize or mobilize DNAPL contaminants. Anetwork of extraction wells is used to remove vapors, mobilized NAPL, and contaminatedgroundwater for treatment at the surface.
There are many variations in the ways this type of thermal treatment is implemented depending onsite-specific conditions and, to some extent, preferences of the vendor. For example, site-specificgeology and contaminant distribution are major considerations in determining the location andcompletion details of steam injection and extraction wells. In addition, some vendors advocate theco-injection of air or oxygen with steam to enhance oxidative breakdown of contaminants or toprovide a noncondensible gaseous phase engineered to prevent formation of a DNAPL condensationfront that might lead to uncontrolled downward migration. Some processes include cycling theinjection of steam with a period of extraction to enhance recovery of DNAPL from lower-permeability zones. One process, DUS, includes the combination of ERH (see the followingdiscussion) to low-permeability units with steam injection in the more permeable zones to providemore complete cleanup.
5.3.2 Electrical Resistance Heating
DNAPL source remediation by ERH usually is deployed as either a six-phase or three-phase heatingprocess depending on the size of the treated area and the purpose of the deployment. In either case,normal three-phase electricity is split into either three or six separate phases and directed to an arrayof electrodes. A summary of these two types of ERH can be found in a white paper available on oneof the vendor’s Web sites (TRS, 2003). One of the primary advantages of ERH is that relativelyuniform heating of the subsurface can be achieved irrespective of the lithologies encountered.Therefore, fine-grain units are able to be heated directly to facilitate volatilization and transport ofVOCs to more permeable units to enhance recovery (USACE, in preparation).
ERH can be employed in both the vadose and saturated zones. Typically, vapor recovery wells areinstalled throughout the depth interval that is treated. However, the high buoyancy of steam causesit to rise to the top of the water table very rapidly. Thus, in practice, most vapor recovery occurs inthe vadose zone. Vapors generated by heating are recovered by these wells and directed to an exsitu treatment system.
Vapors formed by heating within the saturated zone rise buoyantly and, under ideal conditions,migrate into the vadose zone where they are captured by the vapor recovery system. However, thereare several examples of field deployments of ERH where adequate thermal monitoring wasperformed to show that the heating process resulted in lateral displacement of contaminated fluids

ITRC – Strategies for Monitoring the Performance of DNAPL Source Zone Remedies August 2004
63
outside of the treatment zone due to the impact of lithologic changes. Apparently, lower-permeability units can interfere with the vertical rise of hot water and vapor to cause this effect.Some ERH systems are now being designed to anticipate this potential problem and provide moreassurance of hydraulic control during heating.
5.3.3 Thermal Conduction Heating
Thermal conduction heating, known commercially as in situ thermal desorption (ISTD), uses bothconducive heating and vacuum to remediate soils contaminated with a wide range of organiccompounds. Heat is applied to the soil with an array of vertical or horizontal heaters containing aheating element (typically an electrically powered resistance heater) operating at temperatures ofapproximately 1,400–1,500°F. Heat flows through the soil from the heating elements primarily bythermal conduction. In their vertical configuration, these heaters are termed “thermal wells.”
As the soil is heated, organic contaminants in the soil are vaporized and/or destroyed by a numberof mechanisms, including evaporation, steam distillation, boiling, oxidation, and pyrolysis (chemicaldecomposition in the absence of oxygen). The vaporized water and contaminants, as well as somevolatilized inorganic compounds, are drawn counter-current to the heat flow into the vacuumextraction wells (termed “heater-vacuum” wells).
The conductive heating process is very uniform in its vertical and horizontal sweep because theenergy input into the soil by thermal wells is uniform over each heater’s length. In addition, thermalconductivity values do not vary much over a wide range of soil types, leading to a highly predictablerate of heat front propagation around each heater. As neighboring heat fronts overlap, the entiretreatment zone will reach the target temperature provided that heat losses to the atmosphere or dueto water influx (rainfall percolation or groundwater recharge) are not excessive (USACE, inpreparation). For many VOCs, a temperature of 100°C has been demonstrated to be sufficient toachieve significant mass removal (>99.9%) from many types of soil, mainly through in situ steamdistillation (LaChance, et al., 2004). For the treatment of less volatile organics, such as PCBs,PAHs, and dioxins (with higher boiling points), a temperature of 325°C has been demonstrated tobe a suitable target temperature to accomplish >99.9% removal from sandy, silty, and clayey sites(Stegemeier and Vinegar, 2002; Bierschenk, et al., 2004; Baker and Kuhlman, 2002). It should benoted that the presence of even small amounts of liquid water will limit temperatures obtainable inthe subsurface to100°C, the boiling point of water.
5.3.4 Key Monitoring Parameters
Monitoring for thermal projects should be performed both in the subsurface and at key locationsthroughout the treatment train, including the steam injection/extraction wellheads, electrodes, unitprocess inlet/outlet piping, stack discharges, and groundwater monitoring wells. When groundwaterextraction is employed as part of the thermal remediation, samples of extracted groundwater shouldalso be analyzed for the purposes of calculating the amount of contaminants recovered and to helpdetermine when the point of diminishing returns is being reached. Table 5-2 outlines some of the

ITRC – Strategies for Monitoring the Performance of DNAPL Source Zone Remedies August 2004
64
key monitoring parameters applicable to thermally enhanced remediation. More detailedinformation on monitoring is presented in the ISTR design manual (USACE, in preparation).
Temperature
Subsurface temperature monitoring is part of the system built and operated by the thermalremediation vendor. The remediation contract should stipulate that the data is shared with thosedoing the oversight at an agreed on frequency. In discussions with the technology vendor, thenumber of thermocouples to be used and the frequency of temperature measurement should also beagreed on. It is common for subsurface temperature data to be collected daily during operations ofin situ thermal remediation systems.
The vendor will likely have minimum monitoring requirements that they need for operation of thesystem, but those overseeing the remediation may desire to have a greater degree of monitoring builtinto the system. Commonly, thermocouple strings are placed in between injection and extractionwells and at extraction wells in steam injection systems, or at various locations between electrodesor heating elements in ERH and conductive heating systems, respectively. Thermocouple stringsare also generally colocated with monitoring wells, both inside and outside of the treatment area.Generally a 5- to 10-ft vertical spacing of thermocouples is used on thermocouple strings.
To prevent downward contaminant migration during heating, a “hot floor” can be established. Thearea beneath the treatment interval is heated first to establish a hot barrier beneath the remediationarea so that in the event that downward migration occurs during remediation, the contaminantcontacts this hot floor region and quickly transitions to vapor and is recovered by the vapor recoverywells. If a hot floor is desired, thermocouples should also be installed below the treatment area toensure that the hot floor is established. The more heterogeneous the subsurface system, the morethermocouple strings should be employed.
Electrical resistive tomography (ERT) can be used to measure changes in electrical resistivity of thesubsurface, which can be caused by changes in the composition of the fluids in the pore spaces aswell as changes in temperature. ERT has been used only for steam injection; it is not likely toprovide effective monitoring for ERH or conductive heating processes. The main resistivity changesthat normally occur in steam injection remediations lower the saturation of the pore spaces byformation of a steam zone. When ERT is used to monitor steam movement in a steam injectionsystem, thermocouples should also be installed. The use of ERT does not substitute forthermocouples.
Temperature may also be a better indicator of loss of hydraulic control during thermal remediationthan water level measurements or contaminant concentrations. Perimeter monitoring wells used formonitoring groundwater or vapor should also have thermocouple strings installed to monitortemperature at various depths. Temperature increases at a certain depth indicates flow of heatedwater from the treatment zone. Knowing where water is leaving the treatment zone allowsadjustments to be made to improve hydraulic control.

ITRC – Strategies for Monitoring the Performance of DNAPL Source Zone Remedies August 2004
65
Table 5-2. Performance Monitoring Parameters for Thermally Enhanced Remediation
Location / Media Parameter Purpose
GENERAL
Treatmentzone (before,during, andafter treatment)
Thermocouples Temperature Heating progress andcompleteness
Soil Contaminant concentration Remedial performance/progress
Groundwater Contaminant concentration Remedial performance/progress
Vapor Contaminant concentration Remedial performance/progress
Perimetermonitoring
Groundwater Water levels andcontaminant concentration
Migration control
Vapor Subsurface pressure Migration control
Thermocouples Temperature Migration control
Extraction andtreatmentsystem
Extracted fluids(water, vapor,and DNAPLs)
Temperature, pressure,and flow rate
Mass and energy balance, cooling,vacuum confirmation, mass andenergy balance
Contaminant concentration Remedial performance
FOR STEAM-ENHANCED EXTRACTION ONLY
Injection wellhead
Steam, liquid,and vapor lines
Temperature, pressure,and flow rate
Steam injection confirmation,injection safety and processcontrol, energy balance, and sitebalancing
Steam system Steam header Temperature, pressure,and flow rate
Safety and process control, massand energy balance
FOR ELECTRICAL RESISTANCE HEATING ONLY
Electricalheating system
Electrodes Power, current draw, andvoltage
Energy balance and site balancing
Water flow rate Power delivery maintenance
FOR THERMAL CONDUCTION HEATING ONLY
Electricalheating system
Thermal wellcircuits
Power, current draw, andvoltage
Heat delivery, confirmation, andenergy balance
Sources: Heron, SteamTech; Baker, TerraTherm; Beyke, Thermal Remediation Services.

ITRC – Strategies for Monitoring the Performance of DNAPL Source Zone Remedies August 2004
66
Vapor Concentration
Soil gas or extracted vapor monitoring can provide valuable qualitative information regarding theprogress towards meeting remediation objectives at sites with VOC contamination. Similar to SVEsystem behavior, concentrations in extracted vapors will approach an asymptote at some level abovezero where increases in the rate of energy input (in the form of heat) fail to result in higher massremoval rates. For a well-designed, well-operated, and optimized extraction system, this conditionindicates that a point of diminishing returns has been reached and that further reductions in DNAPLmass using enhanced recovery methods may not be feasible. However, there are many variablesinvolved in advective-phase mass transfer that together may result in asymptotic behavior (EPA,2001a), and vapor concentrations alone are not sufficient indicators of performance.
Accurate tracking of vapor concentrations over time to determine whether an asymptotic rate ofrecovery has been reached or whether to shut down the system and collect confirmation samplesrelies on proper vapor and subsurface temperature monitoring to ensure that the subsurfacetemperatures required to generate the observed vapor-phase concentrations are being maintained.
Soil Concentration
Soil concentration data can be obtained during installation of the remediation system as well asfollow system shutdown. The benefits of soil sampling during system installation is that it canprovide additional characterization information on the extent of contamination, as well as providea baseline of contaminant concentrations in soil before remediation begins. In most cases, soilsampling performed for characterization purposes was not completed at the same frequency asdrilling done to install the system, so considerable additional information can be obtained. Aftercompleting the remediation, the frequency of soil sampling may not need to be as great as beforethe remediation, but some paired soil cores should be obtained, and sampling should be done atlocations where there is some question as to the effectiveness of treatment (i.e., those areas that weredifficult to heat completely). Interim soil sampling can also be used to help judge the progress ofthe remediation.
Groundwater Monitoring
If groundwater extraction is being employed, samples of the extracted fluids should also be collectedand submitted for laboratory analysis to gauge the progress of the remediation. Groundwaterconcentrations are used to calculate the mass recovered and to help determine when the point ofdiminishing returns is being reached.
Monitoring wells could also be used for water level measurements, especially for ERH andconductive heating projects at sites with high permeability. Manual measurements of water levelcan be very difficult when the temperatures approach boiling. Thus, the use of pressure transducersthat are installed in the wells permanently and read automatically should be evaluated.

ITRC – Strategies for Monitoring the Performance of DNAPL Source Zone Remedies August 2004
67
Subsurface Pressure
Subsurface pressure is another parameter that can be measured during in situ thermal remediationto ensure control of the vapors that are generated during the remediation. Piezometers are often usedto measure subsurface pressure during in situ thermal remediation projects. These measuring pointscan be included within and around the perimeter of the treatment area and can be colocated withmonitoring wells. The exterior monitoring points must be close enough to the treatment area so thatsubsurface pressure can be expected at that monitoring point.
5.4 Surfactant/Cosolvent Flushing
5.4.1 Technology Description
Surfactant/cosolvent flushing describes an approach to enhanced DNAPL removal involving theinjection, and subsequent extraction, of chemicals to solubilize and/or mobilize DNAPLs. Thechemicals are injected into a system of wells designed to “sweep” the DNAPL zone within theaquifer. The solubilized or mobilized DNAPL is removed through strategically placed extractionwells. The produced liquids are then treated and either disposed or returned to the subsurface. Thechemicals used are typically aqueous surfactant solutions or cosolvents (e.g., alcohols). In theformer case, the process is referred as “surfactant-enhanced aquifer remediation” (SEAR), while inthe latter, it is referred to as “cosolvent flooding.” Both chemical solutions lower the interfacialtension between DNAPL and the aqueous phase and increase the apparent solubility of DNAPLconstituents. Both surfactant and cosolvent flooding have been applied at full scale in the field.Surfactant/cosolvent technology is described in greater detail in a technical and regulatory guidancedocument developed by the ITRC DNAPLs Team (ITRC, 2003b).
Media heterogeneity is one of the greatest impediments to subsurface remediation using currentflushing technologies. The practical efficiency of these technologies varies greatly depending onthe ability of the aqueous phase to contact the resident DNAPL. In heterogeneous geologic systemswith complex DNAPL architectures, the majority of flushing solution flows through the mostpermeable layers of the aquifer. These sections may or may not be the most contaminated. Becauseof media and DNAPL distribution heterogeneities, numerous pore volumes of flushing solution areneeded to ensure that at least one pore volume of flushing solution moves through lower-permeability regions. The system can be designed, though, to have a better sweep efficiency thataddresses this issue.
For more detail, refer to the Navy’s SEAR Design Manual (NAVFAC, 2002) and ImplementationManual (NAVFAC, 2003) and the ITRC document on surfactant/cosolvent flushing (ITRC, 2003b).
5.4.2 Key Monitoring Parameters
Table 5-3 lists suggested performance monitoring parameters for surfactant/cosolvent flushing. Keyparameters to monitor are discussed below.

ITRC – Strategies for Monitoring the Performance of DNAPL Source Zone Remedies August 2004
68
Surfactant/Cosolvent Contaminant Analysis
A key to the successful application of this technology is ensuring that the surfactant/cosolvent isdoing what it was designed to do. In some cases when using surfactants as the remedial agent, smallfluctuations in electrolyte concentrations can have profound effects on the performance of thetechnology because the phase behavior is usually dependent on the electrolyte concentration. Inaddition, cost and time savings can be realized by monitoring concentrations of contaminants ofconcern (COCs) in recovered fluids and evaluating when the remediation goals have been met at thesite. Thus, it is important to monitor both remedial agent and contaminant concentrations duringa surfactant or cosolvent flood. The frequency and locations of that monitoring are dependent onthe subsurface conditions encountered at the site.
Table 5-3. Performance Monitoring Parameters for Surfactant/Cosolvent Flushing
Location/Media Parameter Purpose
Mixed injectate, extraction wells, andmonitoring points
Temperature, pH, specificconductance, electrolyte conc.
Fluid chemistry
Extraction wells and monitoring points DNAPL volume, dissolvedcontaminant concentration
Remedial progress
All pumping locations Pumping flow rates Fluid flow properties
Injection, extraction, and wastewaterprocessing fluid lines
Pressure Fluid flow properties
Injection and extraction wells andmonitoring points
Water levels Aquifer properties
All monitoring points Free-phase DNAPL levels Aquifer properties
Source: Modified from NAVFAC, 2003.
Groundwater Quality
One of the criteria for determining the success of surfactant/cosolvent flushing is a significantreduction in aqueous contaminant concentrations in the injection, recovery, and monitoring wellsafter the chemical flood. Before the surfactant/cosolvent flood, baseline groundwater samplesshould be collected to determine the preflood aqueous contaminant levels. Typically, these samplesare collected immediately before the surfactant flood, during the prestabilization pumping period(before the surfactant water flood).
Post-treatment groundwater sampling should be carried out after the groundwater system hasreequilibrated. To assess any rebound of contaminant concentration, post-sampling events can beconducted quarterly, semiannually, or annually, depending on the magnitude of groundwater flowacross the zone of interest.

ITRC – Strategies for Monitoring the Performance of DNAPL Source Zone Remedies August 2004
69
Additional groundwater samples can also be collected from selected wells outside the treatment zonebefore and after treatment to verify that DNAPL and surfactant did not migrate out of the well fielddue to the surfactant/cosolvent flood. These sentinel wells should be screened to monitor theaquifers above and below the treatment zone. Care should be exercised when installing wells belowthe treatment zone, especially when penetrating thick clay, to avoid providing an additional DNAPLmigration pathway.
Injection/Extraction Flow Rate
The injection and recovery flow rates should be monitored closely during the flood. Accurate flowrate measurement is crucial for estimating the recovered DNAPL and surfactant/cosolvent mass aspreviously described. In addition, unbalanced injection and extraction rates result in poor sweepefficiency and mounding of the water table. Significant fluctuation of the water table can stress thehydraulic control system and potentially lead to insufficient hydraulic capture.
5.5 In Situ Chemical Oxidation
5.5.1 Technology Description
Remediation of contaminant source areas using ISCO involves injecting oxidants and otheramendments as required directly into the source zone. Three of the most common chemical oxidantsused for ISCO are permanganate (either sodium or potassium permanganate), hydrogen peroxide,and ozone. Permanganate is an oxidizing agent with a unique affinity for oxidizing organiccompounds containing carbon-carbon double bonds, aldehyde groups, or hydroxyl groups. Undernormal subsurface pH and temperature conditions, the carbon-carbon double bond of alkenes isbroken spontaneously and the unstable intermediates are converted to carbon dioxide through eitherhydrolysis or further oxidation by the permanganate ion. There are two forms of permanganate,KMnO4 and NaMnO4. Hydrogen peroxide involves free radical generation and direct oxidation.However, to achieve the desired contaminant reductions in a reasonable time, a metal catalyst isrequired. Iron is most commonly used, and, when mixed with hydrogen peroxide, the catalyst isknown as Fenton’s reagent. Ozone (O3) is one of the strongest oxidants available for ISCO. Ozonecan oxidize organic contaminants in two ways, either with direct oxidation by ozone or by thegeneration of free radical intermediates. The hydroxyl radicals are nonselective oxidizers, whichrapidly attack organic contaminants (typically in less than 10 seconds) and break down theircarbon-to-carbon bonds (ITRC, 2001).
Another oxidant, sodium persulfate, is also being applied at some sites. Persulfate requiresactivation by either heat or catalysis by chelated metals. The oxidants, ozone, persulfate, andperoxide create free radicals that react with the contaminant, breaking chemical bonds and producinginnocuous substances such as carbon dioxide, water, and chloride (ITRC, 2000). The permanganateion (MnO4
-) reacts through electron transfer without the formation of free radicals. Each oxidanthas different chemical and physical characteristics and therefore behaves differently in thesubsurface. The rate of reaction between the oxidant and soil matrix varies, which affects thetransport and distribution of the oxidant in the subsurface. For example, peroxide reacts more

ITRC – Strategies for Monitoring the Performance of DNAPL Source Zone Remedies August 2004
70
rapidly than MnO4- and therefore presents greater challenges for oxidant distribution and the ability
to reach the DNAPL.
Treatability studies using soil and groundwater samples from the site may be necessary prior toimplementing an ISCO technology. There are different objectives of the bench-scale treatabilitystudy. Because natural oxidant demand affects the efficiency of ISCO, one objective should be todetermine the oxidant demand of the native soil in order to estimate/design the oxidant concentrationand loading need for the full-scale.
Oxidant injection rates are functionally dependent on subsurface conditions, such as hydraulicconductivity. High hydraulic conductivity is desirable for oxidant distribution and, therefore,important to the success of delivering the oxidants to the targeted DNAPL zones. Oxidantdistribution can also be attempted in subsurface systems with low hydraulic conductivity and/or highanisotropy using close injection well spacing. ISCO technology is described in greater detail in atechnical and regulatory guidance document developed by the ITRC’s ISCO Team (ITRC, 2001).
5.5.2 Key Monitoring Parameters
The overall monitoring program for ISCO projects must provide information that is compatible withthe agreed-upon regulatory framework and should include elements of both efficiency monitoringand effectiveness monitoring.
Efficiency monitoring is done as a quality control measure before, during, and immediately after theinjection operation and consists primarily of the following elements:
• confirmation of oxidant injection concentrations, volumes, and flow rates,• measurement of oxidant concentrations in groundwater or soil gas samples distributed
across the site, and,• measurement of oxidant persistence.
While ISCO monitoring is done in real time during the oxidant injection process, effectivenessmonitoring is done primarily during and after the injection operations, although preinjection datamust be gathered to establish a baseline. Depending on the oxidant chemical applied at a site, therecan be certain oxidant-specific monitoring parameters that should be included. Despite thesedifferences, all applications of ISCO in DNAPL source zones share the same fundamentalperformance assessment strategies and performance metrics described in Sections 3 and 4. ISCOtechnology-specific performance assessment considerations relate to the fact that ISCO is:
• a contaminant mass destruction technology,• nonselective and attacks both target and nontarget oxidizable matter,• very sensitive to the distribution and persistence of oxidant chemical delivered to the
subsurface, and,

ITRC – Strategies for Monitoring the Performance of DNAPL Source Zone Remedies August 2004
71
• is a relatively rapid treatment technology, where geochemical changes are highlytransient, with some exceptions (e.g., permanganate can persist for months afterinjection, and the geochemical change of MnO2 formation may be long-lived).
Since ISCO is a mass destruction technology, contaminant mass is not actually removed from thesubsurface as observed in other treatment technologies (i.e., surfactant flooding technology). Thisfact means that assessment of mass treatment obtained is more difficult and must rely on pre- andpost-treatment subsurface evaluations. For this reason, on many ISCO projects, an accurate estimateof source mass reduction (as described in Section 4.3) may not be practical. Therefore, ISCOperformance assessment commonly focuses more on estimates of source treatment progress (Section4.2). Table 5-4 outlines some of the key monitoring parameters applicable to ISCO.
Table 5-4. Performance Monitoring Parameters for In Situ Chemical Oxidation
Location/Media Parameter Purpose
Groundwater in monitoringwells down-gradient ofinjection wells (pre- and post-injection)
Contaminant concentrations Remedial progress andeffectiveness
Oxidant Estimate oxidant persistenceand radial influence
Soil within source zone (pre-and post-injection)
Contaminant concentrations Remedial effectiveness
Injection wells (duringinjection)
Injection flow rate Determined based on hydraulicconductivity of aquifer system
Recovered oxidant fromextraction wells associatedwith recirculation system, ifinstalled
Extraction flow rate Fluid flow properties
Groundwater in monitoringwells, down-gradient ofinjection wells (pre-, during,and post-injection)
Field parameters (DO, pH,temperature, specific conductance,redox)
Evaluate system efficiency
Tracers (e.g., bromide orpotassium)
Observe travel times anddistribution of oxidant
Metals (e.g., iron, manganese,aluminum, arsenic, lead, chromium,magnesium)
Evaluate potential for formationclogging
Water quality parameters (sulfate,chloride, calcium, nitrate, alkalinity)
Source: ITRC, 2001
With some oxidants, unintentional contaminant mass redistribution and/or transport can occur, suchas with improper application of Fenton’s reagent or ozone. Under this condition, significant heat

ITRC – Strategies for Monitoring the Performance of DNAPL Source Zone Remedies August 2004
72
and/or oxygen gas can be generated that may volatilize and strip contaminants into the vapor phasewhere they can be lost to the unsaturated zone and atmosphere. Transfer of contaminants can alsooccur in the gas phase with ozone. Monitoring for these conditions is important to ensure that thesepotentially adverse effects do not occur or are managed. With the application of Fenton’s reagent(especially at higher H2O2 concentrations), adequate performance monitoring must be done to ensurethat contaminants are destroyed rather than transferred to the atmosphere.
Because ISCO is nonselective, key monitoring parameters include both organic and inorganicconstituents. Furthermore, monitoring in multiple media, including soil, groundwater, andpotentially vapor phases, can be critical. Analysis for organic contaminants in both soil andgroundwater is important for in situ oxidation, since only a small percentage of the mass of DNAPLconstituents are present in the aqueous phase. Furthermore, mass transfer of DNAPL of adsorbed-phase material into groundwater during treatment can result in little change in dissolvedconcentrations, potentially despite effective treatment of a large mass of DNAPL constituents. Forthese reasons, analysis of groundwater alone at ISCO sites provides limited information on theoverall level of DNAPL mass reduction achieved. However, in cases where the objectives of ISCOtreatment are solely to reduce dissolved organic concentrations, groundwater monitoring alone maybe adequate.
Groundwater Quality
Groundwater analytical data obtained during the in situ oxidation process can be highly dynamic andfrequently shows transient increases and decreases in contaminant levels. Since the reaction kineticswith TOC are generally faster than the reaction kinetics with contaminants, contaminants can bereleased from soils during the initial stages of treatment. A common observation is that dissolvedorganic contaminant levels increase for a short period, followed by a permanent decrease as thecontaminant mass is degraded (ITRC, 2001). This pattern reinforces the importance of acomprehensive performance assessment program.
Since ISCO groundwater data are generally dynamic during the treatment process, data collectedwhile oxidant is still present and conditions are highly nonequilibrium can be confounding. In manycases, real-time groundwater quality monitoring has greatest value to ensure that the oxidationprocess is not displacing contaminants or creating other safety concerns. Groundwater quality datacollected for assessing the final performance of DNAPL source treatment should be obtained afterall oxidant reactions are complete and site conditions have returned to equilibrium conditions toaccount for rebound (refer to Section 2.3 on addressing rebound). Depending on the oxidantapplied, the time required to reach equilibrium conditions following oxidant injection can vary fromone week to several months and, in some cases, up to one year. There are various parameters (e.g.,rebound, oxidant persistence, ORP) that can be monitored to make this determination, which aredependent on each oxidant (ITRC, 2001).
If contamination exists after treatment at levels above established criteria, then additional oxidationmay be needed. Sometimes, post-oxidation ground water monitoring is planned to occur at specific,arbitrary intervals. However, contingencies should be established prior to beginning a treatment that

ITRC – Strategies for Monitoring the Performance of DNAPL Source Zone Remedies August 2004
73
allow for additional injections based on the monitoring data. In most cases, multiple applicationsof the oxidant will be needed. Thus, the performance assessment program should be developed toaccommodate multiple applications of the oxidant.
Analysis of dissolved metals in groundwater is also important since certain pH and redox-sensitivemetals can become mobile under conditions that may exist during or as a result of an ISCOapplication. Most metals are more soluble in low-pH environments, which occurs during Fenton’s-type reactions. Redox-sensitive metals are more mobile in an oxidized state and can includechromium, uranium, vanadium, selenium, lead, and molybdenum. At a particular site, they may bein a chemically reduced, insoluble state, and therefore undetectable in groundwater. However,because they are more soluble under oxidizing conditions, these metals can be mobilized by in situoxidation. Sites where this can be a potential problem can include sites where either naturallyoccurring metals concentrations in soils are elevated, historical metals contamination was attenuatedby naturally occurring chemical reductions processes, or metals were codisposed with organiccontaminants.
In most cases, field and laboratory data have shown that the metals liberated by oxidation are readilyattenuated back to background conditions. However, this may not always be the case. To minimizethe possible risk of mobilizing metals at a site where ISCO is in use, several approaches can beimplemented for site screening. Soil laboratory data of total metals content can indicate if the sitecontains sufficient metals to be problematic. More detailed evaluation can be performed byconducting laboratory treatability tests using samples of soil and groundwater from the site. In thesebench-scale tests, aquifer materials are subjected to oxidation, and the solution water is analyzed formetals content before and after treatment. If metals are liberated into the aqueous solution, thissolution can then be contacted with site soils to determine the ability of the soils to attenuate themetals to background conditions. At the field scale, metals analysis of groundwater samples isimportant to verify that metals mobilization is not occurring.
5.6 Enhanced In Situ Bioremediation
In situ bioremediation (ISB) of DNAPL source zones is an emerging area of inquiry and has beendemonstrated in the field at only a few chlorinated solvent sites. Mass removal rates attainable byISB are generally thought to be significantly lower than rates attainable by other, more aggressivesource zone reduction technologies. ISB is, therefore, often considered in conjunction with othertechnologies as a “polishing step” or follow-on remedy after the DNAPL source zone has beendepleted. Nevertheless, many field studies are under way to further evaluate the effectiveness ofenhanced ISB in treating DNAPL source zones directly. ITRC has created a new work group tofollow the progress of this technology regarding its applicability to DNAPLs.
5.6.1 Technology Description
Remediation of contaminant source areas containing halogenated, solvent DNAPL sorbed to soil orpooled as separate phase in groundwater using in situ anaerobic reductive dechlorination, a form ofenhanced ISB, involves injecting electron donor amendment directly into the source zone. For

ITRC – Strategies for Monitoring the Performance of DNAPL Source Zone Remedies August 2004
74
source area treatment to be effective, the soluble amendment must make the DNAPL bioavailableby enhancing the dissolution of the DNAPL. A common amendment used to enhance the dissolutionof DNAPL is sodium lactate. For chlorinated solvent DNAPL reductive dechlorination, theanaerobic bacteria degrade the solvents to carbon dioxide, water, and chloride. This technology isdescribed in greater detail in a technical and regulatory guidance document developed by ITRC’sIn Situ Bioremediation Team (ITRC, 1998).
5.6.2 Key Monitoring Parameters
Assessing ISB effectiveness is different than for most other DNAPL remediation technologiesbecause of the way the technology is implemented. Whereas most of the aggressive DNAPLremediation technologies discussed in this document are deployed as one-time, short-durationremedial actions (weeks to months), ISB in DNAPL source zones is typically applied somewhatcontinuously over a longer time frame (several years).
Groundwater Quality
The most common metric used to assess ISB performance is groundwater concentrations. Asdescribed in Section 4.2.2, this metric alone is not generally recommended for assessing theperformance of a DNAPL remediation. However, the only parameter measured for most DNAPLperformance assessments that use groundwater concentration as a metric is the contaminants thatare being remediated. In contrast, for ISB, several groups of parameters can be monitored throughgroundwater sampling throughout the operation of an ISB system to assess performance. Theseinclude contaminants and degradation products (e.g., PCE, TCE, cis-dichloroethylene [DCE],trans-DCE, vinyl chloride, ethene, chloride), redox-sensitive parameters (e.g., ORP, DO, ferrousiron, nitrate, sulfate, methane, dissolved hydrogen), electron donor parameters (e.g., chemicaloxygen demand, total organic carbon/dissolved organic carbon, speciated electron donors, andvolatile fatty acids), biological activity indicators (e.g., carbon dioxide and alkalinity), biologicalnutrients (e.g., phosphate and ammonia), and water quality parameters (e.g., temperature, pH,specific conductance). This approach essentially provides a multiple lines of evidence approach tomonitoring the performance of ISB that is analogous to using more than one performance assessmentmetric described in Section 3 for assessing the performance of other DNAPL remediationtechnologies.
Table 5-5 presents performance monitoring parameters for ISB of chlorinated solvents. Since themedia for all parameters is groundwater, the second column lists the parameter type rather than themedia.

ITRC – Strategies for Monitoring the Performance of DNAPL Source Zone Remedies August 2004
75
Table 5-5. Performance Monitoring Parameters for In Situ Bioremediation of CVOCs
Parameter Type or Category PurposePCE, TCE, cis-DCE, trans-DCE, vinyl chloride
Contaminants anddegradation products
Required to monitor the extent ofdechlorination
Ethene and ethane Degradation products Ultimate end product of reductivedechlorination of chloroethenes; requiredto monitor the extent of dechlorination
Chloride Degradation product May be useful for monitoring the extentof dechlorination
ORP, dissolved oxygen,ferrous iron, manganese II,nitrate, sulfate, and methane
Redox-sensitiveparameters
Required to assess suitability ofconditions for reductive dechlorination
Dissolved hydrogen Redox-sensitiveparameters
May be useful in assessing the suitabilityof conditions for reductive dechlorination
Chemical oxygen demand,total organic carbon/dissolvedorganic carbon
Electron donor parameters Surrogate measures of available electrondonor in the subsurface; may be usefulfor assessing the extent of electrondonor distribution in the subsurface
Volatile fatty acids andspeciated electron donors(e.g., lactate)
Electron donor parameters Actual measures of available electrondonor in the subsurface (parameters willvary depending on the amendmentused); may be useful for assessing theextent of electron donor distribution inthe subsurface
Carbon dioxide and alkalinity Biological activityindicators
Indicators of microbial respiration; maybe useful for evaluating areas ofincreased biological activity
Ammonia and phosphate Biological nutrients May be useful for assessing potentialnutrient limitations
pH, temperature, specificconductance, and turbidity
Water quality parameters May be useful for evaluating thesuitability of conditions for reductivedechlorination
Microbial community andmolecular parameter
Microbial parameters Assess the presence of particularfunctionality, genetic information, orcommunity structure
Stable carbon isotopes Contaminants anddegradation products
Can be useful to monitor the extent ofdechlorination

ITRC – Strategies for Monitoring the Performance of DNAPL Source Zone Remedies August 2004
76
6.0 OTHER ISSUES
This section addresses health and safety, regulatory issues, and stakeholder concerns that pertain toperformance assessment.
6.1 Health and Safety
Hazards associated with monitoring performance that involve collecting samples while a remedialsystem is operating should be addressed in the job hazard analysis section of the site-specific healthand safety plan. In general, the same hazards that impact workers involved in site operations applyto sampling technicians. The following subsections point out some general warnings and provideexamples of some of the potential health and safety concerns associated with the treatmenttechnologies discussed in this document.
6.1.1 Sampling Hot Media
With thermal treatment approaches, it is important to take precautions to prevent possible injurywhen collecting samples of hot media. To minimize these risks, confirmation sampling ofgroundwater or soil can be delayed until after the subsurface temperature has cooled to safer levels.Depending on the thermal properties of the soil and the velocity of groundwater through thetreatment zone, this process could take from a couple weeks to several months or longer. Forprogress monitoring or intermediate sampling while the subsurface is still hot, the thermalremediation vendors have developed safe methods to obtain valid hot groundwater and soil samples,some of which are presented below.
Sampling Hot Groundwater
Collecting groundwater samples that are more than 90°C can obviously be very hazardous withouttaking special precautions. If monitoring wells are not properly sealed or vented, flash boiling canresult. Box 6-1 shows what can happen if pressure is allowed to build up in the subsurface to thepoint where flash boiling is a problem. Safe sampling protocols have been developed, includingconstructing monitoring wells with stainless steel sampling ports to facilitate sample collection andcooling prior to transfer to a sample vial.
Sampling Hot Soil
In addition to issues related to loss of volatile compounds, handling of hot soil also presents a dangerto the field technicians collecting samples of the soil. Methods employed at Cape Canaveral LC34should help to minimize the loss of volatiles as well as prevent injury (Gaberell, et al., 2002).

ITRC – Strategies for Monitoring the Performance of DNAPL Source Zone Remedies August 2004
77
Box 6-1. NASA Launch Complex 34: “Geyser”
Photo showing a “geyser” atLC34 in the ERH demonstrationplot because the monitoringwells were not vented. Whenthe cap was removed duringactive heating, the pressuredropped, and flash boilingoccurred.
Source: Laymon Grey, Florida State University.
6.1.2 Handling and Working near Hazardous Chemical Agents
Hydrogen peroxide and potassium permanganate, oxidants used in the ISCO technology, andalcohols, used for cosolvent flushing, are relatively safe chemicals with respect to toxicity.However, dangers associated with the handling of any oxidizing chemicals or flammable liquids arepresent with these chemicals. In general, oxidizing chemicals are either potentially flammable orexplosive when mixed with combustible chemicals. Oxidizing chemicals not only react violentlywith combustible materials, but also release oxygen gas during decomposition, which could help fuela fire or explosion. Ethanol, a commonly used cosolvent, is classified as a flammable liquid andmust be handled carefully. Personnel who lack experience and skill with these chemicals may beprone to mishandling of the chemicals and therefore should be supervised closely or assigned toother tasks.
Additional health and safety concerns related to performance monitoring at DNAPL remediationprojects include the following:
• vapor monitoring and respirator use,• electrical hazards,• sampling extracted fluids, and,• shipping samples of DNAPL.
6.2 Decision Support: Forecasting Performance
As mentioned, one of the uses of performance assessment results is the potential to allow predictionsof future performance of these technologies at other sites and to develop performance standards.Performance standards would allow knowledge of a technology’s performance at one site to be used
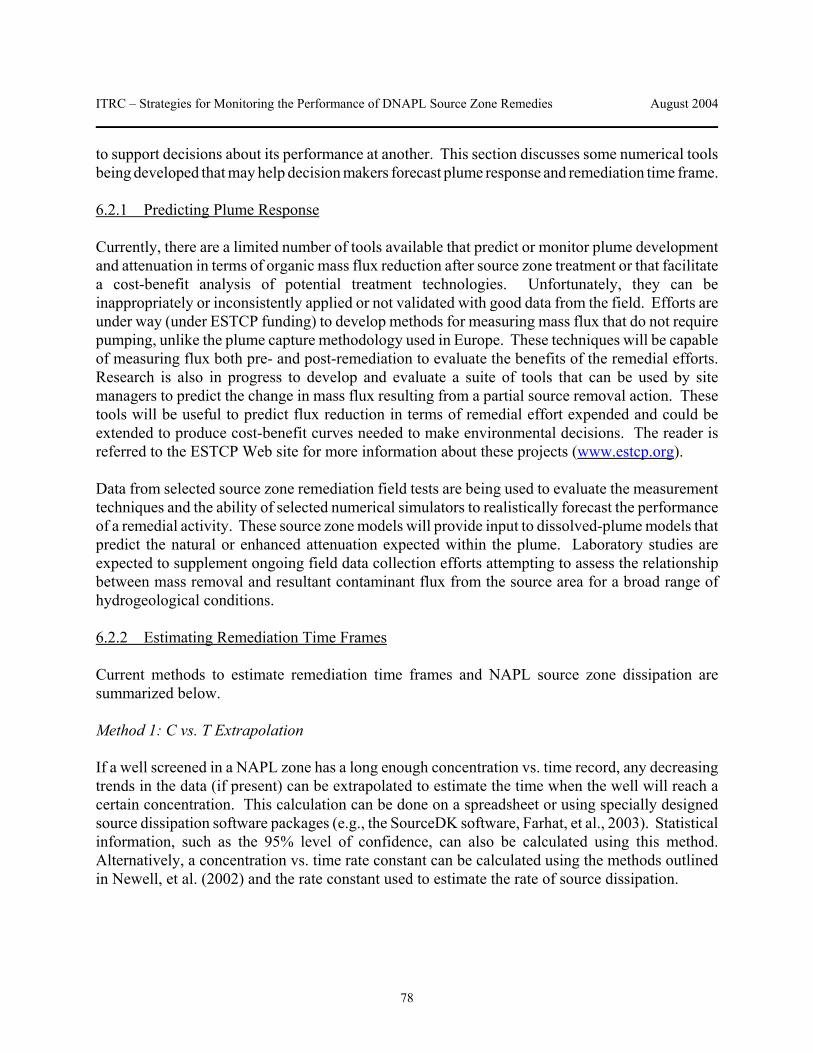
ITRC – Strategies for Monitoring the Performance of DNAPL Source Zone Remedies August 2004
78
to support decisions about its performance at another. This section discusses some numerical toolsbeing developed that may help decision makers forecast plume response and remediation time frame.
6.2.1 Predicting Plume Response
Currently, there are a limited number of tools available that predict or monitor plume developmentand attenuation in terms of organic mass flux reduction after source zone treatment or that facilitatea cost-benefit analysis of potential treatment technologies. Unfortunately, they can beinappropriately or inconsistently applied or not validated with good data from the field. Efforts areunder way (under ESTCP funding) to develop methods for measuring mass flux that do not requirepumping, unlike the plume capture methodology used in Europe. These techniques will be capableof measuring flux both pre- and post-remediation to evaluate the benefits of the remedial efforts.Research is also in progress to develop and evaluate a suite of tools that can be used by sitemanagers to predict the change in mass flux resulting from a partial source removal action. Thesetools will be useful to predict flux reduction in terms of remedial effort expended and could beextended to produce cost-benefit curves needed to make environmental decisions. The reader isreferred to the ESTCP Web site for more information about these projects (www.estcp.org).
Data from selected source zone remediation field tests are being used to evaluate the measurementtechniques and the ability of selected numerical simulators to realistically forecast the performanceof a remedial activity. These source zone models will provide input to dissolved-plume models thatpredict the natural or enhanced attenuation expected within the plume. Laboratory studies areexpected to supplement ongoing field data collection efforts attempting to assess the relationshipbetween mass removal and resultant contaminant flux from the source area for a broad range ofhydrogeological conditions.
6.2.2 Estimating Remediation Time Frames
Current methods to estimate remediation time frames and NAPL source zone dissipation aresummarized below.
Method 1: C vs. T Extrapolation
If a well screened in a NAPL zone has a long enough concentration vs. time record, any decreasingtrends in the data (if present) can be extrapolated to estimate the time when the well will reach acertain concentration. This calculation can be done on a spreadsheet or using specially designedsource dissipation software packages (e.g., the SourceDK software, Farhat, et al., 2003). Statisticalinformation, such as the 95% level of confidence, can also be calculated using this method.Alternatively, a concentration vs. time rate constant can be calculated using the methods outlinedin Newell, et al. (2002) and the rate constant used to estimate the rate of source dissipation.

ITRC – Strategies for Monitoring the Performance of DNAPL Source Zone Remedies August 2004
79
Method 2: Simple Box Model
A simple box model that considers a mass of NAPL in a source zone and the mass flux of dissolvedconstituents leaving the source zone has been applied to estimate source dissipation patterns (e.g.,Wiedemeier, et al., 1999). The key assumption is that the concentration vs. time pattern can bedescribed as a first-order decay process. With this assumption, the source decay rate constant in thebox (ks) can be estimated and used to predict concentration values as a function of time (Ct).
ks = (Q × Cgwo)/Mo
Ct = Cgwo exp(-ks × t)
where
ks = source decay rate constant (per time),Cgwo = concentration of dissolved constituent in groundwater at time 0 (mass/volume),Q = specific discharge through the box (volume/time),Mo = mass in the box at time = 0 (mass),Ct = concentration of dissolved constituent in groundwater at time t (mass/volume),t = time (time).
Software packages that include this type of source dissipation box model include the BIOSCREENmodel (Newell, et al., 1996), the BIOCHLOR model (Aziz, et al., 2000) , and the SourceDK model(Farhat, et al., 2003). The authors of the SourceDK software state that their tool can be used as aplanning tool for developing order-of-magnitude estimates of remediation time frame, although atmost sites, the uncertainty in the estimate is large.
Method 3: Process-Based Models
Available process-type models are based on mass transfer equations for various configurations ofNAPL in the subsurface. Wiedemeier, et al. (1999) summarize key process-based models for NAPLsystems. Examples of process-based models in public domain software are described below.
The Natural Attenuation Software (NAS) (Chapelle, et al., 2003) uses a numerical model, SEAM3D, to estimate the time required for dissolution of a NAPL zone before a dissolved-phaseconcentration goal is achieved. This model follows the work of Imhoff, et al. (1993), where thedriving force for NAPL dissolution is the difference between the actual aqueous-phase concentrationand the aqueous-phase concentration in equilibrium with the NAPL. NAS calculates the length oftime required to meet cleanup goals (“time of remediation”) given various values of plume load.Site characterization data, entered by the user, is used to calculate the natural attenuation capacityof various contaminants at a particular site. Using this estimate of the natural attenuation capacityand contaminant source data, the user may chose to evaluate the effects of source reduction orcomplete removal in terms of meeting a user-specified contaminant concentration at a specific pointof compliance. Like most numerical modeling tools, NAS requires the input of detailed site

ITRC – Strategies for Monitoring the Performance of DNAPL Source Zone Remedies August 2004
80
information about hydrogeology, redox conditions, and the distribution of contaminants. For highlyheterogeneous systems, the program may introduce unacceptable errors which may warrant moredetailed, site-specific modeling. NAS is available for download at Virginia Tech’s Web site(http://www.cee.vt.edu/NAS/).
Other process models in public domain software packages include two models in the SourceDKsoftware (Farhat, et al., 2003): a dissolved-only plumes source decay algorithm from Wiedemeier,et al. (1999) and a source decay model for NAPL-affected source zones, originally developed byPowers, et al. (1994) and modified in Wiedemeier, et al. (1999). SourceDK is available at theGroundwater Services, Inc. Web site (http://www.gsi-net.com/Software/SourceDK.htm) fordownload.
6.3 Regulatory Concerns
The concerns of the various regulatory agencies that require and oversee the remediation of DNAPLsites are to a great extent the reason for the development of this document. At the present time, thereare generally clear regulatory guidelines for the remediation of contaminated groundwater and soil,but these guidelines are often not appropriate to issues unique to DNAPLs. They therefore cannotclearly guide the regulator in assessing the performance of a remediation approach targeting DNAPLsource zones.
When assessing the performance of a DNAPL remedy, regulators must have confidence that theproper tools and proper metrics are selected to successfully evaluate the remedial technologyperformance. This document attempts to provide guidance for assessing the performance of theremediation. Regulator must develop remedial goals and determine what constitutes successfulremediation performance. These goals will likely be site and contaminant specific. The case studiesin Appendix B of this report demonstrate several strategies that regulators have used to assessperformance of various DNAPL remediation technologies.
Other issues that regulators must consider when reviewing, planning, or overseeing a DNAPL sourcezone remediation include, but are not limited to ensuring proper sampling techniques so theperformance can be accurately assessed, stakeholder issues, and public acceptance of theremediation. Some of these concerns are described in more detail below.
Concerns over Drilling in a Source Area
Soil borings. Due to the large number of soil samples that may be needed to assess a remedialperformance, regulators need to ensure that drilling will not mobilize the DNAPLs. Regulators alsoneed to ensure that plugging/ abandoning of drill holes with impermeable materials will not decreasethe conductivity of the formation enough to prevent the flow of remedial fluids or create channelsthat will redirect portions of the flow to prevent them from reaching the DNAPL. Regulators mustalso ensure that the plugging material will not react unfavorably with the DNAPL specific to the site.

ITRC – Strategies for Monitoring the Performance of DNAPL Source Zone Remedies August 2004
81
Baseline soil sampling should be completed as the system as installed, if possible, to minimize theneed for backfilling boreholes. Soil cores that are not collected as part of the injection or extractionwell installation should be backfilled with a grout that is compatible with the type of remediationbeing implemented. For instance, if thermal remediation is to be done, cement grout with 40% silicaflour has been used.
Monitoring wells. Regulators must ensure that the performance assessment wells
• do not create preferential flow pathways for DNAPL or contaminated groundwater,• do not block the flow of remedial fluids or DNAPLs that are being recovered,• do not change the subsurface flow regime, and,• do sample areas that are representative of actual groundwater and subsurface conditions
to accurately assess remedial performance.
Regulators must oversee the well planning process to ensure that the correct types of wells areincorporated into the design. For example, if wells contain multilevel samplers, they must beconstructed and used correctly to avoid creating preferential pathways for contaminant flow. Wellconstruction must also take into account the DNAPL present at the site to ensure that the wellmaterials and grout do not interact with it. Sampling equipment must also be compatible with theDNAPL.
Concerns over Sampling Methods and Techniques Appropriate to the Remedial Technology
The sampling technique, analytical procedures, and the detection limits chosen must be appropriateto measure against the performance assessment goals and objectives. The sampling locations mustbe selected to be representative of the desired zone and/or depth being assessed.
Regulator must ensure that the sampling method used to assess the remedial performance will workas intended. For example, accurate sampling of volatile organic DNAPL-contaminated soil andgroundwater may require special techniques when the media remain hot following a thermalremediation process. Specialized sampling techniques may also be required where injection ofsurfactants is necessary in the remediation effort. In this case, there may be significant foaming ofany materials pumped out of the ground. Accurate analysis of these residuals must be accomplishedto assist regulators in the determination of the success of the remediation.
Concerns Related to Statistical Evaluation of the Data
Regulators must ensure that the statistical methods or models used to evaluate the data areappropriate for the type and amount of data collected. Based on the limited type of data that maybe available from the site, certain statistical methods may not apply. For example, when performingtrend analysis, regulators must ensure that sufficient rounds of sampling and appropriate seasonaldata are available. When this is not the case, application of certain statistical methods may produceerroneous results.

ITRC – Strategies for Monitoring the Performance of DNAPL Source Zone Remedies August 2004
82
Concerns over Potential Mobilization of DNAPLs
Regulators must ensure that DNAPL is not migrating beyond the treatment zone, particularly off siteor to areas that were previously uncontaminated. Additionally, performance measurement may becomplicated by the fact that the contamination has been moved rather than removed by the remedialtechnology. Thus, sampling of the original zone of contamination may show reduced levels ofDNAPLs, when in fact, contamination may have simply migrated to a different zone.
Concerns Related to Other Regulatory Agencies
Regulators must ensure that the remediation efforts meet other regulatory requirements. These caninclude underground injection control regulations, air standards, discharge permits, and RCRAhazardous waste treatment requirements, among others.
Public Concerns over Injected Remedial Fluids
While public concerns regarding the performance assessment are not directly part of a regulator’sconcerns, regulators must be prepared to answer the public’s questions and allay fears. Theseconcerns include both the actual hazards that may be directly posed by the remediation and generalanxiety sometimes expressed by the public. Stakeholder concerns and public involvement inmeasuring success at DNAPL sites are addressed in Section 6.4.
6.4 Stakeholder/Public Involvement
Public stakeholders may be persons who own property on or near a contaminated site, or they maybe persons concerned about air emissions or groundwater conditions. They may be members of anenvironmental group such as the Sierra Club or Natural Resources Defense Fund. They may bemembers of a Department of Defense (DoD) Restoration Advisory Board (RAB) or of a DOECommunity Advisory Board (CAB). Whether a tribal, public, or community stakeholder, allstakeholders are generally interested in similar outcomes—limiting or eliminating risk for publichealth and the environment and future liability.
This document does not suggest that removing DNAPL source areas is required; it is intendedsimply to describe the state-of-the-art and science with respect to measuring the effectiveness andefficiency of available treatment systems. Regardless of the remedial approach selected, the primaryconcern for stakeholders should be the most complete characterization of the extent and nature ofDNAPL contaminants in the subsurface.. This process must begin with a complete and thoroughoperational site history, as this first step is the foundation to identifying the location of contaminantsand potential receptors along the plume.
The delineation of the plume is also critical in assessing the performance of the chosen remedialtechnology. For example, a remediation technology may be deemed effective in terms of facilitatingthe transfer of contaminant mass into the dissolved phase where it can be recovered or treated in situ.It may be viewed as having performed very poorly in terms of efficiency, however.

ITRC – Strategies for Monitoring the Performance of DNAPL Source Zone Remedies August 2004
83
The scientific and engineering background required to comprehend the complexity of DNAPLsource zone remediation are not trivial; hence, many of these concepts are not easily conveyed orunderstood by a nontechnical audience. Conveying even the most basic concepts dealing withDNAPL source zone delineation and remediation can be a daunting task for the regulator, theproperty holder, and/or the remediation contractor. Most of the time, the public simply wants toknow that the “stuff has been cleaned up.” To offer this reassurance, however, there must be someform of tribal, public, or community stakeholder oversight to ensure that the remediation systemselected will behave as promised and not exacerbate the situation, meaning that the stakeholdersneed either instruction in the basic concepts of contaminant delineation and remediation or theservices of an independent consultant to review the contractor documents and the regulators’response to proposed work plans and investigation reports. Technical assistance for stakeholdersis available through most federal agencies, though time limits on the years this assistance isprovided may be limited.
Public involvement requirements differ by state. Arizona, for instance, has extensive state statutesthat spell out very clearly the steps required to inform stakeholders about a proposed remedialsolution. Applicable state and federal law (mostly RCRA and CERCLA) have requirements forstakeholder involvement, but these generally require a minimum number of public meetings orhearings.
Remediation of DNAPL source areas has proved a daunting task in many cases that has lasted farlonger than represented to many stakeholders. The use of newer and better investigativetechnologies has identified more sources and new remediation technologies offer some hope forsolving removal problems at the source. Another benefit of the new technologies available for theremediation of DNAPL is the reduction in the likelihood that a TI waiver is granted withoutconsideration of source control, since TI waivers require NAPL removal to the extent practicable.Such waivers are perceived by many stakeholders as having the potential of leaving them “holdingthe bag” of future liability and exposure to unnecessary risks. The downside of new technology isthat it has meant longer decision-making periods as regulators, insurers, and stakeholders wait forcase studies and proof of both effectiveness and efficiency.
All stakeholders benefit by becoming as educated as possible in the many concepts and technologiesavailable for both DNAPL identification and remediation. ITRC documents and online trainingsessions are a great resource for this need. The challenge for property owners, contractors, andconsultants is to aid in the communication of these concepts and systems so that the process doesnot become bogged down, either because stakeholders do not understand the system being proposedor because they do not believe the nature and extent of the contamination has been fully delineated.
Doing one’s homework in advance of presenting to the public is important, as is having a fall-backplan should the proposed remediation fail. Fully explaining how the remediation technology andperformance monitoring will get the community to the goals for the site and how steps will be takenalong the way to change course will all be valuable in keeping progress from being disrupted.

ITRC – Strategies for Monitoring the Performance of DNAPL Source Zone Remedies August 2004
84
As this document has pointed out, identification and treatment of DNAPL zones is “a work inprogress.” Communication that is early, often, truthful, and conveyed and understood in layman’sterms goes a long way toward keeping a project on track, even if there are missteps along the way.Going beyond the communication requirement of RCRA or CERCLA and offering primers inDNAPL terminology and system descriptions will probably be beneficial.
7.0 REFERENCES
Note: Internet listings are provided solely for the convenience of the reader. ITRC does not controlmost of the Internet sites mentioned and is not responsible for the addition, deletion, or movementof content on those sites.
Air Force Center for Environmental Excellence (AFCEE). 2001. Remedial ProcessOptimization Handbook. Brooks Air Force Base, Tex.
Aziz, C.E., C.J. Newell, J.R. Gonzales, P. Haas, T.P. Clement, and Y. Sun. 2000. BIOCHLORNatural Attenuation Decision Support System User’s Manual Version 1.0. EPA ReportEPA/600/R-00/008.
Baker, R.S., and M. Kuhlman. 2002. “A Description of the Mechanisms of In-Situ ThermalDestruction (ISTD) Reactions.” Paper presented at the 2nd International Conference onOxidation and Reduction Technologies for Soil and Groundwater, Toronto, Ontario,Canada, Nov. 17–21.
Battelle/Duke Engineering & Services. 2001. Navy/ESTCP Final Technical Report, prepared forNaval Facilities Engineering Service Center.
Bedient, P.B., A.W. Holder, C.G. Enfield, and A.L. Wood. 1999. “Enhanced RemediationDemonstrations at Hill Air Force Base: Introduction.” Innovative SubsurfaceRemediation, ACS Symposium Series 725, M. L. Brusseau, et al. (Eds.), pp. 36–48.
Bierschenk, J.M., R.S. Baker, R.J. Bukowski, K. Parker, R. Young, J. King, T. Landler, and D.Sheppard. 2004. “Full-Scale Phase 1a Results of ISTD Remediation at FormerAlhambra, California Wood Treatment Site.” Proceedings of the 4th InternationalConference on Remediation of Chlorinated and Recalcitrant Compounds, Monterey,California, May 24–27. Battelle, Columbus, Ohio (Preprint).
Bockelmann, A., T. Ptak, and G. Teutsch. 2001. “An Analytical Quantification of Mass Fluxesand Natural Attenuation Rate Constants at a Former Gasworks Site.” Journal ofContaminant Hydrology, 53(3–4):429–53.

ITRC – Strategies for Monitoring the Performance of DNAPL Source Zone Remedies August 2004
85
Chapelle, F.H, M.A. Widdowson, J.S. Brauner, E. Mendez III, and C.C. Casey. 2003. Methodology for Estimating Times of Remediation Associated with Monitored NaturalAttenuation, U.S. Geological Survey, Water Resources Investigations Report 03-4057. http://water.usgs.gov/pubs/wri/wri034057/
Cohen, R.M., and J.W. Mercer. 1993. DNAPL Site Evaluation, C.K. Smoley-CRC Press, BocaRaton, Fla.
Crumbling, D. 2002. “In Search of Representativeness: Evolving the Environmental DataQuality Model.” Quality Assurance: Good Practice, Regulation, and Law. 9:179–90.
Crumbling, D., C. Groenjes, B. Lesnik, K. Lynch, J. Shockley, J. Vanee, R. Howe, L. Keith, J.Mckenna, and D. Peck. 2001. “Managing Uncertainty in Environmental Decisions:Applying the Concept of Effective Data at Contaminated Sites Could Reduce Costs andImprove Cleanups.” Environmental Science and Technology, 35:404A–409A.http://cluin.org/download/char/oct01est.pdf
Daniel, D.E. 1992. “Overview of Geoenvironmental Principles Applied to Remediation ofContaminated Waste Disposal Sites.” In M.A. Usmen and Y.B. Acar (eds.),Environmental Geotechnology, Balkema AA, Rotterdam, The Netherlands, pp. 311–20.
Davis, E.L. 1997. “How Heat Can Enhance In-Situ Soil and Aquifer Remediation: ImportantChemical Properties and Guidance on Choosing the Appropriate Technique.” GroundWater Issue Paper, EPA/540/S-97/502, April 1997.
Dwarakanath, V. 1997. “Characterization and Remediation of Aquifers Contaminated byNonaqueous Phase Liquids Using Partitioning Tracers and Surfactants.” Ph.D.dissertation, University of Texas at Austin, Austin, Tex.
Enfield, C.G., A.L. Wood, M. Annable, K. Hatfield, C. Holbert, in preparation. “Benefits ofPartial DNAPL Source Removal: Measuring Contaminant Flux Change.”
Environmental Security Technology Certification Program (ESTCP). 2003. “Demonstration andValidation of a Water and Solute Flux Measuring Device.” ESTCP CU-0114.www.estcp.org/projects/cleanup/200114o.cfm
Farhat, S.K., P.C. de Blanc, C.J. Newell, and J.R. Gonzales. 2003. “SourceDK RemediationTimeframe Decision Support System,” Air Force Center for Environmental Excellence,Brooks AFB, Tex. www.gsi-net.com.
Feenstra, S., D.M. Mackay, and J.A. Cherry. 1991. “A Method for Assessing Residual NaplBased on Organic Chemical Concentrations in Soil Samples.” Ground Water MonitoringReview, 11(2)128–136.

ITRC – Strategies for Monitoring the Performance of DNAPL Source Zone Remedies August 2004
86
Gaberell, M., A. Gavaskar, E. Drescher, J. Sminchak, L. Cumming, S. Yoon, and S. De Silva. 2002. “Soil Core Characterization Strategy at DNAPL Sites Subjected to StrongThermal or Chemical Remediation.” In A.R. Gavaskar and A.S.C. Chen (eds.), TreatingDense Nonaqueous-Phase Liquids (DNAPLs): Remediation of Chlorinated andRecalcitrant Compounds. Proceedings of the Third International Conference onRemediation of Chlorinated and Recalcitrant Compounds. Battelle Press, Columbus,Ohio.
Gavaskar, A. 2002. “Site-Specific Verification of In Situ Remediation of DNAPLs.” Report fromthe 2001 Special Session of the NATO/CCMS Pilot Study on Evaluation ofDemonstrated and Emerging Technologies for the Treatment of Contaminated Land andGroundwater. EPA 542-R-02-002. www.epa.gov/swertio1/pubipart.htm#nato
Hatfield, K., M. Annable, and P.S.C. Rao. 2003. “The Passive Flux Meter: An In SituTechnology for Measuring Water and Solute Flux.”www.diffusionsampler.org/Library/DocumentList.asp
Heron, G., T.H. Christensen, T. Heron, and T.H. Larson. 2000. “Thermally EnhancedRemediation of DNAPL Sites: The Competition Between Downward Mobilization andUpward Volatilization.” In A.R. Gavaskar and A.S.C. Chen (eds.), Treating DenseNonaqueous-Phase Liquids (DNAPLs): Remediation of Chlorinated and RecalcitrantCompounds. Proceedings of the Third International Conference on Remediation ofChlorinated and Recalcitrant Compounds. Battelle Press, Columbus, Ohio.
Hewitt, A.D., T.F. Jenkins, and C.L. Grant. 1995. “Collection, Handling, and Storage: Keys toImproved Data Quality for Volatile Organic Compounds in Soil.” AmericanEnvironmental Laboratory, 7:25–28.
Hunkeler, D., and B.L. Parker. 2002. “Monitoring In Situ Oxidation of TCE by PermanganateUsing Carbon Isotopes.” In A.R. Gavaskar and A.S.C. Chen (eds.), Treating DenseNonaqueous Phase Liquids (DNAPLs): Remediation of Chlorinated and RecalcitrantCompounds. Proceedings of the Third International Conference on Remediation ofChlorinated and Recalcitrant Compounds, Battelle Press, Columbus, Ohio.
Hunt J.R., N. Sitar, K.S. Udell. 1988. “Nonaqueous Phase Liquid Transport and Cleanup: I,Analysis of Mechanisms.” Water Resources Research, Vol. 24, 1247–58.
Imhoff, P.Y., P.R. Jaffe, and G.F. Pinder. 1993. “An Experimental Study of CompleteDissolution of a Nonaqueous Phase Liquid in Saturated Porous Media.” Water ResourcesResearch, 32:321–31.

ITRC – Strategies for Monitoring the Performance of DNAPL Source Zone Remedies August 2004
87
Interstate Technology and Regulatory Council (ITRC). 1998. Technical and RegulatoryRequirements for Enhanced In Situ Bioremediation of Chlorinated Solvents inGroundwater. ITRC/ISB-6. www.itrcweb.org/isb-6.pdf
ITRC. 2000. DNAPLs: Review of Emerging Characterization and Remediation Technologies. ITRC/DNAPLs-1. www.itrcweb.org/DNAPL-1.pdf
ITRC. 2001. Technical and Regulatory Guidance for In Situ Chemical Oxidation ofContaminated Soil and Groundwater. ITRC/ISCO-1. www.itrcweb.org/ISCO-1.pdf
ITRC. 2002. DNAPL Source Reduction: Facing the Challenge. ITRC/DNAPLs-2.www.itrcweb.org/DNAPL-2.pdf
ITRC. 2003a. An Introduction to Characterizing Sites Contaminated With DNAPLs. ITRC/DNAPLs-4. www.itrcweb.org/DNAPL-4.pdf
ITRC. 2003b. Technical and Regulatory Guidance for Surfactant/Cosolvent Flushing of DNAPLSource Zones. ITRC/DNAPLs-3. www.itrcweb.org/DNAPL-3.pdf
ITRC. 2003c. Technical and Regulatory Guidance for the Triad Approach: A New Paradigm forEnvironmental Management. ITRC/SCM-1. http://www.itrcweb.org/SCM-1.pdf
ITRC. 2004. Using Polyethylene Diffusion Bag Samplers to Monitor Volatile OrganicCompounds in Groundwater. ITRC/DSP-2 (in preparation).
Jackson, R.E., and P.E. Mariner. 1995. “Estimating DNAPL Composition and VOC Dilutionfrom Extraction Well Data.” Ground Water 33:407–14.
Jardine, P.M., R. O’Brien, G.V. Wilson, and J.-P. Gwo. 1998. “Experimental Techniques forConfirming and Quantifying Physical Nonequilibrium Processes in Soils.” In H.M.Selim and L. Ma (eds.), Physical Nonequilibrium in Soils: Modeling and Application,Ann Arbor Press, Chelsea, Mich.
Jardine, P.M., W.E. Sanford, J.P. Gwo, O.C. Reedy, D.H. Hicks, J.S. Riggs, and W.B. Bailey.1999. “Quantifying Diffusive Mass Transfer in Fractured Shale Bedrock.” WaterResources Res. 35(7):2015–30.
Jawitz, J.W., R.K. Sillan, M.D. Annable, P.S.C. Rao, and K. Warner. 2000. “In Situ AlcoholFlushing of a DNAPL Source Zone at a Dry Cleaner Site.” Environmental Science andTechnology, 34(17).

ITRC – Strategies for Monitoring the Performance of DNAPL Source Zone Remedies August 2004
88
Jin, M. 1995. “Surfactant Enhanced Remediation and Interwell Partitioning Tracer Test forCharacterization of DNAPL Contaminated Aquifers.” Ph.D. dissertation, University ofTexas at Austin, Austin, Tex.
Jin, M., M. Delshad, V. Dwarakanath, D.C. McKinney, G.A. Pope, K. Sepehrnoori, C.E.Tilburg, and R.E. Jackson. 1995. “Partitioning Tracer Test for Detection, Estimation andRemediation Performance Assessment of Subsurface Nonaqueous Phase Liquids.” WaterResources Research, 31(5):1201–11.
Kalusky, S.F., and K.S. Udell. 2002. “A Theoretical Model of Air and Steam Co-Injection toPrevent the Downward Migration of DNAPLs During Steam-Enhanced Extraction.” Journal of Contaminant Hydrology, 55:213–32.
Kavanaugh, M.C., P.S.C. Rao, and A.L. Wood. 2003. The DNAPL Remediation Challenge: IsThere a Case for Source Depletion? EPA/600/R-03/143.
Kostarelos, K. 1998. Ph.D. dissertation, University of Texas at Austin, Austin, Tex.
Kueper, B.H. and D.B. McWhorter. 1991. “The Behavior of Dense, Nonaqueous Phase Liquidsin Fractured Clay and Rock.” Ground Water, 29(5):716–28.
LaChance, J.C., R.S. Baker, J.P. Galligan, and J.M. Bierschenk. 2004. “Application of ThermalConductive Heating/In-Situ Thermal Desorption (ISTD) to the Remediation ofChlorinated Volatile Organic Compounds in Saturated and Unsaturated Settings.” Proceedings of the 4th International Conference on Remediation of Chlorinated andRecalcitrant Compounds, Monterey, Calif., May 24–27. Battelle, Columbus, Ohio(Preprint).
Lebron, C. 2004. Assessing the Feasibility of DNAPL Source Zone Remediation: Review of CaseStudies. Prepared by GeoSyntec Consultants. NFESC Report No. CR-04-002-ENV.
LFR Levine-Fricke Inc. 1997. Contamination Assessment Report, Former Sages Dry Cleaner,5800 Fort Caroline Road, Jacksonville, Florida, FDEP Facility Identification Number169600614.
LFR Levine-Fricke Inc. 1998a. Cosolvent Flushing Pilot Test Report. Former Sages DryCleaner, 5800 Fort Caroline Road, Jacksonville, Florida. FDEP Facility IdentificationNumber 169600614.
LFR Levine-Fricke Inc. 1998b. Pilot Test Work Plan. Former Sages Dry Cleaner, 5800 FortCaroline Road, Jacksonville, Fla.

ITRC – Strategies for Monitoring the Performance of DNAPL Source Zone Remedies August 2004
89
LFR Levine-Fricke Inc. 2000. Addendum, Contamination Assessment Report: Former Sages DryCleaner, 5800 Fort Caroline Road, Jacksonville, Florida 32211. FDEP FacilityIdentification Number 169600614.
Londergan, J.T., H.W. Meinardus, P.E. Mariner, R.E. Jackson, C.L. Brown, V. Dwarakanath,G.A. Pope, J.S. Ginn, and S. Taffinder, 2001. “DNAPL Removal from a HeterogeneousAlluvial Aquifer by Surfactant Enhanced Aquifer Remediation.” Ground WaterMonitoring and Remediation, (Fall):57–67.
Mackay, D.M., and J.A. Cherry. 1989. “Groundwater Contamination: Limits of Pump-and-TreatRemediation.” Environmental Science and Technology, 23(6):630–36.
Mariner, P.E., M. Jin, and R.E. Jackson. 1997. “A Method for Assessing Residual Napl Based onOrganic Chemical Concentrations in Soil Samples.” Ground Water Monitoring Review,11(2):128–36.
Mayer, A.S., and C.T. Miller. 1992. “The Influence of Porous Media Characteristics andMeasurement Scale on Pore-Scale Distributions of Residual Nonaqueous Phase Liquids.”Journal of Contamination Hydrology, 11:189–213.
McWhorter, D., and B. Kueper. 1996. “Mechanics and Mathematics of the Movement ofDNAPLs in Porous Media, in Dense Chlorinated Solvents and Other DNAPLs,” In J.F.Pankow and J.A. Cherry, (eds.), Groundwater History, Behavior, and Remediation,.Waterloo Press, Portland, Ore.
Meinardus, H.W., V. Dwarakanath, J.E. Ewing, G.J. Hirasaki, R.E. Jackson, M. Jin, J.S. Ginn,J.T. Londergan, C.A. Miller, and G.A. Pope. 2002. “Performance Assessment of NAPLRemediation in Heterogeneous Alluvium.” Journal of Contamination Hydrology,54(3–4):173–93.
Meinardus, H.W., V. Dwarakanath, R.E. Jackson, M. Jin, J.S. Ginn, and G.C. Stotler. 2000. “Full-scale characterization of a DNAPL source zone with PITTs.” In A.R. Gavaskarand A.S.C. Chen (eds.), Treating Dense Nonaqueous Phase Liquids (DNAPLs).Proceedings of the Second International Conference on Remediation of Chlorinated andRecalcitrant Compounds, Battelle Press, Columbus, Ohio.
National Research Council (NRC). 1994. Alternatives for Ground Water Cleanup. NationalAcademy Press, Washington, D.C.
NRC. 1997. Innovations in Groundwater and Soil Cleanup: From Concept toCommercialization. National Academy Press, Washington, D.C.

ITRC – Strategies for Monitoring the Performance of DNAPL Source Zone Remedies August 2004
90
NRC. 2003. Environmental Cleanup at Navy Facilities: Adaptive Site Management. NationalAcademy Press, Washington, D.C.
Naval Facilities Engineering Command (NAVFAC). 2002. Surfactant-Enhanced AquiferRemediation (SEAR) Design Manual. NFESC Technical Report TR-2206-ENV.http://enviro.nfesc.navy.mil/erb/restoration/technologies/remed/phys_chem/phc-33.asp
NAVFAC. 2003. Surfactant-Enhanced Aquifer Remediation (SEAR) Implementation Manual. NFESC Technical Report TR-2219-ENV.http://enviro.nfesc.navy.mil/erb/restoration/technologies/remed/phys_chem/phc-33.asp
Nelson, N.T., M. Oostrom, T.W. Wietsma, and M.L. Brusseau. 1999. “Partitioning TracerMethod for the In Situ measurement of DNAPL Saturation: Influence of Heterogeneityand Sampling Method.” Environmental Science and Technology, 33(22):4046–53.
Newell, C.J., R.L. Bowers, and H.S. Rifai, 1994. “Impact of Non-Aqueous Phase Liquids(NAPLs) on Groundwater Remediation,” American Chemical Society Symposium onMultimedia Pollutant Transport Models, Denver, Colo. www.GSI-net.com.
Newell, C.J., R.K. McLeod, and J.R. Gonzales. 1996. BIOSCREEN Natural AttenuationDecision Support System User’s Manual. U.S. EPA Report EPA/600/R-96/087.
Newell, C.J., H.S. Rifai, J.T. Wilson, J.A. Connor, J.A. Aziz, and M.P. Suarez. 2002. “Calculation and Use of First-Order Rate Constants for Monitored Natural Attenuation,”EPA Groundwater Issue Paper, EPA/540/S02/500, U.S. EPA, Ada, Okla. http://www.epa.gov/ada/pubs/issue/540S02500.htm.
Pankow, J.F., and Cherry, J.A. (eds.). 1996. Dense Chlorinated Solvents and Other DNAPLs inGround Water, Waterloo Press, Portland, Ore.
Parker, B.L., J.A. Cherry, and T.A. Al. 2002. “Passive Permanganate Remediation of a SolventDNAPL Source Zone.” In A.R. Gavaskar and A.S.C. Chen (eds.), Treating DenseNonaqueous Phase Liquids (DNAPLs). Proceedings of the Third InternationalConference on Remediation of Chlorinated and Recalcitrant Compounds, Battelle Press,Columbus, Ohio.
Parker, B.L., Gillham, R.W., and Cherry, J.A., 1994. “Diffusive Disappearance of Immiscible-Phase Organic Liquids in Fractured Geologic Media” Groundwater, 32(5):805-20.
Powers, S.E., L.M. Abriola, and W.J. Weber, Jr. 1994. “An Experimental Investigation ofNonaqueous Phase Liquid Dissolution in Saturated Subsurface Systems: Transient MassTransfer Rates.” Water Resources Research 30(2):321–32.

ITRC – Strategies for Monitoring the Performance of DNAPL Source Zone Remedies August 2004
91
Powers, S.E., W.H. Anckner, and T.F. Seacord. 1996. “Wettability of NAPL-ContaminatedSands.” Journal of Environmental Engineering, 122(10):889–96.
Rao, P.C.S., 2003. “DNAPL Source Zone Remediation: What is the Case for Partial SourceDepletion?” Presentation to the Meeting of the Technical Support Project. Seattle,Washington. www.epa.gov/tio/tsp/download/2003_meeting/seattletechnical.pdf
Rao, P.C.S., J.W. Jawitz, C.G. Enfield, R.W. Falta, M.D. Annable, and A.L. Wood. 2001.“Technology Integration for Contaminated Site Remediation: Cleanup Goals &Performance Criteria.” In Groundwater Quality: Natural and Enhanced Restoration ofGroundwater Pollution (Proceedings of the Groundwater Quality 2001 Conference heldat Sheffield, UK, June 2001). IAHS Pub. No. 275, pp. 571–78.
Sale, T., and D.B. McWhorter. 2001. “Steady-State Mass Transfer from Single ComponentDNAPLs in Uniform Flow Fields.” Water Resources Research, 37(2):393–404.
Schabenberger, O., and F.J. Pierce. 2001. Contemporary Statistical Models for the Plant and SoilSciences, CRC Press, Boca Raton, Fla.
Schwarz, R., T. Ptak, H. Holder, and G. Teutsch. 1998. “Groundwater Risk Assessment atContaminated Sites: A New Investigation Approach.” In Groundwater Quality:Remediation and Protection, IAHS Publication No. 250, ISSN 0144-7815, 68-71.
Siegrist, R.L., and B. Satijn. 2002. “Performance Verification of In Situ RemediationTechnologies.” Report from the 2001 Special Session of the NATO/CCMS Pilot Studyon Evaluation of Demonstrated and Emerging Technologies for the Treatment ofContaminated Land and Groundwater. EPA 542-R-02-002.www.epa.gov/swertio1/pubipart.htm#nato.
Song, D.L., M.E. Conrad, K.S. Sorenson, and L. Alvarez-Cohen. 2002. “Stable Carbon IsotopeFractionation during Enhanced In Situ Bioremediation of Trichloroethene.”Environmental Science and Technology, 36(10):2262–68.
Stegemeier, G.L., and H.J. Vinegar. 2001. “Thermal Conduction Heating for In-Situ ThermalDesorption of Soils.” In Chang H. Oh (ed.), Hazardous and Radioactive WasteTreatment Technologies Handbook, CRC Press, Boca Raton, Fla..
Strategic Environmental Research and Development Program (SERDP). 2002a. Impacts ofDNAPL Source Zone Treatment: Experimental and Modeling Assessment of Benefits ofPartial Source Removal. CU-1295.
SERDP. 2002b. Development of Assessment Tools For Evaluation of The Benefits of DNAPLSource Zone Treatment. CU-1293.

ITRC – Strategies for Monitoring the Performance of DNAPL Source Zone Remedies August 2004
92
Suthersan, S.S. 1997. Remediation Engineering: Design Concepts. CRC Press, Inc., BocaRaton, Fla.
Teutsch, G., H. Rugner, D. Zamfirescu, M. Finkel, and M. Bittens. 2001. “Source Remediationvs. Plume Management: Critical Factors Affecting Cost-Efficiency.” LandContamination and Reclamation, 9(1): 128–39.
Thermal Remediation Services (TRS). 2003. “Three-Phase Heating? Six-Phase Heating? WhichIs better?” Technical white paper by Thermal Remediation Services, Inc.www.thermalrs.com/TRS_docs/ThreePhase_vsSixPhase.pdf
U.K. Environment Agency. 2003. An Illustrated Handbook of DNAPL Transport and Fate inthe Subsurface. R&D Publication 113.www.environment-agency.gov.uk/commondata/105385/dnapl_565627.pdf
U.S. Army Corps of Engineers (USACE). 2002. Engineering and Design: Soil Vapor Extractionand Bioventing. EM 1110-1-4001.www.usace.army.mil/usace-docs/eng-manuals/em1110-1-4001/toc.htm
USACE. In preparation. In Situ Thermal Remediation. UFC 3-280.www.hnd.usace.army.mil/techinfo/
U.S. Department of Energy (DOE). 2002. Guidance for Optimizing Ground Water ResponseActions at Department of Energy Sites. Office of Environmental Management.
U.S. Environmental Protection Agency (U.S. EPA). 1991. A Guide to Principal Threats andLow Level Threat Wastes. EPA 9380.3-06FS.www.epa.gov/oerrpage/superfund/resources/gwdocs/threat.pdf
U.S. EPA. 1992. RCRA Ground-Water Monitoring: Draft Technical Guidance Office of SolidWaste, Washington, D.C. EPA/530-R-93-001.http://www.epa.gov/correctiveaction/resource/guidance/sitechar/gwmonitr/rcra_gw.pdf
U.S. EPA. 1993. Guidance for Evaluating Technical Impracticability of GroundwaterRestoration. OSWER Directive 9234.2-25.www.epa.gov/oerrpage/superfund/resources/gwdocs/techimp.htm
U.S. EPA. 1994. DNAPL Site Characterization. OSWER Publication 9355.4-16FS.www.epa.gov/oerrpage/superfund/resources/gwdocs/dnapl.pdf
U.S. EPA. 1995a. Superfund Ground Water RODs: Implementing Change This Fiscal Year. OSWER Memorandum 9335.5-03P, EPA/540-F-99-005.www.epa.gov/superfund/resources/remedy/pdf/540f-99005-s.pdf

ITRC – Strategies for Monitoring the Performance of DNAPL Source Zone Remedies August 2004
93
U.S. EPA. 1995b. Cost and Performance Report: Soil Washing at the King of Prussia TechnicalCorporation Superfund Site Winslow Township, New Jersey. U.S. EnvironmentalProtection Agency, OSWER, Technology Innovation Office.www.clu-in.org/PRODUCTS/COSTPERF/SOILWASH/KOP.HTM
U.S. EPA. 1996a. Presumptive Response Strategy and Ex-Situ Treatment Technologies forContaminated Groundwater at CERCLA Sites. OSWER Directive 9283.1-12.www.epa.gov/superfund/resources/gwguide/index.htm
U.S. EPA. 1996b. Guidance for the Data Quality Objectives Process (QA/G-4). EPA/600/R-96/055. www.epa.gov/quality/qs-docs/g4-final.pdf
U.S. EPA. 1997. Rules of Thumb for Superfund Remedy Selection. OSWER Directive9355.0-69. www.epa.gov/superfund/resources/rules/rulesthm.pdf
U.S. EPA. 1999a. Use of Monitored Natural Attenuation at Superfund, RCRA Corrective Action,and Underground Storage Tank Sites. OSWER Directive 9200.4-17P. www.epa.gov/swerust1/directiv/d9200417.pdf
U.S. EPA. 1999b. Cost and Performance Summary Report: Six-Phase Heating at a FormerManufacturing Facility, Skokie, Illinois. OSWER, Technology Innovation Office.
U.S. EPA. 1999c. Groundwater Cleanup: Overview of Operating Experience at 28 Sites. OSWER, Technology Innovation Office. EPA 542-R-99-006.
U.S. EPA. 2000a. EPA Region 6 Corrective Action Strategy.www.epa.gov/earth1r6/6pd/rcra_c/pd-o/riskman.htm
U.S. EPA. 2000b. Treatment Technologies for Site Cleanup: Annual Status Report, Tenth Ed.http://clu-in.org/products/asr/
U.S. EPA. 2000c. Guidance for Data Quality Assessment: Practical Methods for Data Analysis. EPA QA/G-9. www.epa.gov/quality/qs-docs/g9-final.pdf
U.S. EPA. 2001a. Development of Recommendations and Methods to Support the Assessment ofSoil Venting Performance and Closure. ORD, EPA 600/R-01/070.www.epa.gov/ada/download/reports/epa_600_r01_070.pdf
U.S. EPA. 2001b. Fractured Bedrock Focus Area.http://clu-in.org/databases/#Fractured_Bedrock_Focus_Area
ITRC – Strategies for Monitoring the Performance of DNAPL Source Zone Remedies August 2004
94
U.S. EPA. 2002a. Handbook of Groundwater Protection and Cleanup Policies for RCRACorrective Action. OSWER, EPA/530/R-01/015.www.epa.gov/epaoswer/hazwaste/ca/resource/guidance/gw/gwhandbk/gwhndbk.htm
U.S. EPA. 2002b. Guidance for Choosing a Sampling Design for Environmental DataCollection. EPA QA/G-5S. www.epa.gov/quality/qs-docs/g5s-final.pdf
U.S. EPA. 2002c. Ground-Water Sampling Guidelines for Superfund and RCRA ProjectManagers. EPA 542-S-02-001. www.epa.gov/tio/tsp/download/gw_sampling_guide.pdf
U.S. EPA. 2003a. In Situ Thermal Treatment of Chlorinated Solvents: Fundamentals and FieldApplications. OSWER, EPA/542/R-03-012.
U.S. EPA. 2003b. Using Dynamic Field Activities for On-Site Decision Making: A Guide forProject Managers. OSWER, EPA/540/R-03/002.www.epa.gov/superfund/programs/dfa/guidoc.htm
U.S. Geological Survey. 2003. “Methodology for Estimating Times of Remediation Associatedwith Monitored Natural Attenuation.” Water Resources Investigation Report 03-4057.http://sc.water.usgs.gov/publications/abstracts/WRIR-03-4057-Abstract.html
Verschueren, K. 1983. Handbook of Environmental Data on Organic Chemicals, 2nd ed., VanNostrand Reinhold, New York, p.1134.
Vinegar, H.J., G.L. Stegemeier, F.G. Carl, J.D. Stevenson, and R.J. Dudley. 1999. “In SituThermal Desorption of Soils Impacted with Chlorinated Solvents.” Proceedings of theAnnual Meetings of the Air and Waste Management Association, Paper No. 99-450.
Wiedemeier, T.H., H.S. Rifai, C.J. Newell, and J.W. Wilson. 1999. Natural Attenuation of Fuelsand Chlorinated Solvents, John Wiley & Sons, New York.

APPENDIX A
List of Acronyms

A-1
Appendix A. List of Acronyms
ACL alternate cleanup levelANOVA Analysis of VarianceAFB Air Force BaseAFCEE Air Force Center for Environmental ExcellenceASTM American Society for Testing and Materialsbgs below ground surfaceCERCLA Comprehensive Environmental Restoration and Cleanup Liability Actcfm cubic feet per minuteCOC contaminant of concernCOD chemical oxygen demandCSM conceptual site modelCVOC chlorinated volatile organic compoundDCE dichloroethylene or dichloroethene DNAPL dense, nonaqueous-phase liquidDO dissolved oxygenDoD Department of DefenseDOE Department of EnergyDPT direct-push technologyDQO data quality objectiveDUS dynamic underground strippingEPA U.S. Environmental Protection AgencyERH electrical resistance heatingERT electrical resistance tomographyESTCP Environmental Security Technology Certification Programft feet or footGC gas chromatograph GPR ground penetrating radarH2O2 hydrogen peroxideHPO hydrous pyrolysis/oxidationHSA hollow-stem augerINEEL Idaho National Engineering and Environmental LaboratoryISCO in situ chemical oxidationISTD in situ thermal desorption (or destruction)ISTR in situ thermal remediationITRC Interstate Technology & Regulatory CouncilLUST leaking underground storage tankLNAPL light, nonaqueous-phase liquidmm millimeterMCL maximum contaminant levelMIP membrane interface probeMNA monitored natural attenuationMS mass spectrometryMSL mean sea levelMTBE methyl tertiary butyl ether

A-2
NAPL nonaqueous-phase liquidNAS Natural Attenuation SoftwareNFA no further actionNRC National Research CouncilO&M operation and maintenanceORP oxidation reduction potentialOST Office of Science and TechnologyPAH polynuclear aromatic hydrocarbonPCBs polychlorinated biphenylsPCE tetrachlorethylene (perchloroethene)PCU power control unitPDB passive diffusion bagPID photoionization detectorPITT partitioning interwell tracer testPMA photo-acoustic multigas analyzerppm parts per millionPVC polyvinyl chlorideQC quality controlRAO remedial action objectivesRCRA Resource Conservation and Recovery ActROD Record of DecisionRPO remedial process optimizationSEAR surfactant-enhanced aquifer remediationSEE steam-enhanced extractionSERDP Strategic Environmental Research and Development ProgramSVE soil vapor extractionSVOC semivolatile organic compoundSWMU solid waste management unitTAN Test Area NorthTCA trichloroethaneTCE trichloroethene (trichloroethylene)TI technical impracticabilityTMP temperature monitoring pointTOC total organic carbonTPH total petroleum hydrocarbonUSACE U.S. Army Corps of EngineersVC vinyl chlorideVOC volatile organic compound

APPENDIX B
Case Studies

B-1
Appendix B. Case Studies
The following case studies are intended to highlight performance assessment approaches used atsome recent DNAPL source treatment projects. Cost data are included where it was reasonablyavailable; however, costs for performance assessment are typically not provided as detailedexpenses.
In half the instances, the information contained in the case studies was provided by the site operatoror technology vendor. In the other half, the state regulator or a researcher overseeing the projectprovided details. The case studies have not been independently reviewed by third parties.
The case studies are organized by technology. Table B-1 below provides a summary of the casestudy sites and directs the reader to the appropriate page.
Table B-1. Summary of Case StudiesCase Study Technology Geology Contaminant Page
Maska DryCleaning Site
SVE and AirSparging
Glacio-lacustrine sandand silty sand
PCE B-3
Cape CanaveralLC34
ERH, SEE, andISCO
Surficial fill and siltysands
TCE and DCE B-8
Young-RaineySTAR Center
SEE and ERH Surficial fill and siltysands
TCE, toluene, andother solvents
B-18
Air Force Plant 4,Building 181
ERH Surficial fill and silty,clayey sand andgravel
PCE and degradationproducts
B-23
Paducah GaseousDiffusion Plant,Bldg C-400
ERH Sand and graveloverlying interbeddedsand/silt/clay
TCE and technetium B-31
NSB Kings Bay,Site 11
ISCO (hydrogenperoxide)
Surficial fill and siltysands
PCE, TCE, and DCE B-36
Broward CountySite
ISCO(permanganate)
Medium sands TCE, TCA, and DCE B-40
INEEL Test AreaNorth
Enhanced ISB Fractured basalt PCE, TCE,radionuclides
B-47

B-2
This page intentionally left blank.

B-3
CASE STUDY 1. MASKA DRY CLEANING SITEBRADFORD, VERMONT
TECHNOLOGY: Soil vapor extraction and air spargingSCALE: FullGEOLOGY: Glacio-lacustrine sand and silty sandCONTAMINANTS: PCE
Background. The site is located on a glacio-lacustrine terrace on the west side of the ConnecticutRiver in Bradford, Vermont. The site was used for manufacturing of clothing by two differentcompanies from the early 1970s through 1998. During the manufacturing, the clothing was drycleaned on site. During the operation of the facilities, dry cleaning chemicals were released on siteby both companies. The facilities had on-site septic, and the wastewater from the solvent recoverystill was piped directly to a subsurface leach field. Chemical analyses of water from this machineryindicated that the water being disposed of on site had tetrachloroethene (PCE) in it at concentrationswell above solubility. Still bottoms were washed out in facility sinks connected to the septic system.Floor drains in the facility buildings were also connected to on-site leachfields. One company thatoccupied the facility reportedly used PCE to clean the floors. The waste from this operation wasdisposed of in the floor drains. PCE was also sprayed on knitting machines to keep them clean.
The buildings were concrete slab-on-grade construction. Dry-cleaning machinery was located onthe concrete slab; however, for vibration protection, a square area where the dry cleaner was locatedhad been cut completely to the subsurface and an antivibration cork liner installed along theconcrete. When the dry cleaners were operated, there were boilovers and releases of PCE. Thereleased PCE would drip through the antivibration pad to the subsurface. There were also reportedlyreleases of PCE when it was carried in buckets from aboveground storage tanks to the dry cleaningmachinery and PCE saturated clothing was taken out of the dry cleaning machinery.
The operations at this facility lead to on-site releases of significant quantities of PCE as unusedchemical, used chemical (used both as a dry cleaning solvent and as a solvent to clean floors andmachinery), and dissolved in wastewater. Very strong indications that PCE exists as DNAPL in thesubsurface were found in both the unsaturated and the saturated zones.
Conceptual Site Model. Very high concentrations of PCE were found in the vadose zone soilsbelow the location of the dry cleaners and in a subsurface leachfield area and associated with acesspool into which the floor drains from one facility discharged. Based on known releases of PCEas DNAPL to the vadose zone, it is believed that this PCE resulted in the formation of a large PCEvapor plume migrating outwards from the source areas and contacting the top of the water table.Discrete interval sampling of the top of the water table showed that the PCE waspartitioning/dissolving from the vapor plume to the groundwater causing a dissolved PCE plume inthe upper portion of the groundwater. Infiltrating recharge waters dissolved some of the vadosezone DNAPL PCE to carry PCE in them to the saturated zone.
While no pooled PCE DNAPL was found during the site investigations, very high concentrationsof PCE in groundwater and the knowledge that PCE DNAPL was disposed on site providessufficient evidence that DNAPL exists in the subsurface below the water table at the site. The sands

B-4
at the site are underlain by a fine silty layer ridge, the top of which is below the manufacturingfacility. It appears that DNAPL released on site traveled vertically downwards through the vadosezone to the saturated zone and downwards through the saturated zone (leaving behind residual-phaseDNAPL) until it encountered the fine silt ridge. This appears to have acted as a low-permeabilitybarrier that directed the DNAPL to have flow downwards along the subsurface slope of the ridge.The DNAPL apparently flowed on top of this low-permeability layer to below the Connecticut Riverlocated east of the facility.
The DNAPL does not appear to have migrated any further east of the site as the releases of DNAPLstopped, and there was no longer a driving force to move the DNAPL. The majority of the DNAPLin the saturated zone probably now exists as residual-phase ganglia or in small lenses controlled bythe stratigraphy. The PCE dissolved in groundwater as the groundwaters move by the DNAPLdischarges to the Connecticut River. The PCE is not present in the river in measurableconcentrations due to the flow of the river compared to the contaminant transport flux to the river.
The soil vapor plume was causing a dissolved PCE plume to grow and caused a potential indoorhealth risk in one house due to apparent infiltration into the basement through a stone foundation.The groundwater plume negatively affected property values and severely limited development inthe industrial park where this facility is located. The large PCE plume and presence of DNAPL hasalso prevented the use of groundwater on potential residential properties along the ConnecticutRiver.
Performance Objective. When determining the appropriate remedy for this site, the State ofVermont determined that a full removal of all DNAPL would not be possible considering thegeology and the available technology. The primary goals of the remediation were to prevent riskto human health and the environment, to prevent DNAPL or the dissolved PCE plume fromspreading, and to permanently reduce the size of the dissolved and vapor plumes. The regulatorsrequired that the soil vapor plume be remediated and required the size of the residual source ofDNAPL in the vadose and saturated zones to be reduced enough to remediate the vapor plume inthe vadose zone and to allow the dissolved plume to become smaller. No specific amount of PCEor DNAPL to be removed from the subsurface was defined.
The remediation also targeted the removal of DNAPL from the shallow portion of the aquifer andthe vadose zone (see above description of the geology and location of contamination). The DNAPLat 90 ft bgs appears to be immobile, and the aqueous-phase plume emanating from this DNAPL isdischarging into the Connecticut River (where, as described above, it does not adversely affect waterquality in the river) and will not likely spread significantly laterally. The depth of the DNAPL inthe deeper portions of the plume where it has apparently migrated would preclude the simpleremedial technology used at this site, and the DNAPL does not need to be remediated as it isimmobile and will not cause risk to human health and the environment (institutional controls willprevent well drilling into this plume).
The State of Vermont decided that the performance of the remediation could be assessed by thelong-term observable effect on the plume. The plume needed to be shrunk and prevented fromexpanding once the active remedial system was turned off. The vapor plume had to be removedfrom the subsurface and not rebound after ceasing active remediation.

B-5
Technology Description. The primary remedial action at this site was a combination of SVE (toaddress the DNAPL and soil vapor plume) in the vadose zone, air sparging coupled with SVE (toremove a portion of the DNAPL source) in the saturated zone, and excavation of contaminated soilsin and near the leachfield (associated with washing floors with PCE). Deed restrictions were placedon the areas where contamination will remain after remediation. A low-tech subsurface heatingsystem was installed in an area of likely DNAPL increased the amount of PCE that could be strippedfrom the subsurface by the sparging system.
Performance Monitoring and Verification. The environmental consultant for the responsibleparties, in coordination with the Vermont regulators, determined that a simple and inexpensivemethod of performance monitoring and verification would be adequate to assess the effect of theremediation. The parties determined that measuring groundwater, soil gas, and soil quality wouldindirectly indicate whether the DNAPL had been sufficiently remediated for the site to meetremedial goals. The performance assessment was a combination of the following activities.
Groundwater Quality Monitoring. Reducing the size of the dissolved PCE plume was one theprimary goals of the remediation; therefore, periodic groundwater quality monitoring was initiatedto evaluate the performance of the remediation. Active remediation was considered complete whenthe areal extent of groundwater contamination was reduced to a size that would not likely pose athreat to human health or to the environment and would be less of a deterrent on potentialdevelopment in the area. This condition was considered an indication that some of the short-termgoals of the remediation had been met. To ensure that contaminant concentrations do not reboundand that the plume does not expand past the post-remediation boundaries, long-term groundwaterquality monitoring is continuing.
Soil Vapor Monitoring. As soil vapor and vadose zone DNAPL had been a significant issue at thissite, it was necessary to demonstrate that contaminants were no longer present in soil vapor atconcentrations high enough to support expanding the dissolved PCE plume or soil vapor plume orbecome a risk to indoor air in potential future residential development. As the contaminant at thesite is volatile, the lack of vapor-phase contamination in the areas where DNAPL was suspectedfollowing remediation strongly indicates that the remediation removed the bulk of the DNAPL andPCE from the vadose zone.
Soil Quality. Soil quality above and below the water table has been attempted to be used to indicatethe effect of the remediation on the DNAPL. However, due to the residual nature of the DNAPLand the lack of knowledge of exactly where DNAPL exists as residual phase or in small lenses, soilsampling has not served to prove that remediation was successful. While soil samples do indicatea likely reduction in the presence of PCE in soil, there is no way to ensure that a soil sample wascollected from the correct location due to the nature of DNAPL distribution. The indirect methodof assessing the long-term effect on the groundwater and soil vapor plumes provided a bettermethod of assessing whether the remediation reached the goals.
Contaminant Removal and Removal Rates. Monitoring of contaminant removal rates provided anindication of whether or not the remedial systems were removing significant concentrations of PCEfrom the subsurface. Once the extraction of PCE became asymptotic, it likely indicated that theremediation had removed much of the readily available contaminant in the source zone and waslimited to removing contamination at the rate of diffusion from the sorbed contaminant to the

B-6
extraction system. This by itself, however, was not a good indication that the remediation wascomplete. Because the amount of DNAPL and dissolved PCE released on-site was not known, anestimate of the percentage of contaminant removed from the subsurface could not be determined.The remediation was not designed to remove all of the contamination at the site. Instead, it wasdesigned to remove enough DNAPL from the vadose zone to halt the production of a significant soilvapor plume; and to remove enough DNAPL from the shallow source zone to reduce the size of thePCE plume. Therefore, while tracking the amounts of contaminant removed was useful to indicatethe progress of the remediation, it did not help make final decisions regarding how long the remedialsystem would need to operate.
Costs. Costs to assess performance of SVE on soil vapor plume and groundwater plume averaged$25,000 per quarter during active remediation. These costs are expected to decrease significantlyas the number of sampling points decreases and the frequency of sampling decreases. Confirmatorysoil sampling and analysis will no longer be a cost once the effects of the remediation are confirmed.
Lessons Learned. While the long-term effectiveness of the remediation is still being assessed, wehave learned that a low-tech, low-cost remediation can be effective at a DNAPL site. In this case,a low-tech SVE/air sparge system coupled with limited subsurface heating appears to have removedthe majority of residual-phase DNAPL from the vadose zone and enough DNAPL from the sourcearea to reduce the size of the PCE plume. The remediation did not attempt to remove all DNAPLfrom the subsurface or completely restore groundwater quality but is protective of human health andthe environment (with the placement of institutional controls). It prevents the plume fromexpanding, removes the great majority of DNAPL mass in the vadose zone (therefore preventingproblems associated with a large soil vapor plume), and prevents people from coming into contactwith the contaminated groundwater through institutional controls and monitoring.
Soil sampling was found to be helpful in understanding the effect of the remedial activities but byitself could not fully show the effects of the remediation. It turned out that a “weight of evidence”of the effectiveness of the remediation of the soil vapor and aqueous-phase plume provided strongindications that the DNAPL at the site was remediated enough to meet the remedial goals. We alsodetermined, however, that if the remedial goal was to remove all DNAPL, this remedial approachwould likely not be an effective remediation technique.
Contact Information
Michael B. SmithVermont DECWaterbury, VT(802) [email protected]
Mr. Jeffrey NoyesHeindel & NoyesBurlington, VT(802) [email protected]

B-7
CASE STUDY 2. CAPE CANAVERAL LC34CAPE CANAVERAL AIR STATION, FLORIDA
TECHNOLOGY: Electrical resistance heating, steam enhanced extraction, and ISCOSCALE: DemonstrationGEOLOGY: Surficial fill and silty sandsCONTAMINANTS: TCE, DCE
NASA’s Launch Complex 34 (LC34) at Cape Canaveral Florida was the site of side-by-side testingof three DNAPL source remediation technologies between 1999 and 2001 in a project jointlysponsored by NASA, DOE, EPA, and DoD (Navy and Air Force). Technologies tested included insitu chemical oxidation (ISCO), electrical resistance heating (ERH), and steam enhanced extraction(SEE).
Background. LC34 was used as a launch site for Saturn rockets 1960–1968. Historical recordssuggest that large amounts of TCE were used at the site to flush rocket engines during testing on thelaunch pad and to degrease engine parts in the Engineering Support Building (ESB) located nearby.The demonstrations were conducted adjacent to the ESB where preliminary field characterizationactivities indicated the presence of an extensive region of subsurface DNAPL contamination. SpentTCE was discharged from the ESB directly to the ground surface in the region of knowncontamination and into floor drains connected by clay tile passing through the contaminated regionto a nearby septic system. It is believed that the joints in the clay tile pipe leaked.
The federal agencies identified above formed the Interagency DNAPL Consortium (IDC) to testthree innovative DNAPL source zone treatment technologies. The primary objective of thedemonstrations was to evaluate the technologies for cost and performance in treating DNAPLcontamination under very similar site conditions. In addition, each demonstration was designed toreveal lessons learned that could be integrated into future applications of the technologies to improvetheir performance and reduce costs. All vendors submitted designs to maintain hydraulic controlof their respective test plots. However, the ISCO design called for recirculation of oxidant solution,which would require an injection permit. Significant delays and added cost were anticipated inresolving this issue and the IDC and its technical advisory group ultimately decided that the vendorshould be permitted to proceed without provisions for recirculation.
The technology testing region near the ESB was subdivided into three demonstration plots. Eachrectangular plot was 50 x 75 ft in surface dimensions and extended to a depth of 45 ft. A 15-ft bufferseparated adjacent plots. A portion of the footprint for each plot underlay the ESB to evaluate theability of the technologies to remove contamination underneath a structure, as shown in Figure B2-1.
The shallow subsurface lithology at the site is comprised of a fine, sandy Upper Sand Unit (USU;approximately 20–25 ft thick) underlain by a silty/clayey sand Middle Fine Grained Unit (MFGU;approximately 5–10 ft thick) and a coarse, sandy Lower Sand Unit (LSU; approximately 10–15 ftthick). A thin, clay-rich, Lower Clay Unit (LCU) underlies the Lower Sand Unit and occurs at adepth of approximately 45 ft bgs. Overall, the approximate total amount of TCE contaminationobserved in the vicinity of the test plots is distributed among the major lithologic units as follows:USU 5%, MFGU 26%, and LSU 69%.

B-8
Engineering Support Building
Steam Six Phase Heating
1 2
3 5 4
6
8 7 9
1110 12 40 42
ISCO
13 14 15
16
17 18
19 20 21
23
25 24
34
333231
3837
3635
41
41B
39
Figure B2-1. Schematic map of the LC34 site and the three DNAPLsource treatment cells. Approximate locations of soil borings are noted.
In Situ Chemical Oxidation. In situ chemical oxidation using potassium permanganate (KMnO4)was one of the first two demonstrations deployed; oxidant injection began in September 1999.There were three phases of injection (September–October, 1999; November, 1999; March–April,2000) that involved a total of over 800,000 gal of oxidant solution (average concentrationapproximately 2%), a volume approximately three times the pore volume of the demonstration plot.On a volumetric basis, nearly 90% of the injection occurred during Phases 1 and 3 and overall, theLSU received more than half of the KMnO4 solution. Oxidant solution was injected throughmultiple soil lances that were advanced in 2-ft increments to a depth of 45 ft near the LSU–LCUcontact. The demonstration design and operation did not include any provision to ensure hydrauliccontrol and a comparison of the amount of fluid injected vs. pore volume as well as evaluation ofmonitoring data from a network of wells and soil cores from locations surrounding the plotfollowing the demonstration illustrate that significant fluid displacement occurred.
Electrical Resistance Heating. Electrical resistance heating was deployed as a combination of boththree- and six-phase heating during the late summer of 1999. The original electrodes werecompleted in both the lower part of the LSU and the MFGU, although electrodes were added to theUSU midway through the demonstration to improve heating in this zone and avoid vaporcondensation. The vacuum vapor extraction system was deployed in the vadose zone at a depth ofabout 3–5 ft bgs. Heating began in August 1999 and continued until late September when the firstof a series of hurricanes and tropical storms impacted LC34 necessitating a shutdown of power.These storms resulted in a rise of the water table in the test plot to the ground surface rendering thevapor recover system inoperative and caused damage to some of the equipment. In addition, lateralmigration of shallow groundwater during this time carried high concentrations of dissolved TCE toa nearby drainage ditch where it discharged to the surface. The vapor recovery system wasredesigned, a storm water diversion modification was implemented, and heating was resumed inmid-December. In spring, 2000 there was another shutdown lasting 48 days. Active heatingcontinued until final shutdown in mid-July, 2000.

B-9
As a result of the hurricanes and tropical storms occurring early in the demonstration, an unknownquantity of TCE was transported laterally beyond the plot boundaries in a northwesterly direction.Four to five months after the weather-related transport, a large zone of dead grass developed to thenorthwest of the ERH plot, and the presence of a plume of hot, shallow groundwater was observedunderlying this same region. The location and timing of the plume is consistent with displacementof hot water from the plot due to active oxidant injection in the ISCO plot. In an apparentlyunrelated observation, significant perturbations also were noted in the vertical temperature profileat a monitoring location about 15 ft beyond the eastern perimeter of the plot. The temperature dataindicated that contaminated hot water was migrating laterally outward from the plot both at thesurface of the water table and the top of the LSU. This effect was observed throughout thedemonstration and probably was related to thermally driven flow caused by the ERH process asmodified by site lithologic features.
Steam Enhanced Extraction. The SEE demonstration began in July, 2001 and continued untilDecember, 2001. For this demonstration steam was injected in two wells located in the central partof the plot and steam/groundwater extraction wells were located along the perimeter of the plot. Theobjective of this arrangement was to ensure hydraulic control, a goal that was confirmed by carefulmonitoring of subsurface temperatures throughout and surrounding the plot. One outcome of thisdesign was the fact that as much as 200,000– 400,000 gal. of groundwater from outside the treatmentplot was captured by the extraction wells. The amount of TCE associated with this water probablyamounted to several hundreds of kilograms.
The design of this demonstration incorporated steam and co–air injection. The purpose of the airwas to create a noncondensible gas phase in the subsurface to help mitigate the potential forformation of a condensation front of TCE that might lead to uncontrolled downward migration.
Performance Objectives. The primary objective of each demonstration was to estimate the amountof TCE removed from the plots, with a general performance criterion for the vendors of at least 90%removal of TCE DNAPL. Secondary performance objectives include the following:
• verify that TCE did not migrate to surrounding regions due to the demonstrations,• evaluate aquifer quality before and after the demonstrations,• verify that the demonstrations do not impact one another or determine the extent of the
interaction, and,• verify operating requirements and costs of the technologies.
Although the eventual target for the LC34 aquifer is to achieve Florida state–mandated groundwatercleanup goals (3 :g/L of TCE, 70 :g/L of cis-1,2-DCE, and 1 :g/L of vinyl chloride), a morefeasible and economically viable goal of 90% reduction of TCE DNAPL mass was agreed upon asthe primary objective for the demonstration projects. The ultimate end state goal for the site is tomeet MCLs in groundwater, but if concentrations can be brought down to within 100 times theMCLs, then state regulators have indicated they would be satisfied and, in accordance with theFlorida DEP’s Natural Attenuation Default Source Concentrations, may allow active source zoneremediation to be shut down as long as natural attenuation processes are occurring.
Performance Monitoring and Verification. The primary objective of performance assessment forall three technologies tested was to estimate the percent reduction in mass of TCE, with a goal of

B-10
>90% mass removal. Predemonstration characterization to determine the mass of TCE present inthe three demonstration plots was accomplished by taking a series of continuous soil cores from thesurface to the depth of the Lower Clay Unit. Specific core locations for each demonstration plotwere determined by an unaligned systematic sampling design (Battelle, 2003) in which a 3- x 4-ftcoarse grid subdivided the cell into 12 equal area elements. A 4- x 4-ft fine-mesh grid was overlaidon each coarse grid element, and a core location was selected from among the grid nodes of the finemesh by using a table of random numbers.
Soil cores were collected by a direct-push rig and were obtained with split spoon samplers in 2-ftincrements and preserved in the field with methanol prior to transport to a laboratory for analysis.Following completion of each demonstration, a second set of cores was obtained from locationsselected, as before, by the unaligned systematic sampling design and analyzed to determine the massof TCE remaining after treatment. The average lateral separation of the paired before/after corelocations was approximately 4.5 ft.
Post-treatment soil cores obtained from the ERH and SEE demonstration plots were at elevatedtemperatures (up to 90°C). Special procedures were devised and tested to ensure that no significantloss of TCE occurred due to evaporation. In general, 2-ft segments of core were obtained in splitspoon samplers, the ends capped, and the entire assembly cooled in an ice bath until near-ambienttemperatures were reached. Subsequent handling, preservation, and analysis procedures wereidentical to those used for all other soil core samples. The effectiveness of this method was verifiedby spiking several hot test cores with a known amount of surrogate volatile tracer and confirmingthat complete recovery was achievable.
In addition to the statistically based sampling program, one set of duplicate soil cores was obtainedfrom each plot before and after treatment to determine the magnitude of variation in TCEconcentrations from what were intended to be nearly identical locations. Figure B2-2 illustratesseveral examples of duplicate core results. For the pair SB-210/SB-210B, the profiles are verysimilar and the total mass of TCE measured in each core agrees to within approximately 4%. Forthe other two pairs of cores shown, there is good to fair agreement of the general trends of the depthprofiles, but there are specific zones where significant differences in TCE concentrations existbetween the members of each pair. These differences tend to occur near the bottom of the profiles(near the top of the Lower Clay Unit), where DNAPL might be expected to be locally pooled.Comparison of paired cores SB-41/SB-41B and SB-217/SB-317 reveals total TCE masses that differby a factor of up to four times for the duplicates. These comparisons are important because theyconfirm that significant heterogeneities in the lateral and horizontal distribution of DNAPL can existover short distances.

B-11
Figure B2-2. Concentration depth profiles for TCE in soils for two pairs of duplicate cores. Ineach case, the paired core holes are located within 3 ft of one another.
The TCE concentration data for the cores at LC34 were converted to total effective mass of TCE ineach plot by two different methods (Buxton and Gavaskar, 2002). One approach was to estimateTCE mass by 3-D contouring of TCE concentration results using the EarthVisionTM softwarepackage, which linearly interpolates among TCE concentration data in soil. The TCE mass wascalculated using the contoured isoconcentration shell volumes. The second approach employedgeostatistical analysis (kriging) that takes into consideration the spatial variability betweenneighboring TCE soil concentration data. In principle, this method captures the type of variabilityillustrated in Figure B2-2.
Table B2-1 presents the results of both methodologies for each of the three demonstration plotsbefore and after treatment. An initial observation indicates reasonable agreement between the twomethods of mass estimation. One benefit of the kriging method is that estimates of the uncertaintyof mass are obtained and one can specify the confidence level desired for the uncertainty; greaterconfidence requires a wider range of uncertainty. For the work at LC34, an 80% confidence intervalwas selected for data evaluation, which leads to an uncertainty of ±25% in the mass estimates. Froma performance assessment perspective, the ability to accurately define the magnitude of DNAPLmass reduction or the amount of remaining TCE mass is limited by these statistical uncertainties.Of course, one can reduce the level of uncertainty by collecting more soil core data, but there is atrade-off in terms of increased cost of drilling, sampling, and analysis.
In general, it appears that all three technologies were capable of removing a large fraction of thetotal mass of TCE (and DNAPL) estimated to be present in the plots prior to implementing thedemonstrations. Only ERH met the performance criterion of 90% mass reduction of TCE DNAPL

B-12
established for the tests, however. TCE concentrations in groundwater for each of the plots werevariable (especially vertically) both before and after the demonstrations. Predemonstration valuestended to be well in excess of 1 mg/L and ranged as high as the solubility limit for TCE (1100mg/L). Post-demonstration groundwater samples on average indicated improvement in terms ofTCE concentration but still were near the solubility limit in a few places.
Table B2-1. Mass estimates of TCE in treatment cells at LC34 obtained from soil core data
Estimation methodTCE mass estimates (kg)
ISCO SEE ERH
PRETREATMENT
EarthVision™ contouring 6,100 10,400 11,300
Kriging (80% confidence interval) 6,200 - 9,200 7,500 – 15,700 11,100 – 14,200
POST-TREATMENT
EarthVision™ contouring 1,100 1,500 1,100
Kriging (80% confidence interval) 1,500 - 2,300 1,000 - 1,500 1,300 – 2,500Source: Buxton and Gavaskar, 2002
One must determine the importance of estimating the amount of DNAPL mass reduction as a metricfor performance assessment. For the reasons already mentioned, uncertainties with making thisestimate from core data are inevitable. However, all methods of DNAPL mass estimation haveassociated uncertainties suggesting that mass reduction should be regarded as only one of severalmeasures of performance and perhaps not even the most important. From the perspective oftechnology design, only ISCO requires a pre-deployment estimate of DNAPL mass in order toestimate the amount of oxidant that will be required. For both thermal technologies, the amount ofenergy required to heat the subsurface to about 100°C far exceeds the energy needed to vaporize andmobilize the DNAPL. Knowing the amount of DNAPL present in the source (and the rate at whichit will vaporize and enter the vapor recovery system) may be important for designing the vaportreatment system.
DNAPL Migration. As part of performance assessment activities and in an effort to ascertain ifDNAPL migration accompanied any of the demonstrations, a comparison of TCE soil andgroundwater concentrations was conducted in pre- and post-demonstration samples obtained fromregions surrounding the demonstration plots. A number of monitoring wells peripheral to the ISCOplot showed sharp increases in dissolved concentrations of TCE during and following thedemonstration. In general, it is believed that these increases occurred as a result of displacement ofhighly contaminated groundwater from within the plot during permanganate solution injection.However, one monitoring site located approximately 25 ft from the SW corner of the ISCO plotrevealed evidence from soil cores of apparent large increases in TCE in several places within the soilprofile following the demonstration. One potential conclusion is that the steep hydraulic gradientsassociated with permanganate injection may have caused some migration and redistribution ofDNAPL in this area, but one cannot dismiss the possibility that the before and after soil core resultssimply reflect natural variations in DNAPL distribution over relatively short lateral distances (e.g.

B-13
Figure 2). None of the pre/post treatment soil cores from other areas surrounding the ISCO plot thatwere monitored showed similar effects.
It has been noted already that lateral migration of hot water (and dissolved TCE) occurred inassociation with the ERH demonstration. Strong evidence of localized DNAPL migration relatedto this technology exists. In a cluster of monitoring wells located about 15 ft from the easternperimeter of the ERH plot the presence of DNAPL was confirmed in the bottom of wells completedin the MFGU and LSU following the ERH demonstration. No DNAPL was present in these wellsprior to the demonstration. In addition, comparison of pre- and post-demonstration soil cores fromthis same location suggest possible increases in the amount of DNAPL in the MFGU and the upperpart of the LSU following the demonstration. It is suspected that DNAPL was mobilized in thisregion as a result of the ERH demonstration. The source of the mobile DNAPL may have been dueto local redistribution or may have originated from within the ERH plot by mechanisms alreadydiscussed.
Because the demonstration plots were located within a much larger area of DNAPL contaminationit is impossible to estimate how much DNAPL might have been transferred from within the plotsto the surrounding area; this region was not sampled nearly as extensively as that within the plots,so relevant data are not available. However, the poor mass balance for the ERH demonstration andother associated observations suggest that contaminant migration to regions external to the treatmentplot, perhaps including DNAPL mobilization, probably occurred for this technology. One of thelessons learned from these results is the need to reevaluate the engineering design and operation ofaggressive DNAPL treatment technologies to prevent or minimize DNAPL migration outside of thezone of influence of the technology.
Costs. The estimated cost of treatment using each of the technologies is presented in Table B2-2.Actual costs for other sites will depend upon site-specific conditions (depth and nature ofcontamination; contaminated medium, etc.), improvements in engineering design andimplementation, and anticipated improvements in cost-effectiveness due to scale-up. Constraintsplaced on the vendors by the IDC (e.g. site logistics, treatment plot size, requirement to maintainhydraulic control, etc.) resulted in applying some design strategies differently than would beemployed for a typical deployment leading to increased costs.
Table B2-2. Cost Estimates for TCE Treatment
Cost basisCost (dollars)
ISCO SEE ERH
Per pound of TCE removed $109 $61 $29
Per cubic yard treated 187 192 104
Consequently, the costs presented in Table B2-2 are not representative of what would beencountered had these technologies been deployed for full-scale cleanup of a site comparable toLC34. The fact that these were demonstrations of limited scale and with special conditions imposedby the IDC and NASA, account for the relatively high unit costs. Some vendors of these

B-14
technologies cite typical unit costs well below these figures, but generally they do not include thesame range of constraints encountered for the demonstrations at LC34.
The cost of conducting the performance assessment for each of the demonstrations is not trivial. Foreach of the three technologies used at LC34, performance assessment cost approximately $500,000to $650,000. However, the IDC requested more extensive performance evaluation activities at LC34than might be necessary at many sites, possibly accounting for some of the cost.
Lessons Learned
• A comprehensive and accurate site conceptual model is essential for successfullydesigning and implementing DNAPL source remediation. In addition, understandinghow a specific technology will respond to different components of the site model (e.g.,lithologic heterogeneities) is of key importance,
• Although DNAPL mass removal was significant in each of the demonstrations(84%–97%), reduction in groundwater concentrations of TCE did not drop dramatically.Part of the reason for this was residual DNAPL remaining after treatment, but anothercause was the fact that the treatment plots were located within a much larger area ofcontamination and post-treatment reinvasion of contamination could occur,
• The location of the three test plots in close proximity to one another and the lack orimperfect achievement of hydraulic control observed for two of the demonstrations(ISCO and ERH) resulted in impacts on a region outside of the test plot areas,
• Soil and groundwater sampling in post-treatment thermal plots must deal with hotsamples. Special precautions are required to avoid VOC losses due to inappropriatehandling procedures.
ISCO
• Hydraulic control during oxidant injection is essential to avoid displacement ofcontaminated groundwater and possibly DNAPL,
• Due to the strong purple color associated with MnO4- and the brownish color related tothe MnO2 reaction products with TCE, collection and visual examination of soil coresproved to be the most effective means of performance monitoring for determining theextent of oxidant distribution,
• The amount of DNAPL to be treated is strongly related to the amount of KMnO4required and is a significant cost driver for the remediation. Treatment by ISCO of siteshighly contaminated with DNAPL might not be a cost-effective alternative.
SEE
• The demonstration design involved steam/air injection to the central part of the test plotwith vapor/groundwater extraction along the perimeter in order to maintain hydrauliccontrol. This resulted in the extraction and treatment of a large quantity of contaminatedgroundwater coming from outside of the treatment plot (perhaps 200,000 to 400,000 galof water). The preferred and most cost-effective design for SEE probably would haveincluded steam injection on the perimeter that drives contaminants to extraction wellslocated in the central part of the plot.

B-15
• There was considerable debate (and some controversy) during the demonstration designphase of the efficacy of co-air injection. The potential benefits and problems of thisdesign feature need to be evaluated carefully before implementation.
ERH
• The design and implementation of electrodes needs to be carefully considered so thatthey work effectively,
• Lithologic variations within the treated region can have an important impact ongroundwater/vapor flow dynamics and lateral fluid migration outside of the plot canoccur if the conceptual model is not properly integrated into the design to ensurehydraulic control,
• The vapor recovery system needs to be designed to maintain effective control ofcontaminants. Vapor recovery limited to the vadose zone may not be sufficient.Furthermore, at some sites it may be necessary to design for significant fluctuations inwater table levels during treatment with the ability of adjusting the water table elevation,
• TCE mass balance calculations reveal that less than 50% of the TCE mass assumed tohave been removed from the source zone was actually captured by the abovegroundrecovery systems. Lateral migration outside of the treatment plot is suspected as animportant cause, but other explanations cannot be ruled out.
References
Battelle. 2003. Demonstration of Resistive Heating Treatment of DNAPL Source Zone at LaunchComplex 34 in Cape Canaveral Air Force Station, Florida. Report to the InteragencyDNAPL Consortium, Feb. 19, 2003. Battelle, Columbus, Ohio.
Battelle. 2003. Demonstration of Steam Injection/Extraction Treatment of DNAPL Source Zone atLaunch Complex 34 in Cape Canaveral Air Force Station, Florida. Report to theInteragency DNAPL Consortium, Sept. 30, 2003. Battelle, Columbus, Ohio.
Battelle. 2002. Demonstration of ISCO Treatment of DNAPL Source Zone at Launch Complex 34in Cape Canaveral Air Force Station, Florida. Report to the Interagency DNAPLConsortium, Oct. 17, 2002. Battelle, Columbus, Ohio.
Buxton, B.E., and A.R. Gavaskar. 2002. “Geostatistical Analysis of TCE Concentrations Before andafter Remediation of a DNAPL Source Zone at Cape Canaveral.” In A.R. Gavaskar andA.S.C. Chen (eds.), Remediation of Chlorinated and Recalcitrant Compounds – 2002.Proceedings of the Third International Conference on Remediation of Chlorinated andRecalcitrant Compounds, paper 1E-06. Battelle Press, Columbus, Ohio.

B-16
Contact Information
Laymon GrayFlorida State UniversityTallahassee, Florida(850) [email protected]
Jorge CasparyFlorida DEPTallahassee, Florida(850) [email protected]
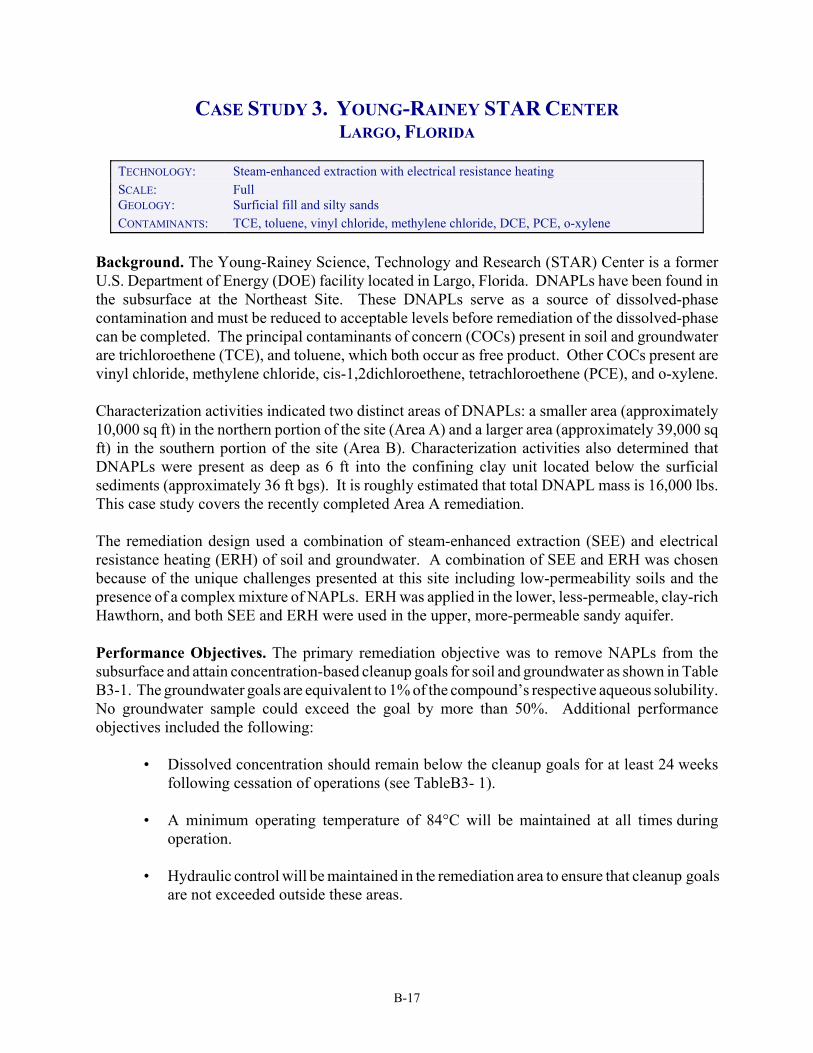
B-17
CASE STUDY 3. YOUNG-RAINEY STAR CENTERLARGO, FLORIDA
TECHNOLOGY: Steam-enhanced extraction with electrical resistance heatingSCALE: FullGEOLOGY: Surficial fill and silty sandsCONTAMINANTS: TCE, toluene, vinyl chloride, methylene chloride, DCE, PCE, o-xylene
Background. The Young-Rainey Science, Technology and Research (STAR) Center is a formerU.S. Department of Energy (DOE) facility located in Largo, Florida. DNAPLs have been found inthe subsurface at the Northeast Site. These DNAPLs serve as a source of dissolved-phasecontamination and must be reduced to acceptable levels before remediation of the dissolved-phasecan be completed. The principal contaminants of concern (COCs) present in soil and groundwaterare trichloroethene (TCE), and toluene, which both occur as free product. Other COCs present arevinyl chloride, methylene chloride, cis-1,2dichloroethene, tetrachloroethene (PCE), and o-xylene.
Characterization activities indicated two distinct areas of DNAPLs: a smaller area (approximately10,000 sq ft) in the northern portion of the site (Area A) and a larger area (approximately 39,000 sqft) in the southern portion of the site (Area B). Characterization activities also determined thatDNAPLs were present as deep as 6 ft into the confining clay unit located below the surficialsediments (approximately 36 ft bgs). It is roughly estimated that total DNAPL mass is 16,000 lbs.This case study covers the recently completed Area A remediation.
The remediation design used a combination of steam-enhanced extraction (SEE) and electricalresistance heating (ERH) of soil and groundwater. A combination of SEE and ERH was chosenbecause of the unique challenges presented at this site including low-permeability soils and thepresence of a complex mixture of NAPLs. ERH was applied in the lower, less-permeable, clay-richHawthorn, and both SEE and ERH were used in the upper, more-permeable sandy aquifer.
Performance Objectives. The primary remediation objective was to remove NAPLs from thesubsurface and attain concentration-based cleanup goals for soil and groundwater as shown in TableB3-1. The groundwater goals are equivalent to 1% of the compound’s respective aqueous solubility.No groundwater sample could exceed the goal by more than 50%. Additional performanceobjectives included the following:
• Dissolved concentration should remain below the cleanup goals for at least 24 weeksfollowing cessation of operations (see TableB3- 1).
• A minimum operating temperature of 84°C will be maintained at all times duringoperation.
• Hydraulic control will be maintained in the remediation area to ensure that cleanup goalsare not exceeded outside these areas.

B-18
Table B3-1. Cleanup Goals for Remediation at Area A
ContaminantGroundwater
(µg/L)1Soil
(µg/kg)2
Trichloroethene 11,000 20,400
cis-1,2-Dichloroethene 50,000 71,000
Methylene chloride 20,000 227,000
Toluene 5,500 15,000
Florida Petroleum Range Organics (FL-PRO) 50,000 2,500,000
1. No groundwater sample can exceed the cleanup goal by more than 50%.2. There must be a 90% certainty that 90% of the site was at or below the
cleanup goals and no soil sample can exceed the goal by more than 100%.
Performance Monitoring and Verification. The progress of remediation was evaluated usingseveral lines of evidence, namely by measuring the NAPL content in extracted fluids, the totalpetroleum hydrocarbon content in extracted water, the temperature distribution, and interim soil andgroundwater sampling.
Soil. Two interim soil sampling rounds were conducted during operation using a Geoprobe rig toprovide detailed chemical information in support of the remedial progress. Samples were collectedfrom areas selected based on the process and subsurface monitoring. Problematic areas, such asareas of the upper sands that were not heating at the desired rate due to low permeability or “coldspots” identified by the thermal monitoring, were also sampled. In addition, areas that receivedsatisfactory treatment based on the operational parameters were sampled for verification. A totalof 25 soil samples were collected and analyzed by EPA Method 8021. Since the sampling was donewhile the site was still hot, the steam and electrical heating systems were turned off at least 24 hoursprior to drilling and sampling. The subsurface temperatures within 20 ft of the drilling locationswere tested and verified to be below 100°C prior to drilling. Also, the temperature of the asphaltcap in a 10-ft radius of the penetration holes was measured and verified to be safely below 80°C toensure that there was no steam present at the location of the penetration.
Post-operation soil sampling was conducted after cessation of operation to test the remedialperformance based on soil COC concentrations. A Geoprobe was used to collect hot soil cores fromthe surficial sediments into stainless steel core tubes. Cores were capped immediately and cooledby placing them on ice. After cooling, the core tubes were opened, and a sample was collected usinga syringe-type sampler. Analytical parameters were VOCs (by EPA Method 8021) and TPH (byFlorida Petroleum Range Organics [FL-PRO]). Locations of the boreholes were selected solely atthe discretion of DOE and its technical contractor.
Figure B3-1 is a contour plot presenting the results of soil sampling for TCE only.

B-19
Figure B3-1. Comparison of soil concentration contours pre- and post-operation for TCE (µg/kg).
Groundwater. For remediation of Area A, groundwater samples were collected and analyzed fornumerous parameters from three extraction wells located within the DNAPL remediation areas andfrom eight monitoring wells located outside the remediation area. Monitoring wells located outsidethe remediation area were used to monitor for contaminant mobilization. Groundwater samples werecollected and analyzed for numerous parameters from the prescribed wells at least every two weeksduring the operational phase of the remediation.
To prevent loss of contaminants, hot sampling techniques were used to collect samples duringconfirmatory sampling. Hot groundwater samples were collected by placing Teflon tubing downthe well to the middle of the screened interval and purging at the surface with a peristaltic pump.The Teflon tubing ran first to a stainless steel coil submerged in an ice chest, then connected to thesilicone pump tubing, and then to a flow cell containing instrumentation used to measuregroundwater parameters to determine when stability was reached during purging. Groundwatersamples were then collected using the pipette method, which consisted of stopping the pump,removing the tubing from the well, then allowing groundwater to flow from the bottom of the tubinginto the sample bottle.
Groundwater was sampled at four weeks after remediation was complete, at 12 weeks after theremediation was complete, and again at 24 weeks after remediation was complete. The purpose ofthis sampling event was to check for any rebound effects and to confirm that remediation wascomplete. A soil sampling event was also performed at randomly selected locations to confirm thatthe source of the NAPLs had been removed.
Groundwater results show that all groundwater concentrations for the COCs were much lower thanthe remediation goals; therefore the post-operational data was compared with the criteria forcomplete site restoration. Overall, 42 of 48 (88%) of the groundwater samples collected were belowthe Maximum Contaminant Level (MCL) for all COCs.

B-20
In addition to the monitoring mentioned above, samples were collected of storm water runoff afterrainfall events and surface water from the East Pond (a storm water retention pond located east ofArea A) and analyzed as a best management practice. These samples were collected prior to andduring DNAPL remediation activities to monitor for potential effects of contaminant runoff. Theresults of these analyses showed no impact.
Mass Removed. Table B3-2 lists the estimated contaminant mass before and after NAPLremediation.
Table B3-2. Comparison of Before and After Contaminant Mass by Compound1
ContaminantPretreatment mass
(lbs)Post-treatment mass
(lbs)
Trichloroethene 1,010 0.14
cis-1,2-Dichloroethene 130 0.19
Methylene chloride 300 0.03
Toluene 800 0.89
FL-PRO 2,960 1,160
1. Mass estimates calculated based on average soil and dissolvedconcentrations projected over entire treatment cell.
Operational. Progression of the steam and electrical heating was monitored using two somewhatcomplimentary techniques: direct temperature monitoring (thermocouples) and Electrical ResistanceTomography (ERT). Thermocouples were used to monitor in-ground temperature at least once perday. Because of the high dissolved solids content of the groundwater at this site (which preventedresistivity effects caused by temperature and saturation changes from being distinguished from thosecaused by changes in groundwater chemistry), ERT was not effective at this site, and its use wasabandoned.
Process water and vapor sampling and the monitoring of numerous parameters of the overallwell-field, subsurface, and liquids from extraction wells were conducted to estimate thecompleteness of remediation. In particular, extracted fluids were monitored to determine whetherthey were free of mobile NAPLs, and equilibrium calculations were performed using vaporconcentrations to determine whether levels in pore water were approaching cleanup goals.
Costs. The total project subcontract cost was approximately $3,800,000. This cost included allaspects of the project from design, permitting, drilling, construction, operations, sampling, wastedisposal, demobilization, and reporting.

B-21
Lessons Learned.
• Need to add air stripper to vapor/water train to address higher than expected levels ofmethylene chloride.
• Temperature reached targets sooner than expected, suggesting that the combined use ofthe two technologies (i.e. ERH and Steam Enhanced Extraction) appears to be moreefficient than either technology used alone.
• System was operated through February 15, 2003, two weeks longer than planned, toaddress the unexpected discovery of residual resinous materials in one area of thetreatment zone.
• Based on initial discussions with the electrical power company, it appeared adequatepower would be readily available. However, this was not the case and an additionalhigh-voltage power line had to be constructed.
• During the interim soil sampling, it was determined that one area was not being heated,and additional steam injection points were added in order to heat the entire target area.
• The actual objective of the remediation that was done at this site was to remove mobileNAPL. The soil and groundwater cleanup standards were set based on this goal; theseconcentrations were thought to demonstrate that no NAPL remained.
• The post-treatment soil sampling showed that all soil concentrations were significantlylower than the soil cleanup standards.
Contact Information
David S. IngleU.S. Department of EnergyLargo, Florida(727) [email protected]
John Armstrong P.G.Florida DEPTallahassee, Florida(850) [email protected]
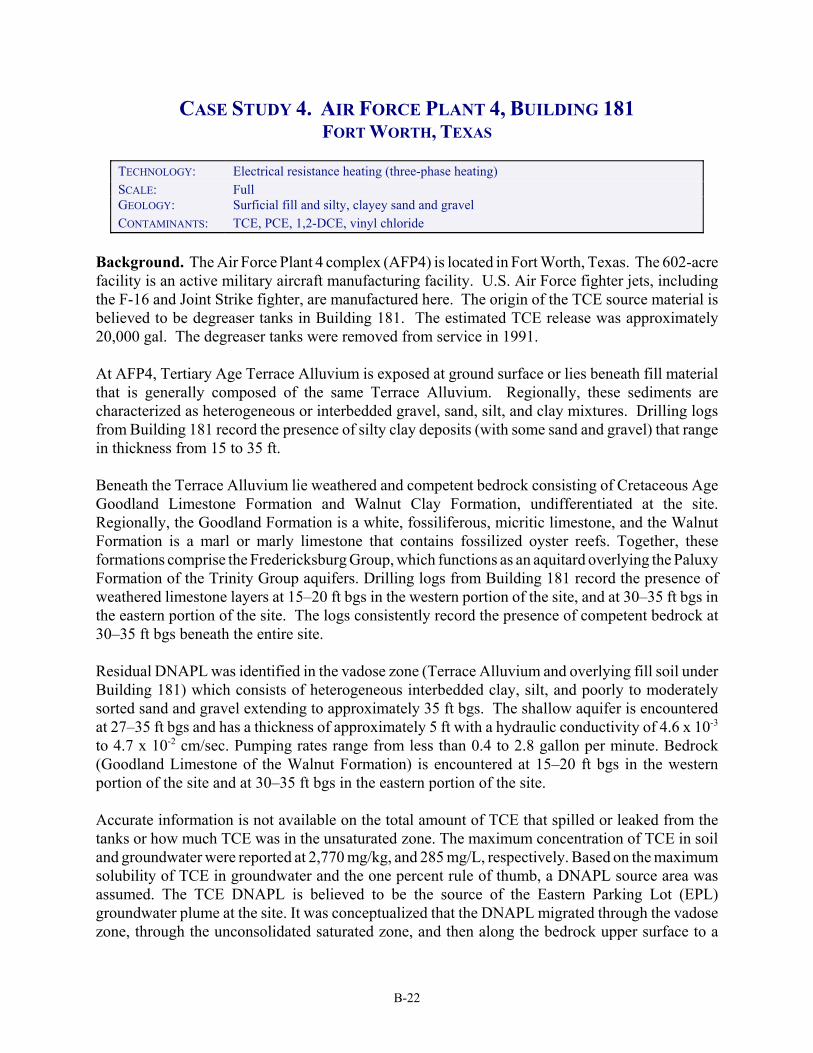
B-22
CASE STUDY 4. AIR FORCE PLANT 4, BUILDING 181FORT WORTH, TEXAS
TECHNOLOGY: Electrical resistance heating (three-phase heating)SCALE: FullGEOLOGY: Surficial fill and silty, clayey sand and gravelCONTAMINANTS: TCE, PCE, 1,2-DCE, vinyl chloride
Background. The Air Force Plant 4 complex (AFP4) is located in Fort Worth, Texas. The 602-acrefacility is an active military aircraft manufacturing facility. U.S. Air Force fighter jets, includingthe F-16 and Joint Strike fighter, are manufactured here. The origin of the TCE source material isbelieved to be degreaser tanks in Building 181. The estimated TCE release was approximately20,000 gal. The degreaser tanks were removed from service in 1991.
At AFP4, Tertiary Age Terrace Alluvium is exposed at ground surface or lies beneath fill materialthat is generally composed of the same Terrace Alluvium. Regionally, these sediments arecharacterized as heterogeneous or interbedded gravel, sand, silt, and clay mixtures. Drilling logsfrom Building 181 record the presence of silty clay deposits (with some sand and gravel) that rangein thickness from 15 to 35 ft.
Beneath the Terrace Alluvium lie weathered and competent bedrock consisting of Cretaceous AgeGoodland Limestone Formation and Walnut Clay Formation, undifferentiated at the site.Regionally, the Goodland Formation is a white, fossiliferous, micritic limestone, and the WalnutFormation is a marl or marly limestone that contains fossilized oyster reefs. Together, theseformations comprise the Fredericksburg Group, which functions as an aquitard overlying the PaluxyFormation of the Trinity Group aquifers. Drilling logs from Building 181 record the presence ofweathered limestone layers at 15–20 ft bgs in the western portion of the site, and at 30–35 ft bgs inthe eastern portion of the site. The logs consistently record the presence of competent bedrock at30–35 ft bgs beneath the entire site.
Residual DNAPL was identified in the vadose zone (Terrace Alluvium and overlying fill soil underBuilding 181) which consists of heterogeneous interbedded clay, silt, and poorly to moderatelysorted sand and gravel extending to approximately 35 ft bgs. The shallow aquifer is encounteredat 27–35 ft bgs and has a thickness of approximately 5 ft with a hydraulic conductivity of 4.6 x 10⁻³
to 4.7 x 10⁻² cm/sec. Pumping rates range from less than 0.4 to 2.8 gallon per minute. Bedrock(Goodland Limestone of the Walnut Formation) is encountered at 15–20 ft bgs in the westernportion of the site and at 30–35 ft bgs in the eastern portion of the site.
Accurate information is not available on the total amount of TCE that spilled or leaked from thetanks or how much TCE was in the unsaturated zone. The maximum concentration of TCE in soiland groundwater were reported at 2,770 mg/kg, and 285 mg/L, respectively. Based on the maximumsolubility of TCE in groundwater and the one percent rule of thumb, a DNAPL source area wasassumed. The TCE DNAPL is believed to be the source of the Eastern Parking Lot (EPL)groundwater plume at the site. It was conceptualized that the DNAPL migrated through the vadosezone, through the unconsolidated saturated zone, and then along the bedrock upper surface to a

B-23
former paleochannel. The full-scale treatment area was approximately ½ acre, with a treatmentvolume of approximately 20,000 cubic yards.
Selection of the ERH technology for the full-scale remediation (source removal) was based on thefindings of the previous ERH pilot-scale test conducted at the site in May 2001. The pilot test areawas inside the subsequent full-scale remediation footprint. The pilot test area was believed tocontain approximately 220–440 lbs of VOCs. Tracer tests were used to estimate the mass of VOCsin the pilot test area. The high degree of variation common in tracer tests is the reason for the largerange in the approximate mass estimate.
Tracer test results also indicated more DNAPL in the F-218 test area (790–1,580 lbs) than withinthe Building 181 pilot test cell. It should be noted that tracer tests are not geared for determining themass of pooled DNAPL; rather, they are performed to determine the mass of nonpooled, residualproduct. These results would be biased low if DNAPL was pooled, which could explain thisapparent inconsistency (based on groundwater concentrations and the location of prior spills, itwould appear more likely that a greater volume of DNAPL would be present under the formerlyleaking tanks within Building 181). Because the pilot test cell volumes were small (56–73 cubicyards swept), extrapolation of these data to the much larger contaminant plume of interest isproblematic, especially moving in the down-gradient direction from the F-218 test area (i.e., out intothe parking lot east of Building 181).
Performance Objectives. The primary RAOs were to reduce residual-phase DNAPL in soil andremove free-phase DNAPL to the extent practicable. The groundwater RAO was to preventgroundwater that has contamination above MCLs from leaving the property boundaries. Specifictargets for both soil and groundwater are presented in Table B4-1.
Table B4-1. Soil and Groundwater Cleanup Targets for Air Force Plant 4, Building 181 SitePerformance Criteria Performance Objectives Methods of Measuring Performance
Subsurface temperatures in thetreatment volume
Boiling point of TCE Temperature monitoring pointmeasurements
Soil -TCE remediation goal <11.5 mg/kg1 Pre- and post-application subsurfacesoil sampling
Groundwater -TCE remediationgoal
<10 mg/L1 Pre-application, interim andpost-application groundwater sampling
1. These performance objectives are equivalent to the ROD-based remedial actionobjectives for the soil and groundwater media and represent a >99% reduction in TCEconcentrations from the highest previous detections in the enlarged ERH applicationvolume. The ROD-based remedial action objectives were calculated using a 95%upper confidence limit (UCL) statistical analysis.
The intent was to reduce the TCE concentration in soils to <11.5 mg/kg, which, based on leachingmodeling, is the allowable soil concentration to prevent underlying groundwater concentrations fromexceeding the respective RAOs.

B-24
ERH System Installation. To implement the full-scale ERH remediation at the site, a network of74 ERH electrodes was installed. In conjunction with electrode construction, an SVE network wasestablished. While many SVE wells were colocated in vertical or angled electrode boreholes, someSVE wells were independently located.
The ERH power control unit (PCU), which conditions electrical energy for optimum subsurfaceheating, was equipped with numerous automatic shut-off components to prevent unwanted exposureto hazardous voltages. Emergency stop buttons were located both remotely and locally in the eventa personnel or equipment hazard was identified. The SVE piping was installed to manifold the SVEwells together into a common inlet at the steam condenser.
ERH System Operations. Electrical voltage and current readings were measured routinelythroughout the full-scale ERH remediation to ensure optimum system performance whilemaintaining safe working conditions. Vacuum pressure and vapor flow rate readings were alsoroutinely collected from each SVE well and from various header pipes supporting some or all SVEnetwork wells. The data were used to assess the performance of the vacuum blower and SVEnetwork, and, in conjunction with laboratory analytical results for influent vapor samples, tocalculate the mass of TCE removed from the subsurface over time. The data were also used todetermine which system adjustments were needed to optimize steam extraction on a weekly basis.
Soil vacuum pressure readings were routinely collected from each temperature monitoring point(TMP). The data were used to assess the cumulative affect of the vacuum blower and SVE networkon surrounding soils at various depths. In conjunction with SVE vacuum pressure and vapor flowrate readings, the data were also used to determine which system adjustments were needed tooptimize steam extraction on a weekly basis.
As part of the routine system measurements, recovered steam and vapor were measured at theirrespective locations downstream of the condenser skid. The condensate was pumped through aturbine-type totalizer (water meter) before it was sent to the equalization tank inside the SVEbuilding. The operator would record the date, time, and totalizer reading so that the time-averagedflow rate of condensate could be calculated. If no condensation occurs in the piping network beforethe condenser, then the condensate flow rate is equal to the steam recovery flow rate.
Indoor air-quality measurements were collected to ensure occupational health and safety and todetect any accidental releases of vapors from the subsurface or collection piping. For this long-termmonitoring the photoacoustic multigas analyzer (PMA) was placed indoors and collected air samplesfor analysis, via tubing, from a location near the center of the heating array. Discrete measurementswere collected at times, but most measurements were collected on an automatic 5-minute cycle, 24hours per day throughout the duration of the remediation. No TCE or other VOC detectionsoccurred at a detection limit of 1 part per million volume (ppmv).
The PCU and the PMA were controlled locally (when personnel were present) through a computerinstalled for each unit. When personnel were not present, the PCU and PMA were controlledthrough a remote computer. The PMA was dynamically linked to the PCU (and thus, the heatingarray) via interlock. If the PMA were to detect TCE above 5 ppmv, the PCU would then shut downthe heating array.
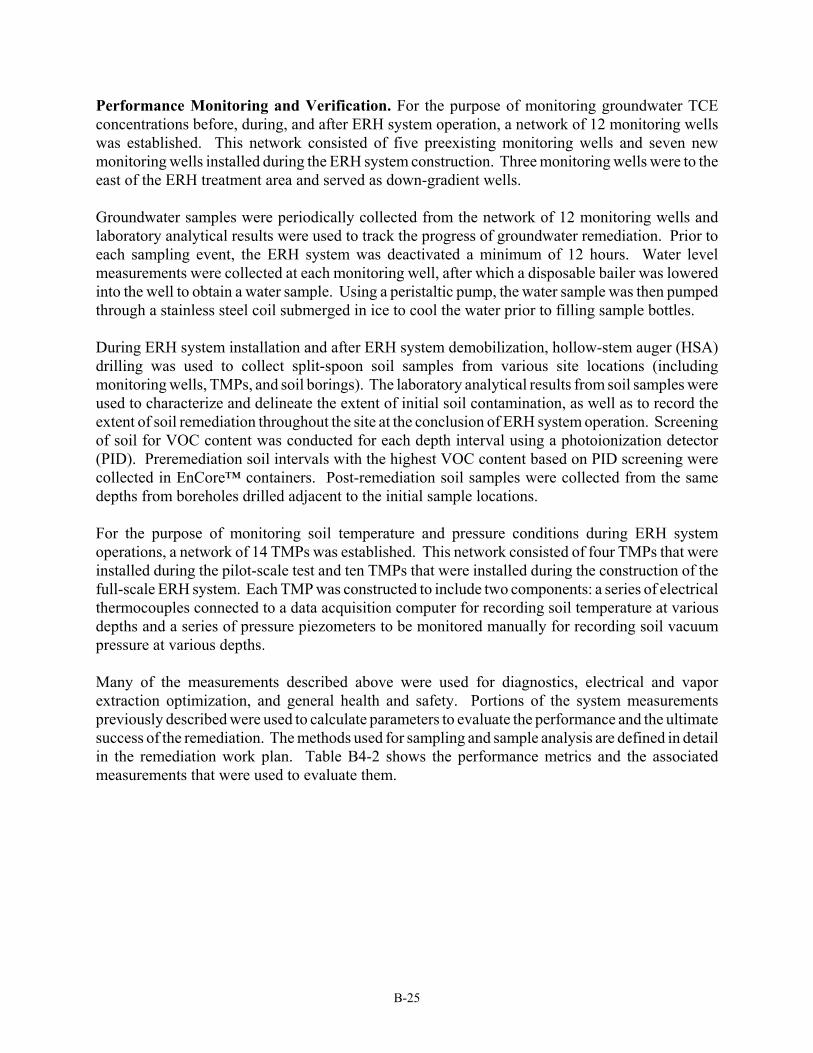
B-25
Performance Monitoring and Verification. For the purpose of monitoring groundwater TCEconcentrations before, during, and after ERH system operation, a network of 12 monitoring wellswas established. This network consisted of five preexisting monitoring wells and seven newmonitoring wells installed during the ERH system construction. Three monitoring wells were to theeast of the ERH treatment area and served as down-gradient wells.
Groundwater samples were periodically collected from the network of 12 monitoring wells andlaboratory analytical results were used to track the progress of groundwater remediation. Prior toeach sampling event, the ERH system was deactivated a minimum of 12 hours. Water levelmeasurements were collected at each monitoring well, after which a disposable bailer was loweredinto the well to obtain a water sample. Using a peristaltic pump, the water sample was then pumpedthrough a stainless steel coil submerged in ice to cool the water prior to filling sample bottles.
During ERH system installation and after ERH system demobilization, hollow-stem auger (HSA)drilling was used to collect split-spoon soil samples from various site locations (includingmonitoring wells, TMPs, and soil borings). The laboratory analytical results from soil samples wereused to characterize and delineate the extent of initial soil contamination, as well as to record theextent of soil remediation throughout the site at the conclusion of ERH system operation. Screeningof soil for VOC content was conducted for each depth interval using a photoionization detector(PID). Preremediation soil intervals with the highest VOC content based on PID screening werecollected in EnCore™ containers. Post-remediation soil samples were collected from the samedepths from boreholes drilled adjacent to the initial sample locations.
For the purpose of monitoring soil temperature and pressure conditions during ERH systemoperations, a network of 14 TMPs was established. This network consisted of four TMPs that wereinstalled during the pilot-scale test and ten TMPs that were installed during the construction of thefull-scale ERH system. Each TMP was constructed to include two components: a series of electricalthermocouples connected to a data acquisition computer for recording soil temperature at variousdepths and a series of pressure piezometers to be monitored manually for recording soil vacuumpressure at various depths.
Many of the measurements described above were used for diagnostics, electrical and vaporextraction optimization, and general health and safety. Portions of the system measurementspreviously described were used to calculate parameters to evaluate the performance and the ultimatesuccess of the remediation. The methods used for sampling and sample analysis are defined in detailin the remediation work plan. Table B4-2 shows the performance metrics and the associatedmeasurements that were used to evaluate them.

B-26
Table B4-2. Performance Measures and MetricsPerformanceMetric
Performance Objectives MeasurementsRequired
Method
Input power To evaluate efficiency ofpower input and heatingpotential.
Power rate(voltage xcurrent)
Direct reading in PCU.
Subsurfacetemperature1
To evaluate the effect ofthe input power onsubsurface temperature.
Temperature Direct temperature readingthrough TMPs andthermocouples.
Vacuumpropagation
To determine if the steamextraction system iseffectively capturingcontaminated steam.
Vacuum pressure Direct pressure reading throughTMPs with hand-held instrument.
TCE massremoved
To quantify the actualmass of contaminationremoved.
Vapor phaseconcentration
SUMMA canister sample fromprocess header.
Temperature Direct reading from thermocoupleplaced in process header.
Vacuum pressure Direct reading, hand heldinstrument from process header.
Differentialpressure
Direct reading, hand heldinstrument from process header.
Condensateconcentration
Water sample collected from tapdownstream from condenser.
Condensate flowrate
Calculation from condensatedischarge totalizer readings.
Soil vaporresults
To evaluate the ERHapplication’s effectivenessof lowering soil vaporconcentrations of TCE.
In situconcentration
Conversion of direct PIDmeasurement from soil vaporextraction wells and vapormonitoring points.
Soil results 1 To evaluate the ERHapplication’s effectivenessof lowering soilconcentrations of TCE.
TCE soilconcentration
Laboratory analysis of samplescollected from boreholes.
Groundwaterresults 1
To evaluate the ERHapplication’s effectivenessof lowering groundwaterconcentrations of TCE.
TCE groundwaterconcentration
Laboratory analysis of samplescollected from monitoring wells.
1. One of the three primary performance metrics for evaluation remediation success.
Remediation Results. A calculated total of 1,417 lbs. of TCE was removed from the subsurfacein Building 181 via the ERH remediation system. The total TCE mass removed from the subsurfaceis the sum of the mass that was removed via vapor and via steam (condensate). The mass removedvia vapor was calculated on the basis of the vapor flow rate and the vapor-phase concentration. Themass removed via condensate was calculated on the basis of the dissolved-phase concentration and

B-27
Figure B4-1. Before (left) and after (right) TCE soil vapor plumes vear Building 181
the condensate discharge rate. Of the 1,417 lbs. that was documented removed from the subsurface,only about 0.5 lb. was removed via condensate. It should be noted that these results do not accountfor any reduction in mass due to biodegradation effects.
The shutdown criteria consisted of monitoring the TCE concentrations in the vapor stream untilasymptotic conditions were achieved. The vendor recommended system shutdown and thenconfirmatory soil and groundwater sampling was performed. Groundwater monitoring was alsoperformed during operations.
Roughly 150 soil vapor samples were collected both before and after heating to evaluate the ERHremediation effects on TCE soil vapor concentration. Samples were collected from various types ofwells, including SVE wells and vapor monitoring wells. The wells were purged for 3–5 minutes witha portable pump prior to sample collection and analysis with a PID. The results indicate that boththe concentration and extent of the vapor plume decreased. Specific observations include thefollowing:
• The mean TCE concentration in vapor was reduced by 93% (1,049 to 73.4 ppm),• There was a marked reduction in the area of vapor plume >100 ppm, and,• The maximum result decreased from >5,200 to 1,358 ppm.
Figure B4-1 shows the before (left) and after (right) TCE soil vapor plumes. The data collected forthe pre-ERH application soil vapor survey was collected during March 2002. The data for thepost-application survey was collected in early February 2003.
Following the full-scale ERH remediation, soil samples were collected from four soil borings andfrom the borings associated with several TMP locations by the methods outlined previously. Theresults of the post-ERH application were compared to the pre-ERH results specific observations forthis comparison include the following:
• The mean TCE concentration was reduced by 90% (1.76 to 0.184 mg/kg),• The 95% UCL TCE concentration reduced by 97% (8.4 to 0.29 mg/kg), and,• All post-ERH results were below RAO of 11.5 mg/kg TCE.

B-28
TMP
6-01
0
TMP
6-06
0
TMP
10-0
10
TMP
5-03
0
TMP
5-04
0
TMP
12-0
10
TMP
12-0
23
TMP
124-
040
TMP
12-0
50
TMP
14-0
13
TMP
14-0
20
TMP
14-0
30
TMP
14-0
40
SB
1-01
0
SB
1-03
3
SB
1-04
0
SB
1-05
0
SB
2-03
0
SB
2-04
0
SB
04-0
50
Ave
rage
Goa
l
After ERH
0
2000
4000
6000
8000
10000
12000
14000
16000
18000
20000
TCE ug/kg
After ERHBefore ERH
Figure B4-2. TCE concentrations in soil before and after full-scale ERH remediation
Figure B4-2 illustrates the comparison of the pre- and post-application data across various depthintervals. Fifty-two samples were collected pre-ERH, whereas only 48 were collected post-ERHdue to auger refusal in one of the post-ERH boreholes. A preapplication average concentration ofTCE for each depth interval is compared to the post-application average concentration of TCE forthe same interval.
Groundwater samples were collected from the 12 ERH monitoring wells before, during, and afterheating. Overall, results for groundwater reveal the following:
• The mean TCE concentration was reduced by 87% (33.2 to 4.3 mg/L),• The 95% UCL TCE concentration was reduced by 85% (47.2 to 7.3 mg/L),• The post-application mean and 95% UCL TCE concentration in groundwater were less
than the 10 mg/L RAO, and,• A 353% increase in average chloride concentrations was noted.
Total organic compounds (TOCs) are important because they represent a reservoir of electron donorcompounds to support continued reductive dehalogenation of chlorinated hydrocarbons. The finalTOC levels should be adequate to support the reduction of the residual TCE in the groundwater.
The probability is high that the ERH pilot test area will become recontaminated following theremediation because the pilot test was located on the periphery of a large TCE DNAPL source area.Nothing was done to prevent or reduce recontamination of the pilot test area before the samples wereobtained.
Lessons Learned. The following are a few observations from the project manager:
• Power input rate. The actual power input rate was lower than the calculated rate;therefore, operating days to achieve the energy input needed to complete the project aregreater than plan. Several factors including malfunction of system components, the

B-29
electrical curtailment program, water addition drip locations, and the electrode arraydesign specifications led to the reduced power input.
• Groundwater well screen intervals. The well screen in wells used to assess theperformance should intercept the bedrock/ alluvium interface and possibly extend somedistance into the limestone bedrock..
• Heating distribution. Despite all attempts, targeted heating was not successful in thevicinity of MW-10. It is unclear why TCE concentrations dropped significantly inMW-9 in late July and increased significantly in August.
• Building logistics. Because the AFP 4 is an active operating facility and remediationcannot significantly interfere with the manufacturing process, the logistical issues (e.g.,remediation at night) were magnified from the pilot test.
• Soil analytical methodology. The distilled-water-preserved backup soil sample analysesprovided lower contaminant levels than the original methanol-extracted soil sample.
• Soil evaluation methodology. The Encore™ sampling methodology provided limitedinformation in remediation effectiveness, however, the heating effects of the technologyon soil gas concentrations has been adjusted.
• ERH treatment interval. The heating electrode should be placed as close to thecontaminant as possible.
Contact Information
David FlemingThermal Remediation ServicesSnoqualmie, WA(425) [email protected]
George WaltersASC/ENVRWright-Patterson AFB [email protected]
Sue RogersTexas Commission on Environmental QualityAustin, Texas(512) [email protected]

B-30
Building C-400 electrode electrode
8’-15’
17’-37’
39’-56’
58’-76’
78’-89’
91’-99’
RGA
McNairy
UCRS
TCE DNAPL
piezometer
Figure B5-1. Vertical Profile of Treatment Area
CASE STUDY 5. PADUCAH GASEOUS DIFFUSION PLANT, BLDG C-400PADUCAH, KENTUCKY
TECHNOLOGY: Electrical resistance heating (six-phase heating)SCALE: Prototype demonstrationGEOLOGY: Sand and gravel, overlying inter-bedded sand/silt/clayCONTAMINANTS: Chlorinated solvents (primarily TCE), Technetium
Background. The DOE’s Gaseous Diffusion Plant in Paducah, Kentucky completed a prototypedemonstration project to evaluate the performance of Electrical Resistance Heating (using Six-PhaseHeating for the demonstration). Soils and groundwater are impacted by TCE and low levels of othersolvents, to a depth of approximately 100 ft, near and beneath an existing facility designatedBuilding C-400 (see Figure B5-1).
Groundwater is encountered approximately 50 ft bgs. The silt-sand overlying soils (the so-calledUpper Continental Recharge System, or UCRS) extend to approximately 56 ft bgs, and the gravellyRegional Gravel Aquifer (RGA) extends from about 56 to about 100 ft bgs, to the contact with thelow-permeability McNairy formation. TCE is present as residual DNAPL throughout theunsaturated and saturated zones and is present in places within the upper McNairy. DNAPL is alsobelieved to be present as pools at the McNairy interface in some areas.
Six electrodes were installed in an area of approximately 30 ft in diameter, and VOCs were removedby vapor extraction and carbon absorption. Treatment continued for almost 7 months (175 days ofactive heating, over a period extending from February to September, 2003). The estimated heatedtreatment area was 43 ft in diameter. The treatment area was near the suspected source of TCE (anaboveground storage tank and associated piping), within an identified “source area” that coversapproximately 200,000 sq ft.

B-31
Performance Objectives. The overall objective for the project was to demonstrate theimplementability and cost-effectiveness of the ERH technology for treating the unsaturated andsaturated zones of the overlying soils, and the groundwater of the RGA. The performance criteriaand objectives established for the project are listed in Table B5-1.
Table B5-1. Performance Objectives and Methods at Paducah GDPPerformance
Criteria Objective Measurement Method
Vadose zone 75% mass removal Pre- and Post-Test soil cores: 9cores, sampled each 2-ft interval
Groundwater <1% TCE solubility(11 mg/L)
Monitoring well samples: 2 wells, 6sampling depths
The following metrics were also used to evaluate the process efficiency:
• Uniform temperature gradients throughout the test cell,• TCE removal rates as a function of operational time and energy consumption,• Constructability of the ERH system in the C-400 Building area,• Construction and operation costs as a function of TCE mass removed or destroyed,• No negative effects of the ERH system on adjacent utilities and facilities.
A review panel was convened to evaluate the technology performance and the performanceassessment methods. The panel questioned the objective of 75% reduction in mass of TCE in thesoils for three reasons: mass reduction is not a typical regulatory objective, mass reduction isdifficult to measure adequately given typical source characterization data, and there was no clearlinkage to overall RAOs for the site. The panel considered the second goal, reducing averageconcentrations in groundwater to below 1% of aqueous solubility, to be a reasonable objective,particularly if post-treatment rebound and recontamination were monitored.
The process efficiency criteria were deemed reasonable as well. However, the panel did note thatthe cost evaluation should include total life-cycle cost assessments for this and other sourcetreatment or containment options. If treatment does in fact leave residual groundwaterconcentrations near 1% of solubility, that is still 2000 times higher than the MCL value for TCE.Although the RAO for TCE at this site is unknown at the present time, it is likely that it will (may?)be lower than the 1% criterion. Consequently, further treatment and/or containment probably willbe needed after thermal treatment, and these costs can impact remedy selection and performancegoals for full-scale source management.
Technology Performance. The percent mass removal from the soil was based on nine boringsobtained before and after treatment, with sampling of each 2-foot interval to the maximum depth towhich soil could be sampled (56 ft bgs). Based on the average soil concentrations, the performanceexceeded the goal of 75% mass removal. The average soil concentrations decreased by 98%, froman average of approximately 125 mg/kg before treatment to 2.5 mg/kg after treatment. As might beexpected, the variability was very large. Averages from the nine pretest cores (generally 28 sampleseach, over a total depth of 56 ft) varied 1.3–464 mg/kg. Averages of the post-test soil cores varied0.1–6.5 mg/kg.

B-32
Figure B5-2. Temperature vs. Depth (5/1/03)
A crude estimate is that the initial mass of TCE in the UCRS was about 1,250 lbs., and the finalmass was only 25 lbs. These estimates are based on average concentrations of 125 mg/kg TCEinitially and 2.5 mg/kg afterwards, a treated volume of 80,000 cu. ft., and a density of 125 lbs./cu.ft. of soil. No estimates of the TCE mass or mass removal in the RGA could be made because soilcores could not be advanced into this gravelly matrix.
The average groundwater concentrations from the two multilevel wells within the treatment zonedid reach the target criteria of 11 mg/L TCE, with an average reduction of approximately 99%.Similar results were observed at all six depths sampled, with initial concentrations ranging 500–1,000 mg/L TCE in most samples and final levels 1–10 mg/L.
The target temperatures were reached at most depths, except in the lowest intervals (95 and 105 ftbgs) as shown in Figure B5-2. This inability to establish a so-called “hot floor” raises someconcerns regarding the potential for removal or containment of DNAPLs at the base of the impactedaquifer. However, modifications to the final design should allow heating the lowest depths as well.
No adverse effects on the adjacent facilities were observed. Pneumatic control of the generatedvapors was achieved, and monitoring of both vapors did not show any evidence of enhancedmigration or escape of VOCs from the treatment area. Unfortunately, hydraulic control was not agoal of the demonstration, complicating any evaluation of the performance. Groundwatertemperatures increased, and TCE concentrations decreased, in both of the control wells that werelocated outside the treatment area.
Lessons Learned. The project demonstrated the capabilities and robustness of the technology. Thetest was conducted in a deep, highly permeable aquifer, with difficulties ranging from powershutdowns to electrode failures. Nevertheless, the results showed ERH effectively heated vadoseand saturated zones, to a maximum depth of up to 100 ft bgs. TCE concentrations were consistentlyreduced by 99% or more, in groundwater with concentrations of up to 1,000 mg/kg, over a 50-ftdepth, with a groundwater velocity of approximately 1 ft per day in the RGA.
The project revealed some other important lessons for future demonstrations and source treatmentprojects:

B-33
• Simplify the electrode design. The electrodes were originally designed to heat at sixdifferent depth intervals. However, the steel shot backfill was too heavy over such agreat depth, leading to collapse and shorting of the entire electrode lengths. Futureprojects should learn from these design difficulties.
• Link performance assessment criteria to RAOs. The goals for treatment should beclearly linked to the Remedial Action Objectives for the site. For example, it is not clearwhether 99% reductions in concentration, to values that still exceed MCLs by threeorders of magnitude, will be acceptable. The impacts of such performance at full scaleon the overall site risks, plume size, plume longevity, or total remediation costs have notyet been established.
• Identify termination criteria. In this test, as in many other source treatment projects, theend point was not clear. As a result, there was continuing debate about when activetreatment could be stopped. Termination criteria should be established beforehand, anddata should be evaluated continually during the project, to determine when theseendpoints have been achieved.
• Hydraulic isolation is valuable for demonstrations. The lack of hydraulic isolationprecluded effectively measuring rebound in the treated source area and complicates anyassessment of technology performance. It also made it impossible to accurately measurechanges in mass flux during and after treatment.
• Continually update the CSM. The CSM suggested DNAPL was pooled at the base ofthe RGA, but the demonstration results indicated this was not the case. The distributionof DNAPL throughout the vadose and saturated zones was shown to significantly affectthe design and costs of the full-scale deployment..
• Avoid DNAPL migration during installation. The evidence suggests that DNAPLmigrated into deeper layers during installation of the electrodes. This apparentmovement of DNAPL along the electrode conduit complicated assessment of thetreatment and possible movement of DNAPL into the low-permeability layer beneath theRGA..
• Phase deployment, especially at large sites. The prototype demonstrated that the initialdesign and operations needed considerable modification. This experience is probablytypical, as designs are optimized to specific site conditions. For a costly technology,phasing deployment allows both cost-efficient operation and the flexibility to respondto new site-specific information.
Contact Information
Beth MooreU.S. Department of [email protected]
Todd MullinsKentucky [email protected]

B-34
CASE STUDY 6. NSB KINGS BAY, SITE 11KINGS BAY, GEORGIA
TECHNOLOGY: Chemical oxidation (hydrogen peroxide)SCALE: FullGEOLOGY: Surficial fill and silty sandsCONTAMINANTS: PCE, TCE, DCE
Background. The Naval Submarine Base at Kings Bay, Georgia is located in southeast corner ofGeorgia, where the St. Mary’s River discharges into the Atlantic Ocean. This Base supports theNavy’s submarine-launched ballistic missile program. It is the only East Coast Naval base capableof supporting the Trident II (D-5) missile.
NSB occupies approximately 16,000 acres in Camden County, Georgia. Site 11 on the NSB wasthe site of an old Camden County Landfill that was incorporated by the NSB in 1979. This site isa 25-acre municipal landfill that operated between 1974 and 1980. The landfill is a Solid WasteManagement Unit subject to corrective action as part of a RCRA Part B Permit. The remedialinvestigation identified chlorinated volatile organic compounds (CVOCs), specifically,tetrachloroethene (PCE), and its degradation constituents TCE, cis-1,2-dichloroethene (DCE), andvinyl chloride (VC) in groundwater emanating from the landfill towards a residential subdivisionapproximately 500 ft away. Over 600 homes are located in the subdivision and many usegroundwater for irrigation purposes.
Groundwater extraction wells with an air stripping treatment system were installed in 1992 toprevent migration of contaminants into the subdivision. While this measure effectively halted themigration on the plume, it was not reducing the contamination. The source of PCE contaminationwas identified on the perimeter of the landfill with concentrations of over 9,000 µg/L. Naturalattenuation of the groundwater was found to be highly efficient but there was not enough distanceprior to reaching the subdivision to complete the process due to the relatively high source areaconcentrations. ISCO was selected to reduce the source of contamination so that the naturalattenuation processes could efficiently treat the residual concentrations.
Three phases of chemical oxidation treatment were conducted during August 1998 through April2000. During the entire treatment program, approximately 35,000 gal of 50% hydrogen peroxideand an equivalent amount of ferrous iron catalyst were delivered to the subsurface. Phase I chemicaloxidation treatment was performed from August 1998 through February 1999. Because of aconcentration increase was measured following the Phase I treatment, a cone penetration testingprogram was conducted in April 1999 to confirm and delineate the horizontal extent of dissolvedgroundwater contamination. Phase II chemical oxidation treatment was performed from May 1999to July 1999 on areas east and west of the Phase I area of concern. Because of a concentrationrebound following the Phase II treatment, a Geoprobe investigation was conducted in August 1999to investigate and locate the potential new source of PCE. Excavation of the suspected source areawas conducted in September 1999. Phase III chemical oxidation treatment was performed fromJanuary 2000 to April 2000 on the delineated source area. Based on the analytical results from thepost-injection sampling event on May 30, 2000, a source area of PCE contamination appeared toremain beneath the injectors.

B-35
Source Area Delineation. An focused source area delineation effort was conducted in two phasesfrom November 6, 2000 through January 12, 2001 to delineate the horizontal and vertical extent ofthe potential source area PCE contamination (and its degradation products) beneath the Phase IIIchemical oxidation treatment injectors. Source Area Delineation No. 1 was completed in November2000 using a membrane interface probe (MIP)/DPT rig. Groundwater samples were collected fromeach boring using the DPT rig with peristaltic sampling pump and analyzed by the on-site mobilelaboratory. Based on the groundwater sample analytical results collected during this initial effort,the vertical interval of contamination in the source area was determined to be 44–48 ft bgs);however, additional groundwater collection sampling and analysis was determined to be necessaryto delineate the horizontal extent of contamination.
Source Area Delineation No. 2 was completed in January 2001. Groundwater samples werecollected on a 25-ft grid, with samples collected from each of nine borings at depths of 36–40,40–44, 44–48, and 48–52 ft bgs and analyzed for USEPA SW-846 Method 8021B. This delineationeffort, along with the initial effort, provided sufficient data to determine the horizontal extent ofcontamination and the area requiring remediation.
Final Fenton’s Reagent Chemical Oxidation Injection. Based on the source area delineation data,a Fenton’s reagent chemical oxidation treatment zone was targeted in the depth interval fromapproximately 40–50 ft bgs. A total of 20 new injectors were installed to a depth of 48 ft bgs witha screen interval 45–48 ft bgs. The Fenton’s reagent chemical oxidation injection program wasperformed in two phases: a primary injection and a polishing phase. Typical injection rates ranged0.4–1.5 gpm, and the total volume of fluids injected at the site was approximately 23,585 gal(approximately 12,220 gal of catalyst and 11,365 gal of 50% hydrogen peroxide). At no time duringthe injection was the concentration of hydrogen peroxide injected greater than 25%. Groundwatersamples were collected for field analytical tests on a daily basis during the injection program. Thefield parameters collected were pH, total iron, chloride, alkalinity, hydrogen peroxide, andphotoionization detector headspace. These analytical parameters were used as screening tools toassist with the injection program.
Performance Objectives. The ultimate goal or RAO at the landfill is to treat groundwater withinthe contaminated plume to concentration levels below the MCLs established by the GeorgiaEnvironmental Pollution Department. Modeling results indicate that source area reduction of CACsto a cleanup objective of 100 µg/L for each compound would be sufficient for natural attenuationto achieve compliance levels in the groundwater plume prior to leaving the base boundaries andreaching off-site monitoring points.
Table B6-1. Cleanup Levels for Groundwater at NSB Kings Bay
Contaminant MCL (µg/L)Cleanup Objective
(µg/L)
PCE 5 100
TCE 5 100
DCE 2 100

B-36
Figure B6-1. Kings Bay Phase I-III Results Showing DissolvedPCE Concentrations
Performance Monitoring and Verification. ISCO was used to treat groundwater contaminatedwith high concentrations of tetrachloroethene (PCE) at the landfill. As a result of the ISCOtreatment, levels of total chlorinated hydrocarbons in the most contaminated areas were reducedfrom nearly 200,000 µg/L in 1999 to 120 µg/L in 2002. Furthermore, in the three years since sourcetreatment began, the off-site plume has decreased to below MCLs, and the on-site plume isapproaching those same levels. This effort has allowed the Navy to accelerate the estimated time forcleanup of the site and turn off the existing pump-and-treat system. The residual on-sitecontamination will be addressed by natural attenuation.
The ISCO treatment achieved over 98% reduction in mean dissolved chlorinated hydrocarbonconcentration. Concentrations of PCE measured at >9,000 µg/L were reduced to <9 µg/L. FigureB6-1 shows the PCE trend between November 1998 and August 1999.
Costs. The total first year cost for implementation of Phase I and II ISCO and UV oxidationtreatment is estimated at $1,050,000. This cost estimate includes an implementation cost of$900,000. Additional annual costs include $65,000 for operations and maintenance, $40,000 formonitoring, and $15,000 for reporting. Phase III chemical oxidation treatment is estimated at$282,000. It is expected that long-term monitoring cost will be substantially diminished at this site,as the time for residual concentrations to meet MCLs through MNA is predicted to be completewithin less than five years. Net present value of project life cycle cost savings are expected toexceed $3.3 million.
Summary. ISCO has been effectively implemented for source reduction at NSB Kings Bay. AtNSB King Bay, 23 injectors were installed and over 12,000 gal of hydrogen peroxide was injectedover 24 days during two treatment events. Source area CVOC concentrations were reduced by anaverage of 98%. The most contaminated well experienced a reduction from >9,000 µg/L totalCVOCs (including 8,500 µg/L PCE) to 65 µg/L (>99% reduction), with little or no rebound 13months after treatment, when total CVOCs measured 85 µg/L. As a result, the State of Georgiaapproved MNA as a final remedy for the down-gradient plume and terminated a long-termpump-and-treat program.

B-37
Lessons Learned
• Additional ISCO treatments were required because highly contaminated source areaswithin the landfill were not initially well understood. The remediation was successfulonce the source of the contamination was finally well defined both vertically andhorizontally.
• The geology (coastal plain deposits) the site was sufficiently permeable that injection ofthe reagents into the aquifer was capable of contacting and destroying the contaminants.
• A remedy utilizing a combination of ISCO and MNA posed some early concernsregarding how quickly the microbial community would rebound from the treatmentprocess. This was determined to be a relatively short period of time. Within six weeksof treatment, the source areas that had been saturated with dissolved oxygen returned toanoxic conditions indicative of anaerobic microbial activity.
• The success of the chemical oxidation of the source area precluded the need to installnew recovery wells and a new expensive off-gas treatment system (UV oxidations) toensure containment of the plume.
Contact Information
Clifton C. Casey, P.E.NAVFAC South DivisionN. Charleston, South Carolina(843) [email protected]
Jim UsseryGeorgia Environmental Protection DivisionAtlanta, Georgia(404) [email protected]

B-38
CASE STUDY 7. BROWARD COUNTY SITEFORT LAUDERDALE, FLORIDA
TECHNOLOGY: Chemical oxidation (permanganate)SCALE: FullGEOLOGY: Medium sandsCONTAMINANTS: TCE, TCA, DCE
Background. Inadvertent releases of small volumes of TCE and TCA occurred in the mid-1990salong an outside wall of an industrial building used to manage waste solvents in Broward County,Florida. The site is underlain by medium-grained sand with a shallow water table (< 3 ft bgs). TCEand TCA contaminated soil and groundwater was discovered in April 1997 at which time solventuse was discontinued and more extensive groundwater investigations were initiated. Initialdirect-push sampling in 1997 was followed by installation and sampling of a network ofconventional 2-inch-diameter monitoring wells with 5- or 10-ft-long screens to delineate the extentof contamination (Parker et al., 2002).
Following a failed attempt to remediate the source zone by injecting a Fenton’s-type reagent in 1998and early 1999, a detailed site characterization was done in February 2000 to facilitate the designof the permanganate solution injections for remediation of the DNAPL source zone. Twocontinuous cores were collected from ground surface to direct-push refusal depth of 75 ft bgs.Detailed sampling of these cores for DNAPL detection using the Sudan IV dye method and analysesby gas chromatography showed no DNAPL occurrences and highest TCE values at 50% TCEsolubility. Detailed depth discrete groundwater sampling was also done using multilevel monitoringsystems (bundle wells) similar to those described by Cherry, et al.(1983). The highest TCE valuemeasured in the bundle wells prior to treatment was 625,500 µg/L, and the highest TCE value foundpreviously by Geoprobe sampling was 940,000 µg/L. These values are only slightly below theaqueous solubility for pure-phase TCE (1,100,000–1,400,000 µg/L). Concentrations of TCA werean order of magnitude below TCE.
The persistence of high TCE concentrations beneath the TCE release area and the occurrence ofhighest TCE values deep in the sand aquifer (55–65 ft bgs) indicate that the TCE contamination iscaused by DNAPL; however, the DNAPL is probably distributed sparsely as small globules thatconstitute extremely low residual saturations. Figure B7-1 illustrates the conceptual model for theTCE contamination and also shows typical pretreatment TCE results obtained from two bundlewells. DNAPL occurs in the source zone as dispersed globules representing the vertical trail ofdownward DNAPL migration. Apparently, the DNAPL descended vertically until it entered a thin(8-inch) coarse sand layer at 57 ft bgs. The larger permeability of the coarse sands likely caused theDNAPL to spread laterally with minimal DNAPL penetrating below this zone. All of the highestTCE and TCA concentrations found prior to permanganate treatment occurred within a near circulararea with a radius of 10–15 ft.
Passive Approach for KMO4 Treatment. The remediation approach used at the Broward Countysite is destruction of the TCE mass in the DNAPL source zone by KMnO4 injections whileminimizing the displacement of contaminated groundwater away from the source zone. These dualobjectives were pursued through injection episodes in which many discrete zones of near-saturation

B-39
Figure B7-1. Nature of the DNAPL source zone: a) geology andconceptualization of DNAPL occurrence, and b) TCE concentrations intwo multilevel systems in the source zone prior to KMnO4 treatment.
KMnO4 solution were created at multiple depths in direct-push holes in the targeted zone. At theend of an injection episode, the pressure pulses in the aquifer quickly dissipate. However, density-driven advection combined with fingering and diffusion causes the KMnO4 solution to spread, whichachieves the coverage in the targeted volume. In the DNAPL source zone the injection point wasdriven to 60 ft bgs using a direct-push rig.
The remediation of the Broward County site was done using the “inject-and-leave” approach in threeepisodes, all in 2000. In the three episodes, a total of 2,791 lbs. of KMnO4 dissolved in 9,166 galof water at a concentration of 40 g/L was injected into a total of 21 holes. Each episode wasfollowed by two sampling events of the detailed network of multilevel systems for measurement ofKMnO4, VOCs, and chloride concentrations for tracking remediation progress.
Performance Objectives. The primary goal of the permanganate remediation was to oxidize theTCE mass in the DNAPL source zone so that the source for the plume no longer existed, allowingthe plume to attenuate by natural processes. In accordance with the Florida DEP’s NaturalAttenuation Default Source Concentrations, state regulators may allow cessation of active sourcezone remediation as long as dissolved concentrations are brought to within 100 times the MCLs andthat natural attenuation processes are occurring. A secondary objectives was to minimize the

B-40
Figure B7-2. Plan view of maximum TCE concentrations found ateach monitoring location prior to KMnO4 injections and 3 monthsafter.
displacement of groundwater with high TCE concentrations away from the source zone. Theeffectiveness of the KMnO4 treatment was demonstrated based on a before-and-after comparisonof TCE and TCA concentrations in the detailed network of multilevel systems and conventionalwells.
Performance Monitoring and Verification. Figure B7-2 shows that, before KMnO4 treatment,all seven of the monitoring locations situated inside the 10,000-µg/L contour (referred to as theDNAPL source zone) had TCE values >16,000 µg/L and as high as 625,500 µg/L. When thecomprehensive post-treatment monitoring occurred three months after the last injection episode,only two of these seven locations showed high values, but at concentrations <35,000 µg/L. FigureB7- 2 also shows two locations just outside of the 10,000-µg/L contour that had moderately highTCE values (3,560 and 7,650 µg/L) before treatment.
After KMnO4 treatment, TCE values at these two locations were below 50 µg/L. Of the five insidethe initial 10,000-µg/L contour area that declined below 10,000 µg/L after treatment, three droppedbelow 150 µg/L, and the other two dropped to 1,300 and 670 µg/L. Therefore, this plan viewcomparison of the maximum before-and-after TCE values at monitoring locations shows clearly thatthe volume of aquifer with high TCE values diminished greatly after KMnO4 treatment.
Figure B7-3 shows the large decline in TCE contamination in cross-sectional view through themiddle of the KMnO4 treatment zone three months after the last injection. (Refer to Figure B7-1 forthe cross-section location.) The cross-sectional area >100 µg/L declined markedly to 10% of thebefore-treatment area, and the area >10,000 µg/L declined to 3% of the before-treatment area.

B-41
Figure B7-3. Comparison of TCE concentrations one monthbefore and three months after KMnO4 treatment observed alongcross section through DNAPL source zone.
Evidence for the TCE destruction is also established by the number of sampling points abovespecified concentrations shown on the cross section. Figure B7-3 shows that 20 sampling points hadTCE in the 100–1,000 µg/L range before treatment; only four had such values after. Beforetreatment, 10 sampling points had TCE values >10,000 µg/L, but after, only two were >10,000 µg/L.Other vertical sections positioned across the former source area displayed similar large decreasesin areas and number of sampling points above specified values.
Measurements of the stable carbon isotope (12C/13C) ratio of TCE in groundwater before and afterKMnO4 treatment provided confirmation of TCE mass destruction. Large increases in 13C relativeto 12C attributable only to oxidation were observed in the treatment zone (Hunkeler and Parker,2002).
An issue that must be resolved when assessing treatment effectiveness is the role of displacementof contaminated water away from the injection points. Depending on sampling locations observed,post-injection declines might reflect the displacement of contaminated water rather than actual TCEmass destruction. The before-and-after monitoring results at the site are not attributable todisplacement because monitoring at all locations in the plume declined after the injections. Ifcontaminated water had been displaced from the source zone into the plume, increases in TCE at oneor more plume locations would be expected. Negligible displacement was ensured given the designof the injections. Another concern inherent in remediation performance assessment is the potential

B-42
for rebound of contaminant concentrations in the treated zone as a result of persistent residualDNAPL dissolution. The comprehensive post-injection sampling described above was done threemonths after the last injection. Additional sampling of selected multilevel points was done threemonths later. These sampling events comprised several points in each of eight bundle wells withinthe former source area. Three of the bundle wells showed no increase, and in the fourth, one pointat 60 ft bgs increased from 34,500 to 50,400 µg/L. This small increase is consistent with thetemporal variability expected from slight groundwater gradient changes causing shifts of the positionof the highest concentration zone. The expected rebound would be much larger if appreciableDNAPL mass remained in this zone.
Discussion. Success of the passive method involving episodic injections of small volumes of denseKMnO4 solution at multiple discrete depths depends on post-injection spreading and sinking of thesolution. Density-driven advection combined with fingering and diffusion must cause invasion ofthe KMnO4 between injection points. Evidence of this invasion derives from the large decrease involume of the TCE contaminated zone, described above, and from comprehensive sampling of thebundle wells for KMnO4 at various times following each injection episode. As expected,immediately after each injection episode, KMnO4 appeared in only a few sampling points becausethe volume input at each injection point was small. At later sampling times, nearly all samplingpoints in the target zone (i.e. inside the initial 10,000-µg/L contour) showed KMnO4 on one or moreoccasions. These occurrences were only temporary because the KMnO4 is continually moving,mixing and being consumed by oxidation of TCE and reaction with natural aquifer components.
The distribution of monitoring points that existed prior to the KMnO4 injection and during thecomprehensive post-treatment sampling left uncertainty about the maximum depth of initial TCEoccurrence and deep TCE treatment. Therefore, near the end of this study a deep monitoring wellwas installed using Rotosonic core drilling. This hole was drilled at the location where deepest TCEwould most likely be found if present. Figure B7-3 shows this well situated in the depth range of81.3–86.3 ft bgs, which is directly below the zone of highest TCE in the 55–65 ft depth zone. Thiswell showed no significant TCE (12 µg/L). Resampling in February 2002 confirmed the absenceof TCE in this well (<1 µg/L). These results indicate that the TCE source zone did not extend to thisdepth or that the sinking of KMnO4 below the deepest injection depth (60 ft bgs) destroyed any deepTCE.
The oxidation of TCE results in release of chloride ions (Cl-) from the TCE to the groundwater. Thestoichiometry for this oxidation reaction specifies that for each mole of TCE oxidized, three molesof Cl- are produced. The preinjection Cl- values in the source zone ranged 20–60 mg/L. Themaximum post-treatment Cl- values were in the range of 150–260 mg/L in the zone where thepretreatment TCE values were generally 100–300 mg/L. The stoichiometric view for Cl- productionpresented above considered only the dissolved-phase TCE in the source zone. It is likely thatDNAPL residual also existed prior to treatment in the source zone, as dispersed globules spacedsufficiently far apart to prevent TCE concentrations from approaching TCE solubility even at thesmall spatial scale used for groundwater monitoring. KMnO4 treatment oxidized dissolved-phaseTCE, and as the dissolved-phase TCE was destroyed, it was replenished by DNAPL dissolution.Therefore, one should expect that Cl- would accumulate in the treatment zone to cause aconcentration rise above the concentrations expected when only the initial aqueous TCE distributionis considered. No such Cl- accumulation is indicated by the post-treatment Cl- distribution.However, the KMnO4 treatment system at the Broward County site is an open system, with an outlet

B-43
at the bottom. Density-driven sinking of the KMnO4 solution after each injection episode mustcause downward transport of Cl- by the sinking KMnO4 solution. Therefore, some of the Cl- wasprobably transported below the maximum depth of Cl- monitoring (i.e., below 70 ft bgs).
The three episodes of KMnO4 injection caused a large reduction in the volume of groundwater withTCE concentrations >100 µg/L and >10,000 µg/L. These results indicate that it is reasonable toexpect that an additional injection episode will bring the destruction of the DNAPL source zone tocompletion. The selection of three injection episodes for the initial phase of this project wasarbitrary. The total initial TCE mass in the source was unknown and therefore there was no basisfor specifying the number of injections and total mass needed to achieve complete remediation. Itwas intended that three injection episodes would be sufficient to establish a trend that would serveas a basis for judging prospects for complete remediation. The trend from the three injectionsindicates that very little DNAPL remains in the source zone and that it exists in a very small volume,exemplified by the small areas within the >10,000 µg/L-contour (Figures B7-2 and -3). Althoughnot expected, the KMnO4 treatments reduced the concentrations and volume of TCA contaminatedaquifer similar to the TCE reductions.
Lessons Learned.
• Isotope analysis made it possible to demonstrate TCE oxidation at locations where Cl-
concentration did not yield unequivocal evidence for TCE oxidation, possibly due tomigration of Cl-.
• By injecting small volumes of near-saturation KMnO4 solution at several depths, aninitial condition of many small, stacked KMnO4 zones with large vertical gaps inbetween was created. However, during the few weeks following each injection episode,these many small KMnO4 zones spread out and descended under the influence of densityand diffusion to achieve complete coverage within the source zone.
• Use of this passive, “inject-and-leave” approach resulted in no observable displacementof high-concentration TCE water outward from the source zone into the surroundingplume.
References
Hunkeler, D., and B.L. Parker. 2002. “Monitoring In Situ Oxidation of TCE by PermanganateUsing Carbon Isotopes.” In A.R. Gavaskar and A.S.C. Chen (eds.), Treating DenseNonaqueous Phase Liquids (DNAPLs). Proceedings of the Third International Conferenceon Remediation of Chlorinated and Recalcitrant Compounds, Battelle Press, Columbus,Ohio.
Parker, B.L., J.A. Cherry, and T.A. Al. 2002. “Passive Permanganate Remediation of a SolventDNAPL Source Zone.” In A.R. Gavaskar and A.S.C. Chen (eds.), Treating DenseNonaqueous Phase Liquids (DNAPLs). Proceedings of the Third International Conferenceon Remediation of Chlorinated and Recalcitrant Compounds, Battelle Press, Columbus,Ohio.

B-44
Contact Information
Beth L. ParkerUniversity of WaterlooKitchener, Canada519-888-4567 (ext. 5371)[email protected]
Doug FittonDepartment of Environmental ProtectionTallahassee, [email protected]

B-45
Figure B8-1. Medial zone of TCE plume at TAN
CASE STUDY 8. INEEL, TEST AREA NORTHIDAHO FALLS, IDAHO
TECHNOLOGY: Enhanced in situ bioremediation (anaerobic reductive dechlorination)SCALE: FullGEOLOGY: Deep-fractured basalt aquiferCONTAMINANTS: PCE, TCE, radionuclides
Background. The historical injection of liquid wastes and concentrated sludges into the SnakeRiver Plain Aquifer using Well TSF-05 has resulted in a nearly 1.9-mi-long TCE, PCE, and tritiumplume in groundwater at the TAN facility of the Idaho National Engineering and EnvironmentalLaboratory (INEEL). The depth to water at TAN is approximately 200 ft. The aquifer and most ofthe unsaturated zone are comprised primarily of layered basalt flows, intercalated with sedimentaryinterbeds deposited during periods of volcanic quiescence. Groundwater flow in the aquifer iscontrolled by the highly transmissive zones that occur at the contacts between individual basaltflows, and to a lesser extent, by fractured zones within flow interiors. The scale of the basaltgeology dictates that preferential flow can be very important at spatial scales less than approximately100 m (330 ft), after which a transition to continuum behavior occurs and the aquifer can be thoughtof essentially as a macro-porous medium.
The distribution of TCE at TAN exemplifies the fringe and core hypothesis for the anatomy ofchlorinated solvent plumes by Cherry (1997). A very large, low-concentration fringe surrounds andemanates from a much smaller, high concentration core (gray shaded area in Figure B8-1). Withinthe core is a very small residual source area that continues to contaminate fresh groundwater flowingthrough from up-gradient. The transition from the scale of the residual source, where preferentialflow is significant, to the scale of the fringe, where sufficient vertical communication has beenpresent along the flow path to create a relatively well-mixed, predictable groundwater plume.
The residual source of contamination in the aquifer near TSF-05 is believed to be composedprimarily of the sludge that was injected into the well over 15–20 years. The pore water of the

B-46
sludge probably contains large amounts of TCE, with PCE and tritium also present in significantamounts. Given the organic content of the sludge, sorbed PCE and TCE are also likely to be present.TCE concentrations as high as 300,000 µg/L have been measured in groundwater from well TSF-05.Some of the sludge has been shown to have TCE concentrations as high as 3%. The sludge thereforerepresents a long-term source of contamination to the aquifer.
It has also significantly affected the properties of the aquifer in the area. The effective porosity nearTSF-05 has been estimated to be about 0.05%, and the transmissivity is about an order of magnitudelower than nearby wells. Both gamma logs measuring radionuclides associated with the sludge andtracer tests measuring effective porosity yield an estimated radius for the sludge distribution of about100 ft.
The 1995 ROD identifies the primary RAO for TAN, which is to restore the contaminated aquifergroundwater by 2095 (100 years from the date of the ROD) by reducing all contaminants of concernto below MCLs and a 1 × 10⁻⁴ total cumulative carcinogenic risk-based level for future residentialgroundwater use and for noncarcinogens, until the cumulative hazard index is less than 1. The RODselected pump and treat as the default remedy for the residual DNAPL source area, but because thisapproach was unlikely to restore the site in a meaningful time frame, it also identified fivealternative technologies to be evaluated for their potential to enhance or replace the default remedy.One of the technologies identified was enhanced in situ bioremediation (ISB).
As described in Section 5.6, the most common performance metric used to assess ISB performanceis groundwater concentrations. Although this metric alone is not generally recommended forassessing the performance of a DNAPL remediation, the monitoring of several groups of parameters(contaminants and degradation products, redox-sensitive parameters, electron donor parameters,biological activity indicators, biological nutrients, and water quality parameters) can essentiallyprovide a multiple lines of evidence approach to monitoring the performance of ISB that isanalogous to using more than one metric described in Section 3 for assessing the performance ofother DNAPL remediation technologies.
Field activities for enhanced ISB began in November 1998 with the shutdown of the interim pump-and-treat facility that was operating in the hotspot and the initiation of the first phase of ISB fieldoperations. The primary performance objective of the field operation was to determine whetheranaerobic reductive dechlorination of TCE in the residual DNAPL source area could be enhancedthrough the addition of an electron donor (sodium lactate). Initially, baseline sampling and aconservative tracer test were performed, followed by initiation of weekly lactate injections into theoriginal disposal well and biweekly groundwater monitoring for the parameter sets described above.
Seven months after sodium lactate injections began, significant dechlorination activity wasstimulated to distances of >40 m from the injection well. For example, TCE concentrations in wellTSF-05 decreased to <10 µg/L, with increases in ethene of up to 2,500 µg/L. Dechlorination wasstrongly correlated with elevated electron donor concentrations and the establishment of stronglyreducing conditions. In particular, dechlorination of TCE to cis-DCE coincided with sulfatereduction, while dechlorination of cis-DCE to vinyl chloride and ethene was observed only in thepresence of methanogenesis. Electron donor concentrations [as chemical oxygen demand (COD)]of >4,000 mg/L and >5,800 mg/L were observed in wells TAN-25 and TAN-26 (refer to Figure B8-2for well locations). By the end of the field evaluation, methane concentrations in these wells were

B-47
Figure B8-2. TAN ISB treatment cell map
20,000 µg/L and 17,000 µg/L, while TCE concentrations had dropped to 68 µg/L and nondetect.Figures B8-3a, -3b, and -3c show the temporal correlation between electron donor arrival, the onsetof methanogenic conditions, and complete dechlorination of TCE to ethene for well TAN-26. Afternine months, lactate injections were discontinued to evaluate anaerobic reductive dechlorinationperformance when propionate and acetate (lactate fermentation products) were the primary electrondonors in the system. The cessation of lactate injections marked the end of the field evaluation andthe beginning of optimization activities at TAN.
A significant outcome of the field evaluation work was the strong evidence indicating that theinjected sodium lactate solution significantly enhanced the bioavailability of TCE in the residualDNAPL source area, thereby accelerating degradation of the source. This effect was evidenced bythe near 21-fold increase in TCE concentrations that corresponded to arrival of lactate in wellTAN-26, followed by complete dechlorination of this newly bioavailable TCE to ethene (Figure B8-3c). Two mechanisms have been described by other investigators that contribute to the enhancedmass transfer effect (Carr, et al., 2000). A third mechanism, which may be the most significant, isthe interaction between the electron donor itself and the nonaqueous TCE. The electron donorsolution enhances dissolution of the TCE and mixes it with the electron donor, making the TCEhighly bioavailable (patent pending). Based on the field data from the FE and subsequent laboratoryexperiments, it was hypothesized that reduced interfacial tension between the nonaqueous TCE andthe aqueous phase was responsible for this effect.

B-48
Figure B8-3. Electron donor (a), redox conditions (b), and VOCs(c) for a TAN ISB monitoring well
ISB has been demonstrated to be a much more effective technology for treatment of residual sourceareas than previously believed. Figure B8-4a shows the pre-lactate TCE concentrations in theresidual source area, and Figure B8-4b shows the TCE concentrations after 21 months of lactateinjections. Based on these substantial concentration reductions within and immediately down-gradient of the DNAPL residual source area, coupled with the evidence for accelerated degradationof the residual DNAPL source, an amended ROD was signed by the State of Idaho and EPA Region10 to replace pump and treat with bioremediation for restoration of the TCE source area at TAN.Operations conducted since the conclusion of the field evaluation have been focused on optimization(the current phase of operations) and long-term implementation of ISB as defined by the objectivesdescribed below.

B-49
TCEIsoplethsTAN-D2
TAN-9
TAN-31
TSF-05
TAN-25TAN-26 TAN-37
TAN-28
TAN-30A
TAN-10A
TAN-29
TAN-49
TAN-27
Pre-Lactate
(a)Figure B8-4. Pre-lactate TCE concentrations (a)and TCE concentrations after 21 months oflactate injection.
October 23, 2000
TAN-D2TAN-9
TAN-31
TSF-05
TAN-25TAN-26
TAN-37TAN-28
TAN-30A
TAN-10A
TAN-29
TAN-49
TAN-27
(b)Figure B8-4b. TCE concentrations after 21months of lactate injection
Performance Objectives. Two stages of operations remain for the TAN ISB hotspotremedy—optimization activities and long-term operations. The primary performance objective forISB optimization activities, which is the current phase of ISB operations, is to distribute electrondonor throughout the entire residual source area to eliminate VOC migration beyond the ISBtreatment cell. The performance metric for this objective, as it was for the ISB field evaluation, ischanges in groundwater concentration. However, in this case, a group of four key wells will serveas sentinel monitoring locations. Wells TAN-28 and TAN-30A will be used to determine whencontaminant migration from the residual source has been eliminated in the down-gradient direction,and wells TAN-1860 and TAN-1861 will be used to determine when contaminant migration fromthe residual source has been eliminated in the cross-gradient direction. Each of these well pairs willserve to indicate when the area of active biological treatment encompasses the entire residual sourcearea.
Once down- and cross-gradient migration has been eliminated, then the ISB remedy will move intoits final phase, long-term operations. The primary performance objective of ISB long-termoperations is to maintain the sufficiently large biologically active zone for a period of time such thatthe residual source material is degraded to a point where natural attenuation processes will addressthe residual levels of groundwater contamination.
Performance Monitoring and Verification. The performance objective for ISB optimizationactivities is to distribute electron donor throughout the entire residual DNAPL source area tocompletely eliminate contaminant migration to down-gradient wells. During the field evaluation,a relatively constant supply of lactate was provided through weekly injections. During initialoptimization activities, however, the presence of propionate and acetate combined with the absenceof lactate resulted in increased dechlorination efficiency as evidenced by conversion of allaccumulated cis-DCE to ethene throughout the residual source area. Therefore, the primaryoperational change during optimization activities was to inject larger pulses of lactate lessfrequently, approximately every six to eight weeks, to increase periods when propionate was theprimary electron donor. This has resulted in significant progress towards meeting the performanceobjective.

B-50
Electron donor distribution has improved during optimization activities, both in terms of distributionof electron donor to wells not previously impacted, and in terms of higher observed donorconcentrations. For example, neither lactate nor its fermentation products (propionate and acetate)were detected in well TAN-D2 (Figure B8-2) during the field evaluation. However, duringoptimization activities, propionate (84 mg/L) and acetate (58 mg/L) both were observed eight daysfollowing a sodium lactate injection. Also, the maximum electron donor concentration (as COD)in well TAN-31 during the FE was 1,700 mg/L. During optimization activities, COD in TAN-31was measured at a concentration of 4,000 mg/L eight days after an injection.
Although substantial progress toward the performance objective for optimization activities has beenmade, the objective has not yet been achieved. To achieve this objective, a second injection well,TAN-1859, was incorporated into ISB operations in December 2003. Although the ISB remedy hasnot yet moved into long-term operations, progress toward this objective can still be measured bymonitoring chloroethene and ethene groundwater concentrations in ISB wells. During optimizationactivities, the same pattern of enhanced TCE dissolution in response to sodium lactate injections,followed by complete dechlorination of the newly bioavailable TCE to ethene that was observed inthe field evaluation still persisted. During optimization activities, TCE concentrations in wellTSF-05 have routinely increased from nondetect to 500–1000 µg/L in response to lactate injections,but then have been subsequently reduced below detection by 4–5 weeks after injections.
The most important and direct evidence for residual source destruction involves well TAN-D2,which is approximately 115 ft cross- and up-gradient of the TSF-05 injection well (see Figure B8-2).To understand these observations, the fate and transport of trans-DCE in the TAN system needs tobe understood. When TCE is biodegraded via reductive dechlorination, greater than 99% of theTCE is transformed to cis-DCE rather than trans-DCE. Thus, it is unlikely that any trans-DCEobserved at TAN is generated biologically. However, significant concentrations of trans-DCE (upto 500 µg/L) have been observed near TSF-05 during ISB operations. This suggests two things—trans-DCE is present as an original contaminant in the injected sludge and diffuses into groundwater,and trans-DCE is recalcitrant to reductive dechlorination in the TAN system. Because of thesethings, trans-DCE acts as a semiconservative tracer for residual source material at TAN. It shouldbe noted that the MCL for trans-DCE is 100 µg/L and that concentrations are an order of magnitudebelow that at the down-gradient edge of the ISB treatment cell (Well TAN-29).
From 11/98 to 3/03, limited reductive dechlorination was occurring at TAN-D2, as evidenced by thesmall amount of ethene production (up to 50 µg/L), however, it was not sufficient to completelydegrade all of the TCE diffusing from the residual source near TAN-D2. During the course of ISBoptimization activities, an injection strategy employing relatively infrequent, large volume injectionswas adopted. These injections contacted a portion of residual source material near TAN-D2 that hadnot been contacted before. Coincident with the electron donor arrival and trans-DCE increase, redoxconditions became methanogenic at TAN-D2 as evidenced by the reduction of sulfate to 0 mg/L andthe presence of ferrous iron and methane. Concurrent with the redox changes, TCE concentrationsdeclined to nondetect.
Currently, the only VOC at TAN-D2 remaining above the detection limit is trans-DCE(approximately 20 µg/L). The importance of the trans-DCE trend at TAN-D2 cannot be overstated.Since trans-DCE acts as a tracer for residual source material, the dramatic increase observed inresponse to the larger injections indicates that additional source material was contacted by these

B-51
larger-volume injections. The fact that trans-DCE is now significantly declined, combined with thefacts that no TCE rebound has occurred and ethene production at TAN-D2 has ceased, suggests thatthis source material has been degraded. In addition, the recent smaller volume injections haveresulted in sulfate concentrations rebounding to near background levels and ferrous iron andmethane concentrations decreasing. This event indicates that redox conditions at TAN-D2 arebeginning to be influenced by up-gradient, uncontaminated water. The fact that neither trans-DCEor TCE has rebounded coincident with the onset of less-reducing conditions at TAN-D2 isconvincing evidence that the residual source material that was present near TAN-D2 is nowcompletely degraded as a result of ISB operations.
Overall, significant progress towards the performance objective for both optimization activities andlong-term operations has been made at TAN. Additional optimization activities are needed todistribute electron donor throughout the entire residual DNAPL source area to completely eliminateflux to down-gradient wells, evaluate alternative electron donors that may decrease long-term costs,and study microbial competition to determine whether the system can be optimized to favor theorganisms of interest.
Lessons Learned
• Enhanced in situ bioremediation can be very effective even in complex source areas,• Toxicity of chlorinated solvents to bacterial communities, once thought to be a problem
for ISB of DNAPLS, may not be an issue. In fact, dechlorinating bacteria may have anecological niche in these high concentration areas,
• Reductive dechlorination is strongly correlated both to electron donor distribution andredox conditions, and,
• Dechlorination efficiency can be controlled in the field by the electron donor additionstrategy and type.
Contact Information
Ryan Wymore North Wind, Inc.Idaho Falls, Idaho(208) [email protected]
Mark JeffersIdaho Department of Environmental QualityBoise, Idaho(208) [email protected]

APPENDIX C
Role of Pilot Tests and Technology Demonstrations

C-1
Appendix C. Role of Pilot Tests and Technology Demonstrations
Pilot studies are primarily conducted to gather information needed to design a full-scale remedialsystem. Treatability studies and technology demonstrations may also be conducted during theremedy selection process to compare the cost and performance of alternate technologies. Becausethey are designed to provide answers to specific questions about a technology’s suitability at a site,pilot studies and technology demonstrations are typically instrumented and monitored moreextensively than full-scale deployments. As such, these technology implementations affordopportunities to obtain performance data not typically collected in full-scale remedial operations(although this information comes at a cost). Careful design and implementation of a robustperformance assessment program is therefore essential to evaluating the pilot or demonstration andwhen selecting final performance metrics for a scaled-up implementation.
The selection of the type of DNAPL remediation technology is dependent on the remedial objectivesto be achieved by the remedial action. The link between the performance objectives for thedemonstration and the criteria for selecting, deploying, and terminating a full-scale DNAPL sourcereduction technology should be clear. This section describes the objectives of a performance reviewthat might be conducted to demonstrate the efficacy of a DNAPL source zone reduction technologyin the unsaturated and saturated zones and to assist in the decision making required under state andfederal programs.
Demonstrating the Feasibility of a Technology
Pilot-scale work and field demonstrations are designed to answer fundamental questions about atechnology’s performance under certain site conditions. They provide an opportunity to applyknowledge to other sites and possibly predict performance. Because pilot studies are often highlyinstrumented, they may provide data on the technology’s impact to the source zone and the dissolvedplume, which can be used to calibrate predictive models.
How does a particular option fare with respect to conventional methods of treatment? A pilot studycan be designed to demonstrate whether a technology is feasible, and if not, what the limiting factorsmight be. Data obtained from a well-documented and instrumented site can be useful whenidentifying and choosing an appropriate remedy at another site. Laboratory bench-scale and pilot-scale treatability tests are often performed prior to a full-scale remediation to evaluate theeffectiveness of a technology and develop specific design parameters for a full-scale remediationsystem. The pilot-scale test is typically conducted in the field presumably under identical conditionsas the full-scale remediation. There are limitations to both tests. For example, a bench-scale test isgenerally performed in a laboratory in a microcosm designed to simulate real site conditions andtherefore can produce results which may or may not reflect the performance of the technology in thefield.
Determining Realistic Performance Objectives and Criteria
RAOs for a full-scale DNAPL source reduction need to take into account how the specific treatmenttechnology impacts the three-dimensional source strength and architecture. To evaluate treatabilitystudy performance relative to achievement of full-scale RAOs, the relationship between source

C-2
treatment, mass reduction, mass flux (distribution of flux and associated mass discharge), and plumeresponse needs to be understood. In addition, the time scale of the response must be understood toestimate cost and performance.
Improving the Conceptual Site Model
The DNAPL architecture and the hydrostratigraphy in the area where the pilot study is performedmust be defined adequately enough to understand how site-specific characteristics may impact thetechnology performance assessment. Soil stratigraphy data collected during the pilot study wellinstallation can provide key information on subsurface features (e.g., confining layers, stratigraphicinterfaces) that might influence the migration and distribution of DNAPL and augment the CSM.For instance, some estimate of the mass and distribution of DNAPL, as well as the uncertainty andpotential error of that estimate, should be determined pre- and post-treatment to validate and test theCSM.
There will always be uncertainties in a site-specific CSM. However, these uncertainties can bemanaged through the remediation design if they are adequately characterized prior to the designprocess. It is not unusual that a pilot will demonstrate that the design and operations needmodification to be implemented at full scale. Phased deployment can allow cost-efficiencies bothin testing and optimizing the modified operational design and in responding to new site-specificinformation.
Selecting the Pilot Study Location
The ideal location for a pilot test would be a small lobe of contamination that extends cross-gradientfrom the main contaminated region. Obviously, such “ideal” pilot-test locations are rare. In general,the pilot test should be located in a representative portion of the site, using knowledge about the sitegeology and DNAPL distribution, so that lessons learned from the pilot can be applied sitewide.Alternately, the project team may elect to locate the pilot study in a section of the site that isconsidered to be more challenging than average so that success achieved under more difficultconditions might extend to the remaining source material.
During a pilot test that is located adjacent to a more contaminated region, the act of remediationcreates concentration gradients and advective flows of vapors and groundwater that cause an inwardcontaminant flux from the surrounding regions. Contaminant flux from concentration gradients isregulated by diffusion. Advective flows into the pilot test volume can result from vapor extractionactivities in the vadose zone or the removal of groundwater as steam during thermal treatments. Forexample. Additionally, if there is a natural groundwater gradient from surrounding contaminatedregions into the pilot study area, fresh contamination will enter the area throughout the study. Thesecontaminant flux sources have several impacts:
• the remediation of the pilot test region proceeds more slowly and requires greater energydensity than a full-scale remediation would require,
• the continual influx of contamination may limit the percentage reduction that can beachieved in a pilot test,

C-3
• groundwater concentrations may rebound after the pilot test is complete due togroundwater mixing and diffusion if monitoring wells are not placed near the center ofthe pilot test region, and,
• soil is typically not prone to the same mechanisms that cause rebound to occur ingroundwater concentrations; however, treatment-induced redistribution of DNAPL couldcause post-treatment soil concentrations to increase in some regions of the treated zoneand influence post-sampling results in a manner suggestive of rebound. Soil samples canbe collected from locations that are closer to the edge of the pilot test treatment region,in locations where monitoring wells would not be recommended.
Addressing Scale-Up Issues
Designing a full-scale remediation based on a pilot-scale demonstration requires understanding thelimitations of the pilot-scale data and identifying which problems can be accounted for andovercome in the full-scale design. Information essential for the design that should be collectedduring the pilot study includes the following:
• effectiveness of treatment delivery,• DNAPL removal rates as a function of operational time and energy consumption,• constructability of the source reduction system,• effectiveness of the design in controlling DNAPL migration,• construction and operation costs as a function of DNAPL mass removed or destroyed,• effects of the source reduction system on adjacent utilities and facilities, and,• potential for operations to impact vulnerable receptors.
It is especially important to address the following issues before designing a full-scale system:
Potential Impacts to Groundwater. Field demonstration work plans should include groundwatermonitoring at treatment completion as well as over a predetermined period. The work plan shouldaddress ongoing measures of removal, contaminant rebound, recontamination of the test area aftertreatment, and methods to improve performance during full-scale treatment. In addition, an adequatenumber of sampling events must be determined to effectively characterize starting conditions,including allowance for any natural variability in groundwater concentrations.
Formation of Treatment By-Products. The pilot study should be adequately designed and monitoredto provide information on potential treatment by-products. For example, the potential for formingtoxic intermediates in situ during subsurface oxidative processes should be addressed. Also, thepossibility of steam venting at the surface or induced pressure gradients causing uncontrolledmigration of vapors should be considered. Hydraulic control of surfactant or cosolvents and theimpact of residual chemicals and their breakdown products should be considered for in situ flushingtreatments.
Effectiveness and Efficiency of Treatment. The pilot study should provide information on howeffective the technology is in dealing with heterogeneity in the treatment volume, recoveringDNAPL, and reducing the mass flux emanating from the treated source. Data from the study shouldallow remediation effectiveness and efficiency to be evaluated at the deepest treatment interval andat any key stratigraphic interfaces. It should be noted that if a pilot study is conducted within a

C-4
larger DNAPL zone, it may be very difficult to assess performance with respect to the longevity ofreductions in DNAPL source strength.
Transition criteria. The criteria for shutoff of the source reduction system must have a cleartechnical basis (e.g., technically supportable asymptote-based goals based on predicted subsurfacecontaminant concentrations or ex situ operational data). The transition to the next step (unit process)in the treatment train should be planned in advance and critical parameters and decision pointsidentified prior to performing the pilot test, if possible.
Constructability. The pilot study should be adequately designed to assess the constructability of theDNAPL source reduction technology. In addition, the DNAPL source reduction system should notnegatively impact adjacent utilities and facilities, including no observed vapor transport into nearbyengineered structures.
Assessing Costs
An examination of cost with respect to DNAPL mass removal is of questionable value forcomparing the costs of alternate mass removal technologies unless the mass removal rates arenormalized by an accurate estimate of the mass originally in place. The cost assessment should bedesigned to both determine operation costs as a function of DNAPL mass removed or destroyed andassess the cost-effectiveness of the DNAPL source reduction technology. It should be noted thatcosts for pilot studies are strongly affected by site scale.
The cost-effectiveness of a technology is also influenced by the long-term operational costs forplume management and/or containment, including long-term groundwater monitoring costs, plusany secondary treatment technology costs for plume management. Final cost comparisons shouldtherefore include total costs to achieve RAOs even if a technology is being considered for partialsource depletion only (i.e., the impacts on subsequent technologies in a treatment train should beconsidered, and total costs of alternate treatment trains should be compared).
The following information is needed for the full-scale cost estimate:
• Operating costs. The pilot study should be used to determine the full-scale treatmenttechnology duration and the time-dependent operating costs as estimated by the pilotdemonstration.
• Mass capture and performance of adjunct treatment technologies. The demonstrationshould provide data needed to estimate adjunct treatment process requirements (e.g.,off-gas treatment) and select the most cost-effective technology. For example, granularactivated carbon treatment may be expensive for long-term projects; therefore, it wouldbe prudent to identify and cost alternate off-gas treatment processes.
• Vertical DNAPL profiles. The design should be successful at reducing the DNAPLsource at the deepest portions of the source. The full-scale design must ensure sourcerecovery at all targeted depths.

C-5
• Contaminant residuals. The long-term impacts of remaining contaminant mass on sourcestrength should be included in long-term projections of groundwater plume migrationand longevity.

APPENDIX D
Statistical Approaches to Evaluating Performance

D-1
Appendix D. Statistical Approaches to Evaluating Performance
The use of statistical analyses of the data is an important tool in evaluating performance. Accuratemeasurement of performance is critical to making project decisions. For example, deciding whetherto expand a pilot test to full scale or how long to operate a remediation system. DNAPL remediationtechnologies, some of which are summarized in Section 4, are biologically, chemically, andphysically complex engineered systems. Data generated from remediation sites are often full ofgood information but sometimes too complex to easily see system trends and may requiresophisticated statistical and data modeling procedures to evaluate. For instance, assessing the degreeof change in contaminant levels between pre- and post-treatment may require a modeling procedureor established methods that can account for temporal and/or spatial data correlation.
It is easy for a project manager to get lost in the world of statistics and modeling, for some of theconcepts and literature in the field is quite obscure. Fortunately, there are tools and reports to help.The EPA has published a series of guidance documents to assist managers in making defensibledecisions, some of which are listed below:
• Guidance on Choosing a Sampling Design for Environmental Data Collection(QA/G-5S). EPA/240/R-02/005. www.epa.gov/quality/qs-docs/g5s-final.pdf,
• Guidance for the Data Quality Objectives Process (QA/G-4). EPA/600/R-96/055. www.epa.gov/quality/qs-docs/g4-final.pdf,
• Decision Error Feasibility Trials (DEFT) Software (QA/G-4D). EPA/240/B-01/007. www.epa.gov/quality/qs-docs/g4d-final.pdf,
• Guidance for the Data Quality Objectives Process for Hazardous Waste SiteInvestigations (QA/G-4HW). EPA/600/R-00/007.www.epa.gov/quality/qs-docs/g4hw-final.pdf,
• Guidance for Data Quality Assessment: Practical Methods for Data Analysis(QA/G-9) EPA/R-96/-84 (QA00 Update). www.epa.gov/quality/qs-docs/g9-final.pdf,
• Data Quality Evaluation Statistical Toolbox (DataQUEST) (QA/G-9D).www.epa.gov/quality/qa_links.html#software.
In addition, comprehensive descriptions of most statistical methods, with tutorials, can be found inthe recently published Contemporary Statistical Models for the Plant and Soil Sciences(Schabenberger, 2001).
Sampling Design
The sampling program and the statistical model must be designed in a manner that meets the specificgoal. The question is, which should be selected first: the statistical model to be used for the dataanalyses or the sampling program? It would be prudent to plan this process in advance so that theappropriate data set (spatial and temporal) is collected to meet the data analysis requirements.Because the appropriate statistical model to be used will depend upon the nature and form of the databeing collected (e.g., seasonality, data distribution), the sampling program should be designedinitially using some assumptions about the data, with an agreement to review the data as it is beingcollected and to modify that plan, if necessary.

D-2
Most statistical methods require a minimum round of samples and a particular samplingmethodology (e.g., random sampling, systematic grid sampling, or cluster sampling). Additionally,some statistical methods require a “repeated-measures” sampling design, which may involve therepeated collection of samples from the same location and depth.
The objectives or goals of a particular technology evaluation may be set to determine the following:
• the approximate reduction in contaminant concentrations that occurs in groundwaterwithin the treatment zone as a result of using a particular remediation technology, or,
• the mass removal over the course of treatment, or,• the decrease in mass discharge,• whether the mean concentration after treatment is significantly different from the
mean concentration before treatment.
The two main approaches to solving these challenges involve the use of statistical or approximationmodels and of integrated physics-based models with statistical representations of the subsurface withsite data. In either process, the optimal estimate of the subsurface condition is desired. The dataneeds and level of effort to produce the estimates vary widely and fitting the analysis with the needsof the project is strongly advised.
Some models may require a comprehensive exploratory data analysis before the formal model is fitto any contaminant data. This analysis may include the construction of time-trend data plots foreach well-depth interval combination (to assess the degree of consistency in the treatment effect),temporal and spatial variance analyses (to assess variance stability assumption across different wellsand sampling time frames), and the need for any data transformation(s). Additionally, a decisionmust be made regarding the treatment of the nondetects. In many cases, a zero concentration maybe a very useful piece of information, as it can bound the extent of impacts and thus help limitoverextrapolation exhibited by some of the predictive methods, such as kriging. Some statisticalmethods may require a degree of detectable contaminant levels, however minimal that is. Nondetectdata may be deleted or some percentage of the detection limit may be used.
To assist the project manager who lacks extensive statistical training with sampling plan design, freepublic domain software called Visual Sampling Plan 2.0 is available. It implements eight commonlyused statistical methods in Excel® spreadsheets and a Microsoft Windows package, specifically, theOne-Sample t-Test, Two-Sample t-Test, Wilcoxon Signed Rank Test, One-Sample Proportion Test,Two-Sample Proportion Test, Wilcoxon Rank Sum Test, MARSSIM Sign Test, and MARSSIMWRS Test. See www.hanford.gov/dqo for details, users guides, software, and tutorials. Thesoftware is limited to two-dimensional analysis.
Data Analysis Procedures
• Analysis of variance (ANOVA). This is the analysis of variance procedure, acollection of statistical models and procedures for comparing means (Maxwell andDelaney, 1990). Comparing background wells to compliance wells can beaccomplished using this method. The one-way ANOVA test is used when one factor(such as the presence of DNAPL) is responsible for the differences in the data

D-3
populations, whereas the two-way ANOVA test is used when the differences are dueto two factors, such as DNAPL saturation and geology. These can be parametric ornon-parametric procedures.
• Tolerance and prediction intervals. Comparing background wells to responseboundary or compliance wells can also be accomplished using this method. Thetolerance interval is obtained from the data in the background wells. Then, the datacollected from the nonbackground wells are used to assess whether they fall withinthe tolerance interval. If not, a conclusion that the nonbackground wells are affectedis reached. This test is best used when the geology is fairly homogeneous and thedata (raw or log-transformed) are normally distributed.
• Control charts. These are constructed primarily from nonimpacted-well data. Theycan be used to detect when the concentration in a well goes “out of control,”indicating probable contamination. The Shewart-CUSUM control chart is well-suitedfor this application (Gilbert, 1987).
Geostatistical Estimation Techniques
Geostatistical methods comprise a collection of techniques to solve estimation problems whengeoreferenced spatial variables are involved. This includes estimating the mass of DNAPL orvolume of dissolved plume, for example. Spatial dependence of variables is expressed in terms ofa variogram.
Many geostatistical methods are employed at hazardous waste sites. There are variance-basedgeostatistical methods, concentration-based geostatistical methods, as well as others. A commonlyused method of estimating mass and volumes of DNAPL is kriging, a linear geostatisticalinterpolation method. A good reference on geostatistical methods is available for download at theU.S. Army Corps of Engineers Web site (USACE, 1997). The method used when kriging chemicaldata is affected by the sampling program, specifically preferential sampling (bias sampling) of thehigh-concentration areas.
There is a significant growth in the use of mixed models, brought on by an increased appreciationof the importance of modeling variation in complex systems. These can be classified into three maingroups: mixed-linear models, generalized linear models, and nonlinear mixed models. Mixedmodels broaden the statistical inference, recover all the relevant information in the data, handlecorrelation structures in the data, and handle nonhomogeneous variances. The mixed-linear modelis a good example for modeling data with both spatially and temporally dependent error structures.It can be used to estimate and test the statistical significance of the treatment effect, while at thesame time adjusting any spatial and/or temporal effects. The mixed-linear model is described indetail in Milliken and Johnson (2001) and Littell, et al. (1996). The commonly used statisticalsoftware package called SAS/STAT® implements all three of the main types of mixed models.
Trend Analysis
In addition, the statistical analysis may include a nonparametric test for trend. The Mann-Kendalltest is a good example of the nonparametric test for trend. This test is a useful technique for

D-4
analyzing the data since missing values are allowed and the data do not have to fit any particulardistribution. Also, nondetect and trace concentrations can be used. These data can be used becausethe Mann-Kendall test uses only the relative magnitudes of the data rather than their measuredvalues. A detailed description of the Mann-Kendall test can be found in Statistical Methods forEnvironmental Pollution Monitoring (Gilbert, 1987). Other trend analyses are potentially applicableto data analyses involving DNAPL source remediation.
Integrated Physical-Geostatistical Methods
The methods described above rely on historical data and professional judgment.Physical-geostatistical methods, in contrast, integrate the physics of the remediation (throughsimulation models), the uncertainty (through geostatistics), the spatial-temporal data (using aKalman filter to estimate the confidence interval of the plume fringe), and the best locations andtime to sample (to reduce uncertainty in the estimate of residual DNAPL). They are also used todevelop optimal long-term monitoring plans for assessing the performance of a remedial action, forexample, or natural attenuation monitoring. Physical-geostatistical methods are more complex toimplement but provide very valuable information based on physical models and site data.
These are some of the many options the site managers have at their disposal to conduct a statisticalevaluation of the data. Table D-1 lists some statistical and probabilistic methods for analyzingenvironmental data and their use in performance assessment.
References
Gilbert, R.O. 1987. Statistical Methods for Environmental Pollution Monitoring. Van NostrandReinhold, New York.
Littell, R., G. Milliken, W. Stroup, and R. Wolfinger. 1996. SAS System for Mixed Models, SASInstitute, Cary, N.C.
Maxwell, S.E., and H.D. Delaney. 1990. Design Experiments and Analyzing Data: A ModelComparison Perspective. Wadsworth Publishing Company, Belmont, Calif.
Milliken, G.A., and D.E. Johnson. 2001. Analysis of Messy Data, Vol. 3, Analysis ofCovariance. Chapman & Hall/CRC, New York.
Schabenberger. 2001. Contemporary Statistical Models for the Plant and Soil Sciences. SASInstitute, Cary, N.C.
U.S. Army Corps of Engineers (USACE). 1997. Engineering and Design: Practical Aspects ofApplying Geostatistics at Hazardous, Toxic, and Radioactive Waste Sites. ETL1110-1-175. www.usace.army.mil/inet/usace-docs/eng-tech-ltrs/etl1110-1-175/toc.html

D-5
U.S. Environmental Protection Agency (EPA). 1992. “Statistical Methods for Evaluating theAttainment of Cleanup Standards,” Volume 3: Reference-Based Standards for Soils andSolid Media. Office of Policy Planning and Evaluation, Washington, D.C.www.epa.gov/swertio1/download/stats/vol3-refbased.pdf
Table D-1. Examples of Statistical and Probabilistic Methods for Analyzing ConcentrationData from Non-Natural Sources
Statistical Method Description/Example Use Comments
Analysis ofvariations(ANOVA)
Compare background well tocompliance well(s) concentration“populations.”
Typically compare the populationmeans. Grouped into parametric ornon-parametric procedures.
One-way ANOVA applied when onefactor (i.e., DNAPL source) isresponsible for inter-populationdifferences.
Two-way ANOVA appropriate whenDNAPL and geology account fordifferences in populations.
When data in background wellscollected different time period than thenon-background data, important tocorrect for seasonal components.
Tolerance andprediction intervals
Compare background well tocompliance well(s) concentration“populations.”
Tolerance interval constructed forbackground well(s). If any results fromthe compliance/remediation wellconcentration are outside of tolerance,conclude well is contaminated.
Prediction interval is constructed usingthe mean and standard deviation of thebackground data. Evidence of wellcontamination is concluded if a meanfalls outside the prediction interval.Called “prediction” as samplescollected for tests are usually in thefuture.
Best when either the raw orlog-transformed data are normallydistributed.
Most appropriate when thehydrogeologic system is relativelyhomogeneous.
Fixed standardscomparison
Compare well concentrations to a fixedstandard, such as an alternativeconcentration limit (ACL).
Grouped into parametric ornonparametric procedures. Can useconfidence or tolerance intervals.
If the lower limit of the confidenceinterval in a nonbackground wellexceeds the MCL/ACL, contaminationis concluded.

Statistical Method Description/Example Use Comments
D-6
Single-wellassessments
Used to evaluate trends in a single wellvia Shewhart-CUSUM control charts.
Used to assess changes inconcentrations in a well due tounnatural causes, such as probablecontamination.
Best for uncontaminated wells, whereeight seasonally correctedconcentration measurements areavailable in a single year.
Raw or log-transformed data arenormally distributed.
Mann-Kendall test Used to evaluate trend. Useful sincemissing values are allowed and dataneed not conform to any particulardistribution.
The relative magnitudes of data areused rather than their measured value. Therefore, trace or less than detectionlimit can be used.
Mixed models Three main groups: mixed linearmodels, generalized linear models, andnonlinear mixed models.
Mixed models broaden the statisticalinference, recover all the relevantinformation in the data, handlecorrelation structures in the data, andhandle nonhomogeneous variances.
The mixed-linear model is a goodexample for modeling data with bothspatially and temporally dependenterror structures. It can be used toestimate and test the statisticalsignificance of the treatment effect,while at the same time adjusting anyspatial and/or temporal effects.
Geostatisticalmethods
Methods which estimategeoreferenced, spatially distributeddata. Kriging is a geostatisticalinterpolation method.
Can be used to estimate concentrationwhere data do not exist, the volume ofplume or DNAPL mass, or the locationof samples collection to reduce thevariance of the estimation error in theabove.
Various types of kriging exist, such asordinary, nonstationary (when thecontaminant is moving), co-kriging(when two or more variables provideinformation for the estimate), quantilekriging, and nonlinear geostatistics.
Performance is highly dependent ofvariability of the concentration data andpreferential sampling of highconcentration areas.
Integrated physicaland stochasticestimation
Integrated approach uses geostatistics,flow and transport models to simulatedistributions of contaminants in spaceand time. Uses Kalman filters andother algorithms to optimize welllocations for plume finding and sampletiming for optimal plume monitoring.
Requires (even a rudimentary)subsurface flow and transportsimulator.
Requires estimation of geostatisticalvariogram for stochastic simulation.

APPENDIX E
Responses to Comments

E-1
Appendix E. Responses to Comments
NOTE: Responses to comments are in bold. Specific pages and line numbers mentioned in thecomments refer to a review draft of this document. In many instances those references do notcorrespond to the published version.
Tom Sale - Colorado State University
1. My hat is off to you and your ITRC colleagues. This is a verygood document. Specifically: 1) the material is relevant and topical,2) the document is well organized and clearly written, and 3) thedocument maintains objective perspectives on a series of difficulttopics. My primary suggestion is that you consider expanding theexecutive summary. As is the document is far more than a quickread. Most people that pick up the document will not have the timeto get through it. Consider writing a 5 to 8 page executive summarythat hits the high points of each section. Those seeing topics criticalto their interests will be inspired to dig deeper. One option would beto use a frequently asked questions format per API Bulletin 18.
We concur. The Executive Summary has been lengthened.
2. Recently, there has been recognition that sorbed and dissolvedphases in relatively stagnant portions of source zones can sustainconcentrations at plume heads for extended periods. With this theEPA Expert Panel Source Zone Report and the soon to be releasedNRC Report recognize the source as the areas in which DNAPL oran alternate high concentration release initially occurred. As anexample one could imagine fractured clay in which most of theDNAPL has been depleted by diffusion into stagnant zones. Contaminants in stagnant zones (sorbed and dissolved contaminants)can express themselves via back diffusion. (See the source zonedefinition in the recently released EPA Expert Panel document http://www.epa.gov/ada/pubs/reports.html).
We will revise Section 2.3 on rebound to incorporate the conceptsof stagnant zones and potential back diffusion. Based on othercomments, Section 2.1.2 on matrix diffusion and discussion offractured bedrock has been eliminated from the document. Thedefinition of a DNAPL source zone has been revised to coincidewith the EPA Expert Panel report.
3. Figure 1.2 was originally developed by Bernie Kueper at QueenUniversity. You should give him credit.
Dr. Kueper has been contacted and has agreed to let us use thefigure.
4. Page 14, Line 4. It might appropriate to add that rigorousdefinition of the amount of DNAPL is difficult.
We agree that it is difficult to define the location of DNAPLsource zones; and we say so.
5. Section 2.2, 2nd paragraph, first sentence, not all changes insource zone architecture will improve removal or destructionefficiencies, consider rephrasing this.
The sentence has been rephrased to read “... changes may occurin the source zone ...”
6. Page 17, Line 7, you might want to note that increased temp canincrease NAPL mobility (primarily a concern with coal tar andcreosote).
We concur and addressed this issue under Redistribution ofDNAPL.
7. Page 20, in the bullets, consider adding back diffusion fromstagnant zones as a cause of rebound
This has been addressed in comment 3.
8. Page 21, 3rd full paragraph, consider adding surfaceobstructions as a factor effecting treatment difficulty (e.g. workingunder process unit in refineries is different than working in an openfield)
We have added a reference to surface and subsurfaceobstructions.
9. Section 3.1.2 – It seems that eliminating any complete exposurepathways should be the first short-term goal.
We consider “controlling immediate risk” to be the same as“eliminating any complete exposure pathways.”
10. Section 3.2.1 – Is DNAPL removal really the primary goal, Whynot reducing contaminant loading to the environment, there are morethan a few situations where DNAPL removal is not the primary goal,consider rewording.
We have deleted the first paragraph and the bulleted list.
11. Typically, developing rigorous estimates of contaminant mass inplace is not practical. Be careful in this section with leaving theimpression that it is typically a doable thing.
We agree and have made a few modifications as appropriate.
12. Section 3.6.2 2nd paragraph, text describing the rarity of closurein the “absolute sense”, should be included to managingexpectations; to my knowledge no DNAPL site has been cleaned upto MCLs. Text supporting this position can be found in the recentEPA expert panel report(http://www.epa.gov/ada/pubs/reports.html).
We concur and the paragraph has been modified.
13. Table 4-1 Source mass remaining & Mobility reduction: (a) thecombination of two topic confuses me, perhaps some punctuation oran “and” would help; (b) why aren’t soil cores listed as aperformance method? ©) PITTs only work in the swept volume anddon’t work in thick NAPL zones due to mass transfer limitations, I’msurprised that the relative accuracy is intermediate to high. I suspectmore than a few people who have used PITTs would debate this.
(a) We have separated into two topics or metrics; (b) we haveincluded soil coring as a method of estimating mass; ©) therelative accuracy of PITTs has been changed.
14. Table 4-1 Mass flux / mass discharge. Listing the relativeaccuracy as Intermediate to High seem premature. It seems to methat our understanding of this topic is evolving rapidly and that youare getting a bit ahead of the science.
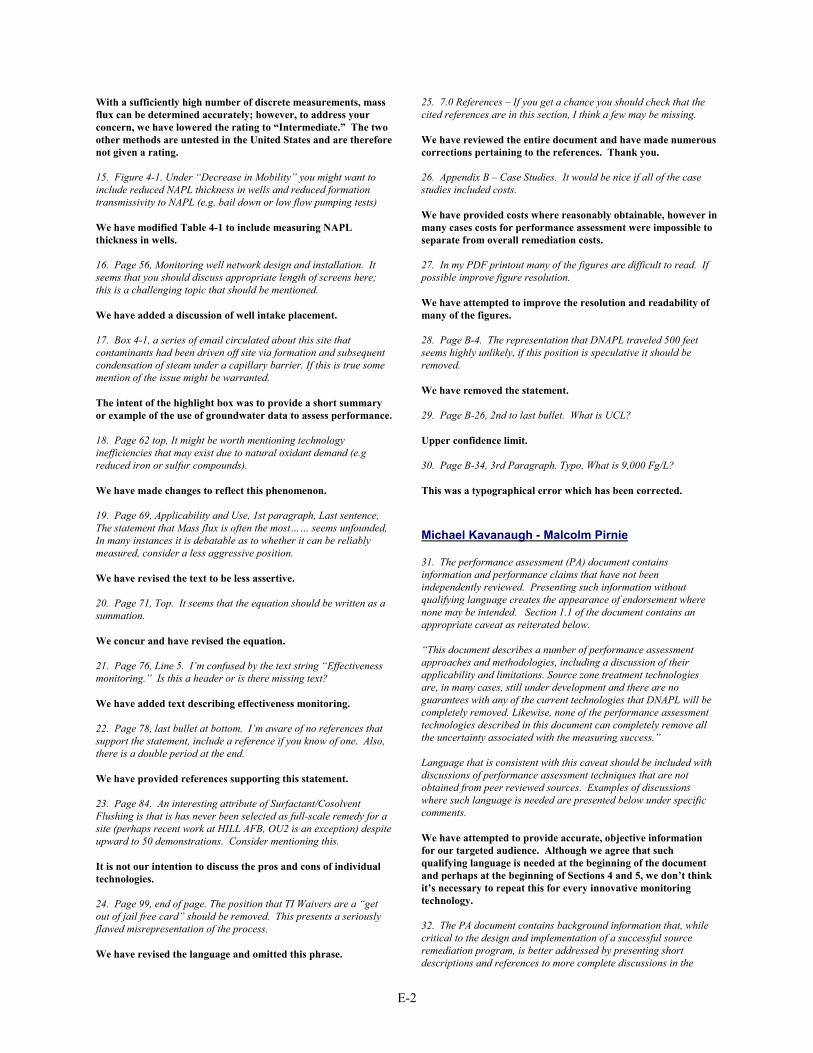
E-2
With a sufficiently high number of discrete measurements, massflux can be determined accurately; however, to address yourconcern, we have lowered the rating to “Intermediate.” The twoother methods are untested in the United States and are thereforenot given a rating.
15. Figure 4-1. Under “Decrease in Mobility” you might want toinclude reduced NAPL thickness in wells and reduced formationtransmissivity to NAPL (e.g. bail down or low flow pumping tests)
We have modified Table 4-1 to include measuring NAPLthickness in wells.
16. Page 56, Monitoring well network design and installation. Itseems that you should discuss appropriate length of screens here;this is a challenging topic that should be mentioned.
We have added a discussion of well intake placement.
17. Box 4-1, a series of email circulated about this site thatcontaminants had been driven off site via formation and subsequentcondensation of steam under a capillary barrier. If this is true somemention of the issue might be warranted.
The intent of the highlight box was to provide a short summaryor example of the use of groundwater data to assess performance.
18. Page 62 top, It might be worth mentioning technologyinefficiencies that may exist due to natural oxidant demand (e.greduced iron or sulfur compounds).
We have made changes to reflect this phenomenon.
19. Page 69, Applicability and Use, 1st paragraph, Last sentence,The statement that Mass flux is often the most…… seems unfounded, In many instances it is debatable as to whether it can be reliablymeasured, consider a less aggressive position.
We have revised the text to be less assertive.
20. Page 71, Top. It seems that the equation should be written as asummation.
We concur and have revised the equation.
21. Page 76, Line 5. I’m confused by the text string “Effectivenessmonitoring.” Is this a header or is there missing text?
We have added text describing effectiveness monitoring.
22. Page 78, last bullet at bottom. I’m aware of no references thatsupport the statement, include a reference if you know of one. Also,there is a double period at the end.
We have provided references supporting this statement.
23. Page 84. An interesting attribute of Surfactant/CosolventFlushing is that is has never been selected as full-scale remedy for asite (perhaps recent work at HILL AFB, OU2 is an exception) despiteupward to 50 demonstrations. Consider mentioning this.
It is not our intention to discuss the pros and cons of individualtechnologies.
24. Page 99, end of page. The position that TI Waivers are a “getout of jail free card” should be removed. This presents a seriouslyflawed misrepresentation of the process.
We have revised the language and omitted this phrase.
25. 7.0 References – If you get a chance you should check that thecited references are in this section, I think a few may be missing.
We have reviewed the entire document and have made numerouscorrections pertaining to the references. Thank you.
26. Appendix B – Case Studies. It would be nice if all of the casestudies included costs.
We have provided costs where reasonably obtainable, however inmany cases costs for performance assessment were impossible toseparate from overall remediation costs.
27. In my PDF printout many of the figures are difficult to read. Ifpossible improve figure resolution.
We have attempted to improve the resolution and readability ofmany of the figures.
28. Page B-4. The representation that DNAPL traveled 500 feetseems highly unlikely, if this position is speculative it should beremoved.
We have removed the statement.
29. Page B-26, 2nd to last bullet. What is UCL?
Upper confidence limit.
30. Page B-34, 3rd Paragraph. Typo, What is 9,000 Fg/L?
This was a typographical error which has been corrected.
Michael Kavanaugh - Malcolm Pirnie
31. The performance assessment (PA) document containsinformation and performance claims that have not beenindependently reviewed. Presenting such information withoutqualifying language creates the appearance of endorsement wherenone may be intended. Section 1.1 of the document contains anappropriate caveat as reiterated below.
“This document describes a number of performance assessmentapproaches and methodologies, including a discussion of theirapplicability and limitations. Source zone treatment technologiesare, in many cases, still under development and there are noguarantees with any of the current technologies that DNAPL will becompletely removed. Likewise, none of the performance assessmenttechnologies described in this document can completely remove allthe uncertainty associated with the measuring success.”
Language that is consistent with this caveat should be included withdiscussions of performance assessment techniques that are notobtained from peer reviewed sources. Examples of discussionswhere such language is needed are presented below under specificcomments.
We have attempted to provide accurate, objective informationfor our targeted audience. Although we agree that suchqualifying language is needed at the beginning of the documentand perhaps at the beginning of Sections 4 and 5, we don’t thinkit’s necessary to repeat this for every innovative monitoringtechnology.
32. The PA document contains background information that, whilecritical to the design and implementation of a successful sourceremediation program, is better addressed by presenting shortdescriptions and references to more complete discussions in the

E-3
published literature. Examples are presented below under specificcomments.
We concur and have provided numerous additional references tothe published literature. We do, however, feel it is important toprovide the reader with sufficient background matter in adocument such as this.
33. Section 2.1.2, Page 9. The definition of source architecture isvague. Also, this section does not present the concept of DNAPLdistribution in low-K vs. high-K zones, which is the primarylimitation of DNAPL architecture on flushing technologies.
We have attempted to clarify the meaning of source zonearchitecture and the affect that proximity of DNAPLs to morepermeable zones has on remedial effectiveness.
34. Page 13. The suggestion that bacteriophages are used asparticulate tracers in groundwater needs a peer-reviewed reference.
We have removed this reference.
35. Section 2.1.3: Source Zone Delineation. This section isunnecessary. The concepts are better addressed by reference topublished literature such as the referenced ITRC document andPankow and Cherry’s Dense Chlorinated Solvents.
We have revised this section to focus on CSM developmentinstead of source zone delineation. It has been renamed andreduced in length, and additional references have been added.
36. Section 2.2: Changes in DNAPL Source Zone ArchitectureResulting from Treatment. This section presents eight potentialimpacts to the DNAPL source zone that may occur due to applicationof an aggressive source removal technology. The fact that therelative importance of each impact is technology specific is lostwithout relating each impact back to the technology.
We use specific technologies as examples throughout the section.
37. Page 15. The meaning of “magnitude and style ofheterogeneity” is not clear.
We have deleted the phrase.
38. Page 17. The paragraph under Preferential Flow refers to“mobility control (as practiced in the petroleum industry).” Mostreaders will not know what this is.
We concur and have revised the sentence to read: “The use ofmobility control agents (i.e., foams and gelants injected into thepore spaces) may mitigate the effect of preferential flowpathways and improve sweep efficiency.”
39. Section 3.1.4 Assessing Costs, Page 27. The discussion on totalrestoration costs begins with the phrase “It may be prudent that...” A more appropriate introduction would be “It is essential that…”
We concur. Also, Section 3.1 on the role of pilot studies has beenmoved to Appendix C.
40. Section 3.4: Statistical Approach to Evaluating Performance andSection 3.5: Data Quality Considerations. Both of these sectionscontain information critical to performing source areacharacterization and remediation. However, for the purposes of thePA document the discussion could be better addressed by referringthe reader to published literature.
We concur. Section 3.4 has been moved to Appendix D. Discussion of the Triad has been revised to focus on performanceassessment.
41. The TRIAD discussion contains too much information on whatTRIAD is and too little on what its benefits are for performanceassessment.
Comment accepted. See revised text for Section 3.4.
42. Section 4.2.1: Decrease in Soil Concentration, Page 52. InTable 4-2 the ratio of Target Area (AT) to Site Area (AS) should notbe greater than one.
We have made corrections to the Table 4-2.
43. Section 4.2.2 Decrease in Dissolved Concentration, Page 54: inorder to be consistent with Section 4.4.3, the last sentence underMulti-level sampling should read (changes in bold) “Multi-levelsampling itself is not the same as plume loading measurement per se(described in section 4.4.3); however, if the monitoring wells areproperly distributed cross-gradient along the control plane (lateralextent), then data generated by a network of multi-level samplerscan be used to estimate contaminant plume load for different depthsalong the control plane.”
The suggested language has been added/revised.
44. Page 55, Second paragraph. The reference to the difficulty ofmonitoring large DNAPL source areas is a good place toincorporate elements of the TRIAD approach or adaptive sitemanagement, which were introduced in Section 3. Ending thediscussion with a reference to numerical simulation is weak.
Comment accepted. The paragraph has been strengthened.
45. Section 4.3.3, Mass Remaining, Box 4-3. The discussionindicates that based on post-treatment soil sampling 75 to 90% of theTCE and 84 to 97% of the DNAPL were removed from each cell. However, at LC34 some of the DNAPL was mobilized into adjacentcells rather than being removed or destroyed in place. Box 4-3should indicate what portion of the DNAPL or TCE was mobilized.
We have made the following modification to Box 4-3 (insert inlast paragraph after the 2nd sentence): “There is evidence thatboth the ISCO and ERH demonstrations may have resulted insome mobilization of DNAPL in several regions peripheral to thedemonstration plots (see Case Study 2 in Appendix B for moredetails).”
46. Page 63. Provide published references to efforts to make PITTtechnology more cost-effective so that the reader can evaluate thelikelihood of implementation.
We have removed reference to the “Quick-PITT” system or otherefforts to reduce costs of PITT.
47. Page 65: Delete the last sentence of Section 4.3.3. This sentencecontradicts the previous statements that there are serious limitationsto estimating mass remaining in-situ.
We do not agree that the sentence contradicts previousstatements about the limitations of in situ mass estimations. Specifically, it states that the use of groundwater concentrationsto estimate “volume, mass, or saturation of the NAPL zone” isnearly impossible.
48. Section 4.4.2 Decrease in DNAPL Mobility. The discussion onNAPLANAL is largely a repetition of the discussion in Section 2.1.2,and therefore is redundant.

E-4
We concur. The material in Section 2.1.2 has been moved toSection 4.4.
49. Section 4.4.3 Decrease in source mass flux, Page 69. Giventhe state of development, it may not be correct to describe eitherpassive borehole flux meters or integrated pump tests as a “methodavailable to estimate mass flux”. It would be better to separatethese two out as “emerging technologies” as identified toward theend of the section.
We agree that the passive flux meter is still in the research anddevelopment/demonstration stage and should not be touted as“available for use.” However, based on an analysis of theliterature, the integrated pump method espoused by Teutsch hasbeen around since the mid-1990s and has been used quite often inEurope. It may not be cost-effective, especially when there is noreadily available place to treat the water, but it has gone beyondthe label of “emerging.” The text has been revised.
50. Page 69. Paragraph under: “Continuous extraction from welltransects” should indicate the basis for cost-effectiveness. Forexample, the cost-effectiveness derives from the use of existing wellsand the assumption that the system achieves 100% plume capture.
We concur. This would be an expensive proposal if meant tostart from scratch (without a preexisting network of monitoringwells in place). The paragraph has been revised.
51. Page 70. Paragraph under multi-level samplers should give anexample of subsurface environments in which multi-level sampling isdifficult or expensive, such as in fractured systems.
We agree that any kind of sampling within fractured bedrock isdifficult and expensive, but we have decided not to addressbedrock in this document.
52. Page 73: The suggestion that integrated pump tests can be usedto overcome heterogeneity is correct. However, it should be notedthat one of the limitations may be excessive cost of this technique.
We concur.
53. Section 4.5 Summary of Performance Metrics from a RecentSurvey. The PA document uses the terms “surprisingly”, and“incredibly” to preface the presentation of the Lebron survey results. It is difficult to know how much validity to place on the surveyresults. Therefore, the discussion of the Lebron survey should bedropped from the PA document. The PA document should referencethe results of peer-reviewed performance assessments, or stronglyqualify the other assessments of DNAPL source removal.
We agree that some of the results in the Lebron survey aredifficult to interpret, but we are not sure that the survey resultsshould be removed altogether. The words “surprisingly” and“incredibly” have been removed and text has been added thatexplains why these specific results are questionable. Thisinformation has also been moved to Box 4-1.
54. Section 5.0 Suggested Technology-Specific Monitoring Tools.Discussions on technology-specific monitoring would be more usefulto decision makers if the discussions were framed in terms of thedecision-making process. What decisions are supported bycollection of the performance assessment data?
Section 1.4 discusses the importance of collecting performancedata and the various decisions that can be supported. We referthe reader to that section.
55. Section 5.2 Conventional Source Zone Remedies. Thesetechnologies are well known or better described in the published
literature. A table would suffice to present relevant informationneeded for the reader.
We feel that the two pages describing conventional technologiesare useful in placing the more innovative techniques intoperspective.
56. Section 5.3 Thermally Enhanced Remediation. This sectionshould reference EPA, 2003a.
Section 5.3 has been revised (insert at end of pg 78 as part of lastpara.) “In addition, EPA (2003a) provides a detailed discussionof thermal remediation methods including the science behind themethods, engineering considerations, and case studies. Treatment of chlorinated solvents, wood treatment chemicals,and PCBs are included in this report.”
57. Appendix B: Case Studies. The case studies should clearlydistinguish between DNAPL removal from the unsaturated zone andthe saturated zone. Appendix B should (also) include a statementindicating that the case studies were provided by the site operatorsor technology vendors and have not been independently reviewed bythird parties.
Information about the DNAPL distribution and zones targetedfor removal/treatment is contained in each case study. For themost part, DNAPL existed in the saturated zone. We have addeda qualifying statement to Appendix B about the lack of anyindependent review. A point of contact is identified for thoseseeking more detailed information.
58. Case Study 2 (Cape Canaveral LC-34). The case study neglectsto discuss the mobilization of DNAPL to adjacent remediation cellsas a result of the technology demonstrations. It is very difficult toassess the performance without knowing how much DNAPL wasmobilized. In fact, the case study is a demonstration of one of helimitations of aggressive DNAPL removal technologies.
Case Study 2 has been modified.
Carmen Lebron - Naval Facilities EngineeringService Center
59. Page 18 bottom: Title “Secondary Water Impact” is split fromthe paragraph pertaining to it. Perhaps formatting can be altered sothat they’re both together.
We have fixed the formatting error.
60. Page 22. The reference for the report which is now finalized is: Assessing the Feasibility of DNAPL Source Zone Remediation:Review of Case Studies (NFESC report No. CR-04-002-ENV, datedMay, 2004).
We have corrected the citation.
61. Page 22. I would change “from 92 different DNAPL sites” to“118 locations.” The reason why I’m suggesting this change isbecause even though we had 92 sites, there were sites that hadmultiple locations, so in reality we have sets of data for 118locations. Since later in the document we refer to 118 locations, it’sprobably better to be consistent.
We have made the suggested change.
62. Page 23 Table 2-1: You need to close the parenthesis for“Early, 2004.” Also, in table footnote no. 2, please change 118 sitesto 118 locations.

E-5
We have made these changes.
63. Page 25, second paragraph: Replace 9% with 11%. Also,replace “any” in the last sentence (have completed any technologyapplication) with “their” (it’ll now read “13 bedrock locationsincluded in this survey have completed their technology application).
Based on other comments, we have deleted all references tofractured rock in this document.
64. Page 32, bottom: There are 2 periods ending the sentence titled“Operating Costs.” I don’t know if you meant to have it this way forformatting reasons or whether one of the periods should be deleted.
We have fixed this error.
65. Page 37, bottom: There are 2 periods ending the sentence titled“Analysis of variance.” I don’t know if you meant to have it this wayfor formatting reasons or whether one of the periods should bedeleted.
We have fixed this error.
66. Page 38, top: There are 2 periods ending the sentence titled“Tolerance and prediction of intervals.” I don’t know if you meantto have it this way for formatting reasons or whether one of theperiods should be deleted.
We have fixed this error.
67. Page 38, top: There are 2 periods ending the sentence titled“Control Charts.”
We have fixed this error.
68. Page 65, 3rd paragraph: There’s a comma separating the firstand second sentences. Either place a period or lower case “this” inthe second portion of the statement.
We have fixed this error.
69. Page 71, 1st paragraph: Second sentence states “Also, theoperation of the extraction wells necessarily alters the plume…” What does “necessarily” mean in this context?
Alteration of the plume is an intended consequence or result ofpumping.
70. Page 74, 5th paragraph: In referring to the “Lebron survey”the date should be 2004, not 2003.
We have changed the date to 2004. The contents of Section 4.5have been incorporated into a new Box 4-1.
71. Page 78, 4th paragraph: There are 2 periods ending the thirdbullet starting with “As subsurface temperatures rise, the rates of....” I don’t know if you meant to have it this way for formatting reasonsor whether one of the periods should be deleted.
We have corrected this mistake.
72. Page 83, 3rd paragraph: Seems like there’s some text missingafter “Box 5-1 shows”
Reference to Box 5-1 has been deleted
73. Page 98, 5th paragraph: “Whether tribal, public or …” seemslike is missing a partial thought.
We concur and have revised the sentence.
74. Page 100 last sentence: I suggest combining last 2 sentencesinto 1 reading “Going beyond the communication requirement ofRCRA or CERCLA and offering primers in DNAPL terminology andsystem descriptions will probably be beneficial.”
We concur.
State of Oregon
75. Clearly there was substantial work put into the preparation ofthe document. The report does a nice job of providing multiplereferences regarding DNAPLs. It does not give a project managerwith any DNAPL experience much new information or actual “howto” guidance. What was good in the report was the reinforcement ofthe importance of the Conceptual Site Model and planning ahead forperformance assessment and exit strategies.
Comment accepted. We agree that CSM development andplanning are two cornerstones of a robust performancemonitoring program.
76. The report is extremely general in scope, unnecessarily lengthyand repetitive, and does not constructively educate those alreadygenerally familiar with DNAPL attributes.
Remedial project managers of all skill levels are faced withDNAPL issues at some point in their careers and will benefitfrom some repetition of important concepts. We disagree thatthe document is too general to be useful. We have reduced itslength somewhat by removing discussions of material not directlyrelated to performance.
77. The report is not unique in its content or presentation, and onlyreproduces information compiled from already existing sources; itdoes pull together the information coupled with available resourcesregarding monitoring techniques (although one needs to read to 2sections of material that doesn’t directly pertain to monitoringstrategies before getting to sections 3 and 4 that are more helpfultoward available techniques for monitoring);
Although the document does contain information that is availableelsewhere, we disagree with the reviewer’s statement that thedocument is not unique. We are unaware of any other documenton this topic that targets the regulatory community.
78. The report does not contain wrong information per se, but itdoes not provide much new or particularly useful guidance whichcould be effectively used by DEQ project managers at DNAPL sites.
See response to Comment 77.
79. Even though the existing information is not wrong – where thereport provides brief guidance on topics such as preferred drillingmethods and sampling methods, it could be misleading because it isnot complete. Unless it pertains directly to monitoring strategies, itshould not be included but referenced to other guidance documents. An example is a preference for hollow stem auger drilling or use ofpush probe technology on page 56. Many sites need to use air rotaryor other techniques based on the geology.
We do not recommend the introduction of air while sampling forVOCs; therefore, the use of air rotary techniques should beavoided. Because air rotary drilling is most appropriate fordrilling in rock, we have removed this reference in Section 4.2.1.
80. The report focuses (at length) upon aggressive DNAPL sourcereduction technologies (i.e. cosolvent; thermal; chem-ox) thatdramatically change and increase the potential for DNAPL mobility.

E-6
This emphasis is somewhat skewed and Section 5.2 (DNAPLrecovery) needs to be enhanced with descriptions of alternate, yetproven approaches (e.g. hydraulic DNAPL recovery by dual phasepumping or water flooding) for DNAPL source reduction. Forexample, enhanced bioremediation is one less aggressive technologydiscussed and it is more oriented toward dissolved plume reductionthan DNAPL source depletion;
This document was not intended to exhaustively list and discussthe applicability of all available DNAPL treatment technologiesfor a site or promote any specific treatment technology. Thereader is informed at the beginning to assume that a treatmenttechnology appropriate for the specific site and contaminants inquestion has already been selected.
81. There is little detail provided in the report that certaintechnologies and/or performance assessment strategies are unique tospecific types of DNAPL (e.g. air sparging for heavy DNAPL PCEdoes not work for creosote DNAPL);
See response to Comment 80.
82. There is little to no discussion about the range of specific gravityDNAPL and the implication of neutral-density NAPL components. This is an important omission because neutral-density NAPLfractions can vary with temperature (or other influences), and thisfactor creates remedial design and operational problems; and,
We concur. Text has been added to Section 2.2 to addressneutral-density NAPLs.
83. The report includes very abbreviated case studies, but thespecific lessons or objectives associated with these individual casesare not clearly conveyed.
We have attempted to provide a broad array of case examplesand to present them in a concise manner. The reader is advisedto contact the project contact listed for more detailedinformation.
84. Page iii Second Paragraph: Include Water Flooding as a sourcereduction technology.
See response to Comment 80.
85. Page 6: To monitor potential impacts beyond the treatment zone:Mention that some source removal actions may increase mobility orproduce toxic, mobile by-products.
This issue is addressed in the paragraph already and will not berevised.
86. Section 1.4.2, Page 8. A skill set is mentioned, but noinformation on what that skill set should be. This is an example ofwhere the report is general such that it is not helpful. Naturally,people with the appropriate skills should be providing the input tomake decisions on project. So, one would expect if you are workingon a DNAPL remediation, you will have a person with DNAPLexpertise, and if you are designing a system, you will have theappropriate type of engineer and hydrogeologist designing thesystem. Statements like this are not helpful and make the documentlonger than it needs to be.
We merely wanted to reiterate the importance of havingexperienced people on board during the planning phases of theperformance assessment. We do not agree that this statement isnot helpful.
87. Page 8, Key Concepts Relating to DNAPLs: I think this shouldbe a referenced section instead of presenting the properties and
distribution of NAPL in the subsurface here. This document shouldonly focus on the monitoring strategies and although this informationis important, it is presented more thoroughly in other references.
Section 2.1 has been shortened, however, we contend that a briefdiscussion of the subsurface behavior of DNAPLs and sourcezone architecture is critical to developing a conceptual model ofthe site and planning a performance program.
88. Page 12: Where did the 8% and 22% come from – these numbersneed to be referenced. Also the “between 1 and 5 percent” should bereferenced.
We have provided a reference to Cohen and Mercer, 1993, andchanged the reported ranges of residual saturation.
89. Page 18. Preferential Flow: “use of Mobility control (aspracticed by the petroleum industry)” - provide a reference for this. Or describe what mobility control is, so that PMs can implement it attheir sites.
See response to Comment 38.
90. Page 21: The information provided on this page is already wellunderstood and does not add to the understanding of monitoringstrategies. Much of this type of information could be eliminated fromthe document so that it focused more directly on monitoringstrategies and techniques.
See response to previous comments.
91. Page 26: Short-term goals: I think it is misleading to state thatshort-tem goals target the “maximum achievable DNAPL massremoval within economic restraints” Many sites are driven by riskand thus, the short-term goal may be to reduce the mobility of theDNAPL which is not the same as maximum removal or even“removal to the extent feasible” as the required removal amount toreduce mobility and eliminate risk may be less than what is feasibleto remove.
We agree. “Mass removal to the extent feasible” should be anintermediate goal.
92. Page 32. First bullet. Eliminate the extra period.
All double periods have been eliminated.
93. Page 33. Second bullet. Vertical DNAPL Profiles: The designmay not need to be successful at reducing the source at the deepestportions of the source. One needs to understand the Conceptual SiteModel and therefore, understand where the pathways exist toreceptors. For example, if DNAPL is discharging into a river, it maybe the shallow source material that remediation should focus on andDNAPL that has migrated deeper may not have a potential receptorand removal of it may not reduce risk.
This discussion has been moved to Appendix C. Many statesrequire source treatment, or at least a demonstration that it is notfeasible, irrespective of risk. Nonetheless, the bullet has beenrevised to read “...must ensure source recovery at all targeteddepths.”
94. Page 39: Second Paragraph: Table 3-1 reference should beTable 3-2.
We have moved the statistics section to Appendix D andcorrected the table number.
95. Page 47. Section 4.0 Eliminate space before first period.

E-7
The space has been eliminated.
96. Page 57: Last Paragraph. Eliminate the word “poorly”. If youare planning to measure flux, then placing wells across the flux planeis not poor design.
We have replaced the word “poorly” with “properly.”
97. Page 59. (Sale et. al., 2001) is not included in the referencesection – add to reference section.
We have added this reference (Sale and McWhorter, 2001).
98. Page 76. Section 5.1 Effectiveness and Efficiency has alreadybeen discussed and this section does not even discuss efficiencymonitoring – if it is meant to be more specific towards monitoring foreffectiveness and efficiency.
We have revised this section to specifically highlight remedialeffectiveness monitoring and system efficiency monitoring.
99. Page 76. Conventional Source Zone Remedies. You shouldalready know what remedy you are planning on implementing whenyou are designing your monitoring strategy - thus this section doesnot need to go into detail on the remediation technology – but onlyon the monitoring strategies appropriate for each technology.
We agree that the focus should be on the monitoring strategy, butfelt that it would be confusing to introduce such strategieswithout first giving a short technology description.
100. Page 76. DNAPL Recovery. It is a mistake to suggest to folksthat it is ok to just proactively remove DNAPL from individual wellswithout a recovery plan. This is apt to cut off flow paths of DNAPLand reduce your ability to recover NAPL. With hydraulic recovery, itis very important to enhance the DNAPL flow paths to your well andnot just remove the existing NAPL from the well as it returns to thewell. Effectiveness may also be measured in reduction in residualNAPL saturations – or mobility – not just the mass of NAPLremoved.
We agree that implementation of a DNAPL recovery system,particularly an automated pumping system, is not a simplematter. We have incorporated your comments.
State of Nebraska
101. From an outsider, layman's point of view, the title did notimmediately evoke the main ideas and/or provide an encapsulatedsummary of what this document should be used for. Suggestreplacing the word "Monitoring" perhaps with Rating and/orMeasuring, add "and Progress" after the word "Performance," andreplace "Remedies" with something like Remedial Action Projects. The resulting document title would read something like this: Strategies for Measuring the Performance and Progress on DNAPLSource Zone Remedial Action Projects.
We do not concur. The document title has not been changed.
102. Box 1-1, page 4: The terms listed should be put into some sortof order, either (1) alphabetical or (2) most important/used to least important/used, (3) simple to more complex, or (4) general tospecific. Add a note at the top of the box to indicate the ordering soreaders can follow the logic and be able to better retain theinformation and be more organized in the future when referring backto the concepts.
We have placed the terms in alphabetical order. No note isnecessary.
103. Introducing/spelling out Acronyms: I believe that acronymsshould be introduced (i.e., spelled out) when they first appear in thedocument text/illustrations. PCE is first used on page 6 but notspelled out/properly introduced until page 9. NAPL is first used onpage 8 without spelling out. ROD is used on page 21 and notspelled out or listed in Appendix A. Both ft and bgs are first used inBox 2-4 on page 22 without being properly introduced or spelled out. DOE is first used on page 22 and not spelled out. BTEX is firstused and not spelled out on page 24. AFB, RAO, RCRA , andCERCLA are first used on page 25 is not spelled out, perhaps intentionally and while AFB is included in Appendix A, the otherthree are not. Additionally, RAO is later spelled out on page 29. MCL and ARAR are first used on page 28 without being spelled outand ARAR is not included in Appendix A. RA first used on page 34without being spelled out and not included in Appendix A. GC/MSis first used on page 43 and not spelled out and while GC is includedin Appendix A, MS is not. TOC is first used on page 44 withoutbeing spelled out and then later spelled out on page 53. LUST isfirst used on page 45 and not spelled out or included in Appendix A. MIP is first used on page 55 without being spelled out and it notincluded in Appendix A. VC is first used in Box 4-1 on page 59without being spelled out and is not included in Appendix A. ERH isspelled out for the first time on page 79 but used earlier twice (inBox 4-3 on page 64 and also on page 78). ERT is first used with outbeing spelled out on page 82. ORP and PA are first used on page90 without being spelled out and are not included in Appendix A. ISCO is introduced/spelled out a second time on page 85 after being first spelled out on page 64. ESTCP is used on page 94 and it's not spelled out nor is it in Appendix A. Other acronyms that are notlisted in Appendix A include but are not necessarily limited to CSM,ISB, ORP, PDB, and RPO.
We appreciate the reviewer’s suggestions and have incorporatedmost of them.
104. Sub-section 1.4.2, Scoping a performance assessment program,page 8: This section is likely to attract a lot of interest and needssome clarification. Consider adding some additional information toprovide a more detailed account of what "skill set and technicalexpertise" are needed to design and implement a performanceassessment program.
We have decided to limit the discussion in Section 1.4.2 to timingand budgetary considerations.
105. Figure 2-1, page 9: I am unable to differentiate between thetwo DNAPL zone/areas labeled "Pool" and "Residual" in the figure. If it's possible, please be sure that the labeled areas are not"questionable" areas that may fit both descriptions or if it may fitboth, label it "Pool/Residual."
The resolution of the figure is not detailed enough to allow one todistinguish between residual and pooled DNAPL, differenceswhich are observed at the micro-scale level. We trust that thereader is able to interpret the information presented in the figureusing the accompanying text and references to the literaturewhich describe DNAPL behavior in detail.
106. Sub-section 2.1.1, first paragraph, second sentence, page 9: The sentence reads "Although DNAPLs are hydrophobic (not verysoluble in water), some components are soluble enough to presentrisks to human health or the environment." (1) Perhaps thesentence should be reworded to say "generally" or "mostly" or"typically" hydrophobic because it becomes evident, as you read on,that they are not totally hydrophobic. (2) Also, perhaps the word"components" should be replaced with "types" or use both terms"components/types". (3) Additionally, the meaning of "components"

E-8
should be introduced to the reader here instead of waiting until it'sused in sub-section 2.1.2 on the next page, although theamplification on page 10 is not a complete explanation.
We concur and have modified Section 2.1.1.
107. Sub-section 2.1.1, second paragraph, second sentence, page 9: The sentence reads "When released in sufficient quantities to thesubsurface soil, DNAPLs will move downward, primarily due togravity, through the vadose zone and usually into the saturatedzone." It's hard to believe that infiltration from precipitation andrun-off does not also share the primary role in downward mobility. Consider the following alternative "... move downward, primarilydue to gravity and infiltration (where applicable), through thevadose zone and gravity within the saturated zone."
We have included infiltration as another possible cause ofdownward movement through the vadose zone, but haveotherwise left the sentence as is.
108. Sub-section 2.1.3, page 14, second paragraph, secondsentence: The sentence reads "As is the case for conventional plumeremediation, the volume and extent of the problem must beadequately delineated to provide a sufficient design basis for boththe remedy and for the performance assessment program." Consider replacing the term "problem" with "area ofcontamination" or "impacted area" or some other appropriateterminology.
We concur and have revised the sentence as the reviewersuggests.
109. Hyphenated terms like In-Situ and Soil-Gas: I think it'sappropriate to use the hyphenation for both of these termsthroughout the document. It's not used at all for "in situ" andsoil-gas appears both with and without hyphenation. Regardless ofhow it's done, the document needs to be checked for consistency. Please check for others, for example three-dimensional needshyphenation on page 29 and site-specific appears both waysthroughout the document.
Thanks for pointing out some inconsistencies. The term “insitu”is now consistently used (without hyphenation or italics). “Soil gas” does not require hyphenation, in our opinion.
110. Section 2.2, sub-section Alteration of subsurface structure, last sentence, page 18: The sentence states "Methods used to achieve subsurface alteration/mixing include multiple injections in the sameof different locations, multiple screened intervals ..." I appears that the word "of" should actually be "or." There are other instances of missing words or inappropriate/extra word usage, for example, onpage 29 under sub-section 3.2.1, the third sentence of the secondparagraph states "A valid and representative program formeasuring for RAO achievement ..." -- the second "for" isredundant. Then on page 34, under sub-section 3.3.2, the thirdsentence of the third paragraph states "... percentage declines inextracted air or groundwater water contaminant concentrations,cumulative DNAPL mass removed, ..." -- there should not be a needto use "groundwater" and "water" together, in the sentence, deleteone of the two (whichever is most appropriate). Also, on page 55,under the Purging considerations, the first sentence of text reads"The purpose of purging is to ensure that water samples collectedfrom a monitoring well are representative of in situ groundwaterconditions the portion of the aquifer being sampled." -- It appearsthat a word is missing (perhaps "in" or "for") after the word "conditions."
We have made these changes as suggested.
111. Section 2.2, sub-section Preferential flow, sixth sentence, page18: The sentence reads "The use of mobility control (as practiced by petroleum industry) mitigates the effect of preferential flow pathways and improves sweep efficiency." Perhaps a little bit more should be said to explain what is meant by the use of mobility controls for those of use who are unfamiliar with those practices.
See response to Comment 38.
112. Box 2-3, page 20: Suggest moving Box 2-3 before thepreceding paragraph because (1) both the text and referencing thebox will have a better flow and (2) that paragraph of text serves as agood summary to the sub-section and would be more effective ifmerged with the two brief paragraphs of text following the box.
We concur.
113. Section 2.4, third paragraph, second sentence, page 21: Thesentence reads "Many of these barriers have not been adequatelyaddressed by the scientific community and regulatory agencies." Does this have to be said and what's the point of this statement? Itmay be viewed as a potential "put-down" by some regulators. If youintend to keep this statement, it may be necessary to add text(perhaps a follow-on support sentence or two) to explain what ismeant by this sentence.
We have removed the sentence.
114. Section 2.4, fourth paragraph, first sentence, page 21: Thesentence reads "Other factors that impact treatment difficulty andcost include depth of contamination and the type of DNAPL present(e.g., chlorinated solvents or wood treatment chemicals)." Withinthe parentheses, it may be more appropriate to briefly say that thecharacteristics vary and some DNAPLs are more persistent thanothers before listing the two examples. In other words, it was notimmediately obvious to this reader what the main point was forlisting the two examples.
We have clarified the meaning of the sentence.
115. Box 2-4, third sentence of first paragraph and the last sentenceof the second paragraph, page 22: These two sentences very longare unclear and may need to be broken down into two sentenceseach and perhaps made simpler to understand for readers that donot have extensive geology/hydrogeology expertise. For example,terms like "thrust sheet" and "dip" may have to be clarified byadding a brief description in parentheses immediately after eachterm. Also, why abbreviate only a couple words like "approx." and"deg"? Suggest spelling out those two words, it does not save anyspace or serve any useful purpose to abbreviate just two words.
Box 2-4, along with other references to fractured bedrock andkarst, has been eliminated from the document.
116. Table 2-1, page 23: There are a few minor things needingadjustments: (1) the is a right parenthesis missing after "Early,2004" in the heading of the third column, (2) consider adding"Maximum" to the bottom entry in the first column so it reads"Maximum Depth of DNAPL Contamination," (3) what does the"N/A" term actually represent (third item listed in fourth column)? --it may be better to replace it with "Not Reported" or "NotDetermined", and (4) the second footnote (i.e., footnote #2) appearsto apply to all the sites (i.e., both the DOE and Navy sites) and thusthe superscript "2" should be moved from its present location abovethe 88% in the fourth column, to the a position right after"Maximum Depth of DNAPL Contamination," in the first column.
We have made the changes as suggested.

E-9
117. Sub-section 2.4.2, EPA's fractured rock database, page 23: Suggest adding the words "contaminants in" before the wordfractured so the sub-title reads "EPA's contaminants in fracturedrock database".
We have removed any discussion of fractured bedrock from thisdocument.
118. Sub-section 2.4.2, first sentence of the first paragraph, page 23: The sentence reads "Although DOE's experience with treatingDNAPL contamination in bedrock is not extensive, EPA'sTechnology Innovation Office has developed a database ..." Whatis the value of having that open statement that "Although DOE'sexperience with treating DNAPL contamination in bedrock is notextensive"? Suggest deleting that first segment of the sentence.
See response to comment 117.
119. Box 3-1, page 27: The example presented in this box is verygeneral and does not provide much additional information/valuebeyond the discussion it is intended to support, therefore, considerstrengthening the example. Also, move Box 3-1 before theparagraph that currently precedes it because Box 3-1 is referencedin and presents an example related to intermediate performancegoals and yet it is presently positioned within/after the discussion onlong-term goals.
We have eliminated Box 3-1.
120. Sub-section 3.2.3, second sentence of second bulleted statement following the second paragraph of text, page 30: The sentence reads "The practical pilot test limit is a reduction in the range of 95 - 99%." Should the reader have to except this fact without indicating where it originated? Suggest adding a reference or lead-instatement like: "According to ..., the practical pilot test limit is areduction ..."
We have removed the statement.
121. Sub-section 3.2.5, first paragraph, first sentence, page 32: The sentence reads "An examination of cost with respect to DNAPL mass removal is of dubious value for comparing the costs of alternatemass removal technologies unless ..." The word "dubious" is ofquestionable tone and distracting/awkward as used; suggestreplacing the word "dubious" with "questionable" or "doubtful" orrestructure the sentence.
We have replaced the word “dubious” with “questionable” andmoved the discussion of pilot studies to Appendix C.
122. Sub-section 3.2.5, end of the first bulleted statement within thethird paragraph, page 32: There are two periods at the end of thesentence. There are a few reoccurrences of double periodselsewhere in the document (often at the end of bulleted statements),as in sub-section 3.4.3 for example; please check for and correctthem.
We have corrected this error throughout the document.
123. Box 3-2, page 44: The example on use of the Triad Strategypresented in Box 3-2 starts out great but end up being veryanticlimactic in the last sentence which presents one very weakspecific benefit. Suggest strengthening this example with moresignificant benefits if possible.
We concur. The text has been revised.
124. Sub-section 4.2.2, under the Multi-level sampling sub-heading,second paragraph, third sentence, page 55: The sentence listsexamples of complex, multilevel systems that may be appropriate for
sites with deeper groundwater. What is the value of simplyname-dropping these systems? Suggest some brief descriptions ofeach of these systems be included within the text to aid unfamiliarreaders.
We do not concur. The reader is encouraged to visit thereferenced internet sites for more detailed information.
125. Sub-section 4.2.2, under the Use of passive diffusion bag (PDB)samplers , second and fourth bulleted statements in the thirdparagraph, page 58: The first statement indicates "PDB samplersintegrate concentrations over time, which may be a limitation if thegoal of the sampling event is to collect a representative sample at apoint in time and the aquifer is know to show VOC concentrationsthat change over time. The second statement indicates "Becauseconcentrations of groundwater collected from PDBs representlocalized concentrations while traditional techniques representaverage concentrations, groundwater collecting from wells locatedadjacent to DNAPL source zone may provide a bias result due tofluctuation of the groundwater movement. Please considerrewording to make the point being made more clear/direct to thereader.
Comment accepted. We have reworded the bulleted section.
126. Sub-section 4.4.1, page 67: The text under this sub-section is abit gappy. Suggest moving the third and fourth paragraphs up tojoin/merge with the second paragraph without changing the text.
We concur. The suggested changes have been made.
127. Figure 4-2, page 69: There are two large arrows with"Contaminant Flux (J,)" -- there are two concerns: (1) it is difficultto determine if the symbol after the letter J is a comma or period orsome other extraneous character and (2) the letter/variable "J"should be explained/introduced.
We have improved the readability of the figure and eliminatedundefined variables.
128. Figure 4-3, page 71: The following observations/concerns areoffered: (1) consider labeling the flow lines, (2) is it likely and/oruseful to have so many injection and/or multilevel monitoring wellsthat are way off of the two ends of the source material, in orderwords, the drawing seems to illustrate that there are too many wells,and (3) would it be useful to add a footnote that indicates thattracers are used to help determine when the appropriate time wouldbe for collecting samples from the multilevel wells.
We have deleted the figure.
129. Sub-section 5.3.3, first paragraph, third sentence, page 79: The sentence reads "A summary of these two types of ERH can befound in a white paper available on one of the vendor's websites(TRS, 2003)." What is a "white" paper?
A white paper is a term used to describe a short publication andis often used to introduce technology innovations or products.
130. Sub-section 5.3.4, third paragraph, third sentence, page 80: The sentence reads "In addition, thermal conductivity values varyover a very narrow range over a wide range of soil types, leading toa highly predictable rate of heat-front propagation around eachheater." This sentence is confusing, please consider rewording.
We concur and have revised the sentence to read “...values do notvary much over a wide range of soil types.”

E-10
131. Table 5-2, page 84: Please consider adding a column oradditional notes elsewhere in the table to present thereasons/purpose for each parameter like was done in Table 5-1.
Comment accepted. The table has been modified as suggested.
132. Table 5-3, page 89: Please consider adding a column oradditional notes elsewhere in the table to present thereasons/purpose for each parameter like was done in Table 5-1.
Comment accepted. The table has been modified as suggested.
133. Section 6.1, both sentences of what appears to be the secondparagraph, page 92: The sentences of concern read "Generalwarning about technologies associated with PA activities." and"Standard monitoring requirements." These two fragmentedphrases are not complete sentences, however, this review realizesthat these two entries may simply be place holders/reminders to addtext at a later point in time.
The reviewer is correct. The placeholders have been revised.
134. Sub-section 6.1.1, last sentence of text under the Sampling hot groundwater sub-heading, page 92: The text of concern reads "Box6-2 Appendix C describes procedures used for sampling hotgroundwater at a site located at the Charleston Naval Complexwhere ERH was employed." There is no Box 6-2 in the documentand the reviewer was unable to find any of the information,including Appendix C, in the document.
The reference to Box 6-2 and hot sampling procedures has beendeleted.
135. Sub-section 6.1.3, the first and fifth bulleted statements, page93: The first bulleted statement is simply a restatement of thesub-heading and of the discussion presented in the previoussub-section (i.e., 6.1.2 Handling and working near chemicaloxidants), yet sub-section 6.1.3 is suppose to present "additionalhealth and safety concerns" beyond those presented in the previoussub-sections. Then the wording of the fifth bulleted statementappears to be incomplete, consider adding terminology to identifywhatever it is that is hazardous to get into direct contact with.
We concur. The subsection has been consolidated with theprevious subsection.
136. Section 6.3, fourth sub-heading page 97: Consider rewordingthe sub-heading in italics, it sounds awkward as is: "Concern over potential for mobilization potential off site migration of DNAPLs."
The heading has been reworded.
137. Section 6.4, first paragraph, first two sentences, page 98: The sentences of concern read "In the context of DoD and DOE, the term "community" takes on a different meaning than what most mightthink. Their use of the term "community" means appointed or electedpublic officials." These statements are not likely to be totallydefensible and may be considered inflammatory or taken as a "potshot" or otherwise condescending remark designed to insult theintelligence of DoD/DOE environmental and/or administrativepersonnel. It's very possible that the meaning of the term"community" as presented in these statements may have been "takenout of context." Please consider deleting these two sentences sincethey do not add any conceptual value to the rest of the section andmay undermine the bigger picture and intent of the other materialpresented in that section.
We concur and have removed these sentences.
138. Section 6.4, pages 98 and 99: This section is gappy and havemany short paragraphs that can be merged with success. Pleaseconsider merging the first short paragraphs to form one. Next,consider merging the fifth, sixth, and seventh paragraphs. There areothers, for example, merging the tenth and eleventh paragraphswould appear to be appropriate. There are also a coupleparagraphs who's first sentence begin with the word "And" and thatstructure can likely be improved and/or that is an indication that theparagraph involved can be merged with the preceding paragraph.
Extensive reworking of Section 6.4 has been completed.
139. Section 6.4, eleventh paragraph, second half of the lastsentence, page 99: The portion of the sentence of concern reads "...though time limits on the years this assistance is provided may provetoo limited." It is not clear what point is being made here, pleaseclarify.
See response to Comment 138.
140. Somewhere appropriate, perhaps late in Section 5.0 or at theend of Section 6.0: Please consider adding some text and asummary table to introduce the eight case studies presented inAppendix B. The table should identify each study by site name, themajor contaminants of concern, what the strengths are or lessonslearned are for each study, and any unique or otherwise significantideas provided by the case study.
We have modified the table of contents and created a more usefulTable B-1 as you suggest.
141. Appendix C, missing items/text: They were likely intentionallynot provided for this review but it should be noted that the followingitems were not included: (1) ITRC Fact Sheet, (2) ITRC ProductList, and (3) User Survey.
We have added these items to the final version.
Commonwealth of Kentucky
142. My overall assessment is that this is a very well writtendocument. I believe that it will serve as a valuable resource forothers like myself that are grappling with the issue of how to bestimplement and subsequently evaluate the success or failure ofDNAPL remediation technologies.
Thank you for the feedback. It is our hope that the documentwill be useful and serve as a good foundation to help regulatorsbegin to think about many of the important issues inperformance assessment.
143. One of my job duties is to oversee groundwater cleanup at thePaducah Gaseous Diffusion Plant located in Paducah, Kentucky –the subject of Case Study #5. The Department of Energy hasproposed to install an ERH system that will be designed to removeVOCs (primarily TCE) from the unsaturated, vadose, and saturatedzones. I plan to rely upon the information provided in this ITRCdocument to assist me in my efforts to insure that this project isimplemented in the most complete, technically sound, and costeffective manner possible.
Again thank you for the feedback. This is exactly how we hopedthat the document could be used. Please let us know more aboutthe Paducah project as it progresses.
144. Section 3.2.4, Page 32, 2nd Paragraph: The text presented inparenthesis in the first sentence should be reworded. The phrase “a

E-11
technically supportable asymptote-based goals…” does not makesense.
We agree that this phrase is not as clear as it could be and we willreword this section. We believe that it is an important concept torecognize that contaminant concentrations alone in thesubsurface may not necessarily be the only or even the bestmeasure in every situation. Every remediation alternative willeventually reach a point of “diminishing returns” and it is nolonger beneficial or cost effective to operate the remediationsystem. At this point either another remedial option could beemployed or it may not be possible or cost effective to removeany further source material. It is important to recognize when agiven technology is no longer yielding significant returns, notthat this point would necessarily be the acceptable end point forthe remediation.
145. Section 3.6.2, Page 46, 3rd Paragraph: The last sentence ofthis paragraph is somewhat confusing. Why would long-termmanagement requirements be required when there is nounacceptable risk remaining following cleanup? Perhaps someclarification is in order.
Since it is unlikely that all DNAPL can be removed, once theremediation reaches asymptotic levels and assuming that thereare no unacceptable exposures then long term managementwould be necessary to insure that conditions do not change andthat risk assumptions remain valid. This sentence will be clarifiedto indicate that we are referring to instituting long-termmanagement to monitor any residual DNAPL remaining.Obviously if there is still a risk posed by the residual DNAPL,additional measures including possibly institutional controlswould be necessary in addition to long-term management.
146. Section 4.2.2, Page 58, 3rd Paragraph, 3rd Bullet: Thesentence appears to refer to groundwater flow as being lesspermeable than an aquifer. This sentence should be reworded.
This is an important limitation of passive diffusion bag (PDB)samplers; it is crucial to ensure that the PDB is not lesspermeable than the surrounding aquifer materials to obtainrepresentative samples because of the potential for inadequateexchange.
147. Section 4.3.3, Page 64, “Tracer tests”: The last sentencestates, “PITTs can be used as remediation performance assessmenttools to determined system effectiveness…” It appears that the word“determined” should be changed to “determine.”
We agree the word should be “determine.”
148. Section 5.2.2, Page 77, 1st Paragraph: The second to lastsentence should be revised. Perhaps the last portion of the sentencereferring to volatilized DNAPL constituents should read, “and arethen removed from the subsurface.”
We concur.
State of Vermont
149. Page 1, ¶ 1: This states that DNAPLs are organic liquids. While this is generally the case, there are potentially other DNAPLs,ie Mercury. Please consider removing the word “organic”
We concur and have removed the word “organic.”
150. Page 11, last sentence of ¶ continued from previous page: Consider changing “World Wide Web” to “internet”. I think thisterm has broader usage the world wide web.
We have made the suggested change.
151. Page 30, 2nd ¶ of 3.3.1: Please consider the following changefrom one sentence to two sentences: “In this context, the CSM servesas the basis for conducting a risk evaluation where potential humanand environmental receptors are identified,. t The potential forcomplete exposure pathways is determined, exposure pointconcentrations are estimated, and risk estimates are developed.”
We concur and have changed the text.
152. Page 43, Other Programs: The paragraph references “NoFurther Action” letters. Not all states use this terminology (ie: we inVT don’t use this). While this is not really that important as mostpeople reading this know what is intended, it might be a little betterto say: “No Further Action (NFA) or equivalent..”
We concur.
153. Page 48, last ¶, first sentence: This uses the term “rathercasual”. It might be better to remove these words so it reads: “…range from rather casual, qualitative indicators of…”
We have made the suggested revision.
154. Page 50, Measuring soil concentration: Please check youanalytical references: Method 8015B measures a small suite ofvolatile and semi-volatile chemicals . I would prefer to use 8260 forvolatiles (as referenced in the paragraph) and Method 8270 forsemi-volatiles.
We concur. We have removed references to specific methods.
155. Page 51, last sentence on ¶ that continues from previous page:I think you could remove: “…however some regions/states do notrequire field preservation using solvents.” We are introducing anexcellent sampling method and probably do not need discuss whetheror not it is required.
We concur. The phrase has been deleted.
156. Page 51, near the end of the first full ¶: I would argue thestatement: “For most DNAPL sites in unconsolidated sediments,drilling with a hollow stem auger (HSA) is the preferred method.” Direct push is many investigators preferred investigation method inunconsolidated materials where the geology will allow it. Thismethod provides much less disturbed samples for sampling forVOCs.
We concur and have added direct-push technologies to thepreferred list.
157. Page 55, 3rd ¶: I suggest making the following change: “Nonetheless, it is may be prudent to have at least …”
We concur.
158. Page 56, Use of passive diffusion bag (PDB) samplers: I thinkyou should add some language to the first paragraph of this sectionthat the suite of chemicals that can be monitored with this technologyis limited.
We have made the suggested change.
159. Page 74, last sentence in ¶ continued from the previous page: Iwould use the term “karst” instead of “karstic”. (I have never seen

E-12
this term and it isn’t in my geologic dictionary. Karst is probably thecorrect word.)
Comment accepted.
160. Page 86, Table 5.3: The method column is empty for most ofthe parameters.
We have revised Table 5-3.
161. Page 87, 5.6.2: This section states that ISB is a long termremedial process and that other remedial processes are “typicallyimplemented as a one-time, short-duration remedial action”. SVEgenerally takes quite a while and other technologies such as heatingcan also take a long time. I would suggest removing or revising thissentence.
We agree that SVE takes longer, but we think the sentence isclear enough as written.
162. Page 90, section 6.1, 2nd ¶: This paragraph appearsincomplete. I am assuming you have been waiting for a contributorto supply this information.
Section 6.1 has been completed.
163. Page 92, top of page. The ¶ at the top of the page appearsincomplete and does not appear to flow from the previous page.
The paragraph has been rewritten.
164. Page 94, Public concerns over injected remedial fluids: Thisparagraph uses the term public outrage. I am not sure that outrageis the correct word here. The “outrage perceived” could beclarified.
We concur. Section 6.4 has been reworked.
Scott Huling - EPA Office of Research &Development
165. It is recommended that Section 5.5, In Situ Chemical Oxidation,be revised with more specific information regarding the variousoxidants. Currently, the text does not address the significantdifferences in reactions and in in situ field behavior of the differentforms of chemical oxidants (e.g., Fenton’s reagent, permanganate,and ozone). These oxidants are similar in some respects but can bequite different in others. For example, in Section 5.5.1, it was statedthat the injected oxidants create free radicals, however,permanganate oxidation occurs through nonradical electrontransfer. Additionally, the gas phase can be important with Fenton’sreagent and with ozone, but not necessarily with permanganate. DNAPL redistribution may occur due to elevated pressure, heat, andsteam resulting from inappropriately high concentrations of H2O2with Fenton’s reagent. It is recommended that this section be revised to reflect differences between the oxidants and the monitoringrequirements.
We have revised Section 5.5 to address differences betweenoxidants; however, only general differences are presented. TheITRC 2001 Chemical oxidation document is referenced foradditional detail.
166. Although a good attempt was made in defining the terms andphrases used in the document, and in consistent usage, there aresome inconsistencies and discrepancies in the terms used. These arediscussed further in the Specific Comment for Section 5.1. It is
recommended that complete consistency be maintained, so as to notconfuse the reader with additional jargon.
Revisions to text to address inconsistencies have been made.
167. The comments given here generally relate to technical issueswithin the document. While the review was being conducted,editorial items were noted, such as incorrect word usage orpunctuation. These were marked on a hard copy of the document(available as a pdf file). The locations of these items are indicatedon the document by a marked “x” in the right-hand margin or by anexplanatory note. Some of these items include improper wordselection that could confuse the technical issue at hand, and whichmight not be caught or noted by other reviewers or editors.
We have made many of these suggested editorial changes.
168. Section 1.2.2 Organization. It is mentioned that the documentis divided into eight major sections, yet only seven are listed.
We have made the change.
169. Section 2.1.1 Physical behavior of DNAPLs in the subsurface. Pg. 10, last paragraph - Two references are cited (Hunt, Sitar andUdell, 1989; and McWhorter and Kueper, 1996) that are not listed inSection 7, References.
We have added these references to Section 7.
170. Section 2.1.3 Source zone delineation. Pg. 15, first textparagraph - It is recommended that the phrase “hard rock terrains”be replaced by “igneous and metamorphic rock terrains”. “Hardrock” is a colloquial term that might be misunderstood by somenongeologist readers who might interpret “hard rock” as rock that ishard (e.g., unweathered rock) as opposed to soft (e.g., weatheredrock), rather than differentiating igneous and metamorphic rockfrom sedimentary rock.
Based on other comments, we have deleted all discussionspertaining to contamination in bedrock.
171. Section 2.1.3 Source zone delineation. Pg. 14, 1st fullparagraph - The citation “(EPA, 1992)” is given. There are two1992 EPA citations in the Reference section. The citation hereshould be “1992a”.
We have made the change.
172. Section 2.3 Addressing Rebound. The definition of rebound, asgiven below from the document, indicates that rebound implies thatconcentrations will be higher after treatment than before treatment.“Rebound is a term applied to observed increases in contaminantconcentrations as compared to preremediation levels followingcessation of active remediation.” A common usage of “rebound” isto indicate the increase in concentrations after they have beenlowered during the active phase of treatment. Reboundingconcentrations may be higher than pretreatment concentrations, but“rebound” can also apply to concentrations at or below thepretreatment concentrations. This latter, common, usage of“rebound” is used later in the document, on page 59: “Contaminantconcentrations observed in monitoring wells near the source maydecrease immediately following treatment, as desired, but mayrebound to pretreatment levels after some period of equilibration.”
We have revised the definition of rebound in the first instanceunder Section 2.3.
173. Section 3.1.3 Performance criteria and metrics. Lastparagraph - The phrase “groundwater plume anatomy” is somewhat

E-13
uncommon. Perhaps it could be changed to “groundwater plumedimensions” or “groundwater plume architecture.”
We have incorporated the suggested revision into Section 3.1.3.
174. Section 3.2.3 Selecting the pilot study location. 2nd bullet - It ismentioned that the practical pilot test limit is a reduction in therange of 95-99%. The discussions in the document to this point havebeen much more general, and emphasize uncertainties, so it appearsa little abrupt and inconsistent to include an actual quantification atthis point. It might also raise questions for the reader as to whethertheir pilot studies need to achieve a 95-99% reduction to be judgedsuccessful (Case Study 2 specified a goal of at least 90%). Thissentence could be deleted.
We have deleted the sentence.
175. Section 3.4.2 Sampling Design. Results using the equationgiven in this section do not appear to match the results given inTable 3-1. For example, using PD = 1 - (1-AT/AS)N with AT = 1, AS =10, (i.e., AS/AT = 10), N = 16 gives PD = 1 - (1-1/10)16 or PD = 0.82(or 82%, not the 98% as listed in Table 3-1). It is recommended thatthe equation and the results in Table 3-1 be verified, to ensure thatthey are consistent.
The equation gives the probability of using N-borings randomlylocated to find the target AT within a site AS. The original tablegives the probability for uniformly located borings. These valuesare lower, as the reviewer suggested. They were calculated bythe referenced author using a Monte-Carlo simulation (not anequation). A revised set of values has been generated and thetable has been revised. We have moved the content of Section 3.4to Appendix D.
176. Section 3.4.6 Integrated physical-geostatistical methods. Thelast paragraph refers to Table 3-1, but should refer to Table 3-2.
We have made the change. The statistics section has been movedto Appendix D.
177. Section 4.2.2 Decrease in dissolved concentration. Pg. 57, lastparagraph - It is not clear why the word “poorly” appears in thefollowing sentence: “Multi-level sampling itself is not the same asflux measurement per se (described in section 4.3.3); however, if themonitoring wells are poorly distributed cross-gradient along thecontrol plane (lateral extent), then data generated by a network ofmultilevel samplers can be used to estimate contaminant flux fordifferent depths along the control plane.” It may require additionalexplanation to indicate why a poor distribution of wells would allowa contaminant flux estimate to be made. Use of the word “properly”would appear more appropriate in this sentence.
We concur and have made the correction to the typographicalerror.
178. Section 4.2.2 Decrease in dissolved concentration. Pg. 58, lastparagraph - The word “levels” in the following sentence isambiguous: “Potential problems and challenges with this type ofgoal and verification approach include:1) the high variability, bothtemporally and spatially, in groundwater levels,...” The word“levels” could refer to ground-water elevations as wells as toconcentrations. It is recommended that “concentrations” be used, ifthat is what is meant.
We have substituted the word “concentration” for “levels.”
179. Section 4.2.2 Decrease in dissolved concentration. Pg. 59, 2nd
to last and last paragraph - There is mention of the fact that groundwater taken from monitoring wells may contain water injected aspart of the treatment process, and this may lower contaminant
concentrations. This is a good point, and perhaps could bestrengthened by an additional sentence explicitly mentioning that“dilution” can impact the ground-water concentrations and that thenumber or fraction of pore volumes of water added should be takeninto account when examining these ground-water concentrations.
We concur and have added a sentence suggesting that dilutioncan impact the assessment of dissolved concentration data.
180. Section 5.1 Remedial Effectiveness vs. System Efficiency. Theterms and discussion in this section appear somewhat contradictoryto the terms and discussion in sections 1.3.1 and 1.3.2. Mostsignificantly, the heading “Effectiveness monitoring” is apparentlyused for two paragraphs of what sounds like it should be referring toefficiency monitoring, not effectiveness monitoring (as described insections 1.3.1 and 1.3.2). It might even be that the words“Effectiveness monitoring” were meant to start off a paragraph ortwo that were somehow omitted, rather than to be used as a heading. Also, these paragraphs use the phrase “system process monitoring,”whereas, sections 1.3.1 and 1.3.2 use “system efficiency.” Thephrase “process monitoring” is used in a few other places in thedocument (primarily in section 5.5.2). This phrase appears to beequivalent to the phrase “efficiency monitoring”. As stated in thebeginning of the document, “performance monitoring” encompassesboth “effectiveness” monitoring and “efficiency” monitoring. It isrecommended that the entire document be consistent in what termsare used, and their definitions, e.g., efficiency monitoring,performance monitoring, effectiveness monitoring, and processmonitoring. The addition of a definition of “process monitoring” toBox 1-1 might help lessen these discrepancies. The term “progressmonitoring” is used in section 4.2, first paragraph, and in section6.1.1, first paragraph. This is an example of the use of yet anotherphrase.
We have attempted to rectify all of these inconsistenciesthroughout the document by using the terms “effectiveness” and“efficiency” monitoring where appropriate.
181. Section 5.3.6 Key monitoring parameters. Pg. 83, Dissolvedconcentrations - At the end of the first paragraph, the words “Box 5-1" are given. This is incomplete and there is no Box 5-1.
We have deleted that reference.
182. Section 5.5.1 Technology Description. Pg. 86 paragraph 1 - Itwas reported that the oxidant creates free radicals that react with thecontaminants. However, the oxidants can react with somecontaminants directly. Additionally, the permanganate ion (MnO4
-)reacts through electron transfer without the formation of freeradicals. It is recommended that the wording in this section berevised to reflect these observations.
We have revised the text accordingly.
183. Section 5.5.1 Technology Description Pg. 86 paragraph 1, lastsentence - It is recommended that the last sentence of the paragraphbe replaced with the following sentences. “Each oxidant hasdifferent chemical and physical characteristics and thereforebehaves differently in the subsurface. The rate of reaction betweenthe oxidant and aquifer material varies which effects the transportand distribution of the oxidant in the subsurface. For example, H2O2reacts more rapidly than MnO4
- and therefore presents greaterchallenges for oxidant distribution.”
We concur and have made the suggested change.
184. Section 5.5.1 Technology Description. Pg. 86 paragraph 2, 1st
sentence - It is recommended to change “are necessary” to “may beuseful”.

E-14
We concur.
185. Section 5.5.1 Technology Description. Pg. 86 paragraph 2, 2nd
- 4th sentences - It is recommended to replace the 2nd - 4th sentenceswith the following. “There are different objectives of the bench-scaletreatability study. One objective is to determine the soil oxidantdemand which can be used to conduct a preliminary feasibility study,and to estimate/design the oxidant concentration and loading. Oxidant injection rates are functionally dependent on subsurfaceconditions, such as hydraulic conductivity. High hydraulicconductivity is desirable for oxidant distribution, and therefore, tothe success of delivering the oxidants to the targeted DNAPL zones. Adequate oxidant distribution can also be accomplished insubsurface systems with low hydraulic conductivity using closeinjection well spacing.”
We have made the suggested revisions.
186. Section 5.5.2 Key Monitoring Parameters. Pg. 86, lastparagraph, 4th bullet - While many of the reactions and geochemicalchanges in ISCO are rapid or transient, there are some exceptions. Permanganate can persist for months in some cases, and thegeochemical change of MnO2 formation may be long-lived.
We concur and have changed the text.
187. Section 5.5.2 Groundwater Quality. Pg. 87, 1st paragraph - Thestatement that “Since ISCO is a mass destruction technology, nomass removal is involved.” is incorrect. Unintentional contaminantmass removal and/or transport can occur with improper applicationof Fenton’s reagent. Under this condition, significant heat and O2(g)can be generated that may volatilize and strip contaminants into thevapor phase where they can be lost to the unsaturated zone andatmosphere. Transfer of contaminants can also occur in the gasphase with ozone. It is recommended that this section be revised toreflect these observations, especially, as significant monitoring maybe required to ensure that these adverse effects do not occur. Withthe application of Fenton’s reagent (especially at higher H2O2concentrations), adequate performance monitoring must be done toensure that contaminants are destroyed rather than transferred to theatmosphere.
We concur and have changed the text.
188. Section 5.5.2 Groundwater Quality. Pg. 87, 3rd paragraph - Itwas reported that the reaction kinetics with TOC are generally fasterthan with the contaminants, and contaminants can be released fromthe soils. This observation is not necessarily true. Oxidant reactionkinetics with some contaminants can be very rapid. In general, theTOC (organic matter) oxidation and contaminant release concept iscurrently a hypothesis and it is unclear whether it has been proven. It is recommended that a reference be provided to support thisobservation or that it be deleted from the text of the report. Thereare many chemical and physical processes occurring during and/orshortly after oxidant injection which would effect the fate andtransport of contaminants in ground water. It is difficult todifferentiate between these various fate and transport mechanisms,including desorption due to TOC oxidation.
We have provided a reference.
189. Section 5.5.2 Groundwater Quality. Pg. 87, 4th paragraph - It isagreed that real-time ground water quality monitoring has value, butit is important to note which parameters and for what reason. Forexample, real time ground water concentrations of the oxidant canbe used to determine the radial influence of the oxidant injection. Or, ground water concentrations of VOCs in nearby sentry wells canbe used to assess whether the plume is expanding via displacement ofcontaminated ground water. However, monitoring VOC’s during
oxidation or shortly thereafter can be confounding due tononequilibrium, as reported.
190. It was reported that post-oxidation final performance should bedetermined after all oxidant reactions are complete and siteconditions have returned to equilibrium. It was also reported thatthis could take 1 week to several months. The time frame toreestablish equilibrium conditions is relatively uncertain. Theredoes not appear to be a well established guideline regarding when toanalyze for contaminants and how much time it takes for equilibriumto be established. There are various parameters that could bemonitored to make this determination, but these will vary from site tosite and will depend on each oxidant. Non-equilibrium (eg.,rebound, oxidant persistence, ORP) can take well over 1 year. Non-equilibrium conditions are likely to be much more significant withFenton systems than with other oxidant forms simply due to theextreme conditions associated with the heat and O2(g) released. Some Fenton vendors will monitor for VOCs soon after oxidantinjection (7 days) so a determination can be made whether additionalapplications of the oxidant are needed. In this case, it is assumedthat if contaminants exist, then additional oxidation is neededimmediately. However, for long term performance evaluation, this isnot acceptable. Sometimes, post-oxidation ground water monitoringwill occur at specific, arbitrary intervals. However, there arecontingencies involving the detection of contaminants and obligatoryground water quality monitoring.
In most cases, multiple applications of the oxidant will be needed. The post-oxidation performance evaluation monitoring programshould be developed to accommodate multiple applications of theoxidant.
We agree with your statements and have modified the paragraphaccordingly.
191. Section 5.5.2 Groundwater Quality. Pg. 87, last paragraph -pH and redox sensitive metals can be mobilized under Fentonconditions. There is a wide range of metals that can be mobilizedunder acidic conditions. It is recommended that this issue bediscussed.
We have modified the text to include mobilization of pH-sensitivemetals.
192. Section 5.5.2 Groundwater Quality. Pg. 87, last sentence - It isrecommended that the last sentence be replaced with the following. “Sites where this can be a potential problem can include sites whereeither, (1) naturally occurring metals concentrations in soils areelevated, (2) historical metals contamination was attenuated bynaturally occurring chemical reductions processes, or (3) sites wheremetals were co-disposed with organic contaminants.”
We have replaced the referenced sentence.
193. Section 5.5.2. Table 5-3. This table for performancemonitoring of ISCO has ground water as the only media to bemonitored. However, soil samples can also be useful to assesstreatment performance of ISCO. In fact, the document recognizedthe limitation of relying solely on ground-water samples forperformance assessment in section 4.2.2 (“Although it is importantto monitor groundwater quality inside and outside the source areaduring enhanced recovery or treatment operations, it is notrecommended that groundwater concentration data alone be used toassess performance because of the uncertainties”).
We have modified Table 5-3 to include soil sampling.
194. Section 6.1 Health and Safety. Pg. 92, 2nd paragraph - Thisparagraph is incomplete.

E-15
We have completed the paragraph.
195. Section 6.1.1 Sampling hot media, sampling hot groundwater. The document mentions “Box 6-2 Appendix C”. There does notappear to be a Box 6-2 in the document.
We have deleted reference to Box 6-2 in Appendix C.
196. Section 6.4 Stakeholder/Public Involvement. Pg. 100, 2nd tolast paragraph - This paragraph includes the sentence: “Fullyexplaining how both remediation monitoring and performancemonitoring get the community to the goals for the site,...” Thedifference between “remediation monitoring” and “performancemonitoring” is unclear (See the Specific Comment for section 5.1).
We have clarified the meaning of the sentence.
197. Section 7.0 References. It is recommended that the format ofthe citations be standardized. Currently some citations have theauthors’ initials before their last names, and other citations have theinitials after the last name. In at least one case, the entire first nameis given. Other aspects, such as punctuation, should also bestandardized.
We have gone through the references to ensure consistency.
198. Section 7.0 References. The references in this section were notreviewed for correctness, to verify that all references cited in the textwere included, or to determine if any references were included thatwere not cited in the text. It is recommended that an editor conductthis review.
We have gone through the document to check the accuracy of allreferences and citations.
199. Appendix A. List of Acronyms. The correct name for ASTM is“American Society for Testing and Materials” (with the “and”),although the official name is now simply “ASTM International”. Also, the first occurrence of “VOA” should be “VOC” (and put incorrect alphabetical order).
We have made the changes.
200. Appendix B. Case Studies, p. B-1. Table B-1, cited on thispage, was not found in the document. It is recommended that theremedial technology be listed on page B-1 in the Table of Contents,along with the name of the site. Perhaps the table of contents couldbe made into a table that includes this information, and maybe theadditional information found in the box at the beginning of each casestudy (this would help the reader who is interested in a particulartechnology to quickly find a relevant case study).
We have modified the table of contents and created a more usefulTable B-1 as you suggest.
201. Case Study 1. Pg. B-5, first full paragraph - A “Figure 1" ismentioned; however, there is no figure. Pg. B-5, third paragraph -“Figures 2-5" are mentioned; however, there are no figures.
We have deleted references to figures in Case Study 1.
202. Case Study 2. Pg. B-12, Figure 3 - It is difficult to read thedetails of this figure, as the font is very small. It is an interesting anduseful figure, and increasing the readability is recommended. Itwould also be very useful if the lithologic units could be marked inthe figure. Also, the case study uses “Steam” and “SEE”interchangeably, and “ERH” and “SPH” interchangeably. Although these terms and abbreviations are explained elsewhere inthe document, for even greater clarity, it is recommended that justone term be used consistently for each remedial technology.
We have enlarged the figure to make the text legible and havemade consistent use of the terms SEE and ERH in the case studyand throughout the document.
203. Case Study 6. This case study does not include any informationabout monitoring for temperature increases due to the high H2O2concentrations used, nor about the vapor monitoring results. Pg. B-34, 3rd paragraph - The PCE concentration is given as 9,000 “Fg/l”. The units need to be corrected. Figure 1 - This figure only providesconcentration data to August 1999; however, additional sitecharacterization, oxidant injection, and/or monitoring occurredthrough 2002. It is recommended that the figure be replaced by onethat provides the complete history of the concentrations at the site.
Discussion of temperature increases and vapor monitoring is notcritical to the case study. The units have been corrected to read“µg/L.” The information in the figure has not been updated,however.
204. Case Study 7. Pg. B-40, last paragraph - The text says to“Refer to Figure 1" for the cross-section location. This apparentlyshould be “Refer to Figure 2".
We have made the change.
Eva Davis - EPA Office of Research & Development
205. In general, I find that the document is well-written, however, Ifeel that the document spends too many pages on ancillaryinformation, and lacks detailed information on performanceassessment itself, at least for thermal remediation technologies. Inote that the core of the document in approximately 100 pages long,while only about 13 pages are contained in Chapter 5, which is onSuggested Technology-Specific Monitoring Tools. Only about twopages of this chapter are devoted to assessing the performance ofthermal remediation technologies. I believe the document could bemade more useful by reducing its overall length, while increasing theinformation contained on performance assessment itself. Mydetailed comments, including some suggestions on where cuts couldbe made and suggestions on performance assessment for thermalremediation to be included, are below.
We have tried to reduce the overall length of the document whereapplicable. Your suggestions on deleting or reducing some texthave been applied throughout the document. See responsesbelow in detail.
206. On page 7, it states that performance based contracts reducethe financial risk of source zone treatment by making the vendorresponsible for meeting performance objectives. Actually, whathappens is that the financial risk is transferred to the vendor, whichhas the effect of driving up the overall costs of a fixed price contract. The degree to which costs will increase will depend on thecomplexity of the site, how well the site has been characterized, andhow stringent the performance standards are. The vendor has toinclude contingency funds to cover the unknowns that are alwaysgoing to be a part of these types of projects. If the remediation turnsout to be relatively straightforward, the vendor makes a handsomeprofit, but whoever paid the bill has paid more than they perhapswould have with a contract that shares the risks of the unknowns inthe subsurface. As an example, consider the fact that it cannot bedetermined accurately with the amount of characterization that isdone at most sites how much of the contaminant is in the treatmentarea. However, the amount of contaminants brought to the groundduring the remediation will significantly affect the costs of the vendorto treat the contaminants.

E-16
We concur and have revised the text and added the followingsentence: “The contracted vendor will likely increase the price asappropriate for the level of risk that is being assumed.”
207. On page 7, what is meant by demonstrating “whetherfeasibility is obtainable”?
The paragraph has been revised to clarify its meaning. It hasbeen moved to Appendix C.
208. On page 9 it states that in the saturated zone water is generallythe wetting phase. Although this may generally be true forchlorinated solvents, recent research has shown that many creosotesare actually the wetting phase with respect to water. I foundcreosote to be the wetting phase when I have observed it in the fieldand in my laboratory. This observation was also made by Powers etal. (Powers, S. E., W. H. Anckner, and T. F. Seacord, Wettability ofNAPL-contaminated sands, Journal of Environmental Engineering,122(10):889-896, 1996.) This has important implications in terms oftheir movement in the subsurface.
We have revised the text to clarify the difference in wettingbehavior.
209. A reference or references should be provided on page 11 forcalculating partitioning of a chemical between phases in thesubsurface.
We have added a reference to the 1991 article by Feenstra, et al.describing a method for calculating partitioning between phases.
210. Page 1 states that the focus of this document is onunconsolidated sediments, however, pages 12 and 13 contain a fullpage of discussion on matrix diffusion, a phenomenon that occurs infractured rock. I would suggest that, in order to shorten the length ofthe overall document and maintain its focus, that this section bedeleted.
We concur. As stated in Response 2, discussions of fracturedrock and matrix diffusion have been eliminated from thedocument.
211. Page 1 states that this document is intended for readers whoare familiar with the term DNAPL and its physical characteristics,however, section 2.0 contains almost 10 pages on DNAPL flow in thesubsurface. Perhaps in the interest of focusing the document onperformance assessment, readers that are not familiar with the flowof DNAPL in the subsurface should be referred to an appropriatedocument and this section could be deleted.
Comment understood; however, we are going to keep thebackground discussion intact so readers understand the complexparameters that change as a result of treatment and that could bemonitored.
212. On page 16, it states that thermal technologies affect aDNAPL’s bioavailability. I would disagree that this is an importanteffect of thermal technologies on DNAPLs in the subsurface, or eventhat it has been proven that thermal remediation has this effect. ForVOC and SVOC DNAPLs, vaporization is the most important effectthat the commonly used thermal remediation technologies have onDNAPLs.
We concur and have removed the reference to bioavailability.
213. Page 17 discusses steam stripping. My experience has beenthat many people in the remediation area are not aware of thisphysical phenomenon which occurs when two immiscible liquids arepresent. I would recommend that the co-boiling point of severalcommon DNAPL contaminants be included in this section as an
example. For instance, the boiling points of TCE, PCE, andchlorobenzene are 87°C, 121°C, and 132°C, respectively, and the co-boiling point of TCE DNAPL in the presence of water is 74°C, PCEis 88°C, and chlorobenzene is 92°C.
Comment accepted. This level of detail is not appropriate forthis section. We have expanded on this topic in Section 5.3 andadded a table of co-boiling points with a reference to personalcommunication with Eva Davis, 2004.
214. Page 1 states that the focus of this document is onunconsolidated sediments, however, page 23 and 24 discusses EPA’sfractured rock database. In order to keep the document morefocused, I suggest that this section be deleted.
We concur. As stated in Response 2, discussions of fracturedrock and matrix diffusion have been eliminated from thedocument.
215. Page 34 states that monitoring needs decline as theremediation continues. However, in terms of determining when toend active treatment, the monitoring needs may significantly increaseas the remediation approaches the end point, in order to confirm thatcontinuing the remediation would have diminishing returns.
We concur and have provide some examples of when monitoringneeds may increase over time. This issue is also addressed in ourresponse to Comment 224.
216. Page 35 states that data from remediation sites is sometimestoo complex to easily see trends and may require sophisticatedstatistical and data modeling to evaluate. I am concerned that mostenvironmental data is not suitable for statistical evaluation, andstatistical assessments may actually misrepresent the data because infact the data does not fit any statistical model. I suggest deleting (orat least reducing) the discussion of statistics, and just referencingother appropriate sources of information. A little informationwithout providing enough information for a full understanding maybe dangerous and lead to attempts to apply statistics incorrectly andthe derivation of erroneous results. Deletion or reduction of thissection will also help to focus the document on the topic ofperformance assessment. Also, my experience with well designedand operated thermal remediations is that the reductions inconcentrations are obvious.
As written, the document does not advocate any particularstatistical approach and primarily suggests topics for “furtherreading” as the reviewer recommends. However, to focus thedocument we have moved the entire statistics section to AppendixD.
217. Section 3.5.2: This section discusses the Triad approach, and Iam currently on the team for the Ft. Lewis site where the Triadapproach is being used during a remediation. However, I hadtrouble following how this section is applicable to remedial projects(versus site characterization processes). To make this informationmore useful, I would recommend focusing it more on how it is used toaid in performance monitoring.
Comment accepted. Section 3.5 (Data Quality Considerations)has been revised.
218. Table 4-1(page 48) states that the relative accuracy of sourcemass extracted is low. I believe this statement is only true forpercent of source mass extracted. In general terms, measuring theamount of contaminant extracted is likely to be significantly moreaccurate than estimates of mass in place before or after remediation.

E-17
Comment accepted. We have revised Table 4-1 to state that therelative accuracy of source mass extracted is intermediate tohigh.
219. Page 51 states that three factors are necessary to guide thedevelopment of a performance assessment plan. I think the choice oftechnology for the remediation is an equally important factor indevelopment of the performance assessment plan, and this should beadded to the list.
The last paragraph of Section 4.1 has been revised to add afourth factor.
220. Page 52 discusses problems with VOC losses during soilsampling. It should be pointed out that this applies to chlorinatedsolvent VOCs, but not to the semi-volatile creosote and coal tarDNAPLs. The sampling technique discussed is not appropriate forSVOCs.
The sentence has been revised to clarify the issue regarding lossof VOCs and SVOCs.
221. Why would “poorly” distributed cross-gradient monitoringwells allow estimates of contaminant flux along the control plane(see the last sentence on page 57)?
The text now reads “properly distributed.”
222. Section 4.4.2: Although I agree that it would be great to knowNAPL saturation in the subsurface to have an indication whether theNAPL is mobile or not, it should be pointed out that when mobileNAPL is present in the subsurface, it may drain from the sampler asthe core is brought to the surface, yielding low (perhaps significantlylow) estimates of NAPL saturation and mobility.
We concur. Text has been added to Section 4.4.2.
223. Section 4.4.3 describes several pumping techniques forestimating mass flux. All of these techniques that involve pumpingwill have the same limitations that are caused by the pumping, whichinclude difficulties with extrapolating the results to unstressed sourcezones, and alteration of the plume. It should be made clear thatthese limitations apply to not just one method but to all the pumpingmethods.
Two of the four techniques involve pumping. We have made surethat both techniques are included when describing thislimitation.
224. Page 76 states that more frequent monitoring is requiredearlier in the process, while less monitoring is required when thesystem stabilizes. It should also be pointed out that more frequentmonitoring may be needed as you approach the end of theremediation and are looking for diminishing returns to determinewhen to turn the system off.
We addressed this issue in our response to Comment 215. Additional text has been added to Section 5.1 to clarify.
225. Section 5.3: Mechanisms that are important in thermalremediation are: 1) vaporization; 2) viscosity reduction; 3)solubilization, and in the case of steam injection, 4) displacement. Isuggest the EPA Issue Paper “How Heat Can Enhance ThermalRemediation” for more information on these mechanisms (Davis, E.L., How heat can enhance in-situ soil and aquifer remediation: Important chemical properties and guidance on choosing theappropriate technique, Ground Water Issue Paper, USEnvironmental Protection Agency, EPA/540/S-97/502, April 1997). Steam generated in situ by ERH or conductive heating does not“sweep DNAPLs out of low-permeability soil lenses” but vaporizes
compounds which have sufficiently high vapor pressures. Biologicalactivity or chemical reactions depend on many factors; these aresecondary factors at best and not primary means of treating DNAPLsvia thermal remediation. More information on chemical processesduring thermal remediation is given in comment #232. It should bepointed out that the USACE thermal remediation manual is notmeant to be guidance for designing thermal remediation systems, butonly provides information for those doing oversight.
Based on this and other comments about maintaining a consistentlevel of detail when describing the technologies, we have deletedthe bulleted list. The reader is referred to the USACE guidanceand the Davis paper (1997) for detailed discussion ofmechanisms.
226. Section 5.3.3: Collecting vapors only in the vadose zone is nota good design for ERH systems unless only the vadose zone is to betreated. In ERH systems being designed today, vapors are collectedover the depth of the zone being treated. In many of these systems,particularly where groundwater flow rates are high, groundwaterextraction is also employed.
We agree that vapor extraction wells are installed over the entiretreatment depth, but in practice, most vapor recovery occurs inthe vadose zone. The text has been revised to clarify.
227. Section 5.3.3: It should be made clear that steam distillationand steam stripping, which are described in the third paragraph ofthis section, are not particular to ERH systems but occur regardlessof how the heat is applied to the subsurface.
We have moved the paragraph to Section 5.3 so that it appliesmore generally to all thermally enhanced technologies.
228. Section 5.3.4: Thermal conduction heating is knowncommercially as in situ thermal desorption, not destruction.
We have made the change.
229. Section 5.3.4: Heating is not necessarily uniform or“inevitable” using thermal conductive heating. Heating near the soilsurface has been found to be particularly difficult for this process. Also, temperatures will not go above 100°C when water is present(all of the energy will go to vaporize the water).
We concur. The subsection has been revised to reflect yourconcerns.
230. Section 5.3.4: It should be pointed out that temperatures above100°C can only be achieved in the vadose zone or wheregroundwater influx is controlled by pumping. The temperature willnot go above 100°C while there is water present.
We have addressed this concern in response to Comment 229.
231. Section 5.3.4: The last paragraph of this section appears to beout of place as design parameters and well spacing is not discussedfor any of the other thermal technologies.
The last paragraph in section 5.3.4 has been deleted.
232. Section 5.3.5: Additional information is now becomingavailable from research funded by EPA under a cooperativeagreement with Georgia Tech University. These carefully designedand controlled experiments show much less transformation of TCEthan was found in the work done by Lawrence Livermore NationalLabs. A presentation on this research was made at the Battelle-Monterey conference in May 2004, and the draft report will be goingout for peer review soon. In fact, a review of the literature on TCEhydrolysis or oxidation shows considerable variation in the reported

E-18
transformation rates. The conclusion I have at this point is thattransformations in the subsurface under the conditions of thermalremediation have not been fully documented. I recommend that thissection be deleted. Thermal remediation methods are excellent forextracting VOCs and SVOCs from the subsurface, but it is not clearhow important transformation processes are under the conditions oftypical thermal remediations.
We concur. The subsection has been deleted.
233. Table 5-1: For a regulatory person or site owner overseeingthe remediation of a site using thermal remediation, the mostimportant performance measures are temperature in the subsurface,water levels and vapor pressures in the subsurface to ensurehydraulic and pneumatic control, and the extraction rate ofcontaminants to allow calculation of mass removed. Also, forcompliance purposes, vapor and water discharges from the treatmentsystems should be monitored. The other things listed in the table,such as injection rates or power and current draw, I consider thingsthat the thermal technology vendor should be monitoring for theiroperation of the system, but not data that is used for performanceassessment by regulators or others providing oversight. I’m used tohaving this data shared to some degree with those overseeing theprocess, but I question whether it should be included in this table. Isee it as being outside of the purpose of this document. I would liketo see the document provide more discussion on frequency ofmonitoring and where the subsurface monitoring should be done.
We disagree. Power density is considered by practitioners ofERH and ISTD to be one of the most important parameters forevaluating the efficiency and effectiveness of thermal treatment.
234. Subsurface temperature monitoring is part of the system builtand operated by the thermal remediation vendor, but the contractshould stipulate that the data is shared with those doing the oversightat an agreed on frequency. In discussions with the technologyvendor, the number of thermocouples to be used and the frequency oftemperature measurement should also be agreed on. The vendor willlikely have a minimum monitoring that they need for operation of thesystem, but those overseeing the remediation may desire to have agreater degree of monitoring built into the system. Commonly,thermocouple strings are placed in between injection and extractionwells and at extraction wells in steam injection systems, or at variouslocations between electrodes or heating elements in ERH andconductive heating systems, respectively. Thermocouple strings arealso generally co-located with monitoring wells, both inside andoutside of the treatment area. Generally a 5 to 10 foot verticalspacing of thermocouples is used on thermocouple strings. If a hotfloor is desired, thermocouples should be installed below thetreatment area also to ensure that the hot floor is established. Themore heterogeneous the subsurface system is, the more thermocouplestrings should be employed. Also, it is likely that more thermocouplestrings will be required in a steam injection system than in a ERH orconductive heating system. When ERT is used to monitor steammovement in a steam injection system, thermocouples should also beinstalled. The use of ERT does not substitute for thermocouples. Thetarget temperature will be dependent on the contaminants to betreated and the technology used. For VOCs, the target temperatureis generally 100°C, or the co-boiling temperature of contaminant tobe recovered. The objective should be to heat the entire target areato this temperature, not to achieve this temperature on average in thetreatment area. If cold spots remain, contaminant vapors may betransported to the cold area and condense, particularly if the vacuumextraction system is not strong enough.
We concur and have added text describing the placement ofthermocouples and achieving a “hot floor.” We have alsoprovided a new table that lists co-boiling points of commonsolvents, as suggested in Comment 213.
235. Under “General” in Table 5-1, vacuum pressure in thesubsurface is another parameter that should be measured duringthermal remediation to ensure control of the vapors that aregenerated. Vapor measuring points should be included within andaround the perimeter of the treatment area. They can be co-locatedwith monitoring wells. The exterior monitoring points must be closeenough to the treatment area so that vacuum can be expected at thatmonitoring point. I like to see vacuum measurements made once aweek during a remediation.
We concur and have added a new subsection entitled“Subsurface pressure.”
236. Under “General”, soil sampling should be included. Normally,soil samples are obtained during installation of the remediationsystem, and then confirmation samples are obtained after theremediation has been completed. The benefits of soil samplingduring system installation is that it can provide additionalcharacterization information on the extent of contamination, as wellas providing baseline soil concentrations. In most cases, the soilsampling done for characterization purposes was not at the samefrequency that drilling will be done to install the system, soconsiderable additional information can be obtained. Aftercompletion of the remediation, the frequency of soil sampling maynot need to be a great as before the remediation, but some paired soilcores should be obtained, and sampling should be done at locationswhere there is some question as to the effectiveness of treatment, ie,those areas that were difficult to heat completely. Interim soilsampling has also sometimes been used to help judge the progress ofthe remediation.
We have revised Table 5-2 to reflect the reviewer’s suggestionsand also added a new subsection on soil and groundwatersampling.
237. Under thermal conduction heating in Table 5-1, the line for“Thermocouples” can be deleted as subsurface temperatures arecovered under the “General” heading.
We concur. The line has been deleted from the table.
238. If the treatment area extends below the water table, monitoringwells should be both within and outside of the treatment area. Baseline groundwater samples should be obtained before theremediation begins. If desired, some samples may be obtainedduring the remediation to gauge the progress of the remediation. Monitoring wells should also be used for water level measurements,especially for ERH and conductive heating projects at sites with highpermeability. Manual measurements of water level can be verydifficult when the temperatures approach boiling. Thus, the use ofpressure transducers that are installed in the wells permanently andread automatically should be evaluated. It has been found at the FtLewis ERH site that temperature is the better indicator of loss ofhydraulic control. Exterior monitoring wells also have thermocouplestrings, and temperature increases at some depths at thesemonitoring wells indicates flow of heated water from the treatmentzone. Knowing where water is leaving the treatment area allowsadjustments to be made to improve hydraulic control. Also, samplesare obtained on a regular basis from the exterior wells that showtemperature increases to ensure that contaminants are not also beingcarried out of the treatment area.
We agree and have added a subsection on groundwatermonitoring.
239. Page 82 mentions ERT, but I don’t believe that this acronymhas been used previously in this document, nor has the process beendescribed. ERT does not measure temperature, but changes inelectrical resistivity of the subsurface, which can be caused bychanges in the composition of the fluids in the pore spaces as well as

E-19
changes in temperature. ERT has only been used for steam injection;it is not likely to provide effective monitoring for ERH or conductiveheating processes. The main resistivity changes that normally occurin steam injection remediations lower the saturation of the porespaces by formation of a steam zone.
We have added a description of ERT to the subsection ontemperature monitoring.
240. Page 82: A hot floor is measured beneath the target zone, notnecessarily at the perimeter of the target zone.
Comment accepted. The discussion in Section 5.3.6 has beenrevised.
241. The middle of page 83 contains an incomplete sentence thatconsists of, “Box 5-1 shows”. The document does not contain a Box5-1.
We have deleted the reference to Box 5-1.
242. Section 5.3.6: When groundwater extraction is employed aspart of the thermal remediation, groundwater samples should also beanalyzed for the purposes of calculating the amount of contaminantsrecovered and to help determine when the point of diminishingreturns is being reached.
We concur. Section 5.3.6 has been modified to includemonitoring extracted fluids.
243. In Section 6.1, the second paragraph consists of two incompletesentences.
We have corrected the error.
244. Section 6.1.1: It is true that sampling hot liquids and soils canbe dangerous if you do not know how to do the sampling. Thermalremediation vendors have developed safe methods to obtain valid hotgroundwater and soil samples. If final groundwater and soil samplesare to be obtained by those overseeing the remediation rather thanthe vendor, they should consult with the vendor about safe samplingmethods. Another good source of hot soil sampling information isthe paper by Gaberell that is referenced.
We concur and have revised the text somewhat.
245. Although it is true that flash boiling of groundwater can occurduring thermal remediation, explosive conditions do not occur.
We concur and have removed reference to explosive conditions.
246. Section 6.3: As mentioned in Comment #28, I recommend thatsoil sampling for baseline data be done as the system as installed,thus the need for backfilling the boreholes is a moot point. If soilsampling is done for characterization that is not part of the systeminstallation, the boreholes should be backfilled with a grout that canwithstand thermal remediation temperatures if thermal remediationis to be done. Normally, cement grout with 40 percent silica flour isused for this purpose. This is especially important if steam injectionis to be used.
We concur and have added a sentence on grout compatibility.
247. Page 97: See comment #216 above in relation to statisticalmethods to evaluate the data.
Discussion of statistical methods has been moved to Appendix D.
248. Page 99: TI Waivers require NAPL removal to the extentpracticable.
Comment accepted.
249. Appendix B, Case Study 2: The case study states that verifyingthat TCE did not migrate to surrounding regions was one of theperformance objectives, and that constraints placed on the vendorsincluded the requirement to maintain hydraulic control. However, italso states that the demonstration design for the ISCO portion didnot include any provision to ensure hydraulic control, althoughapproximately 3 pore volumes of water/oxidant were injected. Thisbecomes very confusing. The case study also states that indicationswere that lateral migration did occur during the ERH demonstration. However, nothing is provided on what these indications were, andmonitoring methods for determining whether or not migrationoccurred is not discussed. Clarification should be provided as towhat monitoring was done for each of these demonstrations,including to determine if hydraulic control was maintained, whatevidence there was of contaminant movement out of the treatmentarea, and at what time the migration occurred. It is myunderstanding that baseline characterization of all three plots wasdone before any of the demonstrations. Thus, displacement of TCEby the ISCO demonstration could have effected concentrations in theother two cells. Also, it appears that some relocation ofcontaminants occurred due to the hurricanes, and it is not clear thatthe ongoing ERH demonstration was the cause migration from thecell. This could help explain the lack of mass balance for the ERHcell (although a lack of mass balance is not surprising). These thingsmay have a significant impact on percent removal estimates, and thispoint should be brought out. It also demonstrates why percentremoved is not a good performance measure for remediation.
We agree that the writeup was somewhat confusing and haverevised the case study.
250. Appendix B, Case Study 3: Salient points about the Young-Rainey remediation that I think would be useful to add to the casestudy:
- During the interim soil sampling, it was determined that one areawas not being heated, and additional steam injection points wereadded in order to heat the entire target area.
- The actual objective of the remediation that was done at this sitewas to remove mobile NAPL. The soil and groundwater cleanupstandards were set based on this goal; these concentrations werethought to demonstrate that no NAPL remained.
- The post-treatment soil sampling showed that all soilconcentrations were significantly lower than the soil cleanupstandards.
- This was a guaranteed remediation, and that likely effected thecosts.
Also, I would recommend that all the lessons learned listed relateback to the objective of this document, which is performancemonitoring. It’s not clear to me that all of the lessons learned listedhere relate to performance monitoring.
We have revised the case study to include these points.
251. Appendix B, Case Study 4: I think the table of performancemeasures (Table 2) is very useful, and adding a table like this to theother case studies would make all the case studies more useful. Whatwas the shut down criteria used for this remediation? Again, I wouldrecommend that all the lessons learned listed relate back to theobjective of this document, which is performance monitoring. It’snot clear to me that all of the lessons learned listed here relate toperformance monitoring.

E-20
The shutdown criteria consisted of monitoring the TCEconcentrations in the vapor stream until asymptotic conditionswere achieved. Then the vendor recommended system shutdownand confirmatory soil and groundwater sampling performed.Groundwater monitoring was also performed during operations.
252. Appendix B, Case Study 5: Since this pilot study was performedwithin a highly contaminated area, what is the probability that finalgroundwater concentrations were affected by recontamination fromsurrounding areas? Was something done to prevent or reducerecontamination before the samples were obtained?
The probability is high that the ERH pilot test area will becomerecontaminated following the remediation because the pilot testwas located on the periphery of a large TCE DNAPL sourcearea. Nothing was done to prevent or reduce recontamination ofthe pilot test area before the samples were obtained.
Greg Lyssy - EPA Ground Water Forum Liaison
253. In Section 1.2.1 on Page 1, under the heading Document intent,the text states “It may very well be that decision makers decide thatDNAPL treatment is not feasible for a particular site…” The textshould be modified to indicate that it is possible that decision makersmay select not to treat DNAPL. Use of the term “may very well be” suggests this practice would be considered standard, normal, andacceptable which it is not in many cases.
We have removed the sentence.
254. In Section 1.4.1 on page 5, under the heading Why isperformance assessment important?, A more appropriate title for thesection might be Potential goals and outcomes of performanceassessment. The concepts expressed in this section are importantand are well stated.
We concur and have changed the heading as suggested.
255. In Section 1.4.1 on page 6, under the heading To monitorpotential impacts beyond the treatment zone, the second sentenceindicates that the concern of project managers is the potential forunacceptable exposure to down-gradient receptors. In a moregeneral sense, the concern would likely be that as a result of theDNAPL remedial action, contaminant migration outside of theDNAPL area would be enhanced and contaminants could betransported into previously uncontaminated areas.
Comment accepted. The text has been revised to include themore general case.
256. On Figure 2-1 on Page 9, this figure should be modified toclearly illustrate the difference between residual and pooled DNAPLas defined in the text. The current illustration is unclear.
See response to Comment 105.
257. In Section 2.1.2, on Page 10, Partitioning Theory, the textstates that “Using these partitioning relationships and the conceptsof conservation of mass and volume, the amount of each componentin each of the four phases can be calculated. The text should bemodified to indicate the amount of each component in each of thefour phases can be estimated assuming equilibrium conditions havebeen met.
We concur and have revised the end of the sentence to read“...can be estimated, assuming equilibrium conditions have beenmet.”
258. In Section 2.1.2, on Page 11, Saturation Concept, the text states“In the field, saturation values are averaged over large areas so thattypical residual saturation of DNAPL will be substantially lower…”. It is unclear if this is referring to measured residual concentrationsor estimations based on calculations. The overall meaning of thesentence is unclear and should be revised.
We have revised the text to highlight the difference betweensaturation values in the vadose zone versus those in the saturatedzone.
259. In Section 2.1.2 on page 12, under the heading Matrixdiffusion, the first sentence can be read to define matrix diffusion asa process that applies to ground-water flow in fractured media. Thetext of this discussion later clarifies that matrix diffusion is notlimited to fractured rock media. This discrepancy should beeliminated by revising the first sentence of the text. Additionally,matrix diffusion may have limited applicability to some fracturedmedia, if the rock is completely impervious with the exception of thefractures. Such an impervious condition may not be common, but inpractical terms, there are certain rock types that have effectively noprimary porosity, potentially making the matrix diffusion processvery limited or even inconsequential with respect to the DNAPLdistribution.
There is a tendency to overuse the term “matrix diffusion” in the text. Advective flow is not limited for all rock types. For instance inpoorly cemented sandstones such as the ST Petersburg, or in manyarkoses, pore space can be significant and advective flux through thepore can be much greater than diffusion. In addition, not all rocktypes diffuse equally or simply. Where chemical weathering hasproceeded along fractures, clay minerals may form. These clayminerals can retard contaminant movement. In an orthoquartzitesuch as the Tuscarora, there is virtually no porosity within beds. Thesilicate framework of quartz make diffusion fairly insignificant.
We concur. Based on this and other comments, the section onmatrix diffusion has been removed.
260. On page 12, Section 2.1.2, Matrix diffusion. The textintroducing Box 2-1 states that matrix diffusion made it infeasible torecover the source in a reasonable time frame. However, the text inthe box indicates matrix diffusion was one of the many factors thatreduced the feasibility of source recovery based on currentlyavailable technologies. The introductory text to Box 2-1 should bereworded accordingly.
Box 2-1 has been deleted.
261. On Page 18, Section 2.2, under the heading Secondary impact,the text indicates source remedies that lower pH mobilize naturallyoccurring metals. Please cite examples of where this condition hasoccurred.
The concern with mobilizing metals at low pH is based on basicwater chemistry and not on any particular experience orobservation. The concern is also qualified by the adjective“potential.” No change is warranted.
262. On page 19, under the heading Gas generation, the thirdsentence states that through exothermic conditions associated with insitu chemical oxidation, VOCs may be generated. This statementshould probably be reworded to indicate that the VOCs can bevolatilized rather than generated through this process.
We concur. The subheading has been changed to “VOC off-gassing” and the term “stripping” substituted for the word“generation.”

E-21
263. On page 19, in the first paragraph under the Section 2.3heading Addressing Rebound, the text indicates or implies that vaporor ground-water extraction technologies are primarily a processinvolving diffusive mass transfer of contaminants. This wordingneeds to be either removed or modified, as advection is the primaryprocess through which contaminant mass is transported through thesubsurface. At some point in the removal processes, diffusion maycontrol the rate of mass removal from the subsurface, but thiscondition is not necessarily the case, as there are other processesthat limit contaminant mass transfer.
We concur. The sentence has been rewritten.
264. On Page 19, Section 2.3 Addressing Rebound, reboundindicates the need for long term monitoring. Site conditions willchange. It may be the behavior of the source terms after treatment orit can be because of many other reasons such as drought, watersupply wells etc. Long term monitoring is needed to assessperformance. Temporal considerations should be a major point.
We agree. Mention of the need for long-term monitoring hasbeen included.
265. In the second paragraph of Section 2.4 on page 21, the textstates that some EPA documents encourage the use of TI waivers. Although the referenced documents may allow TI waivers, they donot necessarily encourage them unless the are appropriate. Pleasemodify text.
We do not agree. The referenced EPA document do encouragethe use of TI waivers.
266. In the second paragraph of Section 3.2.1 on page 29, thewording implies that the percent DNAPL reduction is an importantelement of any assessment of DNAPL removal efficiency. There arelikely to be sites where the amount of DNAPL present under thebaseline conditions will be extremely difficult to ascertain with anyreasonable degree of certainty. For such conditions, the percentDNAPL reduction criterion may not be a good measure of DNAPLremoval efficiency. Under these conditions, it may be best to eitheruse a mass flux reduction/ground-water concentration reductioncriterion to assess removal efficiency or to establish, as applicable,the reduction in DNAPL removal over time relative to the initialDNAPL removal rate and terminate or modify the DNAPL remedialaction at a predetermined ratio of current to initial DNAPL removalrate.
We agree that percent removal is a source reduction metric thatis difficult to quantify. The intent of this section is to describesome of the objectives of a pilot test; a perfectly valid outcomemay be realizing that the goal of achieving a minimum percentremoval is not appropriate for the full-scale because of theamount of uncertainty in the baseline mass estimate. Section 3.2has been move to Appendix B.
267. The text of Section 3.2.2 states that some estimate of the massand distribution of DNAPL and the uncertainty of that estimate,should be determined pre and post-treatment. The mass estimate anddistribution of DNAPL are likely to be very uncertain at a number ofDNAPL sites. The potential error of the DNAPL mass estimateshould be provided when making these calculations.
It may, however be possible at some sites that specific subareas ofDNAPL contamination can be reasonably well characterized prior toDNAPL remediation. Then, depending on the site hydrogeologicconditions, it may be possible to recharacterize those subareasfollowing treatment and use that information as a surrogate for theoverall DNAPL removal efficiency for the entire source area.
At sites where there is considerable uncertainty about the nature ofDNAPL distribution, total mass of DNAPL, et cetera, it may beadvantageous to select such subareas as the locations for pilot-scaletesting and establish such pilot-scale testing as an essential elementprior to establishing performance criteria or treatment details for thefull-scale DNAPL removal.
We have revised the text somewhat to downplay the importanceand expectations of mass estimates. Section 3.2 has been move toAppendix B.
268. Section 3.2.3 on page 30 advocates locating the pilot test ineither a representative portion of a site or in a section of the site thatis considered to be more challenging than average.
If there are any criteria that can be used to decide which of these twooptions would be more appropriate for a particular site, they shouldbe mentioned in this discussion. It may be difficult to define whatconstitutes a “representative” area of DNAPL contamination formany sites, based on DNAPL geometries and othercontaminant-specific factors. There should probably be somemention of the value in having a well defined picture of the sitegeology as a means of assessing if identified subareas of DNAPLcontamination are likely representative of the DNAPL contaminationin general.
We concur and have revised the text. Section 3.2 has been moveto Appendix B.
269. On Page 33, Section 3.3, “Developing an Exit Strategy”, it maybe prudent to not call a section an “exit” strategy. Perhaps anoptimization strategy, especially since the text acknowledges thatmodifications to the remedy may be appropriate.
We agree. The term exit strategy has been changed to“completion or optimization strategy.”
270. On Page 34, Section 3.3.2 is titled “Contingency planning andadaptation”. While this title captures a part of the discussion in thatsection, the title is for the most part inconsistent with the text in thesection. Some of the Section 3.3.2 text should probably be movedinto Section 3.3.1 and the remainder of the text should probably beamended with additional language that describes contingencyplanning and implementation.
We concur and have reorganized the text as suggested.
271. In Section 3.4.2 on page 35, the second sentence poses thequestion “...which should be selected first: the statistical model to beused for the data analyses or the sampling program?” Theappropriate statistical model to be used will depend upon the natureof the data being collected (e.g. is there seasonality in data; do thedata follow some identifiable distribution?) The sampling programshould be initially specified, with an agreement to review the databeing collected and modify that plan, if necessary. Any statisticalapproach to analyze the collected data should be selected on thebasis of the nature of the data that have been obtained.
We have added the sentence, “Because the appropriate statisticalmodel to be used will depend upon the nature and form of thedata being collected (e.g., seasonality, data distribution), thesampling program should be designed initially using someassumptions about the data, with an agreement to review thedata as it is being collected and to modify that plan, if necessary.”
272. Section 3.4.3 presents several data analysis procedures withoutproviding any information as to how those statistical approachesmight relate to monitoring DNAPL source zone remedies. Thediscussion would be improved if some examples were given for how

E-22
each statistical approach might be applied to the DNAPL sourceremediation problem.
We have moved the discussion on statistics (Section 3.4) toAppendix C.
273. Section 3.4.5 presents one type of trend analysis. Throughomission of any alternative approaches, the text implies that thistrend analysis approach will be universally applicable to problemsinvolving DNAPL source zone remedies. This position is clearlyinvalid. Some statement should at least be added that other trendanalyses are potentially applicable to data analyses involvingDNAPL source remediation.
We concur and have added language to that affect.
274. Section 3.6, Keeping an Eye Toward Site Closure. The textpresents ITRC’s (a state organization) interpretation of federalregulations, including CERCLA and RCRA. The description of theprograms is not necessary to understanding performance assessmentor site closure. Even the description of other programs includespotentially erroneous statements about some state programs. Thedescription of different programs is not needed, simply a statementthat all regulatory programs may lead to and allow for site closureprovided certain conditions have been met as determined by theprogram area would probably suffice.
We concur and have deleted the three paragraphs.
275. It would be useful if under the Purging considerationsdiscussion of Section 4.2.2, the text stated that consistency in purgingtechniques between different sampling events is important tomonitoring changes in ground-water chemistry in response toremedial actions addressing DNAPL.
We concur and have added the following sentence: “In addition,when considering changing the purging methods, it is importantto evaluate if a change in analytical values results because ofchanging purging methods by performing a comparison ofresults from each method.”
276. In the last part of the Purging considerations discussion ofSection 4.2.2 on page 56, it would be useful if the text mentioned theuse of passive diffusion samplers for some applications involvingmonitoring of low permeability formations where there iscontamination related to chlorinated solvent DNAPL contamination. In particular, purging and sampling with a bailer can often introduceunacceptable ground-water entrance velocities in monitoring wells,yielding turbid samples. While text on page 58 notes that passivediffusion samplers have limited applications in aquifer materialswith hydraulic conductivity less than 1 × 10⁻⁶ cm/sec, there are alsolimitations in such aquifer materials to using any type of samplingdevice. There is probably an optimal sampling approach for lowhydraulic conductivity materials depending on site-specificconsiderations, and it may be best to note the universal difficulty inconducting ground-water monitoring of such earth materials.
We thank you for the comment, however we feel the documentincludes the information.
277. Section 4.2.3 discusses measurement of soil vaporconcentrations in the context of a DNAPL removal from the vadosezone using SVE as the remedial process. Measurement of soil vaporconcentration changes may also have some applicability where othertypes of DNAPL removal/treatment processes are used in the vadosezone, and perhaps in some limited circumstances, for DNAPLremoval/treatment in the saturated zone. The latter part of thediscussion notes the limitations of measurement of soil vaporconcentrations. The discussion of this possible approach forassessment of DNAPL source treatment progress should note its
benefits, particularly relative to monitoring soil contaminantconcentrations through direct measurement of soil concentrations. Specifically, soil vapor monitoring can be done in a manner thatproduces a result per sample that is applicable to a larger volume ofsoil than a direct soil sampling technique, which may be important incomparing pre and post-treatment concentrations where there isconsiderable spatial variability in the contaminant distribution. Asnoted in the prior discussion regarding measurement of soilconcentrations by direct soil sampling (page 54) “If the goal is toassess performance of a remediation technology, a directcomparison of conditions before and after treatment cannot bemade.”
We thank you for the comment, however we feel the documentincludes the information.
278. Under the heading Monitoring well network design andinstallation on page 56, the second paragraph should identify what“shutdown” refers to.
Shutdown refers to cessation of active source treatment.
279. The third “bullet” in the PDB discussion on page 58 needs tobe reworded to indicate that the well screen/sand pack is thematerial that may be less permeable than the surrounding aquifermaterials.
We have deleted the third bullet because it is not specific to PDBsand more generally applies to well construction.
280. The wording is awkward in the last sentence of the next to lastparagraph of Section 4.2.2.
We concur. The text has been revised to clarify its meaning.
281. The last sentence of the first paragraph under Section 4.4.2needs word added in order to be a complete sentence.
We concur.
282. Section 5.1 appears to omit a discussion on remedialeffectiveness monitoring. The discussion also identifies one type ofperformance monitoring as “System efficiency monitoring,” yet thetext describes “System process monitoring.” Terminology should beconsistent.
We have revised the text in Section 5.1 and have changed processmonitoring to efficiency monitoring.
283. In the last paragraph of Section 5.3.5, the term “ISTD”probably needs to be spelled out.
We have deleted Section 5.3.5 to reduce the length of thedocument.
284. In the discussion under the heading Dissolved concentrationnear the close of Section 5.3.6, there is missing text in the lastsentence of the first paragraph.
Reference to Box 5-1 has been removed.
285. The text of Section 5.6.1 would be improved if a statement wasadded regarding what types of DNAPLs are considered to bepotentially amenable to treatment by enhanced in-situbioremediation.
The first sentence states that ISB has been demonstrated in thefield only at a few chlorinated solvent sites. The entire section islimited to discussion of PCE and its degradation products.

E-23
286. On Page 92, Sampling Hot Ground Water, it is generally notrecommended to collect samples of excessively hot ground watersince it is not going to be representative of overall water quality. What is the purpose of collecting the hot water samples, especially ifVOCs are the target analyte. It would be prudent to wait until thesystem cools so that temperature does not become an issue andcertainly not a dangerous/safety issue.
We are aware of several projects where groundwater samplingwas performed while the aquifer was near 90°C. Hot samplingtechniques were employed to minimize volatilization and preventexposure to hot fluids.
287. On Page 95, in Section 6.2.2, Estimating remediation timeframes, there is a discussion about the Natural Attenuation Software(NAS). Please add a sentence discussing the potential limitations ofthe NAS.
We have added the following sentences: “Like most numericalmodeling tools, NAS requires the input of detailed siteinformation about hydrogeology, redox conditions, and thedistribution of contaminants. For highly heterogeneous systems,the program may introduce unacceptable errors and moredetailed, site-specific modeling may be required.”
A. Lynn Wood - EPA Office of Research &Development
288. Executive Summary, Second Paragraph: Last sentence of thisparagraph states “…rate of contaminant mass or flux emanating…” This would be more correctly stated as “… rate of contaminant massdischarge or flux emanating…”
We concur.
289. 1.3.1 Effectiveness, First paragraph, last sentence: Why limitthis to wood-treater sites? These goals could apply to other types ofDNAPL sites.
We agree. The text has been revised.
290. 1.3.2 Efficiency, First paragraph, last sentence: Replace“procedure” with “practice.”
We concur.
291. 1.4 Planning for Performance Assessment, First paragraph,first sentence: Replace “…source zone removal…” with “…sourcezone treatment…”.
We concur. The change has been made.
292. 1.4.1 Third paragraph, 4th sentence: What is meant by “plumestrength”?
“Decrease in plume strength over time” has been changed to“decrease in plume longevity.”
293. 2.1 Key Concepts Relating to DNAPLs, Second paragraph: MacKay and Cherry, 1989; Cohen and Mercer, 1993 and Feenstra etal., 1996 are not included in Reference Section.
These have been included.
294. 2.1.1 First paragraph: Mercer and Cohen, 1993 is not inReference Section. Fourth paragraph: Hunt, Sitar and Udell, 1989and McWhorter and Kueper, 1996 are not in Reference Section.
These have been included.
295. 2.1.2 Saturation concepts, First sentence: Saturation is moreappropriately defined as the percentage of the pore space occupiedby a fluid. “Available volume” could imply something other than thevoid volume of the medium.
We concur and have revised the text.
296. 2.1.2 Matrix diffusion, Second paragraph, third & fourthsentences: The fractured system described here is the DNAPLsource. Thus, it is confusing to say “When a DNAPL source isdischarging a high mass flux…” Perhaps better stated as: “WhenDNAPL is resident in fractures, the concentration gradient…” Likewise, successful remediation of the source zone could implyremoval of contaminants from both fractures and matrix. I believethe point is that when contaminant concentrations in the fracturesdiminish, contaminants will diffuse out of the matrix and into therelatively clean water in the fractures.
We agree. Based on other comments and a desire to focus onunconsolidated sediments, all discussions on fractured bedrockand matrix diffusion and have been eliminated from thedocument.
297. 2.1.3 Source zone delineation, Third paragraph, secondsentence: Citation should be (EPA, 1992a)
We have deleted the discussion of the “one-percent rule” and nolonger need the citation.
298. 2.2 Changes in DNAPL Zone Resulting from Treatment,Second paragraph: Changes in architecture do not necessarilyimprove efficiencies. It is common to observe decreased removalefficiency as remediation progresses. I know heat-induced soilagitation has been demonstrated in the laboratory, but has it beenconfirmed as an important process in the field? If not, perhaps itshould be stated as a hypothetical (likely) contributor to DNAPLremoval. I suggest rewording the last sentence as follows: “Thedegree of the change in mass flux is in part a function of themagnitude and nature of formation heterogeneity and thedistribution of DNAPL within the formation.”
We concur.
299. 2.2 Redistribution of DNAPL, First paragraph: Mostaggressive treatment technologies mobilize DNAPL to some extent. Some technologies do so by design. The key is to control or capturemobilized DNAPL and substantial attention has been given to thisissue for thermal and flushing technologies. Thus, I believe thefollowing more accurately describes the issue.
“Treatment technologies that modify DNAPL or interfacialproperties or alter the subsurface structure will likely mobilize andredistribute previously immobile DNAPL. This redistribution cancreate a more extensive source zone. Consequently, monitoring andeffective containment of DNAPL during remediation is of paramountimportance. Since the inherent remediation objective is DNAPL massremoval, knowledge of the rate and extent of this redistribution canhelp in the design of subsequent remedial steps.”
We concur and have modified the text.
300. 2.2 Redistribution of DNAPL, Second paragraph, firstsentence: Delete “potentially.”
We concur.

E-24
301. 2.2 Increase in solubility or dissolved phase constituents. Itwould be helpful to list citations to support the statement thatelevated dissolved concentrations often accompany DNAPLtreatment. Does this refer to concentrations during or subsequent toaggressive treatment. The implication is that these elevatedconcentrations occur after treatment. Most field data that I haveseen suggests a reduction in dissolved concentrations upon systemequilibration following aggressive treatment. Although in somecases, there may be short-term increases in groundwaterconcentrations during the equilibration period. Elevatedconcentrations are certainly likely to be seen during application ofthermal, flushing and biostimulation treatments. Also, there issubstantial evidence for enhanced degradation during and followingimplementation of some treatment technologies.
We are referring to increased concentrations during andimmediately after treatment prior to equilibration. The meaninghas been clarified.
302. 2.3 Addressing Rebound, First paragraph: Rebound usuallyrefers to concentration increases with respect to concentrationsmeasured at the completion of remediation. Rebound can besignificant even if concentrations do not return to pre-remediationlevels.
We concur and have revised the text.
303. 2.3 Addressing Rebound, Fourth paragraph: Failure toremediate the DNAPL source is the primary and underlying reasonfor rebound. The other factors listed here are essentially potentialreasons for this failure.
We concur and have clarified the wording.
304. 3.1.3 Performance metrics and criteria, Determining theresponse boundary or control plane: What is meant by“groundwater plume anatomy”? I assume this refers to dimensionsand structure (contaminant distribution) of the plume. Multiplecontrol planes or response boundaries may be required. Would thisinclude measurement of parameters such as contaminant flux ordischarge from which plume properties and changes in theseproperties may be estimated?
Plume anatomy does refer to the plume’s dimensions andcontaminant distribution both vertically and horizontally. Depending on the performance assessment strategy and responseobjective, contaminant mass flux or discharge may be theprimary parameter of interest.
305. 3.2.3 Selecting the pilot study location, Second paragraph,second bullet: It is stated: “The practical pilot test limit is areduction in the range of 95-99%”. What is the basis for this range?
The phrase has been deleted. Section 3.2 has been removed toAppendix C.
306. 3.2.3 Selecting the pilot study location, Second paragraph,third bullet: Replace “Groundwater samples will rebound…” with“Groundwater concentrations will rebound…” The rate of reboundwill be dependent upon hydrodynamic, geochemical, etc properties,and may not be rapid.
We concur and have changed “will rebound” to “mayrebound...”
307. 3.2.3 Selecting the pilot study location, Second paragraph,fourth bullet: If rebound is measured in relation to concentrations atthe termination of remediation (see comments for Section 2.3), soilconcentrations may or may not rebound as contaminatedgroundwater reinvades the treated area. The extent of rebound will
depend on the degree to which sorbed and dissolved concentrationswere altered during remediation and the contaminant concentrationsin the post-treatment groundwater . If post-treatment soilconcentrations are compared to pre-treatment data, this may or maynot be true. For locations from which NAPL was removed, reboundwould be expected to be minimal (in comparison to pre-treatmentconcentrations). However, if compared to pre-treatment samples notcontaining NAPL, rebound could be substantial. Treatment-inducedredistribution of DNAPL could also cause post-treatment soilconcentrations to increase in some regions of the treated zone andinfluence post-sampling results in a manner suggestive of rebound. The bottom line is that it cannot be assumed, a priori, that soilconcentrations do not demonstrate rebound, however significantrebound of soil concentrations is less likely.
We concur. The text has been revised accordingly. Section 3.2has been removed to Appendix C.
308. 3.2.4 Addressing scale-up issues, Second paragraph: It maynot always be possible to definitely answer all of these questions witha pilot study but it should be a goal. Better stated as: “Informationessential for the design that should be collected during the pilot studyincludes:”
We have made the suggested change.
309. 3.2.5 Assessing costs, First paragraph: Does this refer tocomparisons between sites or between technologies at a given site? There are other factors that complicate comparisons, such asstratigraphy, DNAPL composition and architecture. Also, it is verydifficult to get accurate estimates of initial DNAPL mass.
We are referring to estimating the full-scale cost of varioustechnologies that are being piloted at a given site, so siteconditions (stratigraphy, etc.) should not be a complicatingfactor.
310. 3.2.5 Assessing costs, Second paragraph: What is meant by“total restoration costs”. If the remedial goal is less than totalrestoration, would costs to achieve remedial objectives be the basisfor comparison?
Yes, we mean costs to achieve whatever RAOs have beenestablished for the project, not necessarily total restoration costs.
311. 3.2.5 Assessing costs, Third paragraph, first bullet: “prolonged treatment times” can imply longer than anticipated. Ibelieve what is intended here is better stated as “The pilot studyshould be used to determine the source reduction technologyduration and the potential costs for treatment times, as estimatedfrom the pilot demonstration.”
We concur and have made the changes.
312. 3.2.5 Assessing costs, Third paragraph, third bullet: There arepotential scenarios in which some DNAPL-contaminated zones maybe contributing very little to the total mass flux and may not need tobe remediated to achieve remedial objectives.
We concur and have revised the text.
313. 3.2.5 Assessing costs, Third paragraph, fourth bullet: Post-treatment DNAPL mass estimates are difficult and/or expensiveto get. It may be sufficient to know post-treatment fluxes orgroundwater concentrations.
We have deleted the first sentence and have reworded the second.

E-25
314. 3.3 Statistical Approach to Evaluating Performance, Secondparagraph: I did not find some of the cited EPA reports in theReference Section. Also, the CRC citation is not in Section 7.
We have moved the entire section on statistics to Appendix D. The appendix has its own reference section.
315. 3.4.2 Sampling design, Second paragraph: What aboutflux-based goals?
The goals listed are only examples, but we have added “reductionin mass discharge” as a possible goal.
316. 3.4.2 Sampling design, Selecting sample size: What are theassumptions on which this equation is based? For example, does itassume randomly distributed DNAPL? What constitutes an“attempt”. Does an attempt represent a discrete point. What if alarger volume sample (volume-integrated sample) is taken?
This equation assumes randomly distributed DNAPL. An“attempt” is a random, discrete point measurement.
317. 3.4.3 Geostatistical estimation techniques, Third paragraph: Should “…modeling variation in modeling complex systems” be“…modeling variability in complex systems”? Also, Milliken andJohnson (2001) and Lettell et al., 1996 are not in Reference Section.
We have made the changes you suggest.
318. 3.4.6 Integrated physical-geostatistical methods, Firstparagraph: “methods described above” – what methods are these?
The statistical methods described previously are those covered inthe preceding subsections under data analysis procedures,geostatistical estimation techniques, trend analysis, etc.
319. 3.4.6 Integrated physical-geostatistical methods, Firstparagraph: Change “4)…(to reduce uncertainty and to reduceuncertainty in the estimate…” to “4)…(to reduce uncertainty in theestimate…”.
We concur.
320. 3.4.6 Integrated physical-geostatistical methods, Secondparagraph: The statistical methods are in Table 3-2, not Table 3-1.
We have revised the table numbering. The discussion onstatistics has been removed to Appendix D.
321. 3.5.1 Setting data quality objectives, Third paragraph: Notsure I agree with this generalization. Probably depends on dataapplication.
We agree that use of the term “high-quality data” may not beappropriate here. However, we do feel that the tolerance forerror can be set higher when sampling in areas known to containDNAPLs.
322. 4.0 Quantifying Performance with Field Metrics, Table 4-1: The relative accuracy of extracted source mass is reported as low inthis table, extracted mass can be determined with relatively highaccuracy. What cannot be estimated accurately is the fraction of theoriginal mass that is removed, but this is due to difficulty indetermining the original mass.
Conversely, the accuracy with which source mass remaining can bedetermined with PITTs is shown as intermediate to high. I suggestthat, the accuracy would likely be intermediate. If the remainingNAPL is relatively inaccessible (hydraulically), if NAPL saturation islow or if the NAPL is non-uniformly distributed, accuracy is likely to
be low. The primary issue is often adequate resolution of thebreakthrough, but other factors such tracer degradation orretardation by residual remedial agent can be important as well.
We concur. The table has been reorganized to clarify.
323. 4.2.1 Decrease in soil concentration, Limitations, Fourthparagraph, second sentence: False positives are much less likelythan false negatives. In the absence of analytical problems, theprimary reason for false positives would be inadequate informationabout DNAPL composition, soil organic carbon content or thepartitioning behavior of the DNAPL constituents with the soil.
We agree that false negatives are more common than falsepositives. The text has been revised to mention some of thereasons for obtaining false positives and negatives.
324. 4.2.1 Decrease in soil concentration, Limitations, Fourthparagraph, third sentence: Setting upper limits are difficult notbecause chemical and soil properties must be considered, butbecause these properties are difficult to obtain.
We concur and the text has been revised.
325. 4.2.2 Decrease in dissolved concentration, Purgingconsiderations, First paragraph, third sentence: I assume theisolated and stagnant water is in the well bore. Restate as: “However, water in the well bore above the screened section isrelatively isolated and becomes stagnant.”
The text has been revised as you suggest.
326. 4.2.2 Decrease in dissolved concentration, Monitoring wellnetwork design and installation, First paragraph: A single transectof wells parallel to flow will likely not be adequate to determineimpact of remediation on groundwater concentration. Problems andlimitations are similar to those for core samples. Cross-gradientwell locations or transects are likely to be needed.
We agree; however the need for cross-gradient well locations isalready addressed.
327. 4.2.2 Decrease in dissolved concentration, Monitoring wellnetwork design and installation, Second paragraph: Lateralspreading is not limited to flat groundwater gradients. Spreading asa result of diffusion will be more significant under low flowconditions, but this spreading is often small relative to that resultingfrom hydrodynamic variability. The post-treatment monitoring timeexamples (2, 4, 8 weeks) are unlikely to be sufficient for the system tore-equilibrate. System re-equilibration is dependent upon severalfactors but may require months to years in many cases.
We concur and have revised the text accordingly.
328. 4.2.2 Decrease in dissolved concentration, Multi-levelsampling, Fourth paragraph, third sentence: The use of multi-levelsamplers to estimate flux is not dependent upon poorly distributedmonitoring wells – reword to clarify. Also, it is important to notethat contaminant flux estimates require knowledge of bothcontaminant concentrations and groundwater flux.
The word “poorly” has been changed to “properly.” The needfor groundwater flux information has been added.
329. 4.2.2 Decrease in dissolved concentration, Use of passivediffusion bag (PDB) samplers, Third paragraph, fourth bullet: Idon’t understand this bullet.
The bullet has been deleted.

E-26
330. 4.2.2 Decrease in dissolved concentration, Limitations, Thirdparagraph, third sentence: Suggest revising as follows: “Depending on the degree of heterogeneity, groundwater flow ratesand size of the treated area, it may take years …”
We have made the suggested change.
331. 4.2.2 Decrease in dissolved concentration, Limitations, Thirdparagraph, last sentence: Groundwater concentrations in down-gradient wells could be higher prior to equilibration due to waterpassing through a more highly contaminated source zone or perhapsthe presence of residual remedial agents that enhance solubility.
We concur and have added the potential for observing increasedconcentrations as another limitation.
332. 4.3.3 Mass remaining, Estimating mass remaining, Firstparagraph, last sentence & Box 4-3: Box 4-3 presents an example ofmass estimates from core samples, but it does not illustrate ordescribe how soil core data can be used to estimate contaminantmass.
Box 4-3 and the last sentence of the first paragraph have beendeleted.
333. 4.3.3 Mass remaining, Estimating mass remaining, Thirdparagraph: This discussion of tracer tests would be strengthened byadding information about the benefits and limitations of PITTs aswell as information about field applications and assessments. Forexample see Brooks et al. Journal Contam. Hydrology 59:187-210.
The limitations of tracer tests are described under Limitations. The intent here is to make the readers aware of the massestimation technique and provide references for furtherinformation. We will consider including the Brooks et al.reference.
334. 4.4.1 Decrease in DNAPL toxicity, First paragraph, lastsentence: The issue of mass flux and associated risk is perhaps asimportant as (if not more so) toxicity. Concentrations and massfluxes of low solubility components will be lower.
We do not think that mention of mass flux is appropriate here.
335. 4.4.2 Decrease in DNAPL mobility, Measuring NAPLsaturation: The organization of this section implies that NAPLsaturation can be used to estimate NAPL mobility. If so, what is thecorrelation between saturation and mobility? Also, saturation maybe a more direct measure of remedial effectiveness but itsdetermination is subject to same limitations as mass estimates fromwhich it is derived.
We have added qualifying language to that effect.
336. Laboratory analysis of soil samples, Second paragraph: Theprocedure described here needs more detail.
We do not concur. The procedures are described in detail in thereferences.
337. Third paragraph: Jackson and Mariner, 1995 not in ReferenceSection.
These references have been included.
338. 4.4.3 Decrease in source mass flux, Third paragraph, secondsentence: In fact, mass discharge is the primary or correct measureof source strength (as defined earlier in this section). Flux is ameasure of loading over a specific area.
We have reorganized Section 4.4.3 and made revisions toimprove consistency.
339. Figure 4-2: Labels on large arrows should be changed from“Contaminant Flux” to “Contaminant Discharge”.
We have changed the label to read “Source Strength.”
340. Measuring mass flux, Fifth paragraph: Schwarz et al., 1998not in Reference section.
We have added Schwarz et al. to the references.
341. 4.5 Summary of Performance Metrics Results From a RecentSurvey, Fifth paragraph: Is there confidence that these sites wereindeed measuring mass flux? This has not been a commonlymeasured metric and it is very surprising that 57% of the sitesreported doing so.
Section 4.5 has been deleted and the information moved to Box 4-1. We agree that the concept of measuring mass flux is notcommon, but we refer the reader to the report to make their ownconclusions regarding its accuracy.
342. 5.0 SUGGESTED TECHNOLOGY-SPECIFIC MONITORINGTOOLS: The focus of this section is on technology descriptions andto a lesser extent monitoring parameters and needs for specifictechnologies. Tools should be deleted from section title.
We concur and have changed the title to “Technology-SpecificMonitoring Considerations.”
343. 5.1 Remedial Effectiveness vs. System Efficiency: The twotypes of performance monitoring are discussed briefly in Section 1.3,but the concepts are not adequately developed nor are they used inthis section (Section 5.0). This section should be expanded andbetter developed or deleted.
We have expanded Section 5.1.
344. Effectiveness monitoring: This discussion focuses ongeochemical and process monitoring which more appropriately fallunder efficiency monitoring.
See response to previous comment.
345. 5.2 Conventional Source Zone Remedies: This section isintroduced with “Although not innovative, we include theseconventional source zone technologies to allow a comparison ofperformance monitoring tools.” Only one sentence in the sectiondeals with performance monitoring. It is essentially a description ofconventional source remedial approaches. Comparison ofperformance monitoring is not possible with the informationpresented.
We have provided references to EPA and USACE guidance onassessing performance.
346. 5.3 Thermally Enhanced Remediation: Apparently subsection5.3.1 (Technology description?) is missing.
We describe the three main types of thermal technologies underSections 5.3.2 through 5.3.4. Section 5.3.1 consists ofintroductory material on the benefits of heat.
347. 5.3.6 Key monitoring parameters, Dissolved concentration: The sentence beginning with “Box 5-1” is incomplete. Also, Box 5-1is missing.
We have corrected these errors.

E-27
348. 5.4 Surfactant/Cosolvent Flushing: To be consistent with theprevious section, a subsection discussing enhanced in-situdegradation should be added. There is both lab and field data thatsuggests surfactants and cosolvents enhance in-situ degradation(Mravik et al., 2003 and Abriola et al., ?).
The discussion of thermally mediated increases in biodegradationrates has been removed from Section 5.3, therefore they shouldno longer be inconsistent.
349. 5.4.1 Technology description, First paragraph, seventhsentence: Suggest revising sentence as follows: “Both chemicalsolutions lower the interfacial tension between DNAPL and theaqueous phase and increase the apparent solubility of DNAPLconstituents.”
We concur.
350. 5.4.2 Key monitoring parameters, Surfactant/cosolventcontaminant analysis, Second sentence: The electrolyte issue isprimarily associated with surfactant and is not an issue withcosolvents. Therefore, revise as follows: “In some cases when usingsurfactants as the remedial agent, small fluctuations inelectrolyte…”.
We concur.
351. Fourth sentence: To make applicable to both cosolvent andsurfactant systems, revise as follows: “Thus, it is important tomonitor both remedial agent and contaminant concentrations duringa surfactant or cosolvent flood.”
Comment accepted.
352. Groundwater quality: This discussion is also pertinent tothermal technologies but was not included in that section.
We agree that groundwater quality monitoring is oftenperformed during thermal remediation, however it is notconsidered a key parameter.
353. Injection/extraction flow rate, Last sentence: I do notunderstand this sentence.
We have improved the readability of this sentence.
354. 5.5.1 Technology description, First paragraph: Schnarr et al.,1998 is not in Reference Section.
The sentence containing the reference to Schnarr’s work hasbeen deleted.
355. 5.5.1 Technology description, Groundwater quality, Secondparagraph, fourth & fifth sentences: This issue is pertinent to othertechnologies as well. Solution concentrations associated with sorbedcontaminant are likely to be substantially lower than thoseassociated with DNAPL. Actually, for ISCO, dissolvedconcentrations could be low because of rapid and effective oxidationin the aqueous phase (if unreacted oxidant is present) even thoughsubstantial DNAPL is present. Solution concentrations wouldrebound when oxidant is depleted.
To address this issue, we refer the reader to Section 2.3 of thisdocument and the ITRC ISCO document.
356. 5.6.2 Key monitoring parameters, First paragraph, lastsentence: Time frame for ISB is more likely to be years to decades.
We have replaced the phrase with “several years.”
357. 6.1 Health and Safety: Need to add a section dealing with thehandling of flammable liquids such as alcohols used in cosolventflushing.
We concur and have added text regarding flammable liquids.
358. 6.1 Health and Safety, Second paragraph: Incompletesentences and paragraph.
We have corrected the error.
359. 6.1.1 Sampling hot media, Third sentence: “…this could takefrom 2 weeks to several months or longer.”
We concur.
360. 6.2.1 Predicting plume response: It would be helpful tocitations for the research described in this section.
We have provided a reference to the ESTCP web site.
361. Method 2, Simple Box Model: Aziz et al., 2000 is not inReference Section.
We have added the reference.
362. Method 3, Process-Based Models, First sentence: Replace“Process-type models available are…” with “Available process-typemodels are…”
We concur.
363. 6.3 Regulatory Concerns, Concerns over potential formobilization potential off site migration of DNAPLs: Changesubsection title to: “Concerns over potential mobilization ofDNAPLs”.
Okay.
364. 6.4 Stakeholder/Public Involvement: This section reads as aselection of random, poorly coordinated thoughts.
This section has been edited and revised to make it morereadable.
365. Case Study 1: Composition and grammar of this section needsubstantial improvement.
We have made many grammatical corrections to this case study.
366. Case Study 1, Figures are missing.
We have decided not to use any figures in Case Study 1;references to figures have been deleted.
367. Case Study 1, Groundwater quality monitoring: Where weremonitoring locations? What criteria were used for determiningplume stabilization or shrinkage?
Determining plume stability or extent was a simple matter ofcreating contour plots of dissolved PCE concentrations andobserving trends in these plume maps over time. We realizethere are limitations to this approach. Numerical modelingwould certainly be beneficial in predicting plume stability. Groundwater monitoring locations were not provided; pleasecontact the project manager listed.

E-28
368. Case Study 1, Soil vapor monitoring, First sentence: Replace“…demonstrate that Soil Vapor was no longer present in thesubsurface…” with “…demonstrate that contaminants were nolonger in the soil vapor…” Also, how were the concentration levelsdetermined below which the dissolved or vapor plumes did notexpand.
We have revised the text. Evaluation of groundwater and vaporquality data is done by assessing trends using plume maps, asdescribed above.
369. Case Study 1, Soil vapor monitoring, Second sentence: replace“soil vapor” with “vapor-phase contaminant.”
We have made the change.
370. Case Study 2, Performance Monitoring and Verification,Seventh paragraph, second sentence (p. B-13): The report states“Only ERH met the performance criterion of 90% mass reduction ofTCE DNAPL established for the tests, although both ISCO and SEEprobably achieved this goal when measurement uncertainties areconsidered.” I don’t understand how consideration of measurementuncertainties would lead to the conclusion that the criterion was met.
We agree that the statement is misleading. The last part of thesentence has been deleted.
371. Case Study 2, Lessons Learned, ERH, fourth bullet: This bulletis unclear. I assume this is saying that <50% of the estimatedpre-treatment mass was recovered during remediation.
There was greater than 90% removal from the ERH plot basedon a comparison of pre- and post-treatment mass estimates. Thepoint being made is that not all of the mass removed from theERH plot was accounted for in the calculated mass recovered inthe form of vapor, dissolved, and NAPL phases. The sentencehas been revised to state that “... less than 50% of the TCE massassumed to have been removed from the source zone was actuallycaptured by the aboveground recovery systems.”
372. Case Study 3, Performance Monitoring and Verification, Soil:Were precautions taken to prevent contaminant losses from hotsamples?
Hot sampling techniques were employed to minimizecontaminant loss. Methods have been added to the case study.
373. Case Study 3, Performance Monitoring and Verification,Groundwater: What were subsurface temperatures during 4-, 12-and 24-week sampling events? Why was it assumed that 24 weekswas sufficient to assess rebound?
A cool-down phase of operations was conducted followingcompletion of active heating. Subsurface temperatures werebelow 100°C at all temperature monitoring locations followingcool-down before confirmatory sampling began. Groundwatertemperature was not measured during the confirmatorysampling events, however. A period of 24 weeks was determinedto be sufficient to assess rebound based on consultation withNAPL remediation specialists, literature searches, etc. Additionally, the subcontract was performance-based, meaningthat the contaminant concentrations in the subsurface had to bebelow the defined concentration goals, as modified by variousstatistical definitions. If, following the verification sampling at 24week, concentrations exceeded the goals, the subcontractorwould have been required to recommence remediation. Therefore, it was necessary to define a reasonable time frameuntil success could be determined. It was believed that 24 weekswould be a sufficient time period to observe any potentialrebound.
374. Case Study 3, Performance Monitoring and Verification,Operational: Were data available to estimate total contaminantremoval? If so, how did it compare to initial mass?
The table below lists the estimated contaminant mass before andafter NAPL remediation.
375. Case Study 4, Background: A site map would be helpful.
Thanks for the suggestion, but to be consistent, we have notprovided site maps.
376. Case Study 4, Remediation Results: How were groundwaterand soil samples collected? How were losses of VOCs from hotsamples minimized? Was the system allowed to equilibrate beforepost-remediation sample collection?
Sampling procedures are described under “ERH SystemOperations.” To clarify that these procedures apply toperformance monitoring, we have moved the paragraphs to the“Performance Monitoring and Verification” section.
377. Case Study 5, Technology Performance: Was reboundevaluated? Is cost information available?
Rebound was not evaluated due to monitoring andcharacterization data limitations. Cost information was notavailable.
378. Case Study 6, Performance Monitoring and Verification,Second paragraph: How was it determined that 98% of thechlorinated hydrocarbons were destroyed?
The percent reduction refers to a reduction in mean dissolvedconcentrations. The text has been changed.
379. Case Study 7, Performance Monitoring and Verification, Lastparagraph: What were KMnO4 concentrations during thepost-treatment sampling events? Also, add references for this study.
This case study is based on a paper submitted by Dr. Beth Parkerto the 2002 Battelle Conference. References have been added.
380. Case Study 8, Add references for this study.
This case study was written by the project manager from NorthWind, Inc. based on data that has not been published. Thereference has been added.
381. Case Study 8, Performance Objectives, Second paragraph, lastsentence: What is the residual saturation at which naturalattenuation processes will “address” the residual groundwaterconcentrations? How is this saturation determined or estimated?
The NAPL saturation has not been measured at this site and willnot be used as a performance metric due to the difficult andcomplex hydrogeology. Groundwater concentrations constitutethe performance metric that will be used to determine when ISBoperations can be terminated. Operations will continue untilMCLs are achieved for all VOCs and ethene production hasceased in the existing monitoring wells. Once ISB operations areterminated, continued monitoring will be conducted for anadditional period of time to verify that concentrations do notrebound above unacceptable levels. This concentrationthreshold, which essentially represents the contamination levelbelow which attenuation processes will address contamination,has not yet been defined.
382. Case Studies – General: I suggest adding a case study forin-situ flushing. The Sages site has several years of monitoring data

E-29
following cosolvent flooding. These data show substantialenhancement in post-treatment degradation. Primary contacts forinformation would be Susan Mravik with EPA or Mike Annable atthe University of Florida.
We would welcome your help in pulling together the project teamto generate this case study. Perhaps we can add a case study at alater date.

APPENDIX F
DNAPLs Team Contacts, ITRC Fact Sheet, and Product List

F-1
Appendix F. DNAPLs Team Contacts, ITRC Fact Sheet, and Product List
Eric Hausamann (Team Leader)New York State [email protected]
Naji AkladissMaine [email protected]
Ralph BakerTerra [email protected]
Dave BeckerU.S. Army [email protected]
James BernardVirginia [email protected]
Douglas BradfordLouisiana [email protected]
Anne CallisonLowry AFB [email protected]
Wilson ClaytonAquifer Solutions, [email protected]
Eliot [email protected]
William DavisTri-Corders Environmental, [email protected]
Tom EarlyOak Ridge National [email protected]
Linda FiedlerU.S. [email protected]
David FlemingThermal Remediation [email protected]
Harch GillBNP [email protected]
Laurie HainesU.S. Army Environmental [email protected]
George HallHall [email protected]
Mark HasegawaHasegawa [email protected]
William HeathCurrent Environmental [email protected]
David S. IngleU.S. Department of [email protected]
Mark KlugerDajak, [email protected]

F-2
Konstantinos KostarelosPolytechnic [email protected]
John [email protected]
Mark MercerU.S. [email protected]
Beth MooreU.S. Department of [email protected]
Ian T. OsgerbyU.S. Army [email protected]
Jean PaquinSanexen Environmental [email protected]
Robert PierceGeorgia [email protected]
Suresh PuppalaPMK [email protected]
Marta RichardsU.S. [email protected]
Supalak RogersTexas [email protected]
Larry SchmaltzA2L Technologies, [email protected]
Steve [email protected]
Michael SmithVermont Dept. of Environmental [email protected]
Marvin UngerSERDP/ESTCP (c/o The RETEC Group,Inc.)[email protected]
Jim UsseryGeorgia [email protected]
Julie WestHoffPrairie Environmental, [email protected]
Ryan WymoreNorth Wind [email protected]
Laura YehNaval Facilities Engineering [email protected]