strategic modelling and business dynamics sample chapter
TRANSCRIPT

FREEeChapter
John D. W. Morecroft
STRATEGIC MODELLING
and BUSINESS DYNAMICS
A feedback systems approach
Second Edition

Insightful modelling of dynamic systems for better business strategyThe business environment is constantly changing and organisations need the ability to rehearse alternative futures. By mimicking the interlocking operations of firms and industries, modelling serves as a ‘dry run’ for testing ideas, anticipating consequences, avoiding strategic pitfalls and improving future performance.
Strategic Modelling and Business Dynamics is an essential guide to credible models; helping you to understand modelling as a creative process for distilling and communicating those factors that drive business success and sustainability. Written by an internationally regarded authority, the book covers all stages of model building, from conceptual to analytical. The book demonstrates a range of in-depth practical examples that vividly illustrate important or puzzling dynamics in firm operations, strategy, public policy, and everyday life.
This updated new edition also offers a rich Learners’ website with models, articles and videos, as well as a separate Instructors’ website resource, with lecture slides and other course materials.
Buy today from your favourite bookshop and online at

Please feel free to post this
sampler on your blog or website, or emailit to anyone looking to better understand
modelling processes! Thank you.
Extracted from Strategic Modelling and Business Dynamics 2e: A feedback systems approach published in 2015 by John Wiley & Sons Ltd, The Atrium, Southern Gate, Chichester, West Sussex,
PO19 8SQ. UK. Phone +44(0)1243 779777
Copyright © 2015 John D. W. Morecroft
All Rights Reserved. No part of this publication may be reproduced, stored in a retrieval system or transmitted in any form or by any means, electronic, mechanical, photocopying, recording, scanning or otherwise, except under the terms of the Copyright, Designs and Patents Act 1988 or under the terms of a licence issued by the Copyright
Licensing Agency, 90 Tottenham Court Road, London, W1T 4LP, UK, without the permission in writing of the Publisher. Requests to the Publisher should be addressed to the Permissions Department, John Wiley & Sons Ltd,
The Atrium, Southern Gate, Chichester, West Sussex, PO19 8SQ, England, or emailed to [email protected].
2

JWBK754-fm JWBK754-Morecroft Printer: April 22, 2015 13:56 Printer Name: Trim: 246mm × 189mm
Contents
About the Author xix
Foreword by Peter Checkland xxi
Preface to the Second Edition xxiii
Preface from the First Edition xxvii
How to Use This Book xxxvii
Chapter 1 The Appeal and Power of Strategic Modelling 1Introduction 1A New Approach to Modelling 5The Puzzling Dynamics of International Fisheries 7Model of a Natural Fishery 10Simulated Dynamics of a Natural Fishery 12
Operating a Simple Harvested Fishery 13Harvesting in Bonavista, Newfoundland – A ThoughtExperiment 15
A Start on Analysing Dynamics and Performance Through Time 17Saving Bonavista – Using Simulation to Devise a SustainableFishery 20
Dynamic Complexity and Performance Through Time 20Cunning Fish – A Scenario with Reduced Dynamic Complexity 23
Preview of the Book and Topics Covered 25Appendix – Archive Materials from World Dynamics 27References 28
Chapter 2 Introduction to Feedback Systems Thinking 31Ways of Interpreting Situations in Business and Society 31Event-oriented Thinking 32Feedback Systems Thinking – An Illustration 34A Shift of Mind 37The Invisibility of Feedback 38
A Start on Causal Loop Diagrams 39Structure and Behaviour Through Time – Feedback Loops and the
Dynamics of a Slow-to-Respond Shower 41Processes in a Shower ‘System’ 44Simulation of a Shower and the Dynamics of Balancing Loops 45
From Events to Dynamics and Feedback – Drug-related Crime 47A Feedback View 48Scope and Boundary of Factors in Drug-related Crime 50An Aside – More Practice with Link Polarity and Loop Types 51
Purpose of Causal Loop Diagrams – A Summary 52Feedback Structure and Dynamics of a Technology-based Growth
Business 52

JWBK754-fm JWBK754-Morecroft Printer: April 22, 2015 13:56 Printer Name: Trim: 246mm × 189mm
xii � Contents
Causal Loop Diagrams – Basic Tips 55Picking and Naming Variables 55Meaning of Arrows and Link Polarity 56Drawing, Identifying and Naming Feedback Loops 57
Causal Loop Diagram of Psychological Pressures and UnintendedHaste in a Troubled Internet Start-Up 58
References 61
Chapter 3 Modelling Dynamic Systems 63Asset Stock Accumulation 63Accumulating a ‘Stock’ of Faculty at Greenfield University 65Asset Stocks in a Real Organisation – BBC World Service 69
The Coordinating Network 70Modelling Symbols in Use: A Closer Look at Drug-related Crime 72Equation Formulations 75Drug-related Crime 76Funds Required to Satisfy Addiction 77Street Price and Price Change 78Allocation of Police 79
Experiments with the Model of Drug-related Crime 80A Tour of the Model 80Escalating Crime – The Base Case 82Drilling Down to the Equations 84Anomalous Behaviour Over Time and Model Boundary 86
Benefits of Model Building and Simulation 89References 90
Chapter 4 World of Showers 91Getting Started 91Taking a Shower in World of Showers A 92Taking a Shower in World of Showers B 95
Redesigning Your World of Showers 96Reflections on the World of Showers 98Metaphorical Shower Worlds in GlaxoSmithKline, IBM andHarley-Davidson 100
Inside World of Showers 102A Tour of Formulations in the Comfort-seeking Loop of theHidden Shower 102
Interdependence of Showers – Coupling Formulations 105Simulations of World of Showers B 105References 107
Chapter 5 Cyclical Dynamics and the Process of Model Building 109An Overview of the Modelling Process 109Dynamic Hypothesis and Fundamental Modes of DynamicBehaviour 111
Team Model Building 112Employment and Production Instability – Puzzling Performance
Over Time 117Dialogue About Production Control 120Thought Experiment: a Surprise Demand Increase in an IdealFactory 122

JWBK754-fm JWBK754-Morecroft Printer: April 22, 2015 13:56 Printer Name: Trim: 246mm × 189mm
Contents � xiii
Equation Formulations and Computations in Production Control 124Forecasting Shipments – Standard Formulations forInformation Smoothing 126
Inventory Control – Standard Formulations for Asset StockAdjustment 127
Desired Production 128The Computations Behind Simulation 129
Modelling Workforce Management and Factory ProductionDynamics 133Dialogue About Workforce Management 133Operating Constraint Linking Workforce to Production 135Simulation of the Complete Model: A Surprise Demand Increasein a Factory Where Production is Constrained by the Size ofthe Workforce 136
Pause for Reflection 140Equation Formulations in Workforce Management 140Departure Rate – Standard Formulation for Stock Depletion 141Hiring – Standard Formulations for Asset Stock Replacementand Adjustment 142
Workforce Planning 144Chronic Cyclicality in Employment and Production and How to
Cure It 145The Curious Effect of Random Variations in Demand 145Industry Cyclicality and Business Cycles 147Policy Formulation and What-ifs to Improve FactoryPerformance 148
Modelling for Learning and Soft Systems 152A Second Pause for Reflection: System Dynamics and SoftSystems 153
A Link to Soft Systems Methodology 156Alternative Views of a Radio Broadcaster 159
Appendix 1: Model Communication and Policy Structure Diagrams 162Appendix 2: The Dynamics of Information Smoothing 164References 166
Chapter 6 The Dynamics of Growth from Diffusion 169Stocks and Flows in New Product Adoption – A Conceptual
Diffusion Model 171The Bass Model – An Elegant Special Case of a Diffusion Model 172The Dynamics of Product Adoption by Word-of-mouth 175The Need to Kick-start Adoption 177The Complete Bass Diffusion Model With Advertising 177The Dynamics of Product Adoption by Word-of-mouth andAdvertising 179
A Variation on the Diffusion Model: The Rise of Low-cost AirTravel in Europe 182easyJet – A Bright Idea, But Will it Work? 182Visualising the Business: Winning Customers in a New Segment 183Visualising Retaliation and Rivalry 186Feedback Loops in the easyJet Model 188

JWBK754-fm JWBK754-Morecroft Printer: April 22, 2015 13:56 Printer Name: Trim: 246mm × 189mm
xiv � Contents
Strategy and Simulation of Growth Scenarios 189Using the Fliers Simulator to Create Your Own Scenarios 193Simulation, Predictions and Scenarios 194
Conclusion 194Appendix: More About the Fliers Model 195Back to the Future – From easyJet to People Express and Beyond 197
References 199
Chapter 7 Managing Business Growth 201A Conceptual Model of Market Growth and Capital Investment 203Background to the Case 203Adopting a Feedback View 204
Formulation Guidelines for Portraying Feedback Structure 206Review of Operating Policies and Information Flows in theMarket Growth Model 209
Customer Ordering 209Sales Force Expansion 210Budgeting 211Capital Investment 212Goal Formation 214
An Information Feedback View of Management and Policy 215Information Available to Decision Makers and BoundedRationality 217
Nature of Decision Making and the Decision Process 220Policy Structure and Formulations for Sales Growth 222Sales Force Hiring – Standard Stock Adjustment Formulation 223Sales Force Budgeting – Revenue Allocation and InformationSmoothing 223
Order Fulfilment – Standard Stock Depletion Formulation 225Customer Ordering 226
Policy Structure and Formulations for Limits to Sales Growth 226Customer Response to Delivery Delay – Non-linear GraphicalConverter 228
Customers’ Perception of Delivery Delay – InformationSmoothing 229
Order Fulfilment and Capacity Utilisation 229Policy Structure and Formulations for Capital Investment 231Assessment of Delivery Delay 232Goal Formation – Weighted Average of Adaptive and StaticGoals 232
Capacity Expansion – Fractional Asset Stock Adjustment 233Production Capacity – Two-Stage Stock Accumulation 236
Simulation Experiments 237Simulation of Sales Growth Loop 238Strength of Reinforcing Loop 241Simulation of Sales Growth and Customer Response Loops 242Simulation of the Complete Model with all Three Loops Active –The Base Case 246
Redesign of the Investment Policy 250Top Management Optimism in Capital Investment 251High and Unyielding Standards – A Fixed Operating Goal forDelivery Delay 253

JWBK754-fm JWBK754-Morecroft Printer: April 22, 2015 13:56 Printer Name: Trim: 246mm × 189mm
Contents � xv
Policy Design, Growth and Dynamic Complexity 256Conclusion 257Overview of Policy Structure 257Growth and Underinvestment at People Express? 261More Examples of Growth Strategies that Failed or Faltered –and One that Succeeded 262
Growth Strategy for New Products and Services in a CompetitiveIndustry 264
Appendix – Gain of a Reinforcing Loop 266References 268
Chapter 8 Industry Dynamics – Oil Price and the Global Oil Producers 271Problem Articulation – Puzzling Dynamics of Oil Price 272Towards a Dynamic Hypothesis 274
Model Development Process 275A Closer Look at the Stakeholders and Their Investment
Decision Making 278Investment by the Independent Producers 279Development Costs 280Policy Structure and Formulations for Upstream Investment –Fractional Asset Stock Adjustment 282
Oil Price and Demand 284The Swing Producer 286Quota Setting 288The Opportunists 290The Rise of Russian Oil – Incorporating Unforeseen PoliticalChange 291
The Shale Gale – Incorporating Unforeseen TechnologicalChange 292
Connecting the Pieces – A Feedback Systems View 294Two Invisible Hands and More 295The Visible Hand of OPEC 297Webs of Intrigue – Inside OPEC’s Opulent Bargaining Rooms 297
A Simple Thought Experiment: Green Mindset and GlobalRecession 300
Using the Model to Generate Scenarios 301Archive Scenario 1: 10-Year Supply Squeeze Followed by SupplyGlut 301
Archive Scenario 2: Quota Busting in a Green World 306Scenario from the Mid-1990s to 2020: Asian Boom with QuotaBusting, Cautious Upstream Investment and Russian Oil 309
A High Price Scenario from the Mid-1990s to 2020: How to PushOil Price Over $60 per Barrel 314
A 2010–2034 Scenario: Subdued Global Oil Economy with ShaleGale and OPEC Supply Boost 317
Modified 2010–2034 Scenario: Subdued Global Oil Economywith Shale Gale and Punitive Saudi Supply Control 322
2010–2034 Thought Experiment: Subdued Global Oil Economywith a Shale Gale and Mooted US Supply Control – The ‘SaudiAmerica’ Hypothesis 324
Devising New Scenarios 327Effect of Global Economy and Environment on Demand 327

JWBK754-fm JWBK754-Morecroft Printer: April 22, 2015 13:56 Printer Name: Trim: 246mm × 189mm
xvi � Contents
Cartel Quota Bias 327Opportunists’ Capacity Bias 328Oil Price Bias 328Capex Optimism 328Time to Build Trust in Russia (in Oil World 1995 and 2010) 329
Endnote: A Brief History of the Oil Producers’ Project 329References 331
Chapter 9 Public Sector Applications of Strategic Modelling 333Urban Dynamics – Growth and Stagnation in Cities 334Urban Model Conceptualisation 335
Medical Workforce Dynamics and Patient Care 340Background 341Medical Workforce Planning Model 342Quality of Patient Care 346Base Run – Changing Composition of the Medical Workforce 348Base Run – Quality of Patient Care 350Intangible Effects of the European Working Time Directive 351Modelling Junior Doctor Morale 351Overview of the Complete Model 353The Formulation of Work–life Balance and Flexibility 354Simulations of the Complete Model 355Conclusions from the Medical Workforce Study 359
Fishery Dynamics and Regulatory Policy 361Fisheries Management 361A Simple Harvested Fishery – Balancing Catch and FishRegeneration 363
A Harvested Fishery with Endogenous Investment – Coping witha Tipping Point 366
Simulated Dynamics of a Harvested Fishery with EndogenousInvestment 369
Control and Regulation – Policy Design for Sustainable Fisheries 371Formulation of Deployment Policy 373Stock and Flow Equations for Ships at Sea, Ships in Harbourand Scrap Rate 375
Simulated Dynamics of a Regulated Fishery – the Base Case 375Policy Design – A Higher Benchmark for Fish Density 379Dynamics of a Weakly Regulated Fishery 381Policy Design – Lower Exit Barriers Through Quicker Scrappingof Idle Ships 383
Sustainability, Regulation and Self-Restraint 387Conclusion 387Appendix – Alternative Simulation Approaches 388From Urban Dynamics to SimCity 389Discrete-event Simulation and System Dynamics 390Conclusions on Alternative Approaches to Simulation Modelling 396
References 398
Chapter 10 Model Validity, Mental Models and Learning 403Mental Models, Transitional Objects and Formal Models 404Models of Business and Social Systems 406Tests for Building Confidence in Models 407

JWBK754-fm JWBK754-Morecroft Printer: April 22, 2015 13:56 Printer Name: Trim: 246mm × 189mm
Contents � xvii
Model Confidence Building Tests in Action: A Case Study inFast-moving Consumer Goods 410Soap Market Overview 410The Modelling Project 411
Model Structure Tests and the Soap Industry Model 412Boundary Adequacy and Structure Verification Tests Applied toa Simple Soap Model 413
A Refined View of the Market 416Boundary Adequacy and Sector Map of the Complete SoapIndustry Model 417
Managerial Decision-making Processes in the Old English BarSoap Company 419
Managerial Decision-making Processes in Global Personal Care 420Managerial Decision-making Processes in Supermarkets 421
Equation Formulation Tests and the Soap Industry Model 422Substitution of Bar Soap by Shower Gel 423Brand Switching Between Competing Bar Soap Products 424Model Behaviour Tests and Fit to Data 428Tests of Fit on Simulations of the Soap Industry Model – TheBase Case 432
Tests of Learning from Simulation 436Comparing Simulations with Expectations and InterpretingSurprise Behaviour 436
Partial Model Simulations to Examine Pet Theories andMisconceptions 437
Family Member Tests 438Policy Implication Tests 439Understanding Competitive Dynamics in Fast-moving ConsumerGoods 439
Summary of Confidence Building Tests 441Conclusion – Model Fidelity and Usefulness 444Endnote: The Loops of Feedback 447References 449
About the Website Resources 451
Index 453
JWBK754-c01 JWBK754-Morecroft Printer: April 23, 2015 12:39 Printer Name: Trim: 246mm × 189mm
Chapter 1The Appeal and Power of
Strategic Modelling
� Introduction
� A New Approach to Modelling
� The Puzzling Dynamics of International Fisheries
� Model of a Natural Fishery
� Operating a Simple Harvested Fishery
� Preview of the Book and Topics Covered
� Appendix – Archive Materials from World Dynamics
Introduction1
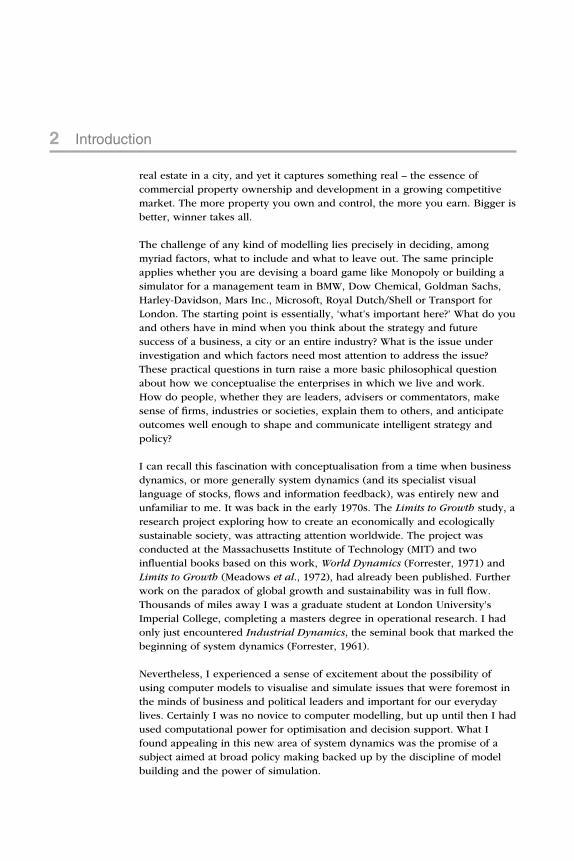
I have always been fascinated by models and games and particularly by modelconceptualisation, the process by which people represent and simplifysituations from the real world to make sense of them. Consider for example,the popular board game of Monopoly. Players find themselves as propertydevelopers in an imaginary city. It could be London or New York, except ofcourse (and this is the curious thing) the board doesn’t look remotely like areal city or even like a geographical map of either city. The game board is justa large square of card on which are printed neatly labelled and coloured boxesdisplaying familiar place names like cheap and cheerful Old Kent Road inbrown, bustling Trafalgar Square in red and elegant Mayfair in dark blue.There are houses and hotels, but no streets. There are stations, but no railwaylines. There is a community chest, but no community of people. There is a jail,but no police department. Players move around the city with a throw of thedice in a curious assortment of vehicles: a boot, a ship, a horse, an iron, acannon and even a top hat. It is a fantasy world, a much simplified view of
1The introduction contains edited extracts from my 2000 paper, ‘Creativity and Convergence inScenario Modelling’.
1
JWBK754-c01 JWBK754-Morecroft Printer: April 23, 2015 12:39 Printer Name: Trim: 246mm × 189mm
2 Introduction
real estate in a city, and yet it captures something real – the essence ofcommercial property ownership and development in a growing competitivemarket. The more property you own and control, the more you earn. Bigger isbetter, winner takes all.
The challenge of any kind of modelling lies precisely in deciding, amongmyriad factors, what to include and what to leave out. The same principleapplies whether you are devising a board game like Monopoly or building asimulator for a management team in BMW, Dow Chemical, Goldman Sachs,Harley-Davidson, Mars Inc., Microsoft, Royal Dutch/Shell or Transport forLondon. The starting point is essentially, ‘what’s important here?’ What do youand others have in mind when you think about the strategy and futuresuccess of a business, a city or an entire industry? What is the issue underinvestigation and which factors need most attention to address the issue?These practical questions in turn raise a more basic philosophical questionabout how we conceptualise the enterprises in which we live and work.How do people, whether they are leaders, advisers or commentators, makesense of firms, industries or societies, explain them to others, and anticipateoutcomes well enough to shape and communicate intelligent strategy andpolicy?
I can recall this fascination with conceptualisation from a time when businessdynamics, or more generally system dynamics (and its specialist visuallanguage of stocks, flows and information feedback), was entirely new andunfamiliar to me. It was back in the early 1970s. The Limits to Growth study, aresearch project exploring how to create an economically and ecologicallysustainable society, was attracting attention worldwide. The project wasconducted at the Massachusetts Institute of Technology (MIT) and twoinfluential books based on this work, World Dynamics (Forrester, 1971) andLimits to Growth (Meadows et al., 1972), had already been published. Furtherwork on the paradox of global growth and sustainability was in full flow.Thousands of miles away I was a graduate student at London University’sImperial College, completing a masters degree in operational research. I hadonly just encountered Industrial Dynamics, the seminal book that marked thebeginning of system dynamics (Forrester, 1961).
Nevertheless, I experienced a sense of excitement about the possibility ofusing computer models to visualise and simulate issues that were foremost inthe minds of business and political leaders and important for our everydaylives. Certainly I was no novice to computer modelling, but up until then I hadused computational power for optimisation and decision support. What Ifound appealing in this new area of system dynamics was the promise of asubject aimed at broad policy making backed up by the discipline of modelbuilding and the power of simulation.

JWBK754-c01 JWBK754-Morecroft Printer: April 23, 2015 12:39 Printer Name: Trim: 246mm × 189mm
Chapter 1 � The Appeal and Power of Strategic Modelling 3
Imagine you are contemplating the dilemma of fast-growing global populationin a world of finite resources. Today, there are 7 billion of us on the planet.Back in 1850 there were just over one billion. By 2050 there could be as manyas nine billion people. Is it really possible that mankind could outgrow theplanet and overexploit its abundant natural resources to usher in a dark age ofpollution, poverty and suffering? Why might this happen and when? How doyou begin to answer such questions and how do you conceive a ‘globalsystem’ in your mind? I was captivated by a representation in World Dynamicsthat limited itself to only two pages of symbols whose clearly defined purposewas to explore alternative future time paths for global industrial society. It wasa bold sketch on a compact canvas.
DeathRate
Birthrate
Population
Capitaldiscard
Capitalinvestment
Capital
Pollutionabsorption
Pollutiongeneration
Pollution
Naturalresourceusage rate
Natural resources Capital inagriculture
Food ratio
Land area
Figure 1.1 Stock accumulations for global growthSource: Adapted from Forrester (1971, pp. 20–21).
For those who have read World Dynamics, Figure 1.1 will evoke memories ofthe model. However, for most readers who are new to system dynamics youwill glimpse what I saw as a graduate student: strange symbols and familiarphrases which claim to set some sort of boundary on the set of factors thatwill shape the environmental and economic destiny of mankind. I havedeliberately chosen to show a much-simplified diagram that leaves out manyintermediate variables and the complex network of connections, because thatis how I first perceived the model. There are only four stock accumulations(shown as rectangles with inflows and outflows), representing aspects of ourworld, that have grown steadily and relentlessly over many centuries:population, capital, pollution and natural resources (which have declined).This fact alone I found remarkable for its brevity yet common-sense appeal. Tounderstand global limits to growth one surely has to think hard about thedrivers of population (birth rate and death rate, shown as small circles withtiny taps superimposed on arrows); the engines of human economic activity

JWBK754-c01 JWBK754-Morecroft Printer: April 23, 2015 12:39 Printer Name: Trim: 246mm × 189mm
4 Introduction
(capital investment, capital discard and the usage rate of natural resources);and the consequences of human activity on the global environment (theprocesses of pollution generation and absorption).
These factors must co-evolve over time. But what forces or influences makesure they evolve in a balanced way that can satisfy the aspirations and sustainthe living standards of a healthy global population? My picture does not showthe full web of coordinating forces. That is something you will learn to modeland interpret later in the book. For now you just have to imagine there is sucha web operating behind the scenes that determines how, for example, thebirth rate depends on population, capital and pollution, or how capitalinvestment depends on population and natural resources. But can asustainable balance be achieved? Is there a coordinating web that will steerglobal growth within the constraints of finite natural resources, limited landarea, and biological/physical laws (that govern the world’s ecology), while atthe same time meeting the needs of billions of global stakeholders (parentsand families, investors in productive capital, exploiters of natural resources)?
It came as a shock all those years ago to realise there is no nation, nogovernment and no responsible business community that has the power or theinformation to mastermind a global growth engine.2 A coordinating web iscertainly there (reproduced in the Appendix as Figure 1.13), but it is a weakand imperfect invisible hand. In the long run, this invisible hand will achieve aruthless balance of population, resources and human activity. But the timepath to this ultimate balance may involve a catastrophic decline of livingstandards and population or spiralling pollution.
Figure 1.2 compares two (among many) alternative time paths that summarisethe message as I recall it from my early encounter with system dynamics(Randers, 1980). Bear in mind these are rough hand-drawn sketches, notformal simulations. Nevertheless, the century-long timescale on these charts isrepresentative of the time horizon in the original study and left a deepimpression about the ambition of the field to understand the long term bysimulating the interaction of human decisions-and-actions with enduringnatural forces. On the left is a likely scenario. Global carrying capacity(defined as how much human activity the globe can sustain) starts high in theuncrowded world of the 1950s. Human activity starts low. As population andcapital grow, human activity rises steadily and exponentially, approaching the
2The same idea of limited ability to control situations applies to firms in competitive industries and,to some extent, to business units and functional areas inside corporations and firms. Managementteams can devise strategy (the intended strategy), but a whole organisation stands between theirideas and resulting action, so the implemented strategy is often different than intended. The leversof power are only loosely connected to operations.

JWBK754-c01 JWBK754-Morecroft Printer: April 23, 2015 12:39 Printer Name: Trim: 246mm × 189mm
Chapter 1 � The Appeal and Power of Strategic Modelling 5
finite (but unknown) global capacity around the turn of the millennium. Thereis no particularly strong signal to announce that this hidden capacity limit hasbeen reached, nor any coalition of stakeholders with the power to restricthuman activity once the limit is exceeded. So ‘the band plays on’ for another20 years. Collectively, we live beyond the generous but limited means of ourplanet. This overexploitation of resources and the environment leads to asteady erosion of global carrying capacity and a consequent rapid decline inhuman activity. In human terms, this multi-decade period of decline is a darkage of low living standards, high pollution, food shortage, premature deathand economic depression. It is a dramatic story arising from simple yetplausible assumptions about human behaviour and planetary limits.
A better yet feasible scenario
years1950 2050
human activity
years1950 2050
globalcarryingcapacity
human activity
A likely scenario
globalcarryingcapacity
Figure 1.2 Limits to global growth – rough sketches of alternative futures
The story has not really changed in the four decades since it was firstsimulated. But there was always another, much more optimistic story. Thisalternative and sustainable future is sketched on the right of Figure 1.2. Iwon’t say here what differences in the coordinating web can lead to this newoutcome. Instead, I invite you to think about the task of balancing the stockaccumulations in Figure 1.1 in light of what you learn from the book. I alsorefer you to the comprehensive simulations of the Limits to Growth team(Meadows et al., 1972; 2002 and Cerasuolo, 2013) and to two of the originalsimulations from World Dynamics reproduced in the Appendix as Figure 1.14.
A New Approach to Modelling
World Dynamics and Limits to Growth anticipated a new and participativeapproach to modelling and simulation. People’s ability to manage theircomplex world can be improved by visualising and simulating it. Plans andalternative futures become clearer by rehearsing them (O’Brien and Dyson,

JWBK754-c01 JWBK754-Morecroft Printer: April 23, 2015 12:39 Printer Name: Trim: 246mm × 189mm
6 A New Approach to Modelling
2007). Only now is this approach coming to be widely appreciated inbusiness, political and academic circles. During the 1970s, models were stillviewed as instruments for accurate prediction whose validity rested primarilyon short-term predictive power, conformance with established economictheory and goodness-of-fit to historical data. Modelling for learning, of thekind presented in this book and intended to complement people’s mentalmodels, was in its infancy.
The idea of rehearsing alternative futures is fundamental to contemporarystrategic modelling and scenario development. The purpose of models andsimulations is to prepare organisations and individuals for alternative futuresby bringing these futures to life so they are imagined more vividly than wouldotherwise be possible. Moreover, as you will see throughout the book,strategic models not only help people to generate alternative futures for theirfirms and industries, but also to challenge, shape, change and enrich theirinterpretation of a complex world.
An important objective for modellers (and arguably for anyone in a leadershipposition who has to make sense of complex business or social situations,devise strategies and communicate them) is to find a compact ‘shareable’description of how a firm, industry or social system operates. Sooner or later,the creative and divergent thoughts that are present at a very early stage ofenquiry (captured in the phrase ‘there’s a lot going on out there’) must beturned to convergent thoughts that focus group attention on the essence of thesituation at hand (by agreeing, through ruthless pruning, what’s reallyimportant and what can be safely ignored). In business dynamics, this creativeprocess of simplification (known as ‘conceptualisation’) takes shape as apicture of a firm or industry that the modeller agrees with the project team.There are of course guidelines to follow. You begin by identifying so calledstock accumulations and feedback loops, the visual building blocks of systemdynamics models and simulators. Striking the right balance of creativity andconvergence is an essential art of modelling. The parsimonious structure of theWorld Dynamics model is evidence of creativity and disciplined convergencein model conceptualisation. The model’s enduring appeal and power tocommunicate lies partly in its concise yet compelling representation of amassively complex reality.3
3Modelling can be controversial. World Dynamics was and still is a thought-provoking model, apotent catalyst for political debate and an instrument for serious policy making. It was also a focusof learned criticism about the nature and use of modelling and simulation in the social sciences.Quotations from the press and academic literature at the time convey the impact, both positive andnegative, of the model on opinion leaders: ‘This is likely to be one of the most important documentsof our age…’, New York Times; ‘There are too many assumptions that are not founded, and thereis too high a level of aggregation in the model’, Science; ‘This year will not see the publication of amore important book than Forrester’s World Dynamics, or a book more certain to arouse dislike’,Fortune; ‘This is a piece of irresponsible nonsense, a publicity stunt… extremely simplistic, given the

JWBK754-c01 JWBK754-Morecroft Printer: April 23, 2015 12:39 Printer Name: Trim: 246mm × 189mm
Chapter 1 � The Appeal and Power of Strategic Modelling 7
The Puzzling Dynamics of InternationalFisheries
By now I hope your curiosity about modelling is stirred, but before probingthe basic concepts and tools used by system dynamics modellers, I want toshow you a model, a small model, designed to address an importantcontemporary issue facing society. I will explain its main assumptions,demonstrate some simulations and then give you the opportunity to run thesimulator for yourself.
The topic is fisheries. The problems of overexploitation facing internationalfisheries are well known, widely reported in the press and a subject ofgovernment policy in many nations. The performance of international fisheriesis indeed puzzling. Fish naturally regenerate. They are a renewable resource,in apparently endless supply, providing valuable and healthy food for billionsof consumers and a livelihood for hundreds of thousands of fishingcommunities worldwide. The fishing industry has been in existence since thedawn of civilisation and should last forever. Yet fish stocks around the worldare volatile and some are even collapsing. Once rich fishing grounds such asCanada’s Grand Banks now yield no catch at all. Stocks in other areas, such asthe English Channel, the North Sea and the Baltic, are in terminal decline.
The issue is powerfully expressed by environmental journalist Charles Clover(2004) in his acclaimed book The End of the Line. Here is an excerpt fromChapter 1:
Fish were once seen as renewable resources, creatures that would replenishtheir stocks forever for our benefit. But around the world there is evidencethat numerous types of fish, such as the northern cod, North Sea mackerel,the marbled rock cod of Antarctica and, to a great extent, the west Atlanticbluefin tuna, have been fished out, like the great whales before them, and arenot recovering…The perception-changing moment for the oceans has arrived.It comes from the realisation that in a single human lifetime we have inflicteda crisis on the oceans greater than any yet caused by pollution. That crisiscompares with the destruction of the mammoths, bison and whales, the rape ofrainforests and the pursuit of bushmeat. It is caused by overfishing.
(from The End of the Line by Charles Clover, published by Ebury. Reprinted bypermission of The Random House Group Ltd and Charles Clover.)
current state of knowledge in the social sciences’, economists from Yale. Notice the sharp divisionof opinion on the scope, size, adequacy and usefulness of the model. The serious press thinks thework is important for its readers and worthy of policymakers’ attention. Academics question themodel’s apparent simplicity. Not surprisingly judgements vary about the complexity and accuracyrequired of models (or even ideas and theories) for them to offer useful guidance to business andsociety. Modellers need to strike a careful balance.

JWBK754-c01 JWBK754-Morecroft Printer: April 23, 2015 12:39 Printer Name: Trim: 246mm × 189mm
8 The Puzzling Dynamics of International Fisheries
0
100
200
300
400
500
600
700
800
0
200
400
600
800
1000
1200
1400
1950
1916
Cat
ch (
tho
usa
nd
tons)
Lan
dings
(th
ousa
nd
ton
nes
)
1920
1924
1928
1932
1936
1940
1944
1948
1952
1956
1960
1964
1968
1972
1976
1980
1984
1988
1992
1996
1953
1956
1959
1962
1965
1968
1971
1974
1977
1980
1983
1986
1989
1992
1995
1998
Figure 1.3 Pacific sardine catch (top) and North Sea herring catch (bottom) fromFish Banks debriefing materials (Meadows et al., 2001)Source: Nichols (1999).
Figure 1.3 shows evidence of overfishing from two real fisheries. This kind oftime series data is a useful focus for model building because it contains thedynamics of interest. The top chart shows the Pacific sardine catch inthousands of tonnes per year over the period 1916–1996. The annual catchgrew remarkably between 1920 and 1940, starting at around 50 thousandtonnes per year and peaking at 700 thousand tonnes per year – a 14-foldincrease. Over the next four years to 1944, the catch fell to 500 thousandtonnes per year, stabilised for a few years and then collapsed dramatically toalmost zero in 1952. Since then it has never properly recovered. The bottomchart shows a similar story for the North Sea herring catch in the period 1950to 1998. However, in this case, following a collapse between 1974 and 1979,the fishery did recover in the 1980s and early 1990s with an average annualcatch around 600 thousand tonnes per year – similar to the catch in the 1950sand 1960s.

JWBK754-c01 JWBK754-Morecroft Printer: April 23, 2015 12:39 Printer Name: Trim: 246mm × 189mm
Chapter 1 � The Appeal and Power of Strategic Modelling 9
Why does overfishing happen? We can be sure that no fishermen set out withthe deliberate intention of depleting fisheries and wrecking their ownlivelihoods. Yet this outcome has been repeated in fishing communitiesaround the world.4 A good explanation is to be found in a fisheries gamingsimulator called Fish Banks, Ltd (Meadows et al., 2001; Meadows and Sterman,2011). Since I am not an expert on fisheries, I will base my model on thispopular simulator. Fish Banks has been used to teach principles of sustainabledevelopment to audiences that include politicians, business leaders andgovernment policy advisers as well as fishing communities and high schoolstudents. Incidentally, it is no coincidence that the lead designer and author ofFish Banks, Dennis Meadows, was also a principal investigator in the Limits toGrowth study. Fish Banks has proven to be a potent metaphor for sustainabledevelopment in many industries and enterprises, including the world itselfviewed as a huge socio-economic enterprise.
Figure 1.4 An imaginary fishery – the game board of the original FishBanks, LtdSource: Meadows, et al., 2001
Figure 1.4 shows the Fish Banks game board and its imaginary fishery. Thereis a region of ocean, close to land, containing a single species of fish. Fishregenerate as a function of the existing population. The local fishingcommunity buys ships from the shipyard and takes them to sea to harvest fish.The total catch depends on the number of ships, the fish population and otherfactors, such as the weather. In the game, as in real life, the fish population isnot known accurately, although it can be estimated. Also, in the game, as in
4Clover describes the poignant scene at Lowestoft in recent years: the unrepaired doorways andshabby 1930s office buildings on the seafront, symbols of economic collapse. This town was onceamong England’s greatest fishing ports, famous the world over, with a history spanning 600 years.

JWBK754-c01 JWBK754-Morecroft Printer: April 23, 2015 12:39 Printer Name: Trim: 246mm × 189mm
10 Model of a Natural Fishery
real life, the process of fish regeneration is not fully understood by those inthe system (players or fishermen). Regeneration is related to the (unknown)fish population, but the relationship is complex and may involve otherexternal factors.
Model of a Natural Fishery
I have taken the situation and factors outlined above and used them to createa simple fisheries model (though the scaling I use is different from Fish Banksand there are no competing fishing companies). Figure 1.5 shows the fishpopulation and regeneration. For now there are no ships or fishermen – theyappear later. So what you see is a natural fishery, free from humanintervention.5 The fish population or fish stock, shown as a rectangle,accumulates the inflow of new fish per year (here the inflow is defined asbirths minus deaths). Initially, there are 200 fish in the sea and the maximumfishery size is assumed to be 4000 fish. Incidentally, the initial value andmaximum size can be re-scaled to be more realistic without changing theresulting dynamics. For example, a fishery starting with a biomass of 20thousand tonnes of a given species and an assumed maximum fishery size of400 thousand tonnes would generate equivalent results.
Fish stock
New fish per year
~Net regeneration
Maximumfishery size
Fish density
Figure 1.5 Diagram of a natural fishery
5The diagram was created in the popular iThink language (isee systems, 2014). The symbols arepretty much standard for all system dynamics models, though there are differences of detail betweenthe main alternative modelling software packages. Here, in Chapter 1, I briefly explain each symbolwhen I first refer to it in the text. Later, in Chapter 3, there is a more formal introduction to modellingsymbols and equations, with a fully documented example.

JWBK754-c01 JWBK754-Morecroft Printer: April 23, 2015 12:39 Printer Name: Trim: 246mm × 189mm
Chapter 1 � The Appeal and Power of Strategic Modelling 11
The flow of new fish per year is shown by an arrow. The size of the inflowvaries according to conditions within the fishery, as explained below. Thisidea of a modulated flow is depicted by a tap or ‘flow regulator’ placed in themiddle of the arrow. At the left end of the arrow is another special symbol, apool or cloud, depicting the source from which the flow arises – in this casefish eggs.
A very important relationship is the effect of fish density on net regeneration,a causal link shown by a curved arrow. Since fish density itself depends on thenumber of fish in the fishery region, the result is a circular feedback process inwhich the size of the fish stock determines, through various intermediate steps,its own rate of inflow.6 The relationship is non-linear as shown in Figure 1.6.
600
00
Fish Density
Net
Reg
ener
atio
n
1
Figure 1.6 Net regeneration as a non-linear function of fish density
When the fish density is low there are few fish in the sea relative to themaximum fishery size and net regeneration is low, at a value of less than 50fish per year. In the extreme case where there are no fish in the sea, the netregeneration is zero. As fish density rises the net regeneration rises too, on thegrounds that a bigger fish population will reproduce more successfully,provided the population is far below the presumed theoretical carryingcapacity of the ocean region.
As the fish density continues to rise, there comes a point at which netregeneration reaches a peak (in this case almost 600 fish per year) and thenbegins to fall because food becomes scarcer. Ecologists say there is increasing
6Interestingly, some people dispute the existence of this circularity. They argue that the number ofjuveniles reaching fishable size each year has nothing to do with the number of parents in the seabecause fish such as cod can produce upwards of seven million eggs in a season – most of whichperish due to predation and environmental factors. However, the number of fish eggs is certainlyrelated to the population of fish.

JWBK754-c01 JWBK754-Morecroft Printer: April 23, 2015 12:39 Printer Name: Trim: 246mm × 189mm
12 Model of a Natural Fishery
intraspecific competition among the burgeoning number of fish for the limitedavailable nutrient. So when, in this example, the fish population reaches 4000the fish density is equal to one and net regeneration falls to zero. Thepopulation is then at its maximum natural sustainable value.
Simulated Dynamics of a Natural Fishery
If you accept the relationships described above then the destiny of a naturalfishery is largely pre-determined once you populate it with a few fish. To somepeople this inevitability comes as a surprise, but in system dynamics it is anillustration of an important general principle: the structure of a system (howthe parts connect) determines its dynamic behaviour (performance throughtime). A simulator shows how. The simulation in Figure 1.7 shows thedynamics of a ‘natural’ fishery over a period of 40 years, starting with a smallinitial population of 200 fish. Remember there are no ships and no investment.Fishermen are not yet part of the system.
000 1
15002 000
1 000
2: New fish per year1: Fish stock
2
2
2
4 000
10 20
Years
30 40
1:2:
1:2:
1:2:
1
Figure 1.7 Simulation of a natural fishery with an initial population of 200 fish andmaximum fishery size of 4000
The result is smooth S-shaped growth. For 18 years, the fish stock (line 1)grows exponentially. The population grows from 200 to 2500 fish andregeneration (new fish per year, line 2) also increases until year 18 as risingfish density enables fish to reproduce more successfully. Thereafter, crowdingbecomes a significant factor according to the non-linear net regeneration curveshown in Figure 1.6. The number of new fish per year falls as the populationdensity rises, eventually bringing population growth to a halt as the fish stockapproaches its maximum sustainable value of 4000 fish.

JWBK754-c01 JWBK754-Morecroft Printer: April 23, 2015 12:39 Printer Name: Trim: 246mm × 189mm
Chapter 1 � The Appeal and Power of Strategic Modelling 13
Operating a Simple Harvested Fishery
Imagine you are living in a small fishing community where everyone’slivelihood depends on the local fishery. It could be a town like Bonavista inNewfoundland, remote and self-sufficient, located on a windswept cape 200miles from the tiny provincial capital of St Johns, along deserted roads wheremoose are as common as cars. ‘In the early 1990s there were 705 jobs inBonavista directly provided by the fishery, in catching and processing’ (Clover,2004). Let’s suppose there is a committee of the town council responsible forgrowth and development that regulates the purchase of new ships by localfishermen. This committee may not exist in the real Bonavista but for now it’sa convenient assumption. You are a member of the committee and proud ofyour thriving community. The town is growing, the fishing fleet is expandingand the fishery is teeming with cod.
~
~
Fish stock
Harvest rate
Effect of fish densityon catch per ship
CatchCatch
per shipNormal catchper ship
Purchase ofnew shipsthis year
Shipsat sea
Shipsin harbour
Ships movedto harbourthis year
Maximumfishery size
Fish density
Net Regeneration
New fish per year
Figure 1.8 Diagram of a simple harvested fishery
Figure 1.8 shows the situation. The fish stock in the top left of the diagramregenerates just the same as before, but now there is an outflow, the harvestrate, that represents fishermen casting their nets and removing fish from thesea. The harvest rate is equal to the catch, which itself depends on the number

JWBK754-c01 JWBK754-Morecroft Printer: April 23, 2015 12:39 Printer Name: Trim: 246mm × 189mm
14 Operating a Simple Harvested Fishery
of ships at sea and the catch per ship. Typically the more ships at sea thebigger the catch, unless the fish density falls very low, thereby reducing thecatch per ship because it is difficult for the crew to reliably locate fish. Ships atsea are increased by the purchase of new ships and reduced by ships movedto harbour, as shown in the bottom half of the diagram.
Ships movedto harbourthis year
Purchase ofnew shipsthis year
Quit
Reset
Run
Stop
ToDiagram
0 4
0
0 10
0
0.00
0
00.0
Page 1
×
4 0001 000
80.0
1:2:3:4:
1:2:3:4:
1:2:3:4:
2 000500
40.0
2: New fish per year 3: Catch 4: Ships at sea1: Fish stock
10.00 20.00
Years
30.00 40.00
Figure 1.9 Interface for fisheries gaming simulator
The interface to the gaming simulator is shown in Figure 1.9. There is a timechart that reports the fish stock, new fish per year, catch and ships at sea overa time horizon of 40 simulated years. Until you make a simulation, the chart isblank. The interface also contains various buttons and sliders to operate thesimulator and to make decisions year by year. There are two decisions. Usethe slider on the left for the purchase of new ships and the slider on the rightfor ships moved to harbour. You are ready to simulate! Open the file called‘Fisheries Gaming Simulator’ in the learning support folder for Chapter 1. Theinterface in Figure 1.9 will appear in colour. First of all, simulate naturalregeneration over a period of 40 years, a scenario similar, but not identical, tothe simulation in Figure 1.7. The only difference is that the initial fishpopulation is 500 fish rather than 200. What do you think will be thetrajectories of the fish stock and new fish per year? How will they differ fromthe trajectories in Figure 1.7? Would you expect any similarities? To find out,press the button on the left labelled ‘Run’ (but don’t alter either of the twosliders, which are deliberately set at zero to replicate a natural fishery). Youwill see a five-year simulation. The fish stock (line 1) and new fish per year(line 2) both grow steadily. You can observe the exact numerical values of the

JWBK754-c01 JWBK754-Morecroft Printer: April 23, 2015 12:39 Printer Name: Trim: 246mm × 189mm
Chapter 1 � The Appeal and Power of Strategic Modelling 15
variables by placing the cursor on the time chart, then selecting and holding.Numbers will appear under the variable names at the top of the chart. At timezero, the fish stock is 500 and new fish are regenerating at a rate of 63 peryear. If you look carefully you will see that the catch (line 3) and ships at sea(line 4) are, as expected, running along at a value of zero, alongside thehorizontal axis of the time chart. Press the ‘Run’ button again. Another fivesimulated years unfold showing further growth in the fish stock and in newfish per year. Continue until the simulation reaches 40 years and theninvestigate the trajectories carefully and compare them with the time chart inFigure 1.7. Why does the peak value of new fish per year occur so muchearlier (year 10 instead of year 16)? Why is the final size of the fish stockidentical in both cases?
Harvesting in Bonavista, Newfoundland – AThought Experiment
Back to Bonavista, or at least a similar imaginary fishery, scaled to thenumbers in the simulator. The fishing fleet has been growing and along with itthe catch and the entire community supported by the fishery. As a member ofthe town’s growth and development committee you want to explorealternative futures for the fishery and the simulator is one way to do so. Youconjure up a thought experiment. Starting as before with an initial stock of 500fish, you first simulate growth, through natural regeneration of fish, for aperiod of 10 years. The result is a well-stocked fishery similar to the oneexisting some 20 years ago when the hamlet of Bonavista, as it was then,began to expand commercial fishing. You know from the previous experimentthat this scenario will lead to plenty of fish in the sea, but in reality you andthe fishermen themselves don’t know how many.
To replicate this fundamental uncertainty of fisheries you should ‘hide’ thetrajectories for fish stock and new fish per year by colouring them grey so theyblend into the background of the time chart. Some playing around with thesoftware is necessary to bring about this change, but the result is importantand worthwhile. First, press the ‘Reset’ button on the left of the time chart.The trajectories will disappear to leave a blank chart. Next move the cursor tothe tiny paintbrush icon at the right of the tools bar at the top of the interface.Select and hold. A palette of colours will appear. Move the cursor to thebottom line containing greys and blacks. Select the light grey colour on theextreme left. Release the mouse button and move the cursor back onto thetime chart where it will now appear as a paint brush. Select and thebackground of the chart will turn grey. Return to the colour palette and selectthe light grey colour second from the left. Now move the paintbrush cursor sothat it lies exactly on top of the phrase ‘Fish stock’ at the top left of the timechart. Select and the phrase will turn from blue to grey and will, as intended,

JWBK754-c01 JWBK754-Morecroft Printer: April 23, 2015 12:39 Printer Name: Trim: 246mm × 189mm
16 Operating a Simple Harvested Fishery
be virtually indistinguishable from the background grey. Repeat the samepainting procedure for the phrase ‘New fish per year’. Your time chart is nowready.
Press the ‘Run’ button twice to recreate 10 years of natural fishery growth. Atfirst glance the simulated chart will appear quite blank and uninteresting.That’s how it should be! Now move the slider for ‘Purchase of new ships thisyear’ to a value of 2 by selecting, holding and dragging the slider icon until thenumber 2 appears in the centre box. This setting means that each simulatedyear two new ships will be purchased and used by Bonavista fishermen. Pressthe ‘Run’ button three times in succession to simulate fleet expansion for years10–25, a period of historical growth for the imagined Bonavista fishery. Shipsat sea (line 4) increase linearly from zero to 30 as you would expect from aninvestment policy that adds two new ships a year over 15 years. The catch(line 3) increases proportionally in a similar linear pattern. Press the ‘Run’button once more to simulate continued fleet expansion for years 25–30. Shipsat sea continue the same relentless linear expansion, but notice a dramaticchange in the trajectory of the catch (line 3). In year 26, after 16 years ofsteady growth, the catch levels out and peaks at 786 fish per year even thoughnew ships are being added to the fleet. (To check the numerical values movethe cursor onto the time chart, then select, hold and drag.) In year 27 the catchdeclines for the very first time in the fishery’s simulated history. At the start ofyear 29, the catch is down to 690 fish per year, a decline of 12 per cent fromthe peak. Imagine the situation in Bonavista. The town’s main business is in adownturn. A community, which has become used to growth and success,begins to worry and to ask why. Perhaps the past two years have beenunlucky – poor weather or adverse breeding conditions. However, year 29sees continued decline. The catch falls below 450 fish per year while the fleetgrows to 40 ships. A downturn has become a slump.
At this point you can imagine pressure building in the community to dosomething about the problem. But what? The fishery is in decline. Perhaps theanswer is to halt the purchase of new ships and to require some ships toremain in harbour. Such measures may seem logical if you believe thatoverfishing is to blame. But others will argue the decline is due to a run ofexceptionally bad luck and that, sooner or later, the catch will return tonormal. And remember nobody knows for certain the size of the remainingfish stock or the regeneration rate. That’s all happening underwater. So, as inall practical strategy development, there is scope for argument and conflictabout the true state of affairs and how best to react. Moreover, it is politicallyand economically painful for any community or business to cause itself toshrink deliberately. There are bound to be more losers than winners.
Nevertheless, imagine Bonavista agrees a conservation policy involving a totalban on the purchase of new ships for the next five years and an effective

JWBK754-c01 JWBK754-Morecroft Printer: April 23, 2015 12:39 Printer Name: Trim: 246mm × 189mm
Chapter 1 � The Appeal and Power of Strategic Modelling 17
reduction in the fleet size to be achieved by moving five ships per year intothe harbour. A little mental arithmetic reveals that in its first year of operationthis policy idles 12.5% of the active fleet (5 ships out of 40), then 14.3% in thesecond year (5 ships out of 35), then 16.7% in the third year (5 ships out of30). After five years, a total of 25 ships have been idled, which is fully 62.5%of the original fleet – a huge reduction in a short time. Adjust the sliders torepresent the implementation of this stringent conservation policy. First set theslider for the ‘Purchase of new ships this year’ to zero, either by dragging theslider icon to the extreme left or by selecting the slider’s ‘Reset’ button(denoted by ‘U’) in the bottom left of the slide bar. Then, set the slider for‘Ships moved to harbour this year’ by dragging the slider icon to the right untilthe number 5 appears in the centre box. Press the ‘Run’ button to see theresults of the policy. You will notice that ships at sea (line 4) decline steeply asenforced idling takes place. By year 35 of the simulation, the active fleet size is15 ships at sea, back to where it had been in the early growth heyday of thefishery almost 20 years ago in year 17. Despite the cuts and huge economicsacrifices, however, the catch has declined to less than 10 fish per year,scarcely more than 1 per cent of the peak catch in year 26. In a single decadeour imagined Bonavista fishery has gone from productive prosperity toextreme hardship. Each day the community awakes to see the majority of thefishing fleet idle in its once busy harbour, and the remaining active shipsreturning with a dismally tiny catch. You can imagine that by now many willhave lost heart and lost faith in the conservation policy.
To finish the simulation reset to zero the slider for ‘Ships moved to harbourthis year’ and then press ‘Run’. In these final years it is no longer possible toenforce further reductions in the active fleet. The number of ships at searemains constant and the catch falls practically to zero. It’s a depressing story,but entirely consistent with the facts of real fisheries. Harvested fisheries areprone to catastrophic decline that nobody involved – fishermen, communityleader or consumer – would wish on themselves. Yet this situation inparticular, and others like it, arise from nothing more than a desire topurchase ships, catch fish and grow a prosperous community. Why? Fisheriesprovide but one example of puzzling dynamics that are the focus of this book.As we will see, modelling and simulation can shed useful light on why suchpuzzling dynamics occur and how to bring about improvement.
A Start on Analysing Dynamics and PerformanceThrough Time
Much of the problem with managing fisheries lies in properly coordinating thenumber of ships at sea in relation to the number of fish. A sustainable fishery,one that provides a reliable and abundant harvest year after year, regeneratesfish at about the same rate as they are being caught. Successful replenishment

JWBK754-c01 JWBK754-Morecroft Printer: April 23, 2015 12:39 Printer Name: Trim: 246mm × 189mm
18 Operating a Simple Harvested Fishery
requires an appropriate balance of ships and fish. Balancing is easier said thandone when in practice it is impossible to observe and count the number of fishin the sea, when fishing technology is advancing and when there is a naturalhuman propensity to prefer growth and the prosperity it brings. Imagine wecould reliably count the fish stock and observe the regeneration of fishthrough time. What new light would this new data shed on the rise and fall ofBonavista and the policy options to avoid catastrophic decline in the fishpopulation? In our simulator we can choose to observe and report variablesthat, in real life, would be unobservable. Use the colour palette and paintbrushto reinstate the original coloured trajectories for the Fish stock (blue) and Newfish per year (red). You will find the appropriate colours on the top row of thepalette. (If you accidentally set the background colour of the chart to blue orred, which can happen if you don’t align the paintbrush with the variablename, don’t panic. Simply return to the colour palette, select light grey, andrepaint the background. Then try again to re-colour the trajectories.) Theresulting chart will look like Figure 1.10, with all the trajectories clearlyvisible, except that yours will be in colour.
0.000.0
00
Page 1
×
4 0001 000
80.0
1:2:3:4:
1:2:3:4:
1:2:3:4:
2 00050040.0
2: New fish per year 3: Catch 4: Ships at sea1: Fish stock
10.00 20.00
Years
30.00 40.00
3
3
3
2
2
21
1
1
4
4
Figure 1.10 Simulation of harvested fishery showing all trajectories
Consider the behaviour over time of the fish stock (line 1). For the first 10years of the simulation the number of fish grows swiftly because effectivelythere is a natural fishery (no ships) that is underpopulated relative to itscarrying capacity. In years 10–15 commercial fishing begins and each yearmore ships are sent to sea (line 4). Nevertheless, the fish population continuesto increase. These are the early growth years of the Bonavista community.During this entire period the catch is rising (line 3), but is always below therate of regeneration (new fish per year, line 2). The fishery is sustainable with

JWBK754-c01 JWBK754-Morecroft Printer: April 23, 2015 12:39 Printer Name: Trim: 246mm × 189mm
Chapter 1 � The Appeal and Power of Strategic Modelling 19
growing population. In years 15–20 the catch continues to rise steadily in linewith fleet expansion, but the fish stock begins to decline gently as the catchexceeds the number of new fish per year (line 3 rises above line 2). Thisexcess of catch over regeneration is not necessarily a problem for long-termsustainability because harvesting is actually stimulating the regeneration offish, as shown by the steady increase in new fish per year. A harvested fishery,even a well-run one, will always have a fish population considerably lowerthan the maximum fishery size.
Herein lies a fundamental dilemma for fisheries management. Who is to saywhether a decline in fish population is a problem or not? It could just be a signof effective harvesting in a period of growth. Moreover, and this is vitallyimportant to remember, nobody knows for certain how many fish of a givenspecies are in the fishery. At best there are estimates subject to measurementerror, bias and even manipulation. So it is very difficult in practice to makefish stock itself (how many fish are believed to be in the sea) the basis forinvestment policy (how many ships to purchase). Much more persuasiveevidence comes from the catch. The simulation shows catch rising all the waythrough to year 25 and beyond. The temptation, even in years 20–25, is tobelieve that further fleet expansion is both desirable and justified. Theconflicting signals from fish stock (a weak signal at best) and the catch (astrong and tangible signal of immediate economic and personal importance tofishermen and fleet operators) form the basis of the coordination problem infisheries. Throughout year 25 and even into year 26 it is not unreasonable tocontinue fleet expansion even though the invisible fish population is in steadydecline.
However, in year 25 something of vital significance happens under water,hidden from all but the fish themselves. The number of new fish per year(line 2) peaks and then starts to decline. This is the first evidence, a kind ofearly warning signal, that the fishery is being overfished. Fish density is nowso low that regeneration is suppressed. The fishery teeters on the brink ofcatastrophe. The rate of population decline (the steepness of line 1) increases.But the catch keeps on rising throughout year 26 so no action is taken tocurtail fleet expansion. In year 27 the catch itself peaks and then declines,gradually at first. This is the first tangible evidence of stock depletionunderwater, but even so the signal is likely to be ignored until the trend provesconclusive and until the fishing community persuades itself to limit fishing. Inthe simulator, we assume that new ship purchasing continues apace until year30. By then the fish stock has fallen to around 400, only 10% of the maximumfishery size. The regeneration rate (new fish per year) is still in decline and farbelow the much reduced catch. Measures to halt investment and to idle shipsin years 30 to 40, drastic though they are, are too little too late. Bonavista’sfish have all but gone and with them the industry on which the communitydepends. By year 35 there are so few fish left (only 16!) that, even with a total

JWBK754-c01 JWBK754-Morecroft Printer: April 23, 2015 12:39 Printer Name: Trim: 246mm × 189mm
20 Operating a Simple Harvested Fishery
ban on fishing, it would take two decades to rebuild the stock to its value inyear 10 when our imagined Bonavista first began commercial fishing.
Saving Bonavista – Using Simulation to Devise aSustainable Fishery
Now you are familiar with the gaming simulator, you can use it to testalternative approaches to growing and developing the Bonavista fishery. Firstpress the ‘Reset’ button to obtain a new blank time chart and to re-initialisethe simulator. Next, without altering either slider, press the ‘Run’ button twicein order to simulate 10 years of natural growth in the fish population so thatBonavista inherits a well-stocked fishery. Then re-simulate the same fleetexpansion as before – two ships per year for years 10–25. You will findyourself back in Bonavista’s heyday with a fleet of 30 ships and a history of 15years of steady growth in the catch. Now it is your responsibility to steer thecommunity toward a sustainable future that avoids the errors of the past. Forrealism you may, as before, want to ‘grey-out’ the trajectories for fish stockand new fish per year. What is happening to the fish stock underwater isdifficult to know, vague and often subject to controversial interpretation. Alsobear in mind the practical political difficulties of curtailing growth and ofidling ships in a community that depends on fishing. Think about plausibleadjustments to the two sliders at your disposal. It is a good discipline to noteyour intentions, and the reasoning behind them, before simulating. Imagineyou first have to convince the Bonavista community and fishermen to adoptyour plan. Then, when you are ready, simulate, analyse the trajectories and tryto make sense of the outcome. Was the result what you expected? If not thenwhy? If you don’t like the result then try again.
Dynamic Complexity and PerformanceThrough Time
Although in principle it is possible to create a sustainable Bonavista it is verydifficult to do so in practice or even in a simulator, particularly when youinherit a fleet of 30 ships following 15 years of successful economic growth.The fisheries simulator is one example of a dynamically complex system, ofwhich there are others in this book and many more in life. Often such systemsgive rise to puzzling performance through time – performance far below theachievable and, despite the best of intentions, not what people (stakeholders inthe system) want. In this case, the fishery is prone to catastrophic declinewhen perhaps all that fishermen desire, and the fishing community wants, isgrowth, more and better ships, and a higher standard of living. Dynamiccomplexity stems from the connections and interdependencies that bind

JWBK754-c01 JWBK754-Morecroft Printer: April 23, 2015 12:39 Printer Name: Trim: 246mm × 189mm
Chapter 1 � The Appeal and Power of Strategic Modelling 21
together social and business systems. When a change happens in one part ofthe system (e.g. more ships are purchased) sooner or later it has implicationselsewhere, and vice versa. Moreover, these implications are not alwaysobvious and are often counterintuitive (e.g. more ships can lead to a greaterrate of fish regeneration, but not always).
Dynamic complexity does not necessarily mean big, detailed and complex,involving hundreds or thousands of interacting components. Indeed, as thefisheries simulator shows, dynamic complexity and puzzling performance canarise from only a few interacting components. What matters is not so much theraw number of components but the intricacy with which they are boundtogether.
Such intricacy involves time delays, processes of stock accumulation (such asthe accumulations of ships and of fish), non-linearities (such as thehump-shaped relationship between fish density and fish regeneration), andclosed feedback loops (such as the reinforcing relationship between fish stock,fish density, fish regeneration and fish stock). These special terms, thelanguage of feedback systems thinking, will become clearer later. For now it issufficient to appreciate that dynamic complexity stems from intricateinterdependencies of which there are many, many examples in ourincreasingly interconnected world. Sometimes it is possible to reduce dynamiccomplexity by making interdependencies less entwined and moreunderstandable. Indeed, this goal of simplification is really the ultimate aim ofpolicy design in system dynamics – redesigning social and business systems sothat, despite their complexity, normally-competent people can run themsuccessfully.
Why are fisheries so dynamically complex? What changes would make themless prone to sudden and catastrophic decline? Herein lies the whole area offisheries policy involving fishermen, fishing communities, governments,marine scientists, consumers and fish themselves. There is a lot that could bemodelled about the interactions among these stakeholders and arguably aserious fisheries policy simulator would be much bigger and would involvemany more variables and relationships than those in our small Bonavistamodel. Nevertheless, at the heart of any such model will be a representation ofthe factors – biological, economic, political and social – that determine thebalance of ships at sea and fish in a commercial fishery.
A vital part of dynamic complexity in fisheries lies in the relationship betweenthe catch and fish density. Not surprisingly, if the fish density is very low thenit is difficult for fishermen to locate fish and the catch is lower than normal.But the relationship is non-linear as shown in Figure 1.11. Here, fish density ismeasured on a scale from zero to one, where one is the highest possible

JWBK754-c01 JWBK754-Morecroft Printer: April 23, 2015 12:39 Printer Name: Trim: 246mm × 189mm
22 Operating a Simple Harvested Fishery
density (the number of fish is equal to the carrying capacity) and zero is thelowest (there are no fish). The vertical axis shows the effect of fish density oncatch per ship, also on a scale from zero to one. In our imagined Bonavista,the normal catch per ship is 25 fish per ship per year – remember this is ascale model. The actual catch per ship is obtained from the product of normalcatch (25) and the effect of fish density.
Fish Density0
01
Effe
ct O
f Fis
h D
ensi
ty O
nC
atch
Per
Shi
p
1
Reference line
Figure 1.11 Relationship between catch per ship and fish density
When the fish density is high, in the range between 0.7 and one, the catch pership is stable at 25 because there is little or no depressing effect from fishdensity. The sea is full of fish and they are easy to find and catch. When thefish density is lower, in the range 0.4 to 0.7, the catch is still very close tonormal (25). The assumption, borne out empirically in real fisheries, is thatfish are still quite easy to find even when there are fewer, because they tend tocluster. Only when the fish density falls very low, in the range between zeroand 0.4, does scarcity make fishing more difficult. In this narrow range theeffect of density falls swiftly from 0.9 (almost normal) to zero.
The non-linearity, the sudden depressing effect of density on the catch, makesfisheries management difficult. You can appreciate why if you imagine theargument between a marine biologist and a fisherman about the need toconserve stocks. When the fish population falls to half the maximum (fishdensity equal to 0.5) the marine biologist argues that stocks are too low. Butthe fisherman reports (accurately) there is no difficulty catching fish, so what’sthe problem? In all likelihood, the fisherman thinks the fish stock is actuallyhigher than the marine biologist’s estimate. The biologist is exaggerating theproblem, or so it seems to someone whose livelihood depends directly on thecatch. When the fish population falls to one-quarter of the maximum (fishdensity equal to 0.25) the marine biologist is frantic and even the fisherman isbeginning to notice a reduction in the catch, down by about one-third relativeto normal. That outcome, though worrying, is not obviously fatal. Perhapswith a bit more effort and luck the poor catch can be rectified, and whybelieve the marine biologist now, when he/she was seemingly so wrong and

JWBK754-c01 JWBK754-Morecroft Printer: April 23, 2015 12:39 Printer Name: Trim: 246mm × 189mm
Chapter 1 � The Appeal and Power of Strategic Modelling 23
alarmist before? The non-linearity creates confusion in the attribution ofcausality – what causes what in the system – and such confusion is a typicalsymptom of dynamic complexity.
Cunning Fish – A Scenario with ReducedDynamic Complexity
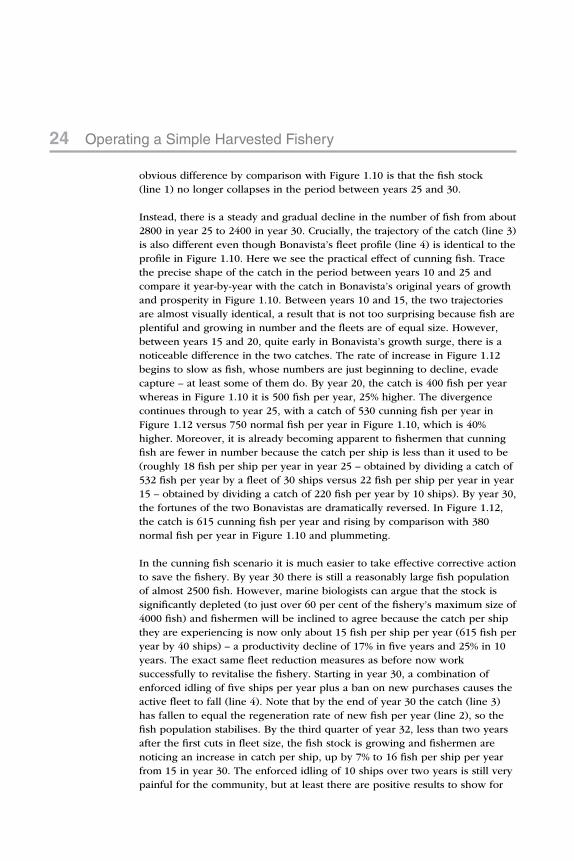
If we lived in a world where fish were cunning and took steps to avoidcapture when they noticed a decline in their numbers (as though respondingto a census) then the dynamic complexity of fisheries would be reduced and,ironically, fish stocks would be easier to manage for sustainability. Torepresent this thought experiment the effect of fish density on catch per shipis modified. Instead of being non-linear it becomes linear, as shown by thereference line in Figure 1.11. As fish density falls the fish take action to protectthemselves. Suppose they disperse instead of clustering. So now, even with aslight decline in density, it is more difficult for fishermen to fill their nets. Theeffect of density falls below one and the catch per ship is reduced. The lowerthe density, the lower the catch per ship – a simple linear relationship. Nowlet’s simulate the same Bonavista growth ‘strategy’ as before: purchase twonew ships per year from years 10–30; and then, in years 30–40, stop newpurchases and idle some ships by keeping them in harbour.
0.00
0.000
Page 1
×
4 0001 000
80.0
1:2:3:4:
1:2:3:4:
1:2:3:4:
2 00050040.0
2: New fish per year 3: Catch 4: Ships at sea1: Fish stock
10.00 20.00
Years
30.00 40.00
2
21
1
4
2
1
3
3
4
Figure 1.12 Simulation of harvested fishery with cunning fish – a thoughtexperiment
The result is shown in Figure 1.12. This is a scenario of reduced dynamiccomplexity and is created by running the model called ‘Fisheries GamingSimulator – Cunning Fish’ in the learning support folder for Chapter 1.Admittedly it is imaginary and fanciful but nevertheless interesting. The most
JWBK754-c01 JWBK754-Morecroft Printer: April 23, 2015 12:39 Printer Name: Trim: 246mm × 189mm
24 Operating a Simple Harvested Fishery
obvious difference by comparison with Figure 1.10 is that the fish stock(line 1) no longer collapses in the period between years 25 and 30.
Instead, there is a steady and gradual decline in the number of fish from about2800 in year 25 to 2400 in year 30. Crucially, the trajectory of the catch (line 3)is also different even though Bonavista’s fleet profile (line 4) is identical to theprofile in Figure 1.10. Here we see the practical effect of cunning fish. Tracethe precise shape of the catch in the period between years 10 and 25 andcompare it year-by-year with the catch in Bonavista’s original years of growthand prosperity in Figure 1.10. Between years 10 and 15, the two trajectoriesare almost visually identical, a result that is not too surprising because fish areplentiful and growing in number and the fleets are of equal size. However,between years 15 and 20, quite early in Bonavista’s growth surge, there is anoticeable difference in the two catches. The rate of increase in Figure 1.12begins to slow as fish, whose numbers are just beginning to decline, evadecapture – at least some of them do. By year 20, the catch is 400 fish per yearwhereas in Figure 1.10 it is 500 fish per year, 25% higher. The divergencecontinues through to year 25, with a catch of 530 cunning fish per year inFigure 1.12 versus 750 normal fish per year in Figure 1.10, which is 40%higher. Moreover, it is already becoming apparent to fishermen that cunningfish are fewer in number because the catch per ship is less than it used to be(roughly 18 fish per ship per year in year 25 – obtained by dividing a catch of532 fish per year by a fleet of 30 ships versus 22 fish per ship per year in year15 – obtained by dividing a catch of 220 fish per year by 10 ships). By year 30,the fortunes of the two Bonavistas are dramatically reversed. In Figure 1.12,the catch is 615 cunning fish per year and rising by comparison with 380normal fish per year in Figure 1.10 and plummeting.
In the cunning fish scenario it is much easier to take effective corrective actionto save the fishery. By year 30 there is still a reasonably large fish populationof almost 2500 fish. However, marine biologists can argue that the stock issignificantly depleted (to just over 60 per cent of the fishery’s maximum size of4000 fish) and fishermen will be inclined to agree because the catch per shipthey are experiencing is now only about 15 fish per ship per year (615 fish peryear by 40 ships) – a productivity decline of 17% in five years and 25% in 10years. The exact same fleet reduction measures as before now worksuccessfully to revitalise the fishery. Starting in year 30, a combination ofenforced idling of five ships per year plus a ban on new purchases causes theactive fleet to fall (line 4). Note that by the end of year 30 the catch (line 3)has fallen to equal the regeneration rate of new fish per year (line 2), so thefish population stabilises. By the third quarter of year 32, less than two yearsafter the first cuts in fleet size, the fish stock is growing and fishermen arenoticing an increase in catch per ship, up by 7% to 16 fish per ship per yearfrom 15 in year 30. The enforced idling of 10 ships over two years is still verypainful for the community, but at least there are positive results to show for

JWBK754-c01 JWBK754-Morecroft Printer: April 23, 2015 12:39 Printer Name: Trim: 246mm × 189mm
Chapter 1 � The Appeal and Power of Strategic Modelling 25
the sacrifice. By year 35, the end of enforced idling, the active fleet or ships atsea (line 4) is down to 15, the catch (line 3) is down to 270 fish per year andthe catch per ship is up to 18 fish per ship per year – an improvement of 20%over five years. In the final interval to year 40, the active fleet size remainsconstant at 15 ships. New fish per year (line 2) gradually converge to equal thecatch (line 3) so that by year 40 the fishery is in long-term equilibrium withalmost 3200 fish. The Bonavista community with its fishermen and its nearbycolony of cunning fish has achieved a sustainable future.
Preview of the Book and Topics Covered
The fisheries simulator demonstrates a general point that dynamic complexitywithin business and social systems makes management and strategydevelopment difficult. The performance of firms and industries over timerarely unfolds in the way we expect or intend. The purpose of strategicmodelling and business dynamics is to investigate dynamic complexity bybetter understanding how the parts of an enterprise operate, fit together andinteract. By modelling and simulating the relationships among the parts wecan anticipate potential problems, avoid strategic pitfalls and take steps toimprove performance.
The rest of the book demonstrates the art and science of system dynamicsmodelling. Chapter 2 introduces causal loop diagrams as a powerfulconceptual tool to visualise interdependencies and take a strategic overview ofoperations. Chapter 3 introduces the additional concepts and tools required totranslate causal loops into algebraic models and simulators. Chapter 4provides an opportunity to experiment with a simulator and gain insight intocyclical dynamics by ‘managing’ the water temperature in an imaginary hotwater shower. At first glance, World of Showers is far removed from theworlds of business or public policy, but the gaming simulator vividly illustratesthe coordination problem at the heart of balancing loop dynamics found inmany practical management situations. Players can also redesign the showermodel to improve personal comfort, just as business simulators are used toredesign operating policies to improve corporate performance.
Chapters 5, 6 and 7 present a variety of business applications, covering topicssuch as cyclicality in manufacturing, market growth and capital investment.The models in these chapters are deliberately small and concise so theirstructure and formulations can be presented in full and used to illustrateprinciples of model conceptualisation, equation formulation and simulationanalysis. Chapters 8 and 9 present larger models that arose from real-worldapplications. Chapter 8 investigates the upstream oil industry and the dynamicsof global oil producers that affect us all through the volatile price of oil andgasoline. The chapter includes a description of the model’s conceptualisation,

JWBK754-c01 JWBK754-Morecroft Printer: April 23, 2015 12:39 Printer Name: Trim: 246mm × 189mm
26 Preview of the Book and Topics Covered
a thorough review of the resulting feedback structure of global oil markets, asample of equation formulations and a comprehensive set of simulations.Chapter 9 presents public sector applications of strategic modelling. We brieflyreview a classic model about the growth and economic stagnation of cities.Next there is a model that investigates the dynamics of hospital doctors’workload and patient care. Then we return to fisheries and further develop thegaming simulator from this chapter into a fully endogenous model of fisheriesthat includes investment and regulatory policy. Finally, Chapter 10 addressesthe important topic of model validity and confidence building, using a modelof product innovation in fast-moving consumer goods to illustrate a variety oftests of model integrity and quality. The chapter ends with a review of all themodels covered in the book and some philosophical yet practical commentson realism, model fidelity and learning.
Throughout the book there are exercises with simulators that illustrate thedynamics of interest and allow readers to conduct their own tests and policyexperiments. The simulators can be downloaded from the book supportwebsite (www.wiley.com/go/strategicmodelling2e). Each is designed with aninterface that makes it easy to run simulations, interpret the time charts,change selected parameters and explore the underlying model structure andequation formulations. They offer a useful way to experience dynamiccomplexity and to develop an intuition for the causes and cures of puzzlingdynamics in businesses and society.7,8
7Here, at the end of Chapter 1, is a good place to issue a challenge for readers who, on completingthe book, wish to further develop their modelling skills on a really important dynamic problem.The task is to rebuild the World Dynamics model to address the effects of global warming, withthe intention of creating a small-scale simulator that can be used to raise public awareness of theneed for us all to cut carbon emissions. By public awareness I mean awareness in your community,company, department, university or school. Background material for this personal project can befound in 2052: A Global Forecast for the Next Forty Years (Randers 2012), The Vanishing Face of Gaia(Lovelock, 2009) and in Last Call, a documentary film about the Limits to Growth project (Cerasuolo,2013)). More ideas can be found in the 30-year update of Limits to Growth (Meadows, et al., 2002),in Thomas Fiddaman’s prize-winning work on a climate–economy model (Fiddaman, 2002) and inA Rough Ride to the Future (Lovelock, 2014). But remember, the main objective in this challenge isto create a compact and vivid model to raise local public awareness of the effects of climate changerather than to develop a calibrated climate–economy model for climate scientists and policy advisers.Incidentally I decided to set myself the task of rebuilding the World Dynamics model. An overviewof my approach can be found in ‘Metaphorical Models for Limits to Growth and Industrialization’(Morecroft, 2012). Sample models and supporting materials are available online from the SystemDynamics Society www.systemdynamics.org. See Morecroft ISDC Workshops 2011–2013 for moredetails.8See also John Sterman’s online interactive simulator on climate change. The simulator, available athttp://web.mit.edu/jsterman/www/GHG.html (accessed 20 February 2015), is based on the ‘bathtubdynamics’ experiments carried out at the MIT System Dynamics Group (Sterman & Booth Sweeney,2007). The results show that even highly educated people with strong backgrounds in mathematicsand the sciences have great difficulty relating the flow of greenhouse gas (GHG) emissions tothe stock of greenhouse gases in the atmosphere. Further material on the ‘bathtub dynamics’ ofgreenhouse gases can be found in World Climate, a vivid interactive role play negotiation of aglobal climate agreement using a simulator called C-ROADS (Sterman, et al., 2011).

JWBK754-c01 JWBK754-Morecroft Printer: April 23, 2015 12:39 Printer Name: Trim: 246mm × 189mm
Chapter 1 � The Appeal and Power of Strategic Modelling 27
There are also two electronic topics that can be found in the folders for‘v-Lectures 1 and 2’ on the Learners’ website. The topics are ‘dynamics ofdiversification’ and ‘managing metamorphosis’. Diversification is an importantpart of corporate (multi-business) strategy and complements material inChapters 6, 7, 8 and 10 on the dynamics of single-business firms and of entireindustries. Metamorphosis is a process of managed adaptation to change in thebusiness environment.
Appendix – Archive Materials fromWorld Dynamics
Figure 1.13 Diagram of the original World Dynamics modelThis world model is a beginning basis for analysing the effect of changing population and economic
growth over the next 50 years. The model includes interrelationships of population, capital invest-
ment, natural resources, pollution and agriculture. Source: Forrester, Jay W., World Dynamics. 1973,
pp. 20–21, Reproduced by permission of Jay W. Forrester.

JWBK754-c01 JWBK754-Morecroft Printer: April 23, 2015 12:39 Printer Name: Trim: 246mm × 189mm
28 References
Basic world modelbehaviour showing themode in whichindustrialisation andpopulation are suppressedby falling natural resources
One set of conditions thatestablishes a world equilibrium ata high quality of life. In 1970normal capital investment rate isreduced by 40 per cent, normal birthrate is reduced by 50 per cent,normal pollution generation isreduced by 50 per cent, normalnatural resource usage rate isreduced by 75 per cent, and normalfood production is reduced by 20per cent
Figure 1.14 Simulations of the original world dynamics modelSource: pages 225 and 232 of ‘Counterintuitive Behavior of Social Systems’, Chapter 14 in the Col-
lected Papers of Jay W. Forrester, originally published by Wright-Allen Press, 1975, available from the
System Dynamics Society www.systemdynamics.org, Reproduced by permission of Jay W. Forrester.
References
Cerasuolo, E. (2013) Last Call. A documentary by Italian film director EnricoCerasuolo about the history, impact and main protagonists of the Limits to Growthproject www.lastcallthefilm.org/ (accessed 17 January 2014).
Clover, C. (2004) The End of the Line. London: Ebury Press.

JWBK754-c01 JWBK754-Morecroft Printer: April 23, 2015 12:39 Printer Name: Trim: 246mm × 189mm
Chapter 1 � The Appeal and Power of Strategic Modelling 29
Fiddaman, T. (2002) Exploring policy options with a behavioral climate-economymodel. System Dynamics Review, 18(2): 243–267.
Forrester, J.W. (1961) Industrial Dynamics. available from the System DynamicsSociety www.systemdynamics.org; originally published by MIT Press 1961.
Forrester, J.W. (1971) World Dynamics. available from the System DynamicsSociety www.systemdynamics.org; originally published by Wright-Allen Press,Cambridge, MA.
Forrester, J.W. (1971 and 1975) Counterintuitive Behavior of Social Systems.Technology Review, 73, 52–68. Also re-published in 1975 as Chapter 14 in theCollected Papers of Jay W. Forrester, available from the System Dynamics Societywww.systemdynamics.org; originally published by Wright-Allen Press, CambridgeMA.
isee systems (2014) iThink modelling software, visit www.iseesystems.com.
Lovelock, J. (2009) The Vanishing Face of Gaia – A Final Warning. London: AllenLane, an imprint of Penguin Books.
Lovelock, J. (2014) A Rough Ride to the Future. London: Allen Lane, an imprint ofPenguin Books.
Meadows, D.H., Meadows, D.L., Behrens, W.W. III, et al. (1972) Limits to Growth.New York: Universe Books.
Meadows, D.L., Fiddaman, T. and Shannon, D. (2001) Fish Banks, Ltd. AMicro-computer Assisted Group Simulation That Teaches Principles of SustainableManagement of Renewable Natural Resources (5th edn). The FishBanks Ltd gamewas developed by Professor Dennis Meadows, co-author of Limits to Growth. Theboard game kits which include the game software, PowerPoint slide sets forintroducing and debriefing the game, instructions for playing the game, the roledescription, game board and pieces are sold through the System Dynamics Societywww.systemdynamics.org/. Email: [email protected].
Meadows, D.H., Randers, J. and Meadows, D.L. (2002) Limits to Growth: The 30Year Update. White River Junction, VT: Chelsea Green Publishing Company.
Meadows, D.L. and Sterman, J.D. (2011) Fishbanks: A Renewable ResourceManagement Simulation. MIT Sloan Learning Edge (an online learning resourcefor management education). https://mitsloan.mit.edu/LearningEdge/simulations/fishbanks/Pages/fish-banks.aspx (accessed 17 January 2014).
Morecroft, J.D.W. (2000) Creativity and convergence in scenario modelling. InFoschani, S., Habenicht, W. and Waschser, G. (eds), Strategisches Management imZeichen von Umbruch und Wandel (Festschrift honouring Erich Zahn). Stuttgart:Schaeffer-Poeschel-Verlag, pp. 97–115.

JWBK754-c01 JWBK754-Morecroft Printer: April 23, 2015 12:39 Printer Name: Trim: 246mm × 189mm
30 References
Morecroft, J.D.W. (2012) Metaphorical Models for Limits to Growth andIndustrialization, Systems Research and Behavioral Science, 29(6): 645–666.
Morecroft, J.D.W. Online ISDC Workshops. (2011–2014). In the OnlineProceedings of the International System Dynamics Conferences for 2011–2013,http://conference.systemdynamics.org/past conferences/.
Nichols, J. (1999) Saving North Sea Herring. Fishing News, February.
O’Brien, F.A. and Dyson, R.G. (eds) (2007) Supporting Strategy. Chichester: JohnWiley & Sons.
Randers, J. (1980) Guidelines for model conceptualisation. In Randers, J. (ed.),Elements of the System Dynamics Method. available from the System DynamicsSociety www.systemdynamics.org, originally published by MIT Press, CambridgeMA, 1980.
Randers, J. (2012) 2052: A Global Forecast for the Next Forty Years. Vermont:Chelsea Green Publishing.
Sterman, J.D. and Booth Sweeney, L. (2007) Understanding public complacencyabout climate change: Adults’ mental models of climate change violate conservationof matter. Climate Change, 80(3–4): 213–238. Available at http://web.mit.edu/jsterman/www/Understanding_public.html (accessed 20 February 2015).
Sterman, J.D., Fiddaman, T., Franck, T., et al. (2012) World Climate: Negotiating aGlobal Climate Change Agreement, https://mitsloan.mit.edu/LearningEdge/simulations/worldclimate/Pages/default.aspx (accessed 20 February 2015).

About the AuthorJohn Morecroft is Senior Fellow in Management Science and Operations
at London Business School where he has taught system dynamics, problem
structuring and strategy in MBA, PhD and Executive Education programmes.
He served as Associate Dean of the School’s Executive MBA and co-designed
EMBA-Global, a dual degree programme with New York’s Columbia Business
School. He is a leading expert in system dynamics and strategic modelling.
His publications include numerous journal articles and three co-edited books.
He is a recipient of the Jay Wright Forrester Award of the System Dynamics
Society for his work on bounded rationality, information feedback and
behavioural decision-making in models of the firm. He is a Past President of
the Society and one of its Founding Members. He has led applied research
projects for international organisations including Royal Dutch/Shell, AT&T,
BBC World Service, Cummins Engine Company, Harley-Davidson, Ericsson,
McKinsey & Co and Mars.
40
Connect with John:

Buy today from your favourite bookshop and online at
Like what you’ve read here? Then get yourself a copy of Strategic Modelling and Business Dynamics
•Understand the system of strategic modelling
•Learn how to accurately model dynamic system
•Study industry examples and public sector applications
•Construct mental models and consider model validity