strategic business rules for business process … · information flow model a business ... lead to...
TRANSCRIPT
See discussions, stats, and author profiles for this publication at: https://www.researchgate.net/publication/269610971
Strategic business rules for business process intelligence : An oracle
prototype
Article · January 2014
DOI: 10.14419/jacst.v3i1.2258
CITATIONS
0
READS
12
1 author:
Rajeev Kaula
Missouri State University
24 PUBLICATIONS 96 CITATIONS
SEE PROFILE
All content following this page was uploaded by Rajeev Kaula on 16 November 2015.
The user has requested enhancement of the downloaded file.
Journal of Advanced Computer Science & Technology, 3 (1) (2014) 90-100
©Science Publishing Corporation
www.sciencepubco.com/index.php/JACST doi: 10.14419/jacst.v3i1.2258
Research Paper
Strategic business rules for business process intelligence
: An oracle prototype
Rajeev Kaula
Computer Information Systems Department Missouri State University 901 South National Ave. Springfield, USA
*Corresponding author E-mail: [email protected]
Copyright © 2014 Rajeev Kaula. This is an open access article distributed under the Creative Commons Attribution License, which permits unrestricted use,
distribution, and reproduction in any medium, provided the original work is properly cited.
Abstract
Business process intelligence aims to provide timely information to improve business process effectiveness and align it
with business objectives in order to compete successfully in the marketplace. Generally such information not only
improves an organizations ability to accomplish business objectives, but may also lead to the identification of
information that could facilitate competitive advantage. This paper outlines an approach to develop an information flow
model that involves the specification of activity dimensions during business process modeling to develop dimensional
models to identify process metrics through strategic business rules that aligns a business process with business
objectives. The paper illustrates the concepts through a marketing business process Lead to forecast prototype which is
implemented in Oracle’s PL/SQL language.
Keywords: Business Intelligence, Business Process, Business Process Metrics, Business Process Intelligence, Business Rules.
1. Introduction
Business process intelligence deals with the application of business intelligence concepts toward business operations to
improve their effectiveness, besides aligning them with business objectives. Business intelligence (BI) in general is a
collection of tools and methodologies that transform the raw data that companies collect from their various operations
into useable and actionable information [5], [7], [16], [17], [23]. Generally such information has assisted organizations
in (i) discovering strategic and tactical trends and opportunities through data mining and predictive analytics [12], [30],
and (ii) improving the performance of their business processes to increase organizational effectiveness [6], [9], [20],
[21], [31].
Even though the use of BI in discovering strategic and tactical trends has gained a lot of attention, the utilization of BI
concepts to enhance business processes intelligence is still in evolution [9], [10], [11], [19], [4]. As an organization is a
collection of business processes, enhancing business process intelligence not only improves an organizations ability to
accomplish business objectives, but may also lead to the identification of information that could facilitate competitive
advantage. One approach involves (i) modeling of process information to understand the extent of information utilized
during business process activities, and then (ii) outline business rules that can facilitate business process alignment with
business objectives. Business process intelligence derived business rules can collectively provide the measurements that
will enable an organization to improve its strategic position in the marketplace.
Modeling of information for business intelligence is generally perceived from the perspective of developing a data
warehouse model in the form of associated star schema. Even though modeling of information for star schema is
important as it allows the organization to make sense of data and unlock the information that is useful and relevant to
the business process, such modeling is simply a snapshot on some aspect of the business process. Since business
process activities are flow-oriented, it is important to model business information in a way that provides fluidity in
process operations from an analytical standpoint, thereby resulting in dynamic alignment with business objectives.
Business rules represent the encoded knowledge of a company's business practices [13], [25]. From a business
intelligence perspective, business rules can also facilitate automatic interpretation of data and specification of
purposeful key performance indicators (KPIs), besides suggesting problem remedies [3]. Business rules by definition

Journal of Advanced Computer Science & Technology 91
are typically expressed declaratively in condition-action terminology represented as IF condition THEN action format a
condition is some constraint, while the action clause reflects the decision or advice. Fig. 1 shows an example of a
business rule that describes a set of constraints applicable for approving a loan application.
Fig.1: Sample Business Rule
There have been attempts toward utilization of business rules for business process intelligence [2], [8], [22]. However
these approaches tie business rules to measures that are defined a priori through existing policies without much
emphasis on database analysis. In general these approaches try to develop business process metrics and then express
them through business rules. A complementary approach could be to utilize the data warehouse dimensional modeling
approaches like star schema [1], [14], [15], [16], [24], [26], and [32] to identify business rules which can then assist in
the development of process metrics. Since dimensional models measure the use of information by a business process,
such an approach would make the business process analysis more responsive to business process objectives.
This paper outlines an approach to (i) develop an information flow model that involves the specification of activity
dimensions during business process modeling, and then (ii) utilize activity dimensions to develop dimensional models
like star schema to focus on process metrics through strategic business rules that align a business process with business
objectives. The paper illustrates the concepts through an adaptation of Oracle E-Business Suite Lead to forecast
business process, and is implemented with Oracle’s PL/SQL language. Modeling for business process intelligence is
reviewed now, followed by information flow modeling concepts and the methodology to transform star schema into
strategic business rules for process metrics and alignment with business objectives.
2. Review of business process intelligence modeling
There have been three approaches towards utilization of BI in business process modeling. The first approach focuses on
either (i) using BI concepts toward dynamic process performance evaluation [27] or (ii) analyze BPMS execution logs
to improve the quality of business processes [11]. This approach applies BI analytics to the whole business process
model instead of focusing on associating analytics with individual business process activities.
The second approach emphasizes analytics with selected business process activities within the modeling process [4]. It
shows reference to analytic information during business process modeling as a way to incorporate BI. The approach is
short on implementation details on how to perform analytics.
The third approach focuses on utilizing BI to reduce redundant specifications of recurrent business functions when
modeling business processes [28]. It fosters reuse of business function specifications and helps to improve the quality
and comparability of business process models.
3. Information flow model
A business process model reflects how a business process works including how information and control are propagated.
An information flow model on the other hand is a graphical representation of the "flow" of information through the
process activities. Information flow modeling is valuable because it provides a basis for distinguishing data
dependencies, control dependencies and artificially imposed implementation dependencies, which in turn, can lead
toward flow optimization, identification of bottlenecks, finding locations for insertion of data validation monitors and
opportunities for increased business analysis points [18]. Information flow models can also provide a basis for
developing process intelligence models to improve business process working.
Even though information flow models in general are tied to business applications, they can also be modified to illustrate
the flow of information among the stages (activities) of a business process. Fig. 2 shows a generic outline of an
information flow model.
An information flow model (as shown in Fig. 2) will consist of (i) process entities with activity dimension attributes,
and (ii) four categories of information flows. Process entities represent collection of information that is of relevance to a
business process activity from an analytical standpoint and represent the factors that influence a business process
performance.
The information flow categories are as follows:
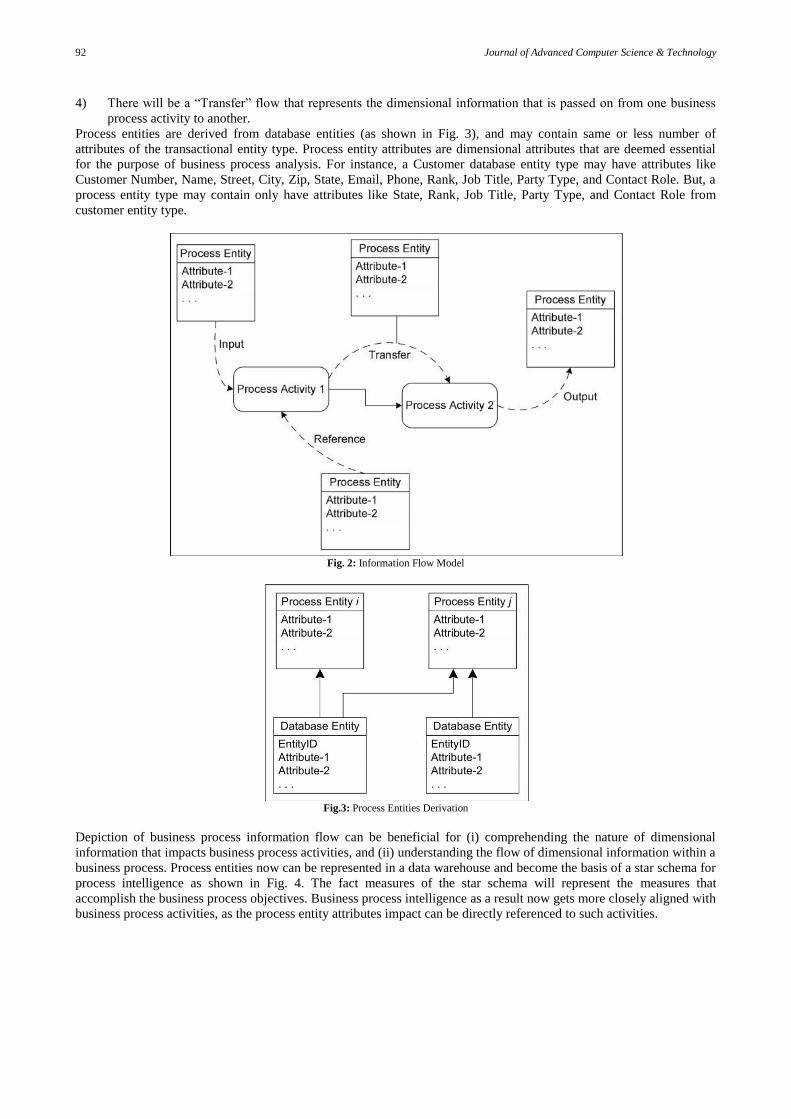
1) There will be an “Input” flow that represents the dimensional information that flows into the business process.
2) There will be an “Output” flow that represents the dimensional information that flows out from the business
process.
3) There will be a “Reference” flow that represents some additional dimensional information that may be needed to
complete a business process activity.
92 Journal of Advanced Computer Science & Technology
4) There will be a “Transfer” flow that represents the dimensional information that is passed on from one business
process activity to another.
Process entities are derived from database entities (as shown in Fig. 3), and may contain same or less number of
attributes of the transactional entity type. Process entity attributes are dimensional attributes that are deemed essential
for the purpose of business process analysis. For instance, a Customer database entity type may have attributes like
Customer Number, Name, Street, City, Zip, State, Email, Phone, Rank, Job Title, Party Type, and Contact Role. But, a
process entity type may contain only have attributes like State, Rank, Job Title, Party Type, and Contact Role from
customer entity type.
Fig. 2: Information Flow Model
Fig.3: Process Entities Derivation
Depiction of business process information flow can be beneficial for (i) comprehending the nature of dimensional
information that impacts business process activities, and (ii) understanding the flow of dimensional information within a
business process. Process entities now can be represented in a data warehouse and become the basis of a star schema for
process intelligence as shown in Fig. 4. The fact measures of the star schema will represent the measures that
accomplish the business process objectives. Business process intelligence as a result now gets more closely aligned with
business process activities, as the process entity attributes impact can be directly referenced to such activities.

Journal of Advanced Computer Science & Technology 93
Fig.4: Process Entities Based Dimensional Model
Fig. 5 shows an example of an information flow model adapted from Oracle’s Lead to forecast business process. The
Lead to forecast business process model diagram is a simplification of business process as supported by Oracle E-
Business Suite (ERP) software. It can be categorized into three stages: (i) generate sales lead, (ii) convert lead to
opportunity, and (iii) opportunity to forecast.
Fig.5: Information Flow Model for Lead to Forecast Business Process Model
Generate sales lead is the initial activity that commences when a sales representative receives a call from a customer
contact requesting the need for further assistance before placing an order. The details about a lead are recorded by the
software automating the process, and a lead number is generated. Once the tasks associated with the lead have been
completed and recorded, the sales representative assesses the lead potential and records the probability of the sale being
accomplished. This moves the recorded lead to the next stage in the process where it is transformed into a sales
opportunity. As the sales opportunity materializes, the software automating the process provides the ability to further
transform the status of the opportunity to a forecast.
At the surface level the information flow model may seem similar to data flow models. However, the information flow
model avoids some of the key tenets of data flow models like decomposition, leveling and data stores. Each process
entity is simply a collection of attributes that can be utilized for performing business process intelligence. It should be
94 Journal of Advanced Computer Science & Technology
something that a business process user can easily recognize and consider as a way to evaluate the efficacy of the
business process.
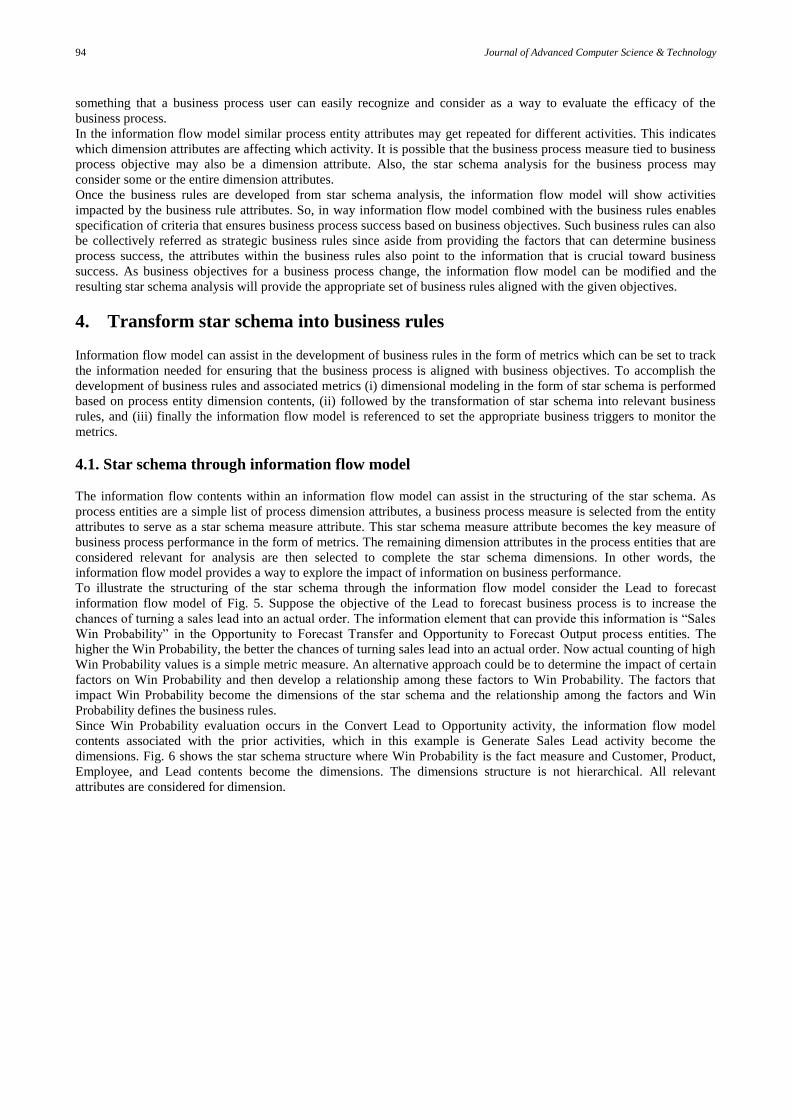
In the information flow model similar process entity attributes may get repeated for different activities. This indicates
which dimension attributes are affecting which activity. It is possible that the business process measure tied to business
process objective may also be a dimension attribute. Also, the star schema analysis for the business process may
consider some or the entire dimension attributes.
Once the business rules are developed from star schema analysis, the information flow model will show activities
impacted by the business rule attributes. So, in way information flow model combined with the business rules enables
specification of criteria that ensures business process success based on business objectives. Such business rules can also
be collectively referred as strategic business rules since aside from providing the factors that can determine business
process success, the attributes within the business rules also point to the information that is crucial toward business
success. As business objectives for a business process change, the information flow model can be modified and the
resulting star schema analysis will provide the appropriate set of business rules aligned with the given objectives.
4. Transform star schema into business rules
Information flow model can assist in the development of business rules in the form of metrics which can be set to track
the information needed for ensuring that the business process is aligned with business objectives. To accomplish the
development of business rules and associated metrics (i) dimensional modeling in the form of star schema is performed
based on process entity dimension contents, (ii) followed by the transformation of star schema into relevant business
rules, and (iii) finally the information flow model is referenced to set the appropriate business triggers to monitor the
metrics.
4.1. Star schema through information flow model
The information flow contents within an information flow model can assist in the structuring of the star schema. As
process entities are a simple list of process dimension attributes, a business process measure is selected from the entity
attributes to serve as a star schema measure attribute. This star schema measure attribute becomes the key measure of
business process performance in the form of metrics. The remaining dimension attributes in the process entities that are
considered relevant for analysis are then selected to complete the star schema dimensions. In other words, the
information flow model provides a way to explore the impact of information on business performance.
To illustrate the structuring of the star schema through the information flow model consider the Lead to forecast
information flow model of Fig. 5. Suppose the objective of the Lead to forecast business process is to increase the
chances of turning a sales lead into an actual order. The information element that can provide this information is “Sales
Win Probability” in the Opportunity to Forecast Transfer and Opportunity to Forecast Output process entities. The
higher the Win Probability, the better the chances of turning sales lead into an actual order. Now actual counting of high
Win Probability values is a simple metric measure. An alternative approach could be to determine the impact of certain
factors on Win Probability and then develop a relationship among these factors to Win Probability. The factors that
impact Win Probability become the dimensions of the star schema and the relationship among the factors and Win
Probability defines the business rules.
Since Win Probability evaluation occurs in the Convert Lead to Opportunity activity, the information flow model
contents associated with the prior activities, which in this example is Generate Sales Lead activity become the
dimensions. Fig. 6 shows the star schema structure where Win Probability is the fact measure and Customer, Product,
Employee, and Lead contents become the dimensions. The dimensions structure is not hierarchical. All relevant
attributes are considered for dimension.

Journal of Advanced Computer Science & Technology 95
Fig.6: Lead to Forecast Business Process Star Schema
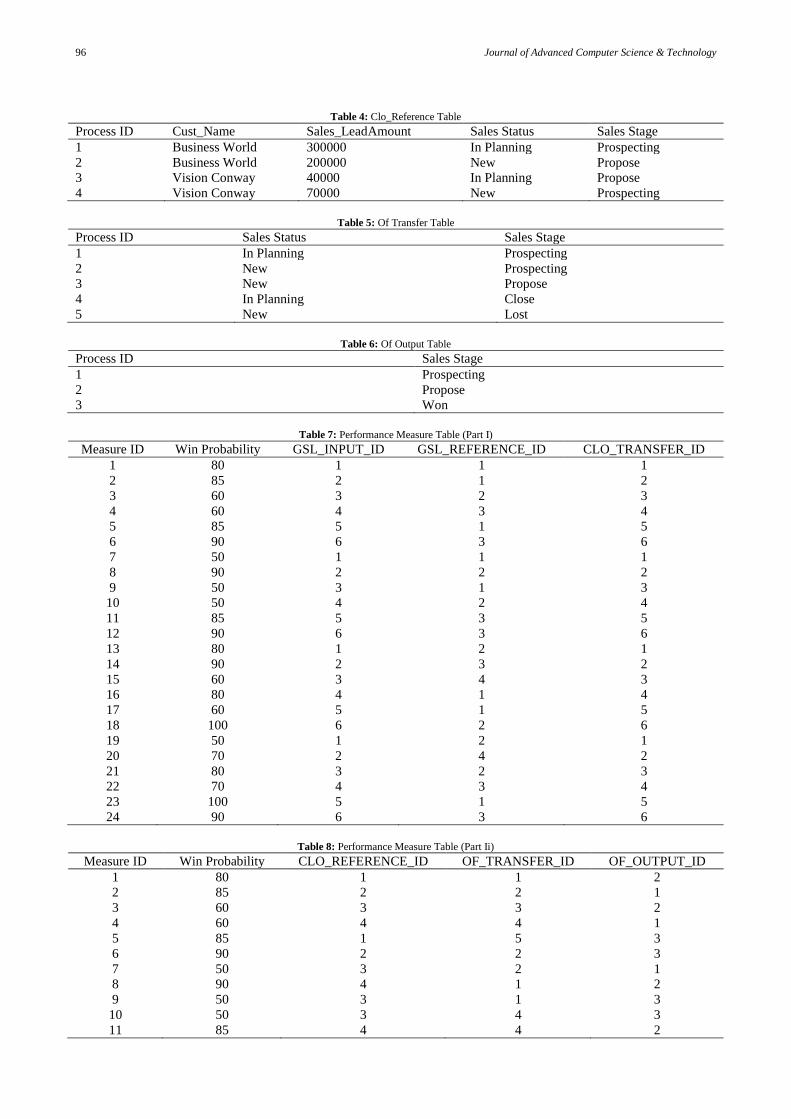
The table structure of the above dimensions and fact measures are listed from Table 1 through Table 8 as follows:
Table 1: Gsl_Input Table
Process ID Cust_PartyType Cust_Name Cust_ContactRole Cust_State
1 Organization Business World Functional User CA
2 Organization Business World Executive CA
3 Organization Vision Conway Functional User CA
4 Person Vision Conway Middle Manager CA
5 Organization Business World Functional User NY
6 Person Vision Conway Middle Manager CA
Table 2: Gsl_Reference Table
Process ID Prod Description Prod Category Empl_Name Empl_Region
1 Sentinel Deluxe Desktop Desktop Charles Taylor CA
2 Windows Handheld Handheld Joe Manchin CA
3 iPad Tablet Terry Govern NY
Table 3: Clo_Transfer Table
Process ID Sales_LeadAmount Sales_LeadRank Sales_TimeFrame Sales Channel
1 200000 Cold Lead One Week Direct
2 200000 Hot Lead Two Week Indirect
3 50000 Medium Lead One Month Direct
4 50000 Hot Lead One Week Indirect
5 500000 Cold Lead One Month Direct
6 500000 Hot Lead Two Week Direct
96 Journal of Advanced Computer Science & Technology
Table 4: Clo_Reference Table
Process ID Cust_Name Sales_LeadAmount Sales Status Sales Stage
1 Business World 300000 In Planning Prospecting
2 Business World 200000 New Propose
3 Vision Conway 40000 In Planning Propose
4 Vision Conway 70000 New Prospecting
Table 5: Of Transfer Table
Process ID Sales Status Sales Stage
1 In Planning Prospecting
2 New Prospecting
3 New Propose
4 In Planning Close
5 New Lost
Table 6: Of Output Table
Process ID Sales Stage
1 Prospecting
2 Propose
3 Won
Table 7: Performance Measure Table (Part I)
Measure ID Win Probability GSL_INPUT_ID GSL_REFERENCE_ID CLO_TRANSFER_ID
1 80 1 1 1
2 85 2 1 2
3 60 3 2 3
4 60 4 3 4
5 85 5 1 5
6 90 6 3 6
7 50 1 1 1
8 90 2 2 2
9 50 3 1 3
10 50 4 2 4
11 85 5 3 5
12 90 6 3 6
13 80 1 2 1
14 90 2 3 2
15 60 3 4 3
16 80 4 1 4
17 60 5 1 5
18 100 6 2 6
19 50 1 2 1
20 70 2 4 2
21 80 3 2 3
22 70 4 3 4
23 100 5 1 5
24 90 6 3 6
Table 8: Performance Measure Table (Part Ii)
Measure ID Win Probability CLO_REFERENCE_ID OF_TRANSFER_ID OF_OUTPUT_ID
1 80 1 1 2
2 85 2 2 1
3 60 3 3 2
4 60 4 4 1
5 85 1 5 3
6 90 2 2 3
7 50 3 2 1
8 90 4 1 2
9 50 3 1 3
10 50 3 4 3
11 85 4 4 2

Journal of Advanced Computer Science & Technology 97
Measure ID Win Probability CLO_REFERENCE_ID OF_TRANSFER_ID OF_OUTPUT_ID
12 90 1 3 1
13 80 1 3 2
14 90 2 5 3
15 60 3 5 2
16 80 1 2 3
17 60 3 3 1
18 100 4 4 1
19 50 1 3 2
20 70 3 5 3
21 80 3 1 3
22 70 1 3 2
23 100 2 2 1
24 90 2 5 2
4.2. Transform star schema into business rules
Once the star schema is queried, the specific dimension data elements (or factors) that affect Win Probability can be
identified. The relationship of these dimensions data elements (or factors) with Win Probability fact measure is then
expressed through business rules. The logic of developing business rules based on star schema query is shown in Fig. 7.
Fig.7: Business Rules Logic
The logic is implemented through a PL/SQL database procedure. The implementation is PC based. Key features of the
logic are as follows:
1) SQL queries (part of logic step 1) are developed. For example, two queries are provided that list dimension
attributes for Win Probability greater than 70 and greater or equal to 80.
a) Select gsl_input.cust_partytype, gsl_input.cust_contactrole, prod_category,
sales_leadrank,sales_channel,clo_reference.sales_status as clo_stat, clo_reference.sales_stage as clo_stage,
of_transfer.sales_status as oft_stat,of_transfer.sales_stage as oft_stage, of_output.sales_stage as ofo_stage.
From performance_measure, gsl_input, gsl_reference, clo_transfer, clo_reference, of_transfer,of_output

98 Journal of Advanced Computer Science & Technology
Where performance_measure.gsl_input_id = gsl_input.processid and
performance_measure.gsl_reference_id = gsl_reference.processid and
performance_measure.clo_transfer_id = clo_transfer.processid and
performance_measure.clo_reference_id = clo_reference.processid and
performance_measure.of_transfer_id = of_transfer.processid and
performance_measure.of_output_id = of_output.processid and
winprobability > 70;
b) Select gsl_input.cust_partytype, gsl_input.cust_contactrole, prod_category,
sales_leadrank,sales_channel,clo_reference.sales_status as clo_stat, clo_reference.sales_stage as clo_stage,
of_transfer.sales_status as oft_stat,of_transfer.sales_stage as oft_stage, of_output.sales_stage as ofo_stage.
From performance_measure, gsl_input, gsl_reference, clo_transfer, clo_reference, of_transfer,of_output
Where performance_measure.gsl_input_id = gsl_input.processid and
performance_measure.gsl_reference_id = gsl_reference.processid and
performance_measure.clo_transfer_id = clo_transfer.processid and
performance_measure.clo_reference_id = clo_reference.processid and
performance_measure.of_transfer_id = of_transfer.processid and
performance_measure.of_output_id = of_output.processid and
winprobability >= 80;
2) Once the queries are executed, the procedure counts the instances of each attribute in the query; if the count for an
attribute is more than 50% then that attribute does have strong influence over the metric measure (part of logic
steps 2 through 4).
3) To express each attribute that has high count to become part of the IF clause of a business rule (part of logic step
5).
The dimension data element factors that influence Win Probability vary depending on the nature of success probability.
Fig. 8 shows instances of dimension factors that impact Win Probability greater than 70 or 80.
Fig.8: Dimension Factors affecting Win Probability
Win Probability is the performance measure. Now, once the dimension factors that influence the Win Probability
performance measure have been identified, the relationship among the dimension factor values and the Win Probability
measure can be expressed as a business rule wherein the IF constraint represents the dimensional factor values, while

Journal of Advanced Computer Science & Technology 99
the THEN action represents the fact (Win Probability) performance measure value. The following are two instances of
business rules resulting from the execution of the PL/SQL procedure.
Business Rule 1:
IF Party Type = Organization AND
Sales Channel = Direct AND
Lead Rank = Hot Lead AND
CLO Reference Sales Status = New AND
CLO Reference Sales Stage = Prospecting AND
OF Transfer Sales Status = New
THEN Win Probability > 70
Business Rule 2:
IF Party Type = Organization AND
Sales Channel = Direct AND
Lead Rank = Hot Lead AND
CLO Reference Sales Status = New AND
CLO Reference Sales Stage = Prospecting AND
OF Transfer Sales Status = New AND
OF Transfer Sales Stage = Prospecting
THEN Win Probability >= 80
The implementation is limited to one procedure to illustrate the efficacy of the concept. It is possible to have other
procedures either for another Win Probability success measure value or for some other key metric measure like Win
Probability. These procedures can generate additional business rules for the same metric measure with different success
factors or similar rules for other metric measures. In general the business rules should be consistent with the star schema
structure.
4.3. Develop business process performance metric
Once the business rules have been defined, a business intelligence performance metric based on Win Probability can be
developed. In this metric, the dimension factor values can be used as a gauge to determine whether the Win Probability
will be high enough to convert a lead into actual sales. Generally business intelligence applications utilize dashboards to
show key performance indicators (KPI) that are relevant to a particular objective or a business process [18, 29]. These
KPIs are often tied to business metrics. In this context, a KPI can be developed that shows the progress toward turning
the sales lead into an actual order through the Win Probability metric based on the business rule specification. The KPI
can show how the changes in the business rules specified dimension factor values are influencing the Win Probability
chances. In other words, the dashboard can track the IF constraints values, and based on the business rules indicate the
Win Probability status.
Once the business metric is developed, the information flow model can also assist in identifying the process activity that
will raise alert with respect to business triggers to monitor specific information content. For example if there are too
many Medium Lead (Lead Rank) which result in lowering the Win Probability then the Convert Lead to Opportunity
process activity can advise the salesperson to either forgo the Lead or ensure such Lead Ranks are not entertained.
Similarly other triggers can be established that will check on information and raise alert as needed (for example triggers
to alert if the customer is about to cancel business with the company).
5. Conclusions
Business intelligence is all about improving performance and decision making within an organization. By presenting
meaningful information to the right people at the right time the quality of decision as well as their timeliness can be
improved. As organizations focus on making smart and intelligent decisions to compete successfully, a key aspect of
proper business intelligence deployment is the alignment of business metrics with business goals from top to bottom
across functional areas.
This paper provides an approach to develop business process operational intelligence through business process
performance metrics. Unlike the existing approaches [2], [8], [22], the proposed approach utilizes the information flow
model to develop the data warehouse repository for outlining strategic business rules to measure business process
operational intelligence. As business process performance metrics is an essential part of any BI based operational
performance management system, use of multi-dimensional modeling to develop business rules and consequent metrics
may result in more dynamic monitoring of business process operations.
Further research is ongoing to enhance the approach by embedding more complexity in the analysis of dimensional
model for business rules specification as a way to improve metrics specification. These enhancements can be in the
form of (i) analysis on two or more performance measures within the same star schema including the impact such
performance measures have on each other, and (ii) analysis from the perspective of family of separate star schemas or

100 Journal of Advanced Computer Science & Technology
constellation schema [24] wherein multiple performance measures may share similar dimensions across different
business processes.
References
[1] R. Agrawal, A. Gupta, and S. Sarawagi, “Modeling Multidimensional Databases,” Proceedings of the Thirteenth International Conference on
Data Engineering, Birmingham, UK, 1997, pp. 232 - 243. [2] F. Arigliano, P. Ceravolo, C. Fugazza and D. Storelli, “Business Metrics Discovery by Business Rules,” in M. D. Lytras, J. M. Carroll, E.
Damiani (editors), Emerging Technologies and Information Systems for the Knowledge Society: Lecture Notes in Computer Science, vol.
5288, 2008, pp. 395-402, [3] R. Blasum “Business Rules and Business Intelligence,” Information Management Magazine, April 2007.
[4] T. Bucher, A. Gericke, and S. Sigg, “Process-centric business intelligence”, Business Process Management Journal, vol. 15, no. 3, 2009, pp. 408 - 429
[5] W. F. Cody, J. T. Kreulen, V. Krishna, and W. S Spangler, “The integration of business intelligence and knowledge management,” IBM
Systems Journal, vol. 41, no. 4, 2002, pp. 697-713. [6] U. Dayal, K. Wilkinson, A. Simitsis, and M. Castellanos, “Business Processes Meet Operational Business Intelligence,” Bulletin of the
Technical Committee on Data Engineering, vol. 32, no. 3, 2009, pp. 35-41.
[7] U. Dayal, M. Castellanos, A. Simitsis, and K. Wilkinson, “Data integration flows for business intelligence” Proceedings of the 12th International Conference on Extending Database Technology: Advances in Database Technology, Saint Petersburg, Russia, 2009, pp. 1-11,.
[8] T. Debevoise, Process Management with a Business Rules Approach: Implementing The Service Oriented Architecture, Roanoke: Business
Knowledge Architects, 2005. [9] M. Z. Elbashira, P. A. Collierb, and M. J. Davernb, “Measuring the effects of business intelligence systems: The relationship between business
process and organizational performance,” International Journal of Accounting Information Systems, vol. 9, no. 3, 2008, pp. 135-153.
[10] M. Golfarelli, S. Rizzi, and I. Cella, “Beyond data warehousing: what's next in business intelligence?” Proceedings of the 7th ACM international workshop on Data warehousing and OLAP, Washington, DC, USA, 2004, pp. 1-6.
[11] D. Grigoria, F. Casatib, M. Castellanosb, U. Dayal, M. Sayalb, M. Shanb “Business Process Intelligence” Computers in Industry, Volume 53,
Issue 3, April 2004, pp. 321–343. [12] J. F. Hair Jr, “Knowledge creation in marketing: the role of predictive analytics”, European Business Review, vol. 19, no. 4, 2007, pp.303-315
[13] B.V. Halle, Business Rules Applied, New York, NY: John Wiley & Sons, 2002.
[14] R. Kaula, “Business Rules for Data Warehouse,” World Academy of Science, Engineering and Technology, vol. 35, 2009, pp. 951-959. [15] R. Kimball and M. Ross, the Data Warehouse Toolkit: The Complete Guide to Dimensional Modeling, New York: John Wiley & Sons, 2002.
[16] R. Kimball, M. Ross, W. Thornthwaite, J. Mundy, and B. Becker, The Data Warehouse Lifecycle Toolkit, New York: John Wiley and Sons,
2008. [17] R. Kimball and M. Ross, The Kimball Group Reader: Relentlessly Practical Tools for Data Warehousing and Business Intelligence, New
York: Wiley Publishing, 2010.
[18] D. Loshin, Business Intelligence: The Savvy Manager’s Guide, San Francisco: Morgan Kaufman, 2013. [19] O. Marjanovic, “The Next Stage of Operational Business Intelligence: Creating New Challenges for Business Process Management,”
Proceedings of the 40th Annual Hawaii International Conference on System Sciences, Honolulu, HI, USA, 2007, pp. 215c-215c.
[20] O. Marjanovic, “Business Value Creation through Business Processes Management and Operational Business Intelligence Integration,” 43rd Hawaii International Conference on System Sciences (HICSS), Honolulu, HI, USA, 2010, pp. 1-10.
[21] L. Marshall and R. de la Harpe, “Decision making in the context of business intelligence and data quality,” South African Journal of
Information Management, vol. 11, no. 2, 2009, pp. 1-15. [22] M. Mircea and A. Andreescu, “Using Business Rules in Business Intelligence” Journal of Applied Quantitative Methods, vol. 4, no. 3, 2009,
pp. 382-393.
[23] C. M. Olszak and E. Ziemba, “Approach to Building and Implementing Business Intelligence Systems,” Interdisciplinary Journal of Information, Knowledge, and Management, vol. 2, 2007, pp. 135-148.
[24] P. Ponniah, Data Warehousing Fundamentals for IT Professionals (2nd Edition), New York: John Wiley & Sons, 2010.
[25] R. Ross, Principles of the Business Rule Approach, Boston: Addison-Wesley, 2003. [26] A. Sen and A. Sinha, “A comparison of data warehousing methodologies,” Communications of the ACM, vol. 48, no. 3, 2005, pp. 79-84.
[27] W. Tan, J.W. Shen, L. Xu, B. Zhou, L. Li “A Business Process Intelligence System for Enterprise Process Performance Management” IEEE
Transactions on Systems, Man, and Cybernetics, vol. 38, no. 6, 2008, pp. 745-756. [28] L. H. Thom, M. Reichert, C. M. Chiao, C. Iochpe and G. N. Hess “Inventing Less, Reusing More, and Adding Intelligence to Business
Process Modeling” in S.S. Bhowmick, J. Küng, R. Wagner (editors), Database and Expert Systems Applications: Book Series Title: Lecture
Notes in Computer Science, vol. 5181, 2008, pp. 837-850. [29] E. Turban, R. Sharda, J.E. Aronson, and D. King, Business Intelligence: A Managerial Approach, Upper Saddle River: Prentice-Hall, 2008.
[30] H.J. Watson, and B.H. Wixom, “The Current State of Business Intelligence” Computer, vol. 40, no. 9, 2007, pp. 96-99.
[31] L. Wise, “Linking Business Intelligence and Business Process Management,” Information Management Online, February 2008. [32] R. Wrembel and C. Koncilia, Data warehouses and OLAP: concepts, architectures, and solutions, Hershey: Idea Group Inc., 2007.
View publication statsView publication stats