strategic assessment of incentives
TRANSCRIPT

ii
Prepared for Business Oregon July 2021
E l l e n H a r p e l
Strategic Assessment of Incentives

1
Acknowledgments
Ellen Harpel and Smart Incentives offer appreciation for the inputs and guidance provided by Business Oregon and many economic development stakeholders and partners throughout the research and information gathering process. This report especially benefited from the insights and expertise of Art Fish, Business Incentives Coordinator and project manager for the Strategic Assessment of Incentives. We would also like to thank all the members of the project steering group and the Business Oregon leadership team for their support and commitment to this project.
2
ACKNOWLEDGMENTS ...................................................................................................................................... 1
EXECUTIVE SUMMARY ..................................................................................................................................... 3
INTRODUCTION ............................................................................................................................................... 4
ALIGNMENT BETWEEN BUSINESS DEVELOPMENT INCENTIVES AND ECONOMIC DEVELOPMENT PRIORITIES ........ 4
STRATEGIC PLAN PRIORITIES .............................................................................................................................................. 5 BUSINESS DEVELOPMENT INCENTIVES ................................................................................................................................. 6 STAKEHOLDER PERSPECTIVES ON INCENTIVE ALIGNMENT WITH STRATEGIC PLAN PRIORITIES ........................................................... 9 GAPS, DATA SHORTCOMINGS, AND OPPORTUNITIES FOR IMPROVEMENT .................................................................................. 10
BENCHMARKING ............................................................................................................................................ 11
SUMMARY COMMENTARY BY STATE .................................................................................................................................. 11 CONTEXT AND STRATEGIC USE OF INCENTIVES ACROSS STATES................................................................................................ 13 FINDINGS AND TAKEAWAYS ............................................................................................................................................. 19
INCENTIVE PROGRAM EFFECTIVENESS AND EFFICIENCY ................................................................................... 21
DATA TO TELL THE STORY OF HOW INCENTIVES ADVANCE ECONOMIC OPPORTUNITY FOR UNDERREPRESENTED PEOPLE ...................... 21 REEXAMINING STRATEGIC RESERVE FUND PROCEDURES AND CRITERIA TO SERVE INTENDED RECIPIENTS AND THE STATE OF OREGON MORE
EFFICIENTLY. ................................................................................................................................................................ 23 NEW WAYS TO PRESENT OR MARKET INCENTIVE PROGRAMS TO BUSINESSES AND LOCAL PARTNERS ............................................... 24 MANAGING INCENTIVES FOR TRANSPARENCY AND ACCOUNTABILITY ....................................................................................... 25
RECOMMENDATIONS ..................................................................................................................................... 27
PREPARE TO ADAPT THE INCENTIVES TOOLKIT TO A CHANGING ECONOMIC AND COMPETITIVE ENVIRONMENT ................................. 27 SOLIDIFY AND AUGMENT DATA GATHERING AND SYSTEMS ..................................................................................................... 32 COMPREHENSIVELY IMPROVE THE ABILITY TO COMMUNICATE AND TELL THE STORY OF OREGON’S INCENTIVES AS A JOINT UNDERTAKING
AMONG THE AGENCY, PARTNERS, AND INCENTIVE PARTICIPANTS ............................................................................................ 36
CONCLUSION ................................................................................................................................................. 41

3
Executive Summary This Strategic Assessment of Incentives analyzes how a set of current business development incentives advances the five priorities in “Prosperity for All Oregonians – Business Oregon Strategic Plan, 2018-2022.” The assessment’s three components – alignment between business development incentives and economic development priorities, benchmarking of incentive programs in competitor states, and review of incentive program effectiveness and efficiency – help address the question of “What could be done differently” within these incentive programs to accomplish the strategic plan’s priorities and enhance Oregon’s competitiveness.
• Enterprise Zone Exemption (Standard Program, affecting property tax)
• Long-term Rural Enterprise Zone Facility (LTREZ, property tax)
• Strategic Investment Program (SIP, property tax)
• Oregon Investment Advantage (OIA, state income tax)
• Governor’s Strategic Reserve Fund (SRF, lottery funds)
• Business Expansion Program (BEP, part of SRF appropriation)
These incentive programs were created prior to 2018 and were not explicitly addressed in
Business Oregon’s 2018-22 strategic plan, so that the question of where they fit naturally arises.
The assessment found that business development incentives “likely” or “possibly” or “partially”
support the priorities to (1) grow small and middle-market companies, (2) advance economic
opportunity for underrepresented people, and (3) ensure transparency, but new data sources or
analytical methods are needed to better evaluate the extent and nature of their impact. This
assessment also found that the incentives are largely designed to (4) cultivate rural economic
stability but as configured do not help (5) innovate Oregon’s economy.
Just as Business Oregon is striving to understand how its legacy business development
incentive programs align with current priorities, so are stakeholders, businesses, and local
partners. Recommendations emphasize finding better ways and systems to demonstrate how the
incentives are used strategically to benefit Oregon businesses, residents, and communities.
Interviews and a comparison to other states also indicated possible approaches to improve their
strategic and competitive use. The research and findings from this report will be a critical input as
the agency embarks on development of its next strategic plan.
1. Prepare to adapt the incentives toolkit to a changing economic and competitive environment.
2. Solidify and augment data gathering and systems.
a. Pursue special data collection practices to help describe the extent to which incentives
are helping small and middle-market companies, rural communities, and
underrepresented people.
b. Further systematize incentive program data collection and management methods and
dedicate resources for a sustainable monitoring and reporting solution.
3. Comprehensively improve the ability to communicate and tell the story of Oregon’s incentives as a joint undertaking among the agency, partners, and incentive participants.
a. Supplement annual reports and transactional information with scheduled assessments
of the longer-run outcomes associated with incentivized activities.
b. Develop new ways to present and market incentive programs, so that businesses and
local agency partners use the incentives toolkit wisely and more effectively.
4
Introduction This Strategic Assessment of Incentives addresses how a set of current business development incentives advances the five priorities outlined in “Prosperity for All Oregonians – Business Oregon Strategic Plan, 2018-2022,” and what could be done differently to accomplish the strategic plan’s priorities and enhance Oregon’s competitiveness. The assessment was organized around the following three analyses (with month of completion) as presented in the next three sections of this report, followed by a general discussion of recommendations and then conclusions.
• Alignment between business development incentives and economic development priorities (February 2021)
• Benchmarking incentive programs in competitor states (April 2021)
• Review of incentive program effectiveness and efficiency (June 2021)
The business development incentives that are the subject of the assessment are:
• Enterprise Zone Exemption (Standard Program, affecting property tax)
• Long-term Rural Enterprise Zone Facility (LTREZ, property tax)
• Strategic Investment Program (SIP, property tax)
• Oregon Investment Advantage (OIA, state income tax)
• Governor’s Strategic Reserve Fund (SRF, lottery funds)
• Business Expansion Program (BEP, part of SRF appropriation)
Business Oregon’s Business Incentive Coordinator served as project manager for the assessment. An 11-member steering group provided ongoing guidance and feedback throughout the project, and 26 staff and stakeholder interviews were conducted (Appendix 1).
The summary narratives prepared at the end of each project phase make up the body of the next three major sections of this report. Recommendations were developed at the conclusion of the third phase and reviewed with the project manager, steering group, and Business Oregon leadership.
Alignment between business development incentives and economic development priorities This section summarizes the analysis of the alignment between existing business development incentives and strategic plan priorities plus findings from stakeholder interviews. The analysis is based on a concise logic model outlining the purpose, inputs, outputs and expected short-, medium- and long-term benefits for each incentive program. The logic models demonstrate how each incentive is intended to work, including anticipated outputs and results that might align with the strategic plan priorities. The logic model exercise combined with a review of statutes, guidelines, procedures, and data on program usage helped indicate specific ways each incentive
5
program supports or could support each priority. Linkages among incentives, priorities, and potential metrics are mapped out for each incentive program. A discussion on gaps, data shortcomings, and opportunities for improvement concludes the analysis of each program. The full analytical presentation, including logic models and program mapping to metrics, is provided in Appendix 2, and the stakeholder interview protocol is included in Appendix 1.
Strategic plan priorities Business Oregon’s mission is to “invest in Oregon’s businesses, communities, and people to promote a globally competitive, diverse, and inclusive economy.” The strategic plan describes agency priorities, strategies to impact those priorities, and actions to carry out the strategies. Following are summaries of the five strategic plan priorities.
1. Innovate Oregon’s economy – Elevate state investments in innovation to grow Oregon’s economy. Provide the business case and develop the roadmap to significantly expand research and development and technology innovation in Oregon. Strategies include expanding Oregon’s R&D capacity and increasing access to capital for high-growth startups.
2. Grow small and middle-market companies – Prioritize business development efforts that scale existing small- and medium-sized companies. Target Business Oregon’s tools and programs toward existing companies best positioned to grow and create quality, accessible jobs. Strategies include increasing access to new markets, enhancing competitiveness of manufacturing companies, attracting businesses and investment to grow target industries, and prioritizing infrastructure investments that directly promote business growth.
3. Cultivate rural economic stability – Build local economic development capacity in distressed rural communities. Focus agency resources to better help prioritize investments and achieve new economic outcomes. Strategies include enhancing economic development capacity, promoting an environment that supports entrepreneurship and small business growth including non-traded sector companies in business development, and connecting rural communities to urban markets through targeted infrastructure investments.
4. Advance economic opportunity for underrepresented people – Explicitly commit to equitable outcomes for communities of color, immigrants, native and tribal populations, and other traditionally underrepresented people. Prioritize investments that counter systemic barriers to economic opportunity. Strategies include connecting people to jobs and fostering wealth creation for underrepresented populations.
5. Ensure an inclusive, transparent and fiscally healthy agency – Strategies include being transparent, accountable and a good steward of public resources; being a sustainable and cohesive agency where all employees feel valued and understand how they contribute to the mission; and being a welcoming agency that empowers employees and is inclusive of Oregon’s cultural diversity.
6
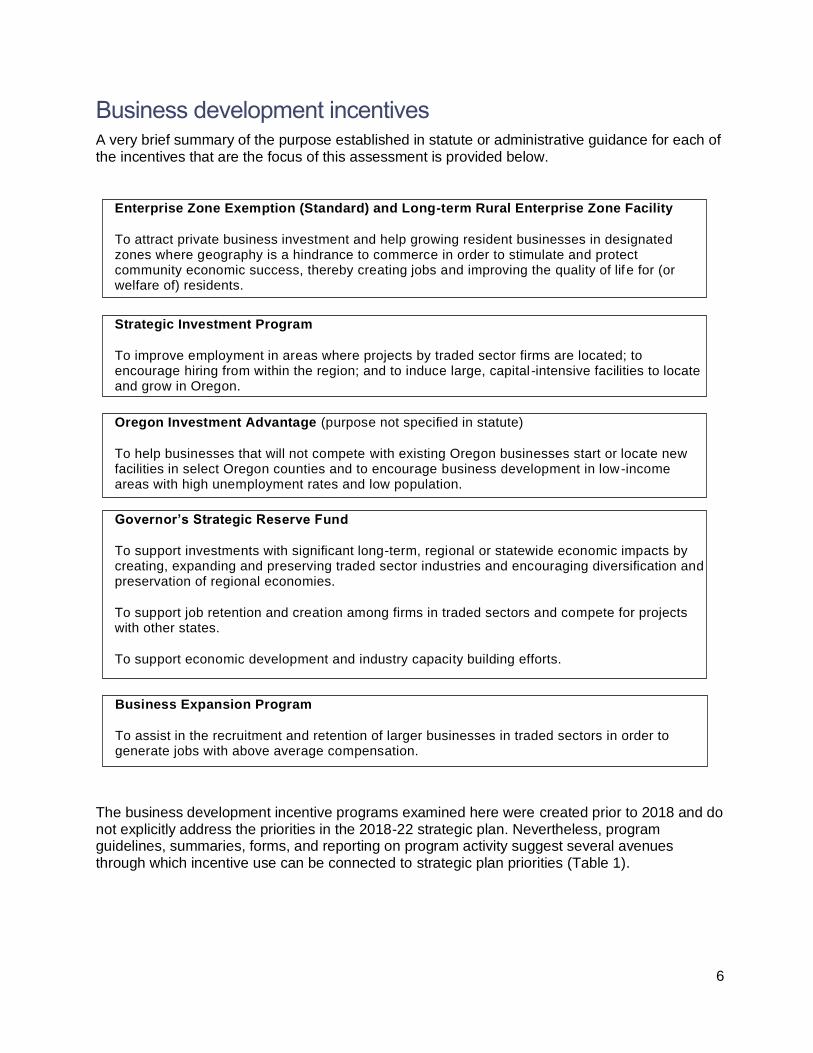
Business development incentives A very brief summary of the purpose established in statute or administrative guidance for each of the incentives that are the focus of this assessment is provided below.
The business development incentive programs examined here were created prior to 2018 and do not explicitly address the priorities in the 2018-22 strategic plan. Nevertheless, program guidelines, summaries, forms, and reporting on program activity suggest several avenues through which incentive use can be connected to strategic plan priorities (Table 1).
Enterprise Zone Exemption (Standard) and Long-term Rural Enterprise Zone Facility
To attract private business investment and help growing resident businesses in designated zones where geography is a hindrance to commerce in order to stimulate and protect community economic success, thereby creating jobs and improving the quality of life for (or welfare of) residents.
Strategic Investment Program
To improve employment in areas where projects by traded sector firms are located; to encourage hiring from within the region; and to induce large, capital -intensive facilities to locate and grow in Oregon.
Oregon Investment Advantage (purpose not specified in statute)
To help businesses that will not compete with existing Oregon businesses start or locate new facilities in select Oregon counties and to encourage business development in low-income areas with high unemployment rates and low population.
Governor’s Strategic Reserve Fund
To support investments with significant long-term, regional or statewide economic impacts by creating, expanding and preserving traded sector industries and encouraging diversification and preservation of regional economies.
To support job retention and creation among firms in traded sectors and compete for projects with other states.
To support economic development and industry capacity building efforts.
Business Expansion Program
To assist in the recruitment and retention of larger businesses in traded sectors in order to generate jobs with above average compensation.

7
Table 1. Match between Incentive Programs and Strategic Plan Priorities
Innovate Oregon’s Economy
Grow Small
and Middle-market
Companies
Cultivate Rural Economic Stability
Advance Economic
Opportunity for Underrepresented
People
Ensure an Inclusive,
Transparent and Fiscally
Healthy Agency
Enterprise Zone
Exemption (Standard Program)
No Likely Yes Possibly Yes
Long-term Rural Enterprise Zone Facility
No Possibly Yes Possibly Partial
Strategic Investment Program
No No Yes Possibly Yes
Oregon
Investment Advantage
Possibly Possibly Yes Possibly Partial
Governor’s
Strategic Reserve Fund
Possibly Possibly Possibly Possibly Partial
Business Expansion Program
No Possibly Unlikely Possibly Partial
Advanced program implementation practices and data collection procedures to allow reporting on relevant metrics would theoretically better establish the proposed linkages to strategic plan priorities in Table 1. The term “likely” means that the program rules and/or data on past use of the incentive suggest that there is a good chance the incentive is supporting this priority, but more analysis is needed to be sure. The term “possibly” means that either the program rules indicate that the incentive could be used to support the priority or that insufficient data is currently available to determine whether the incentive is supporting the priority. The term “partial” generally means more information could be collected and reported to provide a more complete picture of activity and outcomes. The full set of explanations and options for each incentive is provided in Appendix 2. A few illustrative examples are provided here.
The Enterprise Zone (EZ) program (standard) may, in practice, help to grow
Oregon small and middle-market companies.
The incentive is meant to support growing businesses, and during the 2019–21 biennium, 66% of businesses using the program were already operating in that particular zone and obligated to increase their employment; others would be startups or already Oregon-based but with operations new to that zone. The majority of these firms are clearly manufacturers or classifiable as small and medium-sized enterprises. The program’s investment and employment thresholds mean growing small and medium-sized companies would be eligible. It may be possible to track and report on the number or percentage of recipients that are small or middle-market companies
8
depending on the definition of these terms and availability of additional research capacity to verify company size.
Strategies and actions within this priority to assist small and middle-market companies also include helping manufacturers purchase equipment and connecting businesses to workforce partners who can serve those manufacturers. Additional metrics that would indicate EZ support for this priority therefore include the total investment made by small and middle-market recipients in eligible real and personal property and the number or percentage of recipients that are manufacturers.
Oregon Investment Advantage (OIA) and the Governor’s Strategic Reserve Fund (SRF) have the potential to help innovate Oregon’s economy.
OIA is intended to assist operations that are the “first of their kind” in Oregon as well as businesses that do not compete with existing, local Oregon businesses. This suggests the potential, if not the intent, to support innovation and increase access to capital for startups. The program does not appear to have been used for this purpose to date. SRF project descriptions suggest that some offers have increased access to capital for startups.
The strategies and actions within the priority to innovate Oregon’s economy include ensuring investments support target industries and sectors lacking access to capital. It may be possible to track the number of recipients, projects, and resulting benefits associated with incentives provided to companies in Oregon’s targeted industries and sectors. There may be the opportunity to track the number or percentage of recipients that are Oregon- based businesses and/or were once startups that have since grown to the point to which they have become eligible for these incentives. There may be a good story to tell about how these homegrown businesses have developed over time with support from Business Oregon.
All incentive programs have the potential to advance economic opportunity
for underrepresented people.
Participating businesses may be minority-owned and their employees may include people of color, immigrant populations, and individuals from native and tribal communities, but there is no program data to determine if this is the case, and such data collection is not a requirement of programs users. Nevertheless, in a few local enterprise zone programs and with SRF/BEP awards, businesses are subject to relevant public benefit conditions.
There may be an opportunity to request information on these metrics from recipient companies in some programs. For example, some companies may already report some or all of this information on their Equal Employment Opportunity Commission filings and may be willing to share this data to demonstrate commitment to the state’s priority. If sought out, relevant data may be available about hiring related to the First Source Hiring Agreements (FSHA) needed with EZ, SIP, SRF and BEP projects. Obtaining FSHA data may require substantial engagement with the Oregon Employment Department, either in relation to agreements themselves or assistance to businesses provided by Employer Services. Incentive programs that include additional local conditions or public benefits agreements may also enable access to relevant data from recipients or with local governments in the case of EZs & SIP.
9
While these options exist, it remains to be seen whether they are practical and cost-effective. There may be legal or other barriers to obtaining demographic data on employees. Companies may have the information but may not wish to share it if they are not required to do so. Collecting, processing and reporting data related to this priority in a careful manner across multiple programs may require resources beyond what Business Oregon is able to commit. That said, if data and research capacity were to be available, reporting aggregated data program- wide (rather than company by company) should indicate progress toward the priority.
Stakeholder perspectives on incentive alignment with strategic plan priorities Smart Incentives conducted 14 interviews in December 2020 with stakeholders recommended by the project steering group. The interviewees represented individuals with knowledge of the Business Oregon incentive portfolio who would share their perspective on how well the incentives work and their perceived effect on the state’s economic competitiveness. The steering group strived to include individuals from urban and rural parts of the state, people representing different political perspectives and interests, members of state and local government, and professionals engaged in various aspects of the incentive process. Stakeholders were asked a series of questions about their familiarity with the strategic plan and individual incentive programs, thoughts on how well the programs work, challenges and opportunities for improving the programs, and the type of transparency and reporting that would be most useful to them.
Among the top findings from the interviews:
• Most interviewees were vaguely aware of the Business Oregon strategic plan and were generally supportive of the priorities. That said, most of the interviewees talked more about the importance of supporting businesses in traded sectors and priorities related to small business survival and the economic response to COVID-19.
• The interviewees largely focused their remarks on the Enterprise Zone, Long-term Rural Enterprise Zone and Strategic Investment Program. They offered little comment on SRF, BEP, and OIA unless asked specifically about those programs. Several also provided unsolicited praise for Business Oregon’s infrastructure financing programs.
• In response to a question about how well the business development incentives worked to support the strategic priorities, most stated that they generally think this set of incentives works well for what they were intended, but they did not believe they were beneficial for supporting innovation and they were often perceived as a poor match for small and medium enterprises and businesses with owners who are black, indigenous or people of color. Some expressed concern that they were not suitable for assisting existing Oregon businesses.
• Interviewees tended to see incentives as one small piece of the economic development puzzle. That is, incentives were not perceived as the only path to successful economic development in Oregon. The stakeholders generally agreed that the incentives are not substantial enough in most case to be able to fundamentally move the needle on corporate investment decisions – and they were fine with that. However, some
10
interviewees expressed concern that this approach to incentives might need to change as Oregon’s tax and regulatory environment becomes more costly.
• Complexity and communication are perceived as a challenge. One interviewee stressed that the incentive programs could be presented and marketed more clearly and effectively while not detracting from careful management and reporting. Several saw the opportunity for Business Oregon to do more to help communities use the incentives more strategically and take advantage of the flexibility built into the programs. Overall, many interviewees conveyed the opinion that deeper partnerships and more communication with communities would be valuable. The comments were less about “selling” incentives than about helping partners use the incentives toolkit wisely in support of economic development objectives.
• Interviewees shared dozens of ideas on what they would like to see from incentive reporting. In general, there appeared to be satisfaction with current reporting on transactions and compliance results, which may itself be a substantial and valuable accomplishment by Business Oregon in collaboration with county assessors and other local partners. However, they also expressed a strong desire for storytelling and long-term metrics that better describe what the incentives have helped Oregon achieve for its economy, businesses, and residents.
Gaps, data shortcomings, and opportunities for improvement The priority alignment analysis revealed three primary gaps and opportunities for improvement.
1. There are several opportunities across incentive programs to enhance or supplement reporting to provide a more complete picture of the long-term benefits of incentivized activity to the Oregon economy, to rural Oregon specifically, and for residents. This type of analysis and reporting would require additional, dedicated resources (time and money) and a commitment to supplement data collection procedures. While this review demonstrates that many data collection and reporting options are technically possible, the value of those exercises must be weighed against the implementation costs to Business Oregon.
2. Business Oregon already works to enhance local economic development capacity with occasional incentive-related trainings (lately webinars), which are infrequent and limited to providing information, but could with greater resources be more regular and instructional. Stakeholder interviews suggest that local organizations may also benefit from assistance on strategic approaches to incentives that would help communities use and market the programs and better link their incentive use to other economic development initiatives.
3. Some of the programs are complex to administer and to communicate. There could be an opportunity administratively (e.g., SRF) and/or through legislation to streamline procedures and align or simplify requirements to improve the processes within select programs for Business Oregon, local partners, and recipient firms.
11
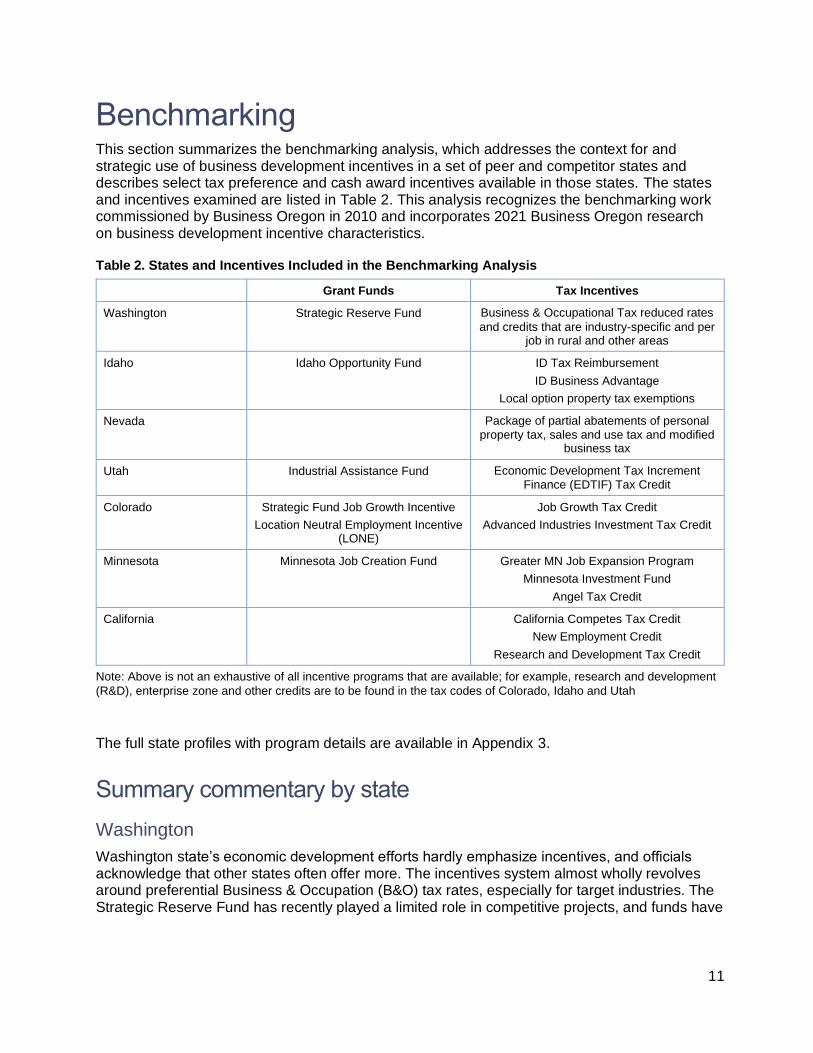
Benchmarking This section summarizes the benchmarking analysis, which addresses the context for and strategic use of business development incentives in a set of peer and competitor states and describes select tax preference and cash award incentives available in those states. The states and incentives examined are listed in Table 2. This analysis recognizes the benchmarking work commissioned by Business Oregon in 2010 and incorporates 2021 Business Oregon research on business development incentive characteristics.
Table 2. States and Incentives Included in the Benchmarking Analysis
Grant Funds Tax Incentives
Washington Strategic Reserve Fund Business & Occupational Tax reduced rates
and credits that are industry-specific and per job in rural and other areas
Idaho Idaho Opportunity Fund ID Tax Reimbursement
ID Business Advantage
Local option property tax exemptions
Nevada Package of partial abatements of personal property tax, sales and use tax and modified
business tax
Utah Industrial Assistance Fund Economic Development Tax Increment Finance (EDTIF) Tax Credit
Colorado Strategic Fund Job Growth Incentive
Location Neutral Employment Incentive (LONE)
Job Growth Tax Credit
Advanced Industries Investment Tax Credit
Minnesota Minnesota Job Creation Fund Greater MN Job Expansion Program
Minnesota Investment Fund
Angel Tax Credit
California California Competes Tax Credit
New Employment Credit
Research and Development Tax Credit
Note: Above is not an exhaustive of all incentive programs that are available; for example, research and development
(R&D), enterprise zone and other credits are to be found in the tax codes of Colorado, Idaho and Utah
The full state profiles with program details are available in Appendix 3.
Summary commentary by state
Washington
Washington state’s economic development efforts hardly emphasize incentives, and officials acknowledge that other states often offer more. The incentives system almost wholly revolves around preferential Business & Occupation (B&O) tax rates, especially for target industries. The Strategic Reserve Fund has recently played a limited role in competitive projects, and funds have
12
been diverted for other purposes. Like Nevada, Washington does not have corporate or personal income taxes, but sales or other tax liabilities can still be significant.
Idaho
Incentives are a rather prominent aspect of Idaho’s economic development activities. Idaho’s marquee incentive program is the Tax Reimbursement Incentive; though back-end and performance-based, it is a refundable tax credit that can generate significant cash flows over time for businesses (up to 30% of a business’s tax contributions in Idaho over several years, comparable to Utah’s EDTIF). That cash flow will look competitive in the 10-year net present value (NPV) models frequently used by site location consultants. The Opportunity Fund exists on paper but does not appear to be active recently. The use of job-based or other grant incentives has evidently subsided in Idaho, but other income tax credits remain, as well as allowances for local property tax abatement.
Nevada
Nevada has moved toward statutory tax abatement programs and away from cash-based assistance in recent years. The abatements require approval and are typically bundled, performance-based, and have relatively low eligibility thresholds (e.g., 10 new jobs in rural areas, as opposed to 50 for urban, and only 6 for rural expansions). The condition that each requisite new job receive at least the statewide average wage ($24.16 per hour) may be a barrier to projects in rural areas, and uniquely among the states reviewed, Nevada specifically requires 65% employer-paid health insurance plan as a condition of receiving incentives. Though lacking corporate or personal income taxes, other business taxes in Nevada do appear to be significant.
Utah
As a strategic priority, Utah highlights the use of sustainable incentives to attract and keep high paying jobs and provide public benefit. The state’s marquee incentive program (Economic Development Tax Increment Financing - EDTIF) remains well-regarded as a refundable tax credit based on a portion of several taxes that the new project will pay over a number of years. In addition, Utah has a robust set of targeted rural initiatives and is clearly attempting to seed entrepreneurial activity in rural areas, along with traditional relocation/expansion incentives, although the effectiveness of these efforts is unclear. EDTIF is also available to help rural counties by not having a minimum job creation requirement and basing the average wage threshold on the county average as opposed to statewide average. Conventional tax credits and other grant funds are also available.
Colorado
Colorado has a substantial slate of incentives, as well as other programs, and it is one of two states reviewed with an active cash grant program (Strategic Fund Job Growth Incentive). The state emphasizes the importance of “maintaining healthy incentives” while also stating it is able to “offer conservative incentives without diminishing inbound investment.” Despite being a western state, Colorado’s industry mix, especially aerospace & defense, will put it into competition with eastern states, where cash grant programs remain more common as business development incentives. The non-refundable Job Growth Incentive and Advanced Industries Investment Tax Credit are compelling offerings to increase investment. The Advanced Industries tax credit focuses on early-stage tech companies but is scheduled to sunset at the end of FY22.
13
Not unlike Utah, Colorado is also creatively pursuing economic development in rural areas with indeterminate results.
Minnesota
Minnesota likewise has a lengthy list of incentive and business financing programs, which are positioned as business support programs to help companies and communities create and retain jobs. As with Colorado, Minnesota’s cash grant program (Job Creation Fund) may reflect greater exposure to competition with eastern states. There are generally low average wage thresholds to access programs (typically 110 or 120% of federal poverty line for family of four), but programs then require prevailing wage rates during construction by projects receiving larger incentive awards, as approved by state agencies. While property taxes can be high in Minnesota, that would apply only to real estate, in that unlike the other benchmark states, personal property, including heavy machinery & equipment, is exempt in Minnesota.
California
Rarely, if ever, has Oregon’s competing with California amounted to a comparison of incentive offers. California by its sheer size and so forth operates in unique terms, but it does seem to be increasingly (if quietly) aggressive in trying to keep opportunities at home with a notable list of incentives designed to help California businesses to grow. In addition, the Governor’s proposed 2021-22 budget would make a major expansion to the California Competes program, which is notable for its process and criteria to secure public and community benefits from incentivized projects. The proposal (as of March 2021) included $250 million in grants (new) and $180 million for tax credits over two years. The grant program is intended for projects that establish at least 500 net new jobs or make a significant infrastructure investment or receive designation as a strategic priority to the state.
Context and strategic use of incentives across states
Tax setting for incentives
Some state tax incentives are conceived as mitigating or offsetting tax burdens, or other business costs or risks, thereby freeing up capital for investment and operations. Some tax incentives use the estimated taxes paid by companies in different tax categories (depending on the state) to calculate a proportionate incentive to be provided to the company. And if nothing else, tax abatement is often a convenient and effective way to structure inducements for development. In any case, it is helpful to understand the tax structures behind tax incentive use in the benchmark states. The following tables provide summary figures on the relative importance of different types of taxes in the benchmark states.
14
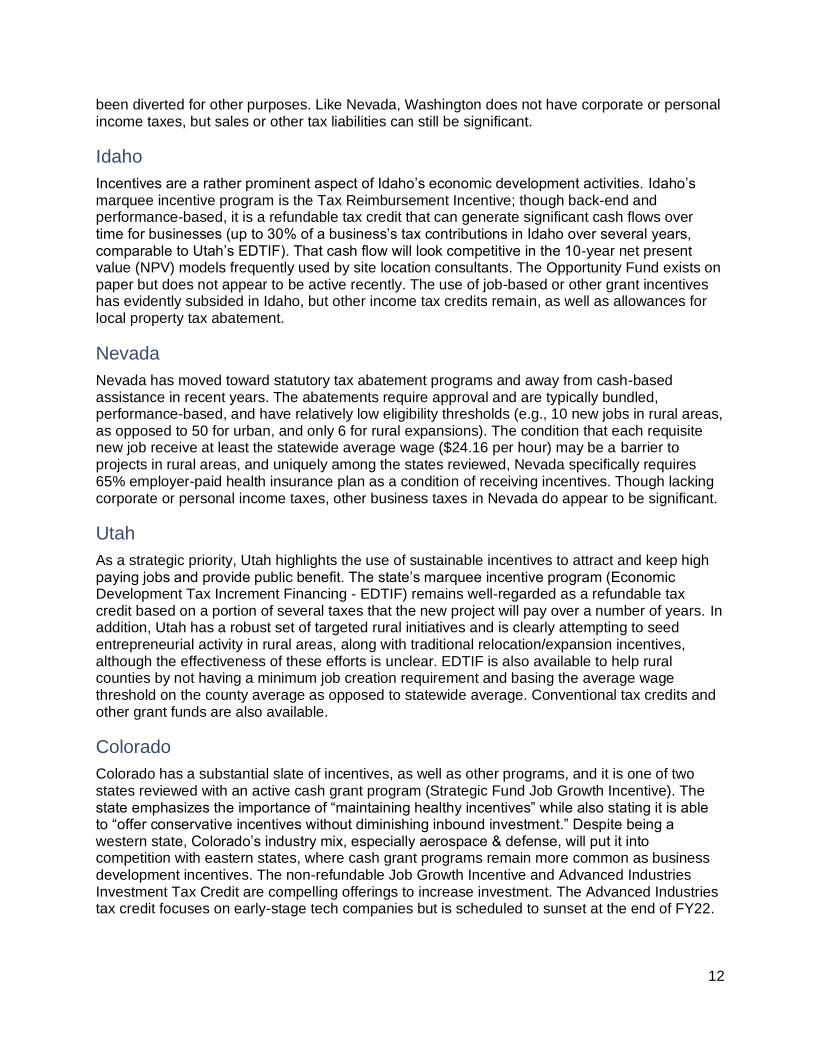
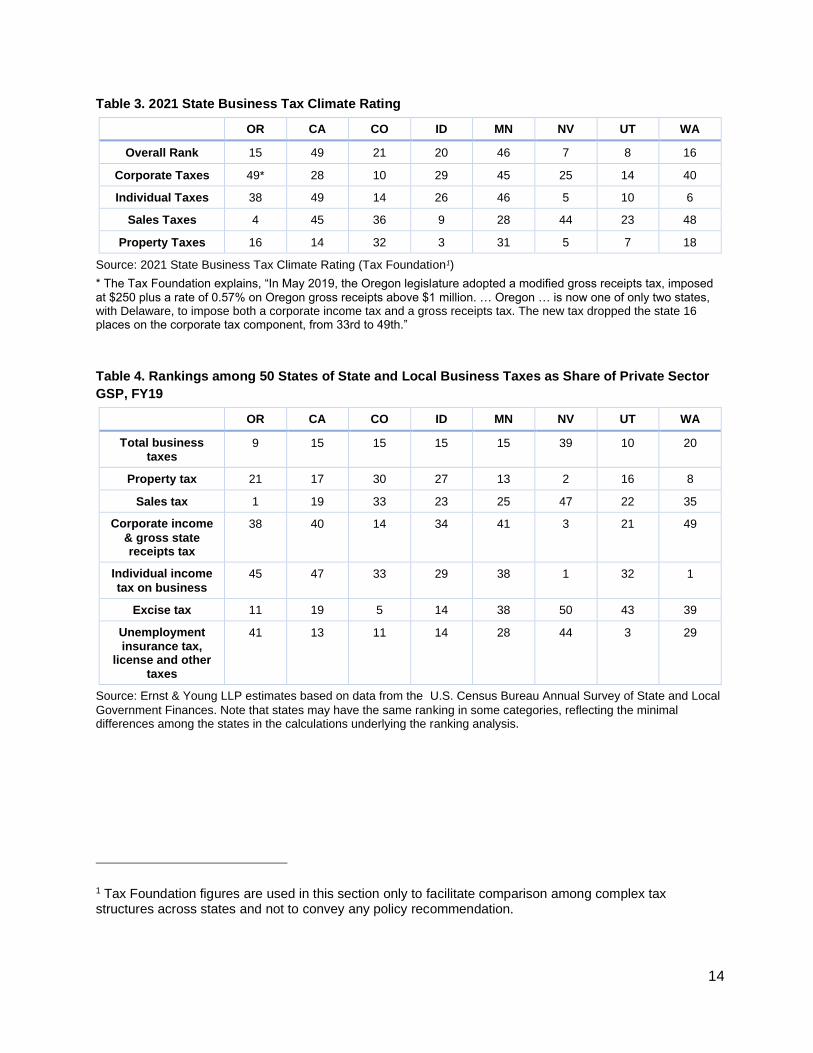
Table 3. 2021 State Business Tax Climate Rating
OR CA CO ID MN NV UT WA
Overall Rank 15 49 21 20 46 7 8 16
Corporate Taxes 49* 28 10 29 45 25 14 40
Individual Taxes 38 49 14 26 46 5 10 6
Sales Taxes 4 45 36 9 28 44 23 48
Property Taxes 16 14 32 3 31 5 7 18
Source: 2021 State Business Tax Climate Rating (Tax Foundation1)
* The Tax Foundation explains, “In May 2019, the Oregon legislature adopted a modified gross receipts tax, imposed at $250 plus a rate of 0.57% on Oregon gross receipts above $1 million. … Oregon … is now one of only two states, with Delaware, to impose both a corporate income tax and a gross receipts tax. The new tax dropped the state 16 places on the corporate tax component, from 33rd to 49th.”
Table 4. Rankings among 50 States of State and Local Business Taxes as Share of Private Sector
GSP, FY19
OR CA CO ID MN NV UT WA
Total business taxes
9 15 15 15 15 39 10 20
Property tax 21 17 30 27 13 2 16 8
Sales tax 1 19 33 23 25 47 22 35
Corporate income
& gross state receipts tax
38 40 14 34 41 3 21 49
Individual income
tax on business 45 47 33 29 38 1 32 1
Excise tax 11 19 5 14 38 50 43 39
Unemployment insurance tax,
license and other taxes
41 13 11 14 28 44 3 29
Source: Ernst & Young LLP estimates based on data from the U.S. Census Bureau Annual Survey of State and Local
Government Finances. Note that states may have the same ranking in some categories, reflecting the minimal differences among the states in the calculations underlying the ranking analysis.
1 Tax Foundation figures are used in this section only to facilitate comparison among complex tax structures across states and not to convey any policy recommendation.
15
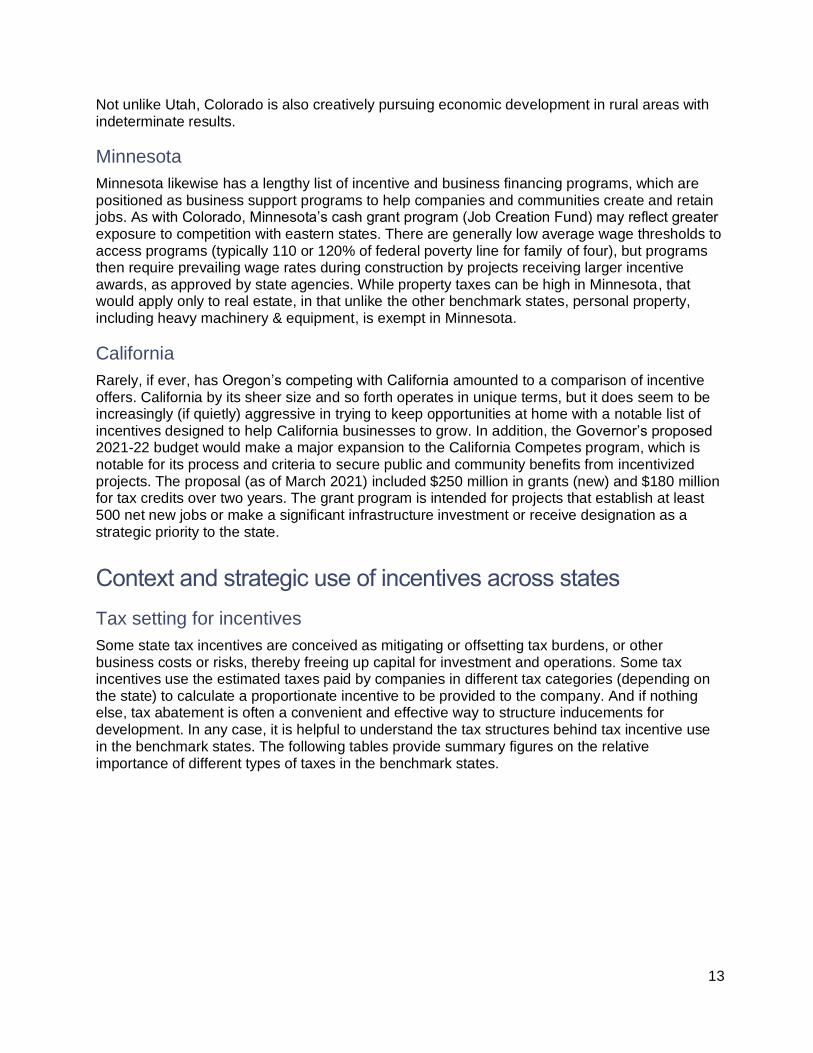
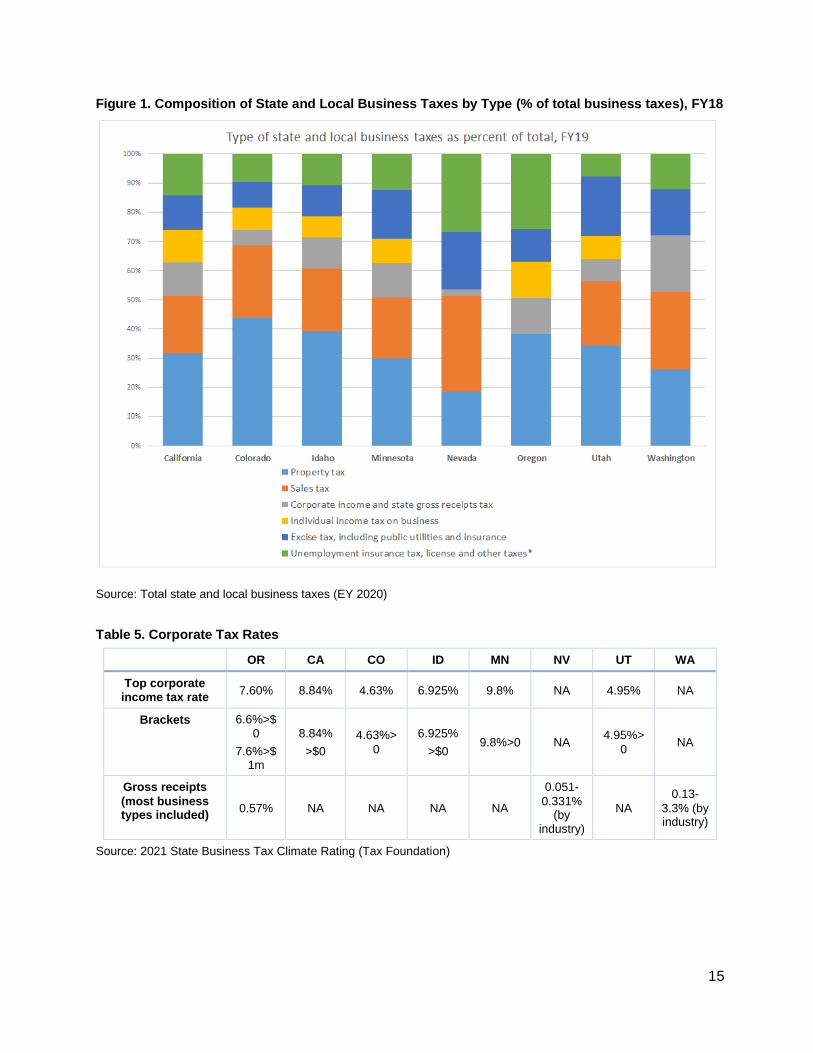
Figure 1. Composition of State and Local Business Taxes by Type (% of total business taxes), FY18
Source: Total state and local business taxes (EY 2020)
Table 5. Corporate Tax Rates
OR CA CO ID MN NV UT WA
Top corporate income tax rate
7.60% 8.84% 4.63% 6.925% 9.8% NA 4.95% NA
Brackets 6.6%>$0
7.6%>$1m
8.84%
>$0
4.63%>
0
6.925%
>$0 9.8%>0 NA
4.95%>
0 NA
Gross receipts
(most business types included)
0.57% NA NA NA NA
0.051-
0.331% (by
industry)
NA
0.13-
3.3% (by industry)
Source: 2021 State Business Tax Climate Rating (Tax Foundation)
16
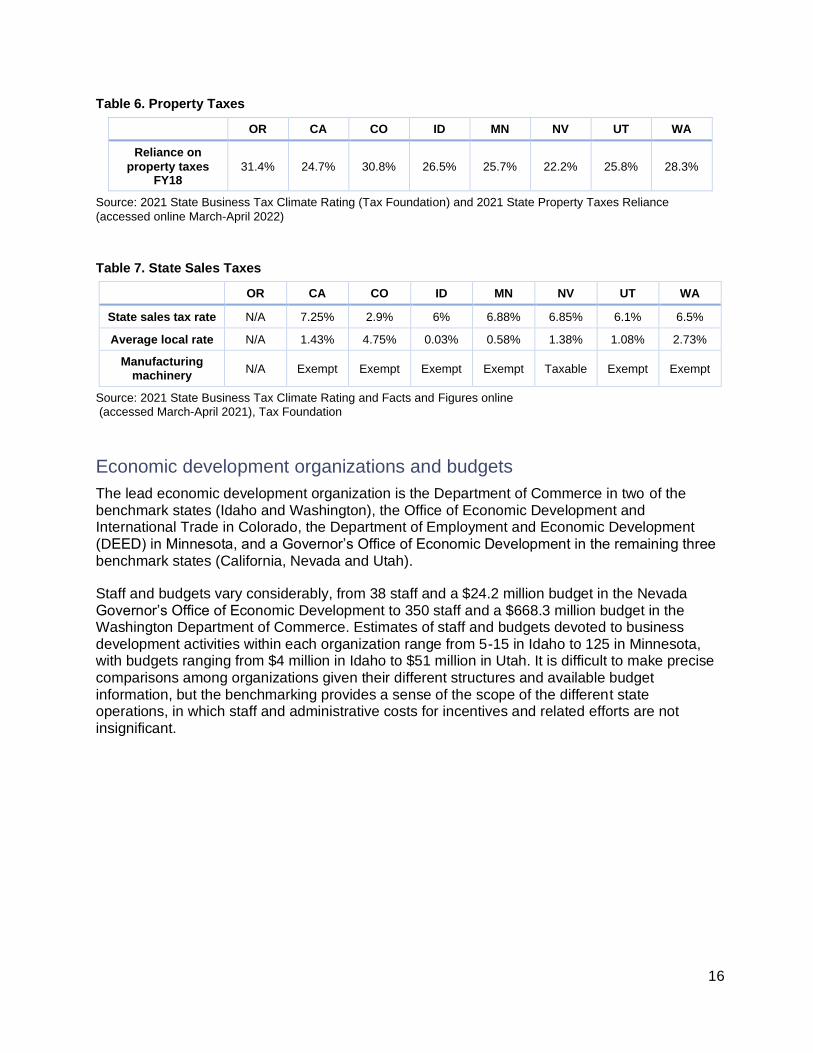
Table 6. Property Taxes
OR CA CO ID MN NV UT WA
Reliance on
property taxes FY18
31.4% 24.7% 30.8% 26.5% 25.7% 22.2% 25.8% 28.3%
Source: 2021 State Business Tax Climate Rating (Tax Foundation) and 2021 State Property Taxes Reliance
(accessed online March-April 2022)
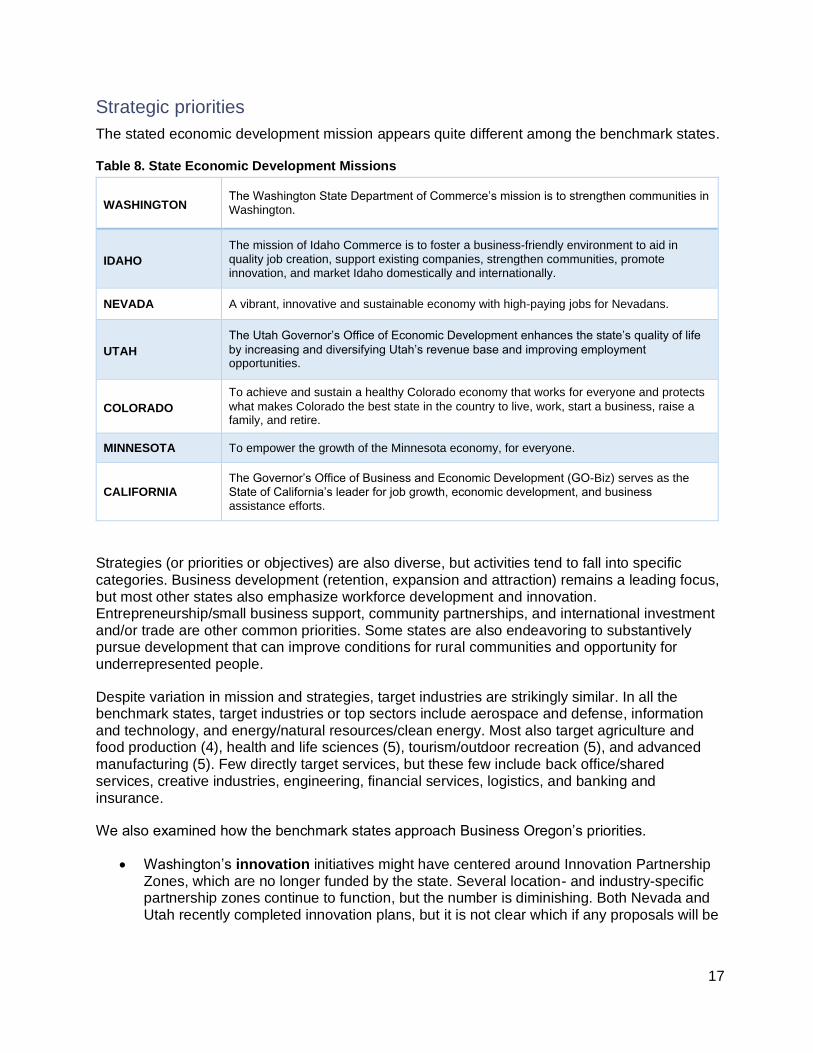
Table 7. State Sales Taxes
OR CA CO ID MN NV UT WA
State sales tax rate N/A 7.25% 2.9% 6% 6.88% 6.85% 6.1% 6.5%
Average local rate N/A 1.43% 4.75% 0.03% 0.58% 1.38% 1.08% 2.73%
Manufacturing machinery
N/A Exempt Exempt Exempt Exempt Taxable Exempt Exempt
Source: 2021 State Business Tax Climate Rating and Facts and Figures online (accessed March-April 2021), Tax Foundation
Economic development organizations and budgets
The lead economic development organization is the Department of Commerce in two of the benchmark states (Idaho and Washington), the Office of Economic Development and International Trade in Colorado, the Department of Employment and Economic Development (DEED) in Minnesota, and a Governor’s Office of Economic Development in the remaining three benchmark states (California, Nevada and Utah).
Staff and budgets vary considerably, from 38 staff and a $24.2 million budget in the Nevada Governor’s Office of Economic Development to 350 staff and a $668.3 million budget in the Washington Department of Commerce. Estimates of staff and budgets devoted to business development activities within each organization range from 5-15 in Idaho to 125 in Minnesota, with budgets ranging from $4 million in Idaho to $51 million in Utah. It is difficult to make precise comparisons among organizations given their different structures and available budget information, but the benchmarking provides a sense of the scope of the different state operations, in which staff and administrative costs for incentives and related efforts are not insignificant.
17
Strategic priorities
The stated economic development mission appears quite different among the benchmark states.
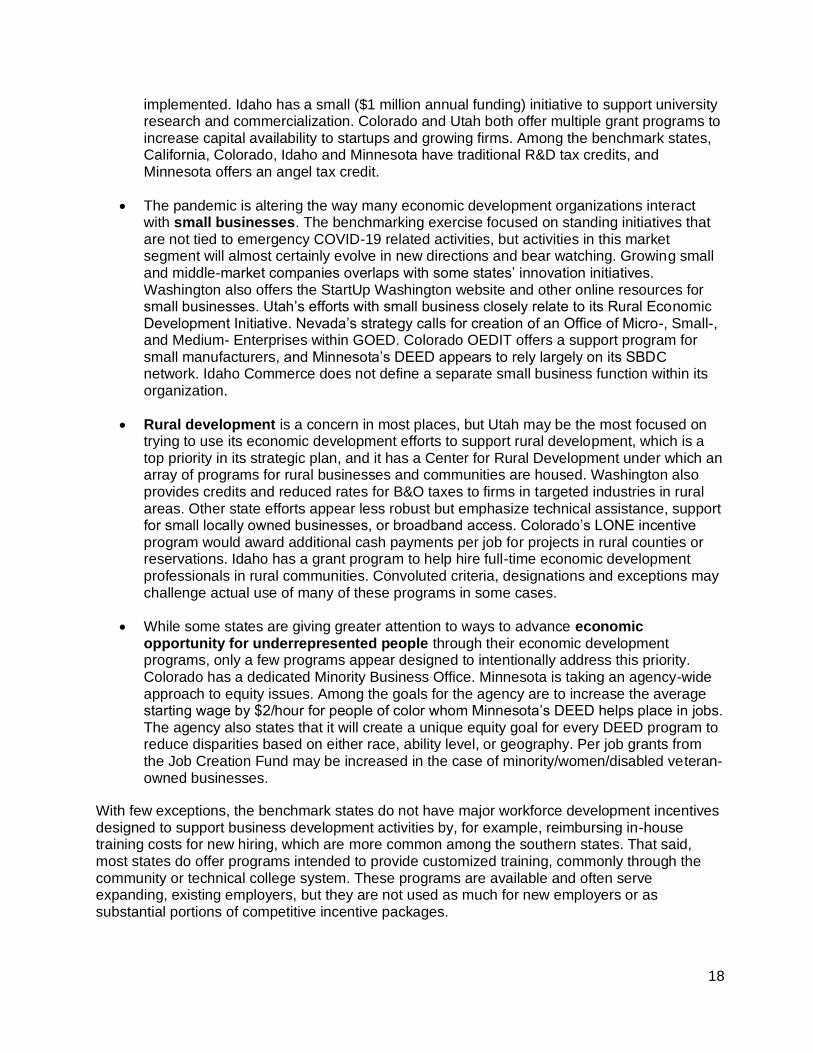
Table 8. State Economic Development Missions
WASHINGTON The Washington State Department of Commerce’s mission is to strengthen communities in Washington.
IDAHO
The mission of Idaho Commerce is to foster a business-friendly environment to aid in quality job creation, support existing companies, strengthen communities, promote innovation, and market Idaho domestically and internationally.
NEVADA A vibrant, innovative and sustainable economy with high-paying jobs for Nevadans.
UTAH
The Utah Governor’s Office of Economic Development enhances the state’s quality of life
by increasing and diversifying Utah’s revenue base and improving employment opportunities.
COLORADO
To achieve and sustain a healthy Colorado economy that works for everyone and protects
what makes Colorado the best state in the country to live, work, start a business, raise a family, and retire.
MINNESOTA To empower the growth of the Minnesota economy, for everyone.
CALIFORNIA The Governor’s Office of Business and Economic Development (GO-Biz) serves as the State of California’s leader for job growth, economic development, and business assistance efforts.
Strategies (or priorities or objectives) are also diverse, but activities tend to fall into specific categories. Business development (retention, expansion and attraction) remains a leading focus, but most other states also emphasize workforce development and innovation. Entrepreneurship/small business support, community partnerships, and international investment and/or trade are other common priorities. Some states are also endeavoring to substantively pursue development that can improve conditions for rural communities and opportunity for underrepresented people.
Despite variation in mission and strategies, target industries are strikingly similar. In all the benchmark states, target industries or top sectors include aerospace and defense, information and technology, and energy/natural resources/clean energy. Most also target agriculture and food production (4), health and life sciences (5), tourism/outdoor recreation (5), and advanced manufacturing (5). Few directly target services, but these few include back office/shared services, creative industries, engineering, financial services, logistics, and banking and insurance.
We also examined how the benchmark states approach Business Oregon’s priorities.
• Washington’s innovation initiatives might have centered around Innovation Partnership Zones, which are no longer funded by the state. Several location- and industry-specific partnership zones continue to function, but the number is diminishing. Both Nevada and Utah recently completed innovation plans, but it is not clear which if any proposals will be
18
implemented. Idaho has a small ($1 million annual funding) initiative to support university research and commercialization. Colorado and Utah both offer multiple grant programs to increase capital availability to startups and growing firms. Among the benchmark states, California, Colorado, Idaho and Minnesota have traditional R&D tax credits, and Minnesota offers an angel tax credit.
• The pandemic is altering the way many economic development organizations interact with small businesses. The benchmarking exercise focused on standing initiatives that are not tied to emergency COVID-19 related activities, but activities in this market segment will almost certainly evolve in new directions and bear watching. Growing small and middle-market companies overlaps with some states’ innovation initiatives. Washington also offers the StartUp Washington website and other online resources for small businesses. Utah’s efforts with small business closely relate to its Rural Economic Development Initiative. Nevada’s strategy calls for creation of an Office of Micro-, Small-, and Medium- Enterprises within GOED. Colorado OEDIT offers a support program for small manufacturers, and Minnesota’s DEED appears to rely largely on its SBDC network. Idaho Commerce does not define a separate small business function within its organization.
• Rural development is a concern in most places, but Utah may be the most focused on trying to use its economic development efforts to support rural development, which is a top priority in its strategic plan, and it has a Center for Rural Development under which an array of programs for rural businesses and communities are housed. Washington also provides credits and reduced rates for B&O taxes to firms in targeted industries in rural areas. Other state efforts appear less robust but emphasize technical assistance, support for small locally owned businesses, or broadband access. Colorado’s LONE incentive program would award additional cash payments per job for projects in rural counties or reservations. Idaho has a grant program to help hire full-time economic development professionals in rural communities. Convoluted criteria, designations and exceptions may challenge actual use of many of these programs in some cases.
• While some states are giving greater attention to ways to advance economic opportunity for underrepresented people through their economic development programs, only a few programs appear designed to intentionally address this priority. Colorado has a dedicated Minority Business Office. Minnesota is taking an agency-wide approach to equity issues. Among the goals for the agency are to increase the average starting wage by $2/hour for people of color whom Minnesota’s DEED helps place in jobs. The agency also states that it will create a unique equity goal for every DEED program to reduce disparities based on either race, ability level, or geography. Per job grants from the Job Creation Fund may be increased in the case of minority/women/disabled veteran-owned businesses.
With few exceptions, the benchmark states do not have major workforce development incentives designed to support business development activities by, for example, reimbursing in-house training costs for new hiring, which are more common among the southern states. That said, most states do offer programs intended to provide customized training, commonly through the community or technical college system. These programs are available and often serve expanding, existing employers, but they are not used as much for new employers or as substantial portions of competitive incentive packages.

19
Findings and takeaways The benchmarking analysis yielded several findings and takeaways for Business Oregon.
• The structure, staff, and budgets for the lead state economic development organization in the benchmark states vary considerably depending on the type of policy areas housed at that agency. There is no standard or “right” model. Business Oregon’s overall size puts it in the middle of the pack, but Oregon has comparatively a rather lean business development and incentives team.
• Economic development missions emphasize everything from strong communities to creating a business-friendly environment to enhancing quality of life to sustaining a healthy economy.
• Nevertheless, to a great extent though not exclusively, other states organizations continue to build around business development (retention, expansion and attraction), while also striving to emphasize workforce development, innovation and geographic equity. The benchmark states target similar industries in their business development work, especially in the manufacturing sector.
• Incentive offerings continue to underpin these business development objectives in most states. Interstate competitiveness and the attraction of new or expanded operations motivate many states’ policies. Other states, such as California and Washington, have appeared more concerned with supporting incumbent businesses. Incentives are ultimately always secondary to a business firm’s basic location/operational factors, but may be more important in the former sense of a firm’s weighing interstate options for new or expanded operations, including less common situations of relocation. For Oregon or any state, interstate versus incumbent is not an absolute issue but rather a balancing act in relation to the regional or national context of relevant industries or opportunities for the state.
• Incentives are context-specific to the state itself. States have different tax structures and diverse economic development missions, priorities, and not least of all, circumstances. Accordingly, they devise and deploy incentives in diverse ways. There is no one right way to design an incentive, even though deliberate design is still crucial.
• States in which firms have relatively high business tax liability, due to size if nothing else, such as Washington, Minnesota, and California, might be more inclined to rely on corporate or other business tax abatement(s). Smaller states, such as Utah, Idaho, and Nevada, have found ways to essentially bundle abatements or refunds against multiple taxes paid by businesses (such as income, sales and use, payroll, property) into an incentive package to present competitive and compelling offers to companies.
• The incentive programs examined here are mostly managed by state staff. They are, in effect, typically state-run, state-delivered (oftentimes discretionary) programs – in marked contrast to the decentralized administration of Oregon’s marquee property tax incentives, which depend on state–local coordination. In any event, monitoring and compliance tasks will also often cross state-agency lines with varying levels of data access and cooperation.

20
• In contrast to Oregon, other states’ incentives primarily comprise income tax credits, although cash grants and sales & use or other tax preferences or abatements are often part of the mix. (Two of the states studied are among those that do not have income taxes.) Property tax abatements are apparently not nearly as prominent for business development in other states as they are in Oregon, but they do figure into a couple of benchmark states offerings, and personal property is exempt across-the-board in Minnesota (as well as others in the upper Midwest). Property tax incentives are most impactful for companies making substantial investments in facilities and equipment, while their value decreases for industry sectors or companies with lower capital expense.
• Though usually a local tax, even local property tax abatement may depend normally on what state law or the state constitution allows. Whether explicitly provided or not, local property tax incentives might exist in some states. Local incentives in some states also arise through tax increment financing, for which Oregon’s urban renewal system does not have the flexibility seen in some places for business development opportunities.
• The incentive programs examined here are not strongly focused on particularly ambitious wage levels for the jobs they would create, with standards that may be simply and consistently based on (100%) parity with state or county average wages, which are not necessarily high in some states.
• Most of the incentive programs reviewed here help a relatively small number of businesses per year. Annually approved projects or companies range from 6 to 26 in the programs for which data were available (not including California Competes or Washington’s B&O tax breaks). In contrast, Oregon has evidently greater (perhaps more straightforward) access among types or sizes of businesses through its enterprise zones and other offerings.
• Businesses often say that talent is the most important factor when making location decisions, but in general, workforce-related programs in the benchmark states have not directly played a substantial role in competitive projects, which may be a reflection of those programs or the situations.
• The major business development incentive programs do not appear to play an important role in supporting either state innovation or small business priorities across the benchmark states. That said, several of the organizations examined for this study have multiple other grant, loan or targeted tax incentives in their portfolios for those purposes.
• While other states have struggled to extend their incentive use beyond their major cities, Oregon’s incentives are weighted toward and seem to benefit rural areas much more significantly than in the other benchmark states. Similarly, Oregon’s incentives often go to small and medium sized businesses, even when it is not their primary statutory purpose or where the amount of capital investment will generate only a relative property tax savings.
• States are increasingly striving to understand how their programs (including incentives) affect underrepresented populations, but only a few of the benchmark states have taken identifiable steps to address this priority.
21
Incentive Program Effectiveness and Efficiency This portion of the analysis examines stewardship and operations matters that affect the effectiveness and efficiency of Business Oregon’s incentive use in support of the strategic plan.
The priority alignment and benchmarking portions of the strategic assessment yielded several findings and opportunities for improvement that pertain to stewardship and operations. The steering group reviewed a set of these topics in March 2021 and agreed to three as the focus of guided conversations during meetings in April and May. For each meeting, the contractor prepared brief background materials and framing questions (Appendix 4). The meetings were then devoted to facilitated discussion of how each issue affects Business Oregon’s incentive use in support of the strategic plan and ways to address challenges and maintain good practices. Additional stakeholders with practical expertise on each subject were invited to join the steering group for these conversations. While the objective was to reach consensus around “what could be done differently” to improve incentive use in Oregon, the process did not attempt to force consensus where it did not exist. Instead, the group identified areas of agreement and reviewed options to advance in those directions.
As part of the examination of stewardship and operations, Business Oregon’s incentive goals, metrics, compliance, and reporting procedures were also reviewed and compared to the Smart Incentives framework for Managing Incentives for Transparency and Accountability (also included in Appendix 4). Select topics related to data management, evaluation, and reporting were reviewed with the project manager and members of the Economic Development Division management team in May.
Each of these meetings provided direction for recommendations to improve incentive use and advance strategic plan priorities in Oregon in the following four topic areas:
1. Data to tell the story of how incentives advance economic opportunity for underrepresented people
2. Reexamining Strategic Reserve Fund procedures and criteria to serve intended recipients and the state of Oregon more efficiently
3. New ways to present or market incentive programs to businesses and local partners
4. Managing incentives for transparency and accountability
Data to tell the story of how incentives advance economic opportunity for underrepresented people Advancing economic opportunity for underrepresented people is one of Business Oregon’s strategic priorities. It is not clear currently whether Oregon’s business development incentives are advancing this priority, although they possibly do so. Participating businesses may be minority-owned or their employees may include people of color, immigrant populations, and

22
individuals from native and tribal communities. As of now, there is no program data to determine if this is the case, and it is not a requirement in most situations.
The steering group reviewed six mechanisms with potential for obtaining data that would improve understanding and reporting on the ways that incentivized projects help advance economic opportunity (employment or business ownership) for underrepresented populations:
• Local Employment Dynamics (LED) by industry from the US Census Bureau
• Oregon First Source Hiring Agreement (FSHA) data
• Equal Employment Opportunity Commission (EEOC) submissions, requested from incentive recipients with more than 100 employees
• Survey questionnaires for incentive program recipients
• Data and documentation related to public benefit agreements (when relevant)
• Stories and evidence obtained from local partners working with recipient businesses
The first two options were considered the most immediately doable, with only somewhat additional or special staff time or resources. LED employment statistics are available at detailed levels of geography and industry for different demographic groups. The demographic employment patterns within Oregon could be analyzed for each of the industry codes associated with incentivized projects. This analysis would provide a rough estimate of the extent to which incentivized projects likely employ certain underrepresented populations, though at the risk of reflecting historic hiring patterns of industries.
FSHAs are required for Standard Enterprise Zone Exemption, Strategic Investment Program, Business Expansion Program, and Governor’s Strategic Reserve Fund (SRF) recipients. FSHAs obligate companies to post job openings with the local office of the Oregon Employment Department (OED), which serves as the contact agency for local publicly funded job training providers. When job listings are made and referrals provided to a business, employers are required to notify the contact agency when a qualified applicant is hired, and OED offices have demographic data for the individuals they assist. A request could be made to OED for aggregated figures on the number of referrals, hires, and demographic characteristics of individuals placed in jobs with incentivized companies. These hires would, however, account for only a segment of persons who are employed by the businesses benefiting from the incentive.
The second two options have potential but would take longer to yield findings and could be more difficult to implement. Companies with more than 100 employees must submit workforce data, including establishment locations, employee counts, and the sex and race/ethnicity for all employees to the EEOC. Although the data are otherwise confidential, incentive recipients meeting this size requirement may be willing to share information that they have already collected and submitted to a government agency to demonstrate their support for Oregon’s economic development priority of greater opportunity for underrepresented people. Business Oregon could also adapt the Business Finance Demographic Questionnaire for the incentive programs to learn more about the demographic characteristics of business ownership and/or employment. This option might also allow data and idea sharing across programs by collecting

23
information in a consistent manner across the agency. Companies are more likely to comply with both of these types of data requests during the application period, so these options, if pursued, would be appropriate primarily for future incentive recipients. Each option would require additional staff resources to collect, secure, review, and report on information collected through these means, and active involvement by the Department of Revenue, which controls key application procedures or forms for tax-based incentives.
Gleaning insights from public benefit conditions in state (SRF) and local agreements seemed a promising option, but the nature of the individually negotiated agreements and barriers to effectively aggregating information across projects would limit the quantitative utility of this option. Instead, there appeared to be consensus that using the agreements could be one way, among others, to help tell the story of how incentivized projects benefit the underrepresented community. While stories may be dismissed as merely anecdotal, they can be an extremely effective complement to program statistics to convey information about how programs work in practice and what incentivized projects mean to residents and communities. We heard repeatedly from stakeholders that stories, more than data, resonate with decision-makers and that a more complete conversation around how and why incentives are used would be welcome. Related options will be described further in the section on “New ways to present or market programs to businesses and local partners.”
Reexamining Strategic Reserve Fund procedures and criteria to serve intended recipients and the state of Oregon more efficiently. During interviews for this project, stakeholders and staff noted a lack of clarity in both the purpose and process for the Strategic Reserve Fund (SRF). The steering group discussed what could be done differently to clarify purpose and improve processes.
Expectations and desired outcomes for SRF have evolved over time, leading to confusion about how and when it should be used. The steering group discussed the need to articulate the SRF’s strategic objectives more simply and consistently for stakeholders and partners, in that it is not always clear what actions by businesses are applicable for specifically satisfying priorities. The group also agreed that more direction on SRF should be provided to Regional Development Officers (RDOs), since they are often engaged in early conversations with businesses and local partners on whether SRF is an option for specific projects, and the RDO might be further empowered to advance projects. The objective would be to make clear the situations in which SRF should be introduced into project discussions and the state’s expectations for successful projects.
The group then turned to process questions. While there is a 30-step SRF process flow chart, it does not even fully convey roles and responsibilities. Further, the review process has become more complex and unpredictable, feeding a growing perception that the program is opaque and difficult to use. In reviewing the process flow chart, steering group members pointed out that while the flow chart summarizes how projects move along, it “leaves out a million things that do happen.” This lack of clarity around what does happen and who has responsibility at different points in the process has contributed to stakeholder frustration. For example, local governments and economic development organizations are not depicted on the flow chart despite the fact that local government engagement usually occurs early in the process, and that a project’s

24
demonstration of local support and commitment to local priorities may be critical in order to proceed. As another example, the SRF page on the Business Oregon website emphasizes the importance of recipient firms performing public benefits, but public benefits are not mentioned in the process flow chart.
The discussion also touched on the role of the Governor’s Office in the approval process. Currently, Regional Solutions Team (RST) coordinators tend to be brought in relatively late in the process. The steering group suggested that RST coordinators should engage earlier in the process to facilitate the discussion of expected benefits and level of local support and identify potential pitfalls sooner rather than later. A “warm hand-off” from Business Oregon to the Governor’s Office could help ensure that questions are addressed early on (in both directions) and minimize surprises by the time a project goes to the Governor for final approval. The Interagency Memorandum making the formal SRF request could also include more narrative about how the proposed project supports or is consistent with state and local economic development priorities, which could complement the project statistics already provided. The memo might also incorporate, as an addendum, up-to-date summary statistics on SRF, including, for example, the percentage of money or projects in rural areas or other indicators of how SRF supports Oregon’s strategic priorities.
Finally, as a flexible incentive tool, SRF could adapt to more closely support Business Oregon’s strategic priorities. For example, there may be an option to use SRF awards to some businesses to explicitly support the innovation priority as defined in the 2018-22 strategic plan, which emphasizes increasing access to capital for high growth startups and ensuring investments support target industries and sectors lacking access to capital. Similarly, SRF could more directly support other strategic priorities. The Governor’s Jobs and Economy Advisor, Regional Solutions Staff, RDOs, and Business Oregon innovation, recruitment and incentives team members should participate together in conversations about how SRF can evolve.
New ways to present or market incentive programs to businesses and local partners Just as Business Oregon is striving to understand how its legacy incentive programs align with current strategic priorities, so are businesses and local partners. The interviews conducted for this project revealed that the state’s incentives are perceived as a weak match for many of the priorities, although this analysis indicates that, in practice, incentives often do support the priorities. Staff and stakeholders also expressed interest in doing more to help communities use incentives strategically to achieve their economic development objectives and to help businesses understand and access incentives in a manner consistent with the state’s priorities.
New approaches to communication, including outreach and capacity building, would be valuable to help businesses and partners use the incentives toolkit wisely in support of state and local economic development objectives. The steering group discussed several options for sharing information through outreach and technical assistance and came to agreement around developing a sort of incentives elevator speech, preparing examples and success stories, and expanding technical assistance or online interactive capability. The group also acknowledged that a need remains for a roadmap or other mechanism to fill information needs between program basics and technical details.

25
Steering group members and guests recognized that creating a brief and consistent elevator speech (or talking points) for the incentives in general could provide a starting point for players to be on the same page. A good elevator pitch would be especially useful to set expectations around when different programs are applicable or appropriate in the case of discretionary use for various types of situations. Regional development officers would be both an audience and an essential communication channel for the talking points. Accordingly, they could work together with the incentive program managers and communication specialists to craft the elevator speech.
The steering group also noted that examples and success stories can be among the most powerful communication tools available and should be used more intentionally for incentives outreach. Brief summary examples of how incentives have been used, who has had success using them, and descriptions of key players (Business Oregon, local partners, businesses) and their roles would be a valuable complement to the suggested elevator speech. Success stories would offer more project detail and thorough descriptions of how incentives have been deployed in the service of specific state and local economic development priorities. They would provide a platform to explain how incentives blend with other state program offerings and local contributions to create a successful outcome for the business, community, and state. Success stories would be lengthier and more robust than the examples. Stories would also be intended to have a longer shelf life on the Business Oregon website and could be shared with partners and businesses through multiple communication channels.
Technical assistance should continue to be a critical element of outreach and communication for effective use of Oregon’s incentive programs since careful stewardship of incentive funds and tax programs remains imperative. Business Oregon’s incentive training and technical assistance programs provide the guidance that enables all parties to the transaction to understand program requirements and their compliance and reporting obligations. Documentation provided on the Business Oregon website is a fundamental, go-to resource for incentive program information. Training events include webinars and, in the past, in-person presentations at Oregon Economic Development Association (OEDA), League of Oregon Cities, and other conferences where local partners gather.
Technical assistance also involves substantial 1:1 interactions to answer questions, offer clarifications and guidance on program rules, and help address the numerous unique circumstances that arise among individual projects. These technical assistance activities should be continued and, ideally, expanded to reach new and additional audiences, including those who may not have actively participated in incentive programs in the past, or enhanced for circumstances such as remote rural or underrepresented communities and delivered in potentially innovative ways. Finally, the steering group acknowledged the potential of hosting (or sponsoring) peer learning opportunities to enable local communities, practitioners, and county assessor offices to share techniques, best practices, and lessons learned among themselves.
Managing incentives for transparency and accountability Business Oregon shares substantial information on incentive program usage through its website, Annual Report, the Oregon transparency website/portal, and the state’s biennial Tax Expenditure Report. Stakeholders appear largely confident in the transactional information that is available and appreciative of the level of transparency provided in most incentive programs. This is a significant accomplishment requiring time, sustained staff commitment, and diffuse local efforts that should not be discounted.

26
Business Oregon now has the opportunity to lock in these improvements in data collection and reporting and build on them. Committing to good data management practices creates value not only by enabling the agency to achieve greater transparency, but also demonstrates that over time it is “accountable and a good steward of public resources,” which are strategic priorities. Being transparent and accountable may also involve seeking other ways of more broadly explaining how Oregon’s incentive programs support the state’s economic development priorities and create benefits for the people and businesses in the state.
Currently, the gathering of incentive information relies on tenuous processes of individual staff initiative to obtain and review data from diverse sources (incentive recipients, local governments, Oregon Employment Department) as entered and maintained in spreadsheets. Data inputs from these sources are not always submitted consistently or correctly, requiring follow-up for clarification. The inputs largely arise from standalone, typically tax, forms (often paper or PDFs) that do not feed into a centralized database. Managing the data is a labor-intensive activity. Accessing, analyzing and presenting the data can be done fairly well with current methods, but this approach has shortcomings.
Business Oregon should consider systematizing elements of its data reporting and management methods. One option is to create an incentive program portal, with clear directions on how data should be provided, through which partners or even business recipients can report certain information in a more direct, consistent, and timely manner. Several states have implemented this type of interface to facilitate data collection, management and reporting for their incentive programs. Another step may be to find ways to integrate incentive programs into Business Oregon’s ongoing transition from Portfol to a new economic development management system for the grants and loans it awards to municipalities, businesses and other organizations. Business Oregon could also expand on or create data sharing agreements with the Oregon Employment Department and Department of Revenue to facilitate access to data that incentive recipients already provide to or are produced by the state, which would serve to verify and validate the incentive program compliance information assembled and used by Business Oregon, including for assistance with local compliance efforts. Other options, such as a statutory or regulatory requirement to compel (or allow access to) information necessary to verify data and compliance, have been implemented in other states.
Stakeholders and staff are also interested in a better, more general understanding of the effectiveness of incentive programs over time, beyond individual project figures or annual reports. Business Oregon leadership would also like to change the culture around economic development incentives and be able to tell a more complete story about the role that incentives play in economic development work. Such an effort can help move past the tropes and myths that afflict policy conversations about incentives in so many states and improve policymaker confidence in how and why incentives are being used. Leaders have also expressed interest in greater historical perspective of the state’s incentive use to understand how they might have affected state residents and communities, including rural areas and underrepresented people, not just the state economy as a whole.
The agency should consider investing in a multi-year review schedule to prepare more holistic reports about what incentive programs (either together or individually) have accomplished relative to program objectives and the state’s economic development strategic priorities over time. This type of assessment would require careful research design, dedicated staff time, funds for research and analysis (whether conducted by an internal or external team), and a
27
commitment to thorough data collection. The benefits would include better stakeholder understanding of how incentives have been used in support of strategic priorities, a stronger awareness of the value of using incentive programs going forward, and insights that can help improve the way incentives are implemented in Oregon so that benefits are felt across all communities.
Recommendations This section draws on the preceding steps to present options that answer the question of what could be done differently with economic incentives to accomplish Oregon’s priorities effectively and efficiently. It offers a set of implementation possibilities for Business Oregon’s consideration to support the proposed options. The intention is not to suggest that Business Oregon should implement all of the presented ideas but to provide a menu from which to select and prioritize initiatives and determine next steps. These proposals are organized as follows:
1. Prepare to adapt the incentives toolkit to a changing economic and competitive environment.
2. Solidify and augment data gathering and systems.
o Pursue special data collection practices to help describe the extent to which incentives are helping small and middle-market companies, rural communities, and underrepresented people.
o Further systematize incentive program data collection and management methods and dedicate resources for a sustainable monitoring and reporting solution.
3. Comprehensively improve the ability to communicate and tell the story of Oregon’s incentives as a joint undertaking among the agency, partners, and incentive recipients.
o Supplement annual reports and transactional information with scheduled assessments of the longer-run outcomes associated with incentivized activities.
o Develop new ways to present and market incentive programs, so that businesses and local agency partners will use the incentives toolkit wisely and more effectively.
Prepare to adapt the incentives toolkit to a changing economic and competitive environment Even as Oregon’s business development incentives have largely stayed the same, other states have been revising their incentive program offerings over the past several years. Since many states target the same industries as Oregon, the state may increasingly find itself at a disadvantage. At the same time, both the economy and tax environment are different now than when most of Oregon’s current business development incentives arose. Business Oregon’s economic development priorities have also evolved. Therefore, Oregon may wish to commence serious conversation regarding how to adapt its incentive toolkit in the next few years to recognize the new setting in which its economic development activities are taking place.
28
It was recognized in interviews and in comparison to other states that there are issues to address and gaps to be filled among Oregon’s current set of incentives in order to improve both their strategic and competitive use. However, the timing was seen as less than optimal to seek significant or immediate program modifications, and no consensus emerged on compelling changes as part of this assessment. While not yet urgent, Business Oregon may wish to take the opportunity to lay the groundwork now to articulate options that will enable the business development incentives to evolve successfully with the changing times. This assessment offers three main suggestions for Business Oregon’s consideration.
1. Seek to identify the incentive components that have contributed to other states’ recent business expansion or recruitment successes within the industries that Business Oregon has targeted to determine if and how such components might be incorporated into Oregon’s incentive offerings. Studying successful attraction announcements in a methodical manner will provide insights into the factors that led to company decisions and the role that different types of incentives played. Analyzing incentive offers across states from a project orientation would also complement the program-oriented analysis conducted for this study and provide valuable perspectives into the how incentives are being used and layered in the present competitive environment. Starting a review from the project viewpoint can help keep the conversation neutral when considering how incentives should evolve because the focus is on companies rather than policies. With this type of analysis in hand, Oregon will be in a stronger position to pursue strategic modifications to its incentive offerings.
2. The discretionary SRF program may be ripe for re-focusing, process rationalization, or explicit adaptations and criteria targeted at competitive opportunities and strategic priorities. The Governor’s Jobs and Economy Advisor, Regional Solutions Staff, RDOs, and Business Oregon innovation, recruitment and incentives team members should participate together in structured conversations about how SRF can evolve.
For example with SRF:
• Business Oregon may wish to determine if program elements can or should be tailored to support the priority to Innovate Oregon’s Economy and to help implement the 2021 Innovation Plan, which would help align incentives with the priority to which they are currently least connected. Though, they may be un-connected because incentives are not the right tool for the mission, adapting SRF might make sense for some projects in which there is clear overlap between incentive capabilities and Innovation Plan objectives. The SRF statute and administrative rules indicate a broad economic development mandate, and the program’s discretionary, forgivable loan structure may make it a unique and potentially attractive option.
• There may be other, perhaps better, ways to deploy SRF to support other Business Oregon’s strategic priorities, such as opportunities to use SRF to help small and middle-market companies with exporting strategies. It may also be possible to reconsider the statutory limit on SRF to traded sector industries. Additional opportunities may surface by engaging with colleagues in other Business Oregon divisions (such as Arts & Culture, Innovation & Small Business Growth) to promote economic development in new ways. A working group drawing from Business

29
Oregon, local economic development partners and allies, and the Governor’s office could constructively assess the potential for using SRF for additional purposes.
• Business Oregon may also wish to reexamine SRF procedures and criteria so that it can serve intended recipients and the state of Oregon more efficiently. Options for consideration include:
o Articulate the SRF’s strategic objectives more simply and consistently for stakeholders and partners. Summary language describing the SRF should be consistent across all Business Oregon communication platforms.
o Provide definite guidance to RDOs on when SRF is an appropriate option for various types of projects, since they are typically engaged in early conversations with businesses and local partners about opportunities. The objective would be to make clear the situations in which SRF should be introduced into project discussions and the state’s expectations for successful projects.
An informal working group of Incentives, RDO staff, and Regional Solutions team members from the Governor’s office could meet to prepare a one-page cheat-sheet or FAQ describing when SRF should be introduced to prospects based on SRF’s current objectives, requirements, and fit with state and local priorities (for both job oriented and capacity building projects). The working group could revisit the document annually to make updates, as the SRF is intended to be a flexible tool and is likely to continue to evolve. Good starting points for crafting a brief or FAQ include the SRF logic model from this report (see Appendix 2), SRF/BEP project intelligence and intake forms, the SRF process flow chart, the SRF Policy Manual (2020), and the SRF page on the Business Oregon website.
Since it is intended to be flexible, the SRF does not have a set of standards regarding employment, compensation, or other requirements; rather, they are all “subject to agreement.” However, it may be possible to create a “what we are looking for” summary or infographic describing the types of project characteristics or actions that are more likely to lead to approval. A related option would be to create a document or infographic indicating that if a community has an opportunity for certain types of projects meeting specific parameters, then SRF is probably an appropriate option. This type of project-oriented presentation would complement the program-oriented presentation of information described above.
o Clarify the roles and responsibilities of business and partners in the SRF process. Business Oregon may consider developing two condensed versions of the SRF process flow chart – one for the approval process and the other for the monitoring period through closeout. The charts could elevate the visibility of the roles and responsibilities associated with each of the major
30
process steps, so, for example, companies and local partners know what they need to contribute and when.
o The roles and responsibilities of the Governor’s Office could be further specified, including providing guidance about the priorities it is willing to support. The Regional Solutions Team in the Governor’s Office could be engaged earlier in the process to share project information, discuss expected benefits and the level of local support, identify potential pitfalls, and commit to outcomes.
o Track and share summary statistics on SRF, including, for example, the percentage of money or projects in rural areas or other indicators of how SRF supports Oregon’s strategic priorities.
• More insight on the structure and outcomes associated with the negotiated public benefit agreements that are considered a critical element of program accountability would also be useful for understanding both the requirements and full value of SRF-funded activities. As with the other incentive programs considered in this analysis, the time and resources needed to make more information available would need to be balanced with confidentiality requirements, staff capacity, and level of interest for additional information among stakeholders.
3. Consider whether a workforce incentive should be created to help existing and new businesses meet their talent needs. Talent is frequently the top issue for new and expanding businesses, and workforce development, often in the form of customized training programs, is part of economic development activities in most of the benchmark states. That said, most of the benchmark states do not have major workforce development incentives to support their business development work, though they are often central to incentive offerings in other regions of the country. Business Oregon may wish to undertake a formal assessment of how best to assist Oregon firms, as well as those new to the state, in meeting their workforce needs, including whether an incentive program would be beneficial and how it should be structured. Emerging efforts are worth investigating as other states continue to develop new approaches to linking their economic and workforce development activities (Figure 2). A well-designed workforce incentive could also help advance some or all of Business Oregon’s strategic priorities, including helping small and middle-market companies grow, cultivating rural economic opportunity, and advancing economic opportunity for underrepresented people. Unlike the first two options presented in this section, a new workforce incentive would require legislative action, except to some extent as a special extension under SRF.

31
Figure 2. Repositioning Talent Development Incentives
Other potential steps that would also necessitate legislative changes include:
• Making the BEP more amenable to use in rural areas. The priority alignment analysis (Appendix 2) noted that BEP eligibility criteria are considered an impediment to rural projects. Business Oregon has in the past offered proposals to reduce the eligibility criteria to make BEP a more viable option for rural areas.
• Expanding use of the OIA or other income tax tools for strategic plan purposes. One proposed improvement has been to permit program use for smaller businesses in certain industries without geographic limit. Such an approach could help further align the OIA with the strategic priority to help grow Oregon small- and medium-sized businesses. There might also be an opportunity to provide more transparency, especially regarding the cost of the incentive. Income tax returns are confidential, and reporting can be very complex. Nevertheless, steps can be taken to improve sharing of confidential information among agencies for evaluation purposes, though it may require more time and effort than merited by the size of the program. Finally, Business Oregon has proposed other modifications to improve the program’s usefulness, including stabilizing the county eligibility definitions, resolving statutory confusion about the incentive term, simplifying employee pay criteria, and capping the total amount of exempt corporate income by year.
• Aligning and streamlining certain definitions and eligibility requirements within and among programs. For example, as described above, the SRF application and approval process may be streamlined to work more efficiently for Business Oregon and for potential recipients by removing snags, bottlenecks, and redundancies that have accumulated as the program has aged and to provide more speed and clarity in the review procedures. Such a review should strive to maintain the accountability measures that have been incorporated into the program over time. Similarly, modifications to OIA definitions,
State economic development agencies are being called up to help existing and relocating companies find the right talent for available jobs. As states add or refocus talent development programs and capabilities, economic development agencies are expanding their toolkit for attracting and retaining business.
Businesses are incentivized to take advantage of these services through several mechanisms. For example, to encourage companies to expand their operations within state borders, state agencies may provide talent recruitment and training services at no or low cost. Many state economic development agencies help connect businesses to just-in-time talent recruitment and training services. These are often customized for larger companies, as a location or expansion incentive, reducing the costs and risks associated with making investments within the state borders.... Some programs help companies improve the skills of existing employees when companies make large capital investments, coinvesting with the firm as it introduces new technologies or equipment.
Talent initiatives are continuing to evolve. These three questions can help economic developers determine if their talent programs are moving in the right direction.
1. Do incentive and talent development programs encourage paid work experience?
2. Do incentive programs foster cooperation with workforce development and education partners?
3. Are talent programs aligned with industry and cluster development strategies?
Source: Repositioning Economic Development Incentives for 2021, Center for Regional Economic Competitiveness and Smart Incentives, March 2021
32
clarification of terms, and simplification of pay criteria could improve program effectiveness and efficiency. Past efforts to trim elements of the property tax incentive programs (EZ, LTREZ, SIP) have not been legislatively successful, while new requirements and nuances have been added over time at the state and local levels. While these programs are perceived as complex, no specific streamlining recommendations emerged for them, except sustaining the commitment to provide technical assistance.
Solidify and augment data gathering and systems This recommendation comprises two elements: 1) knowing more about how incentives may be serving prioritized groups, businesses or communities, and 2) moving beyond rudimentary methods for managing data more generally.
Pursue special data collection practices to help describe the extent to which incentives are helping small and middle-market companies, rural communities, and underrepresented people
Additional data would help determine how well incentivized projects enhance economic opportunity for underrepresented people, help grow small and middle-market companies, and cultivate rural stability. New information would produce helpful insight on program activity relative to strategic priorities, but it would not necessarily translate well into standardized performance metrics. Each option would pose challenges to collect, secure, review, and report on information obtained.
Business Oregon can pursue several data collection options in the near and medium term to obtain insight into how well incentive programs are serving underrepresented populations in the state. As described in the section “Data to tell the story of how incentives advance economic opportunity for underrepresented people,” the two more immediately doable options are to:
• Use available Local Employment Dynamics (LED) statistics to analyze employment patterns for incentivized projects based on their industries. LED employment statistics are available at detailed levels of geography and industry for different demographic groups.
• Request aggregated figures on referrals and demographic characteristics for job placements from the Oregon Employment Department for incentivized firms that are required to enter into first-source hiring agreements. First-source hiring agreements are required for Standard EZ, SIP, BEP and SRF recipients.
Though relatively feasible, the above would yield only partial, indicative information. Other options with potential to generate valuable data—but demanding more time, resources and resolution of issues such as confidentiality—would include requesting additional information from incentive recipients that they must already submit to the Equal Employment Opportunity Commission regarding sex and race/ethnicity data for their workforce; integrating incentive programs with Business Oregon’s Business Finance Demographic Questionnaire for determining BIPOC business ownership and/or employment, and gleaning insights from public benefit conditions and local agreements with assistance from local partners. Successfully implementing these or other related data initiatives will require agency leadership support and coordination with its office of Diversity, Equity and Inclusion.

33
Business Oregon already reports on the extent to which SRF and BEP programs assist small and middle-market companies and support job creation and retention in rural areas in its Annual Report. However, the reported metrics do not cover all business development incentives, making it difficult to ascertain how well some programs serve these priorities. Devoting additional staff, funding, and data management resources to highlight and expand information would enable more complete descriptions of how small and middle-market companies participate in the remaining programs, the demographic characteristics of participating business owners, and incentivized economic activity in rural areas. For example:
• The Oregon Property Tax Incentives Impact Study to be completed in late 2021 will provide additional insight for the property tax incentive programs in these respects.
• It would be possible to track and report on the number or percentage of standard EZ exemption recipients that are small or middle-market companies depending on the definition of these terms and availability of additional research capacity to verify company size. Rural use can be somewhat readily measured subject, again, to definitional constraints.
• Additional potential metrics that would indicate EZ support for small and middle-market companies include the total investment made by small and middle-market recipients in eligible real and personal property and the number or percentage of recipients that are manufacturers.
• There are a small number of participants in the LTREZ, SIP and OIA programs, so case studies may provide one way to demonstrate how incentivized investments help cultivate rural economic stability over time and help achieve local objectives.
• Additional information on how locally collected fees or payments from SIP and special EZ situations are spent or utilized could be requested to demonstrate a connection to strategic priorities. However, to do so would require 1:1 outreach and inquiries to local governments. The cost of such an effort would need to be balanced with the value of the information to be obtained.
Efforts to expand data collection practices would also support the recommendation to conduct assessments of longer-run outcomes associated with incentivized activities. The approaches outlined in this section would require rethinking forms and procedures through which data are gathered and would need to be pursued in consultation with local and state partners involved in reporting tasks.
Further systematize incentive program data collection and management methods and dedicate resources for a sustainable monitoring and reporting
solution
The section on Managing Incentives for Transparency and Accountability notes that, “Committing to good data management practices creates value not only by enabling the agency to achieve greater transparency, but also demonstrates that over time it is ‘accountable and a good steward of public resources,’ which are strategic priorities.”

34
To seize on the opportunity of entrenching and building on recent achievements with transparency and compliance, Business Oregon should move forward with information technology solutions for elements of its incentive data management processes. Other states have implemented more formal systems that, for example, facilitate recipients’ furnishing information in a consistent, secure format, and that offer efficiencies and flexibility in monitoring compliance or disseminating results.
One option is an incentive program portal through which partners or businesses can report in a more direct and timely manner, like the type of interface found in several states. A snapshot from the Wisconsin Economic Development Corporation (Figure 3), a best practice organization for compliance monitoring and reporting, is provided below as one example.
Figure 3. Wisconsin Economic Development Corporation Performance Report Form
Good portals offer clear directions on how data should be provided, definitions for each field, ability to upload required documentation, and instructions to guide to users through the form(s). They typically incorporate validation and verification mechanisms that improve data quality. A consistent and centralized source of high-quality incentive program compliance information enables staff to streamline compliance procedures for recipients, respond to stakeholder information requests more efficiently, conduct analysis that can lead to program improvements, and demonstrate good stewardship while meeting expectations for transparency and accountability.
Steps to begin such an effort include researching incentive portals in other states, speaking with program administrators in peer economic development organizations, and exploring viable systems options within Business Oregon, as well as establishing a budget and sufficient timeline. Second stage steps involve defining the fields, selecting a platform, engaging with partners (such as the Department of Revenue, Oregon Employment Department, assessors, local economic developers, and, perhaps, businesses), and determining whether statutory changes are required for certain elements of the implementation (including but not limited to confidentiality).
35
Alternatives to an incentive-specific portal may also present themselves as part of Business Oregon’s ongoing transition to a new economic development management system. For example, incentive programs could be integrated into the new system along with grants and loans awarded to municipalities, businesses and other organizations. Including the incentives team in EDMS planning could help determine whether this approach would be fruitful.
More standardized use of data-sharing arrangements with the Oregon Employment Department, as well as the initiation of such arrangements with the Department of Revenue (DOR), would also facilitate access to data already provided to or produced by the state on incentive recipients that could be used for analytical and verification purposes. For example, DOR is an efficient, central repository of many projects’ exempt property values by year, which are not nearly as protected by law as information from income tax returns, and yet vague, sweeping concerns about taxpayers and litigation exist. Many states have improved their administrative data sharing among agencies to promote evidence-based economic and workforce development. However, legal, political and agency culture barriers can hinder effective data sharing. Research2 into this topic has found that such barriers can be overcome by:
• Educating agency leaders on the value of administrative data to support better policymaking and ease the reporting burden
• Creating policies that maintain the required standards of data security and confidentiality
• Providing visibility and resources for streamlining data sharing process, and
• Establishing a structured process for data sharing requests to help remove those barriers.
The State Data Sharing Initiative (statedatasharing.org) suggests states begin by defining how data sharing can support agency priorities (such as transparency and accountability) and improve program management, educating leaders and key stakeholders about the value to be obtained from data sharing, creating an inventory of existing data sharing agreements, and identifying the specific policies (as opposed to agency conservativeness) that formally affect data sharing across agencies. From this baseline, states can then start to identify ways to streamline access to data within existing agreements, identify technical solutions for data access and/or warehousing, codify and extend data sharing procedures, and build trust among additional agencies that data will be handled in a secure and confidential manner in compliance with state and federal law.
In addition, statutory or regulatory changes to compel or permit access to information necessary to verify data for incentive program compliance have been implemented in other states and may be worth considering as another means to enhance data collection for incentive program accountability. For example, Utah passed legislation requiring the Utah Tax Commission to provide the Governor’s Office of Economic Development greater access to the tax record data of tax incentive recipients for compliance and evaluation purposes. Other states, such as Iowa and
2 Please see “Improved State Administrative Data Sharing: A Strategy to Promote Evidence-Based Policymaking for Economic and Workforce Development” (2017) and “Advancing State Data Sharing for Better Economic and Workforce Development” (2018), Center for Regional Economic Competitiveness.
36
Oklahoma, have pursued cross-agency data sharing with their tax or revenue departments at the staff and leadership levels.
Comprehensively improve the ability to communicate and tell the story of Oregon’s incentives as a joint undertaking among the agency, partners, and incentive participants This recommendation also comes in two parts to both deepen and broaden understanding about the incentives programs and make them more approachable. Both efforts will require careful planning, as well as dedicated staff time and resources, for work to be done whether by an internal team or external researchers and advisers.
Supplement annual reports and transactional information with scheduled assessments of the longer-run outcomes associated with incentivized
activities
When asked what information they would most like to have about incentive programs that is not currently available, stakeholders interviewed for this assessment frequently responded that they would like to see more long-term metrics or insights of how incentive programs have helped Oregon and affected its residents and communities over time. Business Oregon leadership also expressed interest in telling a more complete story about the role that incentives play in economic development work, along with historical perspective of how the state’s incentives have affected state residents and communities, including rural areas and underrepresented people.
Business Oregon could commit to periodically preparing or commissioning evaluations that fill in the picture about the longer-term effects of incentivized activity and the relationship to strategic priorities. The Oregon Property Tax Incentives Impact Study to be completed in late 2021 is an example, which might be updated or extended over time. Further study could consider how economic conditions have changed in communities since the initial enterprise zone designation and how incentivized investments have fared over time once they exit the program, including whether they continue to generate economic and fiscal benefits for the community. There may be an opportunity to study the factors that are correlated with successful and non-successful zones and identify policy actions to improve outcomes in struggling areas.
Studies could also examine program impacts for other individual incentives, or they could be organized by strategic priority. For example, separate studies could focus on how incentivized activity across programs has influenced economic prospects in rural areas or delve into instances in which incentives have or have not been accessed by small and medium businesses or among underrepresented populations. There may be the opportunity to track the growth patterns of incentive recipients that are Oregon-based businesses, and a longitudinal study could yield constructive findings about how homegrown businesses have developed over time with support from Business Oregon.
37
These types of assessments would require rigorous research design, dedicated staff time, funds for research and analysis (whether conducted by an internal or external team), and a commitment to thorough data collection. Our work has shown that effective incentive evaluations:
• Specify clearly the key questions to be answered and/or the criteria for evaluation
• Bring to light new data or analyze existing data in a new way
• Offer actionable policy insights into the program’s impact and inner workings
• Are collegial and cooperative, with an eye toward improvement not punishment
• Allow time for analysis, discussion, review and questions
Good assessments require trust and cooperation with stakeholders and partners to generate meaningful outcomes. The research studies should be designed to be open and collaborative. Studies of longer-run outcomes should generate findings that emphasize learning and improvement and should not be perceived as either finger-pointing or self-promotional exercises.
The agency should consider investing in a multi-year plan for carefully designed data collection and investigations with a schedule and research budget, involving an inclusive set of partners to either prepare or oversee these more holistic analyses. The first step in beginning an assessment requires coming to agreement on the key questions that should be addressed. This step may also involve building support for an evaluation among stakeholders and policy leaders external to the organization. Universities, think tanks, not-for-profits with research capacity, consultants, or internal staff may then be selected to lead each study. Community engagement to obtain diverse resident and business inputs should be a core element for each assessment. The research plan should include a process for distributing findings widely and use multiple reporting formats (not just a PDF document) to share information with a variety of audiences. Benefits of this effort would include:
• Better community knowledge of how incentives are used in support of strategic or community priorities,
• Stronger stakeholder awareness of the value of using incentive programs going forward, and
• New insights to help refine incentive policies so that benefits are more widely enjoyed.
Develop new ways to present and market incentive programs, so that businesses and local agency partners will use the incentives toolkit wisely and more effectively
Internal and external stakeholders need to understand better how the incentives (including SRF)
can be used generally and individually to advance state or local economic development.
Common understanding of how, why and when each incentive is most appropriate will not only
improve the ability of state and local practitioners to recognize and direct attention and effort to
the more impactful opportunities, but it will also help solidify support for incentivizing projects that
can generate meaningful benefits for communities and the state economy.
38
Explaining incentives is one of the top communication challenges economic developers face.
Business incentives often involve financial transactions or tax strategies that elude easy
understanding for laypersons. Knowledgeable businesses and economic development
practitioners may also struggle to understand the eligibility and compliance criteria that vary
across programs (and that may be further complicated by political or legislative choices) as they
try to apply those criteria to their specific circumstances. Communication challenges are
compounded whenever administrative guidelines and statutory requirements change. Information
imbalances may exist between local officials and the lawyers or consultants of certain
businesses.
Staff and stakeholders interviewed for this project expressed their interest in doing more to help
communities use incentives in an impactful way to achieve state and local economic
development objectives and to help businesses understand and access incentives in a manner
consistent with the state’s strategic priorities. Stakeholder interviews suggested that local
organizations may benefit from guidance on strategic approaches to incentives that would help
communities use and market the program and better link their incentive use to their other
economic development initiatives. Overall, many interviewees conveyed the opinion that deeper
partnerships and more communication with communities would be valuable.
New approaches to communication would allow businesses and partners to see where the
available incentives can specifically serve business development projects and private investment
plans. While Business Oregon provides a variety of quality information with different levels of
detail regarding incentive programs, there is still a lack of uniform messaging about incentives,
and stakeholders still find it challenging to grasp the bigger picture of how collectively they are
used, for whom, why, or when, including cases where Oregon’s incentives may have little or no
relevancy.
The steering group discussed several options for sharing information through outreach and communication efforts. These have been combined with other ideas from Smart Incentives’ own work and organized to mirror the basic project site selection funnel (Figure 4, left), in order to contrast that with the type and magnitude of incentive knowledge (Figure 4, right) businesses and partners need at different points in time. Presentation options organized into these three phases recognize that businesses and partners have changing knowledge needs throughout the incentive process.

39
Figure 4. Corporate site selection process (left) and accompanying incentive knowledge needs
(right)
The first phase, Know the Incentive Toolkit, is about communicating with businesses and partners about the basic incentive landscape in Oregon so they can describe what the incentive programs are, for whom they are intended, and why they are beneficial for businesses and economic development. The project steering group discussed several options for sharing information at this level and landed on advantages of creating basic, consistent messaging about the incentive programs, preparing examples, and sharing success stories.
An informal working team (possibly modeled on the incentives investigations project steering group) could be established, comprising incentives coordinators, RDOs, strategy and communication team members, local partner representatives, and, perhaps, regional solutions staff from the Governor’s office, with a 6-9 month timeline to develop elevator-speech/talking points, project examples, and success stories. Business Oregon may wish to engage a facilitator for this task if an internal lead is not available, and possibly public relations/marking professionals.
The team should also address how best to disseminate the messaging it develops, including options such as:
• Informal or formal “training” for the full RDO team and others
• Adding new examples and success stories to the Business Oregon website
• Incorporating common language and examples into non-technical presentations and workshops for local partners, and

40
• Building the messaging into site tour agendas and outreach presentations to interested groups. (Tax professionals, CPAs, councils of government, legislators, and Small Business Development Centers were identified by the steering group as examples).
The second phase, Match Incentives with Opportunity, is about helping businesses and economic development partners understand when a specific incentive is applicable (or not) for specific types of projects. The steering group discussed this challenge and agreed on the need but did not come to an agreement around a recommendation to pursue. Examples of ways to supplement the information already available include preparing an annual incentives guidebook for the public and maintaining a general internal manual of incentives (both of which are common in other states), creating an if/then chart or online navigation tool to sort through options, conducting interactive and obligatory training or presentations for RDOs and local partners on this topic (Figure 5), and continuing and enhancing ways to provide direct, ad hoc guidance to economic development practitioners and others around the state. This phase would also entail concise project examples and the more detailed stories of when incentives were used more or less successfully.
Figure 5. Virginia impactED
The third phase, Navigate the Process, is about helping businesses and economic development partners understand the pre-award incentive application requirements and their post-award compliance and reporting obligations. The steering group agreed that Business Oregon’s technical assistance activities like workshops/webinars and 1:1 direct guidance should continue, and ideally, they might be expanded or refashioned to reach new and additional audiences, such as underserved and remote rural communities. Proactive, more tailor-made assistance could supplement existing efforts where economic development capacity is lacking. The agency should maintain but possibly also reimagine and reorganize websites as information resources, and develop platforms to facilitate peer-learning opportunities whereby partners (including county assessor offices) are encouraged to share best practices and lessons learned.
Implementation of this recommendation should involve joint selection and implementation of priority options by the incentives team, communications group, information technology staff and regional development and national recruitment officers. Pursuing any of these suggestions will require the commitment of leadership and additional staffing, expertise and other resources to
The Virginia Economic Developers Association (VEDA) and the Virginia Economic Development Partnership (VEDP) have joined forces to present an ongoing learning opportunity for economic developers in Virginia…impactED.
impactED is designed to offer Virginia economic developers a deep-dive discussion on economic development topics impacting the Commonwealth. The online series offers Virginia economic developers timely and useful information on economic development topics impacting the Commonwealth.
Sessions address program overviews and news, federal and state legislative updates, VEDP and other state agency initiatives, and financing and incentive programs. The latter have included discussion of Virginia’s complete incentive portfolio, as well as separate updates on Virginia Talent Accelerator, Business Ready Sites Program, Center for Innovative Technology, workforce initiatives, brownfields assistance, etc.)
More information and the 2021 impactED schedule are available here: https://www.goveda.org/page/2021impacted.
41
involve various parties and work out new communication techniques and channels, as well as commitment to use and maintain them.
Conclusion The Strategic Assessment of Incentives found that, in more ways than anticipated, many of the business development incentives either do or have the potential to support Business Oregon’s strategic priorities. Proposed data and communication recommendations would help demonstrate more fully how Oregon’s incentive use is aligned with the agency’s economic development strategy. Options are presented to lay the groundwork for possible program adjustments that would allow Oregon’s incentives to adapt to an evolving competitive environment. Implementing items from the menu of suggestions for each recommendation will require visible leadership support, dedicated staff time, and, in many cases, additional implementation resources to change the conversation around incentives by enabling a more complete understanding of how incentives support the economic development mission in Oregon.