stormwater quality monitoring report porous asphalt at...
TRANSCRIPT

Stormwater Quality Monitoring Report
Porous Asphalt at Denver Wastewater Management Building
Denver, Colorado 2008-2010
October 2011
Prepared by Holly Piza, P.E., and Claire Eisel
Urban Drainage and Flood Control District
2480 W 26th Avenue,
Suite 156-B
Denver, Colorado 80211

Table of Contents
I. Introduction............................................................................................................................ 1
UDFCD and Stormwater Quality ........................................................................................................... 1
Porous Asphalt at Denver Wastewater ................................................................................................. 1
II. Site Description..................................................................................................................... 2
Study Area ............................................................................................................................................. 2
Watershed ............................................................................................................................................. 4
III. Methods and Materials ...................................................................................................... 4
Pavement Section ................................................................................................................................. 4
Data Collection ...................................................................................................................................... 6
Porous Asphalt Monitoring and Sampling ............................................................................................ 7
Reference Site Monitoring and Sampling ............................................................................................. 9
Maintenance Practices ........................................................................................................................ 10
IV. Results and Discussion...................................................................................................... 13
Outflow Volume Reduction................................................................................................................. 13
Water Quality Impacts ........................................................................................................................ 15
V. Conclusion ........................................................................................................................... 48
VI. References .......................................................................................................................... 51

1
I. Introduction
UDFCD and Stormwater Quality
The Urban Drainage and Flood Control District (UDFCD) was established by the Colorado legislature in 1969 for the purpose of assisting local governments in the Denver metropolitan area with multi-jurisdictional drainage and flood control problems. UDFCD monitors a number of stormwater Best Management Practice (BMP) sites in the Denver metropolitan area and plays a large role in stormwater quality improvement by way of research and promulgation of criteria. UDFCD samples inflow and outflow and collects data on rainfall and runoff at all BMP sites.
UCFCD’s primary objectives are to:
• Determine the Event Mean Concentration (EMC) of different constituents that affect stormwater runoff.
• Assess the longer term performance of each BMP with regard to stormwater quality and runoff volume reduction.
Porous Asphalt at Denver Wastewater
At the City and County Denver Wastewater Management Building, UDFCD is monitoring porous asphalt. Porous asphalt is one of several different types of permeable pavement systems designed to infiltrate stormwater through the pavement. Permeable pavements are a common and important practice of Low Impact Development (LID). Porous asphalt consists of open graded hot mix asphalt that contains less than 3% of fines passing a #200 U.S. Standard Sieve. The absence of fines creates a permeable surface that allows stormwater to infiltrate the pavement. By capturing and slowly releasing effluent, permeable pavements help to reduce outflow volume, improve water quality, and decrease effective imperviousness.
A street view of the porous asphalt at Denver Wastewater is shown in Photograph 1.
Photograph 1. The porous asphalt site with sampling inlet shown in the background

2
II. Site Description
Photograph 2. Denver Public Works Building (Left of island: porous asphalt, right of island: PICP).
Study Area
The porous asphalt and a reference (control) site are located at the Denver Wastewater Management building at 2000 W. 3rd Avenue in Denver. The porous asphalt was placed in May 2008 under the guidance of the Colorado Asphalt Pavement Association, and is located in the turn-around of the main entrance on the north side of the island (see Photograph 2). The porous asphalt has an area of 1840 square feet. The reference site is located in a parking lot a few hundred feet northeast of the BMP and is used to compare water quality and flow of treated effluent to untreated, direct runoff. The general vicinity and location of the porous asphalt are shown in Figures 1 and 2, respectively, with the porous asphalt circled in red and the reference site indicated by a red arrow in Figure 2.

3
Figure 1. Vicinity Map
Figure 2. Location Map
BMP Site
Reference Site
N
4
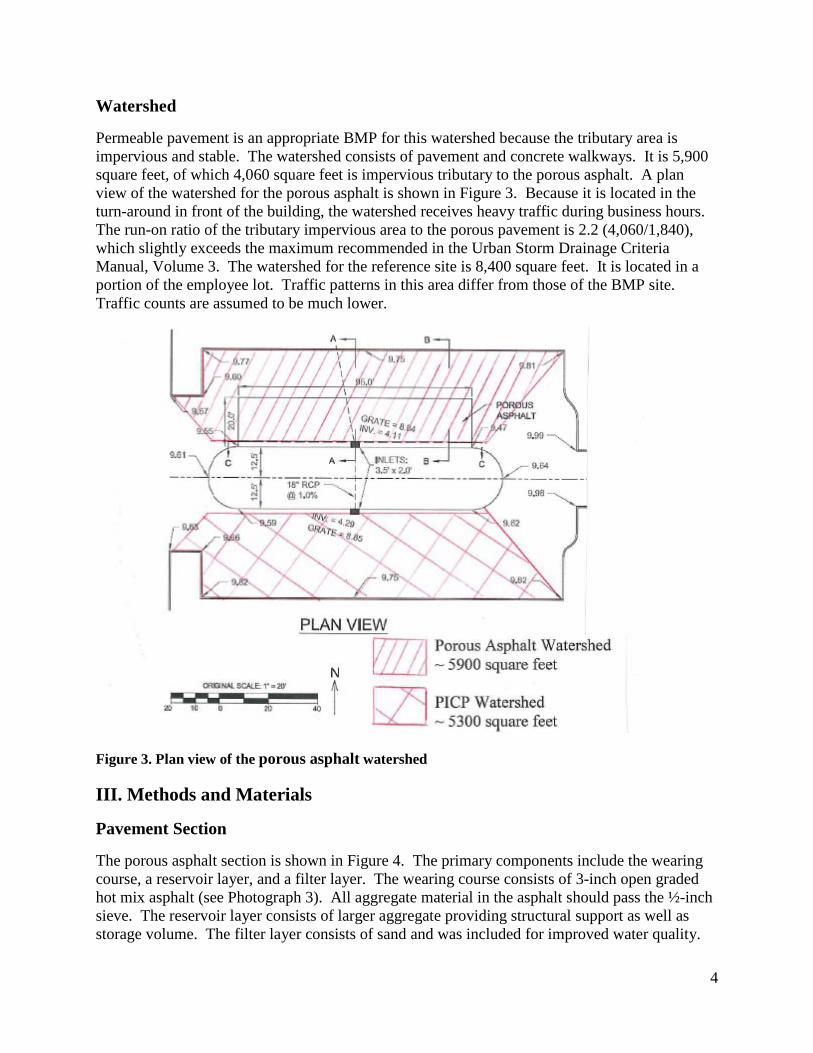
Watershed
Permeable pavement is an appropriate BMP for this watershed because the tributary area is impervious and stable. The watershed consists of pavement and concrete walkways. It is 5,900 square feet, of which 4,060 square feet is impervious tributary to the porous asphalt. A plan view of the watershed for the porous asphalt is shown in Figure 3. Because it is located in the turn-around in front of the building, the watershed receives heavy traffic during business hours. The run-on ratio of the tributary impervious area to the porous pavement is 2.2 (4,060/1,840), which slightly exceeds the maximum recommended in the Urban Storm Drainage Criteria Manual, Volume 3. The watershed for the reference site is 8,400 square feet. It is located in a portion of the employee lot. Traffic patterns in this area differ from those of the BMP site. Traffic counts are assumed to be much lower.
Figure 3. Plan view of the porous asphalt watershed
III. Methods and Materials
Pavement Section
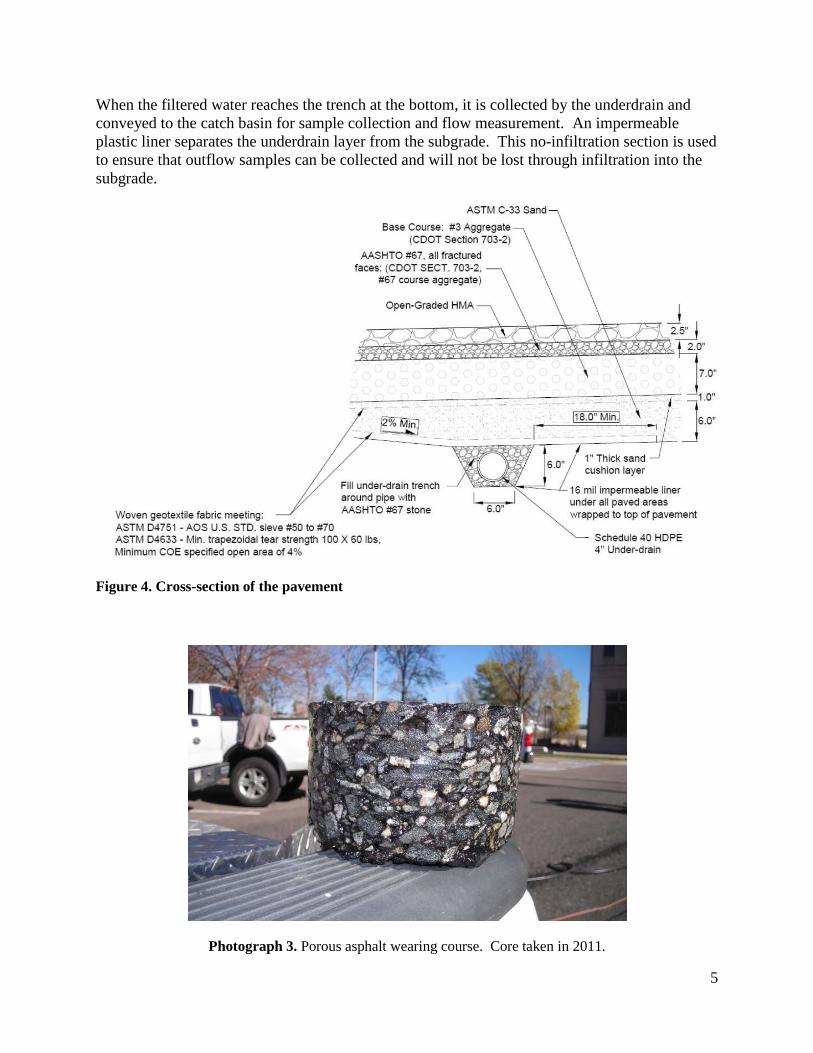
The porous asphalt section is shown in Figure 4. The primary components include the wearing course, a reservoir layer, and a filter layer. The wearing course consists of 3-inch open graded hot mix asphalt (see Photograph 3). All aggregate material in the asphalt should pass the ½-inch sieve. The reservoir layer consists of larger aggregate providing structural support as well as storage volume. The filter layer consists of sand and was included for improved water quality.
5
When the filtered water reaches the trench at the bottom, it is collected by the underdrain and conveyed to the catch basin for sample collection and flow measurement. An impermeable plastic liner separates the underdrain layer from the subgrade. This no-infiltration section is used to ensure that outflow samples can be collected and will not be lost through infiltration into the subgrade.
Figure 4. Cross-section of the pavement
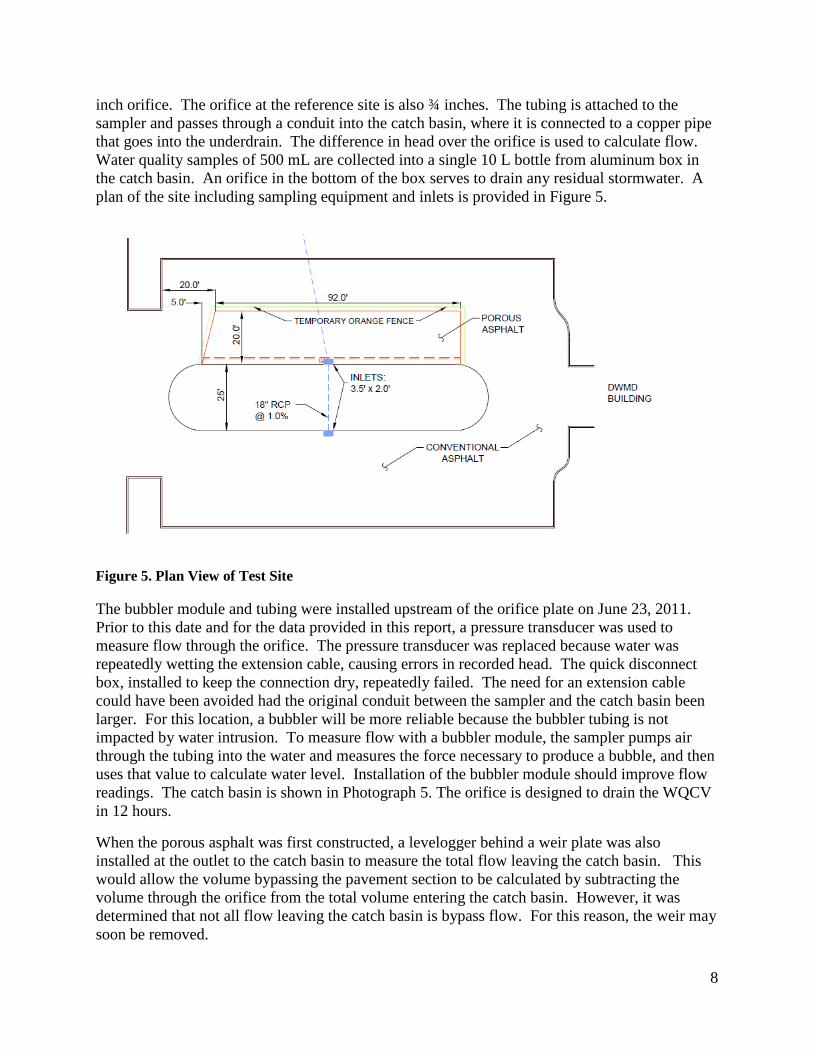
Photograph 3. Porous asphalt wearing course. Core taken in 2011.

6
Data Collection
UDFCD has been collecting water quality and flow data from this site since 2008. Automatic samplers (ISCO Model 6712) are used to collect flow data from the PICP and the reference site throughout the runoff event. The sampling equipment is stored in a metal job box located in the landscaped island of the turn-around. Rainfall is measured to 0.01 inches by an ISCO 674 tipping bucket rain gauge (see Photograph 4) on a post near the storage box. When the rain gauge detects over 0.08 inches in two hours and the pressure transducer measures a difference in head, the ISCO sampler begins to take samples. As of the 2011 sampling season, the sampler draws a sample (500 mL) after a designated volume of five cubic feet has passed, and continues to draw samples at intervals of five cubic feet thereafter. For the time period of the data provided in this report, the rain gauge took samples after 0.01 inches of rain had fallen in 6 hours. It was modified in 2011 to avoid sampling runoff from very small events.
Photograph 4. Rain gauge and sampler

7
All samples are tested for the following: Category Constituent Units Detection Limits Metals: Dissolved Calcium mg/L 1 Dissolved Iron mg/L 0.05 Dissolved Magnesium mg/L 1 Dissolved Sodium mg/L 1 Dissolved Chromium µg/L 1 Dissolved Manganese µg/L 1 Dissolved Nickel µg/L 2 Dissolved Copper µg/L 5 Dissolved Zinc µg/L 1 Dissolved Selenium µg/L 0.2 Dissolved Silver µg/L 0.1 Dissolved Cadmium µg/L 1 Dissolved Lead µg/L 1 Total Beryllium µg/L 5 Total Chromium µg/L 1 Total Manganese µg/L 1 Total Nickel µg/L 2 Total Copper µg/L 20 Total Zinc µg/L 5 Total Arsenic µg/L 1 Total Selenium µg/L 5 Total Molybdenum µg/L 0.2 Total Silver µg/L 0.5 Total Cadmium µg/L 5 Total Antimony µg/L 5 Total Lead µg/L 5 Chemical: Chloride mg/L 20 Chemical Oxygen Demand mg/L 0.02 Nutrients: Nitrite+Nitrate mg/L 0.01 Dissolved Phosphorus mg/L 1 Dissolved Potassium mg/L 0.1 Total Phosphorus mg/L 0.01 Total Kjeldahl Nitrogen mg/L 0.3 Physical: Total Suspended Solids mg/L 1 Porous Asphalt Monitoring and Sampling
The monitoring station for the porous asphalt consists of an ISCO 6712 sampler which is connected to a rain gauge and a bubbler module. The bubbler module is connected to the end of the underdrain through ¼-inch tubing, and measures flow entering the catch basin through a ¾-
8
inch orifice. The orifice at the reference site is also ¾ inches. The tubing is attached to the sampler and passes through a conduit into the catch basin, where it is connected to a copper pipe that goes into the underdrain. The difference in head over the orifice is used to calculate flow. Water quality samples of 500 mL are collected into a single 10 L bottle from aluminum box in the catch basin. An orifice in the bottom of the box serves to drain any residual stormwater. A plan of the site including sampling equipment and inlets is provided in Figure 5.
Figure 5. Plan View of Test Site
The bubbler module and tubing were installed upstream of the orifice plate on June 23, 2011. Prior to this date and for the data provided in this report, a pressure transducer was used to measure flow through the orifice. The pressure transducer was replaced because water was repeatedly wetting the extension cable, causing errors in recorded head. The quick disconnect box, installed to keep the connection dry, repeatedly failed. The need for an extension cable could have been avoided had the original conduit between the sampler and the catch basin been larger. For this location, a bubbler will be more reliable because the bubbler tubing is not impacted by water intrusion. To measure flow with a bubbler module, the sampler pumps air through the tubing into the water and measures the force necessary to produce a bubble, and then uses that value to calculate water level. Installation of the bubbler module should improve flow readings. The catch basin is shown in Photograph 5. The orifice is designed to drain the WQCV in 12 hours.
When the porous asphalt was first constructed, a levelogger behind a weir plate was also installed at the outlet to the catch basin to measure the total flow leaving the catch basin. This would allow the volume bypassing the pavement section to be calculated by subtracting the volume through the orifice from the total volume entering the catch basin. However, it was determined that not all flow leaving the catch basin is bypass flow. For this reason, the weir may soon be removed.

9
Photograph 5. Inlet to the porous asphalt catch basin
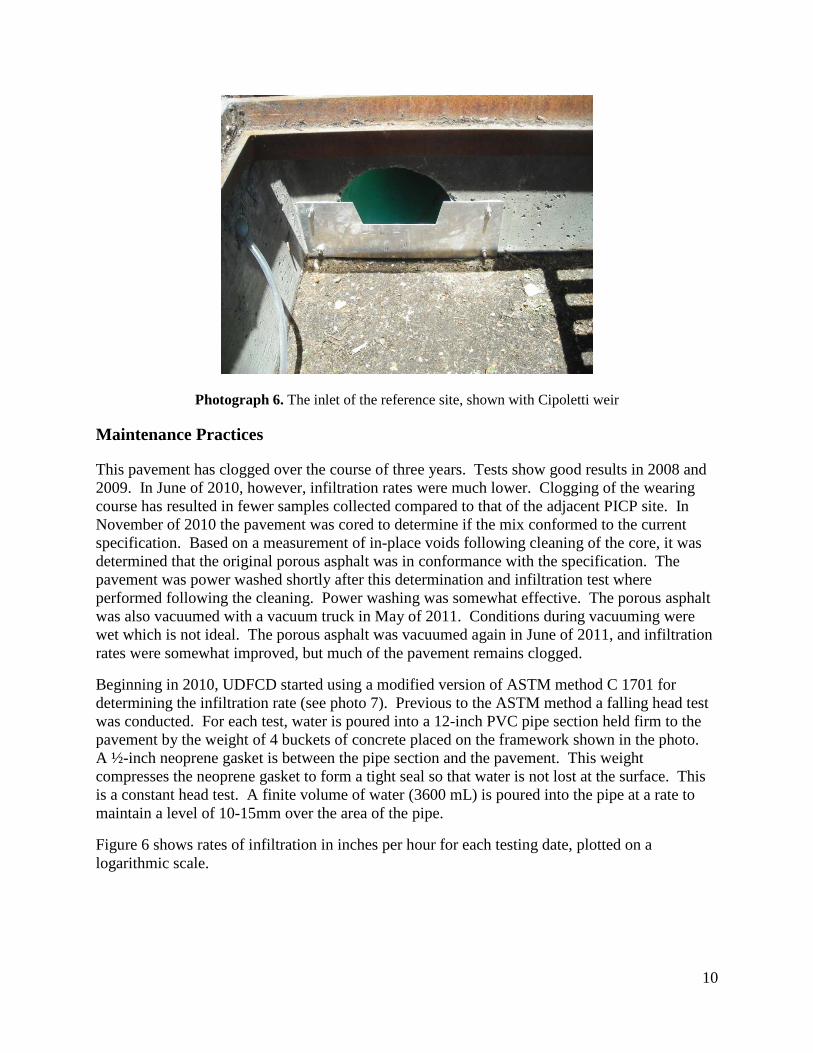
Reference Site Monitoring and Sampling
The reference site monitoring station includes an ISCO 6712 automated sampler. Stormwater runoff from the control watershed flows into a catch basin located in the northeast corner of the parking lot. Sampler tubing pulls samples from the bottom of the catch basin while a pressure transducer measures head behind a Cipoletti weir (shown in Photograph 6). Outlet flow is calculated based on the difference in head upstream of the weir. The sampling equipment is stored in a metal box adjacent to the parking lot in a manner similar to the porous asphalt sampling configuration.
Bubbler tubing
Sampler tubing
Orifice
Pooling Cavity
10
Photograph 6. The inlet of the reference site, shown with Cipoletti weir
Maintenance Practices
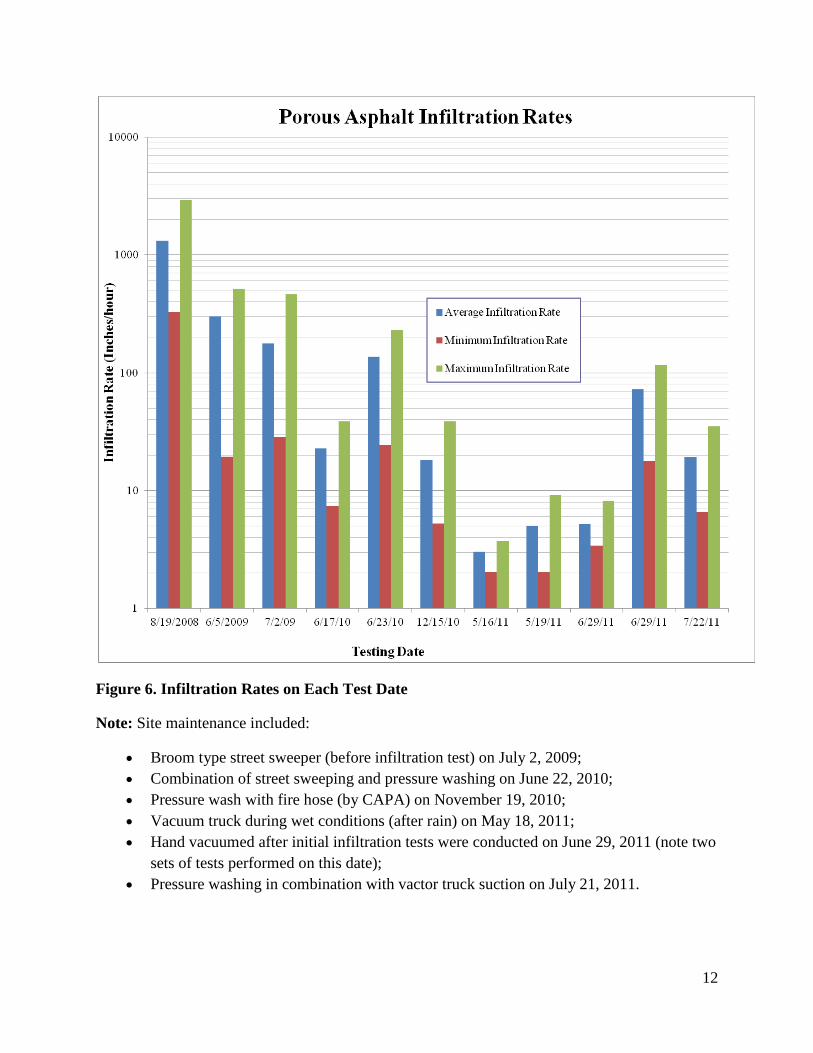
This pavement has clogged over the course of three years. Tests show good results in 2008 and 2009. In June of 2010, however, infiltration rates were much lower. Clogging of the wearing course has resulted in fewer samples collected compared to that of the adjacent PICP site. In November of 2010 the pavement was cored to determine if the mix conformed to the current specification. Based on a measurement of in-place voids following cleaning of the core, it was determined that the original porous asphalt was in conformance with the specification. The pavement was power washed shortly after this determination and infiltration test where performed following the cleaning. Power washing was somewhat effective. The porous asphalt was also vacuumed with a vacuum truck in May of 2011. Conditions during vacuuming were wet which is not ideal. The porous asphalt was vacuumed again in June of 2011, and infiltration rates were somewhat improved, but much of the pavement remains clogged.
Beginning in 2010, UDFCD started using a modified version of ASTM method C 1701 for determining the infiltration rate (see photo 7). Previous to the ASTM method a falling head test was conducted. For each test, water is poured into a 12-inch PVC pipe section held firm to the pavement by the weight of 4 buckets of concrete placed on the framework shown in the photo. A ½-inch neoprene gasket is between the pipe section and the pavement. This weight compresses the neoprene gasket to form a tight seal so that water is not lost at the surface. This is a constant head test. A finite volume of water (3600 mL) is poured into the pipe at a rate to maintain a level of 10-15mm over the area of the pipe.
Figure 6 shows rates of infiltration in inches per hour for each testing date, plotted on a logarithmic scale.

11
Photograph 7. The apparatus used for the infiltration test on December 9, 2010.
12
Figure 6. Infiltration Rates on Each Test Date
Note: Site maintenance included:
• Broom type street sweeper (before infiltration test) on July 2, 2009; • Combination of street sweeping and pressure washing on June 22, 2010; • Pressure wash with fire hose (by CAPA) on November 19, 2010; • Vacuum truck during wet conditions (after rain) on May 18, 2011; • Hand vacuumed after initial infiltration tests were conducted on June 29, 2011 (note two
sets of tests performed on this date); • Pressure washing in combination with vactor truck suction on July 21, 2011.

13
IV. Results and Discussion
Outflow Volume Reduction
Due to problems with the pressure transducer that were mentioned in the porous asphalt Monitoring and Sampling section, flow volumes provided in this report should not be used to calculate volume reduction through this BMP. The accuracy of volume calculations should improve with the installation of the bubbler at the BMP site. Figure 7, below, depicts the outflow volumes for the BMP and reference site, which are plotted on a logarithmic scale due to the wide range of values. Only the paired data was plotted here. Tables 1-3 contain all the data for each year. The figure compares the unit flow rate (volume per area of tributary) as the reference site and BMP site have different tributary areas. The porous asphalt watershed area is 70% of the watershed area of the reference site. Note that the values for storms 3a-3c in 2008 are the same because they represent overlapping events with continuous flow throughout the different storm events.
Figure 7. Comparison of Inflow and Outflow Volumes for Each Storm Event

14
Table 1. Flow Data for 2008
Table 2. Flow Data for 2009
2008 Storm Event
Reference Flow
Start Date
Reference Flow Start
Time
Reference Flow End
Date
Reference Flow End
Time
Reference Flow
Duration (hours)
BMP Outlet Flow Start Date
BMP Outlet Flow Start Time
BMP Outlet Flow End Date
BMP Outlet Flow End Time
BMP Outlet Flow
Duration (hours)
Rainfall (in)
Total Reference
Flow Volume
(cf)
Total BMP Outlet Flow
Volume (cf)
Peak Reference
Flow Rate (cfs)
Peak BMP Outlet Flow Rate (cfs)
Reference Site
Volume per Unit Tributary
Area (cf/sf)
BMP Volume per Unit Tributary
Area (cf/sf)
2 8-Aug 19:37 8-Aug 19:51 0:14 8-Aug 19:19 8-Aug 23:57 4:38 1.15 5.88 2.74 0.75 0.02 0.0007 0.00053a 15-Aug 3:17 16-Aug 21:34 42:17 15-Aug 2:59 17-Aug 12:00 57:01 0.69 1109.39 15.16 1.53 0.02 0.1321 0.00263b 15-Aug 3:17 16-Aug 21:34 42:17 15-Aug 2:59 17-Aug 12:00 57:01 1.37 1109.39 15.16 1.53 0.02 0.1321 0.00263c 17-Aug 1:33 17-Aug 8:40 7:07 15-Aug 2:59 17-Aug 12:00 57:01 0.1 122.03 15.16 0.72 0.02 0.0145 0.00264 11-Sep 19:44 12-Sep 12:34 16:50 11-Sep 19:44 12-Sep 14:13 18:29 1.19 109.14 3.10 0.38 0.01 0.0130 0.0005
2009 Storm Event
Reference Flow
Start Date
Reference Flow Start Time
Reference Flow End
Date
Reference Flow End
Time
Reference Flow
Duration (hours)
BMP Outlet Flow Start Date
BMP Outlet Flow Start Time
BMP Outlet Flow End Date
BMP Outlet Flow End Time
BMP Outlet Flow
Duration (hours)
Rainfall (in)
Total Reference
Flow Volume
(cf)
Total BMP Outlet Flow
Volume (cf)
Peak Reference
Flow Rate (cfs)
Peak BMP Outlet Flow Rate (cfs)
Reference site
Volume per Unit Tributary
Area
BMP Volume per Unit Tributary
Area (cf/sf)
1 ** ** ** ** ** 16-Apr 20:04 17-Apr 17:56 21:52 1.06 ** 120.19 ** 0.007 ** 0.020372 ** ** ** ** ** 18-Apr 6:39 18-Apr 19:28 12:49 1.44 ** 254.59 ** 0.009 ** 0.043154 ** ** ** ** ** 26-Apr 22:37 27-Apr 12:08 13:31 0.54 ** 149.47 ** 0.005 ** 0.025337 22-May 19:45 22-May 21:27 1:42 22-May 19:04 23-May 9:36 14:32 0.17 12.59 23.54 0.023 0.003 0.0015 0.003999 24-May 15:51 24-May 18:44 2:53 24-May 15:48 24-May 19:24 3:36 0.69 1278.63 81.47 1.822 0.018 0.1522 0.01381
10 25-May 10:20 25-May 13:18 2:58 25-May 10:15 25-May 12:38 2:23 0.15 601.28 11.34 0.119 0.003 0.0716 0.0019211 25-May 18:59 26-May 10:45 15:46 25-May 18:38 26-May 3:17 8:39 1.26 32645.86 237.01 1.511 0.019 3.8864 0.0401712 1-Jun 4:40 2-Jun 14:05 9:25 1-Jun 20:48 2-Jun 13:09 16:21 0.89 4864.68 113.86 0.252 0.006 0.5791 0.0193013 ** ** ** ** ** 11-Jun 12:53 11-Jun 13:21 0:28 0.19 ** 5.85 ** 0.005 ** 0.0009915 ** ** ** ** ** 13-Jun 17:58 13-Jun 18:27 0:29 0.17 ** 5.59 ** 0.004 ** 0.0009516 ** ** ** ** ** 25-Jun 18:03 25-Jun 20:34 2:31 0.39 ** 19.28 ** 0.004 ** 0.0032717 ** ** ** ** ** 26-Jun 14:59 26-Jun 15:57 0:58 0.19 ** 9.84 ** 0.004 ** 0.0016718 1-Jul 23:30 1-Jul 23:52 0:22 1-Jul 23:37 2-Jul 0:37 1:00 0.45 66.95 15.38 0.128 0.008 0.0080 0.0026119 ** ** ** ** ** 3-Jul 17:11 3-Jul 18:19 1:08 0.40 ** 15.26 ** 0.007 ** 0.0025920 4-Jul 0:38 4-Jul 3:49 3:11 4-Jul 0:56 4-Jul 1:56 1:00 0.18 24.71 4.76 0.077 0.003 0.0029 0.0008121 20-Jul 22:41 20-Jul 22:46 0:05 20-Jul 22:42 20-Jul 23:06 0:24 0.45 133.05 2.65 0.653 0.005 0.0158 0.0004522 25-Jul 21:25 25-Jul 21:32 0:07 25-Jul 21:42 25-Jul 22:19 0:37 0.48 50.74 3.92 0.216 0.002 0.0060 0.0006624 29-Jul 18:46 30-Jul 1:34 6:48 29-Jul 18:42 30-Jul 12:02 17:20 0.22 1152.45 44.53 0.334 0.001 0.1372 0.0075525 6-Aug 16:05 6-Aug 16:24 0:19 6-Aug 16:03 6-Aug 16:24 0:21 0.39 693.80 1.68 1.688 0.005 0.0826 0.0002827 ** ** ** ** ** 18-Aug 13:09 18-Aug 14:13 1:04 0.07 ** 2.66 ** 0.001 ** 0.0004528 ** ** ** ** ** 12-Sep 16:28 13-Sep 10:45 18:17 0.14 ** 52.84 ** 0.001 ** 0.0089633 ** ** ** ** ** 25-Sep 1:53 25-Sep 6:07 4:14 0.18 ** 17.30 ** 0.001 ** 0.00293
**=No Data

15
Table 3. Flow Data for 2010
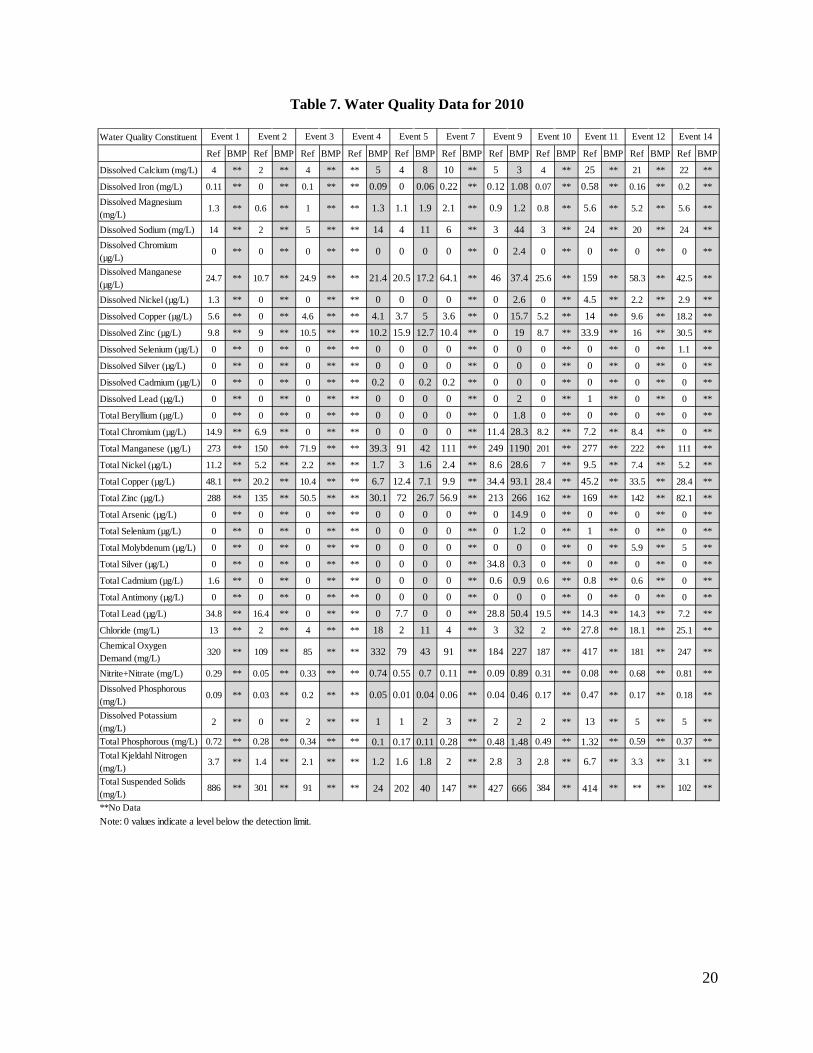
Water Quality Impacts
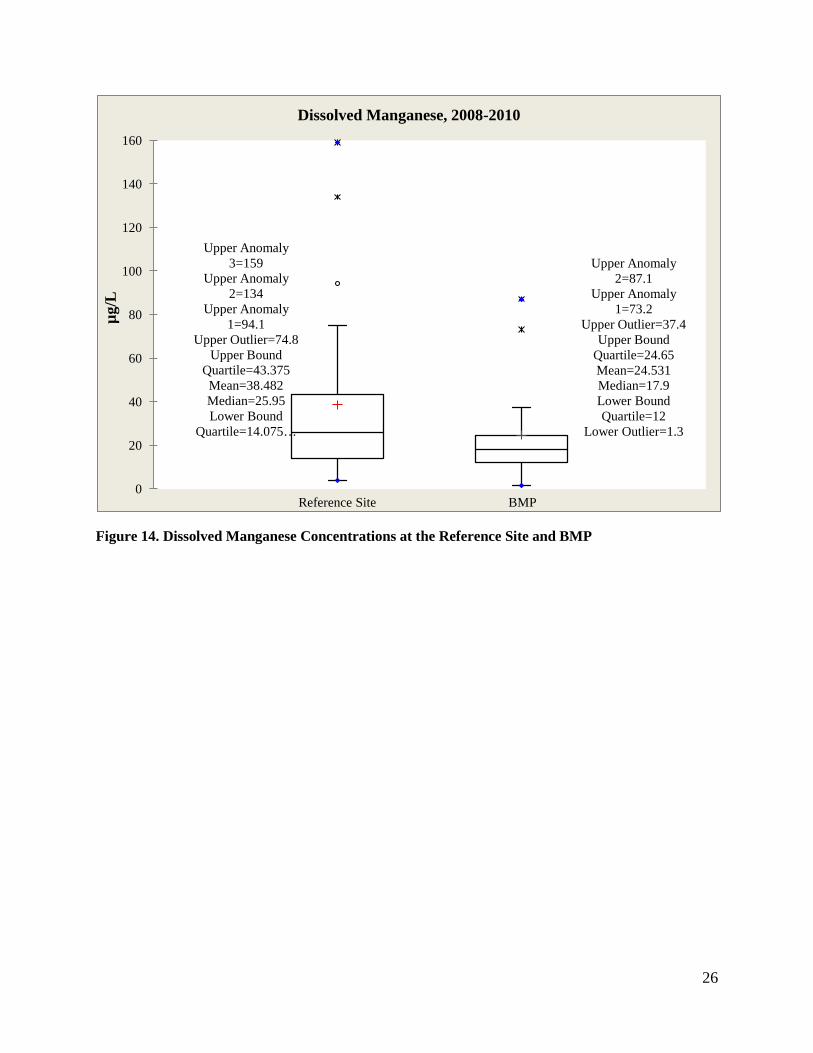
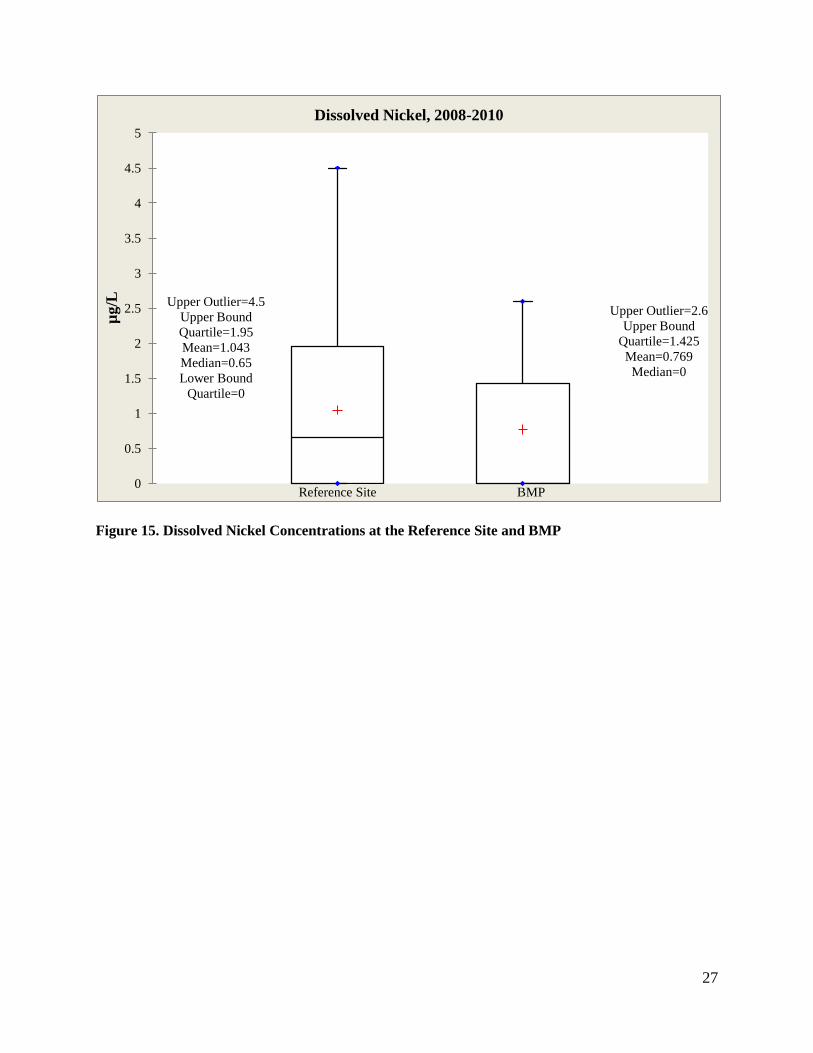
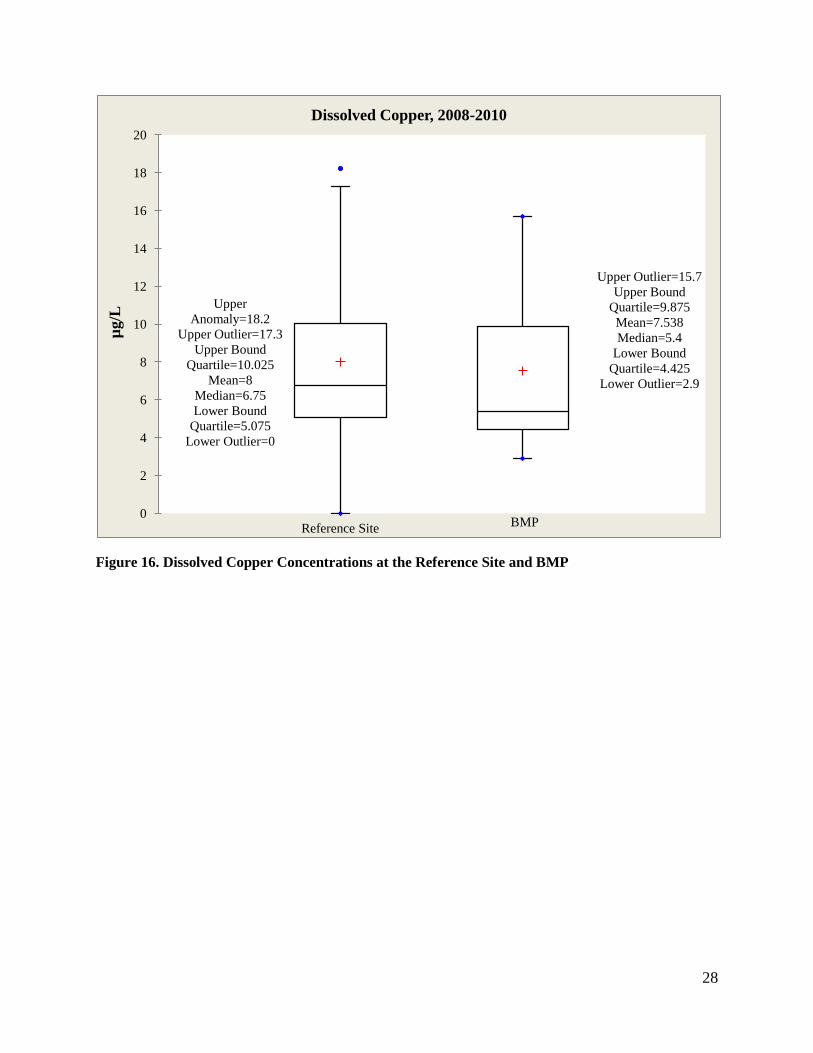
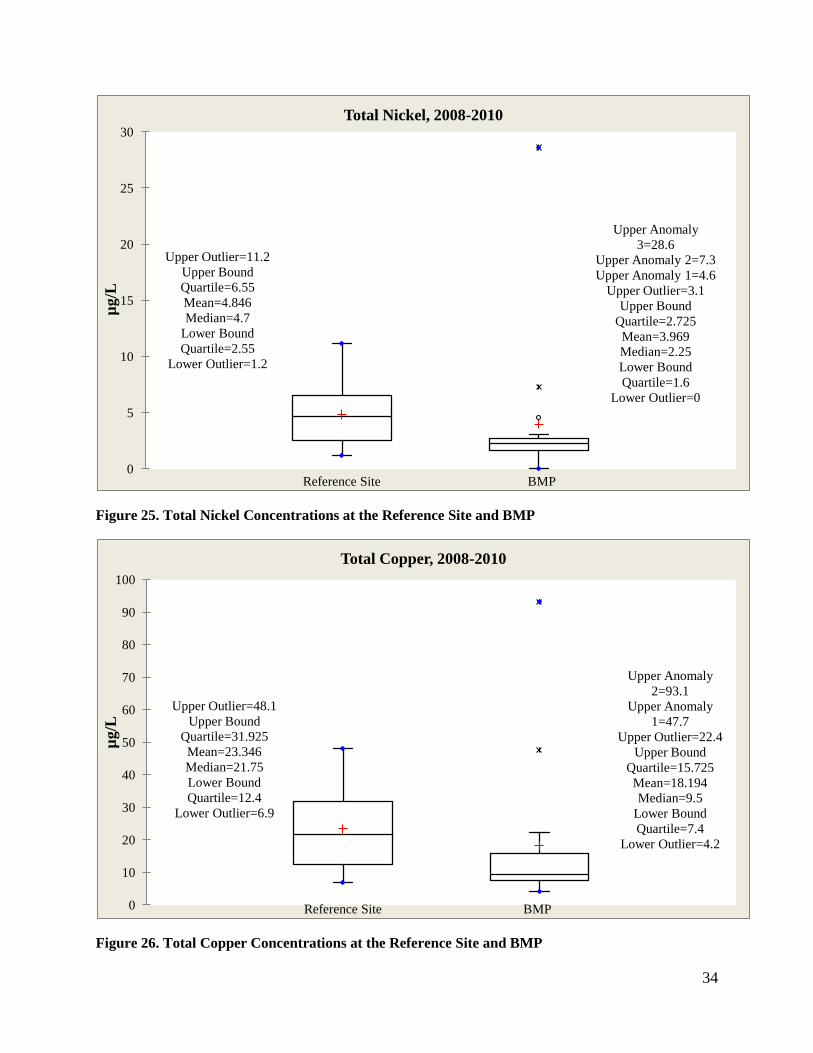
To conduct the water quality analysis, t-tests were performed to compare the arithmetic means for the reference site and the BMP for each constituent. Since the sample sizes for 2008 and 2010 were too small to analyze the data by year, the reference site and BMP data for all years was combined and then analyzed. Since the number of samples was quite small, under 30, it was unclear whether or not the data fit a normal distribution (a bell-shaped curve). Therefore, both parametric tests and non-parametric tests were performed on the data, parametric tests being used when data is normally distributed, and non-parametric tests being used when it is not normally distributed. In cases where the data did not seem to fit a normal distribution a non-parametric Wilcoxon signed-rank test was performed in addition to parametric paired t-tests and two sample t-tests. The two sample t-test is unpaired and is used to compare the means of two independent samples, and a paired t-test is used to compare two related samples over time. The p-values generated for each of the constituents (alpha=0.05) are shown in Table 4. The values that were significant, below the alpha level of 0.05, are shown in bold text. It is also important to note that in cases where certain constituents were not detected in a sample, we used 0 as a number for our analysis.
For most constituents there were few significant differences between the outflows at the reference site and the porous asphalt. Dissolved Potassium, Chloride, and Dissolved Phosphorus (according to one test) were significantly lower in the porous asphalt outflows; however, Nitrite+Nitrate, Total Selenium, and Dissolved Sodium were all in significantly higher concentrations in the porous asphalt outflows. One possible explanation for some of the higher constituent concentrations at the BMP may be the differences in traffic load between the BMP and the reference site. While the current reference site is as close as possible to the PICP, it is an employee parking lot that receives much less traffic. The porous asphalt, on the other hand, experiences heavy traffic during business hours.
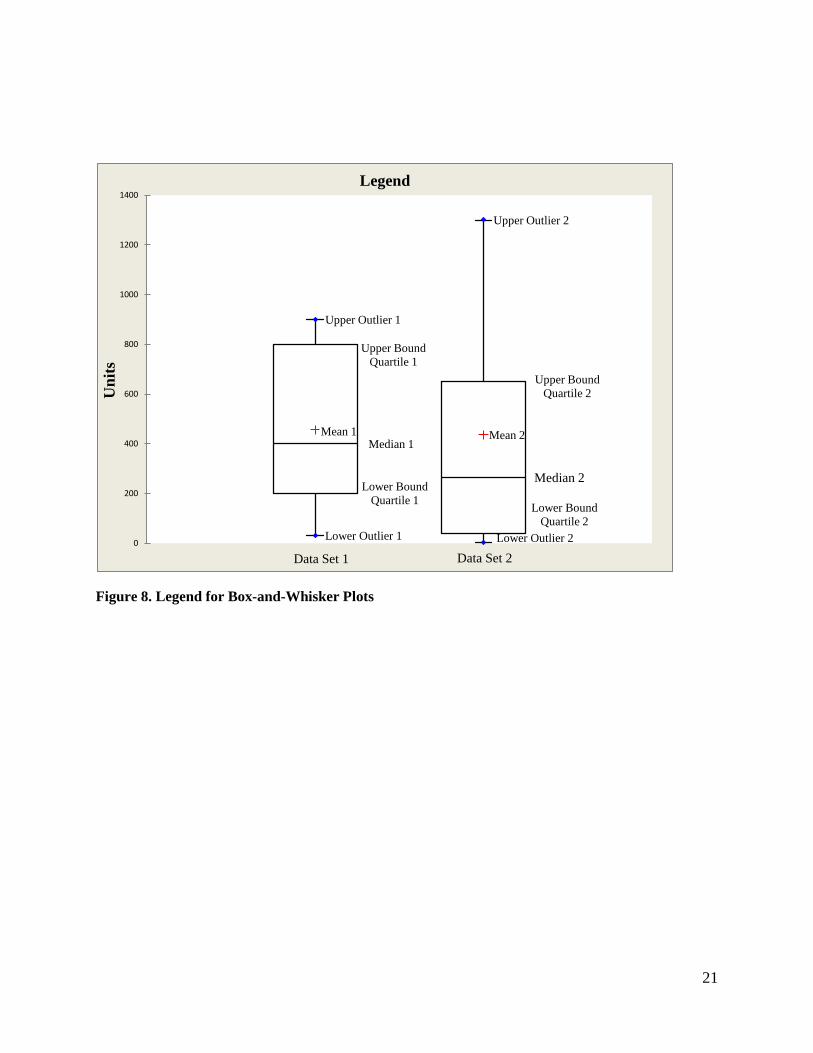
All water quality data is provided in Tables 5-7. Note that in these tables, Reference was abbreviated to Ref to save space. Box-and-whisker plots comparing inflows and outflows for
2010 Storm Event
Reference Flow
Start Date
Reference Flow Start
Time
Reference Flow End
Date
Reference Flow End
Time
Reference Flow
Duration (hours)
BMP Outlet Flow Start Date
BMP Outlet Flow Start Time
BMP Outlet Flow End Date
BMP Outlet Flow End Time
BMP Outlet Flow
Duration (hours)
Rainfall (in)
Total Reference
Flow Volume
(cf)
Total BMP Outlet Flow
Volume (cf)
Peak Reference
Flow Rate (cfs)
Peak BMP Outlet Flow Rate (cfs)
Reference site
Volume per Unit Tributary
Area (cf/sf)
BMP Volume per Unit Tributary
Area (cf/sf)
1 22-Apr 18:25 23-Apr 13:00 18:35 ** ** ** ** ** ** 5008.07 ** 0.70 ** 0.5962 **3 11-May 18:01 12-May 0:46 6:45 ** ** ** ** ** ** 3301.97 ** 0.44 ** 0.3931 **4 13-May 21:02 14-May 1:43 4:41 13-May 20:05 14-May 13:15 17:10 0.14 252.35 52.84 0.03 0.00 0.0300 0.00905 14-May 15:35 15-May 5:56 14:21 14-May 15:32 15-May 10:45 19:13 0.45 13420.38 50.76 0.50 0.00 1.5977 0.00867 11-Jun 19:37 13-Jun 13:18 41:41 11-Jun 15:39 13-Jun 11:37 43:58 1.28 675.15 23.59 0.63 0.00 0.0804 0.00408 13-Jun 20:31 13-Jun 22:17 1:46 13-Jun 19:49 13-Jun 21:22 1:33 0.05 25.41 1.59 0.01 0.00 0.0030 0.00039 4-Jul 20:56 5-Jul 2:29 5:33 4-Jul 20:18 6-Jul 16:01 43:43 0.63 800.41 133.37 0.30 0.00 0.0953 0.022610 7-Jul 0:18 7-Jul 2:37 2:19 7-Jul 1:37 8-Jul 7:09 29:18 0.29 371.67 62.25 0.40 0.00 0.0442 0.010611 20-Jul 17:55 20-Jul 21:53 3:58 ** ** ** ** ** 0.21 153.63 ** 0.04 ** 0.0183 **12 2-Aug 20:40 3-Aug 0:35 3:55 ** ** ** ** ** 0.08 201.02 ** 0.04 ** 0.0239 **13 9-Aug 17:13 9-Aug 19:08 1:55 9-Aug 16:55 10-Aug 11:24 18:29 0.13 134.78 45.03 0.24 0.00 0.0160 0.007614 24-Aug 3:54 24-Aug 8:35 4:41 ** ** ** ** ** 0.07 170.52 ** 0.05 ** 0.0203 **
**=No Data

16
each constituent are shown in Figures 10 through 43. A legend for the box-and-whisker plots is provided in Figure 9.
Table 4. Significance of Differences in Constituent Concentrations at Reference Site and BMP
Constituent Two sample t-test Wilcoxon signed rank test
Paired t-test
Dissolved Calcium 0.5648 0.4053 0.5115 Dissolved Iron 0.3325 0.2785 0.2974
Dissolved Potassium 0.03272 0.01198 0.03279 Dissolved Magnesium 0.1177 0.09766 0.1376
Dissolved Sodium 0.004055 0.01427 0.0088238 Dissolved Chromium 0.1202 0.1814 0.1202 Dissolved Manganese 0.4745 0.3008 0.427
Dissolved Nickel 0.7984 1 0.8113 Dissolved Copper 0.3399 0.9102 0.4442
Dissolved Zinc 0.7379 0.7344 0.7556 Dissolved Selenium 0.08091 0.1736 0.08091
Dissolved Silver NA (all values 0) NA NA Dissolved Cadmium 0.2911 0.05791 0.2868
Dissolved Lead 0.3466 1 0.3466 Total Beryllium 0.3466 1 0.3466 Total Chromium 0.8514 1 0.8002 Total Manganese 0.5904 0.8203 0.5409
Total Nickel 0.6293 0.7344 0.5342 Total Copper 0.7032 0.7344 0.5858
Total Zinc 0.6529 0.4961 0.6691 Total Arsenic 0.3466 1 0.3466
Total Selenium 0.04181 0.1003 0.04181 Total Molybdenum 0.08634 0.1814 0.08634
Total Silver 0.3473 0.4227 0.3437 Total Cadmium 0.3511 0.6845 0.3581 Total Antimony NA NA NA
Total Lead 0.4809 0.4469 0.3766 Chloride 0.02107 0.03125 0.03972
COD 0.9783 0.3594 0.9791 Nitrite+Nitrate 0.0009447 0.007812 0.007334
Dissolved Phosphorus 0.2752 0.02225 0.2677 Total Phosphorus 0.928 0.3436 0.9176
TKN 0.4265 0.25 0.4314 TSS 0.2807 0.3627 0.268

17
Table 5. Water Quality Data for 2008
Water Quality ConstituentRef BMP Ref BMP Ref BMP Ref BMP Ref BMP
Dissolved Calcium (mg/L) ** 33 11 10 6 11 13 14 9 **Dissolved Iron (mg/L) ** 0 0.15 0.14 0.1 0.1 0.08 0.08 0.08 **Dissolved Magnesium (mg/L)
** 6.8 1.7 2.2 1 2.3 2 2.9 1.6 **
Dissolved Sodium (mg/L) ** 64 6 28 5 18 13 19 7 **Dissolved Chromium (µg/L) ** 5.6 0 1.2 0 0 0 0 0 **Dissolved Manganese (µg/L) ** 13.9 94.1 21.1 5.7 2.9 34.2 1.3 30.2 **Dissolved Nickel (µg/L) ** 2.1 1.3 1.3 0 0 1.5 0 0 **Dissolved Copper (µg/L) ** 14.9 5.5 12.5 7.8 5.1 7.8 6.4 17.3 **Dissolved Zinc (µg/L) ** 921 13 10.4 12.4 15.7 33.3 14.6 25.8 **Dissolved Selenium (µg/L) ** 0 0 1 0 0 0 0 0 **Dissolved Silver (µg/L) ** 0 0 0 0 0 0 0 0 **Dissolved Cadmium (µg/L) ** 0.6 0.1 0.4 0 0 0.1 0.1 0.3 **Dissolved Lead (µg/L) ** 0 0 0 0 0 0 0 0 **Total Beryllium (µg/L) ** 0 0 0 0 0 0 0 0 **Total Chromium (µg/L) ** 6.3 8.2 0 0 0 9.4 0 0 **Total Manganese (µg/L) ** 20.8 254 99.5 74.5 47.6 232 43.6 124 **Total Nickel (µg/L) ** 2.5 7.4 3.1 2.8 1.7 8.7 7.3 4.4 **Total Copper (µg/L) ** 15.3 31.7 14.7 15.3 7.5 43.6 47.7 36.4 **Total Zinc (µg/L) ** 1010 188 26.5 67.1 33.3 245 38.2 147 **Total Arsenic (µg/L) ** 0 0 0 0 0 0 0 0 **Total Selenium (µg/L) ** 1 0 1.3 0 0 0 0 0 **Total Molybdenum ** 28.8 0 8.4 0 5.8 0 0 0 **Total Silver (µg/L) ** 0 0 0 0 0 0.4 0 0 **Total Cadmium (µg/L) ** 0.7 1 0.7 0 0 1 0 0.9 **Total Antimony (µg/L) ** 14 0 0 0 0 0 0 0 **Total Lead (µg/L) ** 0 28.3 0 9 0 27.7 0 15.2 **Chloride (mg/L) ** 75 6 12 ** ** ** ** ** **Chemical Oxygen Demand (mg/L)
** 111 418 57 48 19 252 39 174 **
Nitrite+Nitrate (mg/L) ** 1.57 0.19 1.79 0.27 1.24 0.69 0.98 0.28 **Dissolved Phosphorus ** 0.03 0.04 0.11 0.04 0.1 0.02 0.1 0.1 **Dissolved Potassium (mg/L) ** 14 2 3 1 3 2 3 3 **Total Phosphorus (mg/L) ** 0.18 0.9 0.32 0.13 0.16 0.46 0.19 0.33 **Total Kjeldahl Nitrogen (mg/L)
** 3.7 4.5 1.5 1.2 0.9 4.2 0 2 **
Total Suspended Solids (mg/L)
** 16 1360 52 131 25 34 508 154 **
**No DataNote: 0 values indicate a level below the detection limit.
Storm Event 1 Storm Event 2 Storm Event 3 Storm Event 4 Storm Event 5

18
Table 6. Water Quality Data for 2009
Water Quality ConstituentBMP Ref BMP Ref BMP Ref BMP Ref BMP Ref BMP Ref BMP Ref BMP Ref BMP Ref BMP Ref
Dissolved Calcium (mg/L) ** 5 31 ** ** 16 ** 6 12 3 ** 19 ** 7 ** 41 16 8 11 23Dissolved Iron (mg/L) ** 0.18 0 ** ** 0.11 ** 0.14 0.06 0.06 ** 0.09 ** 0.05 ** 0.47 0.06 0 0.05 0.06Dissolved Magnesium (mg/L)
** 1.4 8.5 ** ** 3.6 ** 1.1 4.3 0.6 ** 3.8 ** 1 ** 7.6 3.3 1.4 2.5 4.6
Dissolved Sodium (mg/L) ** 29 46 ** ** 20 ** 7 44 5 ** 21 ** 8 ** 32 31 7 25 20
Dissolved Chromium (µg/L)
** 0 0 ** ** 0 ** 0 4.1 0 ** 0 ** 0 ** 0 0 0 0 0
Dissolved Manganese (µg/L)
** 32.6 16 ** ** 11.8 ** 33.7 6.1 16.7 ** 12 ** 14.2 ** 13.7 73.2 28.3 6.3 4
Dissolved Nickel (µg/L) ** 1.5 1.5 ** ** 1.9 ** 0 0 0 ** 2.1 ** 2.4 ** 2.6 1.1 0 0 1.3Dissolved Copper (µg/L) ** 16.9 9 ** ** 11.3 ** 5.6 4.7 3 ** 14.5 ** 16.1 ** 8.6 4.2 6.1 5.7 8.1Dissolved Zinc (µg/L) ** 20.8 151 ** ** 23 ** 34.7 0 10.7 ** 12.7 ** 354 ** 13.1 25.5 9.2 5.8 9Dissolved Selenium (µg/L)
** 0 0 ** ** 0 ** 0 1.1 0 ** 0 ** 0 ** 0 1 0 0 0
Dissolved Silver (µg/L) ** 0 0 ** ** 0 ** 0 0 0 ** 0 ** 0 ** 0 0 0 0 0Dissolved Cadmium (µg/L)
** 0.2 1.2 ** ** 0.1 ** 0.3 0 0 ** 0 ** 0.7 ** 0 6.5 0.1 0.4 0.2
Dissolved Lead (µg/L) ** 0 0 ** ** 0 ** 0 0 0 ** 0 ** 0 ** 0 0 0 0 0Total Beryllium (µg/L) ** 0 0 ** ** 0 ** 0 0 0 ** 0 ** 0 ** 0 0 0 0 0Total Chromium (µg/L) ** 0 0 ** ** 5.3 ** 6.3 6.8 0 ** 0 ** 5.8 ** 0 0 0 0 0Total Manganese (µg/L) ** 110 40.6 ** ** 164 ** 176 72 61.8 ** 63 ** 92.2 ** 239 159 47.6 70.1 61.1Total Nickel (µg/L) ** 5 2.6 ** ** 5.9 ** 5.8 2.2 2.1 ** 3 ** 6.4 ** 4.3 4.6 1.5 2.3 2.1Total Copper (µg/L) ** 32.6 14.4 ** ** 31.4 ** 23.3 8.7 12.9 ** 18.7 ** 31 ** 19 22.4 8.7 9.5 11.4Total Zinc (µg/L) ** 129 213 ** ** 163 ** 149 0 59.4 ** 40.7 ** 1090 ** 66.1 906 30 29 30.1Total Arsenic (µg/L) ** 0 0 ** ** 0 ** 0 0 0 ** 0 ** 0 ** 0 0 0 0 0Total Selenium (µg/L) ** 0 0 ** ** 0 ** 0 1.1 0 ** 0 ** 0 ** 0 1.9 0 0 0Total Molybdenum (µg/L) ** 0 0 ** ** 0 ** 0 8.9 0 ** 0 ** 0 ** 6.2 0 0 0 0Total Silver (µg/L) ** 0 0 ** ** 0 ** 0 0 0 ** 0 ** 0 ** 0 0.2 0 0 0Total Cadmium (µg/L) ** 0 1.5 ** ** 0.8 ** 0.6 0 0 ** 0 ** 3.6 ** 0 19.7 0 0.6 0Total Antimony (µg/L) ** 0 37.8 ** ** 0 ** 0 0 0 ** 0 ** 23.3 ** 0 0 0 0 0Total Lead (ug/L) ** 16.7 0 ** ** 18.1 ** 20.9 0 5.9 ** 0 ** 9.4 ** 6.6 11.4 0 0 0Chloride (mg/L) ** 34 137 ** ** ** ** 4 41 3 ** 23 ** 6 ** 35 25 6 18 21Chemical Oxygen Demand (mg/L) ** 194 46 ** ** 184 ** 172 26 39 ** 151 ** 129 ** 146 860 106 32 122
Nitrite+Nitrate (mg/L) ** 0.96 1.22 ** ** 0.72 ** 0.19 1.35 0.14 ** 0.64 ** 0.29 ** 0.05 0.59 0.48 1.44 0.34Dissolved Phosphorus (mg/L) ** 0.12 0.07 ** ** 0.14 ** 0.05 0.11 0.03 ** 0.03 ** 0.03 ** 0.09 4.25 0.1 ** 0.06
Dissolved Potassium (mg/L) ** 2 4 ** ** 4 ** 2 5 0 ** 4 ** 6 ** 7 10 2 4 3
Total Phosphorus (mg/L) ** 0.32 0.17 ** ** 0.48 ** 0.38 0.19 0.15 ** 0.14 ** 0.27 ** 0.36 6.63 0.19 ** 0.14Total Kjeldahl Nitrogen (mg/L)
** 3 1.6 ** ** 4.7 ** 2.5 0.8 1.1 ** 2.2 ** 4.5 ** 4.1 58 1.8 1.5 2
Total Suspended Solids (mg/L)
** 129 59 ** ** 198 ** 436 38 116 ** 104 ** 235 ** 230 385 91 55 55
**No Data
Note: 0 values indicate a level below the detection limit.
Event 17 Event 18 Event 20Event 14 Event 16Event 1 Event 3 Event 7 Event 11 Event 12

19
Table 6. Water Quality Data for 2009 (Cont.)
Water Quality ConstituentRef BMP Ref BMP Ref BMP Ref BMP Ref BMP Ref BMP Ref BMP Ref BMP Ref BMP
Dissolved Calcium (mg/L) 21 ** 7 ** 24 ** 6 7 6 ** ** 32 ** 14 ** 8 ** 5Dissolved Iron (mg/L) 0.32 ** 0 ** 0.3 ** 0 0 0 ** ** 0.27 ** 0.14 ** 0.1 ** 0Dissolved Magnesium (mg/L)
3.4 ** 1.4 ** 4.2 ** 1.2 1.5 1 ** ** 7.2 ** 2.8 ** 1.6 ** 1
Dissolved Sodium (mg/L) 15 ** 6 ** 18 ** 6 6 5 ** ** 19 ** 11 ** 6 ** 4
Dissolved Chromium (µg/L)
0 ** 0 ** 0 ** 0 0 0 ** ** 0 ** 0 ** 0 ** 0
Dissolved Manganese (µg/L)
134 ** 22 ** 74.8 ** 12.9 17.7 26.3 ** ** 87.1 ** 34.4 ** 18.4 ** 18.1
Dissolved Nickel (µg/L) 2.3 ** 0 ** 1.4 ** 0 0 0 ** ** 2.3 ** 1.4 ** 0 ** 0Dissolved Copper (µg/L) 7.5 ** 5.1 ** 5 ** 5.9 3.4 7.4 ** ** 15.6 ** 6.9 ** 4.5 ** 2.9Dissolved Zinc (µg/L) 20.3 ** 8.1 ** 15.3 ** 5.7 17.6 11.1 ** ** 49.3 ** 39.4 ** 21.1 ** 13.4Dissolved Selenium (µg/L)
0 ** 0 ** 0 ** 0 0 0 ** ** 0 ** 0 ** 0 ** 0
Dissolved Silver (µg/L) 0 ** 0 ** 0 ** 0 0 0 ** ** 0 ** 0 ** 0 ** 0Dissolved Cadmium (µg/L)
0.3 ** 0 ** 0.1 ** 0 0.1 0.1 ** ** 0.2 ** 0 ** 0 ** 0.1
Dissolved Lead (µg/L) 1.1 ** 0 ** 0 ** 0 0 0 ** ** 0 ** 0 ** 0 ** 0Total Beryllium (µg/L) 0 ** 0 ** 0 ** 0 0 0 ** ** 0 ** 0 ** 0 ** 0Total Chromium (µg/L) 5.8 ** 0 ** 0 ** 0 0 0 ** ** 0 ** 0 ** 0 ** 0Total Manganese (µg/L) 257 ** 106 ** 121 ** 32.9 27.7 82.4 ** ** 89.9 ** 44 ** 38.5 ** 26.3Total Nickel (µg/L) 5.7 ** 2.7 ** 2.4 ** 1.2 0 2.6 ** ** 2.4 ** 1.6 ** 1.3 ** 0Total Copper (µg/L) 24 ** 12.8 ** 10.7 ** 6.9 4.2 12.4 ** ** 17 ** 9.5 ** 8.7 ** 4.6Total Zinc (µg/L) 138 ** 75 ** 49.4 ** 25.2 31.6 49.2 ** ** 55.4 ** 62.8 ** 55.4 ** 29.6Total Arsenic (µg/L) 0 ** 0 ** 0 ** 0 0 0 ** ** 0 ** 0 ** 0 ** 0Total Selenium (µg/L) 0 ** 0 ** 0 ** 0 0 0 ** ** 0 ** 0 ** 0 ** 0Total Molybdenum (µg/L) 0 ** 0 ** 0 ** 0 0 0 ** ** 6.4 ** 0 ** 0 ** 0Total Silver (µg/L) 0 ** 0 ** 0 ** 0 0 0 ** ** 0 ** 0 ** 0 ** 0Total Cadmium (µg/L) 0.9 ** 0 ** 0 ** 0 0 0 ** ** 0 ** 0 ** 0 ** 0Total Antimony (µg/L) 0 ** 0 ** 0 ** 0 0 0 ** ** 0 ** 0 ** 0 ** 0Total Lead (ug/L) 13.6 ** 8.5 ** 0 ** 0 0 6.3 ** ** 0 ** 5.4 ** 6.3 ** 0Chloride (mg/L) 16 ** 6 ** 18 ** 4 8 3 ** ** 27 ** 15 ** 8 ** 5Chemical Oxygen Demand (mg/L) 230 ** 136 ** 113 ** 71 41 127 ** ** 120 ** 80 ** 41 ** 36
Nitrite+Nitrate (mg/L) 0.15 ** 0.18 ** 0.22 ** 0.61 0.57 0.43 ** ** 1.32 ** 0.53 ** 0.64 ** 0.5Dissolved Phosphorus (mg/L) 0.18 ** 0.03 ** 0.15 ** 0.04 0.04 0.07 ** ** 0.07 ** 0.04 ** 0.05 ** 0.05
Dissolved Potassium (mg/L) 6 ** 2 ** 5 ** 1 2 2 ** ** 5 ** 3 ** 2 ** 1
Total Phosphorus (mg/L) 0.65 ** 0.26 ** 0.32 ** 0.1 0.1 0.19 ** ** 0.13 ** 0.1 ** 0.11 ** 0.08Total Kjeldahl Nitrogen (mg/L)
4.2 ** 1.8 ** 2.3 ** 1.8 1.1 2.4 ** ** 2.1 ** 1 ** 1.1 ** 0.7
Total Suspended Solids (mg/L)
481 ** 427 ** 80 ** 78 17 141 ** ** 20 ** 21 ** 24 ** 15
Event 21 Event 33Event 23 Event 24 Event 26 Event 28 Event 31 Event 32Event 22
20
Table 7. Water Quality Data for 2010
Water Quality Constituent
Ref BMP Ref BMP Ref BMP Ref BMP Ref BMP Ref BMP Ref BMP Ref BMP Ref BMP Ref BMP Ref BMP
Dissolved Calcium (mg/L) 4 ** 2 ** 4 ** ** 5 4 8 10 ** 5 3 4 ** 25 ** 21 ** 22 **
Dissolved Iron (mg/L) 0.11 ** 0 ** 0.1 ** ** 0.09 0 0.06 0.22 ** 0.12 1.08 0.07 ** 0.58 ** 0.16 ** 0.2 **Dissolved Magnesium (mg/L)
1.3 ** 0.6 ** 1 ** ** 1.3 1.1 1.9 2.1 ** 0.9 1.2 0.8 ** 5.6 ** 5.2 ** 5.6 **
Dissolved Sodium (mg/L) 14 ** 2 ** 5 ** ** 14 4 11 6 ** 3 44 3 ** 24 ** 20 ** 24 **Dissolved Chromium (µg/L)
0 ** 0 ** 0 ** ** 0 0 0 0 ** 0 2.4 0 ** 0 ** 0 ** 0 **
Dissolved Manganese (µg/L)
24.7 ** 10.7 ** 24.9 ** ** 21.4 20.5 17.2 64.1 ** 46 37.4 25.6 ** 159 ** 58.3 ** 42.5 **
Dissolved Nickel (µg/L) 1.3 ** 0 ** 0 ** ** 0 0 0 0 ** 0 2.6 0 ** 4.5 ** 2.2 ** 2.9 **
Dissolved Copper (µg/L) 5.6 ** 0 ** 4.6 ** ** 4.1 3.7 5 3.6 ** 0 15.7 5.2 ** 14 ** 9.6 ** 18.2 **
Dissolved Zinc (µg/L) 9.8 ** 9 ** 10.5 ** ** 10.2 15.9 12.7 10.4 ** 0 19 8.7 ** 33.9 ** 16 ** 30.5 **
Dissolved Selenium (µg/L) 0 ** 0 ** 0 ** ** 0 0 0 0 ** 0 0 0 ** 0 ** 0 ** 1.1 **
Dissolved Silver (µg/L) 0 ** 0 ** 0 ** ** 0 0 0 0 ** 0 0 0 ** 0 ** 0 ** 0 **
Dissolved Cadmium (µg/L) 0 ** 0 ** 0 ** ** 0.2 0 0.2 0.2 ** 0 0 0 ** 0 ** 0 ** 0 **
Dissolved Lead (µg/L) 0 ** 0 ** 0 ** ** 0 0 0 0 ** 0 2 0 ** 1 ** 0 ** 0 **
Total Beryllium (µg/L) 0 ** 0 ** 0 ** ** 0 0 0 0 ** 0 1.8 0 ** 0 ** 0 ** 0 **
Total Chromium (µg/L) 14.9 ** 6.9 ** 0 ** ** 0 0 0 0 ** 11.4 28.3 8.2 ** 7.2 ** 8.4 ** 0 **
Total Manganese (µg/L) 273 ** 150 ** 71.9 ** ** 39.3 91 42 111 ** 249 1190 201 ** 277 ** 222 ** 111 **
Total Nickel (µg/L) 11.2 ** 5.2 ** 2.2 ** ** 1.7 3 1.6 2.4 ** 8.6 28.6 7 ** 9.5 ** 7.4 ** 5.2 **
Total Copper (µg/L) 48.1 ** 20.2 ** 10.4 ** ** 6.7 12.4 7.1 9.9 ** 34.4 93.1 28.4 ** 45.2 ** 33.5 ** 28.4 **
Total Zinc (µg/L) 288 ** 135 ** 50.5 ** ** 30.1 72 26.7 56.9 ** 213 266 162 ** 169 ** 142 ** 82.1 **
Total Arsenic (µg/L) 0 ** 0 ** 0 ** ** 0 0 0 0 ** 0 14.9 0 ** 0 ** 0 ** 0 **
Total Selenium (µg/L) 0 ** 0 ** 0 ** ** 0 0 0 0 ** 0 1.2 0 ** 1 ** 0 ** 0 **
Total Molybdenum (µg/L) 0 ** 0 ** 0 ** ** 0 0 0 0 ** 0 0 0 ** 0 ** 5.9 ** 5 **
Total Silver (µg/L) 0 ** 0 ** 0 ** ** 0 0 0 0 ** 34.8 0.3 0 ** 0 ** 0 ** 0 **
Total Cadmium (µg/L) 1.6 ** 0 ** 0 ** ** 0 0 0 0 ** 0.6 0.9 0.6 ** 0.8 ** 0.6 ** 0 **
Total Antimony (µg/L) 0 ** 0 ** 0 ** ** 0 0 0 0 ** 0 0 0 ** 0 ** 0 ** 0 **
Total Lead (µg/L) 34.8 ** 16.4 ** 0 ** ** 0 7.7 0 0 ** 28.8 50.4 19.5 ** 14.3 ** 14.3 ** 7.2 **
Chloride (mg/L) 13 ** 2 ** 4 ** ** 18 2 11 4 ** 3 32 2 ** 27.8 ** 18.1 ** 25.1 **Chemical Oxygen Demand (mg/L)
320 ** 109 ** 85 ** ** 332 79 43 91 ** 184 227 187 ** 417 ** 181 ** 247 **
Nitrite+Nitrate (mg/L) 0.29 ** 0.05 ** 0.33 ** ** 0.74 0.55 0.7 0.11 ** 0.09 0.89 0.31 ** 0.08 ** 0.68 ** 0.81 **Dissolved Phosphorous (mg/L)
0.09 ** 0.03 ** 0.2 ** ** 0.05 0.01 0.04 0.06 ** 0.04 0.46 0.17 ** 0.47 ** 0.17 ** 0.18 **
Dissolved Potassium (mg/L)
2 ** 0 ** 2 ** ** 1 1 2 3 ** 2 2 2 ** 13 ** 5 ** 5 **
Total Phosphorous (mg/L) 0.72 ** 0.28 ** 0.34 ** ** 0.1 0.17 0.11 0.28 ** 0.48 1.48 0.49 ** 1.32 ** 0.59 ** 0.37 **Total Kjeldahl Nitrogen (mg/L)
3.7 ** 1.4 ** 2.1 ** ** 1.2 1.6 1.8 2 ** 2.8 3 2.8 ** 6.7 ** 3.3 ** 3.1 **
Total Suspended Solids (mg/L)
886 ** 301 ** 91 ** ** 24 202 40 147 ** 427 666 384 ** 414 ** ** ** 102 **
**No DataNote: 0 values indicate a level below the detection limit.
Event 9 Event 10 Event 11 Event 12 Event 14Event 7Event 1 Event 2 Event 3 Event 4 Event 5
21
Figure 8. Legend for Box-and-Whisker Plots
Upper Bound Quartile 1
Lower Bound Quartile 1
Median 1
Upper Bound Quartile 2
Lower Bound Quartile 2
Median 2
Mean 1 Mean 2
Lower Outlier 1
Upper Outlier 1
Lower Outlier 2
Upper Outlier 2
Data Set 1 Data Set 2 0
200
400
600
800
1000
1200
1400
Uni
ts
Legend

22
Figure 9. Dissolved Calcium Concentrations at the Reference Site and BMP
Upper Outlier=41 Upper Bound Quartile=19.5 Mean=11.857 Median=7.5
Lower Bound Quartile=5
Lower Outlier=2
Upper Anomaly 3= 33 Upper Anomaly 2=32 Upper Anomaly 1=31
Upper Outlier=16 Upper Bound Quartile=14.5 Mean=13.75 Median=11
Lower Bound Quartile=7.75
Lower Outlier=3
Reference Site BMP 0
5
10
15
20
25
30
35
40
45 m
g/L
Dissolved Calcium, 2008-2010

23
Figure 10. Dissolved Iron Concentrations at the Reference Site and BMP
Upper Anomaly 2=0.58 Upper Anomaly 1=0.47
Upper Outlier=0.32 Upper Bound
Quartile=0.165 Mean=0.134 Median=0.1
Lower Bound Quartile=0.58
Lower Outlier=0
Upper Anomaly 2=1.08 Upper Anomaly=0.27 Upper Outlier=0.14
Mean=0.139 Upper Bound Quartile=0.11 Median=0.07 Lower Bound
Quartile=0.038 Lower Outlier=0
Reference Site BMP 0
0.2
0.4
0.6
0.8
1
1.2
mg/
L
Dissolved Iron, 2008-2010
24
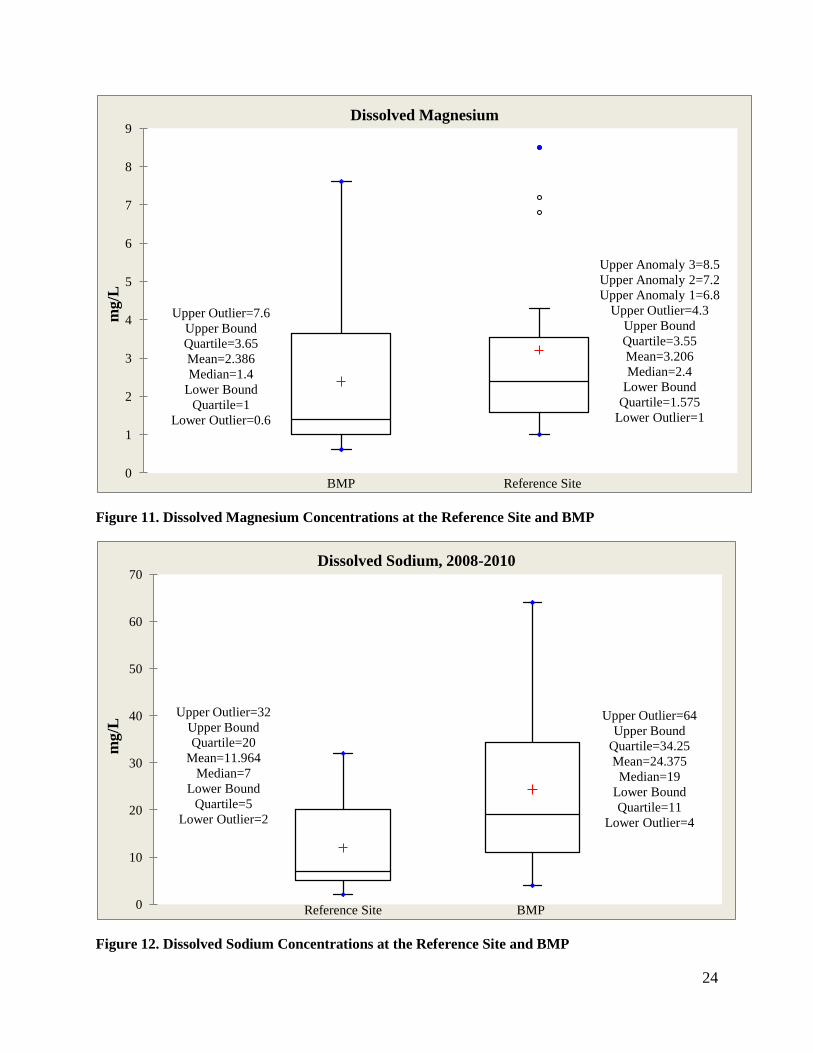
Figure 11. Dissolved Magnesium Concentrations at the Reference Site and BMP
Figure 12. Dissolved Sodium Concentrations at the Reference Site and BMP
Upper Outlier=7.6 Upper Bound Quartile=3.65 Mean=2.386 Median=1.4
Lower Bound Quartile=1
Lower Outlier=0.6
Upper Anomaly 3=8.5 Upper Anomaly 2=7.2 Upper Anomaly 1=6.8
Upper Outlier=4.3 Upper Bound Quartile=3.55 Mean=3.206 Median=2.4
Lower Bound Quartile=1.575
Lower Outlier=1
BMP Reference Site 0
1
2
3
4
5
6
7
8
9 m
g/L
Dissolved Magnesium
Upper Outlier=32 Upper Bound Quartile=20
Mean=11.964 Median=7
Lower Bound Quartile=5
Lower Outlier=2
Upper Outlier=64 Upper Bound
Quartile=34.25 Mean=24.375 Median=19
Lower Bound Quartile=11
Lower Outlier=4
Reference Site BMP 0
10
20
30
40
50
60
70
mg/
L
Dissolved Sodium, 2008-2010

25
Figure 13. Dissolved Chromium Concentrations at the Reference Site and BMP
All Values=0
Upper Anomaly 4=5.6 Upper Anomaly 3=4.1 Upper Anomaly 2=2.4 Upper Anomaly 1=1.2
Mean=0.831 Median=0
Reference Site BMP 0
1
2
3
4
5
6
µg/L
Dissolved Chromium, 2008-2010
26
Figure 14. Dissolved Manganese Concentrations at the Reference Site and BMP
Upper Anomaly 3=159
Upper Anomaly 2=134
Upper Anomaly 1=94.1
Upper Outlier=74.8 Upper Bound
Quartile=43.375 Mean=38.482 Median=25.95 Lower Bound
Quartile=14.075 …
Upper Anomaly 2=87.1
Upper Anomaly 1=73.2
Upper Outlier=37.4 Upper Bound
Quartile=24.65 Mean=24.531 Median=17.9 Lower Bound Quartile=12
Lower Outlier=1.3
Reference Site BMP 0
20
40
60
80
100
120
140
160
µg/L
Dissolved Manganese, 2008-2010
27
Figure 15. Dissolved Nickel Concentrations at the Reference Site and BMP
Upper Outlier=4.5 Upper Bound Quartile=1.95 Mean=1.043 Median=0.65 Lower Bound
Quartile=0
Upper Outlier=2.6 Upper Bound
Quartile=1.425 Mean=0.769 Median=0
Reference Site BMP 0
0.5
1
1.5
2
2.5
3
3.5
4
4.5
5 µg
/L
Dissolved Nickel, 2008-2010
28
Figure 16. Dissolved Copper Concentrations at the Reference Site and BMP
Upper Anomaly=18.2
Upper Outlier=17.3 Upper Bound
Quartile=10.025 Mean=8
Median=6.75 Lower Bound
Quartile=5.075 Lower Outlier=0
Upper Outlier=15.7 Upper Bound
Quartile=9.875 Mean=7.538 Median=5.4
Lower Bound Quartile=4.425
Lower Outlier=2.9
Reference Site BMP 0
2
4
6
8
10
12
14
16
18
20 µg
/L
Dissolved Copper, 2008-2010

29
Figure 17. Dissolved Zinc Concentrations at the Reference Site and BMP
Upper Anomaly=354 Upper Outlier=34.7
Mean=27.746 Median=12.85 Lower Bound Quartile=9.65
Lower Outlier=0
Upper Anomaly 2=921
Upper Anomaly 1=151
Mean=82.919 Upper Outlier=49.3
Upper Bound Quartile=28.975 Median=16.65 Lower Bound
Quartile=12.125 Lower Outlier=0
BMP Reference Site 0
100
200
300
400
500
600
700
800
900
1000 µg
/L
Dissolved Zinc, 2008-2010

30
Figure 18. Dissolved Selenium Concentrations at the Reference Site and BMP
Figure 19. Dissolved Silver Concentrations at the Reference Site and BMP
Upper Anomaly=1.1 Mean=0.039 Median=0
Upper Anomaly 2=1.1
Upper Anomaly 1=1 Mean=0.194 Median=0
Reference Site BMP 0
0.2
0.4
0.6
0.8
1
1.2 µg
/L
Dissolved Selenium, 2008-2010
All Values=0 All Values=0
Reference Site BMP 0
0.1
0.2
0.3
0.4
0.5
0.6
0.7
0.8
0.9
1
µg/L
Dissolved Silver, 2008-2010

31
Figure 20. Dissolved Cadmium Concentrations at the Reference Site and BMP
Figure 21. Dissolved Lead Concentrations at the Reference Site and BMP
Upper Anomaly=0.7 Upper Outlier=0.3
Upper Bound Quartile=0.125
Mean=0.1 Median=0
Upper Anomaly 2=6.5 Upper Anomaly 1=1.2
Mean=0.625 Upper Outlier=0.6
Upper Bound Quartile=0.4 Median=0.15 Lower Bound
Quartile=0
Reference Site BMP 0
1
2
3
4
5
6
7 µg
/L
Dissolved Cadmium, 2008-2010
Upper Anomaly 2=1.1 Upper Anomaly 1=1
Mean=0.075 Median=0
Upper Anomaly=2 Mean=0.125 Median=0
Reference Site BMP 0
0.5
1
1.5
2
2.5
µg/L
Dissolved Lead, 2008-2010

32
Figure 22. Total Beryllium Concentrations at the Reference Site and BMP
Figure 23. Total Chromium Concentrations at the Reference Site and BMP
All Values=0 Upper Anomaly=1.8
Mean=0.113 Median=0
Reference Site BMP 0
0.2
0.4
0.6
0.8
1
1.2
1.4
1.6
1.8
2 µg
/L
Total Beryllium, 2008-2010
Upper Outlier=14.9 Upper Bound
Quartile=6.975 Mean=3.493 Median=0
Upper Anomaly 3=28.3
Upper Anomaly 2=6.8 Upper Anomaly 1=6.3
Mean=2.588 Median=0
Reference Site BMP 0
5
10
15
20
25
30
µg/L
Total Chromium, 2008-2010

33
Figure 24. Total Manganese Concentrations at the Reference Site and BMP
Upper Outlier=277 Upper Bound
Quartile=224.5 Mean=144.836 Median=116 Lower Bound
Quartile=80.425 Lower Outlier32.9
Upper Anomaly 2=1190
Upper Anomaly 1=159
Upper Outlier=99.5 Upper Bound
Quartile=76.475 Mean=128.181 Median=43.8 Lower Bound Quartile=39.1
Lower Outlier=20.8
Reference Site BMP 0
200
400
600
800
1000
1200
µg/L
Total Manganese, 2008-2010
34
Figure 25. Total Nickel Concentrations at the Reference Site and BMP
Figure 26. Total Copper Concentrations at the Reference Site and BMP
Upper Outlier=11.2 Upper Bound Quartile=6.55 Mean=4.846 Median=4.7
Lower Bound Quartile=2.55
Lower Outlier=1.2
Upper Anomaly 3=28.6
Upper Anomaly 2=7.3 Upper Anomaly 1=4.6
Upper Outlier=3.1 Upper Bound
Quartile=2.725 Mean=3.969 Median=2.25 Lower Bound Quartile=1.6
Lower Outlier=0
Reference Site BMP 0
5
10
15
20
25
30 µg
/L
Total Nickel, 2008-2010
Upper Outlier=48.1 Upper Bound
Quartile=31.925 Mean=23.346 Median=21.75 Lower Bound Quartile=12.4
Lower Outlier=6.9
Upper Anomaly 2=93.1
Upper Anomaly 1=47.7
Upper Outlier=22.4 Upper Bound
Quartile=15.725 Mean=18.194 Median=9.5
Lower Bound Quartile=7.4
Lower Outlier=4.2
Reference Site BMP 0
10
20
30
40
50
60
70
80
90
100
µg/L
Total Copper, 2008-2010

35
Figure 27. Total Zinc Concentrations at the Reference Site and BMP
Figure 28. Total Arsenic Concentrations at the Reference Site and BMP
Upper Anomaly=1090 Upper Outlier=288
Upper Bound Quartile=162.25 Mean=146.846 Median=105.55 Lower Bound Quartile=55.3
Lower Outlier=25.2
Upper Anomaly 4=1010
Upper Anomaly 3=906 Upper Anomaly 2=266 Upper Anomaly 1=213
Mean=175.85 Upper Bound
Quartile=100.35 Median=35.75 Lower Bound
Quartile=29.45 Lower Outlier=0
Reference Site BMP 0
200
400
600
800
1000
1200 µg
/L
Total Zinc, 2008-2010
All Values=0 Upper Anomaly=14.9
Mean=0.931 Median=0
Reference Site BMP 0
2
4
6
8
10
12
14
16
µg/L
Total Arsenic, 2008-2010

36
Figure 29.Total Selenium Concentrations at the Reference Site and BMP
Upper Outlier=1 Mean=0.036 Median=0
Upper Outlier=1.9 Upper Bound
Quartile=1.025 Mean=0.406 Median=0
Reference Site BMP 0
0.2
0.4
0.6
0.8
1
1.2
1.4
1.6
1.8
2
µg/L
Total Selenium, 2008-2010
37
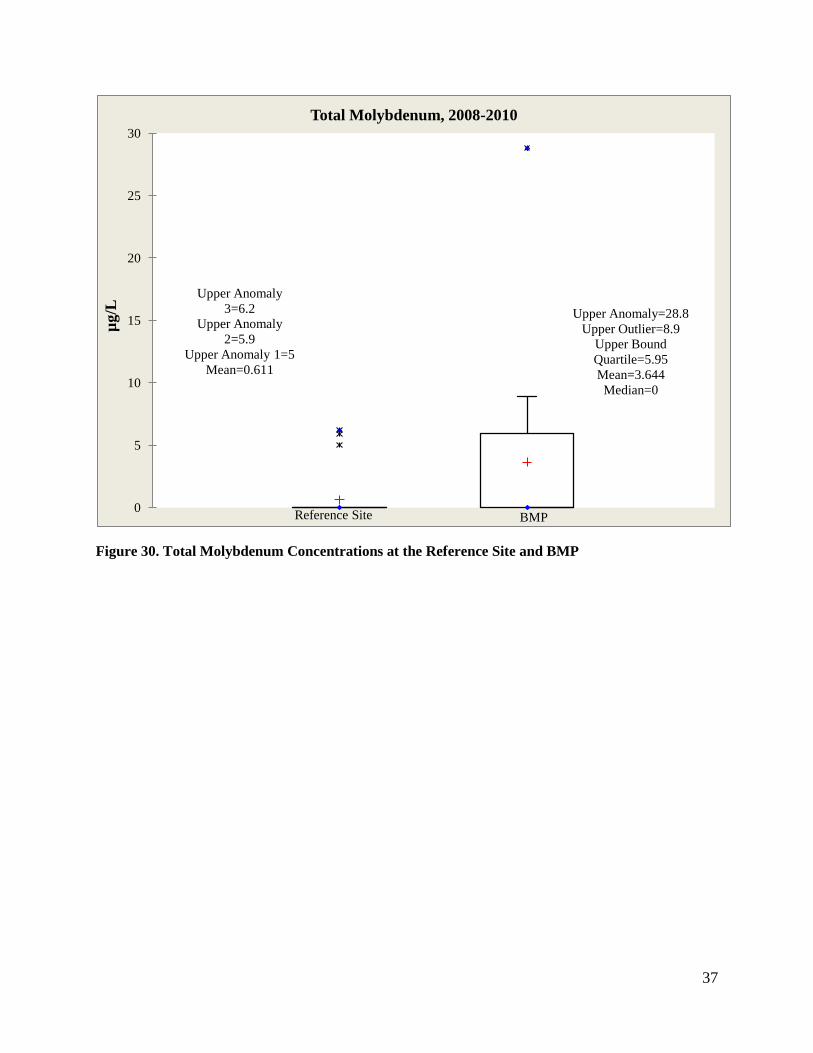
Figure 30. Total Molybdenum Concentrations at the Reference Site and BMP
Upper Anomaly 3=6.2
Upper Anomaly 2=5.9
Upper Anomaly 1=5 Mean=0.611
Upper Anomaly=28.8 Upper Outlier=8.9
Upper Bound Quartile=5.95 Mean=3.644 Median=0
Reference Site BMP 0
5
10
15
20
25
30
µg/L
Total Molybdenum, 2008-2010

38
Figure 31. Total Silver Concentrations at the Reference Site and BMP
Upper Anomaly 2=34.8
Upper Anomaly 1=0.4
Mean=1.257 Median=0
Upper Anomaly 2=0.3
Upper Anomaly 1=0.2
Mean=0.0313
Reference Site BMP 0
5
10
15
20
25
30
35 µg
/L
Total Silver, 2008-2010

39
Figure 32. Total Cadmium Concentrations at the Reference Site and BMP
Upper Anomaly=19.7 Mean=1.506
Upper Outlier=1.5 Upper Bound Quartile=0.7 Median=0
Upper Anomaly=3.6 Upper Outlier=1.6
Upper Bound Quartile=0.8 Mean=0.464 Median=0
Reference Site BMP 0
2
4
6
8
10
12
14
16
18
20
µg/L
Total Cadmium, 2008-2010

40
Figure 33. Total Antimony Concentrations at the Reference Site and BMP
Figure 34. Total Lead Concentrations at the Reference Site and BMP
Upper Anomaly=23.3 Mean=0.832 Median=0
Upper Anomaly 2=37.8
Upper Anomaly 1=14 Mean=3.238 Median=0
Reference Site BMP 0
5
10
15
20
25
30
35
40 µg
/L
Total Antimony, 2008-2010
Upper Outlier=34.8 Upper Bound
Quartile=17.05 Mean=11.757 Median=9.2
Lower Bound Quartile=4.425
Lower Outlier=0
Upper Anomaly 4=50.4
Upper Anomaly 3=11.4
Upper Anomaly 2=6.3 Upper Anomaly 1=5.4
Mean=4.594 Upper Bound Quartile=1.35
Median=0
Reference Site BMP 0
10
20
30
40
50
60
µg/L
Total Lead, 2008-2010

41
Figure 35. Chloride Concentrations at the Reference Site and BMP
Upper Outlier=35 Upper Bound
Quartile=18.825 Mean=11.917
Median=6 Lower Bound Quartile=3.75
Lower Outlier=2
Upper Anomaly 2=137
Upper Anomaly 1=75 Upper Outlier=41
Upper Bound Quartile=30.75 Mean=30.857 Lower Bound
Quartile=11.25 Lower Outlier=5
Reference Site BMP 0
20
40
60
80
100
120
140 m
g/L
Chloride, 2008-2010

42
Figure 36. Chemical Oxygen Demand at the Reference Site and BMP
Upper Anomaly 2=418
Upper Anomaly 1=320
Upper Outlier=252 Upper Bound
Quartile=188.75 Mean=168.286 Median=148.5 Lower Bound
Quartile=108.25 Lower Outlier=39
Upper Anomaly 3=860
Upper Anomaly 2=332
Upper Anomaly 1=227
Upper Outlier=113.25 Upper Bound
Quartile=113.25 Mean=131.875 Median=44.5 Lower Bound
Quartile=38.25 Lower Outlier=19
Reference Site BMP 0
100
200
300
400
500
600
700
800
900
mg/
L
Chemical Oxygen Demand, 2008-2010

43
Figure 37. Nitrite+Nitrate Concentrations at the Reference Site and BMP
Upper Outlier=0.96 Upper Bound
Quartile=0.565 Mean=0.362 Median=0.29 Lower Bound
Quartile=0.173 Lower Outlier=0.05
Upper Outlier=1.79 Upper Bound
Quartile=1.328 Mean=1.004
Median=0.935 Lower Bound
Quartile=0.628 Lower Outlier=0.5
Reference Site BMP 0
0.2
0.4
0.6
0.8
1
1.2
1.4
1.6
1.8
mg/
L
Nitrate+Nitrite, 2008-2010

44
Figure 38. Dissolved Phosphorus Concentrations at the Reference Site and BMP
Upper Anomaly=0.47 Upper Outlier=0.2
Upper Bound Quartile=0.1425
Mean=0.098 Lower Bound
Quartile=0.038 Lower Outlier=0.01
Upper Anomaly 2=4.25
Upper Anomaly 1=0.46
Mean=0.371 Upper Bound
Quartile=0.105 Median=0.07 Lower Bound
Quartile=0.045 Lower Outlier=0.03
Reference Site BMP 0
0.5
1
1.5
2
2.5
3
3.5
4
4.5
mg/
L
Dissolved Phosphorus, 2008-2010
45
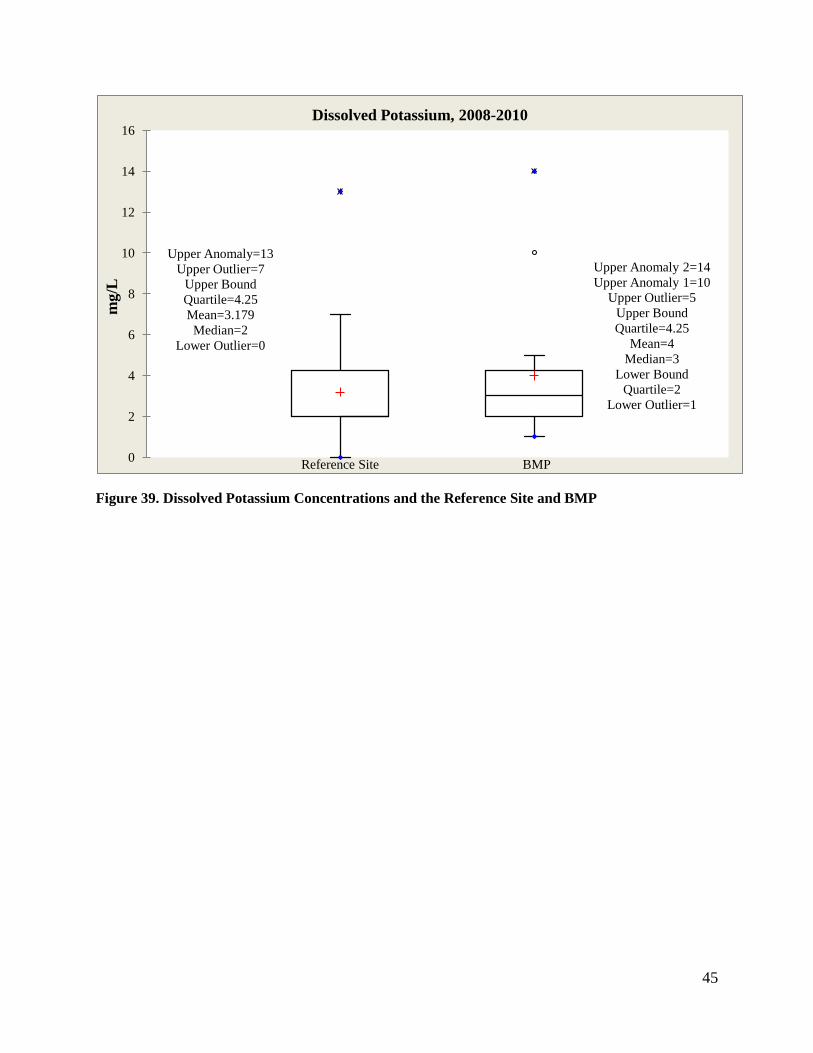
Figure 39. Dissolved Potassium Concentrations and the Reference Site and BMP
Upper Anomaly=13 Upper Outlier=7
Upper Bound Quartile=4.25 Mean=3.179 Median=2
Lower Outlier=0
Upper Anomaly 2=14 Upper Anomaly 1=10
Upper Outlier=5 Upper Bound Quartile=4.25
Mean=4 Median=3
Lower Bound Quartile=2
Lower Outlier=1
Reference Site BMP 0
2
4
6
8
10
12
14
16 m
g/L
Dissolved Potassium, 2008-2010

46
Figure 40. Total Phosphorus Concentrations at the Reference Site and BMP
Upper Anomaly= Upper Outlier= Upper Bound Quartile=0.48 Mean=0.386
Median=0.325 Lower Bound Quartile=0.19
Lower Outlier=0.1
Upper Anomaly 3=6.63
Upper Anomaly 2=1.48
Upper Anomaly 1=0.32
Upper Bound Quartile=0.19
Mean=0.67 Median=0.16 Lower Bound
Quartile=0.105 Lower Outlier=0.08
Reference Site BMP 0
1
2
3
4
5
6
7 m
g/L
Total Phosphorus, 2008-2010

47
Figure 41. Total Kjeldahl Nitrogen Concentrations at the Reference Site and BMP
Figure 42. Total Suspended Solids at the Reference Site and BMP
Upper Anomaly=6.7 Upper Bound Quartile=3.8 Mean=2.85
Median=2.45 Lower Bound Quartile=1.95
Lower Outlier=1.1
Upper Anomaly 2=58 Upper Anomaly 1=3.7
Mean=5 Upper Outlier=3
Upper Bound Quartile=1.875 Median=1.35 Lower Bound
Quartile=0.975 Lower Outlier=0
Reference Site BMP 0
10
20
30
40
50
60 m
g/L
Total Kjeldahl Nitrogen, 2008-2010
Upper Anomaly=1360 Upper Outlier=886
Upper Bound Quartile=420.5 Mean=292.889 Median=198 Lower Bound Quartile=110
Lower Outlier=55
Upper Anomaly 2=666
Upper Anomaly 1=385
Upper Outlier=59 Upper Bound
Quartile=52.75 Mean=93.188 Median=29.5 Lower Bound
Quartile=20.75 Lower Outlier=15
Reference Site BMP 0
200
400
600
800
1000
1200
1400
mg/
L
Total Suspended Solids, 2008-2010

48
V. Conclusion
Assessment of flow reduction and water quality has been difficult at this site. Equipment failures have complicated flow measurement at the porous asphalt. Improvements, namely the installation of the bubbler module, should lead to some improvement in flow readings. While methods for sample collection have been successful, it is hard to discern how the porous asphalt has impacted water quality since the water quality data, in comparison to the reference site, is in many cases not statistically significant. There were some significant differences between the reference site and the porous asphalt. Dissolved Potassium, Chloride, and Dissolved Phosphorus (according to one test) were significantly lower in the porous asphalt outflows compared to the reference site. Nitrite+Nitrate, Total Selenium, and Dissolved Sodium were all in significantly higher concentrations in the porous asphalt outflows when compared to the reference site. As noted in this report differences may be amplified by differences in site use. The reference site is in a more remote area of an employee parking lot and the BMP site is in a frequently traveled area at the entrance of the building.
Due to clogging of the wearing course, UDFCD could consider other alternatives for this site such as conventional asphalt to serve as an improved reference site for the adjacent PICP site or a difference type of permeable pavement. UDFCD continues to investigate the use of porous asphalt in the Denver metropolitan area. In 2011 UDFCD tested infiltration rates of porous asphalt installations at four other sites and continues to look for other sites in place for at least three years to determine if infiltration rates can be maintained or restored after this period of time. Results were mixed and more tests are needed before UDFCD can recommend porous asphalt per the permeable pavement design criteria in Volume 3 of the USDCM.
Water quality constituent concentrations can be compared with other permeable pavement studies found in the International Stormwater BMP database, as summarized in Table 8, which is adapted from Table 2-2 in Volume 3 of the USDCM. The database outlet values are fairly consistent with the porous asphalt data produced by this study.

49
Table 8. Comparison of Median Constituents for the porous asphalt at Denver Waste Water and the International Stormwater BMP Database
Data from Porous Asphalt
Data from International
BMP Database
Water Quality Constituent
Reference Median Value
BMP Median Value
Inlet Median Value
Outlet Median Value
Total Phosphorus (mg/L) 0.325 0.16 0.12 0.13
Total Suspended Solids (mg/L) 198 29.5 23.5 29.1
Total Kjeldahl Nitrogen (mg/L) 2.45 1.35 2.4 1.05
Total Cadmium (µg/L) 0 0 NA 0.3
Dissolved Copper (µg/L) 6.75 5.4 5.0 6.2
Total Copper (µg/L) 21.75 9.5 7.0 9.0
Dissolved Lead (µg/L) 0 0 0.1 0.3
Total Lead (µg/L) 9.2 0 2.5 2.5 Dissolved Zinc (µg/L) 12.85 16.65 25 14.6
Total Zinc (µg/L) 105.55 35.75 50 22 NA=Not Analyzed

50
The runoff data for the reference site can also be compared to runoff data from the Denver Regional Urban Runoff Program (DRURP), as summarized in Table 9. This provides another way to compare the data from this study to an outside source.
Table 9. Comparison of Mean Constituents for the Reference Site Inflows and the Commercial DRURP Data
Constituent
EMC Denver Commercial
Land Use (DRURP)
EMC Reference Site
EMC Porous Asphalt
Total Phosphorus (mg/L)
0.42 0.39 0.67
Total Kjeldahl Nitrogen (mg/L)
2.30 2.85 5.00
Nitrate+Nitrite (mg/L) 0.96 0.36 1.00
Total Lead (µg/L) 0.06 11.76 4.59
Total Zinc (µg/L) 0.24 146.85 175.85
Total Copper (µg/L) 0.04 23.35 18.19
Total Cadmium (µg/L) 0.00 0.46 1.51
Chemical Oxygen Demand (mg/L)
173.00 168.29 131.88
Total Suspended Solids (mg/L)
225.00 292.89 93.19
ND=Not Detected

51
VI. References
International Stormwater Best Management Practices (BMP) data base: www.bmpdatabase.org. (June 14, 2011).
Geosyntec Consultants, Inc., and Wright Water Engineers, Inc. 2010. International Stormwater Best Management Practices (BMP) Database Pollutant Category Summary: Nutrients. http://bmpdatabase.org/Docs/BMP%20Database%20Nutrients%20Paper%20December%202010%20Final.pdf. (June 14, 2011).
Urban Drainage and Flood Control District (UDFCD). 2001. Urban Storm Drainage Criteria Manual – Volume 1 and 2. Updated and maintained by UDFCD. Denver, Colorado
Urban Drainage and Flood Control District (UDFCD). 2010. Urban Storm Drainage Criteria Manual – Volume 3. Updated and maintained by UDFCD. Denver, Colorado