stop wasting your analytics budget - edui 2016
TRANSCRIPT
Stop Wasting Your Analytics Budget
October 2016
Mitch Daniels Digital Analyst at Viget


How’s our site doing?


✘
Establish Meaningful Goals
Share Decision Context
Deliver Actionable Analysis
1
2
3

Establish Meaningful Goals
Share Decision Context
Deliver Actionable Analysis
1
2
3

The Problem

Common Requests
• We want to know how our site is doing.
• We want to know if we’re ‘moving the needle’.
• We want to be able to show progress / improvements.

Common Goals
• Increase traffic
• Increase engagement (pages / session; time on site)
• Reduce bounce rate
• Drive more email signups

Weak goals yield weak results.

Common Goals
• Increase traffic
• Increase engagement (pages / session; time on site)
• Reduce bounce rate
• Drive more email signups

Effective goals are clear, actionable and
meaningful.


Total Time Reading (TTR)

Goal Framework

Goal Framework
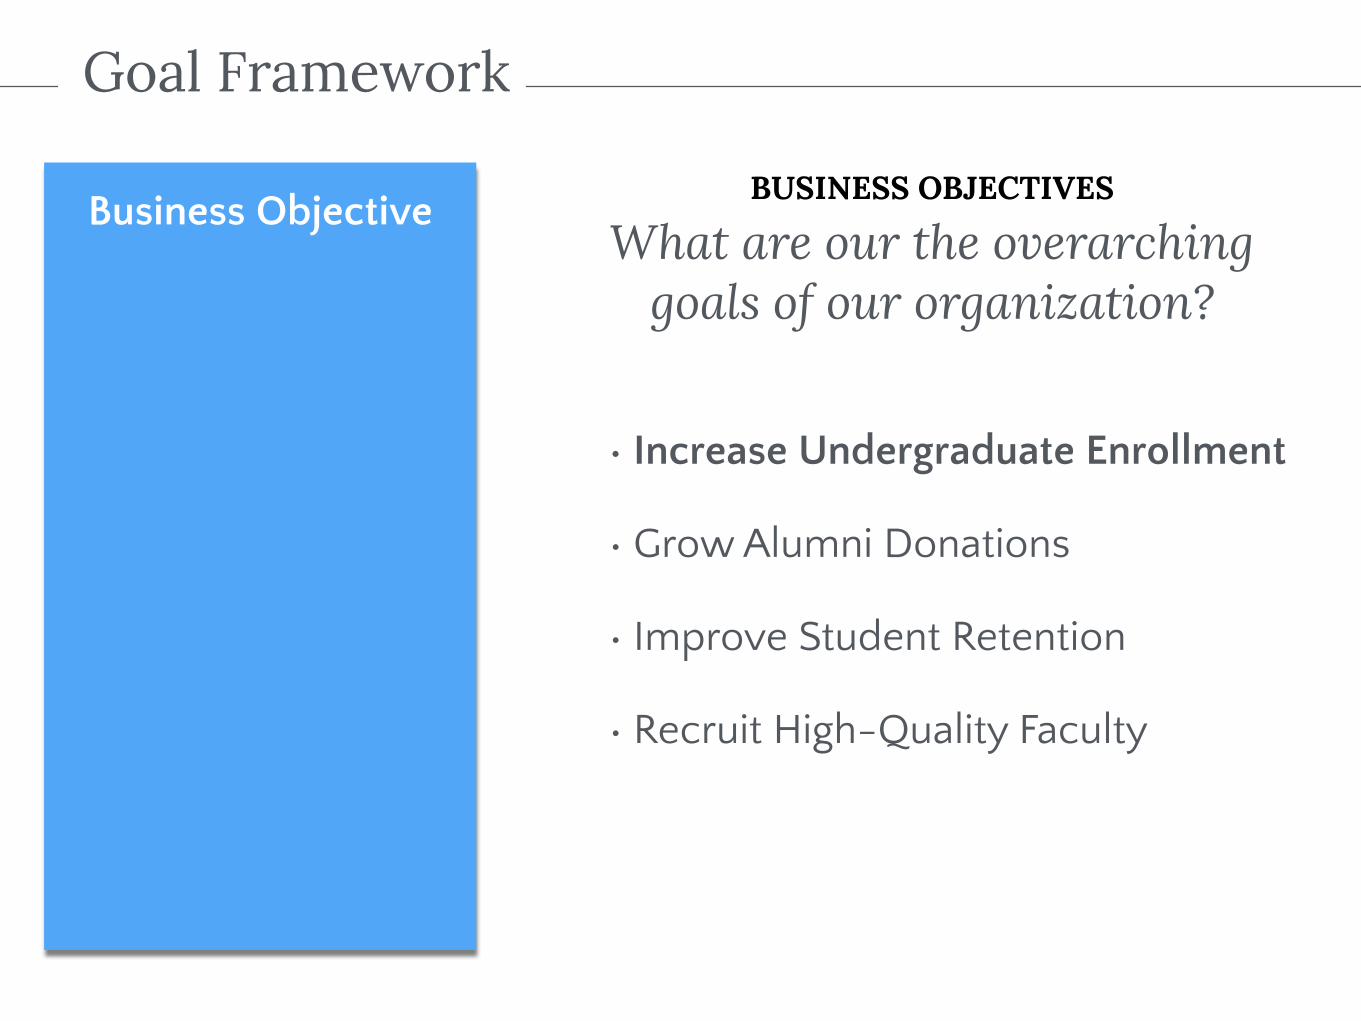
Business ObjectiveBUSINESS OBJECTIVES
What are our the overarching goals of our organization?

Goal Framework
Business ObjectiveBUSINESS OBJECTIVES
What are our the overarching goals of our organization?
“Don’t let your dreams be dreams.”

Goal Framework
Business ObjectiveBUSINESS OBJECTIVES
What are our the overarching goals of our organization?
• Increase Undergraduate Enrollment
• Grow Alumni Donations
• Improve Student Retention
• Recruit High-Quality Faculty
Goal Framework
Business ObjectiveBUSINESS OBJECTIVES
What are our the overarching goals of our organization?
• Increase Undergraduate Enrollment
• Grow Alumni Donations
• Improve Student Retention
• Recruit High-Quality Faculty

Goal Framework
Increase Undergrad Enrollment
Site Goal SITE GOALS
How does our website contribute to the objective?
• Communicate value proposition
• Provide path to application

Goal Framework
Increase Undergrad Enrollment
Communicate Value Prop
Provide Application Path

Goal Framework
Increase Undergrad Enrollment
Communicate Value Prop
Provide Application Path
KPIs
How do we measure progress against site goals?
• Sessions viewing ‘Student Life’ content
• Interest email sign-ups
• Campus tour sign-ups

Goal Framework
Increase Undergrad Enrollment
Provide Application Path
KPIs
How do we measure progress against site goals?
Communicate Value Prop
• ‘Student Life’ sessions • Interest email sign-ups • Campus visit sign-ups

Goal Framework
Increase Undergrad Enrollment
Provide Application Path
KPIs
How do we measure progress against site goals?
Communicate Value Prop
• ‘Student Life’ sessions • Interest email sign-ups • Campus visit sign-ups
• Online application starts
• Online application completions

Goal Framework
Increase Undergrad Enrollment
Communicate Value Prop
• ‘Student Life’ sessions • Interest email sign-ups • Campus visit sign-ups
Provide Application Path
• Online application starts • Online application completions
Effective goals are clear, actionable and
meaningful.

Goal Framework
Increase Undergrad Enrollment
Communicate Value Prop
• ‘Student Life’ sessions • Interest email sign-ups • Campus visit sign-ups
Provide Application Path
• Online application starts • Online application completions

Establish Meaningful Goals
Share Decision Context
Deliver Actionable Analysis
1
3
2

The Problem

Decision Context
• Priorities - Risk aversion - Appetite for change - Politics vs data
• Constraints - Development resources - Budget - Stakeholder approval
Media Spend Optimization
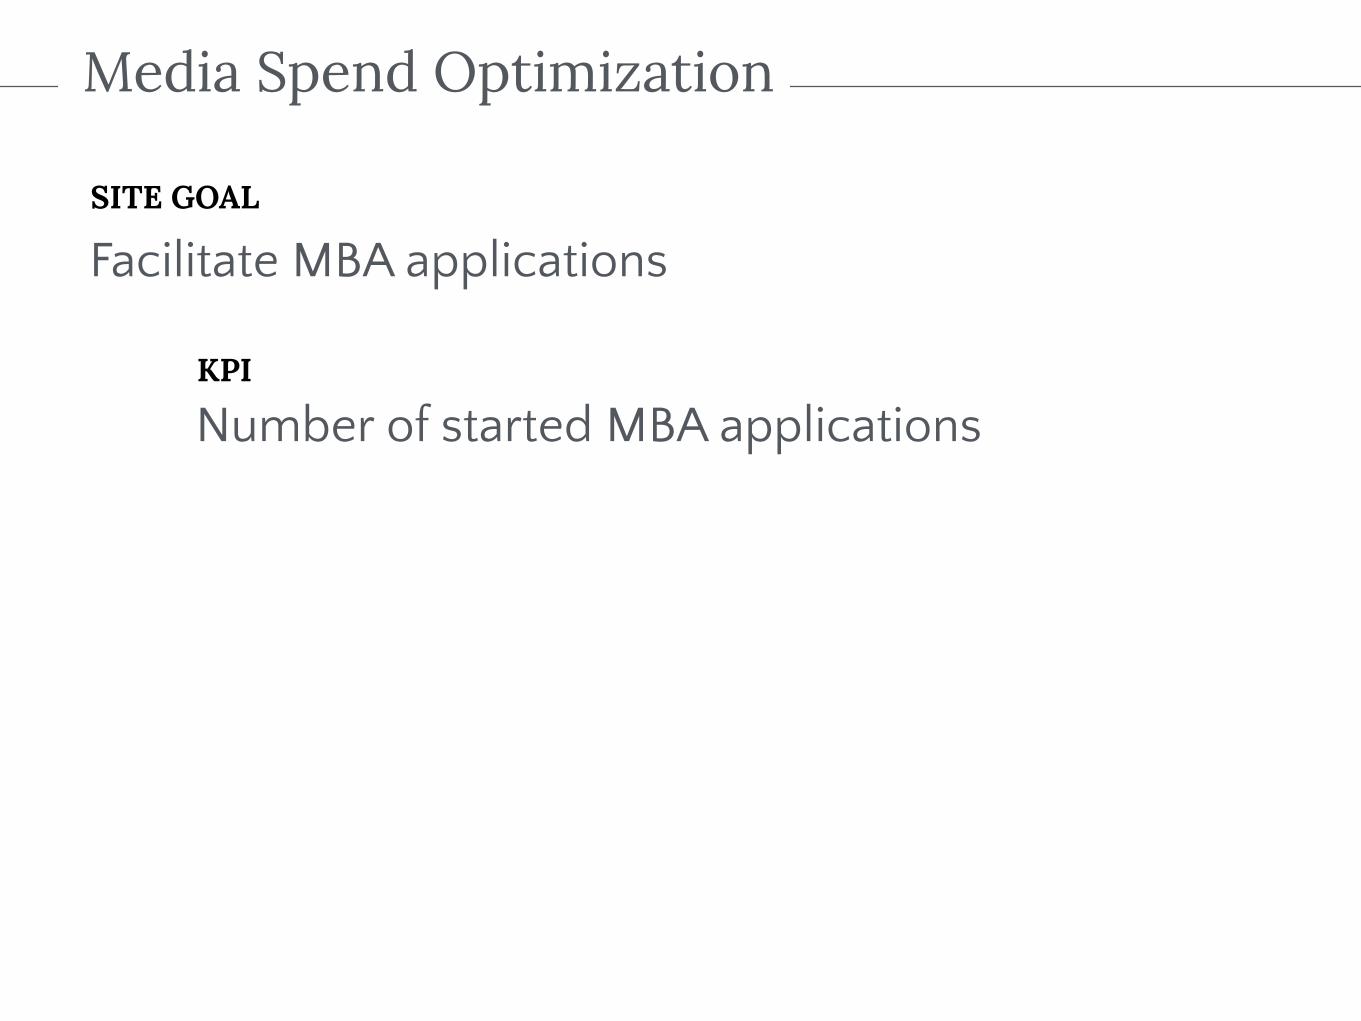
SITE GOAL
Facilitate MBA applications
KPI
Number of started MBA applications

Media Spend Optimization
How can we grow our MBA application numbers using our existing budget?
Decision Context • Timeline
- Budget approved annually
• Constraints - Maximum total budget - Minimum spend on certain outlets

Identify constraints, priorities and resources.
Be realistic.

Establish Meaningful Goals
Share Decision Context
Deliver Actionable Analysis
1
2
3

Establish Meaningful Goals
Share Decision Context
Deliver Actionable Analysis
1
2
3
>>> Configure tracking

Analytics budget
10% on tools / tracking 90% on analysis

Configure tracking
KPIs > Tracking Requirements

Establish Meaningful Goals
Share Decision Context
Deliver Actionable Analysis
1
2
3

Typical Web Reporting
• Year-over-year, visitors increased 18% from 8,951 to 10,562
• Page entrances to the homepage increased 26% from 6,718 to 8,468
• Page entrances to the /solutions pages decreased 15% from 491 to 419
• Page entrances from Google increased 8% from 6,718 to 7,235
• Contact Us form submits decreased from 17 to 16

Typical Web Reporting
Traffic Source Visits Bounce Rate Avg Time on Site
{redacted} / referral 79,976 22% 1:37
Google / sem 34,797 54% 0:56
{redacted} / referral 21,697 34% 1:20
Facebook / social 17,901 78% 0:53
paid.outbrain.com / referral 14,996 77% 0:35
Twitter / social 12,299 83% 0:24
(direct) / (none) 10,913 45% 2:26
Undertone / display 7,299 69% 0:42
google / organic 2,013 42% 2:42
uni-watch.com / referral 1,570 25% 1:02
TOP TRAFFIC SOURCES
Device Visits Bounce Rate Avg Time on Site
Apple iPad 27,973 54% 0:56
Apple iPhone 21,457 76% 0:36
Samsung Galaxy S 9,669 76% 0:48
TOP DEVICES


“
Avinash Kaushik Digital Marketing Evangelist at Google
If you see a data puke then you know you are looking at the result of web reporting …
If you see words in English outlining actions…then you are looking at the result of web data analysis.

web reporting• tables, charts, graphs • something happened • past tense
web data analysis• paragraphs • why something happened • Forward looking • Recommendations

web reporting web data analysis• informs (hopefully!) • inspires action

web reporting web data analysis

Why?

So What?

We should…

Typical Web Reporting
Year-over-year, visitors increased 18% from 8,951 to 10,562
Why? Google organic traffic landing on /admissions.
So what? These sessions bounce 10x more often than average.
We should… create a CTA on the /admissions page to engage this growing audience.

Web Data Analysis
Create a CTA on the /admissions page to engage the growing Google organic audience.
Bonus! If 5% of these sessions convert, we’ll see up to 500 additional applications in the next year.

Recommendation Level of Effort Priority (1-10) Status
Create stronger CTA on admissions page Medium Low Implemented
Link to Student Life more prominently in the main nav Low High To-Do

(a word of caution)


Recommendations Status

Recommendations Status
to-do
✔
✔
✘

Recommendations Status
to-do
✔
✔
✘

Recommendations Status
to-do
to-do
to-do
to-do
✔
✔
✘
✘

Recommendations Status
to-do
to-do
to-do
to-do
to-do
to-do
✔
✔
✘
✘
✔
✔

Deliver Actionable Analysis
• Use your goals and decision context
• “Why?”, • “So What?” • “We should…”
• Align reporting to your organization’s speed

Establish Meaningful Goals1
Share Decision Context2
Deliver Actionable Analysis3
>>> Configure tracking


Thanks!