stocks in the northern and southern benguela upwelling ecosystems
TRANSCRIPT

A Decade ofNamibian Fisheries SciencePayne, A. I. L.. Pillar, S. C. and R. J. M. Crawford (Eds). S. Afr. 1. mar. Sci. 23: /23-/342001
A COMPARISON OF CONDITION FACTOR AND GONADOSOMATIC INDEXOF SARDINE SARDINOPS SAGAX STOCKS IN THE NORTHERN AND
SOUTHERN BENGUELA UPWELLING ECOSYSTEMS, 1984-1999
A. KREINER*, C. D. VAN DER LlNGENt and P. FREONtJ;.
Time-series of condition factor (CF) and gonadosomatic index (GSl) were generated using general linear models(GLM) for sardine Sardinops sa/?ax stocks in the northern and southern Benguela ecosystems over the period1984-1999. During this period the biomass of sardine in the northern Benguela remained at relatively low levelsof <500 000 tons, whereas that of southern Benguela sardine increased 40-fold to 1.3 million tons. The GLMsexplained 27 and 45% of the observed variation in Cl", and 32 and 28% of the observed variation in GS1, forsardine in the northern and southern Benguela subsystems respectively. Whereas the sardine Cl" in the northernBenguela remained stable over time, that for the southern Benguela stock declined steadily during the studyperiod. Sardine Cl" showed a seasonal cycle in the southern but not in the northern Benguela. Time-series ofGSl showed high interannual variability but no trends in either subsystem, and the seasonal pattern was similarfor both stocks. The lack of coherence between the Cl" time-series for sardine in the two subsystems furthersuggests that sardine stocks in the northern and southern Benguela subsystems are independent.
Key words: condition factor, gonadosomatic index, northern Benguela. sardine, southern Benguela
/23
The Benguela upwelling ecosystem lies adjacent to thesouth-western coast of Africa, from southern Angola(l5°S) to Cape Agulhas (35°S; Fig. I). Ecologically,it is split into separate northern and southern subsystems by a zone of intense perennial upwelling nearLiideritz (26-27.5°S; Shannon 1985). As is characteristic of upwelling ecosystems, the Benguela ishighly productive and supports abundant populations ofplankton-feeding c1upeoids, including anchovy Engraulis capensis, round herring Etrumeus spp. and sardine Sardinops sagax, all of which are commerciallyexploited (Armstrong and Thomas 1989).
Sardine are distributed from southern Angola toKwaZulu-Natal on the north-east coast of South Africa,and despite wide-ranging migrations, there appear tobe two separate stocks. The northern stock extendsalong the Namibian coast from the Liideritz upwellingcell to the warm-water front off southern Angola(-15°S), and the southern stock is found from theOrange River to Kwazulu-Natal (27°S; Beckley and vander Lingen 1999). Tagging studies indicated no movement of sardine from the Western Cape to Namibiaand only minimal movement in the opposite direction(Newman 1970), and genetic studies have shown nodifferences between the northern and southern stocks(Grant 1985). The Benguela sardine is a population
of the circumglobally distributed Sardinops sagax,additional populations being found in some of theother upwelling ecosystems of the world (Parrish etal. 1989, Grant and Leslie i 996).
Sardine have formed the basis of important fisheriesin both South Africa and Namibia since the late 1940s(Crawford et al. 1987). Catches in both countrieswere high during the 1950s and early 1960s, but declined rapidly thereafter and have remained relativelylow since then (Beckley and van der Lingen 1999). OffSouth Africa, hydroacoustic estimates of sardine biomass have shown that the stock size has grown steadilyfrom the mid 1980s to the present (Barange et al. 1999).Off Namibia, signs of a population recovery in theearly 1990s were followed by a decline in biomassthat rendered the northern sardine population virtuallycommercially extinct by the end of 1995 (Boyer et al.1997). Since then, the population has shown a slightincrease, but it is still below the levels of the early1990s (Fig. 2).
Large fluctuations in sardine biomass have beendescribed in all regions of the world where the speciesis intensively fished (L1uch-Belda et al. i 989, Schwartzlose et al. 1999). Although variability in populationsize is commonly attributed to conditions affectingearly life-history stages and hence recruitment vari-
* National Marine Information and Research Centre, Ministry of Fisheries and Marine Resources, p.a. Box 912, Swakopmund. Namibia.E-mail: [email protected]
t Marine & Coastal Management, Private Bag X2. Rogge Bay 8012, South Africa:j: Institute of Research for Development, 213 Rue La Fayette, 75480 Paris Cedex la, France
Manuscript received February 2001; accepted May 200 I
:.J
Illiiiifiill010029973
Fonds
Cote:
Documentaire I R0
b *2C1Cli2.. Ex: 2.

•
2001
MATERIAL AND METHODS
INDIANOCEAN
A Decade ofNamibian Fisheries ScienceSouth African Journal ofMarine Science 23
months). Condition factor is affected by food availability, physical factors and the physiology of fish,including its gonad maturity stage. Food availabilityis further dependent on environmental conditions andpopulation density (Parrish and Mallicoate 1995).Gonadosomatic index has been used as an indicatorof reproductive activity of Namibian sardine (Matthews1964), and in the absence of information on eggs andlarvae, could be used to give an indication of peakspawning periods.
The objective of this paper was to derive time-seriesof condition factor and gonadosomatic index for sardinepopulations in the northern and southern Benguelaover the period 1984-1999. These time-series couldthen be compared to assess possible co-variation between these two spatially distinct populations. Theeffect of various parameters (sex, fish length, etc.) oncondition factor and gonadosomatic index was alsostudied. Finally, the condition factor time-series wascompared with estimates of population biomass inorder to speculate on the effect of density-dependence.
I
SOUTH I
AFRICA (~) I
Port )
Elizabe.!!J/ \
~-...~:
I
LOderitz
\1
1
I ATLANTICOCEAN
35°~I
I _10°
124
Fig. 1: Map of southern Africa showing the location of themajor fishing grounds (shaded) and places mentioned
in the text
ability (Bakun 1985, Chambers and Trippel 1997),processes that affect population parameters (such asgrowth rate, natural mortality rate, fecundity and ageat maturity) of post-recruit fish have not been excludedas candidates for causality of interannual and interdecadal variation in population size (Freon 1989,Parrish and Mallicoate 1995). Such processes couldinclude environmental forcing, interspecies interactionsand density-dependent factors. With the exception ofmeasurements of growth rate, however, estimatingpopulation parameters is difficult, and it requires intensive sampling and analytical effort. As a result ofthese difficulties, biological time-series that can be usedto assess processes that could alter the populationsizes of post-recruit fish, are limited. Examples of timeseries that can be generated with relative ease formany fish populations are those of condition factorand gonadosomatic index.
Condition factor may be defined as an index of thephysiological well-being of a fish, and can also beconsidered an integrator of conditions encounteredduring some previous period (of the order of weeks to
Data sources
Biological data for sardine from both northern andsouthern Benguela were collected from commercialcatches made during the period 1984-1999. Data werecollected from a sample of 25-50 fish per landing. Inthe northern Benguela, samples were taken fromcatches landed at Walvis Bay, a total of 48 949 fishbeing sampled (Table I). In the southern Benguelasamples were collected from commercial catcheslanded at several different ports (Fig. 1). In all, 62 567fish were sampled there (Table I).
Information collected for each sample included thedate (only Year and Month variables were used) andcapture location (Latitude, Longitude and Depth [usingclass intervals 0-18.3 m, 18.3-36.6 m, 36.6 -54.9 m,etc. up to 530.4-548.7 m] for the northern Benguela;and Latitude and Longitude [of the north-west cornerof a lOxlO nautical mile "pelagic fishing block" inwhich the catch was made] for the southern Benguela).Measurements taken from individual fish includedtheir total length (TL, to the nearest mm), caudal length(CL), wet body mass (g, to the nearest 0.1 g), sex,gonad maturity stage and gonad mass (g, to the nearest0.1 g). Where no caudal length data were collected (forthe northern Benguela from 1992 onwards), caudal

Kreiner et al.: Condition Factor and GSI of Sardine in the Benguela 125
-.
19991997
,+,
,,41
'+- ---+",
199519931991
--f:O:f-- Southern Benguela
/----.,
,. ,,
198919871985
.----.----
- - - - .. - - - - - Northern Benguela
2001
II
1 OOO~
.. Iu;- 800~c.9
I0
600~0
E.Cl)Cl)
I«::2
400l0cc
I
I
2001I
Fig. 2: Estimates of the biomass of sardine in the northern and southern Benguela derived from VPA and hydroacoustic surveys. Data courtesy Boyer et al. (1997) and NatMIRC (unpublished data) for the northernBenguela, and Barange et al. (1999) and Marine & Coastal Management (unpublished data) for the
southern Benguela
(2)
(4)
length was calculated from total length using theequation
CL (mm) =0.836328 TL (mm) - 0.408755 , (1)
derived by fitting a linear regression (r2 = 0.984; n =43 695) to the data points where total length and caudallength were available.
The condition factor (CF) of each sardine was calculated using the expression
CF observed wet body massexpected wet body mass
Expected mass was estimated from length/massrelationships derived separately for the northern andsouthern Benguela sardine populations by fitting nonlinear regressions to the untransformed wet body massand caudal length data using Marquardt's (1963) iterative algorithm:
Wet body mass = a CLb , (3)
where a and b are estimated parameters.Gonadosomatic index (GSl) was expressed as a per
centage of wet body mass, and was calculated usingthe equation
GSI gonad mass xl00observed wet body mass- gonad mass
Data analysis
Time-series of CF and GSI were generated by fittinggeneral linear models (GLMs) to each of the datasetsfor each of the regions. The SAS software package(SAS Institute Inc. 1988) was used for all statisticalanalyses.
The GLM fitted to the CF data from the northernBenguela used Year, Month, Sex (immature or mature)and Depth as independent class variables, and Latitude,Longitude, GSI and CL as independent continuousvariables, plus their two-level interactions. A stepwise

126A Decade ofNamibian Fisheries Science
South African Journal ofMarine Science 23
Table I: Numbers of fish sampled by month and year in the northern and southern Benguela, 1984-1999
2001
YearJan.
Number of fish sampled
Total
Northern Bengl/ela1984 100 299 3991985 100 75 1751986 201 237 1498 1250 542 l263 150 100 199 299 57391987 100 100 I 547 1797 1241 I 330 I 174 1004 100 83931988 250 100 1448 950 539 437 349 637 65 50 48251989 339 931 1396 997 50 2194 798 250 69551990 349 350 749 2176 I 798 549 2140 I 786 6 99031991 10 656 569 609 499 110 10 24631992 16 41 336 1083 708 423 126 27331993 20 168 487 343 334 321 63 17361994 18 132 297 245 287 271 184 224 I 6581995 63 6 370 353 172 273 201 163 106 17071996 13 78 133 19 20 27 91 3811997 45 24 IJ4 224 87 122 6161998 49 27 143 199 146 15 168 12 7591999 19 144 148 150 46 507
Total 969 I 308 6894 10604 8247 6011 8 157 4911 789 587 106 366 48949
SOl/them Bengl/ela
1984 192 713 607 685 498 250 3 293 104 33451985 501 756 631 517 630 836 550 65 17 45031986 192 716 706 520 502 597 718 165 16 41321987 368 592 578 519 449 314 421 316 283 38401988 244 580 419 682 792 919 432 507 328 282 11 51961989 372 565 940 925 1100 764 586 275 55271990 350 950 987 841 1344 988 375 391 150 125 175 50 67261991 452 852 705 1 100 699 926 172 50 148 125 75 53041992 125 300 250 125 75 200 75 125 125 50 14501993 75 125 150 125 50 50 5751994 25 25 100 25 25 148 3481995 125 175 250 166 300 350 175 625 575 688 300 175 39041996 324 503 550 490 517 425 450 400 500 300 400 150 50091997 50 470 639 675 550 550 750 279 275 125 75 25 44631998 75 375 600 347 450 550 425 625 449 375 50 43211999 150 25 499 450 650 625 525 300 350 225 100 25 3924
Total 3620 7722 8611 8067 8706 8492 5657 4123 3216 2638 1290 425 62567
•
•
procedure was used to select manually a "sub-optimal"model. Because the number of observations is high,an optimal model (including all the significant variables)would be over-parameterized, and some parameterestimates would be biased and/or not unique estimators.As stressed by Lebreton et al. (1992), instead of intending to get the ideal model explaining the highestpercentage of variance, it is preferable to allow somesecondary and hypothetical effects in the residualsand to focus on the main effects in the model. A visualresidual analysis was performed to check for normalityin the distribution of residuals, and to ensure that therewas no trend in the mean and variance of residualsplotted against observed values.
As the sample size was unbalanced for the differentclass variables, simple means are biased and were notused here. Instead, least-squares estimates of marginalmeans (LS means) provided unbiased estimators ofthe class marginal means that would be expected hadthe design been balanced. For northern Benguela sardine, only data collected from January to Augusteach year were used in the analysis because of insufficient data in the last third of the year (see Table I).Owing to some wet mass data being missing, only45 725 data points were used for the CF analysis.
The GLM fitted to the CF data from the southernBenguela used the same approach and the same dependent variables as those for the northern Benguela
•

200] Kreiner et al.: Condition Factor and CS] ofSardine in the Benguela 127
- - - - -.- -- _. Northern Benguela ---('0"--- Southern Benguela
1.05
er:0f-0 1.00u: Iz0i=15 0.95z00
0.90
I
,,
, ,, ,
1985 1987 1989 1991 1993 1995 1997 1999
Fig. 3: GLM-derived time-series of annual LS means of condition factor for sardine in the northern and southernBenguela, 1984-1999
analysis, except for depth class, which was not available.Only data collected from January to September eachyear were used in this analysis because of insufficientdata in the last quarter of the year (see Table I). Initialanalysis of post-1996 data (years where there wasgood spatial coverage of sardine landings, with a significant number of samples being collected from bothWest Coast and South Coast fishing ports) revealedsignificant longitudinal effect, indicating that sampleslanded at Port Elizabeth had different characteristicsfrom those landed elsewhere. Therefore, data fromlongitudes east of 21 °E (i.e. > 21 °E) were excludedfrom further analysis, resulting in a total of 55 533data points being used in the CF analysis.
The GLM fitted to the CS] data from the northernBenguela used Year. Month, Sex (male or female) andDepth as independent class variables, and Latitude,Longitude and CL as independent continuous variables,plus their two-level interactions. All fish < 130 mmCL as well as fish with Maturity Stages <2 and>7were excluded, because these fish were considered tobe either immature or undergoing oocyte atresia. Thisreduced the total number of data points used for thenorthern Benguela sardine CS] analysis to 39 429.
The GLM fitted to the CS] data from the southern
Benguela used Year, Month and Sex (male or female)as independent class variables, and Latitude, Longitudeand CL as independent continuous variables, plustheir two-level interactions. Fish <130 mm CL andthose with Maturity Stages <2 and>7 were excluded,as for the northern Benguela data. In addition, data collected east of 21 °E were excluded for the reasons described above. This reduced the total number of datapoints used for the southern Benguela sardine CS]analysis to 16 316.
RESULTS
Length-mass relationships
The length/mass relationship for sardine in the northernBenguela is described by the equation
Wet body mass (g) = 0.0000096 CL (mm)3.0769(n =47 981, r2 =0.989) (5)
and that for sardine in the southern Benguela by
128A Decade ofNamibian Fisheries Science
South African Journal ofMarine Science 23 200]
-- - - -.- - - - - Northern Benguela ----EO~- Southern Benguela
1.10
0.95
1.00
'3:: - - - - - - -::w: _
"':E- ::£ - - _.'*="" - - - - - -~
0.90
cc~ 1.05(.)
Ltzoi=15z8
Jan. Feb. Mar. Apr. May Jun. Jul. Aug. Sep.
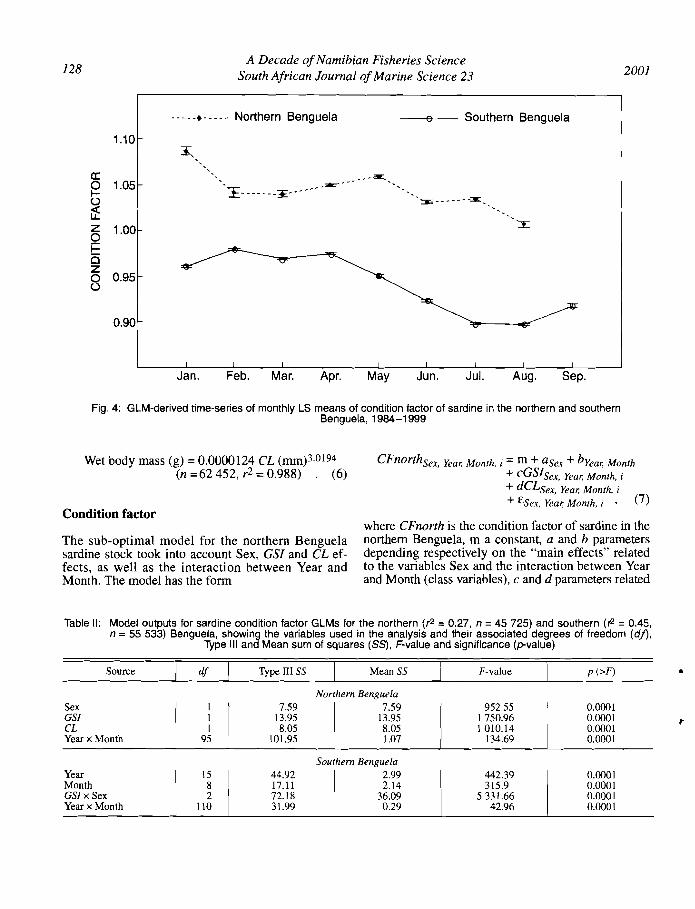
Fig. 4: GLM-derived time-series of monthly LS means of condition factor of sardine in the northern and southernBenguela, 1984-1999
Wet body mass (g) = 0.0000124 CL (mm)3.0194(n =62452, r2 = 0.988) . (6)
Condition factor
The sub-optimal model for the northern Benguelasardine stock took into account Sex, GS] and CL effects, as well as the interaction between Year andMonth. The model has the form
CFnorthsex, Year, Month, i = m + aSex + byear, Month+ cGSISex, Year, Month, i
+ dCLSex, Year, Month, i
+ ESex, Year, Month, i' (7)
where CFnorth is the condition factor of sardine in thenorthern Benguela, m a constant, a and b parametersdepending respectively on the "main effects" relatedto the variables Sex and the interaction between Yearand Month (class variables), c and d parameters related
Table 11: Model outputs for sardine condition factor GLMs for the northern (r2 =0.27, n =45 725) and southern (re =0.45,n =55 533) Benguela, showing the variables used in the analysis and their associated degrees of freedom (df),
Type III and Mean sum of squares (88), F-value and significance (p-value)
Source Type III SS Mean SS F-value p(>F)
Northern BenguelaSex 7.59
I7.59 952.55 0.0001
GSI 13.95 13.95 1 750.96 0.0001CL 8.05 8.05 1010.14 0.0001Year x Month 101.95 1.07 134.69 0.0001
Southern BenguelaYear 15 44.92 2.99 442.39 0.0001Month 8 17.11 2.14 315.9 0.0001GSlx Sex 2 72.18 36.09 5331.66 0.0001Year x Month 110 31.99 0.29 42.96 0.0001

2001 Kreiner et al.: Condition Factor and GSI ofSardine in the Benguela 129
Table Ill: Model outputs for the sardine gonadosomatic index GLMs for the northern ((2 =0.32, n =31 740) and southern((2 = 0.28, n =16315) Benguela, showing the variables used in the analysis and their associated degrees of free
dom (d/), Type III and Mean sum of squares (SS), F-value and significance (p-value)
Source Type III SS Mean SS F-value p (>F)
Northern BenguelaSex 1 5685.51 5 685.51 1512.25 0.0001CL I 8203.65 8203.54 2 182.04 0.0001Year x Month 93 49784.24 535.31 142.38 O.OOOl
Southern BenguelaSex 1 1 488.74 1 488.74 325.59 0.0001CL 1 4022.99 4022.99 879.84 0.0001Month 8 1 775.46 221.93 48.54 0.0001Year 12 1438.77 J 19.9 26.22 0.0001Longitude I 7302.48 7302.48 1 597.07 0.0001Year x Month 76 5919.53 77.89 17.03 0.0001
(10)
to covariates GSI and CL respectively, observed forgiven Sex, Year and Month classes, with i repetitions,and E is the residual. This model explains 27% of theobserved variance in CF (Table II) and indicates thatmost of the variance is explained (in descending orderof relative importance) by the interaction betweenYear and Month, GSI (positive effect) and CL (negativeeffect). The GLM-derived time-series of annual LSmean CF of sardine in the northern Benguela showsno trend and relatively high interannual variability(Fig. 3). The monthly variation looks rather high, butthe maximal amplitude seems to lie during a period(August-January) where the paucity of data preventsproper estimation of the CF LS mean values for theperiod September-December (Fig. 4).
The sub-optimal model for the southern Benguelasardine stock took into account Year and Month effects.as well as the interactions between GSI and Sex andbetween Year and Month. The model has the form
CFsouthyear. Month Sex i =m + QYear, " + bMonth + CYear, Month
+ dSexGSIYear, Month, Sex. i+ EYear, MOl11h, Sex, i ,(8)
where CFsollth is the condition factor of sardine in thesouthern Benguela, m a constant, a, band c parameters,and E is the residual. This model explains 45% of theobserved variance in CF and indicates that most ofthe variance is explained by the interaction betweenGSI and Sex (GSI has a positive effect regardless ofsex), and by Year (Table II). The GLM-derived timeseries of annual LS mean CF of sardine in the southernBenguela shows a steady decline over the study period(Fig. 3). Monthly LS mean CF values show a seasonalcycle, with CF highest between February and April
and lowest between July and September. However,some years showed a departure from this general pattern (e.g. in 1990 and 1997 the seasonal cycle was nonexistent) making it necessary to incorporate an interaction term between Year and Month in the model.
Gonadosomatic index
The sub-optimal model fitted to the GSI data for sardinefrom the northern Benguela took into account Sexand CL effects as well as the interaction between Yearand Month. The model has the form
GSlnorthsex, Year, Month, i = m + aSex + bYear,Mollth+ cCLSex,Year, Month+ ESex,Year, Month, i, (9)
where GSlnonh is the gonadosomatic index of sardinein the northern Benguela, m a constant. a, band careparameters, and E is the residual. The model explains32% of the variance (see Table HI) and indicates thatmost of the variance is explained (in descending orderof relative importance) by the interaction betweenYear and Month and by CL (positive effect).
The GLM fitted to the GSI data for sardine from thesouthern Benguela took into account the Year, Monthand Sex effects, the interaction between Year andMonth, as well as the CL and the Longitude effects.The model has the form
GSIsouthyear, Month, Sex, i = m + aYear + bMonth+ cSex + dyear, Month+ e-CLyear, Month, Sex, i+jLongitudeYear, Month, Sex, i+ £Year, Month, Sex, i

130A Decade ofNamibian Fisheries Science
South African Journal ofMarine Science 23 200]
- - - - .... - - - - - Northern Benguela o Southern Benguela
7
xUJ0 6z(J ,I~:::E 50Cl)
0 , ,
"0I.
,« ,z 4 ':70 ,(!)
,
"I,
" ,II "3 :t
1985 1987 1989 1991 1993 1995 1997 1999
Fig. 5: GLM-derived time-series of annual LS means of gonadosomatic index for sardine in the northern andsouthern Benguela, 1984-1999
where CSlsouth is the gonadosomatic index of sardinein the southern Benguela, m a constant, a , b, c and dparameters, and £ is the residual. This model explains28% of the observed variance in CSI (Table III), andindicates that most of the variance is explained (in descending order of relative importance) by Longitude(negative effect), the interaction between Year andMonth, and CL (positive effect).
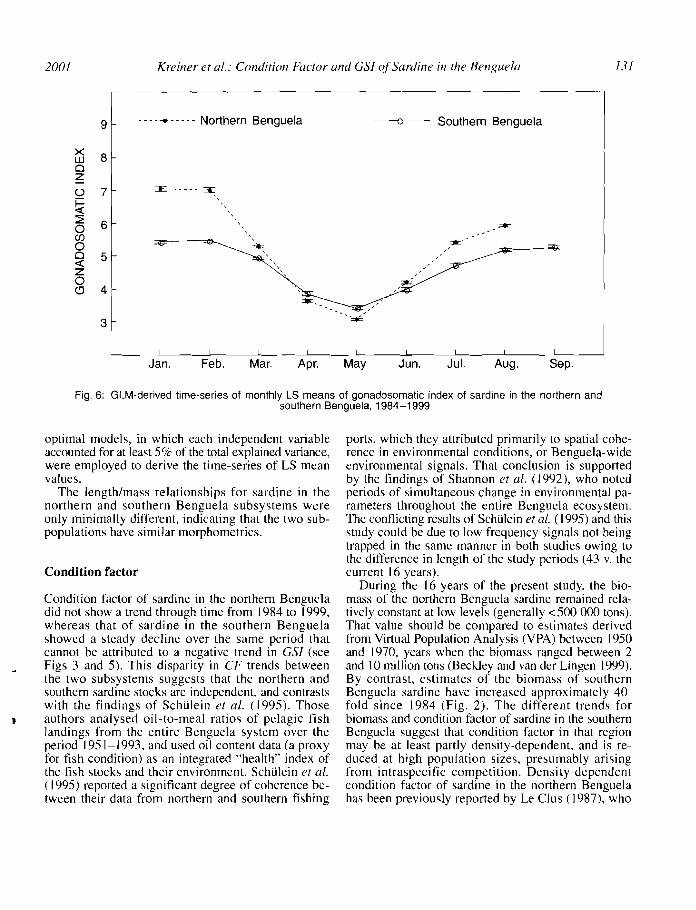
The GLM-derived time-series of annual LS meanCS] values for sardine in the northern and southernBenguela show high interannual variability and noannual trend over the study period in either subsystem(Fig. 5). Over the period studied, the two time-seriesappear to fluctuate quasi-synchronously, with the exception of 1994 where the data were out of phase; thiswas the lowest annual value of the time-series for thenorthern Benguela sardine and the highest annualvalue for sardine in the southern Benguela. MonthlyLS mean values indicate that the CS] follows thesame seasonal pattern for the northern and southernsardine stocks, with high CS] values between Januaryand March, low values from April to June, and highvalues again from July onwards (Fig. 6).
DISCUSSION
The main limitation perceived in the use of the GLMapproach is that it is not primarily designed to tracknon-linear effects of continuous variables. It is possibleto overcome this limitation by categorizing continuousvariables suspected of having non-linear effects whensufficient data are available, as was the case in thisanalysis. The non-linear effect of latitude and longitudein the northern Benguela was explored, and a slight butsignificant bimodal effect found in the latitude (withcondition factor peaking at 19 and 22°S). However.incorporating this effect improved the percentage ofexplained variance by only 1%, despite an increaseof 7 degrees of freedom in the model; hence, the latitudinal effect was not included. A second limitationof the analysis was the non-independence of individualobservations within a subsample taken from eachlanding, which would have resulted in overestimationof the level of significance of the variable effects. Tocounter this, a very low p-value threshold (p < 0.0001)for retaining independent variables was used, and sub-
2001 Kreiner et af.: Condition Factor and CS! of Sardine in the Benguela 131
----
- - - --. - - - - - Northern Benguela 0 Southern Benguela9
x 8w0z() 7 :::E-------~
~:::?: 6 -'*'0Cl) ,.-0 ~0 5«z0CJ 4
3~L, , I ,
Jan. Feb. Mar. Apr. May Jun. Jul. Aug. Sep.
Fig. 6: GLM-derived time-series of monthly LS means of gonadosomatic index of sardine in the northern andsouthern Benguela, 1984-1999
•
optimal models, in which each independent variableaccounted for at least 5% of the total explained variance,were employed to derive the time-series of LS meanvalues.
The length/mass relationships for sardine in thenorthern and southern Benguela subsystems wereonly minimally different, indicating that the two subpopulations have similar morphometrics.
Condition factor
Condition factor of sardine in the northern Bengueladid not show a trend through time from 1984 to 1999,whereas that of sardine in the southern Benguelashowed a steady decline over the same period thatcannot be attributed to a negative trend in CS! (seeFigs 3 and 5). This disparity in CF trends betweenthe two subsystems suggests that the northern andsouthern sardine stocks are independent, and contrastswith the findings of Schiilein et af. (1995). Thoseauthors analysed oil-to-meal ratios of pelagic fishlandings from the entire Benguela system over theperiod 1951-1993, and used oil content data (a proxyfor fish condition) as an integrated "health" index ofthe fish stocks and their environment. Schiilein et al.(1995) reported a significant degree of coherence between their data from northern and southern fishing
ports, which they attributed primarily to spatial coherence in environmental conditions, or Benguela-wideenvironmental signals. That conclusion is supportedby the findings of Shannon et al. (1992), who notedperiods of simultaneous change in environmental parameters throughout the entire Benguela ecosystem.The conflicting results of SchUlein et al. (1995) and thisstudy could be due to low frequency signals not beingtrapped in the same manner in both studies owing tothe difference in length of the study periods (43 v. thecurrent 16 years).
During the 16 years of the present study. the biomass of the northern Benguela sardine remained relatively constant at low levels (generally <500000 tons).That value should be compared to estimates derivedfrom Virtual Population Analysis (VPA) between 1950and 1970, years when the biomass ranged between 2and 10 million tons (Beckley and van der Lingen 1999).By contrast, estimates of the biomass of southernBenguela sardine have increased approximately 40fold since 1984 (Fig. 2). The different trends forbiomass and condition factor of sardine in the southernBenguela suggest that condition factor in that regionmay be at least partly density-dependent, and is reduced at high population sizes, presumably arisingfrom intraspecific competition. Density-dependentcondition factor of sardine in the northern Benguelahas been previously reported by Le Clus (1987), who

132A Decade ofNamibian Fisheries Science
South African Journal of Marine Science 23 2001
observed that condition indices were low when sardinebiomass was high, and high when biomass was low.Explicit statistical analysis regarding the correlationof condition factor and biomass has not yet been conducted, because this work forms part of an ongoingstudy using longer (50 years) time-series data.
The GLM analyses of condition factor for both thenorthern and southern Benguela sardine stocksshowed that the Month x Year interaction term explained a significant part of the variance in each system(Table II), suggesting that seasonal patterns of conditionfactor varied from year to year in both systems. Theamount of variance explained by this interaction washigher for the northern (78%) than for the southern(19%) Benguela, suggesting a more consistent seasonal signal in the southern Benguela data. The lack ofa clear seasonal cycle in condition factor of the northern Benguela sardine has been previously reported.Matthews (1964) was unable to show a clear seasonalpattern for condition factor data over the period 19571960, and Le Clus (l990a) found no consistent seasonal trend in sardine condition index for data from1965 -1979. Attempts to determine the age of sardinefrom the region by reading annual rings on otolithshas proven to be extremely difficult because of highinterannual differences (Thomas 1983, Agnalt 1995),further suggesting the absence of clear seasonal effects.Together with the results presented here, these datasuggest that the seasonal effect on sardine in thenorthern Benguela is low and/or inconsistent. Studiesin the region indicate stronger amplitude in the seasonalwind signal in the south than in the north (TauntonClark and Shannon 1988), but also suggest strongeroccasional events in the north than in the south (e.g.Benguela Niilos; Shannon et al. 1992). These findingsmay indicate a high degree of variation in the seasonalpattern of food availability in the northern Benguela.If this is the case, it would imply that sardine in thissubsystem have adopted an opportunistic strategywith regard to their use of energy available in theecosystem for somatic growth and lipid storage.
For the southern Benguela sardine, condition factoris highest in summer, declines in autumn and is lowestin July/August (Fig. 4). Because of the lack of summerdata (October-December is generally a closed season),the whole seasonal cycle could not be analysed for theperiod investigated. However, the seasonality in sardinecondition factor described by the GLM analysis aboveagrees with the findings of Davies (1956), who showedthat sardine condition factor during the years 1950-1954 was high during summer (December- February)and reached a maximum in March. From March onwards, condition factor declined through autumn and
winter, reaching a minimum in August/September(Davies 1956). Using visual assessments of mesentericfat as a proxy for total body lipid and hence an index offish condition, Van der Lingen et al. (1998) also reporteda strong seasonal cycle in lipid content of southernBenguela sardine, peaking between March and Juneand at a minimum between August and November.
Gonadosomatic index
The GSI for sardine in both northern and southernBenguela subsystems showed clear seasonal cycles(Fig. 6), but no trend over the study period. In thenorth, sardine spawn for most of the year, with peaks insummer/autumn, JanuarylFebruary, and winter/spring,September/October (Matthews 1964, Le Clus et al.1987, Le Clus 1991). In winter (May/June) there isnormally very little or no spawning, and these earlierfindings are reflected in this analysis. GSI was lowduring this period for the entire study. Matthews (1964)showed, for the years 1957-1960, that gonad mass(both sexes) is lowest in May in the nOlthern Benguela.In the southern Benguela, sardine appear to spawn yearround (Shelton 1986), but principally from August toMarch (Armstrong et al. 1989, Akkers et al. 1996,Huggett et al. 1998). The time-series of GSI obtainedin this study confirms the winter (April-July) minimumin reproductive activity. The negative relationship between GSI and longitude observed for southern Benguela sardine most likely reflects the greater intensityof spawning off the West Coast than on the SouthCoast in recent years (Van der Lingen et al. in press).
A very low GSI was observed in 1994 in the northernBenguela system, the year before a major BenguelaNiilo, whereas in the southern Benguela a peak in thesame parameter was noticeable in the same year. Thelow GSI in the north could have been a result of environmental disturbances or dispersal of food concentrations prior to the arrival of warm water (Le Clus1990b). Le Clus (1990b) found that, prior to the onsetof the Benguela Ndio of 1984, neither sardine nor anchovy were spawning. Nevertheless, low values of GSIwere also observed in 1989 and, to a lesser extent, in1995 (Fig. 5), without clear interpretation.
In conclusion, the results of the GLM analyses havesuggested that the two subsystems of the Benguelaupwelling ecosystem displayed different and nonsynchronized patterns in interannual variation in condition factor and gonadosomatic index of Sardinopssagax over the period 1984-1999. TIlls finding suggeststhat the stocks of sardine in the two subsystems havetheir own short-term dynamics, probably related to
•
2001 Kreiner et al.: Condition Factor and CSl ofSardine in the Benguela 133
•
different dynamics in the environment, and confirmsthat, during the years of this study at least, there waslittle migration (if any) between the two.
ACKNOWLEDGEMENTS
This paper arises from cooperative research betweenmembers of the VIBES/IDYLE1 (French-SouthAfrican) and ENVIFISH (EU project, contract no. ICI8.CT98-329) research programmes. The authors thankDr R. H. Parrish (Pacific Fisheries EnvironmentalLaboratory) for valuable comments on the draftmanuscript.
LITERATURE CITED
AGNALT, A-L. 1995 - An attempt to validate the ageing ofsouthern African pilchard (Sardinops ocellatlls) caught offNamibia using back-calculation. Unpublished report,Ministry of Fisheries and Marine Resources, Namibia: 24pp. (mimeo).
AKKERS, T. R., MELO. Y. C. and W. VEITH 1996 - Gonaddevelopment and spawning frequency of the South Africanpilchard Sardinops sagax during the 1993 -1994 spawningseason. S. Afr. J. mar. Sci. 17: 183-193.
ARMSTRONG. M. J. and R. M. THOMAS 1989 - Clupeoids. InOceans of Life off Southern Africa. Payne, A. I. L. andR. 1. M. Crawford (Eds). Cape Town; Vlaeberg: 105-/21.
ARMSTRONG, M. J., ROEL, B. A. and R. M. PROSCH 1989Long-term trends in patterns of maturity in the southernBenguela pilchard population: evidence for density-dependence? S. Afr. J. mar. Sci. 8: 91-101.
BAKUN, A. 1985 - Comparative studies and the recruitmentproblem: searching for generalizations. Rep. Calif. coop.oceanic Fish. Invest. 26: 30-40.
BARANGE, M., HAMPTON, r. and B. A. ROEL 1999 - Trendsin the abundance and distribution of anchovy and sardine onthe South African continental shelf in the 1990s. deducedfrom acoustic surveys. S. Afr. J. mar. Sci. 21: 367-391.
BECKLEY, L. E. and C. D. VAN DER LINGEN 1999 - Biology,fishery and management of sardines (Sardinops sagax) insouthern African waters. Mar. Freshwat. Res. 50: 955-978.
BOYER, D. c.. CLOETE, R.. BOYER, H. [1.] and G. D'ALMEIDA1997 - The recent collapse of the northern Benguelapilchard stock. In Proceedings of an InternationalWorkshop on the Research and Management of Pilchard inNamibia. February 1997. Swakopmund: Ministry ofFisheries and Marine Resources: 118-130.
CHAMBERS, R. C. and E. A. TRIPPEL (Eds) 1997 - Early LifeHistory and Recruitment in Fish Populations. London;Chapman & Hall: 596 pp.
CRAWFORD. R. J. M.. SHANNON, L. V. and D. E. POLLOCK1987 - The Benguela ecosystem. 4. The major fish and in-
1 Interactions and spatial dynamics of renewable resources in upwelling ecosystems. IDYLE is a follow-up programme of VIBES
vertebrate resources. In Oceanography and Marine Biology.An Annual Review 25. Bames, M. (Bd). Aberdeen: UniversityPress: 353-505.
DAVTES, D. H. 1956 - The South African pilchard (Sardinopsocellata). Sexual maturity and reproduction 1950-54.Investl Rep. Div. Fish. S. Afr. 22: 155 pp.
FREON, P. 1989 - Introduction' of climatic variables into globalmodels. In Proceedings of an IllIemational Symposium onLong Term Changes in Marine Fish Populations, Vigo, 1986.Larrafieta. M. G. and T. Wyatl (Eds). Vigo: ConsejoSuperior de Investigaciones Cientificas: 481-528.
GRANT, W. S. 1985 - Population genetics of the southern Africanpilchard, Sardinops ocellata. in the Benguela upwelling system. In IllIernational Symposium 011 the Most ImportantUpwelling Areas off Western Africa (Cape Blatlco andBenguela), [Barcelona, 1983]. Bas, C. Marga1ef. R. and P.Rubies (Eds). Barcelona; Instituto de InvestigacionesPesqueras: 551-562.
GRANT, W. S. and R. W. LESLlE 1996 - Late Plei stocene dispersalof Indian-Pacific sardine populations in an ancient lineageof the genus Sardinops. Mar. BioI. 126: 133-142.
HUGGETT, J. A .• BOYD. A. J., HUTCHINGS, L. and A. D.KEMP 1998 - Weekly variability of c1upeoid eggs andlarvae in the Benguelajet current: implications for recruitment.In Benguela Dynamics: Impacts of Variability on Shelf-SeaEnvironments and their Living Resources. Pillar. S. c..Moloney, C. L.. Payne. A. I. L. and F. A. Shillington (Eds).S. Afr. J. mar. Sci. 19: 197-210.
LEBRETON. J-D., BURNHAM. K. P.. CLOBERT. J. and D. R.ANDERSON 1992 - Modeling survival and testing biological hypotheses using marked animals: a unified approachwith case studies. Ecol. Monogr. 62(1): 67-118.
LE CLUS, F. 1987 '- Reproductive dynamics of female pilchardSardinops ocellatus in the northern Benguela system, withparticular reference to seasonality. the environment andfish condition. Ph.D. thesis. University of Port Elizabeth: x+ 430 pp.
LE CLUS, F. I990a - Spatial variability in the seasonal trends ofovary weight in the Namibian pilchard population,1965-1979. S. Afr. J. mar. Sci. 9: 69-83.
LE CLUS. F. I990b -Impact and implications of large-scale environmental anomalies on the spatial distribution of spawningof the Namibian pilchard and anchovy populations. S. Afr. J.mar. Sci. 9: 141-159.
LE CLUS, F. 1991 - Hydrographic features related to pilchardand anchovy spawning in the northern Benguela system,comparing three environmental regimes. S. Afr. J. mar. Sci.10: 103-124.
LE CLUS, F.. HEWITSON. J. D.. MELO, Y. c., COOPER. R. M.and P. E. MALAN 1987 - The multispecies pelagic fisheryoff Namibia 1982-1986 and stock assessments for pilchardand anchovy. Colln scient. Pap. into CO//lmn SE. Atl. Fish.14(2): 7 -25.
LLUCH-BELDA. D., CRAWFORD, R. 1. M.. KAWASAKI, T.. MacCALL. A. D., PARRISH, R. H., SCHWARTZLOSE, R. A.and P. E. SMITH 1989 - World-wide fluctuations of sardineand anchovy stocks: the regime problem. S. Afr. 1. //lar. Sci.8: 195-205.
MARQUARDT, D.W. 1963 - An algorithm for least-squares estimation of non-linear parameters. J. Soe. ind. Appl. Math.11: 431-441.
MATTHEWS, J. P. 1964 - The pilchard of South West Africa(Sardinops ocellata). Sexual development. condition factorand reproduction, 1957 -1960. Investl Rep. mar. Res. Lab.S. W Afr. 10: 96 pp.
NEWMAN, G. G. 1970- Migration of the pilchard Sardinops

/34A Decade ofNamibian Fisheries Science
South African Journal ofMarine Science 23 2001
ocel/ata in southern Africa. Investl Rep. Div. Sea Fish. S.Afr. 86: 6 pp.
PARRISH. R. H., SERRA. R. and W. S. GRANT 1989- Themonotypic sardines, Sardina and Sardinops: their taxonomy,distribution. stock structure. and zoogeography. Can. 1. Fish.Aquat. Sci. 46(11): 2019-2036.
PARRISH. R. H. and D. L. MALLlCOATE 1995 - Variation in thecondition factors of California pelagic fishes and associatedenvironmental factors. Fish. Oceanogr. 4(2): 171-190.
SAS INSTITUTE [Ne. 1988 - SASISTAT User's Guide, Release 6.03Edition. Cary, North Carolina: SAS Institute Inc.: 1028 pp.
SCHOLEIN. F. H., BOYD. A. J. and L. G. UNDERHILL 1995Oil-to-meal ratios of pelagic fish taken from the northernand the southern Benguela systems: seasonal patterns andtemporal trends. 1951-1993. S. Afr. 1. mar. Se/.IS: 61-82.
SCHWARTZLOSE, R. A.• ALHEIT, J., BAKUN. A.. BAUMGARTNER. T R" CLOETE. R., CRAWFORD, R. J. M ..FLETCHER, W. J., GREEN-RUIZ, Y.. HAG EN. E.,KAWASAKI. T. LLUCH-BELDA. D., LLUCH-COT~. S. Eo,MacCALL, A. D., MATSUURA, Y., NEV AREZMARTfNEZ, M. 0., PARRISH, R. Ho, ROY, e.. SERRA, R..SHUST. K. v., WARD, M. N. and J. Z. ZUZUNAGA 1999- Worldwide large-scale fluctuations of sardine and anchovypopulations. S. AfT. J. mar. Sci. 21: 289-347.
SHANNON, L. V. 1985 - The Benguela ecosystem. I. Evolutionof the Benguela, physical features and processes. InOceanography and Marine Biology. An Annual Review 23.Barnes, M. (Ed.). Aberdeen: University Press: 105-182.
SHANNON, L. v., CRAWFORD, R. J. M.. POLLOCK, D. E.,HUTCHINGS, L.. BOYD. A. J., TAUNTON-CLARK. 1..
BADENHORST, A., MELVILLE-SMITH. R.. AUGUSTYN.e. J .. COCHRANE. K. L.. HAMPTON, I.. NELSON, G..JAPP, D. W. and R. J. Q. TARR 1992 - The 1980s - adecade of change in the Benguela ecosystem. In BenguelaTrophic Functioning. Payne. A. I. L.. Brink. K. H., Mann.K. H. and R. Hilborn (Eds!. S. Afr. 1. mar: Sci. 12: 271-296.
SHELTON. P. A. 1986 - Fish spawning strategies in the variablesouthern Benguela Current region. Ph.D. thesis, Universityof Cape Town: [vi] + 327 pp.
TAUNTON-CLARK. J. and L. V. SHANNON 1988 - Annualand interannual variability in the South-East Atlantic duringthe 20th century. S. AfT. J. mar. Sci. 6: 97 -I 06.
THOMAS, R. M. 1983 - Back-calculation and time of hyalinering formation in the otoliths of the pilchard off South WestAfrica. S. Afr. 1. mar. Sci. 1: 3-18.
VAN DER LINGEN, e. D., DE GOEDE, J. and L. HUTCHINGS1998 - Condition factor of pelagic fish. In Report 011 thePelagic Working Group Workshop on Biological Resellrch.Unpublished report, Marine & Coastal Management, SouthAfrica WG/AUG98IPELl2: no pagination.
VAN DER L1NGEN, CD., HUTCHINGS. L., MERKLE, D.. VANDER WESTHUIZEN, J. J. and J. NELSON (in press) Comparative spawning habitats of anchovy (Engrallliscapensis) and sardine (Sardinops sagax) in the southernBenguela upwelIing ecosystem. In Proceedings ot theSymposium on Spatial Processes and Mallagement of FishPoplllariof/s. Kruse. G. H., Bez, N.. Booth. T, Dorn, M..Hills, S.. Lipcius. R., Pelletier. D., Roy. C, Smith. S. andD. Witherell (Eds). Fairbanks: University of Alaska SeaGrant, AK-SG-OO-04.
•