stock assessment executive summary
TRANSCRIPT

CDFG California Spiny Lobster
Stock Assessment - Executive Summary
1
California Spiny Lobster Stock Assessment
Executive Summary
Assessment Conclusions. The spiny lobster population off southern California
appears to be stable from both observed and modeled results, and the fisheries
targeting this species can be considered, as of today, sustainable.
Stable trends, or trends that over time will favor higher levels of stability, are apparent in
a large number of different variables from both fishery independent and dependent
observations. Over the last ten years, the commercial fishery has consistently harvested
660,000 lbs (300+ tonnes), accumulated at the same general rate as the season
progresses, each season. The average size of commercially caught lobster has been
fairly consistent as well at 1.4 ± 0.1 lbs over the decade, with a similar size (1.7 ± 0.5
lbs.) seen in recreationally-caught lobster. A just-legal size lobster weighs
approximately 1.3 lbs (0.67 kg), based on a power function fitted to bight-wide creel
survey data (R2=0.77) which, at published rates of growth, means these fisheries are
catching lobster within a year or two of recruitment; and the recreational fishery, at least,
is targeting trophy-size animals. The lack of larger animals could be a cause for
concern, however the sub-recruit population appears large and robust. The number of
short lobster released as a percentage of the total caught has also remained consistent
over the decade, regardless of the overall size of the seasonal harvest. Although
varying by county, the percentage of released shorts is consistent within each county as
well as in the southern California bight as a whole. Although no information is available
on the frequency of recapturing shorts, shorts released across the entire bight account
for 70-80 percent of the total lobster caught indicating the possibility of a very large,
underlying population.
The number of operator permits has been declining despite a jump in the number of
active permits in 2006. The number of traps deployed is expected to continue to
decline, and the number of permit transfers in any given year (who may fish at higher
effort levels) is not expected to be significant. Measured CPUE, while currently lower

CDFG California Spiny Lobster
Stock Assessment - Executive Summary
2
than two or three decades ago, is still within a standard deviation of the average CPUE
over the last decade.
Modeled results likewise support a conclusion that the population and its fisheries have
been stable over the last decade. Catchability, the percent of the total catch caught with
each trap pull and estimated using depletion models, has been consistent since 1998,
the earliest year considered. This consistency is seen despite fluctuations in the
ultimate size of the catch each season. Using the size-structured, Fishery Simulation
Model (FISMO) utilizing von Bertallanfy growth and Beverton-Holt recruitment,
estimates of fishing effort (F), effort at the maximum sustainable yield (Fmsy), and stock
biomass also appear to be sustaining. Although the technical review of this assessment
identified several things to be investigated or modified before FISMO could be used to
fully explore the interplay between lobster life history parameters, catch, and effort,
some basic results were found useful (and were corroborated by independent modeling
by the Technical Review Panel members).
In all but one of eight scenarios - scenarios differentiated between different levels of
recreational catch and changes in life history parameter values - the level of modeled
effort did not result in a decline in biomass; and it is questionable, in the remaining
scenario whether a decline was in fact occurring. The two scenarios that best
supported the stable nature of the stock biomass, relative to the fishing effort, were also
the scenarios that best fit an increase in biomass since 1976 that we assume is
responsible for the increase in observed landings over the same time period. All the
modeling scenarios reflected, as well, a stable estimated stock biomass since 2000.
Corroboration of a stable fishery can also be found in observed (not modeled) data as
well. Model runs using the Fishery Simulation Model (FISMO, description below)
suggest that despite the apparent stability of the recent catch record, the fishery is
approaching, or has reached the maximum sustainable yield. While this may mean that
increased effort on the part of the fishermen will result in declining increases in catch,
the overall stable state of so many population-specific parameters, and no immediate
indication that anything is going to change, suggests the fishery is stable. The
CDFG California Spiny Lobster
Stock Assessment - Executive Summary
3
increasing FISMO biomass estimates over time also corroborated this conclusion.
There is a confounding factor, however, and that is the recreational fishery.
The recreational fishery has changed dramatically since 2005 with the introduction and
popularization of hoop nets. Preliminary data suggest that the recreational take is
substantial, adding the equivalent of another 30 to 60 percent to the commercial
harvest. However, the data is limited with only about a 12 percent return rate of spiny
lobster report cards. We cannot tell if the recreational fishery is stabilizing or continuing
to increase its harvest. If the recreational hoop net fishery continues to increase in
popularity and commercial landings remain at current levels, the probability that model
runs, already approaching or exceeding the Fmsy, will exceed this level, increases. If
Fmsy is exceeded by a substantial amount, at some point the modeled stock biomass
estimates will decline. If that decline is accompanied by a drop in actual catch the
population will definitely be overexploited and action may need to be taken. However,
since our report card data collection lags each season by approximately a year; and we
cannot detect changes in the recreational fishery within that timeframe; rates of change
will take longer to quantify. Thus, we might not detect a problem with the recreational
effort until commercial catch starts to decline. Future assessment efforts need to fully
consider the uncertain state of the recreational effort when predicting the health of the
fisheries.
Similar to the unknown factor presented by the hoop net fishery, transferable
commercial operator licenses could also upset the apparent stability in the lobster
fisheries. Although it is not expected to be a consistent problem, it is possible for a
large number of transfers to occur before any given season. Currently, permits are
selling for approximately $75,000 and a purchaser may attempt to recover that cost be
increasing the fishing effort relative to the previous permit holder’s fishing effort. A large
number of transfers year after year could impact the health of the fishery and as with the
recreational hoop net effort, future assessment efforts need to consider this possibility.
Natural and Life History Overview. The California spiny lobster is endemic to the
west coast of North America from Monterey, California southward at least as far as

CDFG California Spiny Lobster
Stock Assessment - Executive Summary
4
Magdelena Bay, Baja California (Wilson, 1948; Schmitt, 1921), with a small isolated
population in the northwestern corner (Bahia de Los Angeles) of the Gulf of California
(Kerstitch, 1989). Johnson and Snook (1927) reported its occurrence as far south as
Manzanillo, Mexico.
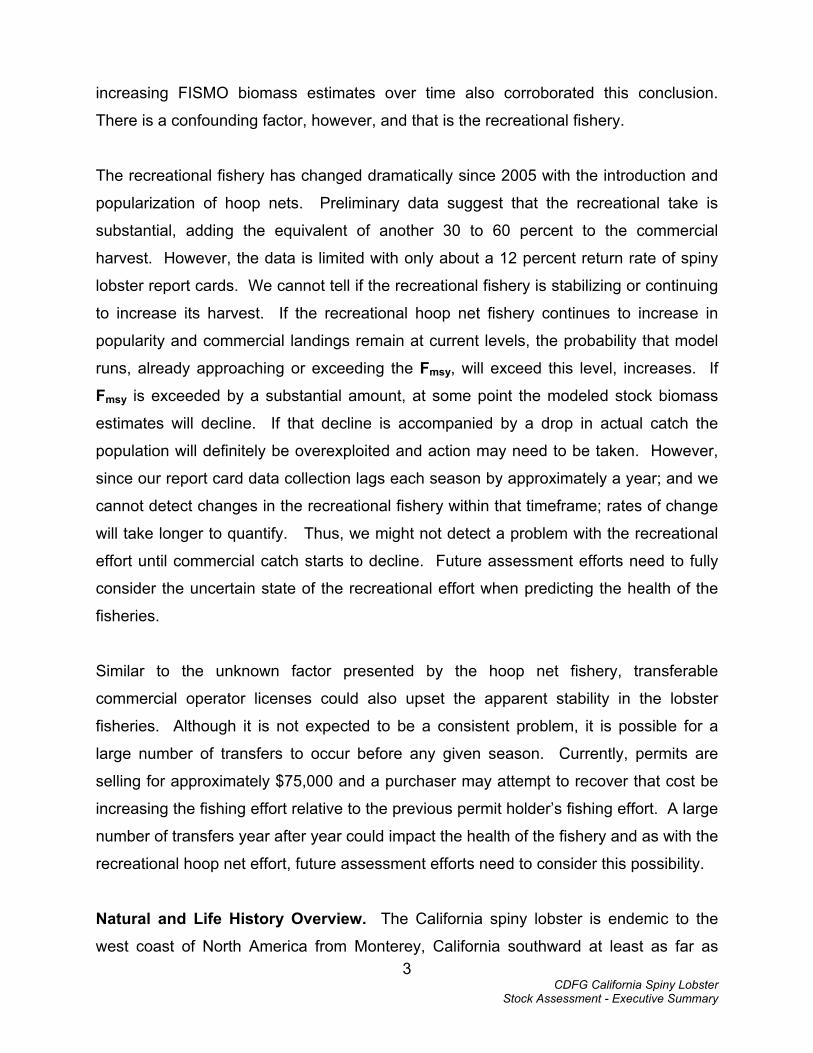
Figure 1. Primary distribution range of the California Spiny Lobster extending from Monterey, California in the north to Magdalena Bay, Baja California with a small population occurring in the northwest portion of the Sea of Cortez. Lobster are considered rare north of Pt. Conception. The center of the population, and the point with the highest concentration of individuals falls in Baja California.
Spawning occurs once per year during the late spring through summer months
(Johnson, 1960). Male lobster attach a gummy spermatophore on the underside of the
female’s carapace, termed plastering. The female produces 50,000 to 800,000 eggs
(Allen, 1916; Lindbergh, 1955; Johnson, 1960) which are kept between the underside of
her tail and her paddle-like swimming legs (pleopods). The eggs are fertilized when the
female breaks open the attached spermatophore, and the fertilized eggs are carried
under her tail until they hatch.

CDFG California Spiny Lobster
Stock Assessment - Executive Summary
5
Upon hatching, the larval lobster (phyllosoma) spends approximately 10 months in the
plankton (Mai & Hovel, 2007; Mitchell 1971). The final planktonic stage (puerulus) is the
first to resemble an adult lobster, and settles into shallow, vegetated habitats such as
eelgrass or surfgrass beds (Mai & Hovel, 2007). Assuming conditions are conducive,
the puerulus begins a benthic existence that will last the rest of the lobster’s life. The
planktonic larva have been found offshore as far as 530 km and at depths to 137 m.
(California Department of Fish and Game, 2001) while post-settled lobster are
commonly found at depths ranging from intertidal to 64m.
Engel (1979) summarized numerous studies that have published growth information on
the California spiny lobster but found little agreement. Legal size (82.5 mm CL) is
reached after 7 to 13 years and, once attained, lobster molt once per year. Males grew
faster than females. The age at sexual maturity ranged from 3 to 9 years, with most
suggesting around 5 years, and males matured faster than females. From observations
of trapped lobster, sexual maturity occurs prior to the attainment of legal size.
Fisheries. The Southern California population of California spiny lobster in the
Southern California Bight is considered a single stock targeted by three fisheries: a
commercial fishery, a hoop net-based recreational fishery, and a dive-based
recreational fishery relying on hand catch. The state of California, and specifically the
Fish and Game Commission, is responsible for the regulation of these fisheries.
Current regulations cover the commercial fishing effort and a single, combined hoop net
and dive-based, recreational fishing effort.
Assessment Background. Discussions setting the stage for this assessment began in
2008, increased in frequency and focus during 2009, and culminated in a December
2009 lobster data workshop soliciting models and datasets available for the
Department’s use. Formal work on the stock assessment began in January 2010.
Existing Datasets Used. The 2009 lobster data workshop did not identify any
Southern California Bight-wide fishery independent datasets targeting California spiny
lobster north of the Mexican border. There were some highly detailed studies, carried

CDFG California Spiny Lobster
Stock Assessment - Executive Summary
6
out both by and independent of the Department, from which data and results were made
available for our use. However, there was limited time allotted to this assessment effort,
and whether the results from any of these studies could be applied to the bight in
general would represent a significant study by itself. For this effort, however,
determining the applicability of these studies to the whole bight was unnecessary since
the Department possessed a long-term, bight-wide, fishery dependent set of
commercial logbook and landings data. In addition, the Department also had bight-wide
recreational data from the newly implemented recreational spiny lobster report card.
The Department decided to rely on the bight-wide datasets with the expectation that the
resulting assessment would provide a contextual framework for interpreting the regional
datasets from a bight-wide perspective.
A related effort was also undertaken in parallel with the assessment effort aimed at
digitizing the entire available record of commercial logbook data, since over 20 years of
the 38-year record (1973 to present) existed as paper hardcopies only. In addition, data
from newly-received recreational spiny lobster report cards were digitized. This work
occurred in parallel with the formal stock assessment effort. However, datasets of
sufficient length and coverage for some approaches were not available until well into the
second half of the project. In the case of the recreational catch record, approximately
20 years of harvest were estimated from a single creel survey in 1992, a 2007 creel
survey and the initial return of calendar year 2009 lobster report cards.
Since there was insufficient data to isolate the two recreational fisheries, the
Department chose, for the current assessment, to combine catch and effort from the two
recreational fisheries into a single dataset. Initial results from the Department’s
recreational lobster report cards, established in the fall of 2008, suggest that the
recreational harvest is not insignificant compared to the commercial harvest. The
historical recreational harvest was estimated from report card data for two seasons
(2008-09 and 2009-10) and two Department-led recreational creel surveys performed in
1992 and 2007. As data were entered, assessment tools that were previously unusable
because of the lack of a sufficiently long time series became available. Where time
allowed, these emerging techniques were investigated, otherwise they were set aside
for future iterations of this assessment.
CDFG California Spiny Lobster
Stock Assessment - Executive Summary
7
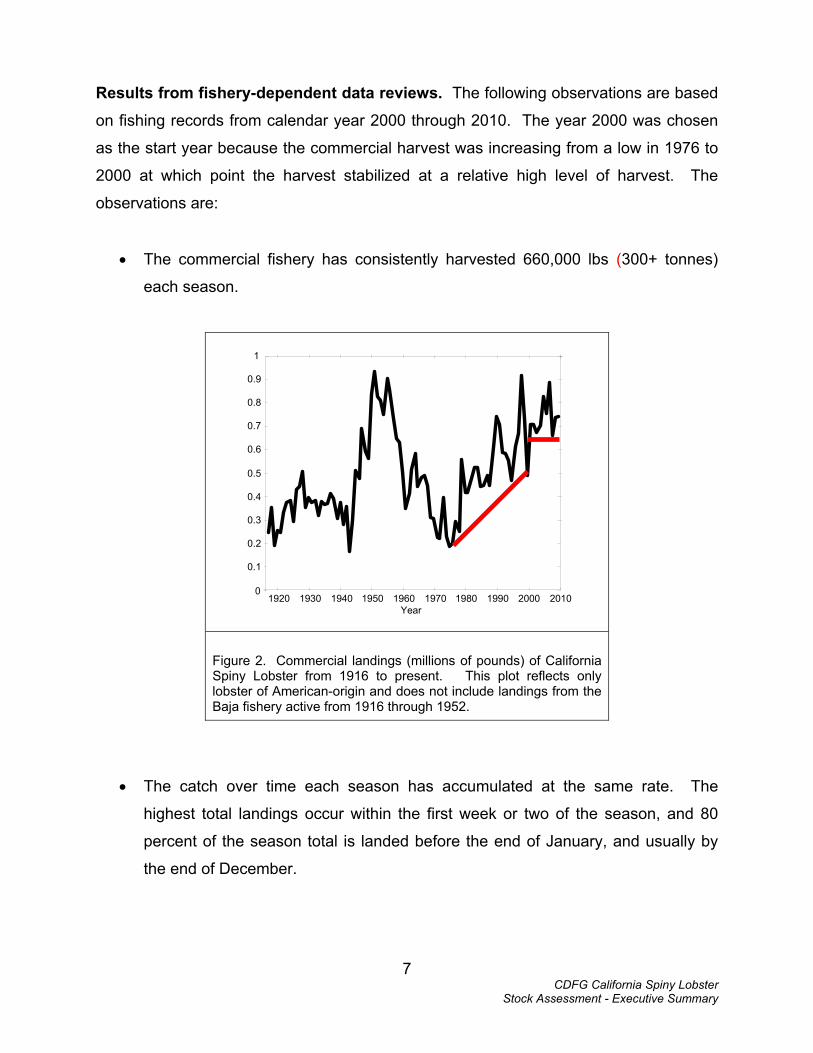
Results from fishery-dependent data reviews. The following observations are based
on fishing records from calendar year 2000 through 2010. The year 2000 was chosen
as the start year because the commercial harvest was increasing from a low in 1976 to
2000 at which point the harvest stabilized at a relative high level of harvest. The
observations are:
The commercial fishery has consistently harvested 660,000 lbs (300+ tonnes)
each season.
1920 1930 1940 1950 1960 1970 1980 1990 2000 2010 0
0.1
0.2
0.3
0.4
0.5
0.6
0.7
0.8
0.9
1
Year
1920 1930 1940 1950 1960 1970 1980 1990 2000 2010 0
0.1
0.2
0.3
0.4
0.5
0.6
0.7
0.8
0.9
1
Year
Figure 2. Commercial landings (millions of pounds) of California Spiny Lobster from 1916 to present. This plot reflects only lobster of American-origin and does not include landings from the Baja fishery active from 1916 through 1952.
The catch over time each season has accumulated at the same rate. The
highest total landings occur within the first week or two of the season, and 80
percent of the season total is landed before the end of January, and usually by
the end of December.

CDFG California Spiny Lobster
Stock Assessment - Executive Summary
8
A B
A B
Figure 3. Combined commercial catch trends showing the decline in CPUE (black line) and the percentage of total catch (orange line) by week of the seasons for A) the 07/08 season, and B) the 06/07 season. These seasons are typical for the commercial fishery. Initial high CPUE declines rapidly to a ‘background’ level of CPUE marked by booms and bust. Booms and busts are indicative of fewer available lobster either because of local fish-out or movement of the fishery into deeper waters with less accurate trap placements relative to resident lobster concentrations.
The size structure of the catch has not changed significantly. Assuming a fixed
growth rate (6 mm yr-1), the majority of the harvest is first year recruits to the
fishery. The commercial fishery targets this size lobster while the recreational
harvest, which targets trophy animals, is constrained to this size probably by
availability.

CDFG California Spiny Lobster
Stock Assessment - Executive Summary
9
Figure 4. Reconstructed age classes of recruited lobster for seasons 1998-99 through 2008-09 based on collated landing weights and logbook retained lobster counts. The resulting weight per lobster was converted to carapace length using the length/weight relationship derived from the Department’s 2007 creel survey data. The growth rate was assumed to be 6 mm CL year-1 based on results reported in Engel (1979). The plot was created to show the consistency of size/age within the commercial catch over the last ten years.

CDFG California Spiny Lobster
Stock Assessment - Executive Summary
10
Based on depletion model results, catchability – the percent of total seasonal
catch caught in each trap pull - has not varied significantly from season to
season.
Table 1. Catchability, the percent of total catch caught in each trap pull for the combined recreational and commercial fishery. Extracted from Table 4, below.
Season Catchability
1999-00 1.10 x 10⁻⁶
2000-01 2.51 x 10⁻⁶
2001-02 1.64 x 10⁻⁶
2002-03 Does not fit Depletion Model assumptions
2003-04 1.21 x 10⁻⁶
2004-05 2.10 x 10⁻⁶
2005-06 1.54 x 10⁻⁶
2006-07 1.85 x 10⁻⁶
2007-08 1.78 x 10⁻⁶
2008-09 1.50 x 10⁻⁶
2009-10 1.31 x 10⁻⁶
The number of shorts released, as a percent of the total commercial catch, has
not changed over the last decade. This statement is true whether considering
the entire bight, individual counties, or offshore islands. The percentage is
independent of the size of total catch. Bight-wide, 70 percent of the catch is
short. Put into perspective, the 480,000 lobster landed in 2009-10 were 28
percent of the total 1.7 million lobster caught.

CDFG California Spiny Lobster
Stock Assessment - Executive Summary
11
Table 2. Percent number of shorts released by location and season from logbook data. Total catch was calculated by adding the numbers of legals retained to the number of shorts reported for each region. Total bight percentages sum across the entire southern California Bight.
Season Total Bight
North Channel Islands
South Channel Islands
Santa Barbara County
Ventura County
Los Angeles County
Orange County
San Diego
County 2000-01 68.80 40.45 61.02 57.67 49.39 55.97 71.15 77.55 2001-02 68.72 32.13 63.09 54.92 44.15 54.52 71.34 80.11 2002-03 70.35 33.71 66.49 55.28 50.49 55.53 74.59 83.43 2003-04 70.69 27.86 59.60 52.00 38.27 55.12 70.10 83.83 2004-05 65.92 25.17 56.87 48.97 39.72 46.31 66.96 78.27 2005-06 69.79 26.85 64.46 52.39 48.24 53.23 69.27 81.20 2006-07 69.59 27.48 63.60 57.85 25.57 54.23 70.49 78.62 2007-08 73.56 33.46 65.32 62.91 45.98 56.84 74.33 84.47 2008-09 74.10 29.41 69.93 57.14 52.97 58.21 76.03 84.06 2009-10 72.44 27.85 66.86 54.80 53.07 62.11 76.47 83.11
The number of commercial operator permits have been declining and the number
of active fishermen have also declined since a small jump in the early 2000s. If
this trend continues fewer traps will be set in the future leading to reduced
pressure on the resource. However, the commercial fishery is transitioning to
transferable permits. These will make it easier for inactive permits to be
purchased by new operators. Given the high cost of the permit, it would be
expected that new permit holders would want to fish at maximum effort in order
to recoup their costs. Transferability adds uncertainty to predictions of stability
within the fishery. In addition, new MPAs, set to go into effect on January 1,
2012 will probably increase fishing effort on the non-MPA fishing grounds as
displaced fishermen move to new areas. The magnitude of this increase, and its
effects, has yet to be determined.

CDFG California Spiny Lobster
Stock Assessment - Executive Summary
12
Number of Lobster Permits by Season
150
200
250
300
350
400
450
500
1985 1990 1995 2000 2005 2010
Season Start Year
Nu
mb
er o
f P
erm
its
Figure 2. Total number of available operator permits by season from 2005-06 through 2008-09. There has been a steady decline in the number of permits since the 1998-99 season. Seasons without available operator permit totals are left blank.
Number of Active Permits by Seaon
100
120
140
160
180
200
220
1985 1990 1995 2000 2005 2010
Season Start Year
Nu
mb
er o
f P
erm
its
Figure 3. The number of operator permit holders that actually fished for lobster each season between the 1986-87 and 2009-10 seasons. Missing data are represented by spaces in the line. The jump between 2005-06 and 2006-07 is thought to reflect new permit holders (permit transfers) that are acting on their investment.
Some commercial fishermen have suggested that they are catching less with
more effort. The data are mixed on this. CPUE, while currently lower than two or
three decades ago, is still within a standard deviation of the average CPUE over

CDFG California Spiny Lobster
Stock Assessment - Executive Summary
13
the last decade. The CPUE is also higher in the last few years than earlier in the
decade.
CPUE (Pounds per Traps Fished)
0.50.6
0.70.8
0.91
1.1
1.21.3
1.4
1.5
1.6
1.7
1.8
1985 1990 1995 2000 2005 2010
Season Start Year
CP
UE
Figure 4. CPUE (pounds landed per trap pulled) for the seasons from 1976-77 through 2009-10. The values used are the totals representing 80% of their respective seasonal totals which were achieved, on average, at 12 weeks into each season. Seasons missing data were excluded. The average CPUE across all seasons is indicated (purple line) as is the range, +/- 1 standard deviation (yellow lines).
Hoop nets have become popular in the recreational fishery since approximately
2005. By 2007, hoop nets accounted for 80 percent of the fished gear based on
a bight-wide recreational creel survey. Over this short period of time, the more
efficient conical net was also introduced and is becoming the net design of
choice among recreational fishermen. Recent lobster report card results suggest
that the recreational take adds an additional 30 to 60 percent to the commercial
catch.

CDFG California Spiny Lobster
Stock Assessment - Executive Summary
14
Figure 5. Proportion of recreational fishermen employing hoop nets or diving for lobster during the 1992-93 season (blue bars) and the 2007-08 season (red bars). These results are based on creel survey interviews taken at Dana Landing Launch Ramp, Shelter Island Launch Ramp, and Channel Islands Harbor Launch Ramp which were the three sites common to both the 1992-93 and 2007-08 seasonal creel surveys.
Overview of Modeling Efforts I. The second assessment task was to develop models
and approaches that could provide reference points for the FMP effort. Initially we
developed depletion model formulations based on commercial landings and logbooks
from 1998 to 2008 which were the only years with daily records available to us. We
were able to investigate runs based on Leslie Depletion Models (which do not directly
provide management reference points), equilibrium forms of Fox and Shaeffer surplus
production models (which are not appropriate for management), and the non-equilibrium
surplus production model, ASPIC (Prager, 1994; Prager, 2004), which is part of the
National Oceanic and Atmospheric Administration’s (NOAA) Fisheries Tool Box.
Surplus production models appeared to be the most appropriate models since they do
not require size or age structure and could provide a reference point for management.
However, ASPIC ultimately failed to provide usable results. Various alternate

CDFG California Spiny Lobster
Stock Assessment - Executive Summary
15
formulations were suggested, but time limitations based on the original 12 month
timeframe for this assessment effort did not allow for exploration of these alternatives.
Preliminary steps had been taken to develop a size structure for our stock based on
collated logbook and landing receipt data. Logbooks supplied the number of lobster
captured in a trap and landing receipts provided the total weight of that trap’s catch.
Towards the end of the initial assessment effort, in December 2010, a copy of a
simulation model (FISMO) suitable for data poor situations was provided to the
Department. Since this model provides a reference point (Fmsy), it was decided to
investigate this model for the lobster stock assessment. FISMO was used recently to
evaluate the sustainability of the Baja California spiny lobster fishery (Chavez and
Gorostieta, 2010)
Leslie Depletion Model runs. Leslie Depletion Models rely on measurements of catch
per unit effort (CPUE) accumulated over individual seasons. The models were written
in-house and relied on Ricker (1975) for the specific algorithms. We used commercial
catch data, in pounds, from landing receipts and effort, the number of traps pulls, from
commercial log books. At the time these models were run, complete seasons of
logbook data had been entered only from the 1998-99 season to present. These
seasons were divided into weekly sums of both catch and effort across the whole bight.
No attempt was made to subdivide the Southern California Bight into geographical
regions.
Stock-Production Model Incorporating Covariates (ASPIC). Given the lack of data
concerning age or size structure for the spiny lobster population off California, the
Department attempted to use surplus production models as the basis for this
assessment. Initial efforts relied on the 10 years of data available to us as we
developed non-equilibrium Fox and Schaefer models in anticipation of the additional
data that was being entered. In discussion with others involved in assessment,
however, it was decided to forgo custom development and use the ASPIC model
(Prager, 1994; Prager, 2004) from the NOAA Fishery Toolbox instead. It was reasoned
that the scientific community would be familiar with this model and its behavior.

CDFG California Spiny Lobster
Stock Assessment - Executive Summary
16
ASPIC runs began around July 2010 when we finally had enough data available in
electronic format for statistical rigor. ASPIC Fox model runs were made using both
commercial data and combined commercial plus estimated recreational data from 1965
to 2009. Approximately 80 cases were considered using catchability and initial
population estimates from multiyear depletion model runs and estimating MSY and K.
Unfortunately, ASPIC failed to converge on a non-trivial solution with this data. The
ASPIC configurations using the Fox model were then re-run using a more generalized
Pella-Tomlinson fit across the widest possible domain (essentially doing a grid search
for a solution) and, again, the model failed to converge or find a non-trivial solution. It
was agreed at this point that the landings/effort data did not work given the assumptions
that ASPIC was operating under, and ASPIC was abandoned.
Fisheries Simulation Model (FISMO). FISMO (Chavez, 2005; Chavez and Gorostieta,
2010), is a size-structured model relying on Beverton-Holt invariants assuming Von
Bertalanffy growth (Beddington & Kirkwood, 2005; Beddington & Cooke, 1983; Jensen,
1996). The basic methods in FISMO are suited to data poor and emerging fisheries and
are included in discussions of the United Nation Food and Agriculture Organization’s
(FAO) Fisheries Management Science Programme (Hoggarth et al. (Chapter 4), 2006).
The model requires at least 15 years of catch data (landing weights, maturity age, age
at first capture (here assumed to be age at legal size), length/weight power relationship,
and the relative independence between spawning stock and recruitment. Von
Bertalanffy growth parameters: K, t0, and longevity are also needed. Although the
ranges of published values for these parameters were fully explored, most FISMO runs
were made with the age of maturity set at 5 years, age at first capture set at 7 years,
and Von Bertalanffy parameters calculated assuming 6mm year-1 growth.
Originally provided as an Excel spreadsheet, the model has been rewritten in Matlab (by
Neilson), and expanded. Differences from the stock FISMO model include observed
catch years expanded beyond 15, and higher resolution of Fmsy estimates. The Matlab
version also provides the user with a streamlined method to test FISMO sensitivity to a
range of parameter values along with interactions between varying parameters.

CDFG California Spiny Lobster
Stock Assessment - Executive Summary
17
Modeling Results. As stated previously, the non-equilibrium, surplus production model
ASPIC, failed to converge or produce a non-trivial result using both fixed domain and
unconstrained grid searches. All surplus production modeling was then abandoned.
Leslie Depletion Model results (catchability and fishable population size) suggested the
harvest-over-time profiles are similar for all seasons since 2000 and independent of the
ultimate harvest size. While recently the combined commercial and recreational
harvest totals have diverged from the commercial-only harvest totals, the similarity
between seasons suggest little has changed over the decade.

CDFG California Spiny Lobster
Stock Assessment - Executive Summary
18
Table 3. Leslie Depletion Model results considering only commercial catch and effort. Calculations are based on the number of weeks required to catch approximately 80% of the season total. Initial fishable biomass (B0) is represented relative to 80% of the total catch and also extrapolated to 100% of the total catch. The data for season 2002-03 did not fit the model assumptions and the model results for that season are excluded from the table. qt is the catchability; the percent of the 80% total catch caught on each trap pull.
Season # Weeks Selected
Percent of total Catch
qt Optimal B0
(80%) (pounds)
Upper B0 (80%)
(pounds)
Lower B0 (80%)
(pounds)
Total B0
(100%)
Total Catch
(pounds)
Total # Traps
Total CPUE
1999-00 15 78.09 1.05 x 10⁻⁶ 785348.4 916952.2 696059.5 1005697 486215.2 791,658 0.62
2000-01 12 78.03 2.63 x 10⁻⁶ 707163.7 750892.2 671649.3 906271.6 705106.3 789,632 1.00
2001-02 12 78.42 1.70 x 10⁻⁶ 895569.1 989800 824921.7 1142016 696179.5 773,891 0.78
2002-03 Data doesn’t fit assumptions 700670.0 850,362 0.82
2003-04 13 79.70 1.17 x 10⁻⁶ 1116979 1250542 1017499 1401479 733373.3 857,266 0.66
2004-05 12 78.13 2.15 x 10⁻⁶ 934814.1 983781.5 893341.5 1196485 856363.1 801,098 0.92
2005-06 12 77.91 1.51 x 10⁻⁶ 1026516 1114192 956721.5 1317566 762568.6 789,694 0.74
2006-07 10 76.96 1.86 x 10⁻⁶ 1070922 1141752 1012312 1391531 888783.1 826,815 0.83
2007-08 12 77.65 1.90 x 10⁻⁶ 771182 877065.8 698747.6 993151.4 663030.9 785,623 0.86
2008-09 11 77.72 1.56 x 10⁻⁶ 929449.4 1056412 840588.8 1195895 737681.2 873,797 0.79
2009-10 12 77.53 1.37 x 10⁻⁶ 1016708 1108999 944348.3 1311374 742057.0 831,059 0.73

CDFG California Spiny Lobster
Stock Assessment - Executive Summary
19
Table 4. Leslie Depletion Model results using combined recreation and commercial catch data. Effort (total # of traps) is based on commercial catch only. Calculations are based on the number of weeks required to catch approximately 80% of the season total. Initial fishable biomass (B0) is represented relative to 80% of the total catch and also extrapolated to 100% of the total catch. The data for season 2002-03 did not fit the model assumptions and the model results for that season are excluded from the table. qt is the catchability; the percent of the 80% total catch caught on each trap pull.
Season # Weeks Selected
Percent of total Catch
qt Optimal B0
(80%) (pounds)
Upper B0 (80%)
(pounds)
Lower B0 (80%)
(pounds)
Total B0 (100%)
(pounds)
Total Catch (Y) (pounds)
Total # Traps
Total CPUE
1999-00 15 78.09 1.10 x 10⁻⁶ 890,843.6 1026200 796574.3 1140791 563296.9 791,658 0.71
2000-01 12 78.03 2.51 x 10⁻⁶ 799,685.1 855250.4 755429.8 1024843 782188.0 789,632 0.99
2001-02 12 78.42 1.64 x 10⁻⁶ 1,013,663.4 1130903 927639 1292608 773261.2 773,891 1.00
2002-03 Data doesn’t fit assumptions 777751.8 850,362 0.90
2003-04 13 79.70 1.21 x 10⁻⁶ 1203887 1,355,501 1092825 1510524 810455.0 857,266 0.95
2004-05 12 78.13 2.10 x 10⁻⁶ 1029940 1,088,332 981040.1 1318239 933444.8 801,098 1.17
2005-06 12 77.91 1.54 x 10⁻⁶ 1113215 1,218,740 1031190 1428847 839650.2 789,694 1.06
2006-07 10 76.96 1.85 x 10⁻⁶ 1176968 1,269,050 1103093 1529325 981281.1 826,815 1.19
2007-08 12 77.65 1.78 x 10⁻⁶ 946485.7 1,094,848 848567 1218913 786361.8 785,623 1.00
2008-09 11 77.72 1.50 x 10⁻⁶ 1182661 1,374,390 1055051 1521695 922677.4 873,797 1.06
2009-10 12 77.53 1.31 x 10⁻⁶ 1481307 1,671,891 1343686 1910624 1050384.0 831,059 1.26

CDFG California Spiny Lobster
Stock Assessment - Executive Summary
20
Of the eight scenarios run by FISMO, six produced Fs in excess of the Fmsy. In
these six, the last two years of each run - the years most associated with
increased recreational hoop netting - were in excess of Fmsy. In the remaining
two scenarios, both 35-year runs, all fishing effort remained below Fmsy. Whether
fishing at or above the Fmsy in the most recent seasons, FISMO-calculated, stock
biomass remained stable or slightly increasing in all but one scenario. In that
scenario, however, any declining trend was minimal. No statistical tests were run
to determine the slope of the trend.
1980 1985 1990 1995 2000 2005 20100
0.05
0.1
0.15
0.2
0.25
0.3
0.35
0.4F using Beverton-Holt Recruitment
F
Year1980 1985 1990 1995 2000 2005 2010
0
200
400
600
800
1000
Estimated Stock Biomass - Beverton-Holt Recruitment
Sto
ck B
iom
ass
(ton
nes)
Year
1980 1985 1990 1995 2000 2005 20100
0.1
0.2
0.3
0.4
0.5
0.6
Exploitation using Beverton-Holt Recruitment
E
Year
A B
C D
1980 1985 1990 4 9 14 19150
200
250
300
350
400
450
500
550
600Estimated catch
Calendar/Simulation Year
Ton
nes
lobs
ter
1980 1985 1990 1995 2000 2005 20100
0.05
0.1
0.15
0.2
0.25
0.3
0.35
0.4F using Beverton-Holt Recruitment
F
Year1980 1985 1990 1995 2000 2005 2010
0
200
400
600
800
1000
Estimated Stock Biomass - Beverton-Holt Recruitment
Sto
ck B
iom
ass
(ton
nes)
Year
1980 1985 1990 1995 2000 2005 20100
0.1
0.2
0.3
0.4
0.5
0.6
Exploitation using Beverton-Holt Recruitment
E
Year
A B
C D
1980 1985 1990 4 9 14 19150
200
250
300
350
400
450
500
550
600Estimated catch
Calendar/Simulation Year
Ton
nes
lobs
ter
Figure 9. FISMO model results using commercial catch + recreational catch (recreational at 61% of commercial) from 1976 to 2010. Beverton-Holt α was set at 0.15, tc to 7, tm to 5. (A) Fitted fishing effort, F, for each observed year (bars) relative to the Fmsy (dashed line). Fmsy = 0.2420. (B) Estimated Stock Biomass (tonnes) for each year. (C) Exploitation rate, E, for each year (diamond line) plotted againt Emsy (dashed line). Emsy = 0.5874. (D) Estimation of observed catch (thick line) with 31 year simulation (thin line) extending from 2010 results and using the estimated fishing pressure for 2010 (0.2829).

CDFG California Spiny Lobster
Stock Assessment - Executive Summary
21
1980 1985 1990 1995 2000 2005 20100
0.05
0.1
0.15
0.2
0.25
0.3
0.35
0.4F using Beverton-Holt Recruitment
F
Year1980 1985 1990 1995 2000 2005 2010
0
200
400
600
800
1000
1200
Estimated Stock Biomass - Beverton-Holt Recruitment
Sto
ck B
iom
ass
(ton
nes)
Year
1980 1985 1990 1995 2000 2005 20100
0.1
0.2
0.3
0.4
0.5
Exploitation using Beverton-Holt Recruitment
E
Year
A B
C D
1980 1985 1990 4 9 14 19150
200
250
300
350
400
450
500
550
600Estimated catch
Calendar/Simulation Year
Ton
nes
lobs
ter
1980 1985 1990 1995 2000 2005 20100
0.05
0.1
0.15
0.2
0.25
0.3
0.35
0.4F using Beverton-Holt Recruitment
F
Year1980 1985 1990 1995 2000 2005 2010
0
200
400
600
800
1000
1200
Estimated Stock Biomass - Beverton-Holt Recruitment
Sto
ck B
iom
ass
(ton
nes)
Year
1980 1985 1990 1995 2000 2005 20100
0.1
0.2
0.3
0.4
0.5
Exploitation using Beverton-Holt Recruitment
E
Year
A B
C D
1980 1985 1990 4 9 14 19150
200
250
300
350
400
450
500
550
600Estimated catch
Calendar/Simulation Year
Ton
nes
lobs
ter
Figure 10. FISMO model results using commercial catch + recreational catch (recreational at 61% of commercial) from 1976 to 2010. Beverton-Holt α was set at 0.50, tc to 7, tm to 5. (A) Fitted fishing effort, F, for each observed year (bars) relative to the Fmsy (dashed line). Fmsy = 0.2000. (B) Estimated Stock Biomass (tonnes) for each year. (C) Exploitation rate, E, for each year (diamond line) plotted againt Emsy (dashed line). Emsy = 0.5406. (D) Estimation of observed catch (thick line) with 31 year simulation (thin line) extending from 2010 results and using the estimated fishing pressure for 2010 (0.1823).