stle2017 operating conditions that shorten gas engine oil
TRANSCRIPT
Operating Conditions that shorten Gas Engine Oil Life
NNAMDI J . ACHEBE – C L S , OMA I , MLT I I , MLA I I I
Going by Petrosave Laboratory oil analysis database information accumulated over the years,from analyzing oil samples from well over 500 Gas Engines comprising different brands,operating at remarkably different locations and subjected to varying loads, loading proceduresand all sorts of operational/maintenance practices; Gas Engine Oil life could span from under500 to > 8,000 Hours depending on Oil quality, Oil Sump Capacity, Operating Loads and evenconsistence in keeping to OEM specified Oil Make‐ups.
Benefits Statement
Situation
As one strategy to minimize running cost, it is the drive of every operator to safely extract themost hours during the life of the in‐service oil. One Gas Engine OEM, in its servicecommunications to users, recommended 2,000 Hours Oil Drain, however, strongly recommendedthe use of Oil Analysis to more appropriately determine oil change.
This presentation show cases different scenarios for which oil analysis reports produced widelydifferent ODIs even for same Make/Model Gas Engines but operating in different Plants.
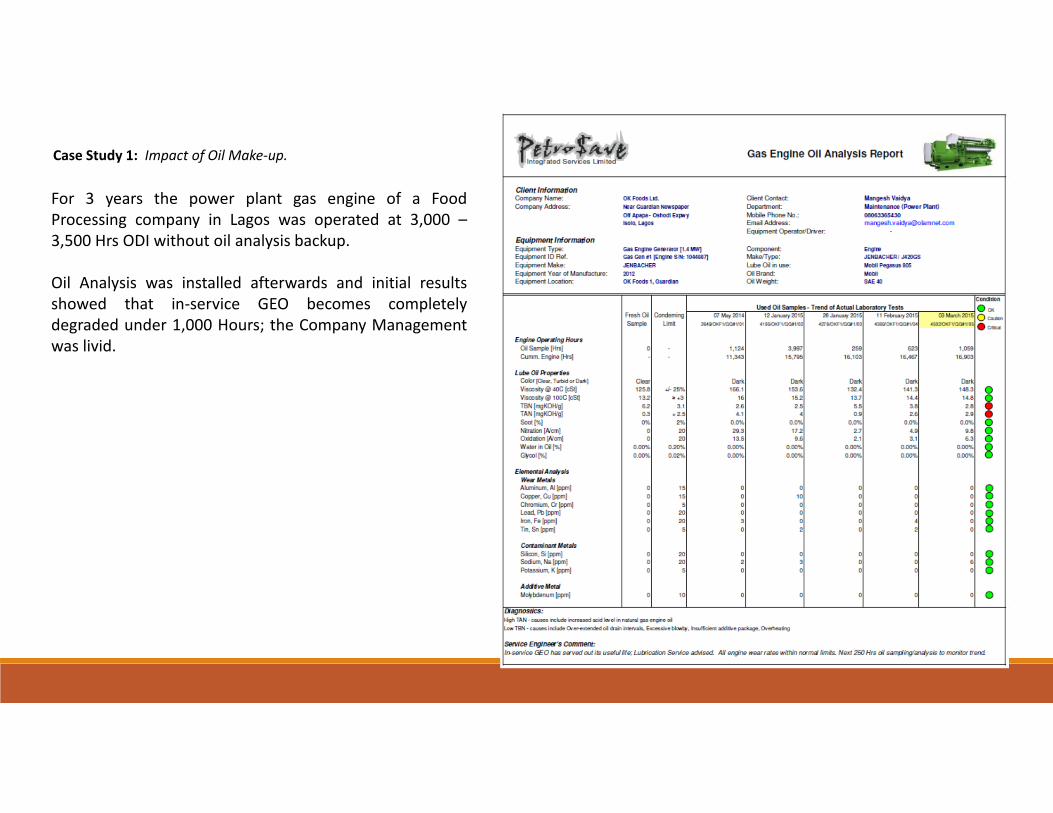
Case Study 1: Impact of Oil Make‐up.
For 3 years the power plant gas engine of a FoodProcessing company in Lagos was operated at 3,000 –3,500 Hrs ODI without oil analysis backup.
Oil Analysis was installed afterwards and initial resultsshowed that in‐service GEO becomes completelydegraded under 1,000 Hours; the Company Managementwas livid.
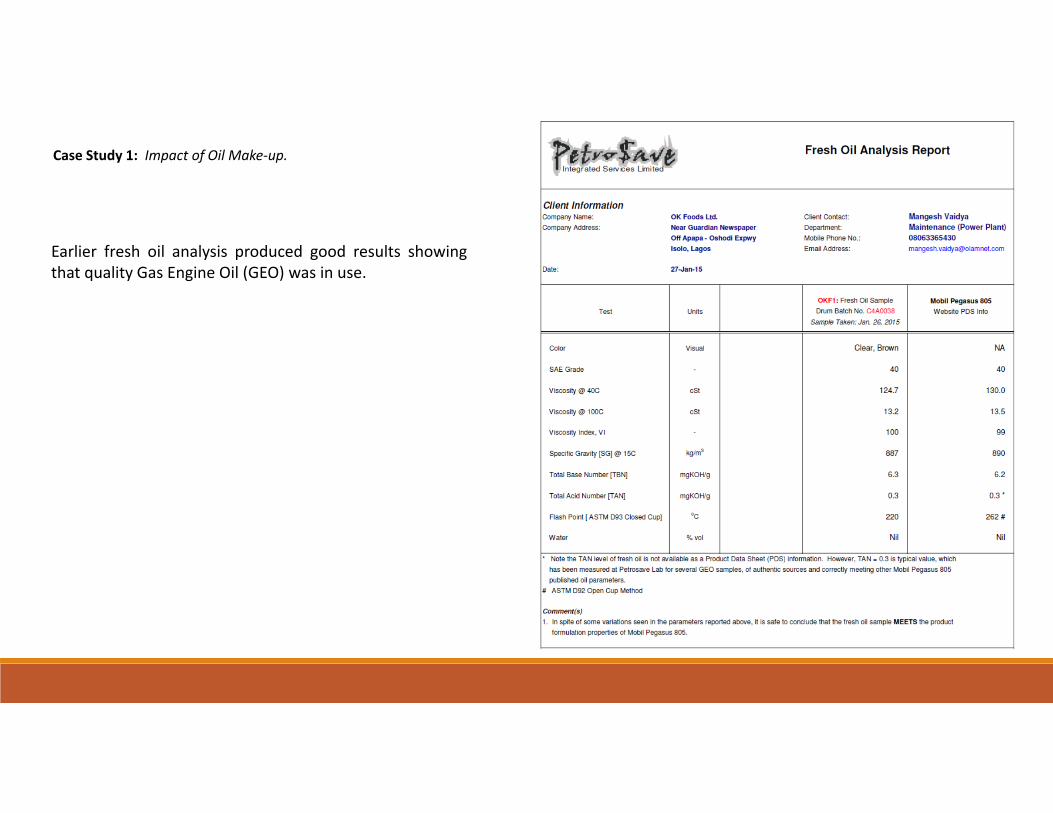
Case Study 1: Impact of Oil Make‐up.
Earlier fresh oil analysis produced good results showingthat quality Gas Engine Oil (GEO) was in use.
Case Study 1: Impact of Oil Make‐up.
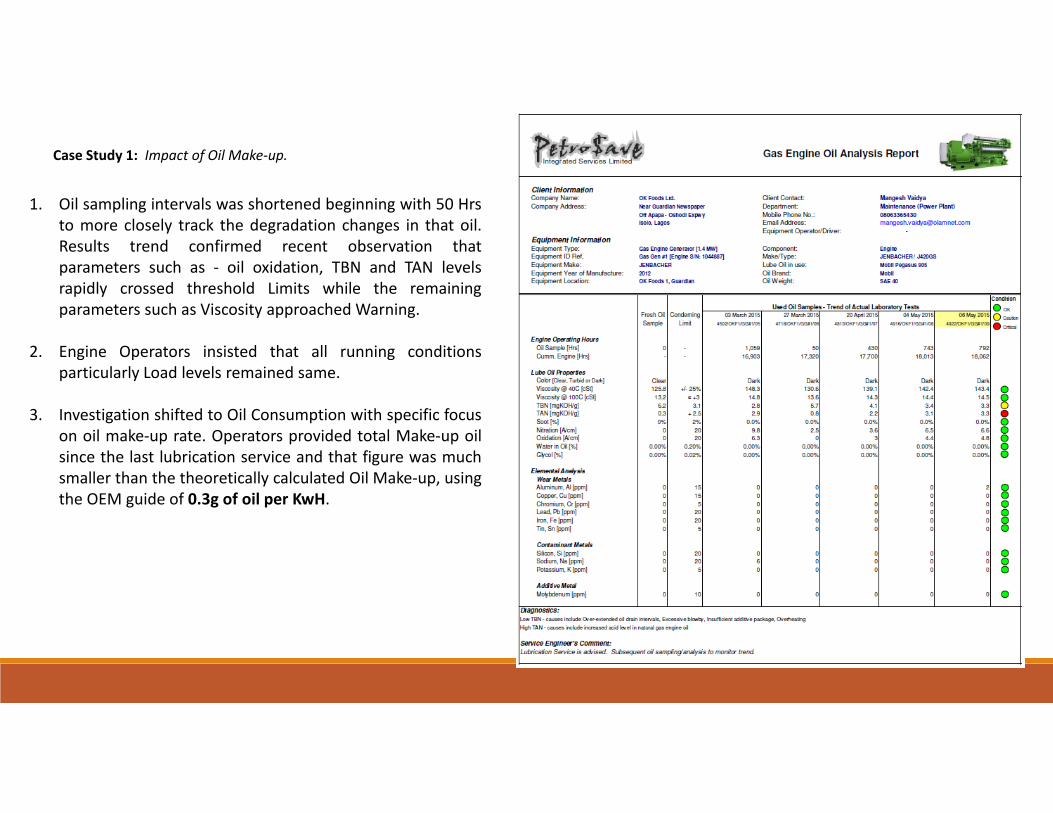
1. Oil sampling intervals was shortened beginning with 50 Hrsto more closely track the degradation changes in that oil.Results trend confirmed recent observation thatparameters such as ‐ oil oxidation, TBN and TAN levelsrapidly crossed threshold Limits while the remainingparameters such as Viscosity approached Warning.
2. Engine Operators insisted that all running conditionsparticularly Load levels remained same.
3. Investigation shifted to Oil Consumption with specific focuson oil make‐up rate. Operators provided total Make‐up oilsince the last lubrication service and that figure was muchsmaller than the theoretically calculated Oil Make‐up, usingthe OEM guide of 0.3g of oil per KwH.
Case Study 1: Impact of Oil Make‐up.
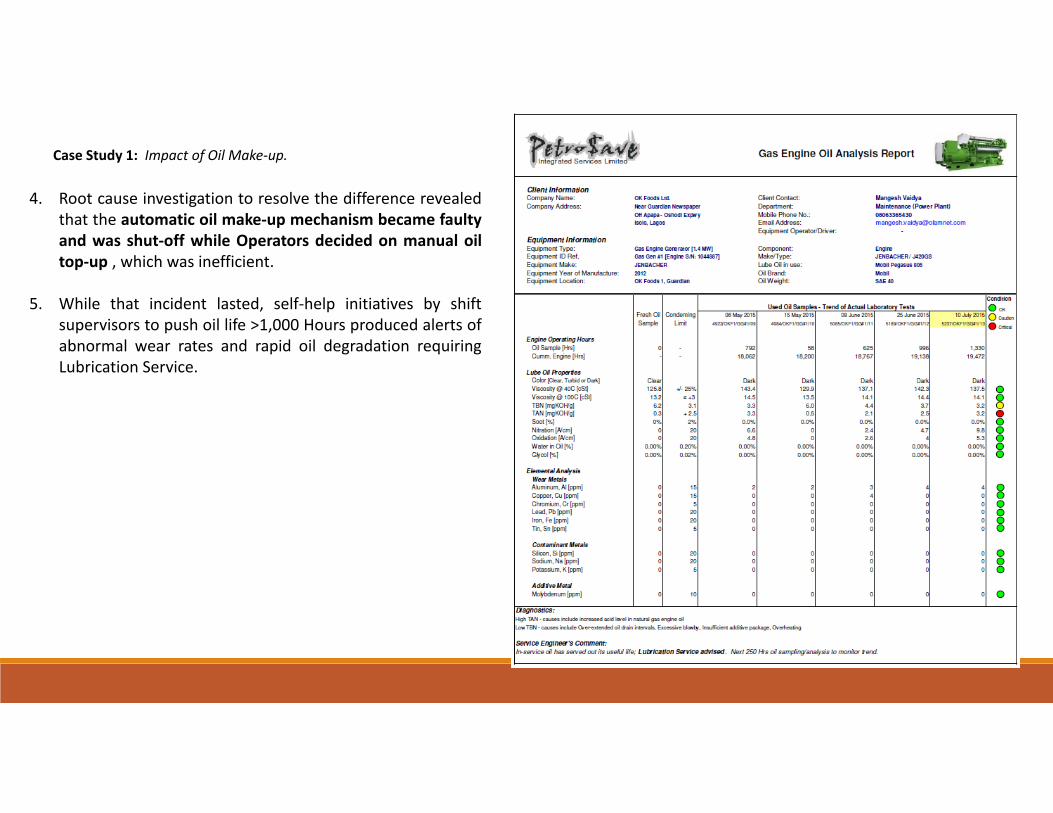
4. Root cause investigation to resolve the difference revealedthat the automatic oil make‐up mechanism became faultyand was shut‐off while Operators decided on manual oiltop‐up , which was inefficient.
5. While that incident lasted, self‐help initiatives by shiftsupervisors to push oil life >1,000 Hours produced alerts ofabnormal wear rates and rapid oil degradation requiringLubrication Service.
Case Study 1: Impact of Oil Make‐up.
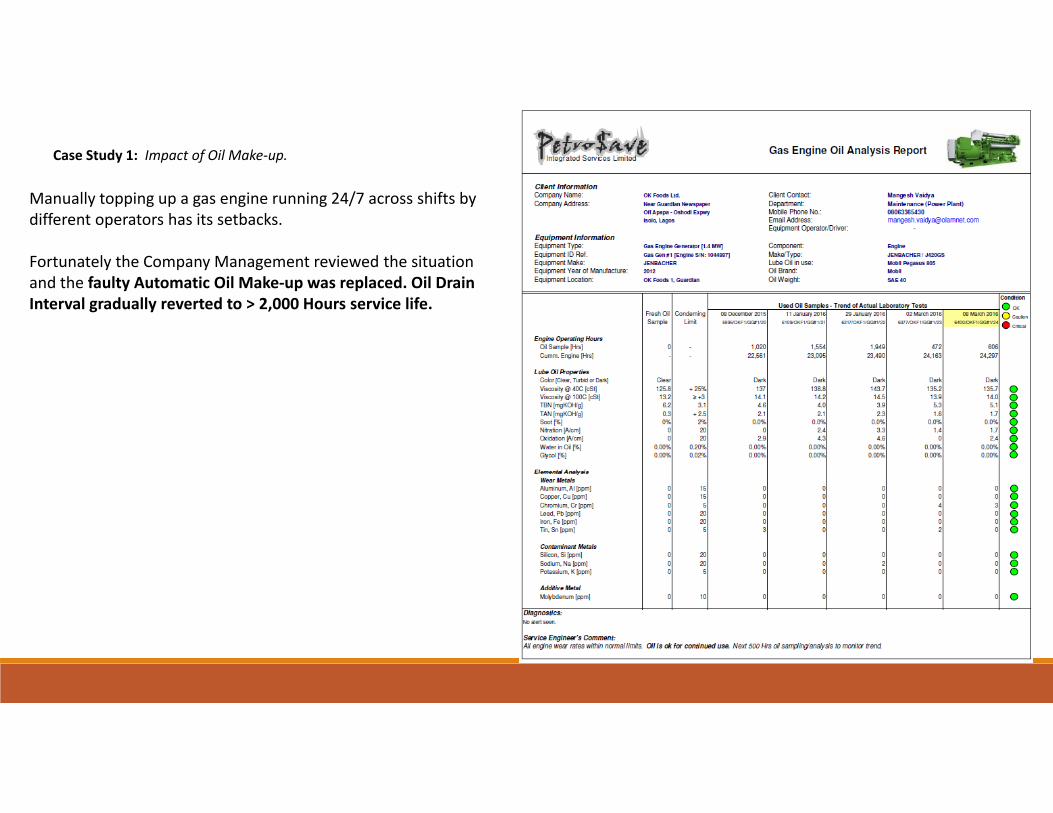
Manually topping up a gas engine running 24/7 across shifts bydifferent operators has its setbacks.
Fortunately the Company Management reviewed the situationand the faulty Automatic Oil Make‐up was replaced. Oil DrainInterval gradually reverted to > 2,000 Hours service life.

Case Study 2: Lubrication Service – Impact of Partial Drain
First 500 Hrs oil sample taken after Lubrication Service revealedthat remaining oil life was less than 40%. Initial thoughts werethat operators were only carry out “oil sweetening”, a commonpractice of combining partial drain‐out and oil make‐up inorder to manage limited oil stock; to keep engine safe andrunning pending when adequate oil replenishment stock isreceived to enable full lubrication service.
When the operators informed otherwise, root causeinvestigations driven by oil analysis commenced, andfortunately was quick to connect oil analysis observation to theamount of oil used during Lubrication Service.
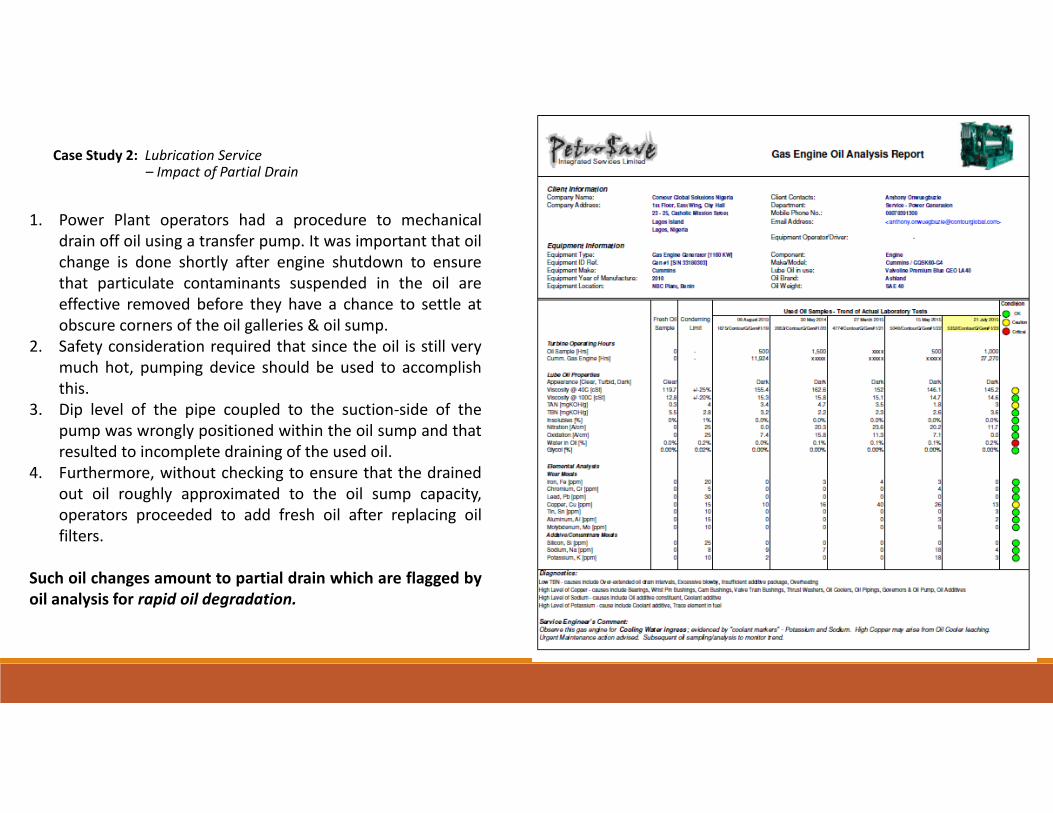
Case Study 2: Lubrication Service – Impact of Partial Drain
1. Power Plant operators had a procedure to mechanicaldrain off oil using a transfer pump. It was important that oilchange is done shortly after engine shutdown to ensurethat particulate contaminants suspended in the oil areeffective removed before they have a chance to settle atobscure corners of the oil galleries & oil sump.
2. Safety consideration required that since the oil is still verymuch hot, pumping device should be used to accomplishthis.
3. Dip level of the pipe coupled to the suction‐side of thepump was wrongly positioned within the oil sump and thatresulted to incomplete draining of the used oil.
4. Furthermore, without checking to ensure that the drainedout oil roughly approximated to the oil sump capacity,operators proceeded to add fresh oil after replacing oilfilters.
Such oil changes amount to partial drain which are flagged byoil analysis for rapid oil degradation.
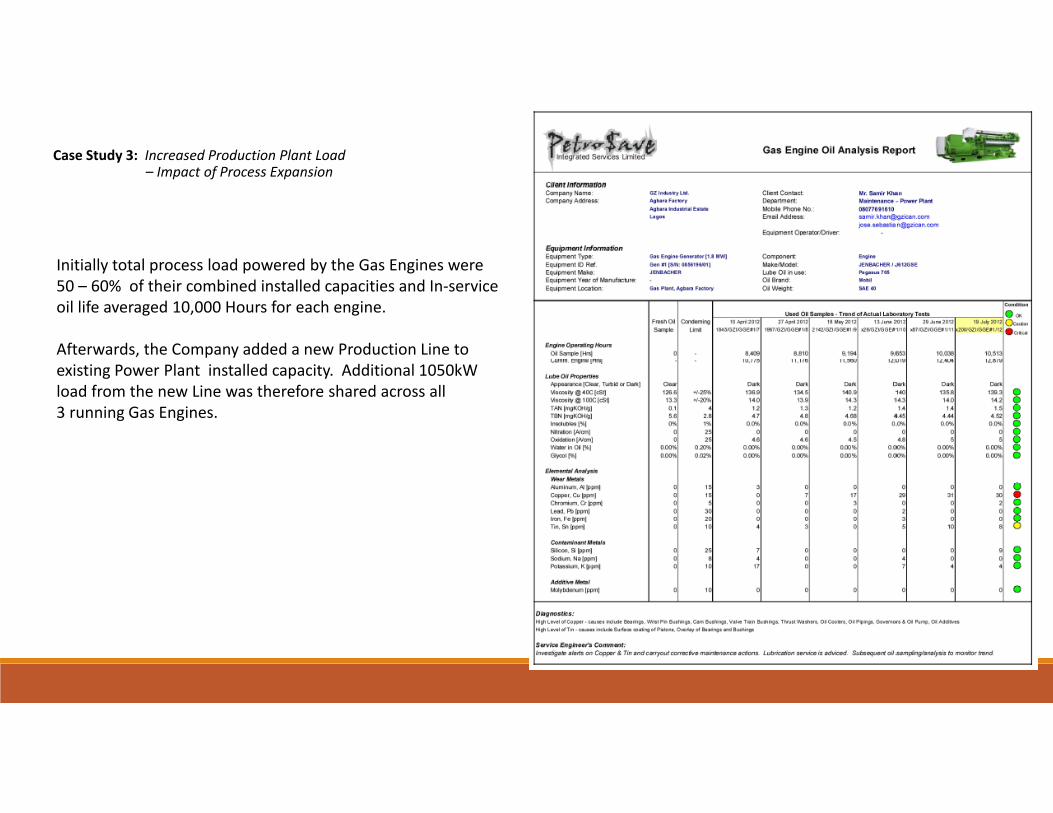
Case Study 3: Increased Production Plant Load– Impact of Process Expansion
Initially total process load powered by the Gas Engines were50 – 60% of their combined installed capacities and In‐serviceoil life averaged 10,000 Hours for each engine.
Afterwards, the Company added a new Production Line toexisting Power Plant installed capacity. Additional 1050kWload from the new Line was therefore shared across all3 running Gas Engines.
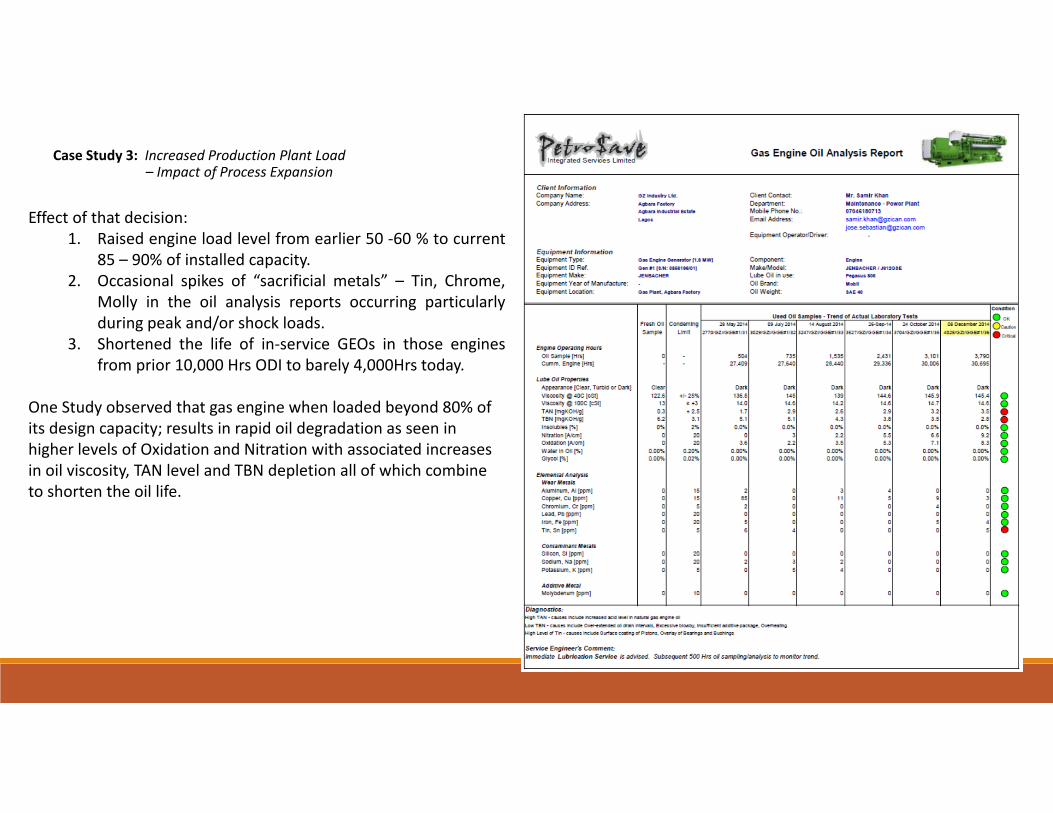
Case Study 3: Increased Production Plant Load– Impact of Process Expansion
Effect of that decision:1. Raised engine load level from earlier 50 ‐60 % to current
85 – 90% of installed capacity.2. Occasional spikes of “sacrificial metals” – Tin, Chrome,
Molly in the oil analysis reports occurring particularlyduring peak and/or shock loads.
3. Shortened the life of in‐service GEOs in those enginesfrom prior 10,000 Hrs ODI to barely 4,000Hrs today.
One Study observed that gas engine when loaded beyond 80% ofits design capacity; results in rapid oil degradation as seen inhigher levels of Oxidation and Nitration with associated increasesin oil viscosity, TAN level and TBN depletion all of which combineto shorten the oil life.
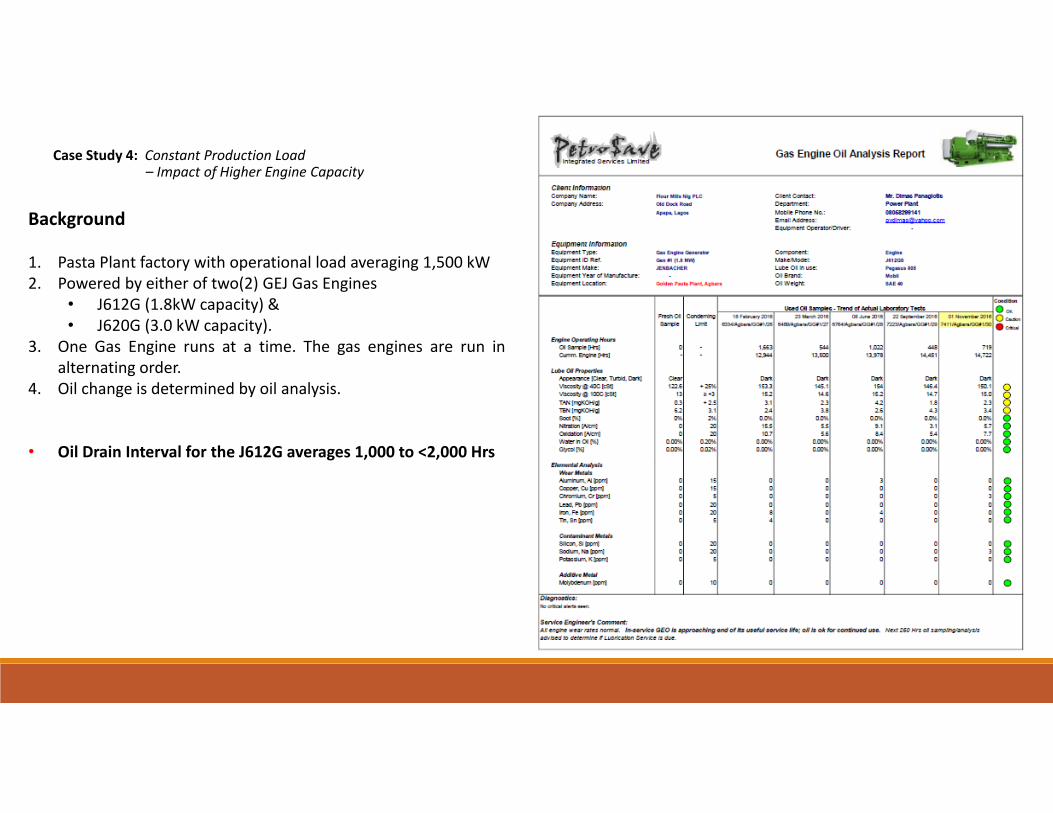
Case Study 4: Constant Production Load – Impact of Higher Engine Capacity
Background
1. Pasta Plant factory with operational load averaging 1,500 kW2. Powered by either of two(2) GEJ Gas Engines
• J612G (1.8kW capacity) &• J620G (3.0 kW capacity).
3. One Gas Engine runs at a time. The gas engines are run inalternating order.
4. Oil change is determined by oil analysis.
• Oil Drain Interval for the J612G averages 1,000 to <2,000 Hrs

Case Study 4: Constant Production Load – Impact of Higher Engine Capacity
• Oil Drain Interval for the J620G averages >7,000 Hrs
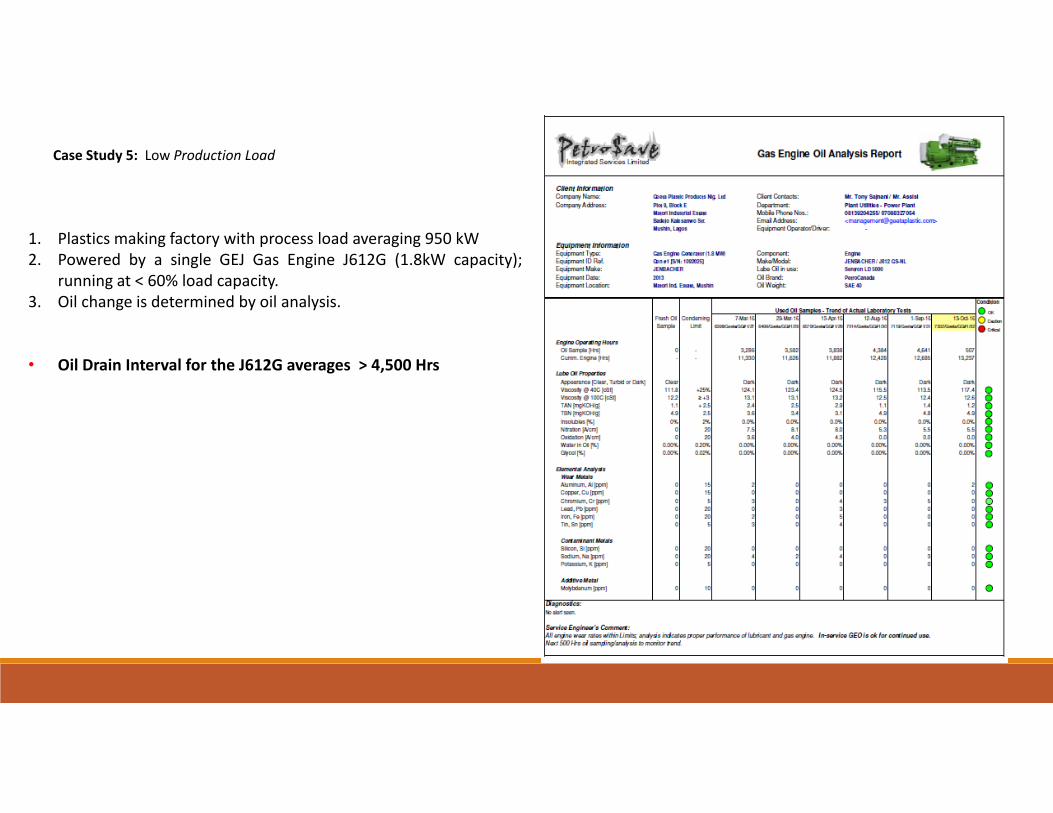
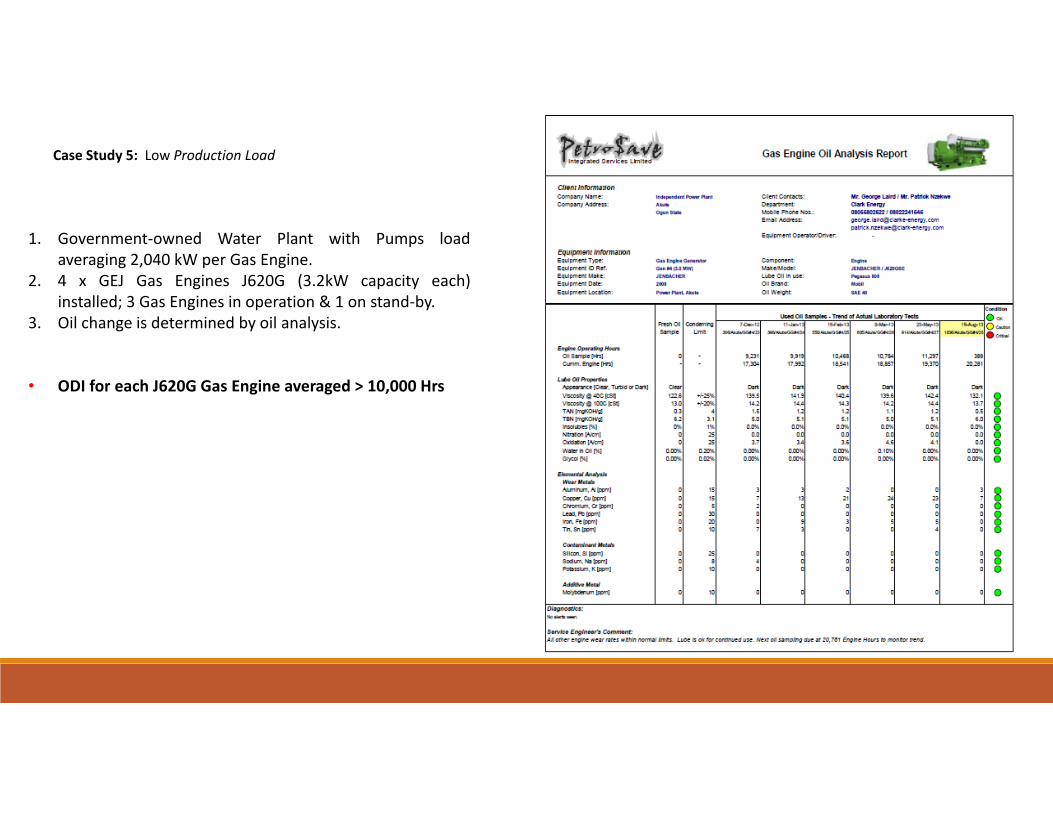
Case Study 5: Low Production Load
1. Plastics making factory with process load averaging 950 kW2. Powered by a single GEJ Gas Engine J612G (1.8kW capacity);
running at < 60% load capacity.3. Oil change is determined by oil analysis.
• Oil Drain Interval for the J612G averages > 4,500 Hrs
Case Study 5: Low Production Load
1. Government‐owned Water Plant with Pumps loadaveraging 2,040 kW per Gas Engine.
2. 4 x GEJ Gas Engines J620G (3.2kW capacity each)installed; 3 Gas Engines in operation & 1 on stand‐by.
3. Oil change is determined by oil analysis.
• ODI for each J620G Gas Engine averaged > 10,000 Hrs
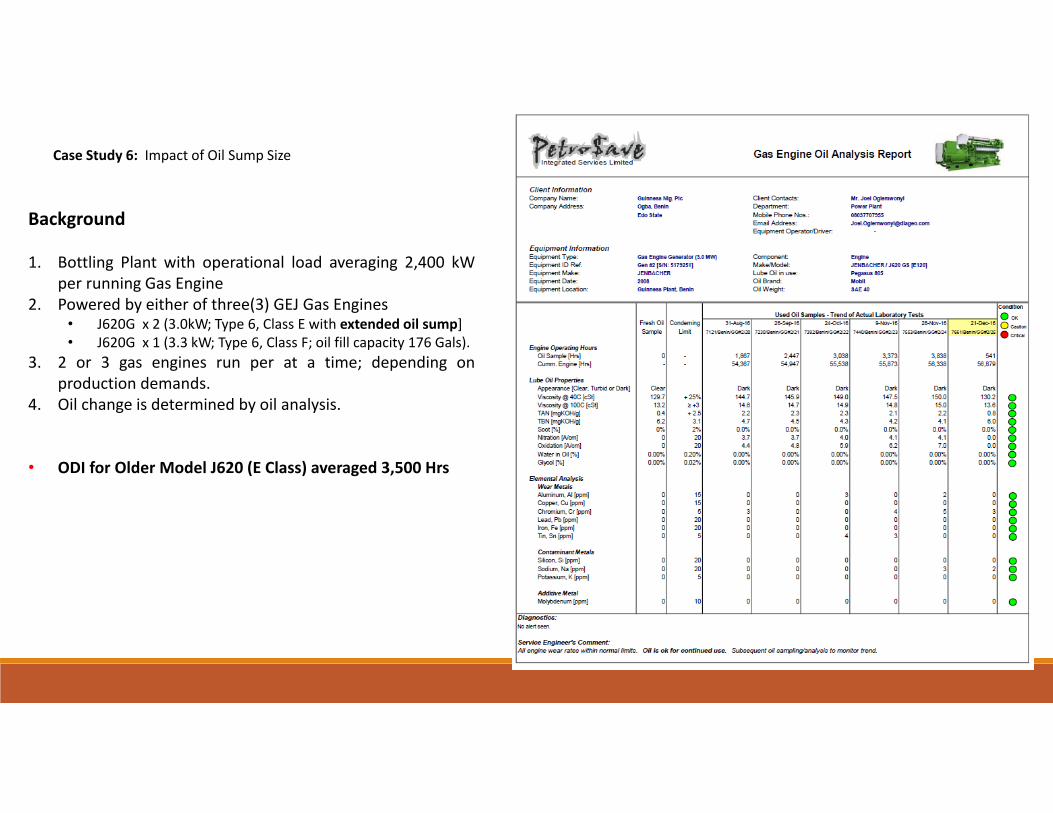
Case Study 6: Impact of Oil Sump Size
Background
1. Bottling Plant with operational load averaging 2,400 kWper running Gas Engine
2. Powered by either of three(3) GEJ Gas Engines• J620G x 2 (3.0kW; Type 6, Class E with extended oil sump]• J620G x 1 (3.3 kW; Type 6, Class F; oil fill capacity 176 Gals).
3. 2 or 3 gas engines run per at a time; depending onproduction demands.
4. Oil change is determined by oil analysis.
• ODI for Older Model J620 (E Class) averaged 3,500 Hrs
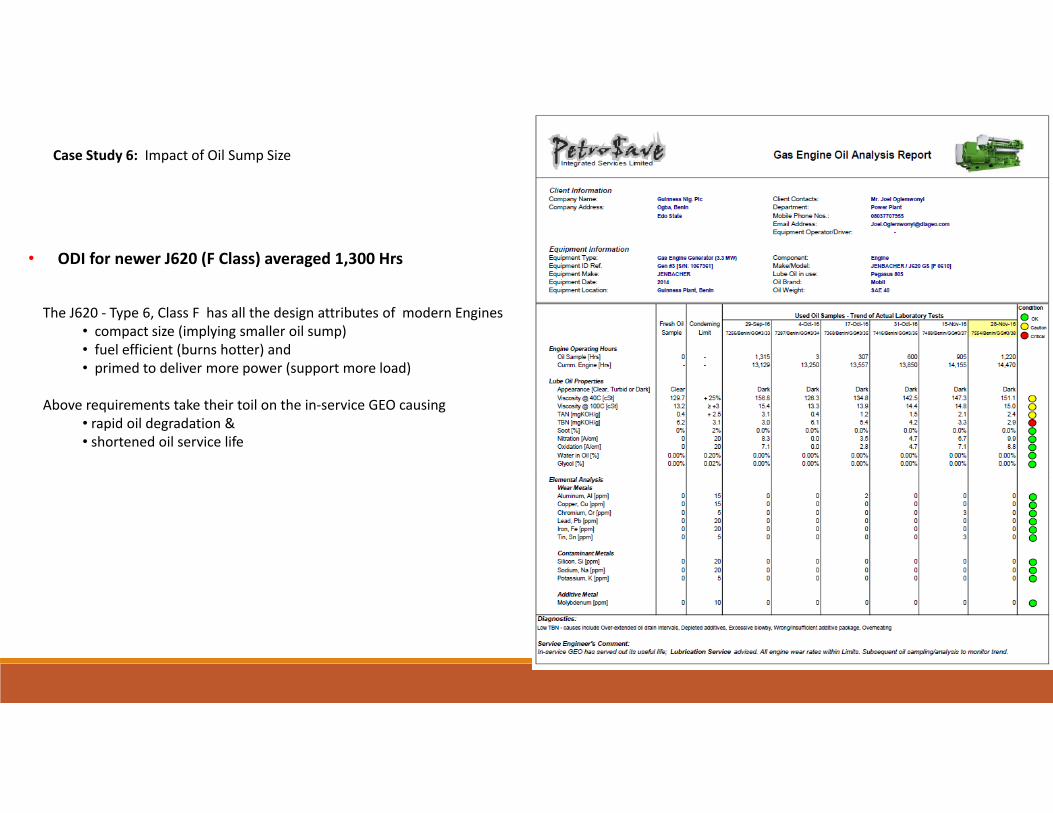
Case Study 6: Impact of Oil Sump Size
• ODI for newer J620 (F Class) averaged 1,300 Hrs
The J620 ‐ Type 6, Class F has all the design attributes of modern Engines• compact size (implying smaller oil sump)• fuel efficient (burns hotter) and • primed to deliver more power (support more load)
Above requirements take their toil on the in‐service GEO causing • rapid oil degradation &• shortened oil service life
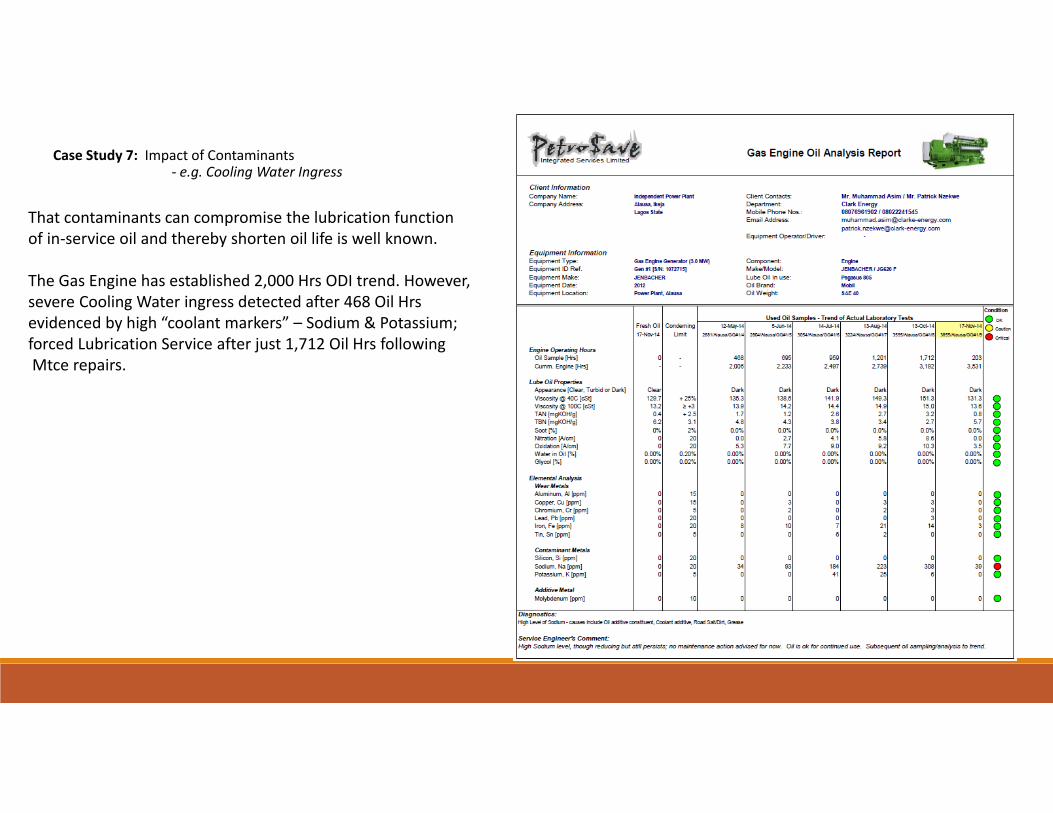
Case Study 7: Impact of Contaminants‐ e.g. Cooling Water Ingress
That contaminants can compromise the lubrication functionof in‐service oil and thereby shorten oil life is well known.
The Gas Engine has established 2,000 Hrs ODI trend. However,severe Cooling Water ingress detected after 468 Oil Hrsevidenced by high “coolant markers” – Sodium & Potassium;forced Lubrication Service after just 1,712 Oil Hrs followingMtce repairs.
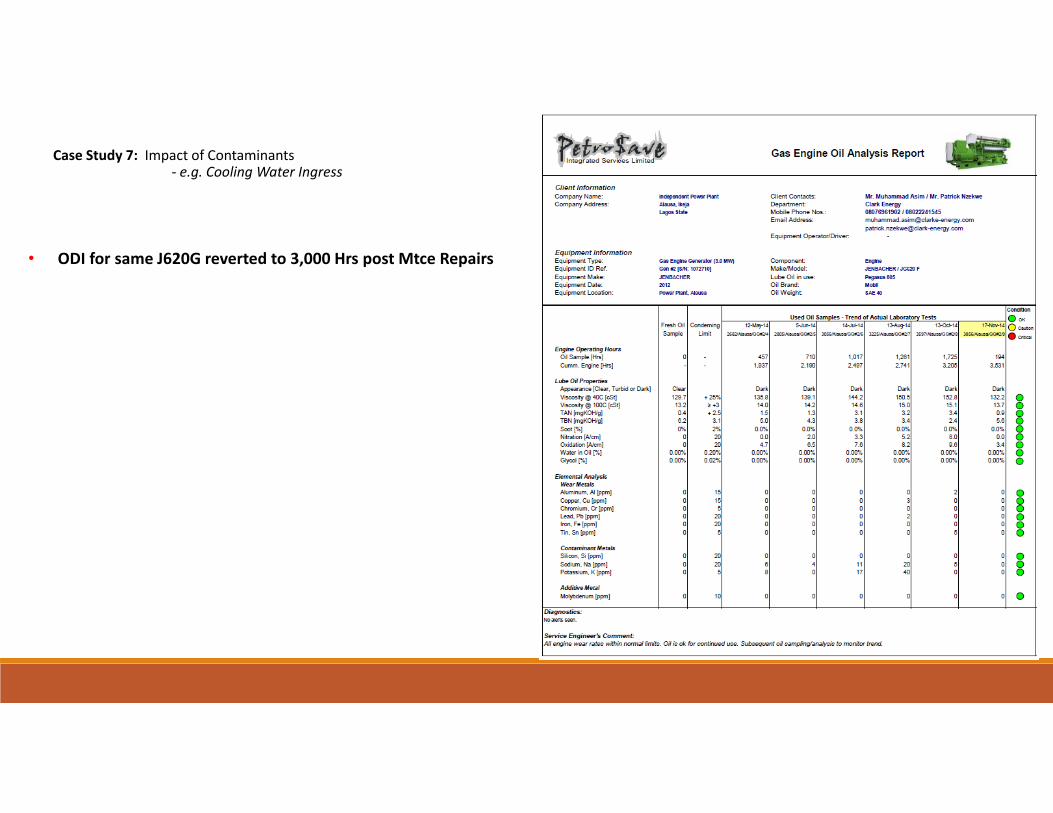
Case Study 7: Impact of Contaminants‐ e.g. Cooling Water Ingress
• ODI for same J620G reverted to 3,000 Hrs post Mtce Repairs

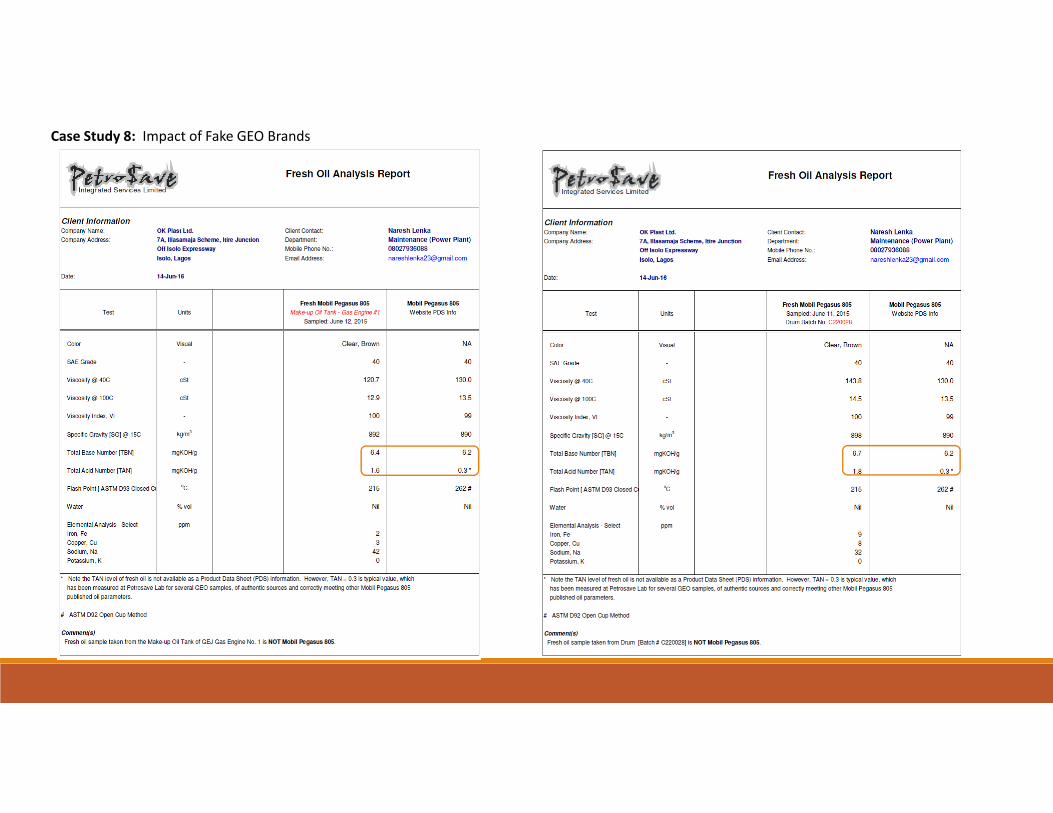
Case Study 8: Impact of Fake GEO Brands
Background
1. Some Gas Engine operators, erroneously believe inbuying from unauthorized Oil Vendors at cheaper prices
2. Often oil drum offered at cheaper price is mere perfectcopy of a successful Brand’s drum design “external” butfails remarkably to match its content quality “internal”.
3. Such purchases most time put the gas engine to risk,because the quality content of the oil is compromised
4. If oil analysis is in place, such poor oil quality may bequickly detected from measuring rapid degradation ofkey lubricant parameters
• Oil Analysis detected the in‐service GEO was bothover‐Based and over‐Acidified, shortening its servicelife. Fresh oil analysis confirmed, the GEO was fake.
Case Study 8: Impact of Fake GEO Brands
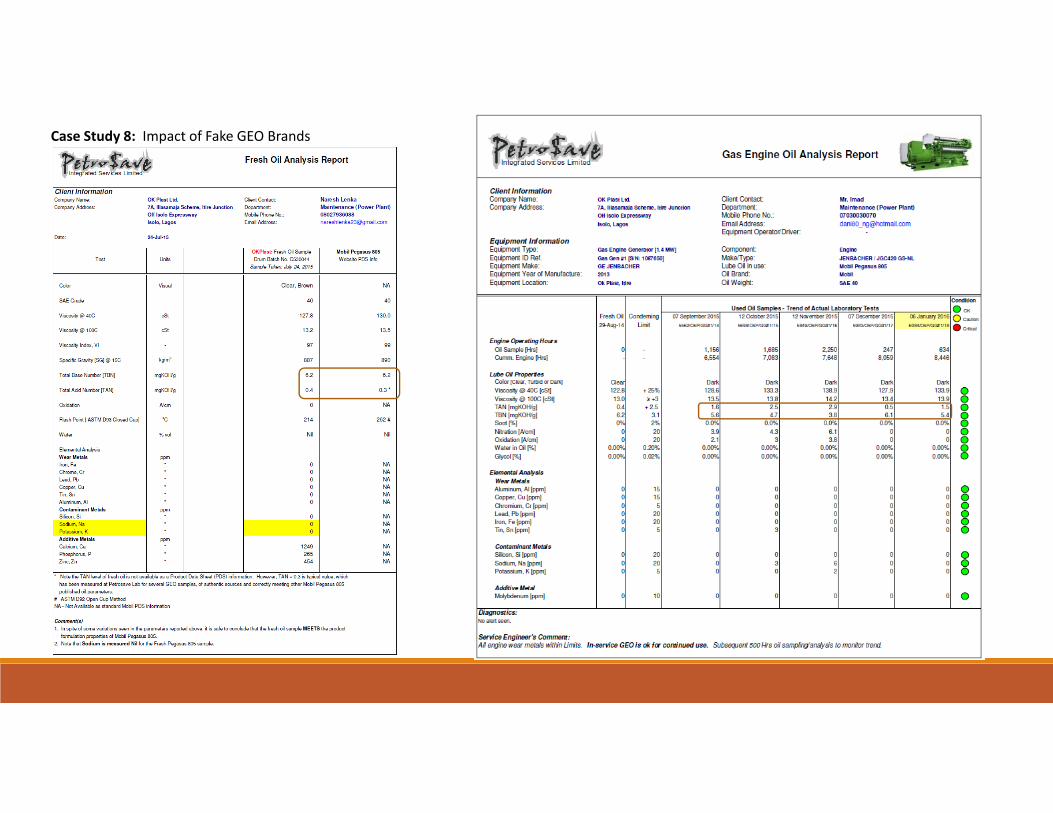
Case Study 8: Impact of Fake GEO Brands

Other Impacting Factors
Oil Make‐up with DEO
It is common practice in almost all the Power Plants to run Gas Engines as the prime source of power while retaining the DieselEngines as backup in case of gas supply outage. In a few cases, operators’ initiatives to replace properly blended GEO with multi‐grade DEO had also resulted in shortened oil life.
In some case studies already covered, thinning down of oil viscosity, partly from comparatively lower viscosity & shearing of VIimprover additives of multigrade DEO blends, rapid increase in Nitration and associated TAN increase, higher TBN with resultantincrease in ash deposits are some of the observations, compelling oil analysis to flag for early oil change.
Gas Fuel Quality
Petrosave Laboratory hopes to commence running GC analysis on gas samples to investigate Industry‐wide reduction of Oil lifeacross different Power Plants. Early indications point in direction of quality of Natural Gas supplied to the Nigeria Energy Industrywhich may not be farfetched, as Gas Vendors struggle to meet market demands against the backdrop of severe gas outagesresulting from rampant cases of pipeline vandalization.
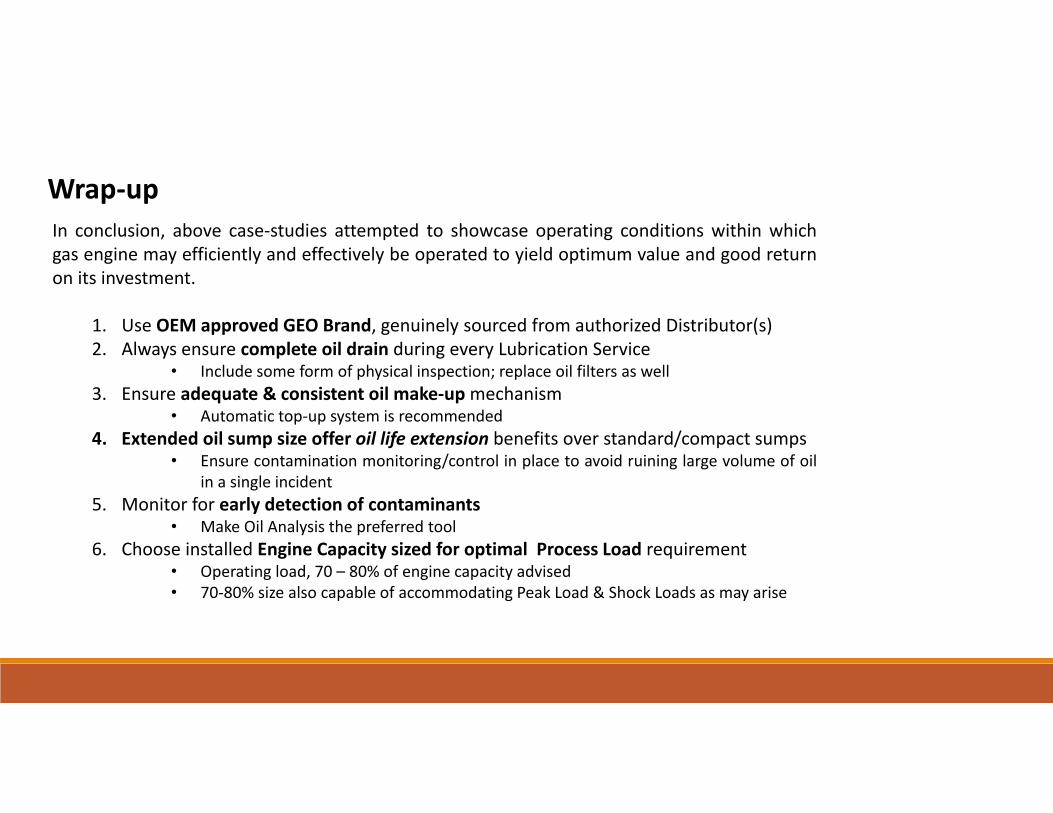
In conclusion, above case‐studies attempted to showcase operating conditions within whichgas engine may efficiently and effectively be operated to yield optimum value and good returnon its investment.
1. Use OEM approved GEO Brand, genuinely sourced from authorized Distributor(s)2. Always ensure complete oil drain during every Lubrication Service
• Include some form of physical inspection; replace oil filters as well3. Ensure adequate & consistent oil make‐upmechanism
• Automatic top‐up system is recommended4. Extended oil sump size offer oil life extension benefits over standard/compact sumps
• Ensure contamination monitoring/control in place to avoid ruining large volume of oilin a single incident
5. Monitor for early detection of contaminants• Make Oil Analysis the preferred tool
6. Choose installed Engine Capacity sized for optimal Process Load requirement• Operating load, 70 – 80% of engine capacity advised• 70‐80% size also capable of accommodating Peak Load & Shock Loads as may arise
Wrap‐up

Thank You