step forward - strivetogether · pdf filestep forward report to the community october 2015...
TRANSCRIPT
Step Forward
Report to the Community
October 2015
Metro Shreveport-Bossier City
Strive Network
www.stepforwardnla.org

www.stepforwardnla.org Page 1
Dear residents of Caddo, Bossier, DeSoto, and Webster parishes,
We recognize the well-being of our children is the most powerful indicator of
the economic and social health of our community. Their ability to achieve as
students and develop as citizens literally will determine either our
community’s growth or its decline.
Trends in North Louisiana indicate there is cause for our concern. Many
children do not start school with the basic knowledge they need and continue
to lag behind their peers in subsequent grades. This has resulted in an
alarming number of children who drop out prior to graduation and are then
unprepared to earn a living.
We all hope for each child’s success for their own benefit; yet we often fail to
realize this goal impacts not only the child, but every person in our
community. In just a few short years, the collective outcomes of our children
will result in positive or negative economic and social impacts which will
affect us all. Local businesses will either grow or eventually cease to exist,
based on the educational status of the local workforce. Similarly, poverty
levels will either rise or fall in correlation with business growth. Cities and
municipalities will either flourish or wither, relying on the tax base created by
the width and depth of employed wage earners. So much is dependent upon
the success of our children. Put simply, we all will eventually benefit or suffer
as a result; therefore ensuring that each child can succeed to his or her
potential is of vital interest to us all.
Step Forward is an example of a “collective impact” initiative which requires
commitment from community leaders and citizens with different
perspectives, working to develop consensus solutions to address specific
problems – in our case academic failure for too many children. Step Forward
is working to develop data-driven solutions. That is, by measuring some key
educational and workforce indicators as outlined in this report, we are
committed to identifying areas of need as well as areas of success.

www.stepforwardnla.org Page 2
Your interest and involvement in Step Forward is so important. To learn
more, please contact me at 318.221.0582 or via email at [email protected].
Step Forward respects the wisdom of our community and believes the
knowledge of developing solutions is within our people. We believe that our
community’s ability to provide support or “social capital” is boundless and is
absolutely necessary as we work to ensure success for our children today, and
a stronger community tomorrow. Our children have a request for us. They
are asking us all to step forward.
Sincerely,
Laura Lane Alderman
Executive Director
Step Forward

www.stepforwardnla.org Page 3
Authored by:
Wesley M. Hinze, Ph.D.
Sociologist and Instructor
Bossier Parish Community College
www.stepforwardnla.org Page 4
Table of Contents
Summary Dashboard ................................................................................................ 8
Vision & Mission ......................................................................................................... 9
Leadership Council .................................................................................................. 10
Operation Team Leaders ...................................................................................... 12
Introduction ................................................................................................................ 13
Step Forward Team ................................................................................................. 14
Goals & Objectives ................................................................................................... 14
Current Projects ........................................................................................................ 15
Guide to the Charts .................................................................................................. 17
About the Community ............................................................................................ 18
Data-Driven Program ............................................................................................. 27
Indicators ..................................................................................................................... 28
Early Childhood Education .................................................................................. 29
Early Literacy ............................................................................................................. 35
Youth Civic Development – My Brother’s Keeper ..................................... 40
Workforce Development ...................................................................................... 49
Next Steps .................................................................................................................... 60
Notes .............................................................................................................................. 61
www.stepforwardnla.org Page 5
List of Figures
Gross domestic product and poverty rates in metro Shreveport-Bossier City,
2009-2014 .................................................................................................................................... 19
Percent and count of group that is less than 50 percent of the poverty level in
metro Shreveport-Bossier City, all ages ........................................................................... 20
Unemployment rates in metro Shreveport-Bossier City, age 16 and over ....... 22
Some college or above in metro Shreveport-Bossier City, age 25 and over ..... 23
Some college or above in metro Shreveport-Bossier City, age 25 and over,
2013 ................................................................................................................................................. 24
Percent and count of group in management, business, science, and arts
occupations in Shreveport-Bossier City, age 16 and over ........................................ 25
Percent and count of group in management, business, science, and arts
occupations in Shreveport-Bossier City, age 16 and over, 2013 ........................... 26
Indicator 1. Incoming kindergarteners arriving ready for kindergarten in the
fall in metro Shreveport-Bossier City, with goals for 2015 and 2016................. 29
Indicator 2. Ages 3 and 4 enrolled in school in metro Shreveport-Bossier City,
ACS 1-year and 5-year estimates, with goals for 2015 and 2016 ......................... 30
Indicator 3. Low birth weight (under 2,500 grams (5lbs., 8 oz.)) in metro
Shreveport-Bossier City, with goals for 2014-2016 ................................................... 31
Indicator 4. All children 19-35 months vaccinated with DTaP and MMR in
metro Shreveport-Bossier City, with goals for 2015 and 2016 ............................. 32
Indicator 5. Obesity (BMI >= 95%) in WIC children ages 2-5 in metro
Shreveport-Bossier City, with goals for 2015 and 2016 ........................................... 32
Indicator 6. Children under 6 in poverty in metro Shreveport-Bossier City, ACS
1-year and 5-year estimates, with goals for 2015 and 2016................................... 33
Children under 6 in poverty in metro Shreveport-Bossier City by race, ACS 5-
year (2009-2013) and 1-year (2014) estimates .......................................................... 34
www.stepforwardnla.org Page 6
Incoming third-graders arriving ready for third grade reading in the fall in
metro Shreveport-Bossier City, with goals for 2015 and 2016 ............................. 36
Indicator 7. Third-grade English language arts proficiency (basic and above)
in metro Shreveport-Bossier City, with goal for 2016 ............................................... 37
Indicator 8. Fourth grade on-time and on-level in metro Shreveport-Bossier
City, with goals for 2014-2016 ............................................................................................. 38
Indicator 9. Age 6-11 in poverty in metro Shreveport-Bossier City, ACS 1-year
and 5-year estimates, with goals for 2015 and 2016 ................................................. 39
Age 6-11 in poverty in metro Shreveport-Bossier City by race, ACS 5-year
(2009-2013) and 1-year (2014) estimates ..................................................................... 39
Indicator 10. School discipline rates for all grades in metro Shreveport-
Bossier City, with goals for 2014-2016 ............................................................................ 41
Indicator 11. Truancy referrals (unique) for all grades in Caddo Parish, with
goals for 2015 and 2016 ......................................................................................................... 41
Indicator 12. Annual student dropout rates for all grades in metro Shreveport-
Bossier City, with goals for 2014-2016 ............................................................................ 43
Indicator 13. Idleness ages 16-19 in metro Shreveport-Bossier City, with goals
for 2014-2016 ............................................................................................................................. 44
Shreveport Police Department arrests age 17 and under for part 1 and part 2
crimes, with goals for 2015 and 2016............................................................................... 45
Indicator 14. Shreveport Police Department arrests age 17 and under for theft
and other assault, with goals for 2015 and 2016 ......................................................... 46
Indicator 15. Cohort graduation rate in metro Shreveport-Bossier City, with
goals for 2015 and 2016 ......................................................................................................... 47
Indicator 16. Average ACT score in metro Shreveport-Bossier City, with goals
for 2015 and 2016 ..................................................................................................................... 48
Indicator 17. Enrolled in college first fall after high school graduation, metro
Shreveport-Bossier City, with goals for 2015 and 2016 ........................................... 49

www.stepforwardnla.org Page 7
Indicator 18. Enrolled in college or graduate school age 18-24 in metro
Shreveport-Bossier City, ACS 1-year and 5-year estimates, with goals for 2015
and 2016 ........................................................................................................................................ 50
Total enrollment at two-year colleges in metro Shreveport-Bossier City
(SUSLA, NLTC, BPCC), with goals for 2015 and 2016 ................................................ 51
Indicator 19. Enrollment at two-year colleges age 24 and under in metro
Shreveport-Bossier City (SUSLA, NLTC, BPCC), with goals for 2015 and 2016
............................................................................................................................................................ 52
Indicator 20. Certificates, diplomas, and associate degrees granted at two-year
colleges in metro Shreveport-Bossier City (SUSLA, NLTC, BPCC), with goals for
2015 and 2016 ............................................................................................................................ 52
Associate’s degree or above age 18-24 in Caddo, Bossier, and Webster
parishes, with goals for 2014-2016 ................................................................................... 54
Indicator 21. Some college or above age 18-24 in metro Shreveport-Bossier
City, ACS 1- and 5-year estimates, with goals for 2015 and 2016 ........................ 54
Indicator 22. In labor force age 20-24 in metro Shreveport-Bossier City, ACS 1-
and 5-year estimates, with goals for 2015 and 2016 ................................................. 55
Indicator 23. Employed ages 20-24 in metro Shreveport-Bossier City, ACS 1-
year and 5-year estimates, with goals for 2015 and 2016 ....................................... 56
Indicator 24. Unemployed ages 20-24 in metro Shreveport-Bossier City, ACS
1-year and 5-year estimates, with goals for 2015 and 2016................................... 57
Indicator 25. Average annual wage and salary income age 18-24 civilian
employed in Caddo, Bossier, and Webster parishes, with goals for 2014-2016
............................................................................................................................................................ 58
Idleness ages 18-24 in Caddo, Bossier, and Webster parishes, with goals for
2014-2016 .................................................................................................................................... 59
www.stepforwardnla.org Page 8
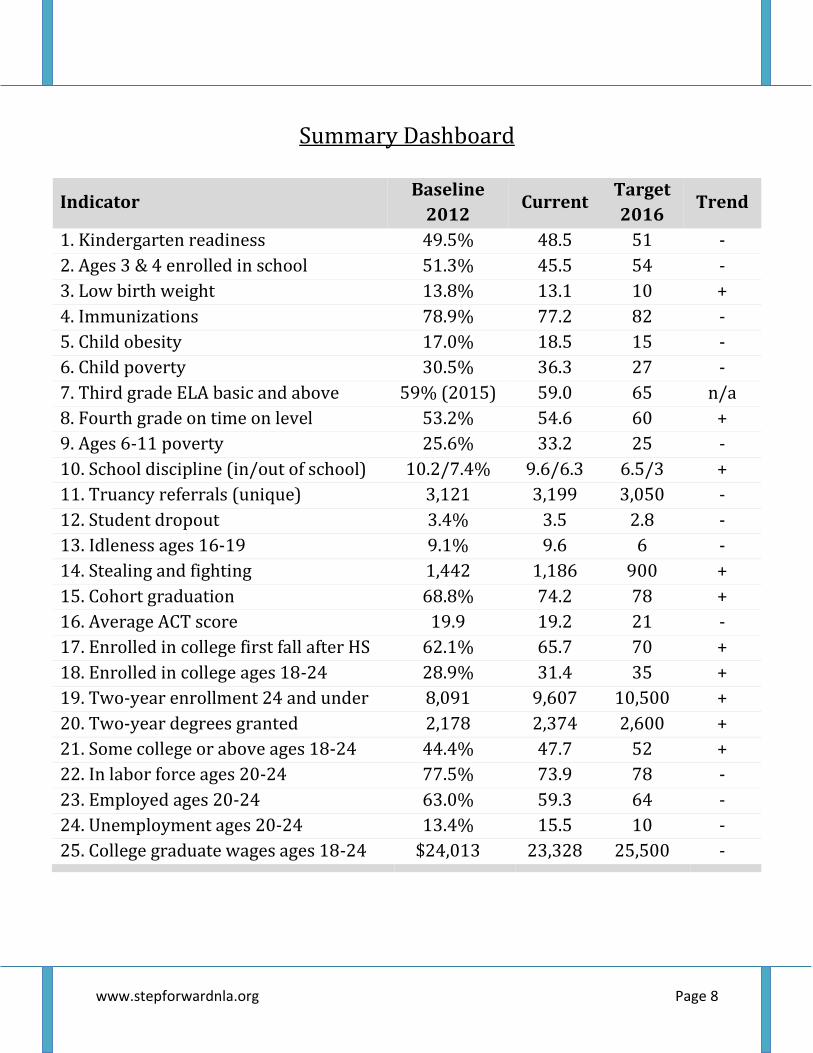
Summary Dashboard
Indicator Baseline
2012 Current
Target
2016 Trend
1. Kindergarten readiness 49.5% 48.5 51 -
2. Ages 3 & 4 enrolled in school 51.3% 45.5 54 -
3. Low birth weight 13.8% 13.1 10 +
4. Immunizations 78.9% 77.2 82 -
5. Child obesity 17.0% 18.5 15 -
6. Child poverty 30.5% 36.3 27 -
7. Third grade ELA basic and above 59% (2015) 59.0 65 n/a
8. Fourth grade on time on level 53.2% 54.6 60 +
9. Ages 6-11 poverty 25.6% 33.2 25 -
10. School discipline (in/out of school) 10.2/7.4% 9.6/6.3 6.5/3 +
11. Truancy referrals (unique) 3,121 3,199 3,050 -
12. Student dropout 3.4% 3.5 2.8 -
13. Idleness ages 16-19 9.1% 9.6 6 -
14. Stealing and fighting 1,442 1,186 900 +
15. Cohort graduation 68.8% 74.2 78 +
16. Average ACT score 19.9 19.2 21 -
17. Enrolled in college first fall after HS 62.1% 65.7 70 +
18. Enrolled in college ages 18-24 28.9% 31.4 35 +
19. Two-year enrollment 24 and under 8,091 9,607 10,500 +
20. Two-year degrees granted 2,178 2,374 2,600 +
21. Some college or above ages 18-24 44.4% 47.7 52 +
22. In labor force ages 20-24 77.5% 73.9 78 -
23. Employed ages 20-24 63.0% 59.3 64 -
24. Unemployment ages 20-24 13.4% 15.5 10 -
25. College graduate wages ages 18-24 $24,013 23,328 25,500 -
www.stepforwardnla.org Page 9
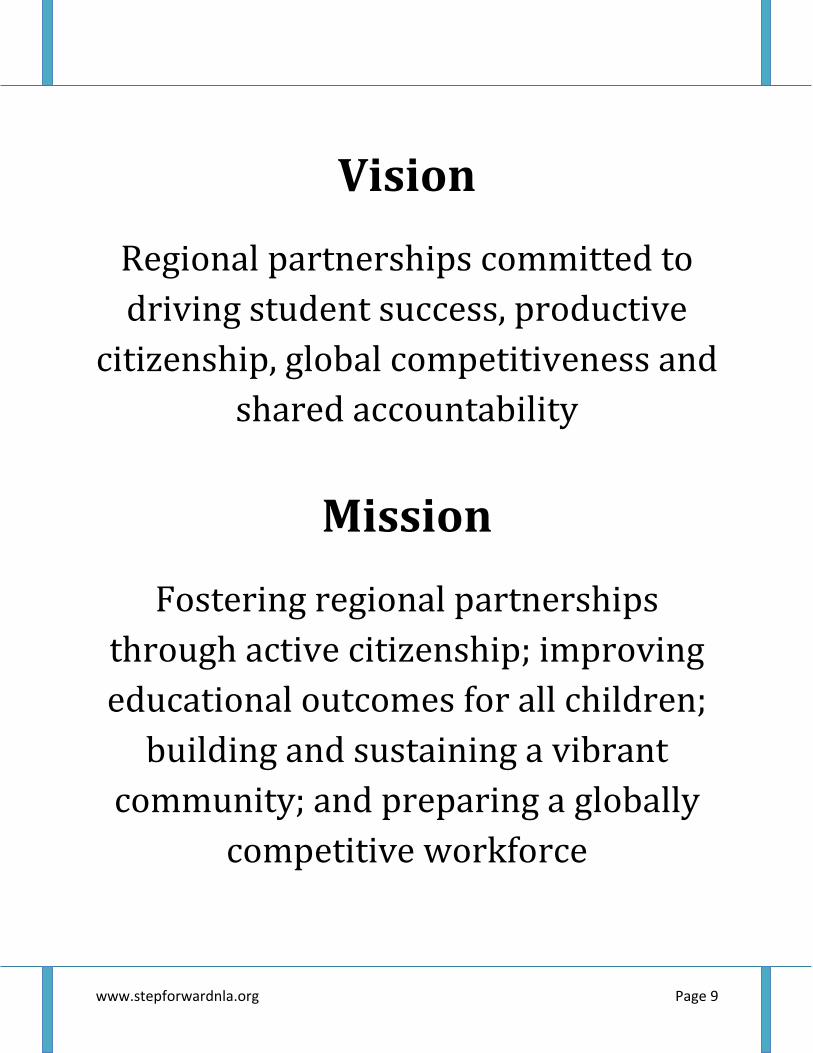
Vision
Regional partnerships committed to
driving student success, productive
citizenship, global competitiveness and
shared accountability
Mission
Fostering regional partnerships
through active citizenship; improving
educational outcomes for all children;
building and sustaining a vibrant
community; and preparing a globally
competitive workforce

www.stepforwardnla.org Page 10
Leadership Council
Bishop Larry Brandon
Pastor
Praise Temple Full Gospel Baptist Church
Dr. Cade Brumley
Superintendent
DeSoto Parish Schools
G.B. Cazes
Vice President
Cyber Innovation Center
John Dean
Partner of Counsel
Heard, McElroy and Vestal
Zell Dudley
Director, Business Development
North Louisiana Economic Partnership
Chris Gabriel
Executive Vice President
Volunteers of America North Louisiana
Dr. Lamar Goree
Superintendent
Caddo Parish School Board

www.stepforwardnla.org Page 11
Dr. Jim Henderson President
Northwestern State University
Paula Hickman Executive Director
The Community Foundation of North Louisiana
Rev. Timothy Jones Pastor
Peaceful Rest Baptist Church
DC Machen Superintendent
Bossier Parish Schools
Tim Magner Education Consultant
Paul Pratt
Director of Community Relations Chesapeake Energy
Africa Price
Director of Public Relations and Communications
City of Shreveport
Dr. Phillip Rozeman, MD Cardiovascular Consultants
Nancy Walker
Former kindergarten teacher and community volunteer

www.stepforwardnla.org Page 12
Operation Team Leaders
Nancy Alexander – Early Childhood Network
Sonja Bailes – Communications and Outreach
Rick Bateman – Post-Secondary
Susan Beaird – Funding
Dr. Joseph Bocchini – Health
Rosalyn Glover Bryant – Parent Advisory
LeVette Fuller – Early Literacy Network
Dudley Glenn – Civic Service
Lydia Jackson – Policy/Advocacy
Terrie Johnson – High School
Jacques Lasseigne – Economic Network
Michael Phillips – Youth Civic Development / My Brother’s Keeper Network
Mary Rounds – Youth Civic Development / My Brother’s Keeper Network
Billy Snow – Early Literacy Network
Nancy Walker – Early Childhood Network
Frederic Washington – Youth Advisory
www.stepforwardnla.org Page 13
Introduction
In order to address the many challenges that are facing our area’s young
people, leaders from across our community have joined forces with the Step
Forward effort. These individuals and groups are united behind a common
purpose: to strengthen and support the area’s children in order to improve
their academic achievement and prospects for entering a successful career.
The Step Forward initiative represents the work of an array of community
stakeholders. These individuals and groups are united by an important set of
principles. These principles are:
Shared Common Vision that focuses on regional collaboration to drive
student success, productive citizenship, and global competitiveness;
Collaborative Action that aligns the work of community partners as they
continually identify, adopt, and scale what improves student outcomes;
Data Driven, Evidence Based Decision Making that delivers positive
results for children from cradle to career;
Communication that offers transparency about our outcomes; and
Investment that sustains and scales what the data says works.
These principles are what drive this initiative. By coming to the table and
participating at this critical time, the members of this project have endorsed
and are guided by these principles. In doing so, they have all agreed to take
our community in a new direction and step forward.

www.stepforwardnla.org Page 14
Step Forward Team
Step Forward enjoys support from a wide range of stakeholders in the
community. They include community partners working in early childhood, k-
12, higher education, workforce development, businesses, foundations, and
nonprofit and civic organizations. These individuals and groups have been
involved in discussions and planning since December 2012.
Goals & Objectives
Be PREPARED for school,
Be SUPPORTED inside and outside of school,
SUCCEED academically,
Be EQUIPPED with tools to become an effective and productive citizen,
ENROLL in postsecondary education,
GRADUATE and ENTER A CAREER.
The Step Forward initiative operates within the Shreveport-Bossier City
Metropolitan Statistical Area (MSA), a four-parish region in northwest
Louisiana discussed in detail below.
www.stepforwardnla.org Page 15
Current Projects
Early Childhood
1. Understand current status of kindergarten readiness via
parent surveys and identification of exemplar child care
programs;
2. Provide education regarding kindergarten readiness in feeder
programs for pilot schools;
3. Increase health services to pilot schools and their feeder
preschool programs; and
4. Provide literacy volunteers for specified preschool programs
and feeder child care centers.
Early Literacy
1. Strengthen summer reading library/school partnership to
ameliorate summer reading drop;
2. Recruit and train literacy volunteers for third-grade students;
3. Parent education regarding early grade literacy; and
4. Increase health services at pilot schools.
www.stepforwardnla.org Page 16
Youth Civic Development – My Brother’s Keeper
1. Increase community support of schools via development of a
school-site community center;
2. Recruit and train mentors to serve in specific Caddo Parish
middle and high schools within the Transformation Zone; and
3. Conduct truancy/dropout data analysis to develop
recommendations for intervention.
Workforce Development
1. Hold career/life fair for 18-24-year-olds;
2. Create a marketing toolkit to disseminate information to 18-
24-year-olds;
3. Conduct employer survey regarding workforce needs;
4. Create employer speaker’s bureau regarding workforce needs;
and
5. Create a life needs resources/training options brochure for 18-
24-year-olds.
www.stepforwardnla.org Page 17
Guide to the Charts
The 39 charts below attempt to present a good deal of information as clearly
and simply as possible. The text above and below each figure describes the
measure at hand and where it comes from. Most of these statistics can be
recreated by the curious reader with the links provided and some familiarity
with MS Excel or a similar spreadsheet program. In the cases of weighted
data, the population totals used to create the weights come from either the
U.S. Census or the state Department of Education.
Most of the charts include both percentage values and number/count values
for each data point in each year. Keep in mind the size of a population often
varies from year to year. For example, the total counts of individuals under
age 5 in the area for the years 2010-2014 are 27,986, 29,059, 29,250, 32,146,
and 31,160 (ACS 1-year estimates). If an indicator for this population
remained at 50 percent during each of these years, the number/count value
would be different in each year.
It is even possible for the percentage to rise as the number/count falls, and
vice versa. This is more likely to occur between the years 2012 and 2013,
when Webster Parish (re)joined the metropolitan statistical area. Generally,
one uses the percentage when comparing different years (and areas) because
it expresses the value as a fraction of 100 and is unaffected by population size.
The number/count however is necessary information when considering the
magnitude of the interventions needed to accomplish the goal of population-
level change.
www.stepforwardnla.org Page 18
About the Community
All of the numbers presented in this introduction are from the U.S. Bureau of
the Census (unless otherwise noted) and are discussed at length in the report
below.i Following the introduction a profile will emerge of the young metro
Shreveport-Bossier City residents in four stages, from the early days of the
cradle to the beginning of a career.
The Shreveport-Bossier City metropolitan statistical area contains four
parishes with various population sizes: Caddo (252,063), Bossier (125,064),
Webster (40,333), and DeSoto (27,142). As surrounding communities become
socially and economically integrated with the urban core, the boundaries of
the metro area expand. Patterns of commuting to work also figure into the
federal Office of Management and Budget’s delineation decisions. The
addition of Webster in 2013 does introduce complications for annual
comparisons, but the benefits far outweigh any technical concerns. The latest
estimate of the total metro population is 445,142. Of a total 381 metro
areas—from New York-Newark-Jersey City, NY-NJ-PA (20 million), to Carson
City, NV (54,522)—we are the 114th most populous in the U.S.
The metro population is distributed into the five cities with populations over
5,000 and into many smaller surrounding areas. The five cities and their 2014
population sizes are Shreveport (198,242) in Caddo; Bossier City (67,472) in
Bossier; Minden (12,808) and Springhill (5,148) in Webster; and Mansfield
(5,006) in DeSoto. Shreveport is the largest in the metro area, twice the size
of the other four cities combined. All together, these 288,676 residents of the
five largest cities make up almost two thirds of the metro population
(Shreveport alone is 44 percent). Although the remaining 156,466 individuals
do not live in places of 5,000 or more, they are not formally rural because they
are inside the metropolitan statistical area geography. That is, many places
here are small, but they are socially and economically integrated into
Shreveport and Bossier City.
www.stepforwardnla.org Page 19
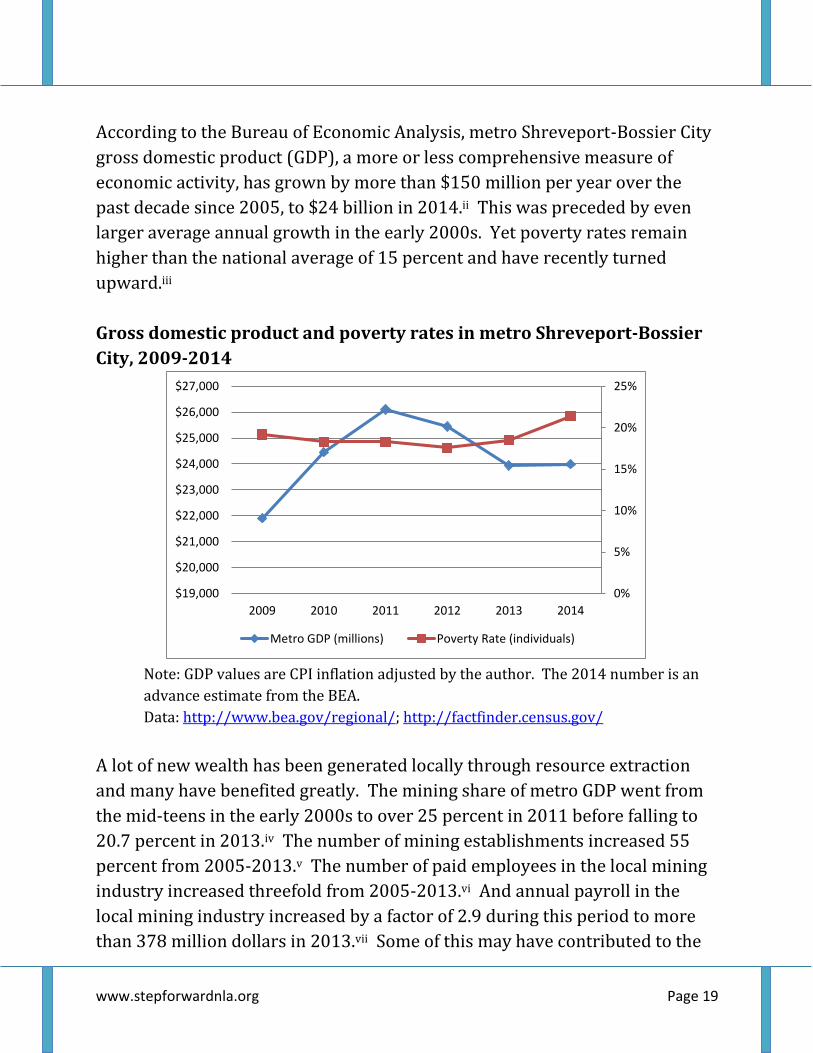
According to the Bureau of Economic Analysis, metro Shreveport-Bossier City
gross domestic product (GDP), a more or less comprehensive measure of
economic activity, has grown by more than $150 million per year over the
past decade since 2005, to $24 billion in 2014.ii This was preceded by even
larger average annual growth in the early 2000s. Yet poverty rates remain
higher than the national average of 15 percent and have recently turned
upward.iii
Gross domestic product and poverty rates in metro Shreveport-Bossier
City, 2009-2014
Note: GDP values are CPI inflation adjusted by the author. The 2014 number is an
advance estimate from the BEA.
Data: http://www.bea.gov/regional/; http://factfinder.census.gov/
A lot of new wealth has been generated locally through resource extraction
and many have benefited greatly. The mining share of metro GDP went from
the mid-teens in the early 2000s to over 25 percent in 2011 before falling to
20.7 percent in 2013.iv The number of mining establishments increased 55
percent from 2005-2013.v The number of paid employees in the local mining
industry increased threefold from 2005-2013.vi And annual payroll in the
local mining industry increased by a factor of 2.9 during this period to more
than 378 million dollars in 2013.vii Some of this may have contributed to the
0%
5%
10%
15%
20%
25%
$19,000
$20,000
$21,000
$22,000
$23,000
$24,000
$25,000
$26,000
$27,000
2009 2010 2011 2012 2013 2014
Metro GDP (millions) Poverty Rate (individuals)
www.stepforwardnla.org Page 20
recent decline in poverty levels, but this improvement appears to have been
overcome and the current poverty rate for individuals is probably at or near
20 percent.
This is not to say that poverty in the area has remained unchanged for a long
time. This region and the country as a whole have witnessed major
improvements in the poverty rate since 1960. Overall metro Shreveport-
Bossier City poverty rates by decade are: 37 percent (1960), 25 percent
(1970), 17 percent (1980), 23 percent (1990), 20 percent (2000), and 18
percent (2010). The most recent estimate is 21.4 percent in 2014.viii Those at
highest risk of being in poverty are no longer older individuals, as they once
were. They are now children. The most recent poverty figure for those under
18 years is 32.7 percent or 35,101. For those 65 years and over this figure is
10.5 percent or 6,511.ix
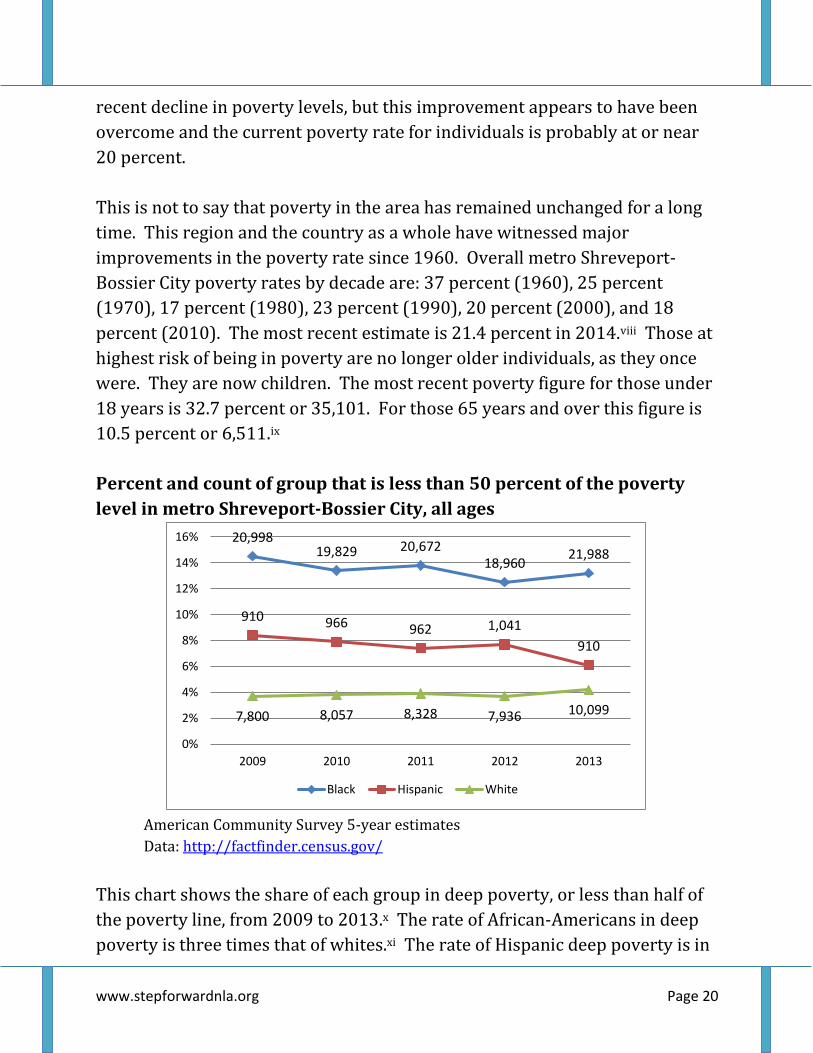
Percent and count of group that is less than 50 percent of the poverty
level in metro Shreveport-Bossier City, all ages
American Community Survey 5-year estimates
Data: http://factfinder.census.gov/
This chart shows the share of each group in deep poverty, or less than half of
the poverty line, from 2009 to 2013.x The rate of African-Americans in deep
poverty is three times that of whites.xi The rate of Hispanic deep poverty is in
20,99819,829 20,672
18,96021,988
910 966 962 1,041
910
7,800 8,057 8,328 7,936 10,099
0%
2%
4%
6%
8%
10%
12%
14%
16%
2009 2010 2011 2012 2013
Black Hispanic White
www.stepforwardnla.org Page 21
between and has been declining. Poverty and income definitions are
discussed in detail in the report below.
At the turn of the 20th century, the great sociologist W. E. B. Du Bois wrote
about the changing social and economic conditions of African-Americans
during the previous three decades.xii He famously described race as the “veil”
that colors all human relations in America. Seventy-five years later, William
Julius Wilson, another great sociologist, wrote about the declining significance
of race in America.xiii He maintained that social class differences had become
more important than race in determining an individual’s life chances. The
works of these scholars continue to be relevant today. Educated African-
American professionals abound in metro Shreveport-Bossier City, and yet
some of our community’s poorest children are African-American. The number
of African-American metro Shreveport-Bossier City residents in deep poverty
is twice the number of white residents. However, African-American
unemployment rates are falling, and educational attainment is rising.
The number of African-Americans with education beyond high school has
increased more than 2,000 per year over the past six years, to an estimated
44,838 in 2014. More than a third of African-American males now have some
college or above, an estimated 16,538 in 2014. The number of African-
Americans employed in management, business, science, and arts occupations
has increased more than 900 per year since 2010 to an estimated 16,877,
more than 70 percent female, in 2014.xiv
www.stepforwardnla.org Page 22
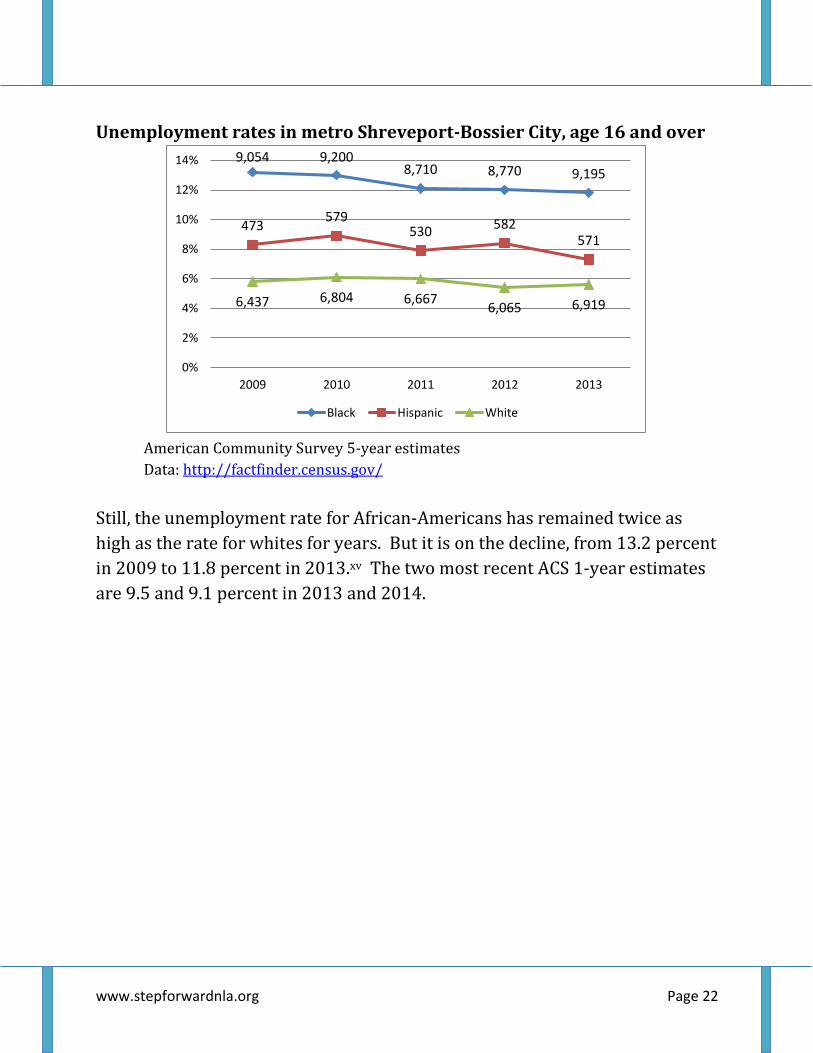
Unemployment rates in metro Shreveport-Bossier City, age 16 and over
American Community Survey 5-year estimates
Data: http://factfinder.census.gov/
Still, the unemployment rate for African-Americans has remained twice as
high as the rate for whites for years. But it is on the decline, from 13.2 percent
in 2009 to 11.8 percent in 2013.xv The two most recent ACS 1-year estimates
are 9.5 and 9.1 percent in 2013 and 2014.
9,054 9,2008,710 8,770 9,195
473579
530582
571
6,437 6,804 6,6676,065 6,919
0%
2%
4%
6%
8%
10%
12%
14%
2009 2010 2011 2012 2013
Black Hispanic White
www.stepforwardnla.org Page 23
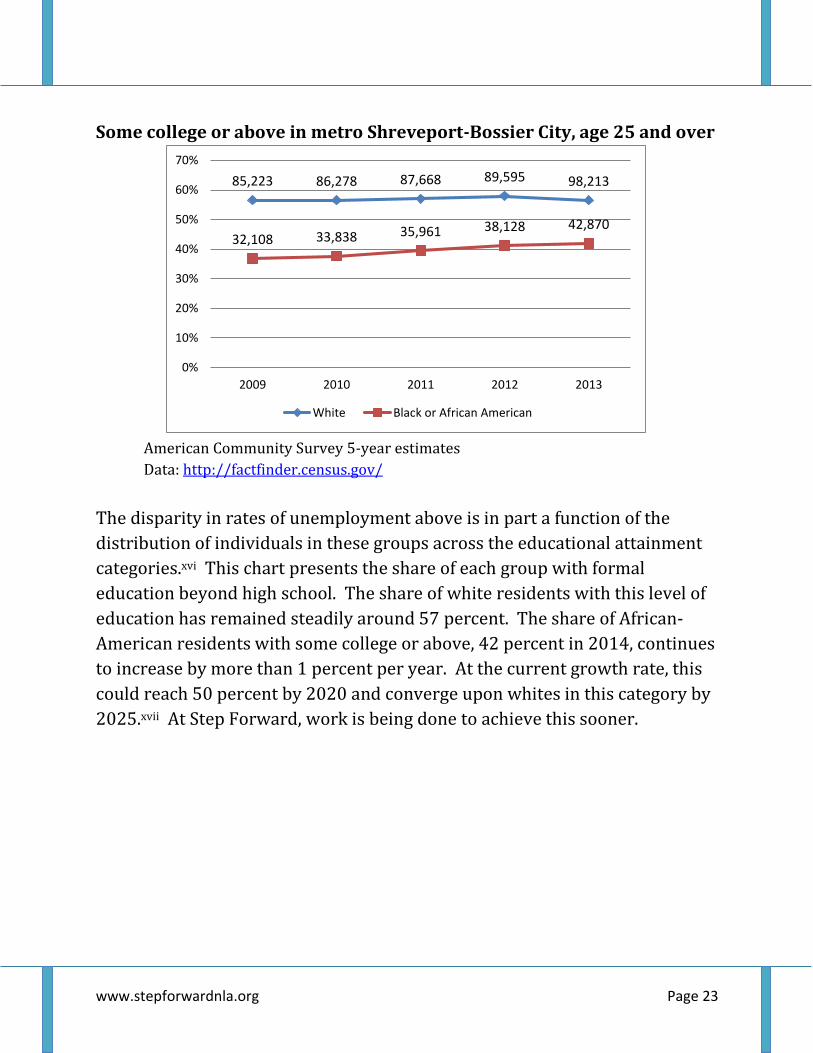
Some college or above in metro Shreveport-Bossier City, age 25 and over
American Community Survey 5-year estimates
Data: http://factfinder.census.gov/
The disparity in rates of unemployment above is in part a function of the
distribution of individuals in these groups across the educational attainment
categories.xvi This chart presents the share of each group with formal
education beyond high school. The share of white residents with this level of
education has remained steadily around 57 percent. The share of African-
American residents with some college or above, 42 percent in 2014, continues
to increase by more than 1 percent per year. At the current growth rate, this
could reach 50 percent by 2020 and converge upon whites in this category by
2025.xvii At Step Forward, work is being done to achieve this sooner.
85,223 86,278 87,668 89,595 98,213
32,108 33,838 35,961 38,128 42,870
0%
10%
20%
30%
40%
50%
60%
70%
2009 2010 2011 2012 2013
White Black or African American
www.stepforwardnla.org Page 24
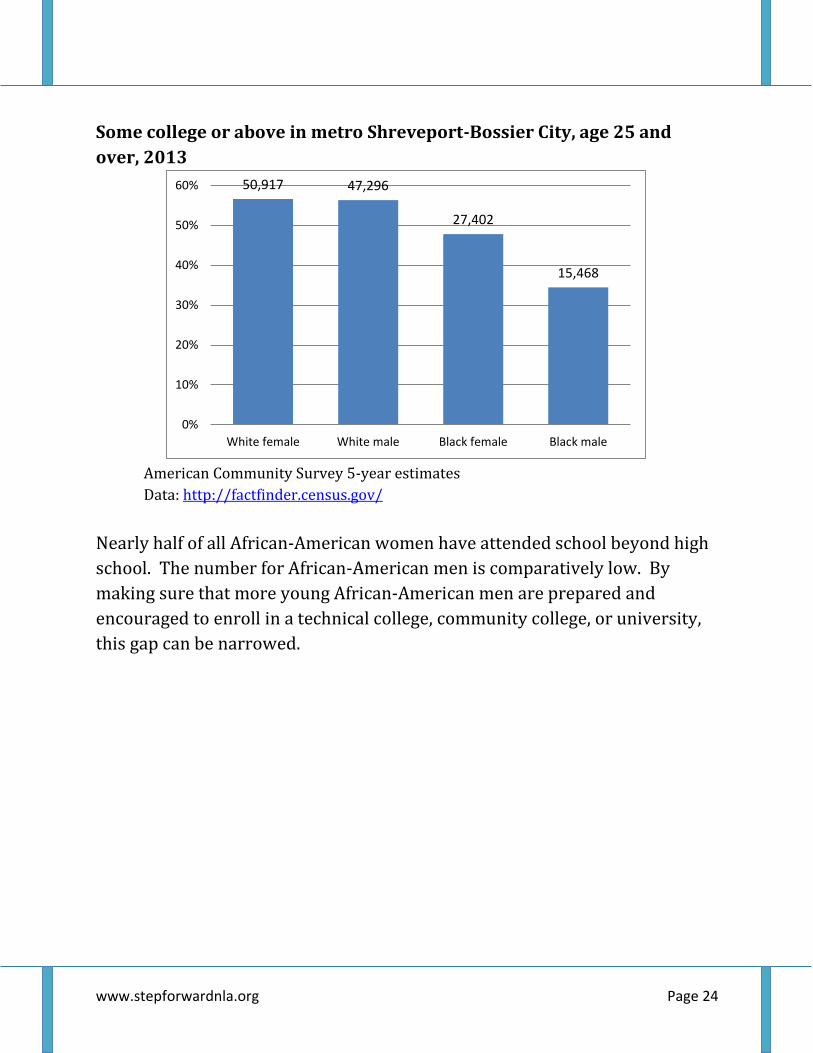
Some college or above in metro Shreveport-Bossier City, age 25 and
over, 2013
American Community Survey 5-year estimates
Data: http://factfinder.census.gov/
Nearly half of all African-American women have attended school beyond high
school. The number for African-American men is comparatively low. By
making sure that more young African-American men are prepared and
encouraged to enroll in a technical college, community college, or university,
this gap can be narrowed.
50,917 47,296
27,402
15,468
0%
10%
20%
30%
40%
50%
60%
White female White male Black female Black male
www.stepforwardnla.org Page 25
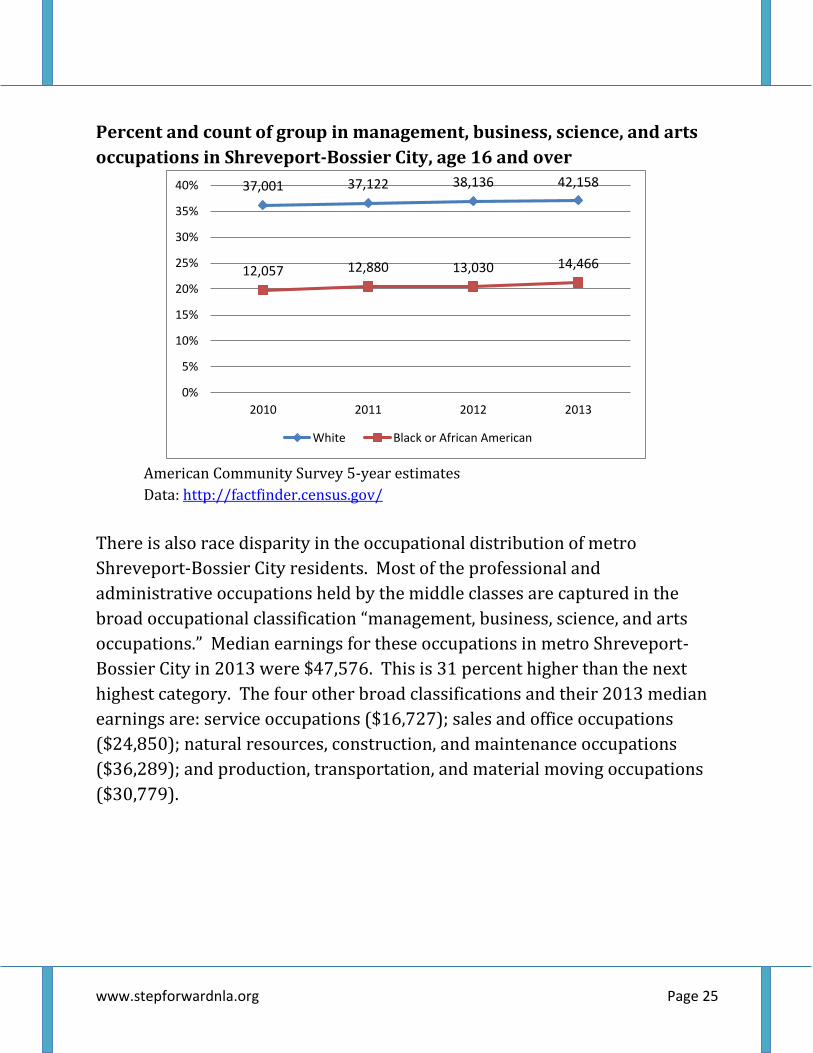
Percent and count of group in management, business, science, and arts
occupations in Shreveport-Bossier City, age 16 and over
American Community Survey 5-year estimates
Data: http://factfinder.census.gov/
There is also race disparity in the occupational distribution of metro
Shreveport-Bossier City residents. Most of the professional and
administrative occupations held by the middle classes are captured in the
broad occupational classification “management, business, science, and arts
occupations.” Median earnings for these occupations in metro Shreveport-
Bossier City in 2013 were $47,576. This is 31 percent higher than the next
highest category. The four other broad classifications and their 2013 median
earnings are: service occupations ($16,727); sales and office occupations
($24,850); natural resources, construction, and maintenance occupations
($36,289); and production, transportation, and material moving occupations
($30,779).
37,001 37,122 38,136 42,158
12,057 12,880 13,030 14,466
0%
5%
10%
15%
20%
25%
30%
35%
40%
2010 2011 2012 2013
White Black or African American
www.stepforwardnla.org Page 26
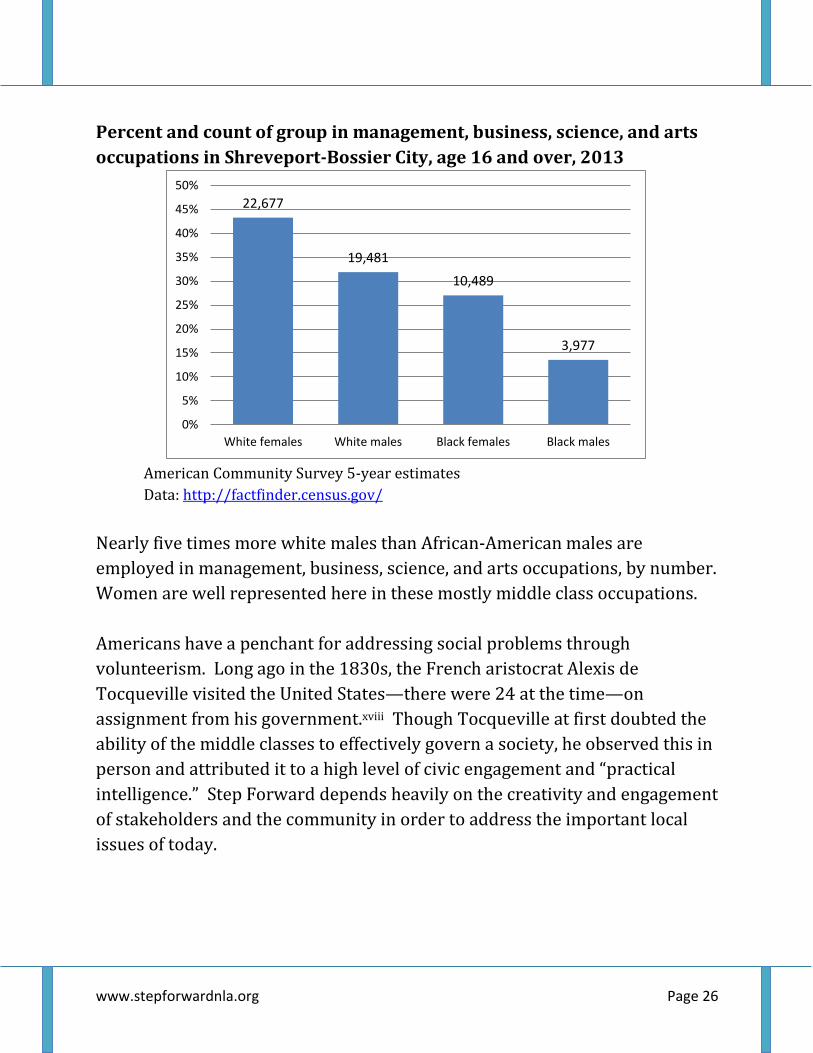
Percent and count of group in management, business, science, and arts
occupations in Shreveport-Bossier City, age 16 and over, 2013
American Community Survey 5-year estimates
Data: http://factfinder.census.gov/
Nearly five times more white males than African-American males are
employed in management, business, science, and arts occupations, by number.
Women are well represented here in these mostly middle class occupations.
Americans have a penchant for addressing social problems through
volunteerism. Long ago in the 1830s, the French aristocrat Alexis de
Tocqueville visited the United States—there were 24 at the time—on
assignment from his government.xviii Though Tocqueville at first doubted the
ability of the middle classes to effectively govern a society, he observed this in
person and attributed it to a high level of civic engagement and “practical
intelligence.” Step Forward depends heavily on the creativity and engagement
of stakeholders and the community in order to address the important local
issues of today.
22,677
19,481
10,489
3,977
0%
5%
10%
15%
20%
25%
30%
35%
40%
45%
50%
White females White males Black females Black males
www.stepforwardnla.org Page 27
Data-Driven Program
Step Forward uses data to drive project planning, goal setting, and evaluation.
This report uses information from the following sources:
U.S. Bureau of the Census; U.S. Bureau of Economic Analysis; National
Center for Health Statistics; Louisiana Children’s Cabinet; Louisiana
Department of Health and Hospitals; Louisiana Board of Regents;
Louisiana Department of Education; Caddo Parish Department of
Juvenile Services; and the Shreveport Police Department.
Some of our most important community indicators are from the Census
Bureau, including measures of poverty, school enrollment, educational
attainment, employment, and income, in addition to population statistics for
the area. This information is available annually as a result of the American
Community Survey (ACS), which took the place of the decennial census “long
form” in 2010.xix American Community Survey 1-year and 5-year estimates
are rolling annual averages based on a sample of households.xx The
unweighted sample count of population for the 2014 ACS 1-year estimates in
metro Shreveport-Bossier City is 6,263. For the 2013 ACS 5-year estimates
(most recent available) the unweighted sample count is 30,838.
Rapid change is captured slowly by the multi-year method, but the larger
sample size reduces the margins of error, narrowing the confidence intervals
around the estimates. When considering the ACS figures one might think of
the 5-year estimate as the more accurate statistic for that variable in this area
and the 1-year estimate as a preview, as they are available several months
earlier. When these two values differ (as they often do) one might think of the
“true” value as close to the 5-year estimate and in the direction of the 1-year
estimate.
www.stepforwardnla.org Page 28
Indicators
In the spring of 2013, the Step Forward team developed a set of indicators to
track progress toward the stated goals of the project. These indicators were
selected based on criteria developed by the Strive Network.
Is the proposed indicator:
A valid measure of the outcome?
Easily understandable to local stakeholders?
Reasonably similar across the region and school districts?
Produced by a trusted source?
Affordable to gather and report?
Available consistently over time?
Able to be improved through local action, and useful in the day to day
work?
The 2013 baseline report included nine indicators. The most recent data
suggest the area has improved on four of these measures from baseline
(fourth grade on time on level, high school cohort graduation, college
enrollment ages 18-24, and some college or above ages 18-24). We have
added sixteen additional indicators to this report fitting the criteria above.
The figures below present the 25 population level indicators and other
information. Some Step Forward projects will impact these indicators directly
and others will impact them indirectly. More than one project is necessary to
change conditions such as school enrollment or employment rates in a metro
area of this size. Currently, ten of the 25 indicators (40 percent) are trending
positive from their baseline.
Goals for the community in the figures are represented in gray with dotted
lines. These are not official estimates, projections or forecasts. The more of
these indicators that are heading in the right direction, the more likely the
necessary conditions exist for future success.
www.stepforwardnla.org Page 29
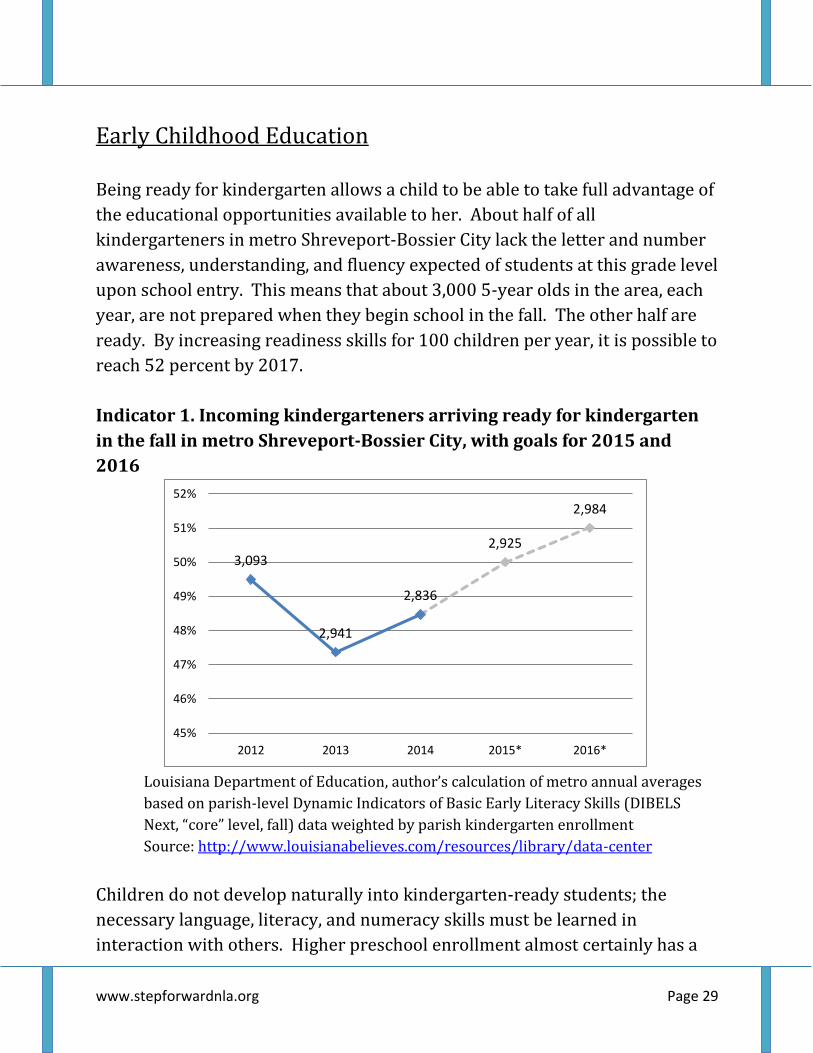
Early Childhood Education
Being ready for kindergarten allows a child to be able to take full advantage of
the educational opportunities available to her. About half of all
kindergarteners in metro Shreveport-Bossier City lack the letter and number
awareness, understanding, and fluency expected of students at this grade level
upon school entry. This means that about 3,000 5-year olds in the area, each
year, are not prepared when they begin school in the fall. The other half are
ready. By increasing readiness skills for 100 children per year, it is possible to
reach 52 percent by 2017.
Indicator 1. Incoming kindergarteners arriving ready for kindergarten
in the fall in metro Shreveport-Bossier City, with goals for 2015 and
2016
Louisiana Department of Education, author’s calculation of metro annual averages
based on parish-level Dynamic Indicators of Basic Early Literacy Skills (DIBELS
Next, “core” level, fall) data weighted by parish kindergarten enrollment
Source: http://www.louisianabelieves.com/resources/library/data-center
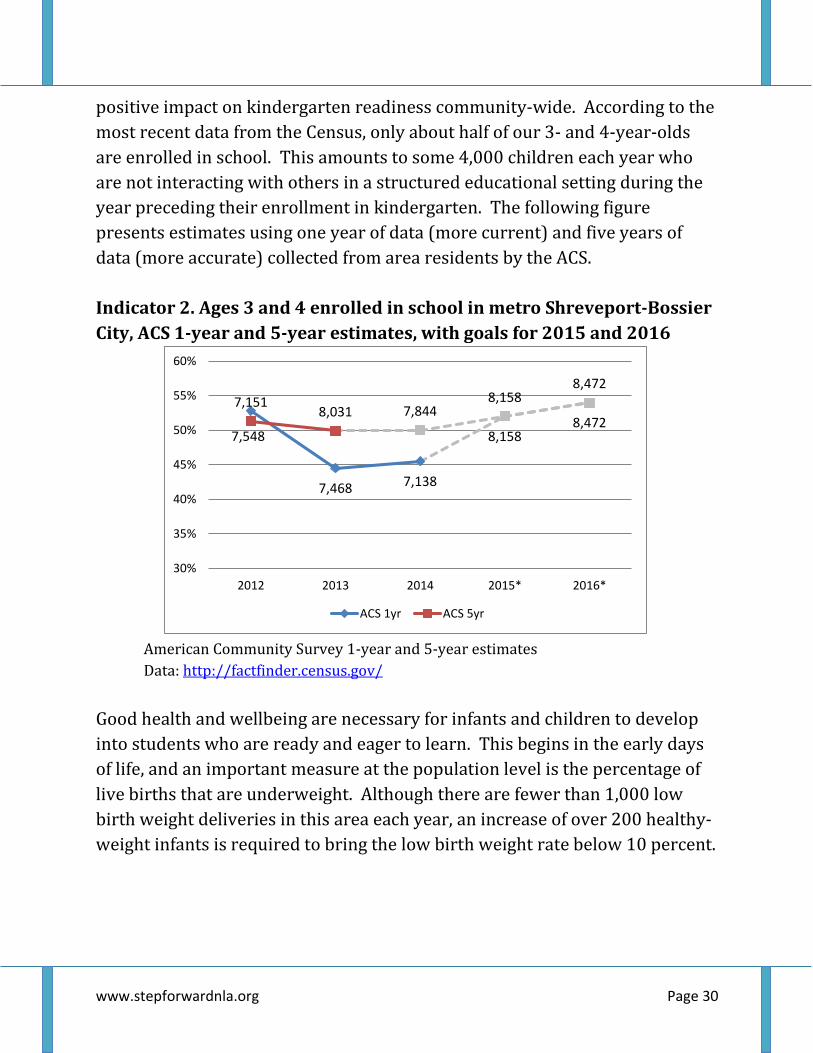
Children do not develop naturally into kindergarten-ready students; the
necessary language, literacy, and numeracy skills must be learned in
interaction with others. Higher preschool enrollment almost certainly has a
3,093
2,941
2,836
2,925
2,984
45%
46%
47%
48%
49%
50%
51%
52%
2012 2013 2014 2015* 2016*
www.stepforwardnla.org Page 30
positive impact on kindergarten readiness community-wide. According to the
most recent data from the Census, only about half of our 3- and 4-year-olds
are enrolled in school. This amounts to some 4,000 children each year who
are not interacting with others in a structured educational setting during the
year preceding their enrollment in kindergarten. The following figure
presents estimates using one year of data (more current) and five years of
data (more accurate) collected from area residents by the ACS.
Indicator 2. Ages 3 and 4 enrolled in school in metro Shreveport-Bossier
City, ACS 1-year and 5-year estimates, with goals for 2015 and 2016
American Community Survey 1-year and 5-year estimates
Data: http://factfinder.census.gov/
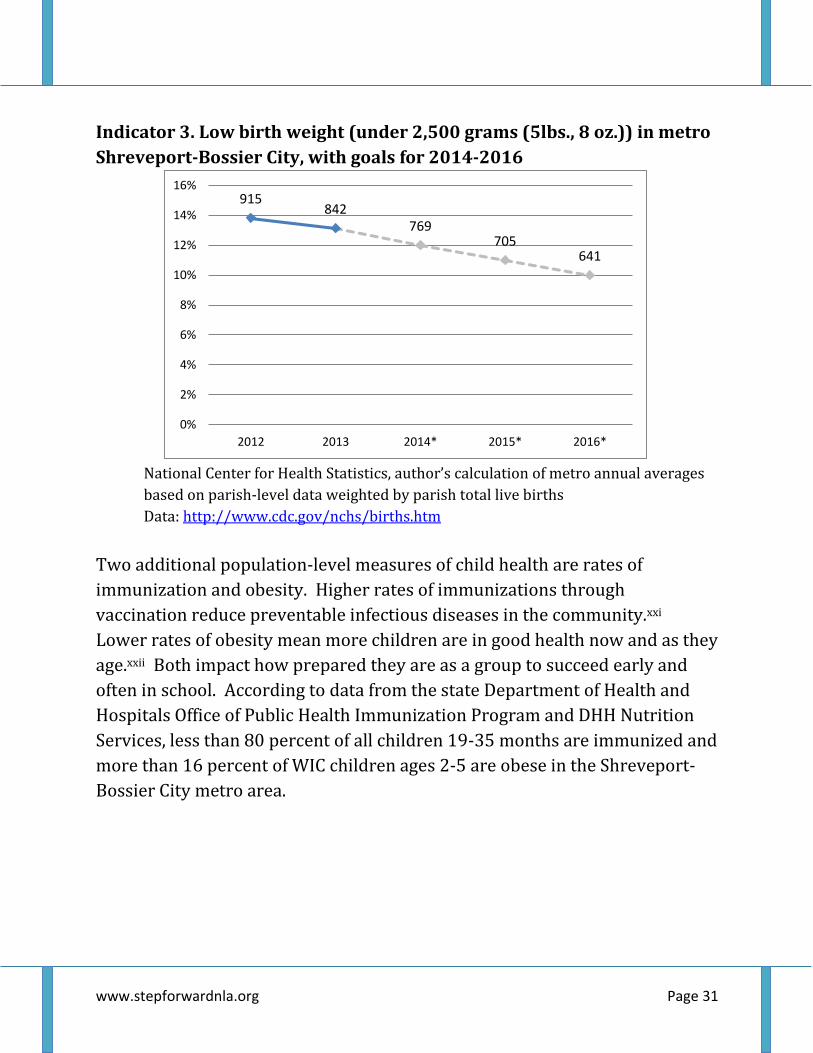
Good health and wellbeing are necessary for infants and children to develop
into students who are ready and eager to learn. This begins in the early days
of life, and an important measure at the population level is the percentage of
live births that are underweight. Although there are fewer than 1,000 low
birth weight deliveries in this area each year, an increase of over 200 healthy-
weight infants is required to bring the low birth weight rate below 10 percent.
7,548
7,468 7,138
8,1588,472
7,1518,031 7,844
8,1588,472
30%
35%
40%
45%
50%
55%
60%
2012 2013 2014 2015* 2016*
ACS 1yr ACS 5yr
www.stepforwardnla.org Page 31
Indicator 3. Low birth weight (under 2,500 grams (5lbs., 8 oz.)) in metro
Shreveport-Bossier City, with goals for 2014-2016
National Center for Health Statistics, author’s calculation of metro annual averages
based on parish-level data weighted by parish total live births
Data: http://www.cdc.gov/nchs/births.htm
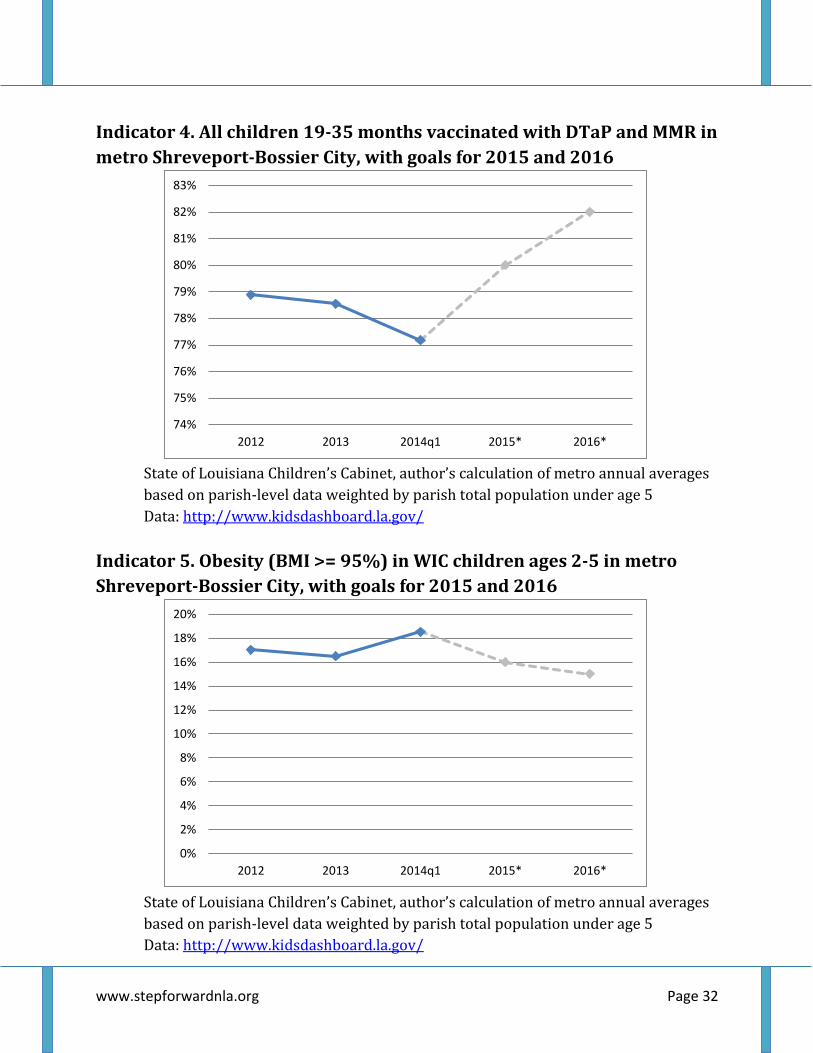
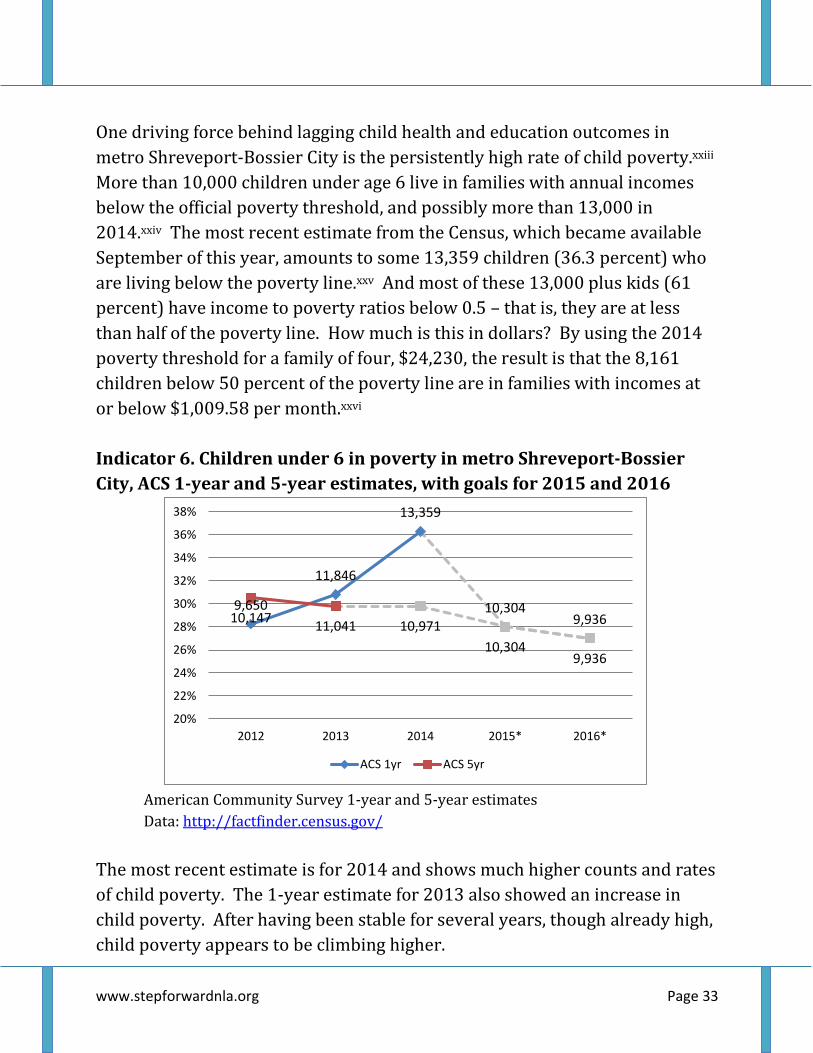
Two additional population-level measures of child health are rates of
immunization and obesity. Higher rates of immunizations through
vaccination reduce preventable infectious diseases in the community.xxi
Lower rates of obesity mean more children are in good health now and as they
age.xxii Both impact how prepared they are as a group to succeed early and
often in school. According to data from the state Department of Health and
Hospitals Office of Public Health Immunization Program and DHH Nutrition
Services, less than 80 percent of all children 19-35 months are immunized and
more than 16 percent of WIC children ages 2-5 are obese in the Shreveport-
Bossier City metro area.
915842
769705
641
0%
2%
4%
6%
8%
10%
12%
14%
16%
2012 2013 2014* 2015* 2016*
www.stepforwardnla.org Page 32
Indicator 4. All children 19-35 months vaccinated with DTaP and MMR in
metro Shreveport-Bossier City, with goals for 2015 and 2016
State of Louisiana Children’s Cabinet, author’s calculation of metro annual averages
based on parish-level data weighted by parish total population under age 5
Data: http://www.kidsdashboard.la.gov/
Indicator 5. Obesity (BMI >= 95%) in WIC children ages 2-5 in metro
Shreveport-Bossier City, with goals for 2015 and 2016
State of Louisiana Children’s Cabinet, author’s calculation of metro annual averages
based on parish-level data weighted by parish total population under age 5
Data: http://www.kidsdashboard.la.gov/
74%
75%
76%
77%
78%
79%
80%
81%
82%
83%
2012 2013 2014q1 2015* 2016*
0%
2%
4%
6%
8%
10%
12%
14%
16%
18%
20%
2012 2013 2014q1 2015* 2016*
www.stepforwardnla.org Page 33
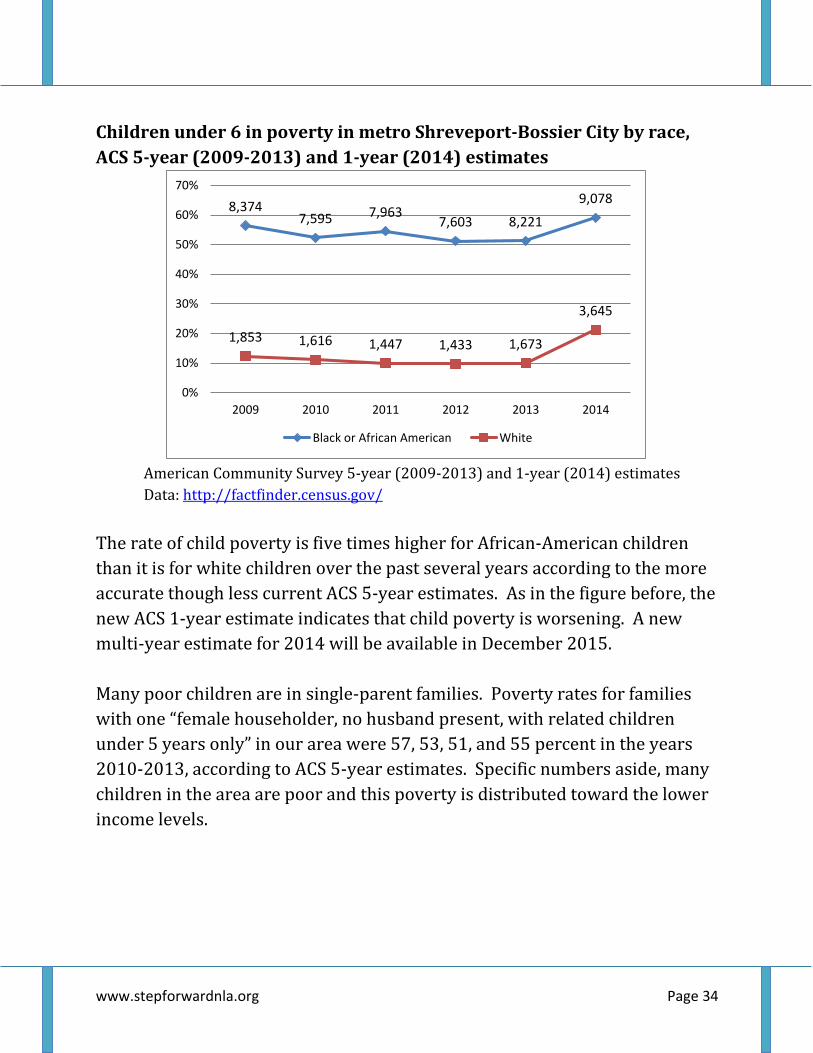
One driving force behind lagging child health and education outcomes in
metro Shreveport-Bossier City is the persistently high rate of child poverty.xxiii
More than 10,000 children under age 6 live in families with annual incomes
below the official poverty threshold, and possibly more than 13,000 in
2014.xxiv The most recent estimate from the Census, which became available
September of this year, amounts to some 13,359 children (36.3 percent) who
are living below the poverty line.xxv And most of these 13,000 plus kids (61
percent) have income to poverty ratios below 0.5 – that is, they are at less
than half of the poverty line. How much is this in dollars? By using the 2014
poverty threshold for a family of four, $24,230, the result is that the 8,161
children below 50 percent of the poverty line are in families with incomes at
or below $1,009.58 per month.xxvi
Indicator 6. Children under 6 in poverty in metro Shreveport-Bossier
City, ACS 1-year and 5-year estimates, with goals for 2015 and 2016
American Community Survey 1-year and 5-year estimates
Data: http://factfinder.census.gov/
The most recent estimate is for 2014 and shows much higher counts and rates
of child poverty. The 1-year estimate for 2013 also showed an increase in
child poverty. After having been stable for several years, though already high,
child poverty appears to be climbing higher.
9,650
11,846
13,359
10,3049,93610,147
11,041 10,971
10,3049,936
20%
22%
24%
26%
28%
30%
32%
34%
36%
38%
2012 2013 2014 2015* 2016*
ACS 1yr ACS 5yr
www.stepforwardnla.org Page 34
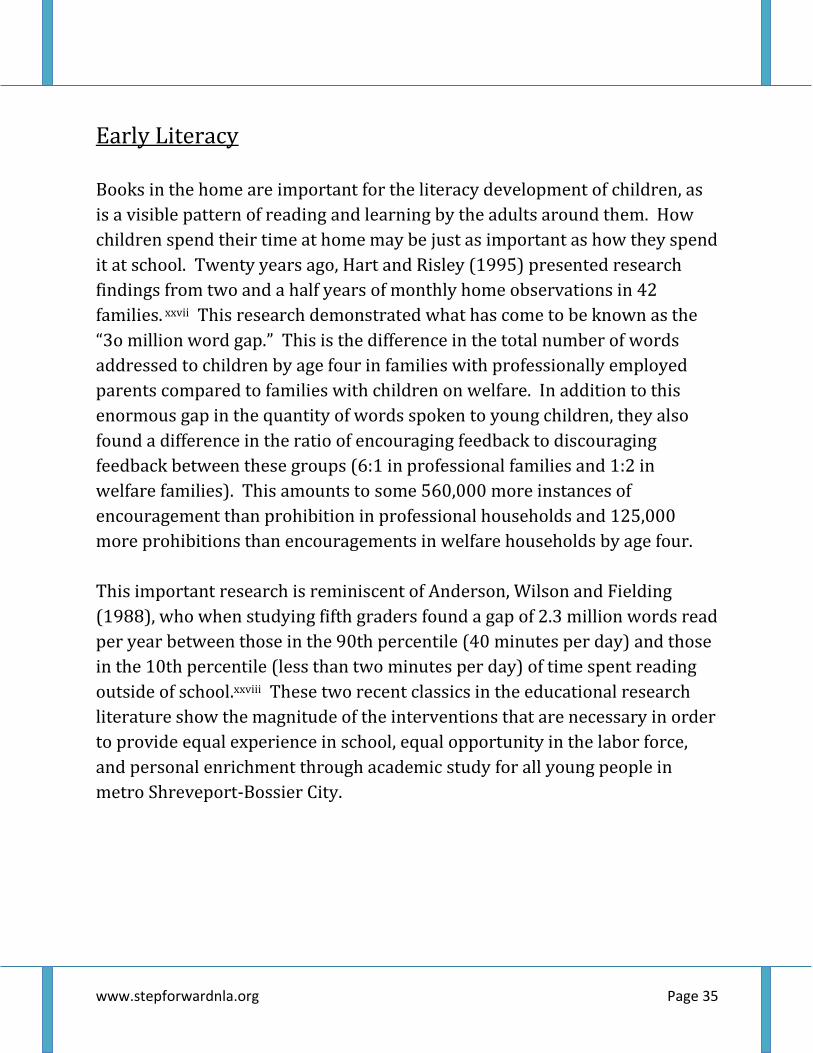
Children under 6 in poverty in metro Shreveport-Bossier City by race,
ACS 5-year (2009-2013) and 1-year (2014) estimates
American Community Survey 5-year (2009-2013) and 1-year (2014) estimates
Data: http://factfinder.census.gov/
The rate of child poverty is five times higher for African-American children
than it is for white children over the past several years according to the more
accurate though less current ACS 5-year estimates. As in the figure before, the
new ACS 1-year estimate indicates that child poverty is worsening. A new
multi-year estimate for 2014 will be available in December 2015.
Many poor children are in single-parent families. Poverty rates for families
with one “female householder, no husband present, with related children
under 5 years only” in our area were 57, 53, 51, and 55 percent in the years
2010-2013, according to ACS 5-year estimates. Specific numbers aside, many
children in the area are poor and this poverty is distributed toward the lower
income levels.
8,3747,595 7,963
7,603 8,221
9,078
1,853 1,616 1,447 1,433 1,673
3,645
0%
10%
20%
30%
40%
50%
60%
70%
2009 2010 2011 2012 2013 2014
Black or African American White
www.stepforwardnla.org Page 35
Early Literacy
Books in the home are important for the literacy development of children, as
is a visible pattern of reading and learning by the adults around them. How
children spend their time at home may be just as important as how they spend
it at school. Twenty years ago, Hart and Risley (1995) presented research
findings from two and a half years of monthly home observations in 42
families. xxvii This research demonstrated what has come to be known as the
“3o million word gap.” This is the difference in the total number of words
addressed to children by age four in families with professionally employed
parents compared to families with children on welfare. In addition to this
enormous gap in the quantity of words spoken to young children, they also
found a difference in the ratio of encouraging feedback to discouraging
feedback between these groups (6:1 in professional families and 1:2 in
welfare families). This amounts to some 560,000 more instances of
encouragement than prohibition in professional households and 125,000
more prohibitions than encouragements in welfare households by age four.
This important research is reminiscent of Anderson, Wilson and Fielding
(1988), who when studying fifth graders found a gap of 2.3 million words read
per year between those in the 90th percentile (40 minutes per day) and those
in the 10th percentile (less than two minutes per day) of time spent reading
outside of school.xxviii These two recent classics in the educational research
literature show the magnitude of the interventions that are necessary in order
to provide equal experience in school, equal opportunity in the labor force,
and personal enrichment through academic study for all young people in
metro Shreveport-Bossier City.
www.stepforwardnla.org Page 36
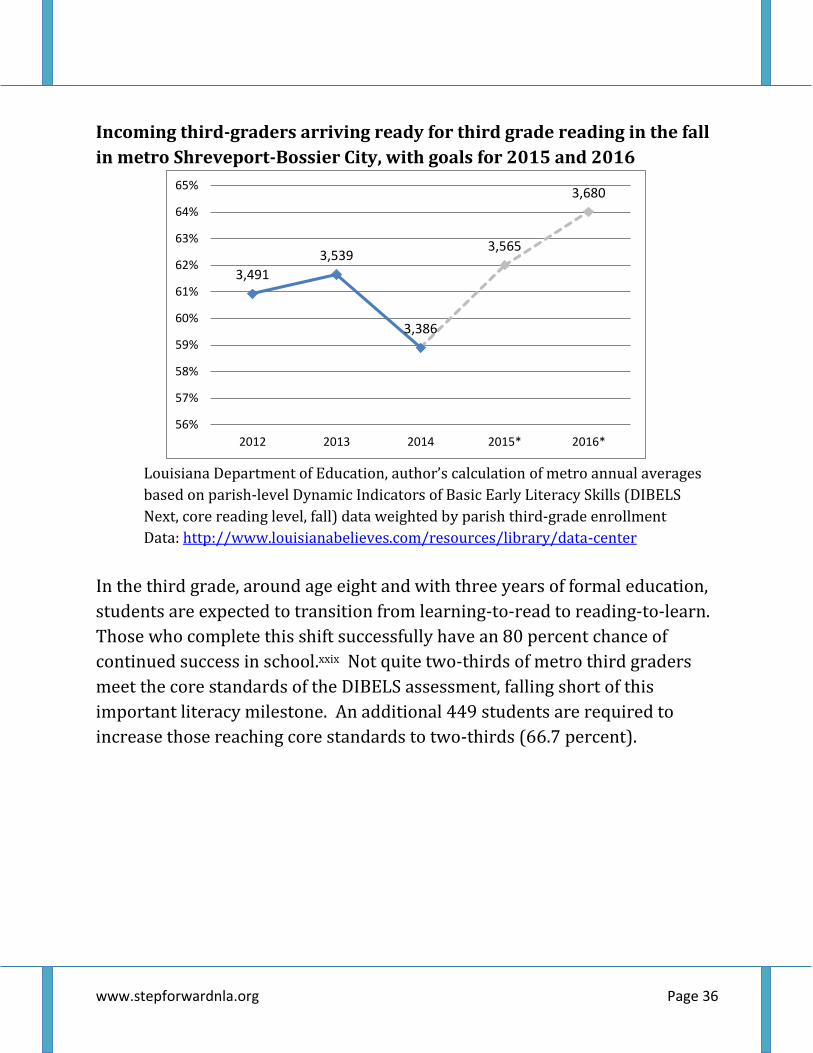
Incoming third-graders arriving ready for third grade reading in the fall
in metro Shreveport-Bossier City, with goals for 2015 and 2016
Louisiana Department of Education, author’s calculation of metro annual averages
based on parish-level Dynamic Indicators of Basic Early Literacy Skills (DIBELS
Next, core reading level, fall) data weighted by parish third-grade enrollment
Data: http://www.louisianabelieves.com/resources/library/data-center
In the third grade, around age eight and with three years of formal education,
students are expected to transition from learning-to-read to reading-to-learn.
Those who complete this shift successfully have an 80 percent chance of
continued success in school.xxix Not quite two-thirds of metro third graders
meet the core standards of the DIBELS assessment, falling short of this
important literacy milestone. An additional 449 students are required to
increase those reaching core standards to two-thirds (66.7 percent).
3,491
3,539
3,386
3,565
3,680
56%
57%
58%
59%
60%
61%
62%
63%
64%
65%
2012 2013 2014 2015* 2016*
www.stepforwardnla.org Page 37
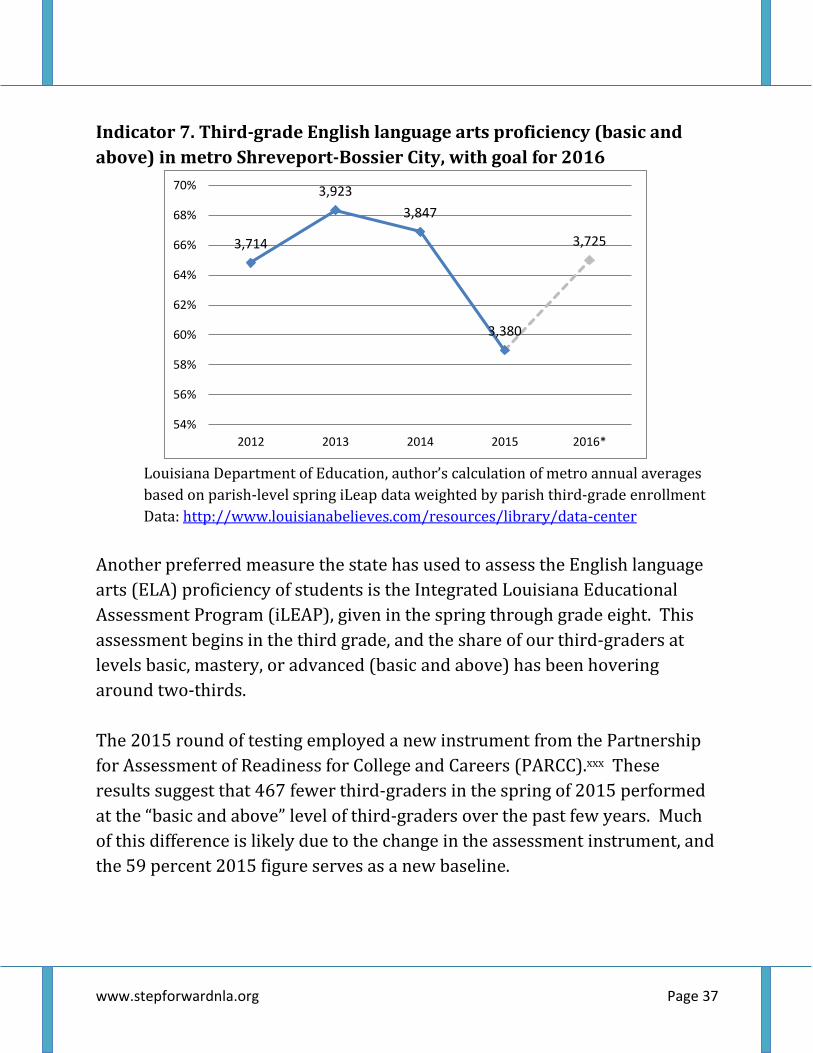
Indicator 7. Third-grade English language arts proficiency (basic and
above) in metro Shreveport-Bossier City, with goal for 2016
Louisiana Department of Education, author’s calculation of metro annual averages
based on parish-level spring iLeap data weighted by parish third-grade enrollment
Data: http://www.louisianabelieves.com/resources/library/data-center
Another preferred measure the state has used to assess the English language
arts (ELA) proficiency of students is the Integrated Louisiana Educational
Assessment Program (iLEAP), given in the spring through grade eight. This
assessment begins in the third grade, and the share of our third-graders at
levels basic, mastery, or advanced (basic and above) has been hovering
around two-thirds.
The 2015 round of testing employed a new instrument from the Partnership
for Assessment of Readiness for College and Careers (PARCC).xxx These
results suggest that 467 fewer third-graders in the spring of 2015 performed
at the “basic and above” level of third-graders over the past few years. Much
of this difference is likely due to the change in the assessment instrument, and
the 59 percent 2015 figure serves as a new baseline.
3,714
3,923
3,847
3,380
3,725
54%
56%
58%
60%
62%
64%
66%
68%
70%
2012 2013 2014 2015 2016*
www.stepforwardnla.org Page 38
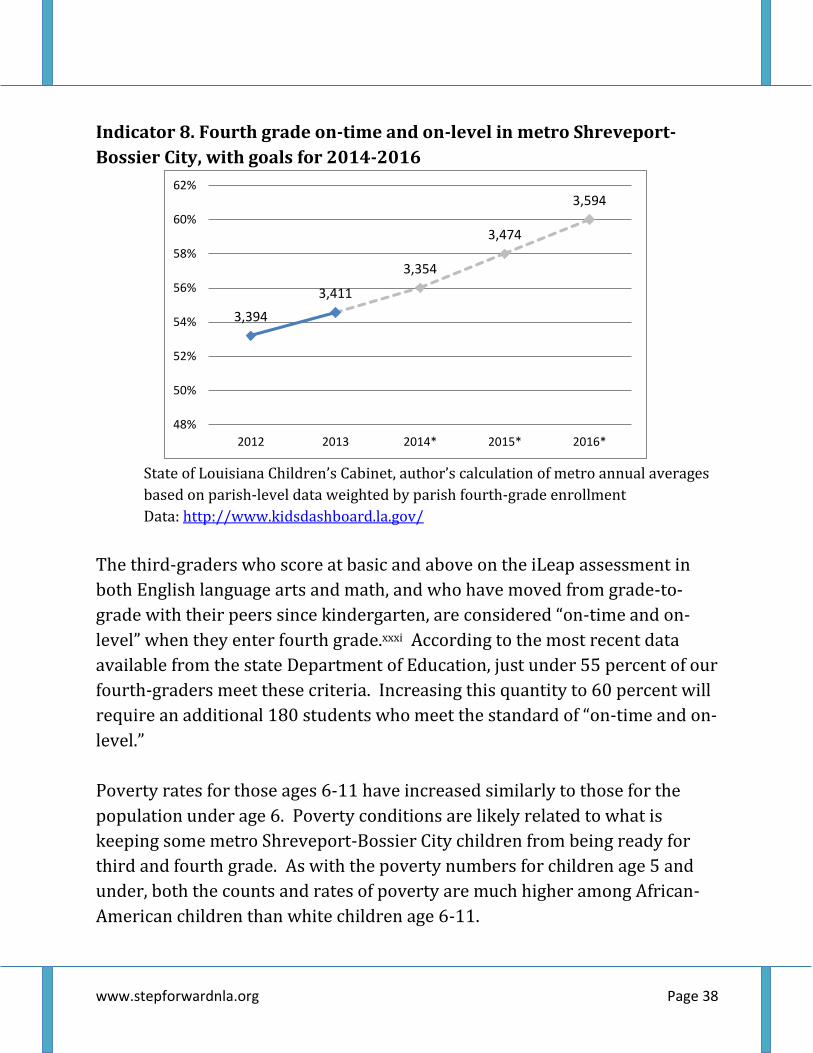
Indicator 8. Fourth grade on-time and on-level in metro Shreveport-
Bossier City, with goals for 2014-2016
State of Louisiana Children’s Cabinet, author’s calculation of metro annual averages
based on parish-level data weighted by parish fourth-grade enrollment
Data: http://www.kidsdashboard.la.gov/
The third-graders who score at basic and above on the iLeap assessment in
both English language arts and math, and who have moved from grade-to-
grade with their peers since kindergarten, are considered “on-time and on-
level” when they enter fourth grade.xxxi According to the most recent data
available from the state Department of Education, just under 55 percent of our
fourth-graders meet these criteria. Increasing this quantity to 60 percent will
require an additional 180 students who meet the standard of “on-time and on-
level.”
Poverty rates for those ages 6-11 have increased similarly to those for the
population under age 6. Poverty conditions are likely related to what is
keeping some metro Shreveport-Bossier City children from being ready for
third and fourth grade. As with the poverty numbers for children age 5 and
under, both the counts and rates of poverty are much higher among African-
American children than white children age 6-11.
3,394
3,411
3,354
3,474
3,594
48%
50%
52%
54%
56%
58%
60%
62%
2012 2013 2014* 2015* 2016*
www.stepforwardnla.org Page 39
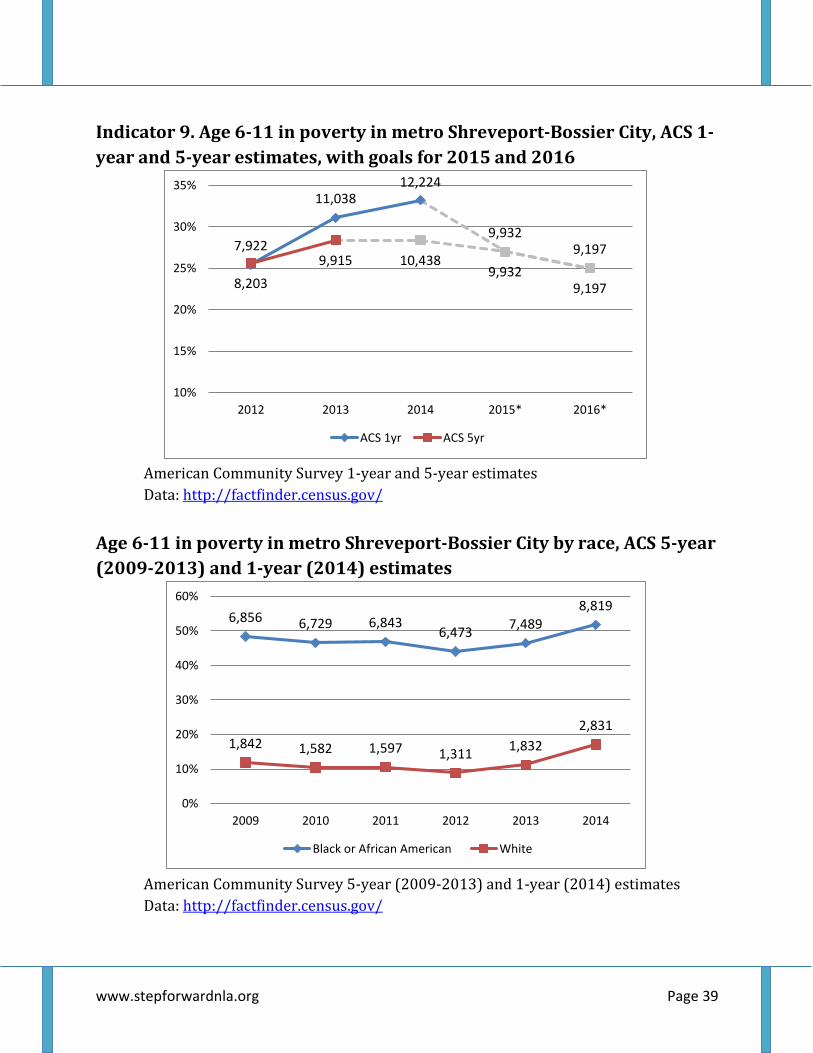
Indicator 9. Age 6-11 in poverty in metro Shreveport-Bossier City, ACS 1-
year and 5-year estimates, with goals for 2015 and 2016
American Community Survey 1-year and 5-year estimates
Data: http://factfinder.census.gov/
Age 6-11 in poverty in metro Shreveport-Bossier City by race, ACS 5-year
(2009-2013) and 1-year (2014) estimates
American Community Survey 5-year (2009-2013) and 1-year (2014) estimates
Data: http://factfinder.census.gov/
7,922
11,03812,224
9,9329,197
8,203
9,915 10,4389,932
9,197
10%
15%
20%
25%
30%
35%
2012 2013 2014 2015* 2016*
ACS 1yr ACS 5yr
6,856 6,729 6,8436,473
7,489
8,819
1,842 1,582 1,597 1,3111,832
2,831
0%
10%
20%
30%
40%
50%
60%
2009 2010 2011 2012 2013 2014
Black or African American White
www.stepforwardnla.org Page 40
Youth Civic Development – My Brother’s Keeper
When individuals age into the teenage years, they begin to experience more
personal freedom by making more decisions for themselves. The earliest
behavioral interventions occur in the home and in the school. Some later
require interventions of a kind beyond the capabilities of most parents and
teachers.
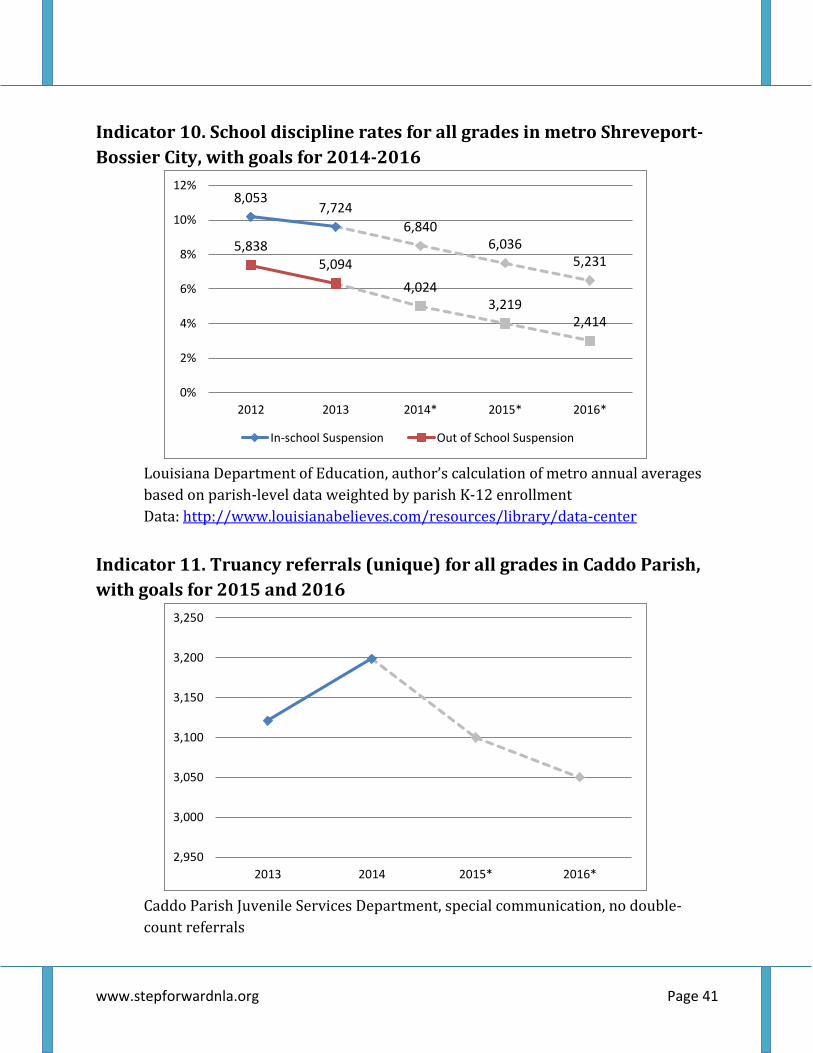
Our community sees about 3,000 truancies, 1,000 school dropouts and 2,000
idle teens per year, with 315 Shreveport Police Department arrests for
stealing and 871 for fighting in 2014. Although both violent and property
crime rates are generally low these days compared to the 2000s (and much
lower than their peaks in the 80s and 90s), the goal will be to build upon past
success and work toward reducing them further. Suspensions are on the
decline. Reducing truancy is likely to reduce stealing, fighting, and leaving
school before graduating. Improvements in the average ACT score may be an
additional positive outcome of increased school attendance.
www.stepforwardnla.org Page 41
Indicator 10. School discipline rates for all grades in metro Shreveport-
Bossier City, with goals for 2014-2016
Louisiana Department of Education, author’s calculation of metro annual averages
based on parish-level data weighted by parish K-12 enrollment
Data: http://www.louisianabelieves.com/resources/library/data-center
Indicator 11. Truancy referrals (unique) for all grades in Caddo Parish,
with goals for 2015 and 2016
Caddo Parish Juvenile Services Department, special communication, no double-
count referrals
8,0537,724
6,8406,036
5,2315,838
5,094
4,0243,219
2,414
0%
2%
4%
6%
8%
10%
12%
2012 2013 2014* 2015* 2016*
In-school Suspension Out of School Suspension
2,950
3,000
3,050
3,100
3,150
3,200
3,250
2013 2014 2015* 2016*

www.stepforwardnla.org Page 42
A recent journal article from researchers at Michigan and Texas A&M looks at
reasons for high school dropout over the past half century using seven
nationally representative studies from 1955 to 2002 (Doll et al. 2013).xxxii
They follow a framework that classifies reasons for dropping out of school as
push, pull, or falling out factors. Push factors include “tests, attendance and
discipline policies, and even consequences of poor behavior.” Pull factors
include “financial worries, out-of-school employment, family needs, or even
family changes such as marriage or childbirth,” or illness. Falling out of school
“occurs when a student does not show significant academic progress in
schoolwork and becomes apathetic or even disillusioned with school
completion.”
In studies from the 1950s to the 1980s students report most often that they
were pulled away from school, often by work or family (60 percent in 1955).
In the most recent study, these and other pull factors were the cause for
dropout for only 37 percent of those who left school. Push factors were the
most common cause, at 49 percent, and falling out factors were the cause for
14 percent. The top three ranked reasons (and overall frequency percentage)
were: “missed too many days of school” (43.5), “thought it would be easier to
get a GED” (40.5), and “was getting poor grades/failing school” (38). Two of
these are push factors (GED is a pull factor). Possible explanations according
to the authors include the higher bar for students beginning with the
standards movement and changing societal expectations as more individuals
now complete high school.
www.stepforwardnla.org Page 43
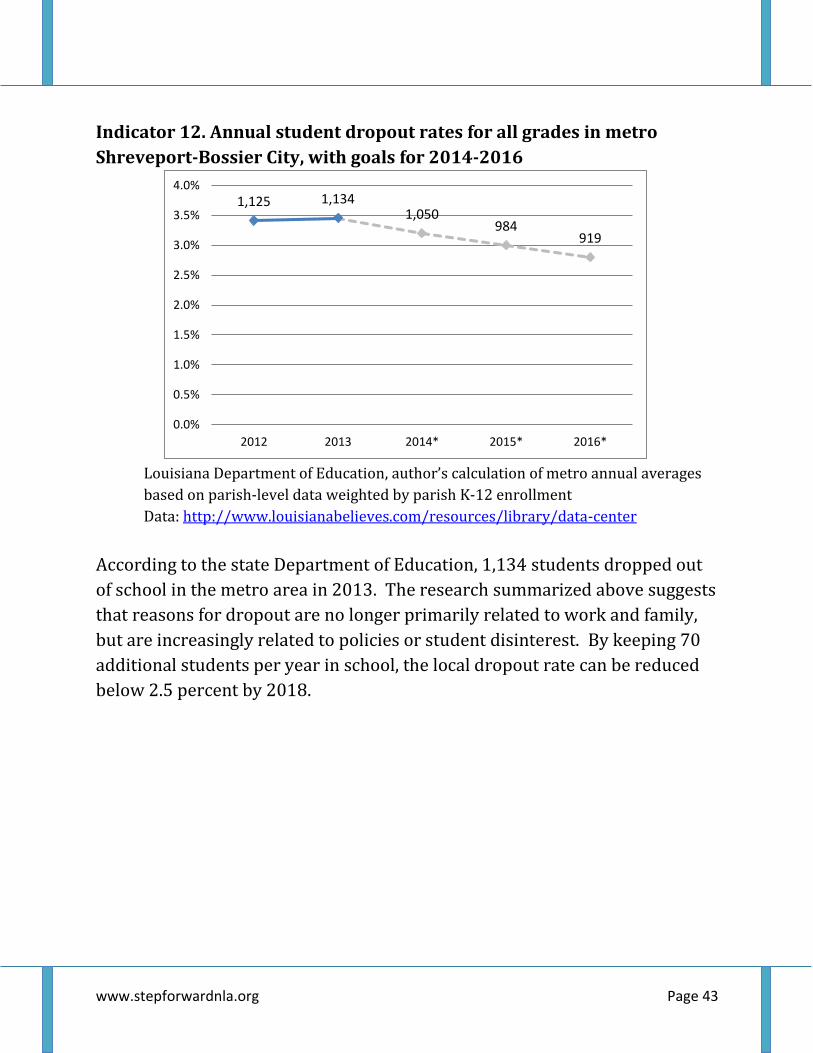
Indicator 12. Annual student dropout rates for all grades in metro
Shreveport-Bossier City, with goals for 2014-2016
Louisiana Department of Education, author’s calculation of metro annual averages
based on parish-level data weighted by parish K-12 enrollment
Data: http://www.louisianabelieves.com/resources/library/data-center
According to the state Department of Education, 1,134 students dropped out
of school in the metro area in 2013. The research summarized above suggests
that reasons for dropout are no longer primarily related to work and family,
but are increasingly related to policies or student disinterest. By keeping 70
additional students per year in school, the local dropout rate can be reduced
below 2.5 percent by 2018.
1,125 1,1341,050
984919
0.0%
0.5%
1.0%
1.5%
2.0%
2.5%
3.0%
3.5%
4.0%
2012 2013 2014* 2015* 2016*
www.stepforwardnla.org Page 44
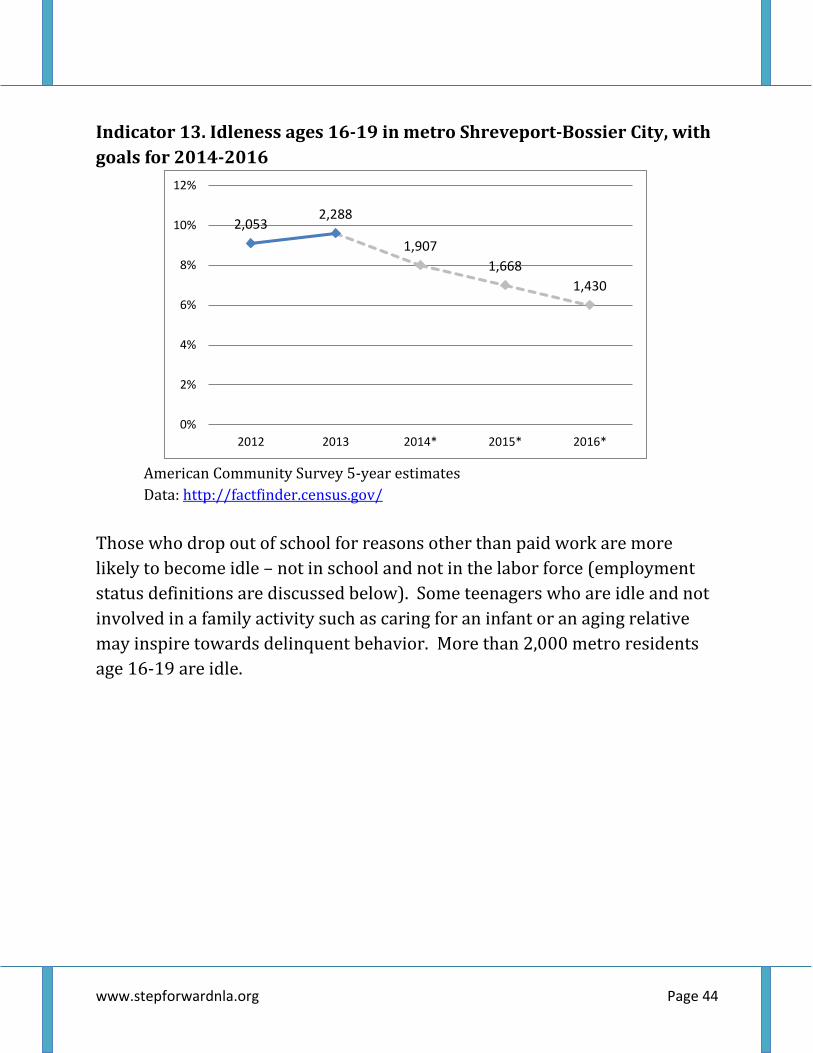
Indicator 13. Idleness ages 16-19 in metro Shreveport-Bossier City, with
goals for 2014-2016
American Community Survey 5-year estimates
Data: http://factfinder.census.gov/
Those who drop out of school for reasons other than paid work are more
likely to become idle – not in school and not in the labor force (employment
status definitions are discussed below). Some teenagers who are idle and not
involved in a family activity such as caring for an infant or an aging relative
may inspire towards delinquent behavior. More than 2,000 metro residents
age 16-19 are idle.
2,0532,288
1,907
1,668
1,430
0%
2%
4%
6%
8%
10%
12%
2012 2013 2014* 2015* 2016*
www.stepforwardnla.org Page 45
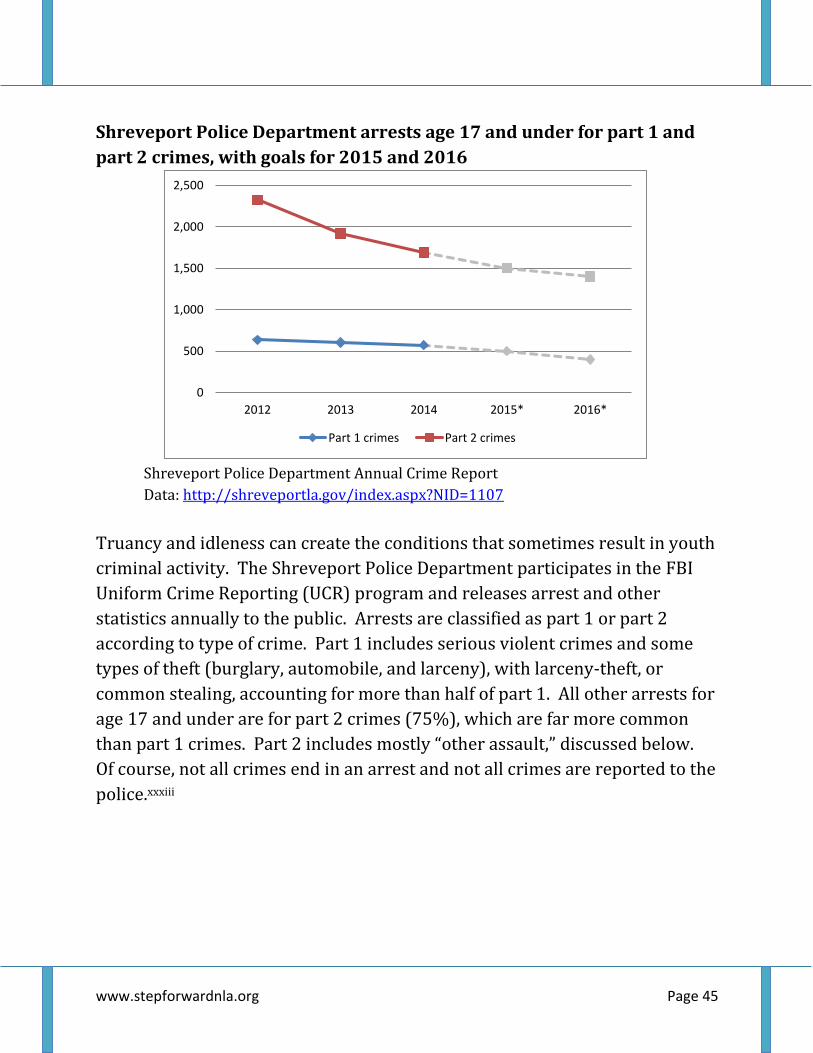
Shreveport Police Department arrests age 17 and under for part 1 and
part 2 crimes, with goals for 2015 and 2016
Shreveport Police Department Annual Crime Report
Data: http://shreveportla.gov/index.aspx?NID=1107
Truancy and idleness can create the conditions that sometimes result in youth
criminal activity. The Shreveport Police Department participates in the FBI
Uniform Crime Reporting (UCR) program and releases arrest and other
statistics annually to the public. Arrests are classified as part 1 or part 2
according to type of crime. Part 1 includes serious violent crimes and some
types of theft (burglary, automobile, and larceny), with larceny-theft, or
common stealing, accounting for more than half of part 1. All other arrests for
age 17 and under are for part 2 crimes (75%), which are far more common
than part 1 crimes. Part 2 includes mostly “other assault,” discussed below.
Of course, not all crimes end in an arrest and not all crimes are reported to the
police.xxxiii
0
500
1,000
1,500
2,000
2,500
2012 2013 2014 2015* 2016*
Part 1 crimes Part 2 crimes
www.stepforwardnla.org Page 46
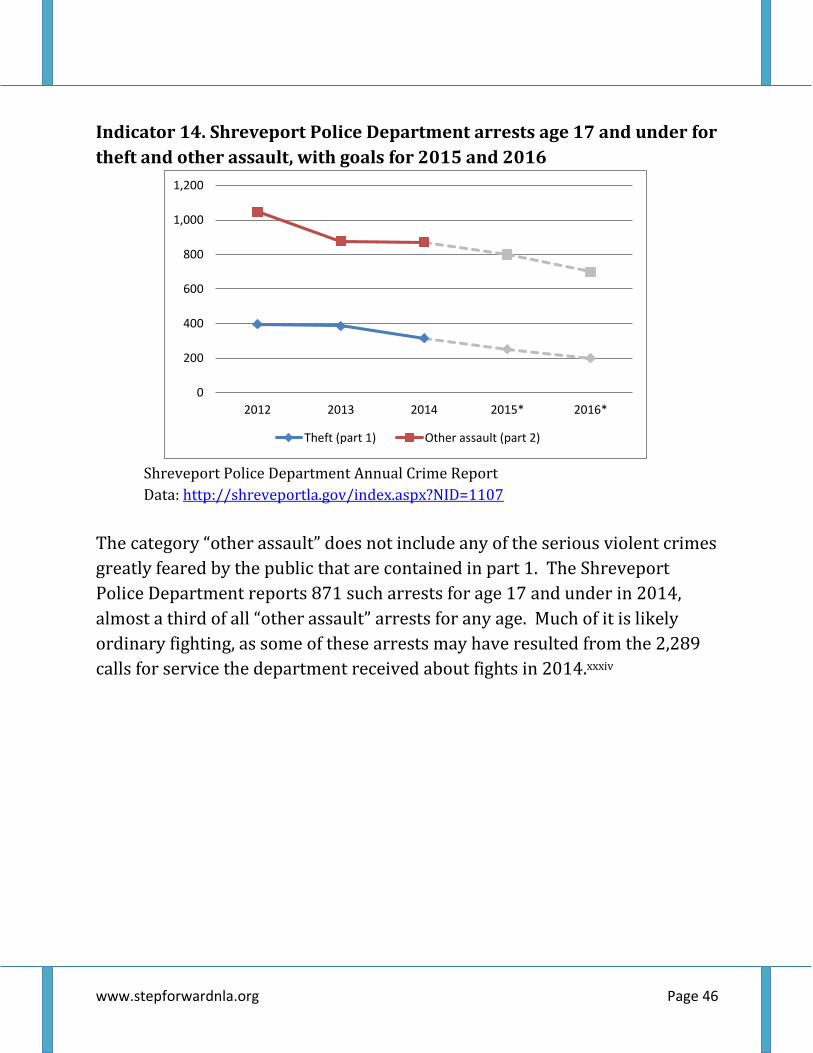
Indicator 14. Shreveport Police Department arrests age 17 and under for
theft and other assault, with goals for 2015 and 2016
Shreveport Police Department Annual Crime Report
Data: http://shreveportla.gov/index.aspx?NID=1107
The category “other assault” does not include any of the serious violent crimes
greatly feared by the public that are contained in part 1. The Shreveport
Police Department reports 871 such arrests for age 17 and under in 2014,
almost a third of all “other assault” arrests for any age. Much of it is likely
ordinary fighting, as some of these arrests may have resulted from the 2,289
calls for service the department received about fights in 2014.xxxiv
0
200
400
600
800
1,000
1,200
2012 2013 2014 2015* 2016*
Theft (part 1) Other assault (part 2)
www.stepforwardnla.org Page 47
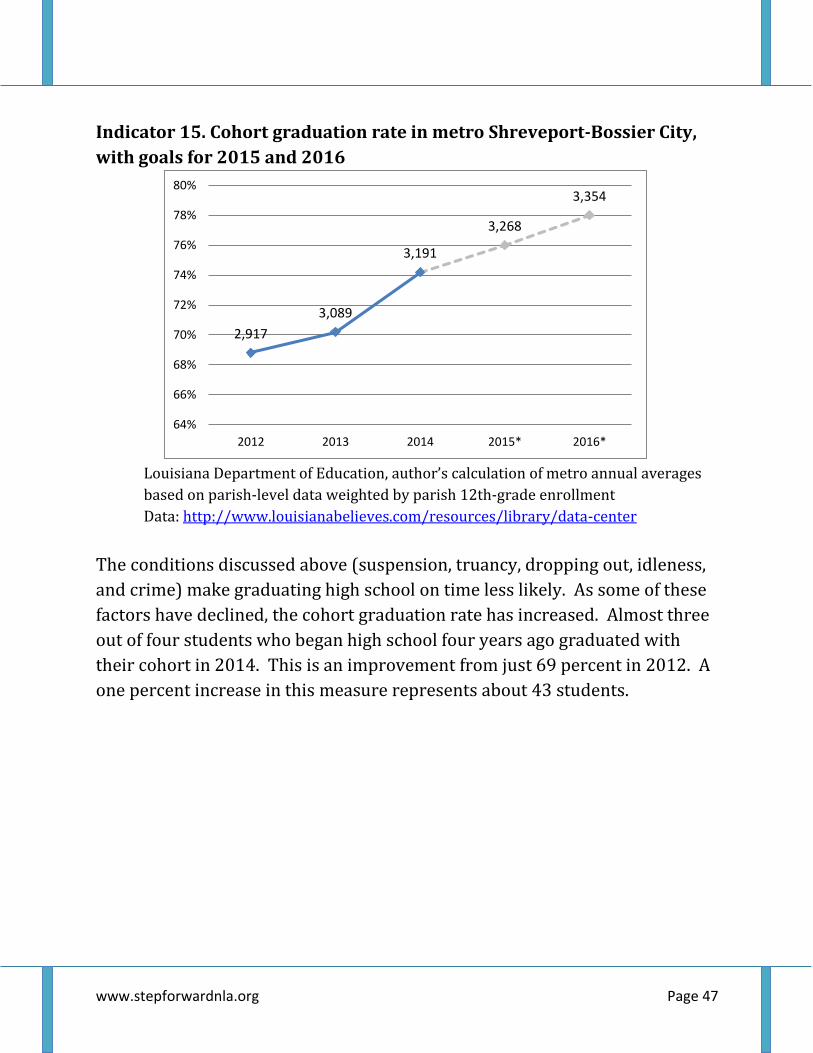
Indicator 15. Cohort graduation rate in metro Shreveport-Bossier City,
with goals for 2015 and 2016
Louisiana Department of Education, author’s calculation of metro annual averages
based on parish-level data weighted by parish 12th-grade enrollment
Data: http://www.louisianabelieves.com/resources/library/data-center
The conditions discussed above (suspension, truancy, dropping out, idleness,
and crime) make graduating high school on time less likely. As some of these
factors have declined, the cohort graduation rate has increased. Almost three
out of four students who began high school four years ago graduated with
their cohort in 2014. This is an improvement from just 69 percent in 2012. A
one percent increase in this measure represents about 43 students.
2,917
3,089
3,191
3,268
3,354
64%
66%
68%
70%
72%
74%
76%
78%
80%
2012 2013 2014 2015* 2016*
www.stepforwardnla.org Page 48
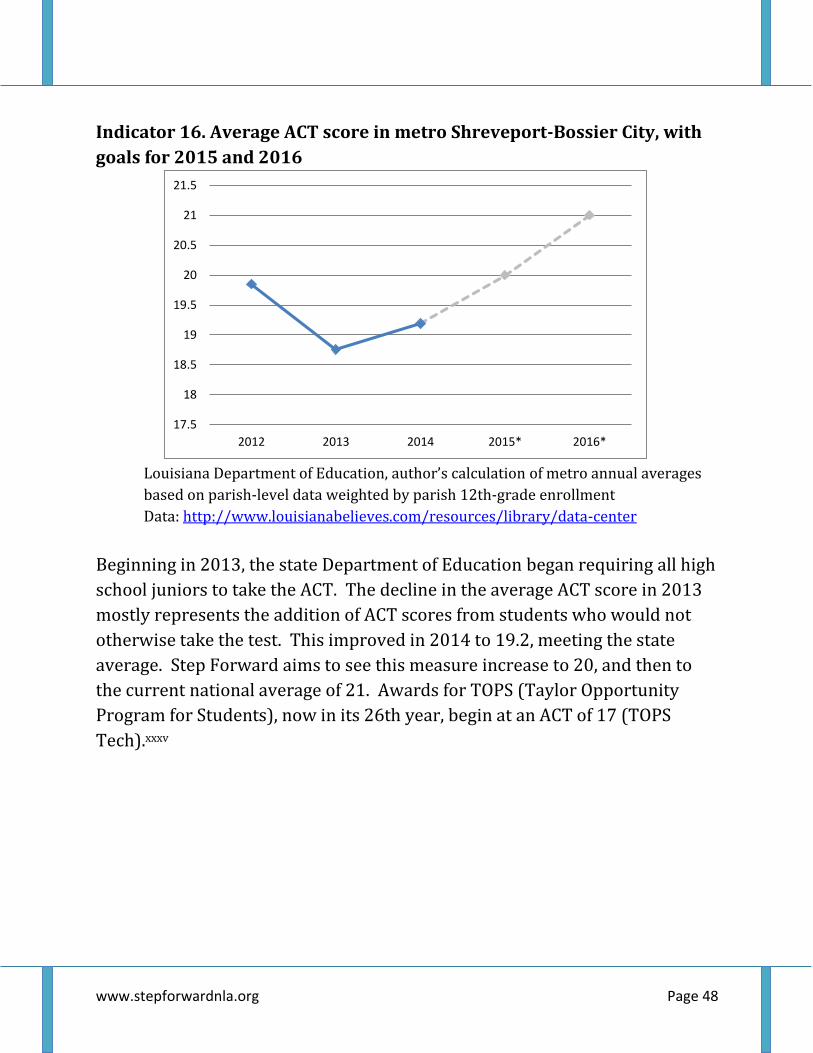
Indicator 16. Average ACT score in metro Shreveport-Bossier City, with
goals for 2015 and 2016
Louisiana Department of Education, author’s calculation of metro annual averages
based on parish-level data weighted by parish 12th-grade enrollment
Data: http://www.louisianabelieves.com/resources/library/data-center
Beginning in 2013, the state Department of Education began requiring all high
school juniors to take the ACT. The decline in the average ACT score in 2013
mostly represents the addition of ACT scores from students who would not
otherwise take the test. This improved in 2014 to 19.2, meeting the state
average. Step Forward aims to see this measure increase to 20, and then to
the current national average of 21. Awards for TOPS (Taylor Opportunity
Program for Students), now in its 26th year, begin at an ACT of 17 (TOPS
Tech).xxxv
17.5
18
18.5
19
19.5
20
20.5
21
21.5
2012 2013 2014 2015* 2016*
www.stepforwardnla.org Page 49
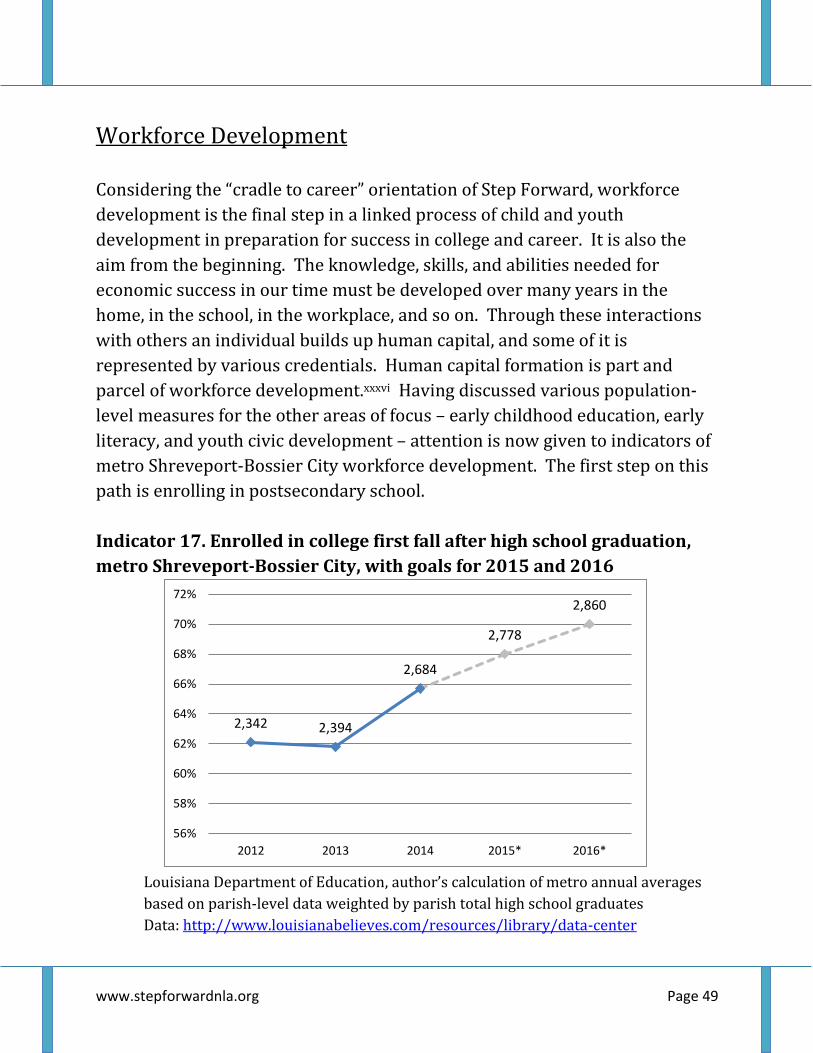
Workforce Development
Considering the “cradle to career” orientation of Step Forward, workforce
development is the final step in a linked process of child and youth
development in preparation for success in college and career. It is also the
aim from the beginning. The knowledge, skills, and abilities needed for
economic success in our time must be developed over many years in the
home, in the school, in the workplace, and so on. Through these interactions
with others an individual builds up human capital, and some of it is
represented by various credentials. Human capital formation is part and
parcel of workforce development.xxxvi Having discussed various population-
level measures for the other areas of focus – early childhood education, early
literacy, and youth civic development – attention is now given to indicators of
metro Shreveport-Bossier City workforce development. The first step on this
path is enrolling in postsecondary school.
Indicator 17. Enrolled in college first fall after high school graduation,
metro Shreveport-Bossier City, with goals for 2015 and 2016
Louisiana Department of Education, author’s calculation of metro annual averages
based on parish-level data weighted by parish total high school graduates
Data: http://www.louisianabelieves.com/resources/library/data-center
2,342 2,394
2,684
2,778
2,860
56%
58%
60%
62%
64%
66%
68%
70%
72%
2012 2013 2014 2015* 2016*
www.stepforwardnla.org Page 50
According to the state Department of Education, about two-thirds of metro
high school graduates are going directly into college the following fall. This is
an increase over previous years, and each percent increase from here would
take about 41 additional students.
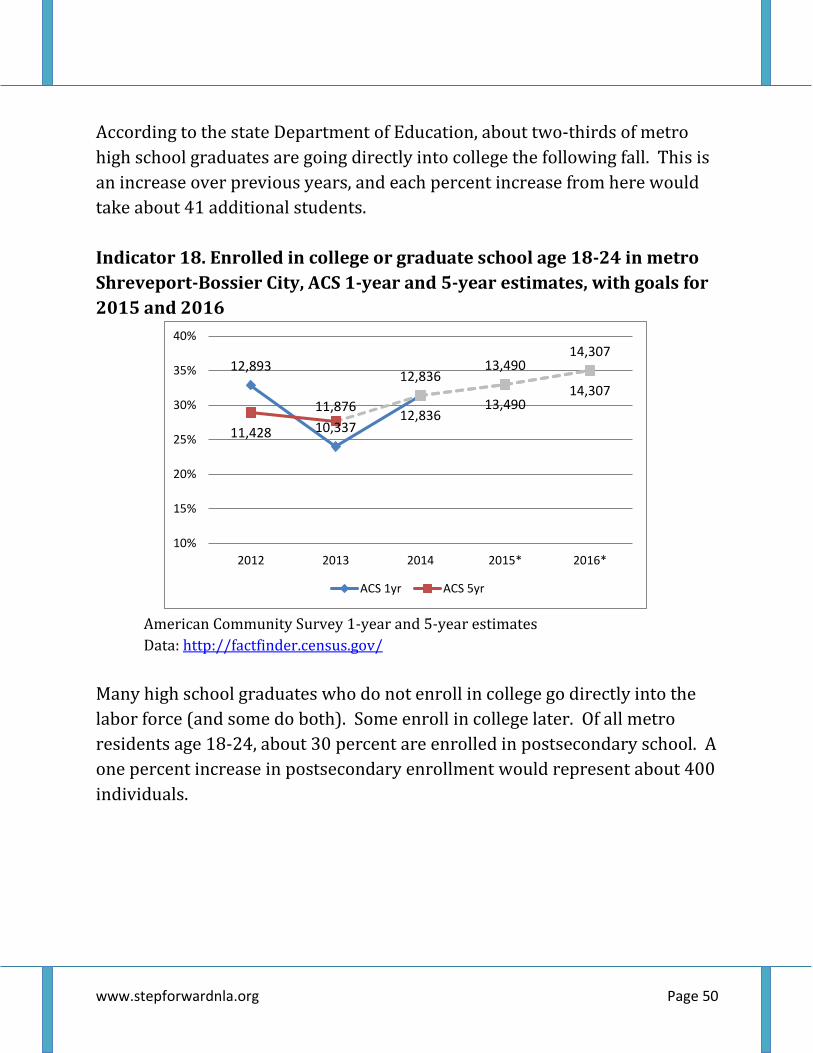
Indicator 18. Enrolled in college or graduate school age 18-24 in metro
Shreveport-Bossier City, ACS 1-year and 5-year estimates, with goals for
2015 and 2016
American Community Survey 1-year and 5-year estimates
Data: http://factfinder.census.gov/
Many high school graduates who do not enroll in college go directly into the
labor force (and some do both). Some enroll in college later. Of all metro
residents age 18-24, about 30 percent are enrolled in postsecondary school. A
one percent increase in postsecondary enrollment would represent about 400
individuals.
12,893
10,337
12,83613,490
14,307
11,428
11,87612,836
13,49014,307
10%
15%
20%
25%
30%
35%
40%
2012 2013 2014 2015* 2016*
ACS 1yr ACS 5yr
www.stepforwardnla.org Page 51
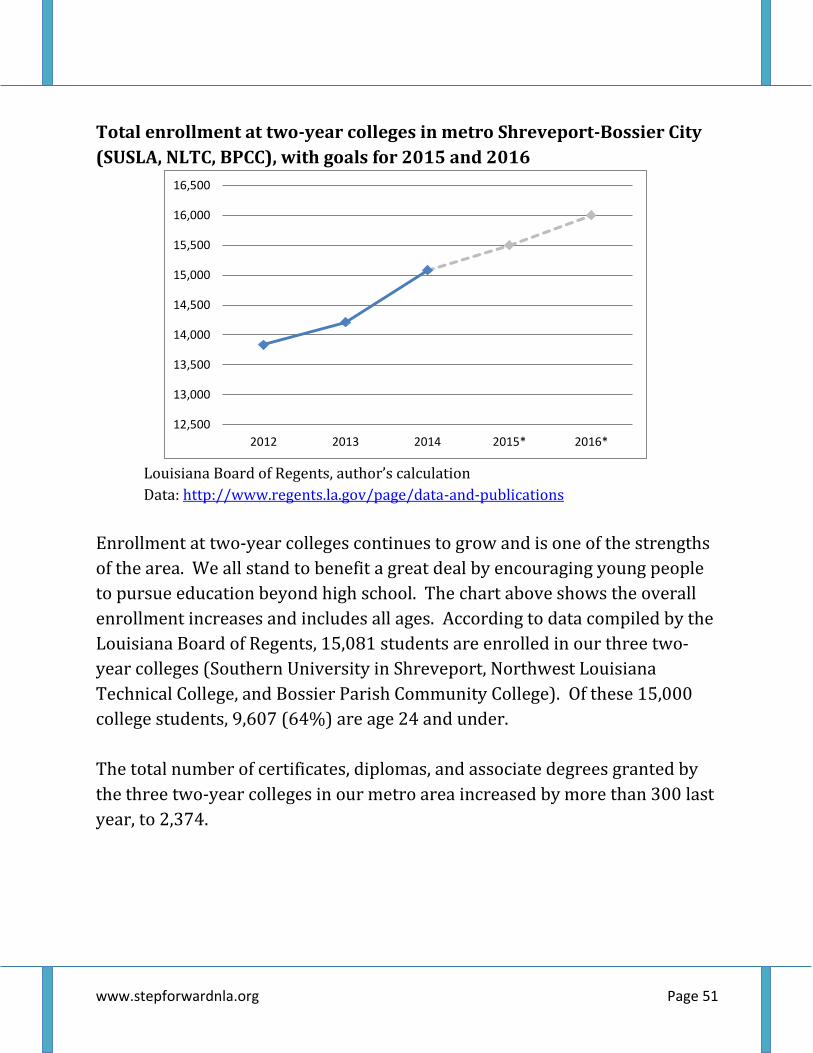
Total enrollment at two-year colleges in metro Shreveport-Bossier City
(SUSLA, NLTC, BPCC), with goals for 2015 and 2016
Louisiana Board of Regents, author’s calculation
Data: http://www.regents.la.gov/page/data-and-publications
Enrollment at two-year colleges continues to grow and is one of the strengths
of the area. We all stand to benefit a great deal by encouraging young people
to pursue education beyond high school. The chart above shows the overall
enrollment increases and includes all ages. According to data compiled by the
Louisiana Board of Regents, 15,081 students are enrolled in our three two-
year colleges (Southern University in Shreveport, Northwest Louisiana
Technical College, and Bossier Parish Community College). Of these 15,000
college students, 9,607 (64%) are age 24 and under.
The total number of certificates, diplomas, and associate degrees granted by
the three two-year colleges in our metro area increased by more than 300 last
year, to 2,374.
12,500
13,000
13,500
14,000
14,500
15,000
15,500
16,000
16,500
2012 2013 2014 2015* 2016*
www.stepforwardnla.org Page 52
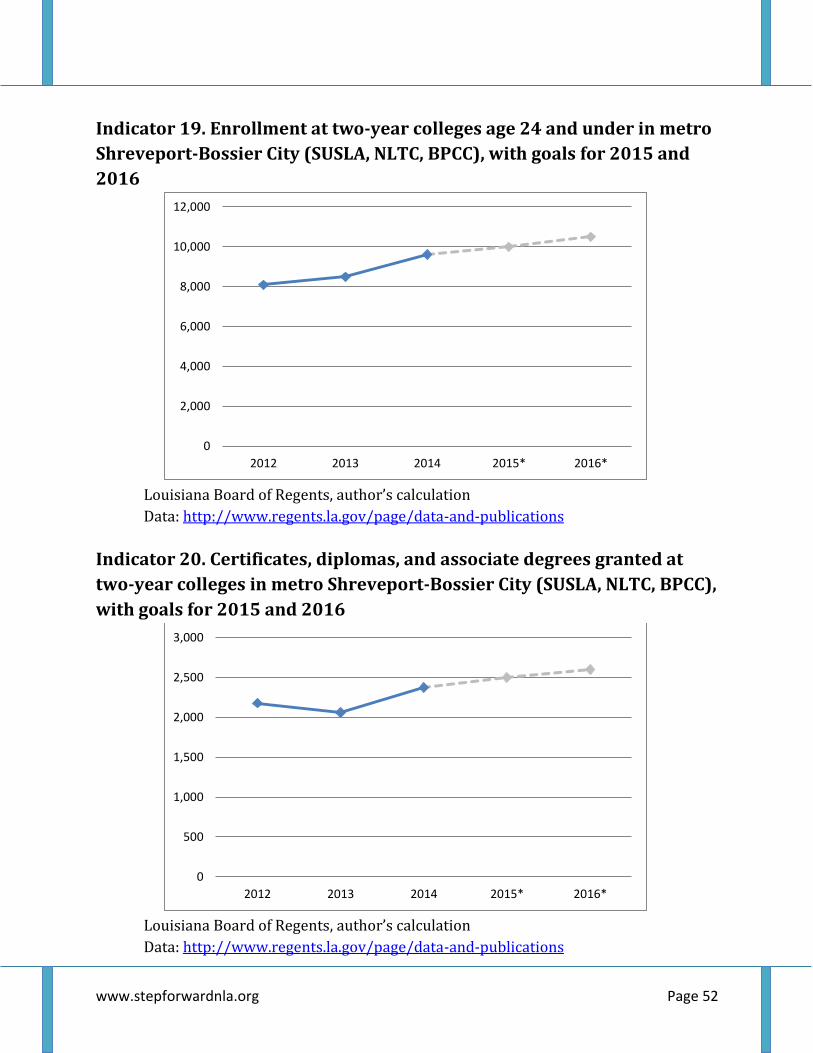
Indicator 19. Enrollment at two-year colleges age 24 and under in metro
Shreveport-Bossier City (SUSLA, NLTC, BPCC), with goals for 2015 and
2016
Louisiana Board of Regents, author’s calculation
Data: http://www.regents.la.gov/page/data-and-publications
Indicator 20. Certificates, diplomas, and associate degrees granted at
two-year colleges in metro Shreveport-Bossier City (SUSLA, NLTC, BPCC),
with goals for 2015 and 2016
Louisiana Board of Regents, author’s calculation
Data: http://www.regents.la.gov/page/data-and-publications
0
2,000
4,000
6,000
8,000
10,000
12,000
2012 2013 2014 2015* 2016*
0
500
1,000
1,500
2,000
2,500
3,000
2012 2013 2014 2015* 2016*
www.stepforwardnla.org Page 53
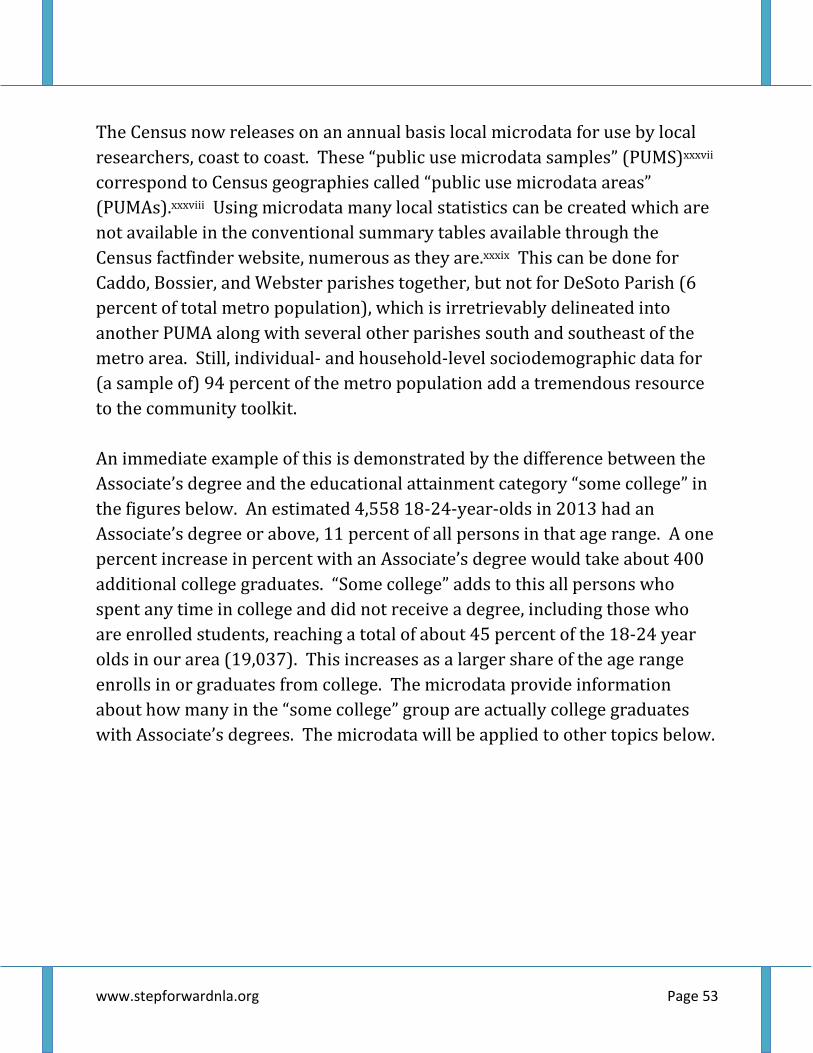
The Census now releases on an annual basis local microdata for use by local
researchers, coast to coast. These “public use microdata samples” (PUMS)xxxvii
correspond to Census geographies called “public use microdata areas”
(PUMAs).xxxviii Using microdata many local statistics can be created which are
not available in the conventional summary tables available through the
Census factfinder website, numerous as they are.xxxix This can be done for
Caddo, Bossier, and Webster parishes together, but not for DeSoto Parish (6
percent of total metro population), which is irretrievably delineated into
another PUMA along with several other parishes south and southeast of the
metro area. Still, individual- and household-level sociodemographic data for
(a sample of) 94 percent of the metro population add a tremendous resource
to the community toolkit.
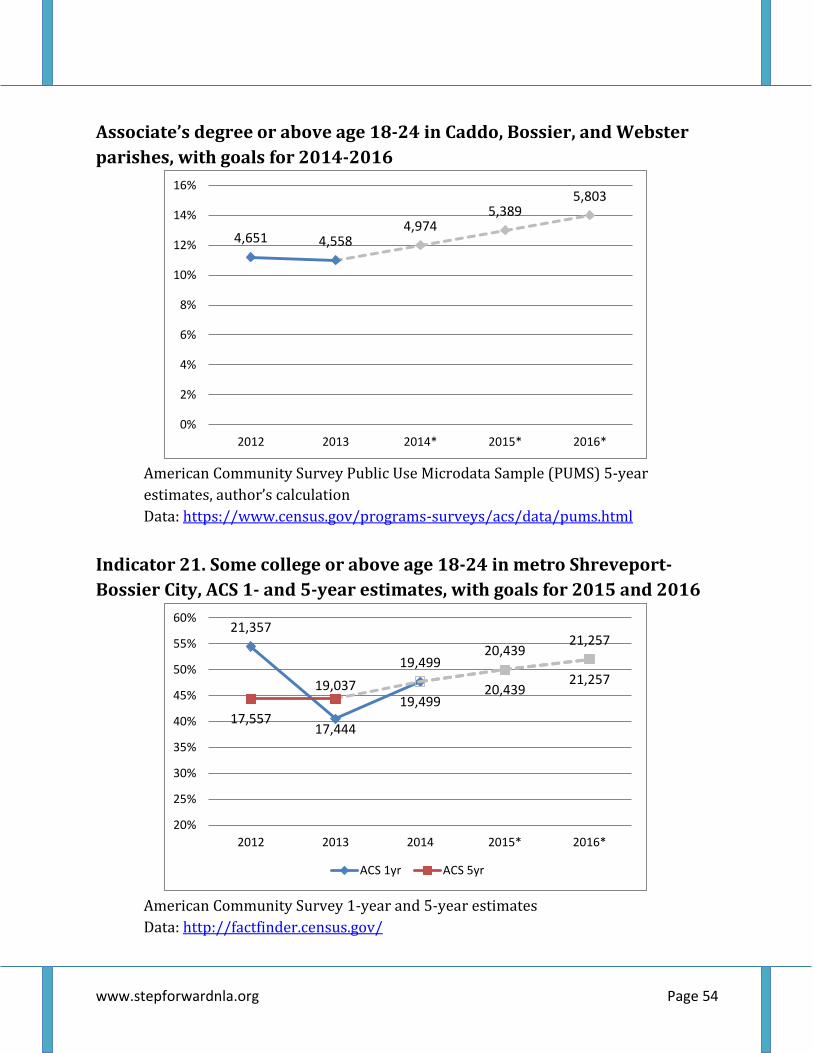
An immediate example of this is demonstrated by the difference between the
Associate’s degree and the educational attainment category “some college” in
the figures below. An estimated 4,558 18-24-year-olds in 2013 had an
Associate’s degree or above, 11 percent of all persons in that age range. A one
percent increase in percent with an Associate’s degree would take about 400
additional college graduates. “Some college” adds to this all persons who
spent any time in college and did not receive a degree, including those who
are enrolled students, reaching a total of about 45 percent of the 18-24 year
olds in our area (19,037). This increases as a larger share of the age range
enrolls in or graduates from college. The microdata provide information
about how many in the “some college” group are actually college graduates
with Associate’s degrees. The microdata will be applied to other topics below.
www.stepforwardnla.org Page 54
Associate’s degree or above age 18-24 in Caddo, Bossier, and Webster
parishes, with goals for 2014-2016
American Community Survey Public Use Microdata Sample (PUMS) 5-year
estimates, author’s calculation
Data: https://www.census.gov/programs-surveys/acs/data/pums.html
Indicator 21. Some college or above age 18-24 in metro Shreveport-
Bossier City, ACS 1- and 5-year estimates, with goals for 2015 and 2016
American Community Survey 1-year and 5-year estimates
Data: http://factfinder.census.gov/
4,651 4,5584,974
5,3895,803
0%
2%
4%
6%
8%
10%
12%
14%
16%
2012 2013 2014* 2015* 2016*
21,357
17,444
19,49920,439
21,257
17,557
19,03719,499
20,43921,257
20%
25%
30%
35%
40%
45%
50%
55%
60%
2012 2013 2014 2015* 2016*
ACS 1yr ACS 5yr
www.stepforwardnla.org Page 55
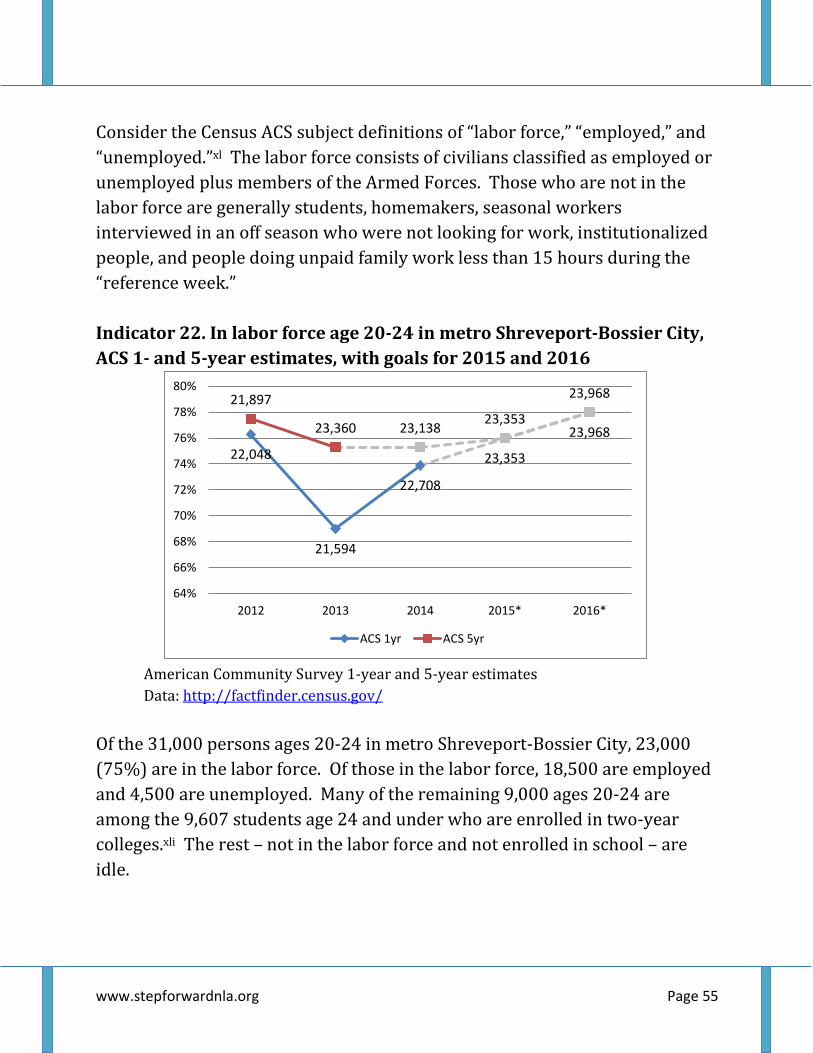
Consider the Census ACS subject definitions of “labor force,” “employed,” and
“unemployed.”xl The labor force consists of civilians classified as employed or
unemployed plus members of the Armed Forces. Those who are not in the
labor force are generally students, homemakers, seasonal workers
interviewed in an off season who were not looking for work, institutionalized
people, and people doing unpaid family work less than 15 hours during the
“reference week.”
Indicator 22. In labor force age 20-24 in metro Shreveport-Bossier City,
ACS 1- and 5-year estimates, with goals for 2015 and 2016
American Community Survey 1-year and 5-year estimates
Data: http://factfinder.census.gov/
Of the 31,000 persons ages 20-24 in metro Shreveport-Bossier City, 23,000
(75%) are in the labor force. Of those in the labor force, 18,500 are employed
and 4,500 are unemployed. Many of the remaining 9,000 ages 20-24 are
among the 9,607 students age 24 and under who are enrolled in two-year
colleges.xli The rest – not in the labor force and not enrolled in school – are
idle.
22,048
21,594
22,708
23,353
23,968
21,897
23,360 23,13823,353
23,968
64%
66%
68%
70%
72%
74%
76%
78%
80%
2012 2013 2014 2015* 2016*
ACS 1yr ACS 5yr
www.stepforwardnla.org Page 56
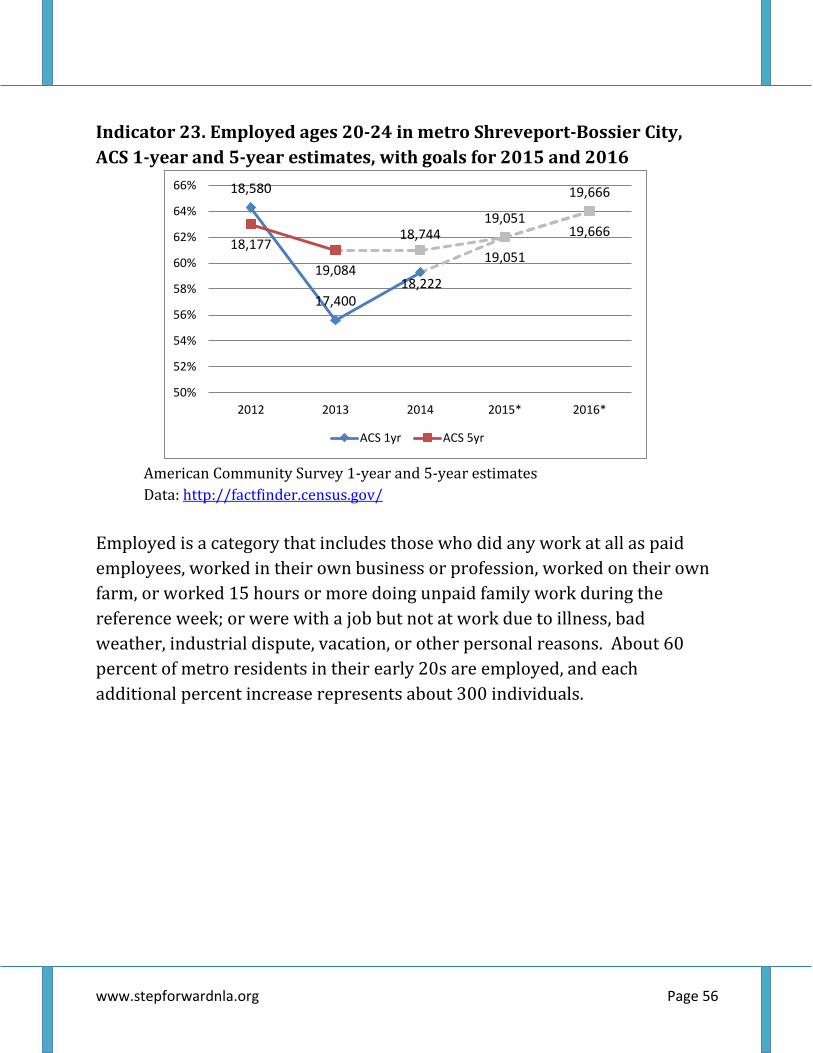
Indicator 23. Employed ages 20-24 in metro Shreveport-Bossier City,
ACS 1-year and 5-year estimates, with goals for 2015 and 2016
American Community Survey 1-year and 5-year estimates
Data: http://factfinder.census.gov/
Employed is a category that includes those who did any work at all as paid
employees, worked in their own business or profession, worked on their own
farm, or worked 15 hours or more doing unpaid family work during the
reference week; or were with a job but not at work due to illness, bad
weather, industrial dispute, vacation, or other personal reasons. About 60
percent of metro residents in their early 20s are employed, and each
additional percent increase represents about 300 individuals.
18,580
17,40018,222
19,051
19,666
18,177
19,084
18,744
19,051
19,666
50%
52%
54%
56%
58%
60%
62%
64%
66%
2012 2013 2014 2015* 2016*
ACS 1yr ACS 5yr
www.stepforwardnla.org Page 57
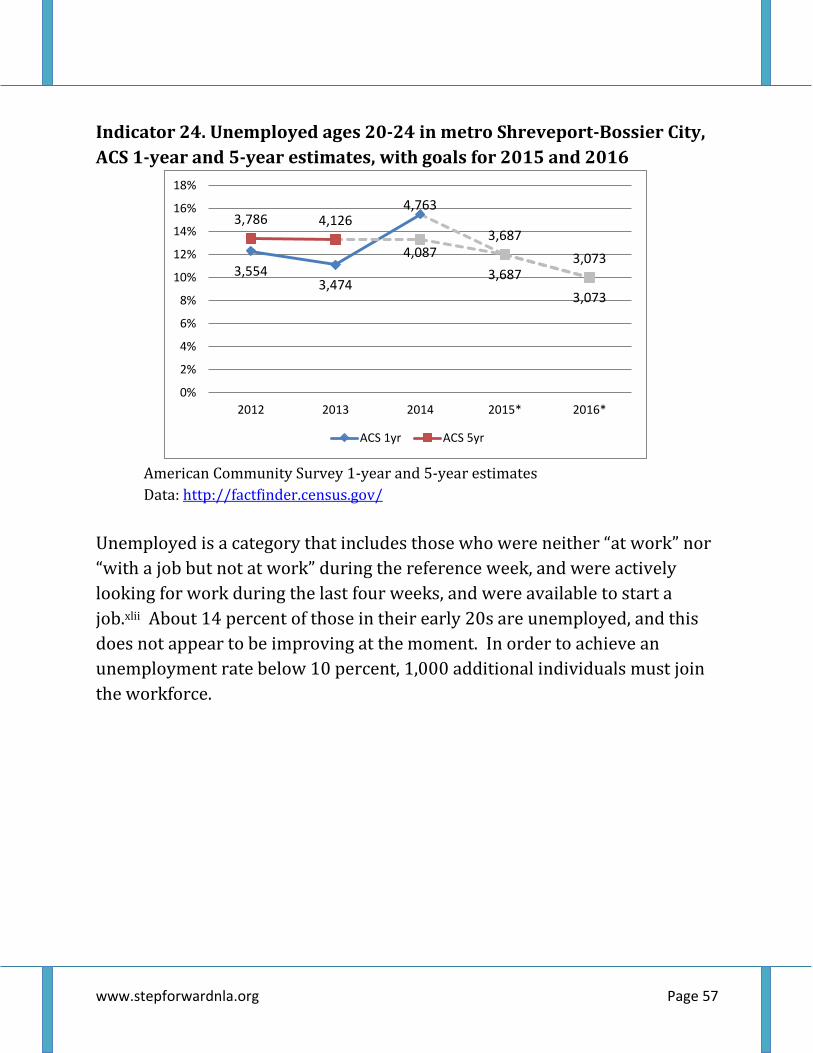
Indicator 24. Unemployed ages 20-24 in metro Shreveport-Bossier City,
ACS 1-year and 5-year estimates, with goals for 2015 and 2016
American Community Survey 1-year and 5-year estimates
Data: http://factfinder.census.gov/
Unemployed is a category that includes those who were neither “at work” nor
“with a job but not at work” during the reference week, and were actively
looking for work during the last four weeks, and were available to start a
job.xlii About 14 percent of those in their early 20s are unemployed, and this
does not appear to be improving at the moment. In order to achieve an
unemployment rate below 10 percent, 1,000 additional individuals must join
the workforce.
3,5543,474
4,763
3,687
3,073
3,786 4,126
4,0873,687
3,073
0%
2%
4%
6%
8%
10%
12%
14%
16%
18%
2012 2013 2014 2015* 2016*
ACS 1yr ACS 5yr
www.stepforwardnla.org Page 58
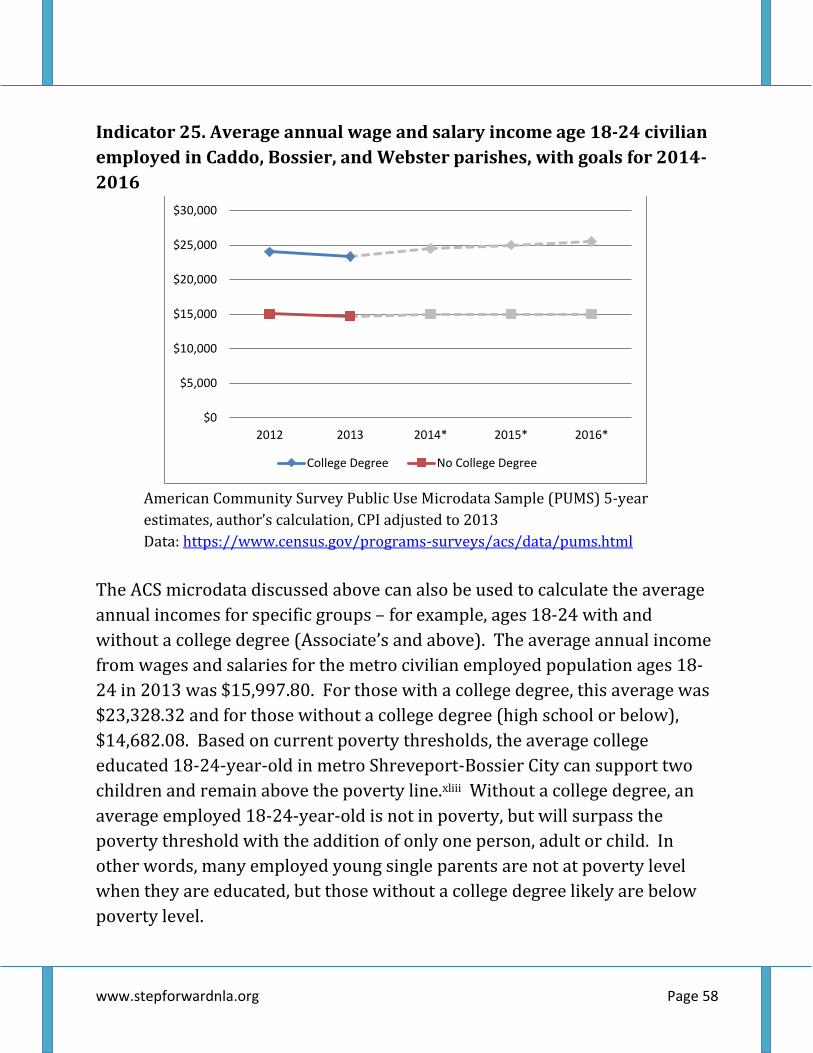
Indicator 25. Average annual wage and salary income age 18-24 civilian
employed in Caddo, Bossier, and Webster parishes, with goals for 2014-
2016
American Community Survey Public Use Microdata Sample (PUMS) 5-year
estimates, author’s calculation, CPI adjusted to 2013
Data: https://www.census.gov/programs-surveys/acs/data/pums.html
The ACS microdata discussed above can also be used to calculate the average
annual incomes for specific groups – for example, ages 18-24 with and
without a college degree (Associate’s and above). The average annual income
from wages and salaries for the metro civilian employed population ages 18-
24 in 2013 was $15,997.80. For those with a college degree, this average was
$23,328.32 and for those without a college degree (high school or below),
$14,682.08. Based on current poverty thresholds, the average college
educated 18-24-year-old in metro Shreveport-Bossier City can support two
children and remain above the poverty line.xliii Without a college degree, an
average employed 18-24-year-old is not in poverty, but will surpass the
poverty threshold with the addition of only one person, adult or child. In
other words, many employed young single parents are not at poverty level
when they are educated, but those without a college degree likely are below
poverty level.
$0
$5,000
$10,000
$15,000
$20,000
$25,000
$30,000
2012 2013 2014* 2015* 2016*
College Degree No College Degree
www.stepforwardnla.org Page 59
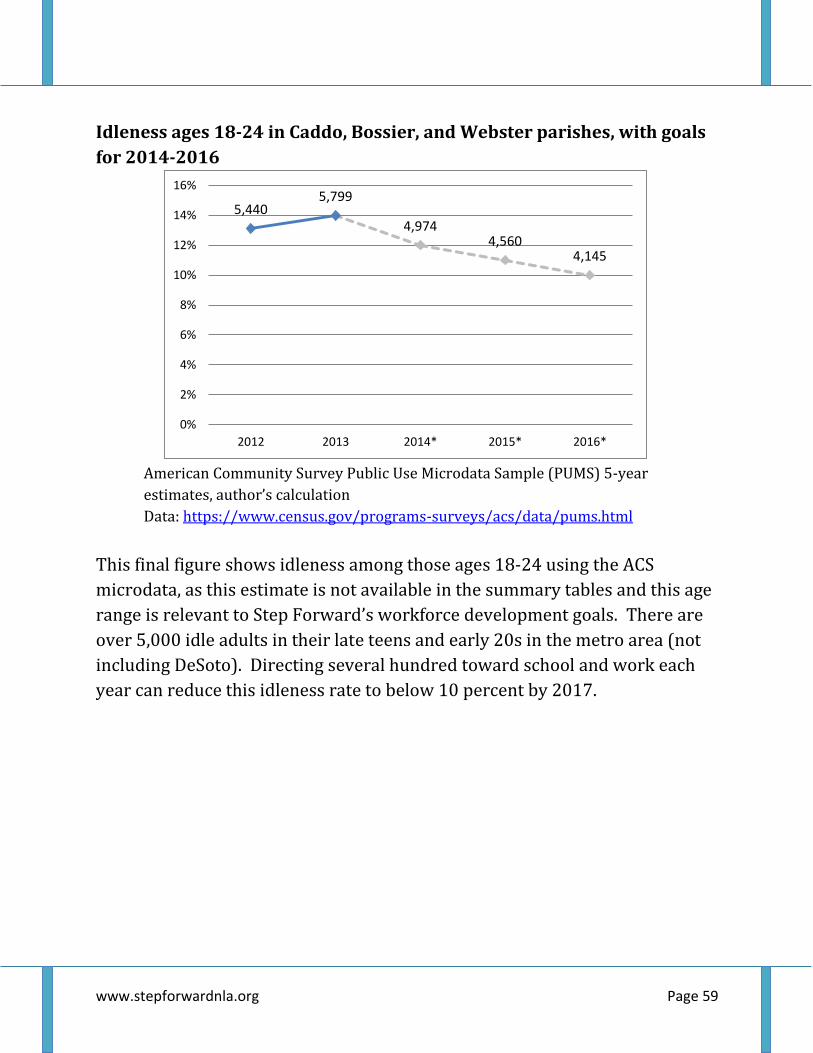
Idleness ages 18-24 in Caddo, Bossier, and Webster parishes, with goals
for 2014-2016
American Community Survey Public Use Microdata Sample (PUMS) 5-year
estimates, author’s calculation
Data: https://www.census.gov/programs-surveys/acs/data/pums.html
This final figure shows idleness among those ages 18-24 using the ACS
microdata, as this estimate is not available in the summary tables and this age
range is relevant to Step Forward’s workforce development goals. There are
over 5,000 idle adults in their late teens and early 20s in the metro area (not
including DeSoto). Directing several hundred toward school and work each
year can reduce this idleness rate to below 10 percent by 2017.
5,4405,799
4,9744,560
4,145
0%
2%
4%
6%
8%
10%
12%
14%
16%
2012 2013 2014* 2015* 2016*
www.stepforwardnla.org Page 60
Next Steps
The Step Forward initiative is actively engaged on a number of fronts. Action
plans for Early Childhood, Early Literacy, Youth Civic Development, and
Workforce Development have been developed. Carrying out these plans by
leveraging community resources through collaborative action has already
begun.
The project is always seeking community volunteers to assist and contribute
to these important efforts. Your involvement can make a difference.
Community-wide grass-roots involvement is in fact critical to achieving such
population-level change. If you are committed to improving educational
opportunities for our area’s children, we would like to hear from you.
In the meantime, we will remain committed to sharing data indicators, and we
will continue to engage in continuous evaluation of our efforts to improve the
status of our community’s children, from cradle to career.
www.stepforwardnla.org Page 61
Notes i The Census numbers in this introduction are American Community Survey 5-year estimates for years 2009-2013 and ACS 1-year estimates for 2014. iihttp://www.bea.gov/newsreleases/regional/gdp_metro/gdp_metro_newsrelease.htm, CPI inflation adjusted by the author. iii National and state poverty rates for comparison, 2009-2013: 13.5, 13.8, 14.3, 14.9, 15.4 (U.S.), and 18.4, 18.1, 18.4, 18.7, 19.1 (LA), from ACS 5-year estimates. iv Mining includes: Oil and gas extraction; Mining, except oil and gas; and Support activities for mining. From MSA Business Patterns, available here: http://censtats.census.gov/cgi-bin/msanaic/msasect.pl. v From 211 to 328 total mining establishments, according to MSA Business Patterns. For comparison, the number of total establishments in all industries increased 13 percent over the same period (from 8,809 to 9,957). vi From 1,432 to 5,624 paid employees according to MSA Business Patterns. For comparison, the number of paid employees in all industries increased 7 percent over the same period (from 149,116 to 159,902). vii From $97,688,066.71 annual payroll in 2005, according to MSA Business Patterns, CPI inflation adjusted by the author. For comparison, total annual payroll in the area increased by 11.4 percent over the same period (from 5.2 billion to 5.8 billion dollars). viii A more reliable but less recent figure is 18.5 percent or 80,188 individuals below the poverty level, according to 2013 ACS 5-year estimates discussed further below. ix According to the most recent 2013 ACS 5-year estimates, these figures are 27.7 percent or 29,921 (under 18 years) and 11 percent or 6,353 (65 years and over). x Because the populations of Webster Parish alone and metro Shreveport-Bossier City (Caddo, Bossier, and DeSoto in 2012) are distributed differently along many characteristics discussed in this report, the addition of the new parish to the area in 2013 causes almost all numerical values to increase, while causing only some of the percent values to increase. Because of this, it is even possible that a percent value falls as a numeric value rises, but only between the years 2012 and 2013, because of the addition of the new parish. xi In this report, data for whites includes only non-Hispanic whites. Census data on race is based on self-identification. More information on how the Census classifies race here:
www.stepforwardnla.org Page 62
http://www.census.gov/topics/population/race/about.html, and Hispanic origin here: http://www.census.gov/topics/population/hispanic-origin/about.html. xii Du Bois, W. E. B. 1903. The Souls of Black Folk: Essays and Sketches. Chicago: A. C. McClurg. xiii Wilson, William Julius. 1978. The Declining Significance of Race: Blacks and Changing American Institutions. University of Chicago Press. xiv Management, business, science, and arts occupations include: management, business, and financial occupations (e.g. financial managers, education administrators, accountants, tax preparers); computer, engineering, and science occupations (e.g. information security analysts, database administrators, architects, petroleum engineers, chemists and materials scientists, economists); education, legal, community service, arts, and media occupations (e.g. social workers, clergy, lawyers, teachers, artists, musicians, writers); and healthcare practitioners and technical occupations (e.g. dentists, physicians, nurses, clinical laboratory technologists and technicians, paramedics). More information here: http://www2.census.gov/programs-surveys/acs/tech_docs/code_lists/2014_ACS_Code_Lists.pdf. xv ACS 1-year estimates for Black or African-American unemployment rates since the recession (2009-2014): 11.3, 14.3, 9.7, 13.2, 9.5, and 9.1 percent. xvi Educational attainment categories include: Less than ninth grade; ninth to 12th grade, no diploma; Regular high school diploma; GED or alternative credential; Some college, no degree; Associate’s degree; Bachelor's degree; and Graduate or professional degree. More information available here: http://www2.census.gov/programs-surveys/acs/tech_docs/subject_definitions/2014_ACSSubjectDefinitions.pdf. xvii Author’s calculation using ACS 5-year estimates 36.8 percent (2009) and 41.9 percent (2013). xviii Tocqueville, Alexis de. 1838. Democracy in America. London: Saunders and Otley. xix American Community Survey general information available here: https://www.census.gov/programs-surveys/acs/about.html. xx More information available here: https://www.census.gov/programs-surveys/acs/guidance/estimates.html. xxi Center for Disease Control and Prevention vaccine information available here: http://www.cdc.gov/vaccines/vac-gen/imz-basics.htm. xxii Center for Disease Control and Prevention childhood obesity information available here: http://www.cdc.gov/obesity/childhood/defining.html.
www.stepforwardnla.org Page 63
xxiii Poverty definitions used by the Census Bureau including those used for the American Community Survey available here: https://www.census.gov/hhes/www/poverty/methods/definitions.html. xxiv The income definition used in the ACS poverty calculation is “total income,” which includes: wage and salary income; net self-employment income; interest, dividends, or net rental or royalty income or income from estates and trusts; Social Security or Railroad Retirement income; Supplemental Security Income (SSI); public assistance or welfare payments; retirement, survivor, or disability pensions; and all other income. Receipts from the following sources are not included as income: capital gains, money received from the sale of property (unless the recipient was engaged in the business of selling such property); the value of income “in kind” from food stamps, public housing subsidies, medical care, employer contributions for individuals, etc.; withdrawal of bank deposits; money borrowed; tax refunds; exchange of money between relatives living in the same household; gifts and lump-sum inheritances, insurance payments, and other types of lump-sum receipts: http://www2.census.gov/programs-surveys/acs/tech_docs/subject_definitions/2014_ACSSubjectDefinitions.pdf. xxv The sum of those under 6 years with income to poverty ratios: under .50 (8,161), .50 to .74 (3,175), and .75 to .99 (2,023). These estimates do carry margins of error (+-4,750 total). Such is the nature of sampling statistics. Using the margins of error, we find that the lower bound of the confidence interval for metro Shreveport-Bossier City child poverty in 2014 is 23.3 percent and the upper bound is 49.2 percent. The current estimate of 36.3 percent falls in the middle of this interval. xxvi This is a rough estimate as not all children in poverty are in families of four. xxvii Hart, Betty and Todd R. Risley. 1995. Meaningful Differences in the Everyday Experiences of Young American Children. Baltimore: Paul H. Brookes Publishing. xxviii Anderson, Richard C., Paul T. Wilson and Linda G. Fielding. 1988. Growth in Reading and How Children Spend Their Time Outside of School. Reading Research Quarterly, vol. 23, no. 2, pp. 285-303. xxix According to the state’s fall 2013 DIBELS report. A current list of research publications related to DIBELS assessments available here: https://dibels.org/papers/DIBELS_references_2013.pdf. xxx http://www.parcconline.org/about

www.stepforwardnla.org Page 64
xxxi Because the denominator used by the state to construct this measure is “the number of students with consecutive promotion from kindergarten through fourth grade,” and not total fourth graders, what this actually measures is the share of “on time” fourth graders who are “on level,” and not the share of all fourth graders who are both “on time and on level.” xxxii Doll, Jonathan Jacob, Zohreh Eslami and Lynne Walters. 2013. Understanding Why Students Drop Out of High School, According to Their Own Reports: Are They Pushed or Pulled, or Do They Fall Out? A Comparative Analysis of Seven Nationally Representative Studies. SAGE Open, October-December 2013:1-15. xxxiii Perhaps as much as half of all crimes nationwide go unreported, according to data from the National Crime Victimization Survey, administered by the Census for the Bureau of Justice Statistics annually since 1973: http://www.bjs.gov/index.cfm?ty=dcdetail&iid=245. xxxiv If calls for service about fights and arrests for “other assault” are similarly distributed across age categories, a back-of-the-envelope calculation finds: 2,289*.32=732 calls for age 17 and under fights, which likely involve two or more individuals each and end in an arrest less than half of the time (call it a wash?), arriving at 732 age 17 and under arrests for fighting, near to our 871 other assault arrests. xxxv http://www.osfa.state.la.us/MainSitePDFs/QualifyingforTOPS_QnA.pdf. xxxvi Athreya, Kartik B., Urvi Neelakantan and Jessie Romero. “Expanding the Scope of Workforce Development,” Federal Reserve Bank of Richmond Economic Brief, available here: https://www.richmondfed.org/publications/research/economic_brief/2014/eb_14-05 (Views expressed in this article are those of the authors and not necessarily those of the Federal Reserve Bank of Richmond or the Federal Reserve System). xxxvii Public Use Microdata Sample information available here: https://www.census.gov/programs-surveys/acs/technical-documentation/pums.html. xxxviii Public Use Microdata Area reference maps (Caddo PUMAs 22 00100, 22 00101 and Bossier and Webster PUMA 22 00200) available here: https://www.census.gov/geo/maps-data/maps/2010puma/st22_la.html. xxxix Unfortunately, PUMA geography does not perfectly correspond to all metropolitan area geographies. Metropolitan area geographies are county-based, while public use microdata area boundaries cut through highly populated counties or group together less-populated counties to achieve a

www.stepforwardnla.org Page 65
population threshold of 100,000 per area. For the purposes of our analysis many PUMAs in a county can be aggregated, as in the case of Caddo, but many counties in a PUMA cannot be disaggregated, as in the cases of Bossier and Webster; and DeSoto, Claiborne, Bienville, Lincoln, Red River, Sabine and Natchitoches (PUMA 22 00300). xl American Community Survey employment status subject definitions available here: https://www.census.gov/programs-surveys/acs/technical-documentation/code-lists.html. xli Some of these 9,000 plus students undoubtedly are under age 20 or live outside the metro area. xlii Examples of job seeking activities from the American Community Survey subject definition of unemployed include: registering at a public or private unemployment office, meeting with prospective employers, investigating possibilities for starting a professional practice or opening a business, placing or answering advertisements, writing letters of application, and being in a union or professional register. xliii Poverty thresholds by size of family and number of children for 1978-2014 available here: https://www.census.gov/hhes/www/poverty/data/threshld/.