a detailed look at the haynesville/ bossier play – a well ... · bossier play – a well...
TRANSCRIPT
See the energy at TGS.com
© 2018 TGS-NOPEC Geophysical Company ASA. All rights reserved.
white paper
Authors– T. Mirenda (TGS)
A Detailed Look at the Haynesville/Bossier Play – a Well Performance Data Analysis
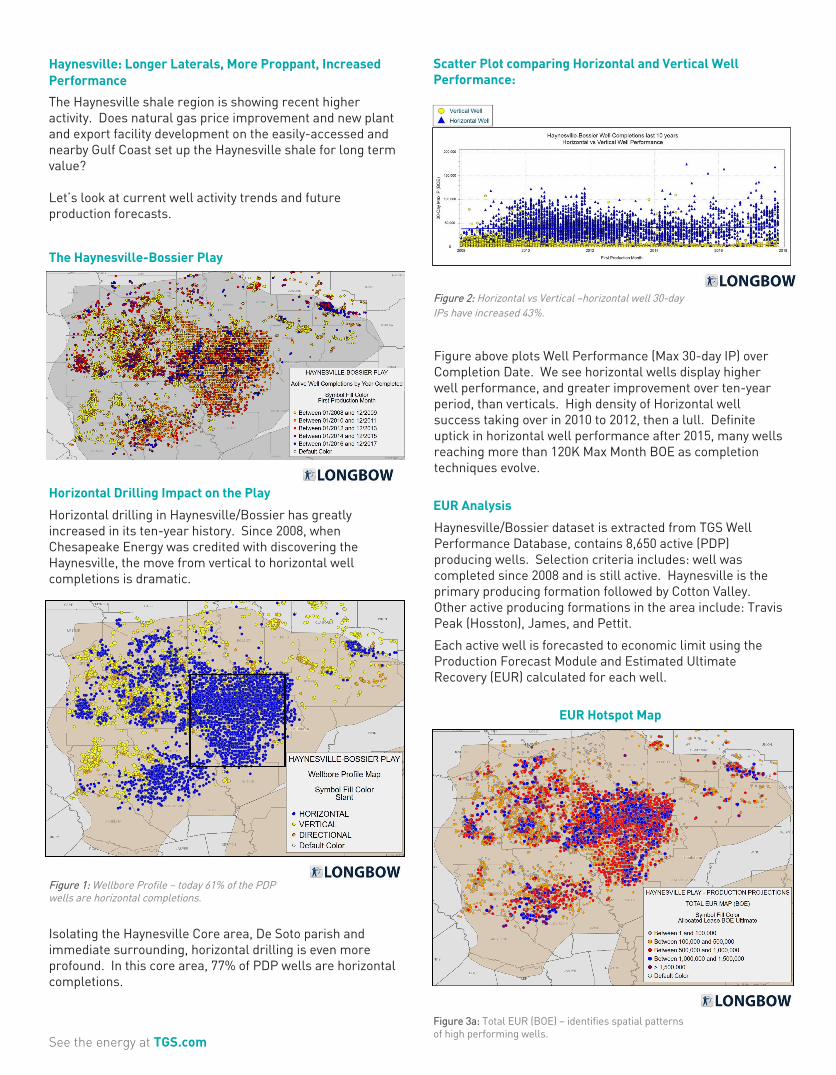
Haynesville: Longer Laterals, More Proppant, Increased Performance
The Haynesville shale region is showing recent higher activity. Does natural gas price improvement and new plant and export facility development on the easily-accessed and nearby Gulf Coast set up the Haynesville shale for long term value?
Let’s look at current well activity trends and future production forecasts.
The Haynesville-Bossier Play
Horizontal Drilling Impact on the Play
Horizontal drilling in Haynesville/Bossier has greatly increased in its ten-year history. Since 2008, when Chesapeake Energy was credited with discovering the Haynesville, the move from vertical to horizontal well completions is dramatic.
Figure 1: Wellbore Profile – today 61% of the PDP wells are horizontal completions.
Isolating the Haynesville Core area, De Soto parish and immediate surrounding, horizontal drilling is even more profound. In this core area, 77% of PDP wells are horizontal completions.
See the energy at TGS.com
Scatter Plot comparing Horizontal and Vertical Well Performance:
Figure 2: Horizontal vs Vertical –horizontal well 30-day IPs have increased 43%.
Figure above plots Well Performance (Max 30-day IP) over Completion Date. We see horizontal wells display higher well performance, and greater improvement over ten-year period, than verticals. High density of Horizontal well success taking over in 2010 to 2012, then a lull. Definite uptick in horizontal well performance after 2015, many wells reaching more than 120K Max Month BOE as completion techniques evolve.
EUR Analysis
Haynesville/Bossier dataset is extracted from TGS Well Performance Database, contains 8,650 active (PDP) producing wells. Selection criteria includes: well was completed since 2008 and is still active. Haynesville is the primary producing formation followed by Cotton Valley. Other active producing formations in the area include: Travis Peak (Hosston), James, and Pettit.
Each active well is forecasted to economic limit using the Production Forecast Module and Estimated Ultimate Recovery (EUR) calculated for each well.
EUR Hotspot Map
Figure 3a: Total EUR (BOE) – identifies spatial patterns of high performing wells.
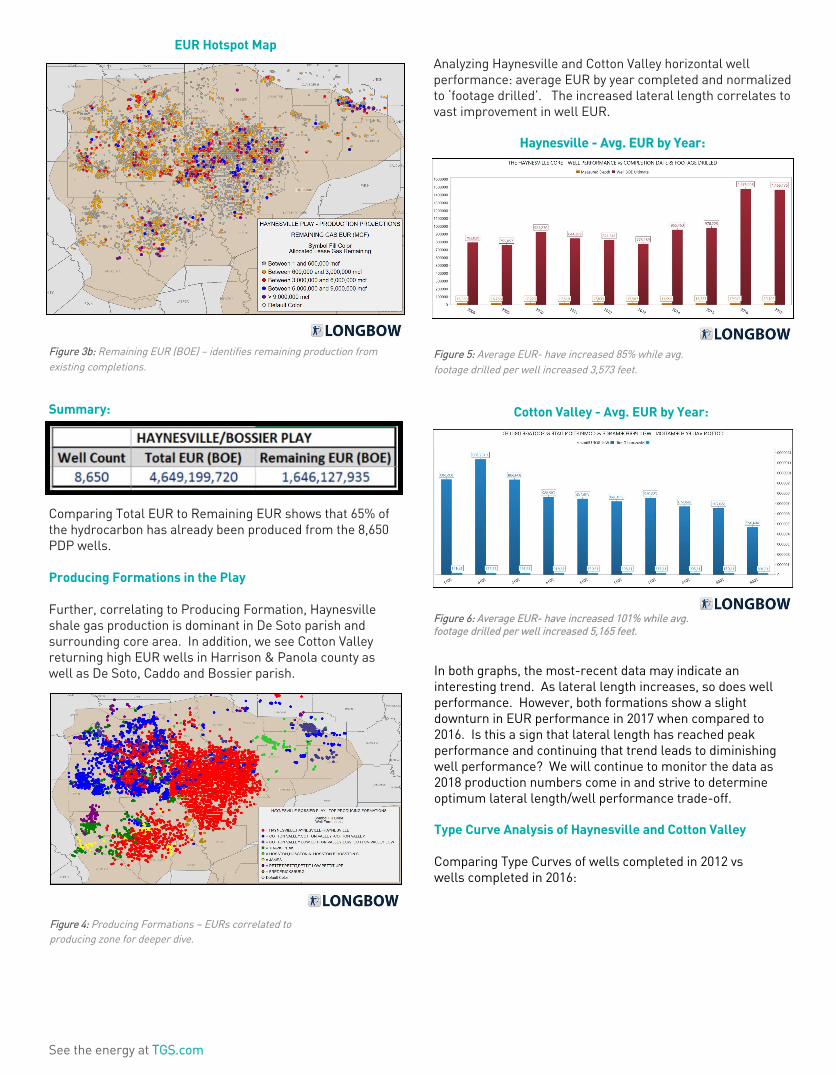
EUR Hotspot Map
Figure 3b: Remaining EUR (BOE) – identifies remaining production from existing completions.
Summary:
Comparing Total EUR to Remaining EUR shows that 65% of the hydrocarbon has already been produced from the 8,650 PDP wells.
Producing Formations in the Play
Further, correlating to Producing Formation, Haynesville shale gas production is dominant in De Soto parish and surrounding core area. In addition, we see Cotton Valley returning high EUR wells in Harrison & Panola county as well as De Soto, Caddo and Bossier parish.
Figure 4: Producing Formations – EURs correlated to producing zone for deeper dive.
See the energy at TGS.com
Analyzing Haynesville and Cotton Valley horizontal well performance: average EUR by year completed and normalized to ‘footage drilled’. The increased lateral length correlates to vast improvement in well EUR.
Haynesville - Avg. EUR by Year:
Figure 5: Average EUR- have increased 85% while avg. footage drilled per well increased 3,573 feet.
Cotton Valley - Avg. EUR by Year:
Figure 6: Average EUR- have increased 101% while avg. footage drilled per well increased 5,165 feet.
In both graphs, the most-recent data may indicate an interesting trend. As lateral length increases, so does well performance. However, both formations show a slight downturn in EUR performance in 2017 when compared to 2016. Is this a sign that lateral length has reached peak performance and continuing that trend leads to diminishing well performance? We will continue to monitor the data as 2018 production numbers come in and strive to determine optimum lateral length/well performance trade-off.
Type Curve Analysis of Haynesville and Cotton Valley
Comparing Type Curves of wells completed in 2012 vs wells completed in 2016:
YEAR 2012 Wells
YEAR 2016 Wells
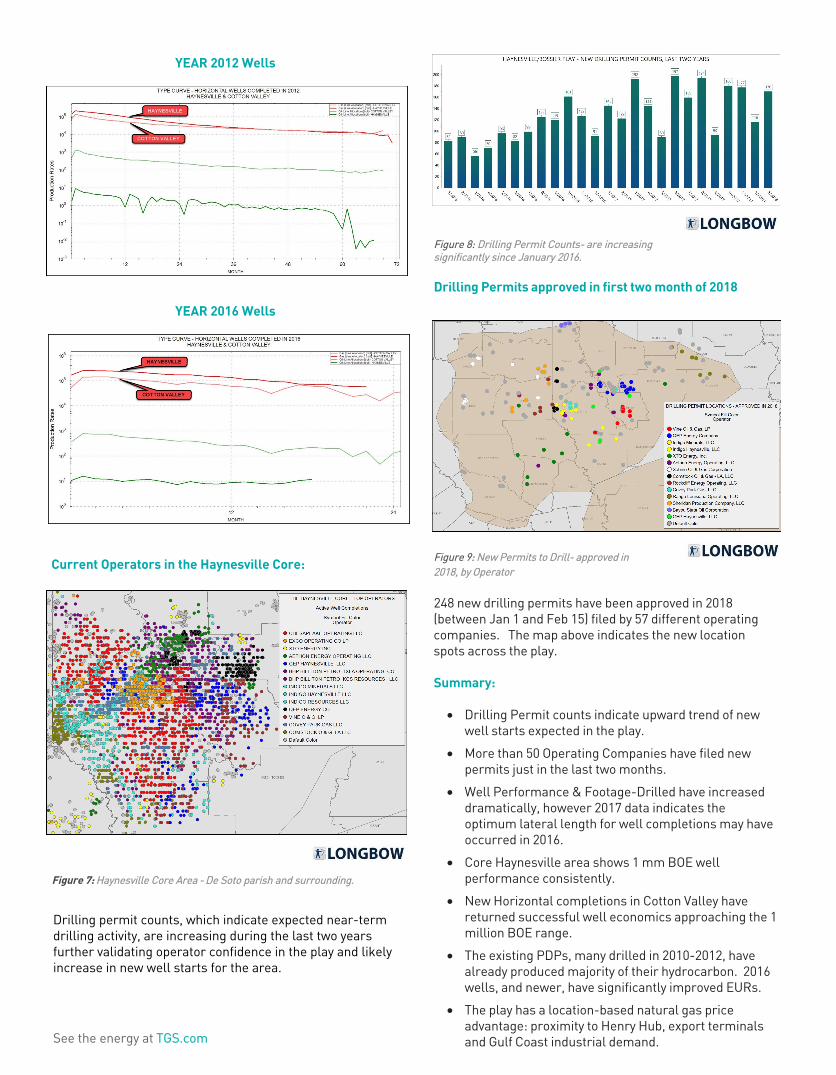
Current Operators in the Haynesville Core:
Figure 7: Haynesville Core Area - De Soto parish and surrounding.
Drilling permit counts, which indicate expected near-term drilling activity, are increasing during the last two years further validating operator confidence in the play and likely increase in new well starts for the area.
See the energy at TGS.com
Figure 8: Drilling Permit Counts- are increasing significantly since January 2016.
Drilling Permits approved in first two month of 2018
Figure 9: New Permits to Drill- approved in 2018, by Operator
248 new drilling permits have been approved in 2018 (between Jan 1 and Feb 15) filed by 57 different operating companies. The map above indicates the new location spots across the play.
Summary:
• Drilling Permit counts indicate upward trend of newwell starts expected in the play.
• More than 50 Operating Companies have filed newpermits just in the last two months.
• Well Performance & Footage-Drilled have increaseddramatically, however 2017 data indicates theoptimum lateral length for well completions may haveoccurred in 2016.
• Core Haynesville area shows 1 mm BOE wellperformance consistently.
• New Horizontal completions in Cotton Valley havereturned successful well economics approaching the 1million BOE range.
• The existing PDPs, many drilled in 2010-2012, havealready produced majority of their hydrocarbon. 2016wells, and newer, have significantly improved EURs.
• The play has a location-based natural gas priceadvantage: proximity to Henry Hub, export terminalsand Gulf Coast industrial demand.
See the energy at TGS.com
© 2018 TGS-NOPEC Geophysical Company ASA. All rights reserved.
US Tel: +1 713 860 2100
Email: [email protected]
For more information, contact TGS at:
About TGSTGS is headquartered in Oslo, Norway, and publicly traded on the Oslo Stock Exchange. Our other main offices are in Calgary, Houston, London and Perth, and we have employees in cities around the globe. Our primary business is to provide geoscience data to energy companies worldwide. We offer extensive global libraries that include seismic data, magnetic and gravity data, multibeam and coring data, digital well logs, production data and directional surveys. Additionally, we offer advanced processing and imaging services, interpretation products and data integration solutions.