stem graduates in non-stem jobs - welcome to gov.uk · stem graduates in non-stem jobs 6 5....
TRANSCRIPT

BIS RESEARCH PAPER NUMBER 30
STEM Graduates in Non STEM Jobs
MARCH 2011
Authors:
Robin Mellors-BourneCRAC - Careers Research & Advisory Centre
Helen ConnorCIHE - Council for Industry & Higher Education
Charles JacksonNICEC - National Institute for Careers Education & Counselling
Prepared by:
CRAC – the Careers Advisory & Research CentreSheraton HouseCastle ParkCambridgeCB3 0AX
01223 460277www.crac.org.uk
© Careers Research & Advisory Centre (CRAC) Ltd. 2010
The views expressed in this report are the authors’ and do not necessarily reflectthose of the Department for Business, Innovation and Skills.
Department for Business, Innovation and Skills1 Victoria StreetLondon SW1H 0ETwww.bis.gov.uk
BIS Research Paper number 30March 2011

3
Acknowledgements
The authors would like to acknowledge a number of people for assistance in the project.Contacts within many scientific societies, networks of HE heads of department andprofessional bodies, too numerous to mention, were helpful in promoting participation in thestudent survey. Equally, the assistance of employers was critical in recruiting graduates forinterview – we are immensely grateful for their help, as well as others with networks whohelped distribute our requests for participation. Other employers were kind enough to giveup time for an interview or discussion group. Especial thanks are due of course to thethousands of students and hundreds of graduates who took part in surveys or interviews,entirely voluntarily, and whose views we report here.
We also thank Geoff Pike at Employment Research Ltd who undertook the telephonesurvey on our behalf, Wendy Hirsh who assisted with development of the telephoneinterview script, and Gill Wilson in undertaking a significant proportion of the face-to-faceinterviews with graduates. Our thanks go also to Hugh Smith and Keith Herriman at CIHEwho assisted in the interview work and gave valuable input to earlier report drafts, and tothe project Steering Group for their consistent encouragement and review comments atvarious stages.

STEM Graduates in Non-STEM Jobs
4
ContentsExecutive summary 1
Key research findings 3Overall conclusions9
1. Context and methodology in brief 131.1 Context and research questions 13
1.1.1 Evidence to explore further and hypotheses to test 141.2 Defining STEM 181.3 Methodology and samples 21
1.3.1 Samples achieved 211.3.2 Implications and limitations of the samples 22
2. Overall findings 242.1 Why do some STEM graduates not work in STEM jobs? 242.2 Underpinning observations 242.3 Do STEM graduates want a STEM degree-related career? 272.4 Why choose a STEM career or a non-STEM direction? 292.5 Influences on career thinking 322.6 Employment decisions and outcomes 322.7 Variations by discipline and other factors 342.8 STEM skills mismatch 352.9 Overall conclusions and implications 36
2.9.1 Reasons why STEM graduates are not in STEM jobs 362.9.2 Broader implications 402.9.3 Recommendations for further research 44
3. Career intentions of STEM students 463.1 Future career intentions 47
3.1.1 Are they likely to stay in STEM? 473.1.2 Reasons for wanting to stay in STEM 493.1.3 Reasons for not wanting to pursue a career in STEM 54
3.2 Current career thinking 553.2.1 Strength of career plans 553.2.2 What careers are being considered? 573.2.3 How essential is the degree subject? 59
3.3 Plans after graduation 613.3.1 Plans for next year 613.3.2 Further study options 633.3.3 Relating different career tracks to longer term career plans 65

5
3.3.4 Job-seeking behaviour 683.4 Development of career thinking prior to and at university 70
3.4.1 Reasons for choosing a STEM degree course 713.4.2 Reasons for undertaking postgraduate study 733.4.3 Changing degree course 74
3.5 Development of career plans 753.5.1 Presence of career plans at entry to university 763.5.2 Changing career plans during undergraduate study 763.5.3 Nature of initial career plans 773.5.4 How plans changed with time 79
3.6 Influences on career thinking 803.6.1 Impact of changing career plans 82
3.7 Impact of career motivation 833.8 Work experience 85
3.8.1 Link to work experience 903.9 Career advice and guidance 92
3.9.1 Impact of use of the careers service 943.9.2 Consequences of a need for additional career support 94
3.10 Observations and conclusions 953.10.1 Overall observations 953.10.2 Conclusions 98
4. STEM graduate career decisions and outcomes 1004.1 Current employment 101
4.1.1 Reasons for taking first graduate job 1024.1.2 Job changes and reasons 1054.1.3 Summary of reasons 106
4.2 Career thinking at graduation and applying for first graduate job 1064.2.1 Career readiness and job applications 1064.2.2 Were the job applications degree-related? 1094.2.3 Reasons for career direction and related job applications 111
4.3 Choice of degree course 1154.4 Evolution of career thinking 118
4.4.1 Career plans at entry to university 1184.4.2 Changes to career thinking during university and
influencing factors 1204.4.3 Impact of career influences 1244.4.4 Careers advice and support at university 125
4.5 Use of degree knowledge and related skills 1264.6 Job satisfaction and future expectations of career 1334.7 Observations and conclusions 139
4.7.1 Overall observations from graduate interviews 1394.7.2 Conclusions 141

STEM Graduates in Non-STEM Jobs
6
5. Employer demand and recruitment strategies in relation toSTEM graduates 1435.1 The employer sample 1435.2 Questions for employers 1455.3 Research findings 146
5.3.1 Where are STEM graduates being sought, and forwhat jobs? 146
5.3.2 Why are they recruited and what is being sought? 1525.3.3 How much do STEM disciplines align with job needs? 1525.3.4 Skills being sought 1545.3.5 Preferences for particular qualifications or institutions 1555.3.6 Where are the STEM graduate recruitment difficulties
and why? 1575.3.7 Are there perceived deficiencies in STEM graduates? 1595.3.8 How do employer recruitment strategies affect students’
career decisions? 1615.3.9 Why do some STEM graduates not want to work in
their STEM degree discipline? 1615.4 Summary and conclusions 163
References 168
Appendix A. Research context, methodology and samples 173A.1 Context for the research 173A.2 Study definitions – STEM and ‘non-STEM’ 195A.3 Research methodology and samples 209
Appendix B. Additional tables 231

STEM Graduates in Non-STEM Jobs
1
Executive SummaryThis research set out to investigate why some STEM graduates do not work in occupationsrelated to their degree. This question has arisen from previous research looking at the extentto which the supply of graduate-level STEM skills meets employer demand. While there isevidence of high demand from employers (of whom many report difficulties recruiting STEMgraduates) and an apparent salary premium for many STEM qualified graduates who work in‘scientific‘ occupations1, why is it that a significant proportion of STEM graduates do not enterthese occupations? What factors are influencing STEM graduates’ career decisions,especially to move ‘away’ from STEM careers? More knowledge of STEM student andgraduate career decisions was felt to be needed to help current efforts to improve the supplyof STEM-qualified entrants to the graduate labour market. The research was commissionedby the Department for Business, Innovation & Skills (BIS) and undertaken in 2009 and 2010.
Defining STEM
The research question was not simple or straightforward. A particular issue is the definition ofSTEM (and thereby also “non-STEM”). While degree disciplines can be grouped relativelyeasily into a STEM cluster (subjects grouped as Science, Technology, Engineering andMathematics), it is much more difficult to classify STEM employment in the absence of agenerally accepted definition of what comprises either a STEM job or STEM skills. NeitherStandard Occupational Classification (SOC) system codes or Standard IndustrialClassification (SIC) codes are particularly valuable to do this, so it was necessary to developa working definition of STEM and its scope for our research.
The degree subjects with which we were primarily concerned were Physical and BiologicalSciences, Engineering and Technology, Mathematics and Computer Sciences, but we alsoincluded Subjects allied to Medicine (but excluding Nursing), Architecture/Building,Psychology and Geography within our STEM discipline scope as these other subjects includecourses with a scientific focus. We developed our own STEM employment framework,consisting of:
A STEM Specialist sector where employers seek core STEM competences ingraduates, a STEM Generalist sector where STEM graduates might be suitable orpreferred, and non-STEM employers where there is no overt demand for STEMgraduates; and
STEM Core jobs where a STEM degree and associated competences are directly
1 Analysis by DIUS, now known as BIS, in Demand for STEM skills (BIS, 2009a)

STEM Graduates in Non-STEM Jobs
2
relevant, STEM-related jobs where STEM competences are of relevance but appliedmore broadly, and Unrelated jobs where a STEM degree qualification has little or noapparent relevance.
Only by using the combination of both our sector and occupational role classifications, whichcould be represented as positioning in a 3 x 3 Sector/Occupational Matrix, could we fullyunderstand how much any particular job was a ‘STEM job’ or a ‘non-STEM job’.
Student career decision-making
A second issue was that existing knowledge (from previous research) suggests thatdecisions to enter ‘STEM jobs’ at the point of, or after, graduation are often part of a longerprocess of career decision-making by individuals. So, aspects of career decisions at differentstages in the ‘journey’ through higher education and into work, needed to be covered in ourinvestigations, as well as career intentions at the transition between degree study and workand graduate employment outcomes. This meant exploring the reasons behind choosing tostudy STEM as a degree, development of career thinking from entry to university onwards,influences on certain career decisions taken (especially career ‘direction’, i.e. towards STEMjobs or not) and the factors that appeared to have the most impact on graduates’ outcomes.We particularly wanted to assess the extent to which STEM graduates were makingconscious decisions to follow paths towards or away from STEM-based occupations, orwhether they drifted into them accidentally, or whether they wished to take up STEM careersbut were prevented from doing so, by employers’ recruitment requirements or for otherreasons.
Research methodology
We needed to see how graduates’ decisions differed according to STEM subject and if otherfactors, such as type of higher education institution, qualification, ability, work experience ordemography, might interact with this. An important requirement was therefore to generatesufficient data on STEM students and graduates to understand such potential differences. Amixed method approach was used in the research:
Reviews of existing evidence drawn from other studies and data sources; A survey of STEM students on their career decision-making and intentions, focusing on
final-year undergraduates but also taught masters and PhD students ( c.7,000 in totalsample);
Interviews, face-to-face and by telephone, with over 550 graduates now in early-careeremployment about their actual decisions to take up either STEM or non-STEMoccupations and their employment experiences;
Discussions with over 50 employers of their requirements and strategies in relation torecruitment of STEM graduates and how these might affect graduates’ decision-making

STEM Graduates in Non-STEM Jobs
3
and career outcomes.
Key research findings
A ‘STEM job’ or ‘STEM career’ is not a clear concept
Employers and graduates tend not to think of ‘STEM’ but more about degree subject(groups). Students are anchored in their subject rather than in STEM, and considercareer/occupational directions in relation to their degree subject, rather than in relationto STEM.
This results in complexity for analysis and policy – a job like accountancy is seen asstrongly degree-related by a Mathematics graduate but unrelated by an Engineeringgraduate, while a specialist IT role regarded as degree-related for a Computer Sciencegraduate could be in any industrial sector. For a Sports Scientist, working at a localauthority fitness centre would be degree-related, but neither the role nor that sector islikely to be regarded as being within or related to STEM in most policy discussions oranalyses.
The definitions used in any analysis of STEM employment are therefore crucial; the‘matrix’ approach using both role and sector for any particular job was useful to tell howmuch it was a ‘STEM job’ or not, although subjectivity remained in classifying someroles.
Do STEM students/graduates want a STEM career?
The vast majority of final-year students, at undergraduate, masters and PhD level,report that they do want to pursue a career related to their degree subject, althoughthat proportion varies somewhat with degree subject, and some are more definite aboutthis than others. As many as two-thirds of those in more ‘vocational’ subjects likeEngineering definitely want a degree-related career, but nearer to a half in othersubjects. However, between a half and a third are not fully decided.
Many of the undergraduates who want to pursue postgraduate study also wish toprogress to degree-related occupations in the longer-term. Entering a postgraduatecourse is often a deliberate path towards a STEM career.
Among those with career ideas, about half are considering a career in a STEMSpecialist sector and/or in a STEM Core job function (i.e. the ‘core’ of STEMemployment as we defined it). This varied considerably by subject, with the highestproportions in the more narrowly ‘vocational’ STEM subjects, but this partly reflects thatdegree-related STEM employment will be outside this ‘core’ for many subjectdisciplines within STEM (e.g. Mathematics, Geography).
Only a very small minority report that they want to work in employment not related totheir degree (11% might not or don’t, and even fewer postgraduates), but a larger andmore significant proportion have only vague or no career plans. A substantial

STEM Graduates in Non-STEM Jobs
4
proportion of final-year students had not made job applications half way through theirfinal year, and roughly a quarter expect to take time out or enter temporary work next,deferring any long-term career direction decision.
Why choose a non-STEM career?
The main reasons students seek a STEM degree-related job are aspirational, chieflythe potential for interesting work and to use their learning and specialist skills. There isno one dominant factor. Career-related and more pragmatic reasons, includingexpected earnings and job availability, are uppermost for a few but secondary for mostthat are considering entering a STEM career.
The most likely reason students seek employment in a direction away from STEM isbecause other fields are seen to be of more interest, although more practical andcareer-related reasons are also significant for graduates considering ‘leaving STEM’.
Earnings (expected pay) is an important factor (somewhat more important for males)but not the main motivating factor either to choose STEM degree-related work or not to.Career prospects and earnings are seen as positive reasons both to enter STEMcareers and not to, i.e. there are mixed perceptions about where earnings are best.
In parallel with the student survey, most graduates interviewed had chosen theircurrent job (whether in STEM or unrelated) because it offered interesting work, withstarting salary and prospective earnings a main driver for only a minority of graduates,almost exclusively male.
The profile and reputation of certain major employers, especially in our STEMGeneralist and non-STEM sectors, with well-established and substantial graduateschemes, were attractive and powerful influences on ‘undecided’ graduates at thetransition stage between university and work. For many strong STEM graduates thiswas considered to be the ‘mainstream’ career route – rather than into specialisedSTEM jobs – an impression reinforced by peers and some careers services.
Although few students reported this as a reason for not staying in STEM, employers –especially in some STEM Specialist sectors – were much more likely to feel that STEMhad a less attractive image (as employer or working environment) in the eyes ofstudents. In some cases, they felt this perception arose from a lack of real knowledgeabout STEM employment and unrealistic expectations among many STEM graduates.
Almost no students and very few graduates reported that rejection by STEM Specialistemployers had led to a shift in their direction away from STEM work; if anythingrejection from non-STEM corporate graduate schemes was more significant in theirdecision-making.
Progressive development of career thinking
Most students did not originally choose to study a STEM degree primarily for a career-related reason, but rather for interest/enjoyment in the subject or based on their

STEM Graduates in Non-STEM Jobs
5
aptitude. Of those that did cite career-related reasons, more thought a STEM degreekept career options open than thought it would accelerate them to a specific STEMoccupation, even those studying a subject like Engineering.
Most started university with few career ideas but developed and firmed them up duringtheir degree study, the majority focusing towards a STEM degree-related direction. Theprofile and reputation of employers became more important with time, and some beganto have some understanding of the graduate labour market.
Different career routes were progressively adopted depending on degree subject andthe firmness of career plans, and the firmness of plans also varied with subject.
Those who were more career-motivated (i.e. had firmer career plans when starting theSTEM degree, or at any later stage), were more likely to wish to enter a STEMoccupation. The more ‘decided’ they were at any stage, the more likely they wouldseek a STEM career direction.
Although partly related to career motivation, degree-related work experience had astrong influence on developing a career plan, mostly towards a STEM occupation.
A substantial proportion of final-year students had not made job applications by thetime of survey, nearly half way through the academic year. The majority of graduateswho did had applied both to STEM Specialist employers for STEM jobs or graduateschemes and to more general graduate schemes with employers related to or outsideSTEM.
Many STEM students and graduates did not use their university careers service, yetmost felt they would have benefited from additional career support at some point,particularly before they went to university in order to understand better how differentdegree courses related to potential careers or occupations.
In principle, most would study a similar degree if they had their time again, althoughperhaps a quarter would study a different course (and higher for some subjects).
Complex and individual paths post-graduation
Many graduates interviewed had still been undecided about career direction by thetime they graduated and delayed job applications until after university. Those choosingto take time out or enter temporary work were amongst the least ‘decided’ andpotentially the most likely to drift away from STEM.
Graduates’ eventual job destinations often did not correlate simply with their careerthinking before graduation; significant numbers who had applied only for STEM jobswhen finishing at university ended up outside STEM, while the reverse was also thecase with some who had only applied for non-related jobs at that time ending up inSTEM jobs.
For a minority, particular individual circumstances became more important thanstrategic career-thinking, as they had to take into account their own personalresponsibilities or the impact of potential decisions on personal relationships.
For those that secured jobs after leaving university, quite complex and often very
STEM Graduates in Non-STEM Jobs
6
individual decision-making had taken place, as pragmatic and tactical considerationswere combined with what remained of their prior aspirational thinking.
Some graduates had changed jobs since graduation, due to redundancy or their owntactical choice for similar but higher quality employment. Others had taken until thistime to recognise the true direction they wanted in their career; overall, these changestended to result in shift away from STEM employment.
STEM graduates doing non-STEM jobs
STEM graduates were found working for employers right across the economy, in bothprivate and public sectors, in a wide variety of job roles, although most of the graduatesinterviewed worked for larger employers.
Within the workplace, few graduates interviewed used their specific degree subjectknowledge a great deal (even those in STEM Specialist work), although their degreesubject was perceived as vitally important in gaining such jobs. On the other hand,almost all the graduates – irrespective of employment sector – used the general andbroader skills learned while doing a STEM degree to a much greater extent.
Some skills of high value to non-STEM employers were unique to STEM graduates,such as a particularly logical approach to solving problems, enabling some STEMgraduates to progress faster in their careers than non-STEM graduate colleagues.
Levels of satisfaction with current job and career progress were found to be very highamongst the graduates interviewed irrespective of employment sector, reflecting thatmany in the sample were in ‘good’ jobs with ‘good’ employers. Although many workingoutside STEM would like more degree-related work, as it might be more interesting,few considered it would be feasible to re-enter STEM occupations, largely due to theexpected drop in earnings they thought would result. On the other hand, many did notwant more degree-related work as they perceived it might be narrower than theircurrent work.
Employer perspectives
The interviews with employers confirmed previous research (and the student andgraduate survey findings) that a wide range of employers seek to recruit STEMgraduates, and that classifying employers by type can be ‘fuzzy’ with overlaps inplaces, especially between our defined STEM Specialist and STEM Generalistemployers.
The employers using the most targeted approaches to securing the STEM skills theyneed tended to be STEM Specialist employers recruiting graduates for STEM Corejobs (usually into a graduate development programme). Some of these graduateswould later move to STEM-related or unrelated jobs as they progressed with thatemployer. Many STEM Specialist employers also recruited STEM graduates directlyinto STEM-related or unrelated job functions too.

STEM Graduates in Non-STEM Jobs
7
STEM graduates could be recruited into a range of job roles or functions in STEMGeneralist employers, from investment banking and accountancy to education, as wellas commercial and specialised (‘STEM Core’) functions in non-STEM employers inboth private and public sector. Although STEM degrees were frequently welcomed bythese STEM Generalist employers, only in a few places was a particular need for aSTEM degree qualification specified on entry.
STEM Generalist (and also non-STEM) employers recruit STEM graduates for differentreasons – some focused more on their numeracy and analytical skills, others theirapproaches to problem-solving, yet others their technical knowledge and skills. It wasthe ability to apply some STEM knowledge and derived employability skills morebroadly which seemed most highly valued.
The interviews confirmed much of the existing evidence on STEM recruitmentproblems. STEM Specialists mainly perceived deficiencies in some STEM graduates’technical ability and subject knowledge, and in some cases also in their lack ofcommercial awareness. STEM Generalist employers did not generally encounterrecruitment difficulties.
There was a wide and sometimes contrasting range of views held about specific STEMdiscipline deficiencies. All types of employers felt that some STEM graduates lackedsome of the broader behavioural skills sought of graduates, such as particular team-working, communication and time management /organisational skills, as well as morecommercially-related skills.
Targeting certain universities or degree courses, or both, was seen as a necessary andvaluable part of graduate recruitment strategies of most STEM firms, in order to delivera sufficient supply of recruits of the calibre they required, and to compete with non-STEM employers. It did not necessarily mean that STEM students from other placeswere excluded, as any student could apply online, although potentially from a lowerinformation base. Many employers were actively working with schools, especially, andselected universities, to try to improve STEM students’ (and potential STEM students’)knowledge of STEM careers.
The majority of STEM Specialist employers were concerned about potential, and someactual, shortfalls of STEM graduates to fill their core functions, arising from graduatespreferring other employers and unrelated jobs. STEM Generalist and other employers,on the other hand, were more likely to see economic benefit in wider dispersion ofSTEM graduates across the economy. The two main reasons seen by employers ascauses of an outflow of STEM graduates ‘away’ from specialised STEM jobs/careerswere the perceived greater attractiveness of careers outside STEM (not least theperception of higher salaries) and the graduates’ lack of real knowledge about workingin STEM core functions.

STEM Graduates in Non-STEM Jobs
8
Overall conclusions
The research has given insights to many issues in the career decision-making of STEMstudents and graduates and their recruitment to a wide range of jobs and employers. It hasbeen shown to be an area of greater complexity than often recognised; and there is not aclear or simple main reason why some STEM graduates are not in STEM jobs. It may resultfrom many individual factors, but the most likely one reported is that students and graduatesfind other (non-STEM) work potentially to be more interesting, and/or that their chosen STEMdegree turns out less interesting or enjoyable than expected so they actively seek a changeof direction.
The decision on whether to apply for and enter STEM work is often more a matter ofindividual choice which takes in a number of push and pull factors, both personal andemployment-related, over a period of time. Few students appear to be primarily motivated bypay in choosing a STEM or non-STEM career (despite the economic evidence that financialreturns in STEM are better), or are turning away from seeking a STEM job because theyhave experienced rejection on the grounds of inadequate skills. Some can be influencedstrongly away from the degree-related areas of work which they thought they might pursue bythe pull of individual employers; for quite a number this is after they leave university as manydelay job applications until after completing their degree. Furthermore, it seems that, ratherthan them seeing STEM Specialist employers or STEM Core job functions as the expected ormainstream career option for STEM graduates like themselves, a good number (although notthe majority) prefer corporate graduate schemes , the majority of which are outside STEMSpecialist sectors. For many, and particularly those that have not done degree-related workexperience, this is reinforced by their lack of knowledge or experience of what STEM Corejobs and careers are really like, or what the wider opportunities to use their skills and learningopen to them might be in STEM-focused jobs, in STEM Specialist or Generalist sectors.Increasing opportunities for STEM-degree related work experience would be beneficial indeveloping better understanding in these areas.
The research has called into question the widespread assumption that STEM studentsexpect themselves to become STEM workers/employees. This ‘default’ career direction isclearly not what many STEM students or graduates have in mind or are adhering to. Thesituation is more complex and career paths less simple and less predictable than generallythought. The research has also highlighted the fluidity of the students’ and graduates’ careerdecision-making (and lack of career thinking in many cases) which lies behind many of theobserved individual outcomes. A number of policy messages arise from the research:
Limitations need to be put on an expectation that choosing to study a STEM subjectleads to entering a STEM job. This link has been an important part of the STEMpipeline model which has formed part of the Government’s STEM skills strategy, andmay require some rethinking.

STEM Graduates in Non-STEM Jobs
9
A wide range of job opportunities is open to STEM qualified students, and they cansecure employment if they develop the appropriate academic and personal skillssought by employers. But there is insufficient awareness of the full range ofopportunities available to them and employers’ requirements. Furthermore, not enoughget the opportunity to gain experience or knowledge of work in STEM which would bebeneficial to them in understanding what STEM work entails and how STEM careerscan develop. Many acknowledge they would have benefited from additional careersupport either before they went to or during their time at university.
For employers, especially those in STEM Specialist sectors, the research confirms thatmany STEM graduates are attracted to other areas, often because of a lack ofknowledge of what STEM work and careers look like but also because the graduatesperceive other areas to be of more interest. It appears to be more a case of ignorancerather than decisions to go in other directions due to well-founded negative views. Withso many students apparently undecided and without well-founded views, there is muchpotential to help STEM students firm up career ideas while at university and beyond(especially in the first year or so after graduating when many appear to ‘drift away’ fromSTEM). STEM employers need to make their case more visibly, both in terms of theattractiveness of the offer and career prospects but also the opportunities forinteresting and rewarding work within STEM employment sectors..
Employers in STEM specialist sectors are still reporting mismatches between theirrequirements and the skills offered by STEM student applicants, a problem highlightedby previous studies. Weaknesses in core discipline knowledge and understanding anda lack of high calibre applicants was widely commented upon, as well as for some,specific skills (in Mathematics, for example) and their general employability. Thoughaction has been taken by universities to align many STEM degree courses more toemployer demand, it seems that more needs to be done by them to engage effectivelywith employers and take account of their needs in the curriculum.

STEM Graduates in Non-STEM Jobs
13
1. Context and methodology in brief
This report documents extensive new research, commissioned by the Department forBusiness, Innovation & Skills (BIS) in 2009, into the early careers and career decisions ofSTEM (Science, Technology, Engineering and Mathematics) students and graduates in orderto understand why many elect not to enter STEM occupations and/or STEM employmentsectors and what influences these career choices. This section outlines very briefly thecontext to the research, its objectives and questions, definitions used and the researchmethodology. A more substantial treatment of these issues is given in Appendix A.
1.1 Context and research questions
Behind the research lay evidence that significant proportions of STEM-qualified graduatesare found in employment not related to their degree – that is to say not in ‘STEM work’. Thisis despite an apparent salary premium for STEM graduates who are and reports of employerdemand for STEM graduates and shortages of specialist STEM skills – an apparent paradoxor at least a suggestion that this part of the graduate employment market is not operatingpredictably in terms of conventional economic supply and demand. It could not be explainedsufficiently from evidence collated and analysed by DIUS (now BIS) in its 2009 report Thedemand for STEM skills although several possible hypotheses were suggested there.
The issue raises concern because of the widely held view that the future success of the UKeconomy depends increasingly on high ‘added value’ and knowledge-intensive industries,many of which rely on a workforce with graduate-level STEM skills and qualifications. Theseinclude both ‘traditional’ STEM employers in manufacturing and R&D as well as servicesector employers where the value of science and technology is also increasingly recognised.As a consequence, recent Government policy has supported the funding of activities toencourage greater numbers of young people to study STEM subjects at school or collegepost-16 and to enrol for STEM degrees in Higher Education, with the expectation that mostwill help to satisfy growing requirements for an increasingly STEM-qualified workforce.
This study focused on what happens during and immediately after Higher Education, which isa potential point of ‘leakage’ from the STEM ‘pipeline’; and crucially why. The primaryresearch aim was to understand why some STEM graduates do not work in occupationsrelated to their degree. In order to understand this fully, it was felt necessary also tounderstand better the reasons why many other STEM graduates do. The research objectivestherefore were to:
Provide an understanding of the decision-making process and reasons underlyingSTEM undergraduates’ and postgraduates’ decisions about careers;
STEM Graduates in Non-STEM Jobs
14
Learn from the experiences of STEM graduates, in both STEM and non-STEMoccupations, about their actual career and job decisions at and after graduation, andtheir subsequent experiences and career decisions while in employment;
Understand employers’ requirements and strategies in relation to recruitment of STEMgraduates and how these might affect graduates’ decisions and careers.
The research aimed to explore the extent to which STEM graduates make consciousdecisions to follow career paths away from STEM jobs, or whether they seek to enter STEMjobs but are prevented from doing so. Thus, the study sought to identify the main factorsshaping STEM graduates’ decisions and employment outcomes, and which have mostimpact on their decision-making and subsequent paths. It sought also to understand theextent to which the decision-making of STEM students at graduation (or first job) determinestheir long-term career direction, or whether opportunities might exist for subsequent re-entryto STEM occupations later in their careers. The extent to which there is variation in decision-making of people studying different STEM subjects was explored to see how this couldaccount for the differential rates of entry to STEM occupations previously reported2. We alsoaimed to identify such variation according to the graduate’s type of institution, qualification orother personal factors such as gender.
1.1.1 Evidence to explore further and hypotheses to test
Prior to this research, DIUS (which preceded BIS), in ‘The demand for STEM skills’ (BIS,2009a), analysed existing evidence and made a series of observations relating to the supplyand demand of graduate-level STEM skills. It suggested some possible hypotheses whichcould potentially explain the observed employment patterns of STEM graduates and also theco-existence of a shortage of STEM graduates with apparent market forces encouragingthem to enter STEM employment. These are discussed further below, along with somefurther exploration of the contextual evidence undertaken at the outset of the study (reportedin more detail in Appendix A) which formed the basis of our investigations.
A significant proportion of STEM graduates are not in STEM occupations
Historically, the manufacturing industry has been the main employer of STEM graduates butthis pattern has shifted over time and there is now a much broader spread of STEMgraduates across industrial, business and services sectors. Analysis conducted by DIUS (inBIS 2009a) of the Labour Force Survey (LFS, 2008) estimated that, approximately, just overa third of STEM graduates were working in ‘non-STEM’ occupations, although this figurevaried between graduates of different degree subjects. It also acknowledged that definingSTEM occupations was not easy as there can be problems in ‘fitting’ certain identifiableSTEM jobs into Standard Occupational Classification codes (SOCs), especially in new and
2 See Appendix A for data on employment outcomes of graduates from different STEM disciplines
STEM Graduates in Non-STEM Jobs
15
emerging employment fields. BIS used a series of SOCs to define ‘science-relatedoccupations’, and also included financial and teaching occupations, to arrive at its estimate ofSTEM employment. It showed that just under half of STEM graduates were in its defined‘science-related occupations’, a further 4-8% in financial occupations (but this rose to over20% of mathematics graduates), and 9-10% were in teaching. The latest L-DLHE(‘Longitudinal’ Destinations of Leavers from Higher Education) survey from HESA (2009),which measured employment outcomes of 2005 graduates 3.5 years after graduation,provides further evidence of the spread of STEM graduates across different areas ofemployment. It shows the extent to which graduates from certain disciplines are workingoutside manufacturing or other industries, for example: 22% of Mathematics and 10% of ITgraduates were in the finance sector, and 15% of Biological and Physical Science graduatesworked in the public sector (such as in administration, defence or social security).
A wage premium exists for STEM graduates in STEM-related work
Analysis by BIS of the LFS and L-DLHE data on earnings revealed there to be an earningspremium for STEM graduates at the level of annual first-degree earnings, reinforcing thefindings of other studies which suggest a premium over the course of a working career formany STEM qualified graduates. Deeper analysis, however, suggested that the wagepremium mainly exists for STEM graduates who work in science and financial occupations,rather than all those who possess a STEM degree. Although there was again considerablevariance according to degree subject, for all subjects analysed there appeared to be at leastsome premium for working in a science or financial occupation (referred to as STEMemployment there), either as early-career wage or average annualised pay. The existence ofa wage premium for such occupations would be consistent with a shortage of STEMgraduates to work in these fields, on the basis of conventional supply and demand.
Is there a mismatch between employers’ requirements and graduate applicants’ skills?
It is possible that there is some mismatch between the types of STEM and other skills offeredby current STEM graduates and the needs of the employers. This could result in some STEMgraduates being unable to secure employment in STEM occupations, and entering alternativesectors or career paths instead. There is evidence for certain STEM skills mismatches (seereports form CBI, e-skills, HEFCE, ABPI etc. in Appendix A), including long-established,though often anecdotal, impressions that some technically able graduates (andpostgraduates) have weak transferable or employability skills, and also recently highlightedperceptions of employers about the overall quality of STEM graduate supply. Therefore, itcould be that a higher proportion of STEM graduates are actually seeking to enter STEMoccupations, but some may be prevented from doing so by individual skill shortfalls orstringent skills requirements on the part of STEM employers.

STEM Graduates in Non-STEM Jobs
16
BIS cited two further strands of evidence which would possibly be consistent with this, i.e.that some STEM graduates were taking up roles, including non-graduate roles, outsideSTEM occupations, after failing to secure STEM jobs. Analysis of L-DLHE data showed thatSTEM graduates working in science occupations have been just over one month lessunemployed than STEM graduates working in non-STEM occupations. There was alsoevidence from the L-DLHE survey that STEM graduates in science-based jobs were lesslikely to be classified as over-educated for the job they were doing, than STEM graduatesworking in other occupations (where ‘over-education’ was taken to mean working in a ‘non-graduate’ job).
Are STEM occupations or employers seen as undesirable by STEM graduates?
If substantial numbers of STEM graduates are choosing not to enter STEM occupations, thiscould be due to the existence of, or perception of, certain undesirable characteristics whichare not compensated for by a wage premium. On the other hand, evidence from the L-DLHEsurvey on satisfaction with career to date suggests that STEM graduates in science-relatedjobs report somewhat higher satisfaction rates than those working in other jobs. Equally, ahigher proportion of those working in science-related jobs stated that they would study thesame subject if they had to do it again, than those in other occupations, which is alsoconsistent with broad ‘satisfaction’.
However, a range of factors relating to STEM occupations, such as undesirable locations ofSTEM employers, poor images or reputations of jobs or employers, or other perceptionsrelating to work and career, have been shown to contribute towards negative views aboutpursuing STEM careers (discussed further in Appendix A). Some of these potential factorscould largely be issues of perception, while others (such as the differential availability ofSTEM jobs by geographical location, or the nature of the working environment) might bemore physical.
STEM jobs may not be perceived as high value in comparison with other jobs
It could be that students and graduates have ‘conscious constructs’ of STEM and non-STEMjobs, to which they might attribute different value. This could be interpreted as a perceptionthat a STEM job is “worse” (or “better”) than a non-STEM job, in the same way that someattribute status to certain professions, and could lead to graduates feeling less successful ifthey had a STEM job, or the reverse. Potentially, this could also be affected if they wereconscious of Government’s desire to assure sufficient STEM skills in the workforce. There islittle in the research literature which investigates this, but it is possible that the poor publicimage of STEM and STEM careers, in particular the lack of recognition of the valuablecontribution that science and technology make to wealth and human well-being, which hasbeen demonstrated by prior research, could be a factor influencing students’ and graduates’decisions to take up STEM jobs or careers.

STEM Graduates in Non-STEM Jobs
17
Only the higher ability graduates may be getting STEM jobs
There appears to be evidence that STEM graduates working in STEM jobs are somewhatmore ‘able’ (as measured by UCAS3 tariff scores on entry to university) than those who arenot working in STEM jobs – at least in overall terms, as some non-STEM employmentsectors also require high levels of academic attainment and are very competitive. Highproportions of all STEM students study for their degrees in high or highest tariff universities,relative to many other degree subjects, but the reasons for differential attainment (measuredthis way, such as on A-level grades) between those in different occupations are as yet notfully understood. However, this could be consistent with the entry requirements demanded bySTEM employers being higher than those in some non-STEM sectors, and so a factor insome STEM graduates’ decisions to seek work there.
Individual career choice can be affected by a variety of factors, operating over time
A range of factors, in addition to earnings and employer demand, are known to affectemployment outcomes, including individual career choice. This in turn is affected by a myriadof factors, including chance events, as research has shown (see Appendix A). For somestudents the decision to go into a STEM career can result from an earlier decision taken atschool, while for others it can be a part of a long-term process of career decision-forming athome and school which interacts with subsequent experiences at university, during periods ofwork and job searching. These influences can include school subject choices, careers adviceand guidance, contact with employers, parental background and perceived image of STEM,peer group attitudes and so on, and can vary by gender, ethnicity and social class. Therehave only been a small number of studies which have focused on the career intentions ofstudents, and only in some STEM disciplines, mainly engineering and IT. These have mostlyfocused on general career intentions while none has explored in detail the reasons why aSTEM graduate might choose not to ‘stay’ in his or her discipline when making careerchoices.
1.2 Defining STEM
The term STEM (Science, Technology, Engineering and Mathematics) is increasingly usedtoday by Government and others but its scope can be subject to differing interpretations.
Within this project, after reviewing approaches taken by others, we adopted the followingdefinitions of STEM:
3 UCAS: Universities and Colleges Admissions Service

STEM Graduates in Non-STEM Jobs
18
As a subject of higher education study or qualification, our definition of STEM used JACS4
codes in the following broad subject code groups:
(B) Subjects allied to medicine
(C) Biological sciences
(D) Agriculture & related subjects
(F) Physical sciences
(G) Mathematical sciences
(G) Computer science
(H,J) Engineering & technology
(K) Architecture, building & planning
Thus a graduate (with a first or higher degree) in any of these subject groups would beconsidered a STEM graduate. However, we deliberately excluded certain very vocationalsubjects (which were included in the scope of some previous STEM research) -- Medicineand Dentistry, Veterinary Science and Nursing – since graduates from these subjects areknown predominantly to enter directly related STEM occupations (e.g. doctors, dentists, vetsand nurses, respectively). It was specifically agreed with BIS to include in our researchstudents of Psychology, Geography and Archaeological/Forensic Sciences. These aresubjects within the JACS broad subject groups above but for which there is a spectrum ofmore and less ‘scientific’ courses and study.
When considering employment sectors, we identified three broad clusters and named them‘STEM Specialist’, ‘STEM Generalist’ and ‘non-STEM’ employers, defined as follows:
‘STEM Specialist’ employers: recruit graduates for roles where a degree in a certainSTEM subject or group of STEM subjects is required for entry to a graduateprogramme or direct to appropriate jobs;
‘STEM Generalist’ employers: recruit STEM graduates or consider them to bepotentially suitable candidates within graduate programmes or roles which are open toholders of a range of degree subjects. Although they do not list a STEM subject as a
4 JACS: Joint Academic Coding System (by HESA)

STEM Graduates in Non-STEM Jobs
19
requirement for entry, they see the skills or knowledge gained from study of STEMcourses as an advantage for the jobs being filled.
‘Non-STEM’ employers: make no distinction by degree subject at recruitment (at leastin relation to STEM subjects) and have no specific demand for STEM graduates, butmay still recruit them into graduate programmes or directly to jobs.
In terms of occupation, we also identified three categories, which we defined as:
STEM Core jobs, where STEM degree disciplines are closely related to the type ofwork; for example, scientific, research and development professionals, engineeringand IT professionals and a range of other associate scientific professional andtechnical jobs (such as lab technicians, surveyors, ophthalmic opticians etc.).
STEM-related jobs, where some STEM degree disciplines are more loosely related tothe type of work; for example, certain business professionals (such as auditors,financial consultants, underwriters, also some marketing, sales and legal rolesrelating to STEM Specialist businesses), certain associate health professionals, butalso science administrators and policy advisers, some education professionals(secondary science teachers), and business managers in relevant sectors(healthcare, conservation);o All other jobs were classified as ‘Unrelated’ (to STEM) jobs.
We then ‘positioned’ individual jobs by combining our classifications of employment sectorand occupational role/function (Figure 1.1). Although boundaries between categories aresomewhat fuzzy, and there may be some subjectivity in positioning a particular job, theresulting ‘matrix’ is useful in illustrating to what extent a job is a “STEM job” or a “non-STEMjob”. Although no specific boundary can be drawn between the two, “STEM jobs” rangeoutwards from the lower left corner of the matrix, while “non-STEM jobs” were those towardsthe upper right corner. Illustrative job roles within Figure 1.1 demonstrate this approach.

STEM Graduates in Non-STEM Jobs
20
Figure 1.1 Plot of illustrative jobs using both employment sector and occupational role classifications
If SOC codes are allocated to these illustrative jobs, what this also shows is that the sameSOC code can appear in more than one matrix segment. This reinforces the observation thatit is necessary to have both the SOC and SIC code of a job in order to determine how much itis a “STEM job” or not. We have given details in Appendix A on how our classification relatesto both the SIC and SOC coding systems, and also give there further details on otherapproaches to defining STEM jobs and how they differ from ours
1.3 Methodology and samples
The methodology comprised three strands:
Quantitative online surveys of STEM students, i.e. STEM undergraduates (mainlyfinal year), postgraduates on taught courses (mostly Masters degrees) and Doctoralstudents, to obtain information on the career thinking and decision-making of thosestudying STEM subjects in Higher Education, and their career intentions in particular;
Interviews with STEM graduates in early career employment to learn about the realexperiences of STEM graduates who had entered the labour force. The principaltargets were STEM graduates who were not working in STEM occupations or sectors,although some STEM graduates who worked in STEM occupations, and some non-
IT manager in localauthority (LA)
LA highway engineer
LA fitness instructor
IT manager for bank
Actuary
Pharma lab chemistSoftware engineer
Electronics designerEnvironmentalconsultant
Medical physicist
Scientific publisher
Museum explainer
Science policy adviser
Accountant
Investment bankerSecondary scienceteacher
Product designer
Pharma marketingmanager
Finance manager fortelecom company
Logistics firm analyst
Retail manager
Policy adviser
Commercial lawyer
Social care manager
IP/patent lawyer
Management consultant
HR manager forengineering firm
Sport/fitness equipmentsales
SurveyorSound engineer
Unrelated
STEM related
STEM core
Occupationalrole
STEMSpecialist
STEM Generalist Non-STEM Employmentsector

STEM Graduates in Non-STEM Jobs
21
STEM graduates, were included for comparison. ‘Early career’ was taken to meanthose who had been in the workplace for 1-5 years, close enough to graduation tohave good recollection of their perceptions and decisions while in HE but long enoughfor them to be in stable employment. These were chiefly conducted by telephone, witha proportion of face-to-face interviews for greater depth.
Interviews and discussion groups with employers across a range of sectorsencompassing our three defined groups, including both private and public sectororganisations and a range of types and sizes of employer.
1.3.1 Samples achieved
Over 7000 complete responses were received to the undergraduate and taught postgraduatesurvey, of which almost 4300 were both from the UK/EU/EEA and were in their final year orwere taught postgraduate students (i.e. the target sample). A parallel survey of PhD studentsreceived over 2,900 responses within STEM subjects.
Full details of the characteristics of the survey respondents are given in Appendix A. Theundergraduate and taught postgraduate survey responses were from students at 115 UK HEinstitutions, with 42% at Russell Group universities, 23% within the 1994 Group and 36%from other UK universities. By degree subject studied, there was good coverage across thetarget STEM subjects, although it somewhat under-represented students in Subjects allied toMedicine and somewhat over-represented those studying Physical Sciences. The STEM PhDstudents were studying at 106 universities and research institutes, including 61% at RussellGroup institutions.
Over 480 interviews were conducted with working graduates by telephone, with a further 70in depth conducted face-to-face. Interview candidates were mostly identified and recruited viaemployers, as well as through a range of other networks. The individuals interviewed workedfor 128 different employers (including 10 different Government departments), as well as a fewwho were self-employed; detail of their personal characteristics is in Appendix A.
The sample of working graduates was not aimed to be representative statistically but insteadto be illustrative of the range of employment sectors and occupations in which STEMgraduates are found. The sectors and occupations in which they worked are detailed inAppendix A. Using our classification, of the STEM graduates, about 40% were working inSTEM Core jobs, 37% in STEM-related jobs and 22% in unrelated jobs. By employmentsector, they were split relatively evenly between those working for STEM Specialist (36%),STEM Generalist (34%) and non-STEM employers (30%), reflecting the targeting achievedduring volunteer recruitment.

STEM Graduates in Non-STEM Jobs
22
In terms of their HE background, a good spread was achieved across the target degreedisciplines. Just under a quarter had a higher degree, while 64% had been to Russell Groupuniversities and 85% had obtained a first or upper second class undergraduate degree.
Employers covering a wide range of industrial and services sectors were targeted forinterviews and within discussion groups, structuring the sample around the three mainemployment sector groups defined (STEM Specialist employers, STEM Generalist employersand Non-STEM employers). Thirty individual interviews and two discussion groups wereundertaken, covering 51 different employers (i.e. organisations or divisions of businessgroups), classified as 15 STEM Specialists and 36 STEM Generalists or Non-STEMemployers.
1.3.2 Implications and limitations of the samples
The samples achieved in the quantitative surveys of undergraduates and taughtpostgraduate students, and doctoral students, were substantial and compared reasonablywell with national cohort proportions in terms of key demographic characteristics, for the mainsubjects under scrutiny. The main attraction strategy, using a range of subject-basedorganisations and other groups to contact HE staff, who in turn forwarded e-mails to theirstudents, added an element of “randomness” to the distribution, increasing the likelihood ofthe samples being representative of the broader national STEM student cohorts.
The sample of graduates interviewed was not representative either of STEM graduates inearly-career employment or of STEM graduates working in ‘non-STEM’ jobs. It waspurposive, designed to include graduates working in a wide range of sectors and functions, toillustrate the range of choices made and to understand how those career decisions had beenmade. However, the reliance upon employers within the attraction strategy led to an over-representation of graduates who worked for larger organisations, as their more significanthuman resources and recruitment teams had sufficient capacity to assist in the research. Thehigh recruitment criteria for these ‘premier’ graduate employers are reflected in the relativelyhigh academic achievement of many of the interviewees, in terms of their degree class.Equally, it is likely that relatively few graduates interviewed had not been successful in findingemployment. The sample therefore needs to be considered mainly to be ‘strong’ graduates in‘good’ jobs, rather than a full cross-section of STEM graduates in employment.

STEM Graduates in Non-STEM Jobs
24
2. Overall findingsWe here summarise the main findings of the research and our conclusions. The full results ofthe three strands of the study are presented in Chapters 3, 4 and 5, while additional backgroundinformation and tables of data are provided in Appendices A and B.
2.1 Why do some STEM graduates not work in STEM jobs?
In simplest possible terms, STEM graduates’ career decisions appear to be driven byindividual choice rather than any one dominant ‘rational’ factor such as earnings orcareer prospects, or a ‘practical’ factor such as skills mismatch or job availability.Individuals’ choices take in a number of ‘push’ and ‘pull’ factors and influences which are bothpersonal and employment-related, and which operate over a period of time.
2.2 Underpinning observations
Three main general observations are drawn from the research results which underpin many ofthe more detailed findings and conclusions, and so these are discussed first.
Neither a STEM degree nor, especially, a STEM career/occupation is a clear concept forstudents, graduates or employers, nor universally to policymakers or analysts either.
This was seen in all strands of the research:
In the initial literature review, where a lack of consistency was highlighted in the waysSTEM has been defined, especially in terms of employment, (and sometimes it is notdefined at all); this has led to differing and inconsistent estimates of STEM supply anddemand;
In the student survey, where students of certain subjects identified particularoccupations as degree-related but others did not. For example, Mathematics studentsconsidered accountancy, teaching and banking as closely related to their degree, andSports Science students saw teaching the in same way, but Engineering students hada greater focus on R&D work and manufacturing when considering what constituteddegree-related employment;
In the graduate survey, again, graduates seemed not to have any construct of aSTEM degree (or a STEM-related occupation) but tended, perhaps not surprisingly,also to view potential jobs and careers in relation to their own degree subject. Manygraduates were unsure of the meaning of certain letters in the acronym STEM;
In the discussions with employers, the STEM acronym was widely recognised butvariably interpreted, in terms of the academic disciplines and the meaning of theletters, especially by those outside our defined STEM Specialist sector. The generic
STEM Graduates in Non-STEM Jobs
25
term ‘STEM’ is not in the ‘business language’ or terminology used by many firms ingraduate recruitment. Rather, terms like ‘scientist and technologist’ or ‘engineering ortechnical’ are preferred, or graduates are sought only from certain STEM subjectdisciplines (e.g. Computer Science, Engineering).
These issues, around the lack of clarity, added complexity throughout the research and tend tohinder the ability to draw clear conclusions in relation to the key research question – why not gointo STEM?
A wide range of jobs is open to STEM graduates within an equally wide range ofemployers. We identified a very wide range of jobs open to STEM graduates, both in thegraduate survey and employer dialogues. These were where graduates from STEM disciplineswere either directly sought or where such applicants had an advantage over others, in somecases for specific subject knowledge but especially for the broader skills that accompanied themand which had been developed during a STEM degree. There were also jobs open to graduatesin any degree subject for which STEM graduates apply. Our mapping of jobs into STEM Core,STEM-related and Unrelated occupations, and of employment sectors into STEM Specialist,STEM Generalist and non-STEM, was a refinement on the simple STEM vs. non-STEMdichotomy used by some researchers and policymakers. It helped to highlight both thesignificance of STEM graduate opportunities across a wide range of sectors and also to givemore insight into the wide demand for some STEM graduates across the economy, for whichreason traditional, solely SIC-based or SOC-based, classifications prove insufficient. However,the approach adopted is recognised as being only a first step, and rather crude, and furtherwork might improve our categorisation (i.e. through adaptation or revision). This could aidgreater clarity in future research and, perhaps more importantly, encourage its use in careersadvice and guidance practice with future STEM graduates.
For many STEM graduates, career plans are not well developed. A thread running throughboth the student and graduate survey findings is the extent to which career decision readiness(or, more simply, the level of ideas about careers) is relatively under-developed. We foundnearly a quarter of the undergraduates to have no or only vague career ideas when surveyedalmost mid-way through their final academic year. Only around a third of students had a definitecareer plan by then, with the majority of students considering various options; and just over athird (37%) had applied for jobs (although this was about 60% of those who intend to enter long-term employment directly after graduation). This pattern varied by subject: higher proportions ofstudents in Architecture, Building and Planning (52%) and Subjects allied to Medicine (48%)had a definite career plan than students in Geography (22%), Chemistry (24%) and ForensicScience/Archaeology (24%); and more final year students in Engineering/Technology (58%)had already applied for a job than in Psychology, Sports Science or Biological Sciences (allaround 20% ) or Forensic Science/Archaeology (17%).

STEM Graduates in Non-STEM Jobs
26
Around half of the working graduates interviewed had made long-term5 job applications by thetime they left university, but over a third had made none at all – reflecting a similar position tothat reported by the final-year undergraduates. However, these proportions did represent‘progress’ over time, as only 16% of the graduates (and 19% of the students) surveyed had adefinite career plan when starting their degree. Furthermore, the vast majority had chosen theirdegree course for reasons other than strategic career thinking. ‘Interest/enjoyment of the work’was the reason given by almost all graduates (85%), while a third gave ‘personal ability’ andfewer still, just under a quarter, chose it for ‘improved job prospects’. Students mainly cited‘personal interest/aptitude in the subject’ (77%) and ‘enjoyed studying subject at A-level’ (67%)as the main reasons for choosing their degree course, though around half wanted to pursue acareer in this field while, interestingly, a similar proportion thought it would keep their careeroptions open. Again we saw variation by STEM subject; desire for a career in the field was lessfrequently mentioned by students in Chemistry and Geography (around a third) and Physics andMathematics (around 40%). ‘Keeping career options open’ was more likely to be mentionedthan ‘wanting to follow a career in the field’ by Engineering and Technology, Physics,Chemistry, Geography and Mathematics students, while the reverse was the case in most othersubjects.
Their experiences at university, and the influences upon them, did appear to have had agenerally positive effect in terms of firming up career ideas. However, this pattern varied bySTEM subject, with those in Engineering and Computer Science being more definite aboutcareer plans generally than others, especially those in the sciences. The situation forpostgraduate research (PhD) students was markedly similar, although more taughtpostgraduates had firm career ideas (after all, many had pursued postgraduate study for careerreasons).
This is perhaps not an unsurprising result or one that only applies to STEM students, as otherresearch has shown (see, most recently, the 2010 Graduate Real Prospects Survey). Manygraduates leave university today with few ideas about the career they will follow and beforemaking any applications for long-term graduate jobs, often with unrealistic expectations aboutthe kinds of jobs employers will recruit them to. Many of the observations in our surveys mayapply similarly to non-STEM graduates (and did appear to, from our limited non-STEM graduatesample). However, it is has been shown in other research to apply much less to very vocationalsubjects like Medicine, Veterinary Science or Nursing, where there is a more visible and wellrecognised link between degree study and career (hence their omission from our study). Itwould seem that there is potential here to reduce this uncertainty among STEM students, whichcould lead to an improved supply of graduates into STEM work. Some of the employers weinterviewed recognised this and were actively working on improving the level of knowledgeindividuals had about careers in their own firms or industry. Most were focusing on youngpeople before they went to university, which seems also to have merit given our finding that
5 As opposed to applications for temporary or vacation-type work

STEM Graduates in Non-STEM Jobs
27
nearly a quarter of final year STEM students would do a different degree were they,hypothetically, to have their time again.
2.3 Do STEM graduates want a STEM degree-related career?
Only a very small proportion of STEM students report that they do not wish to pursue aSTEM degree-related career by the time they are nearing graduation. About one in eightSTEM final year students, one in ten STEM PhD students and one in twenty taught STEMpostgraduates definitely did not want to, or did not think they wanted to, pursue a career directlyrelated to their degree when they graduated. This proportion did vary by subject, but not hugely,so that in all subjects it was a small minority (none above one fifth or so of final yearundergraduates), and did not seem to vary by gender.
Thus, the vast majority of STEM students in their final academic year are considering pursuingSTEM careers, though some are more definite about this than others and some are consideringvarious jobs or careers alongside STEM careers at this time. Overall, just over half definitelywanted to pursue a career in an occupation related to their STEM degree and a third might wantto do so. Students in some subjects were more definite than others about staying in STEM,though the differences were not huge (Figure 2.1: ‘definite’ proportions ranged from around 60%in Engineering and Technology, Other Physical Sciences and Architecture, Building andPlanning, to just over 40% in Geography, Physics, Forensic Science/Archaeology and alsoMathematics. However, as mentioned, what is considered as degree-related employment variesconsiderably between subjects.

STEM Graduates in Non-STEM Jobs
28
Figure 2.1 Percentage of respondents who definitely want to pursue a career in a
degree-related occupation (Final year undergraduates and taught postgraduates)
0 10 20 30 40 50 60 70 80 90 100
Other Physical Sciences
Engineering andTechnology
Architecture, Building andPlanning
Computer Science
Subjects allied to Medicine
Biological Sciences
Psychology
Chemistry
Sport Science
Mathematical Sciences
ForensicScience/Archaeology
Physics
Geography
All respondents
Final year undergraduates Taught postgraduates
Multiple careers and jobs/occupations are in many STEM students’ minds aroundgraduation – some unrelated to degree subject. Although most said they were likely topursue a STEM career, many of them were looking at the possibility of working in a range ofsectors or jobs using their learning from a STEM degree in different ways. Among those whohad distinct careers in mind by their final year of study, about half overall expected a career inour defined STEM Specialist sector and just under half in our STEM Core jobs group (Table2.1). A further 21% specified careers in both STEM and non-STEM sectors, while 18% specified

STEM Graduates in Non-STEM Jobs
29
both STEM and Unrelated job functions. However, this pattern varied considerably by STEMsubject with, in particular, much higher proportions not planning to work in STEM Specialistsector or STEM Core functions in the less vocationally focused or broader subjects, such asMathematics, Geography and Psychology.
Table 2.1 Expected occupational function for those with career plans, for selected subjects of study
(final year UK undergraduates), expressed as percentages
Subject group
STE
MC
ore
STE
Mre
late
d
Unr
elat
ed
ST
EM
/C
ore
rela
ted
Mix
edfu
nctio
ns
Don
'tkn
ow
Num
bero
fca
ses
Subjects allied to Medicine 65 6 8 9 9 2 109
Biological Sciences 51 9 11 11 18 0 276
Psychology 36 14 16 9 24 1 234
Chemistry 45 13 6 15 19 1 157
Physics 47 19 7 15 11 1 162
Mathematical Sciences 13 50 11 7 17 2 151
Computer Science 50 4 17 8 21 1 194
Engineering and Technology 65 2 7 6 19 1 474
Geography 31 18 13 11 23 4 160
All final year STEM 47 12 12 9 18 2 2187
Those students with firmer career plans are more likely to intend to pursue a STEMcareer, and vice versa. As highlighted above, many students’ career plans were not welldeveloped, and although they did improve during their degree study, there was a significantminority still very uncertain about which career to choose or employers/jobs to apply for, andlikely not to decide until after university. It was clear though that a higher proportion of final-yearSTEM students with definite career ideas intended to pursue degree-related careers, than ofthose who were still ‘undecided’ about careers at this stage.
2.4 Why choose a STEM career or a non-STEM direction?
The main reasons for applying for STEM degree-related jobs are to have potentiallyinteresting work and to use specialised skills/learning. High proportions of those final yearSTEM undergraduates who definitely intended to pursue a STEM career were motivated byexpected excitement, interest and challenge in the work, wanting to continue in a field they hadenjoyed, or wanting to put their learning into practice (all reasons given by over 60%). Thoseless certain about continuing in a STEM career direction (but who still might do so) weresimilarly motivated, although a proportion had not enjoyed their degree course and did not seethe logic of continuing in it (43%). By contrast, career-based or practical/tactical reasons,including having better long-term career prospects or being better paid, were motivating factorsfor staying in STEM for only a minority of students. Expected pay was a stronger factor for

STEM Graduates in Non-STEM Jobs
30
Engineering and Technology, Mathematics, Other Physical Sciences, Architecture, Building andPlanning, and Computer Science students (mentioned by over a third of STEM career‘definites’), and more so for men than women (31% v. 25% of STEM career ‘definites’).
Graduates currently in STEM work (STEM Specialist employers/STEM Core jobs) had, similarly,in the main, chosen their current work for enjoyment/interest (over 50% gave this reason) orbecause it was the ‘type of work they wanted’ (over 40%), although salary, company benefitsand location were also of importance (but mentioned by under 30%) and seemingly more so forthem than for those in less STEM-focused work (i.e. those employed by STEM Generalistsemployers or in a STEM-related job). However, many individuals in the latter group rated factorsrelating to their employer’s reputation or training/development scheme as more importantreasons than interest/enjoyment, suggesting that other more practical or more individualemployer-orientated factors may have greater importance for those choosing this kind of STEM-related career path.
Reasons for not staying in STEM are less polarised and mainly to do with studentsfinding other fields of more interest. Most students seeking employment in a non-STEMdirection (though relatively few) make a conscious decision to do so, primarily for potentialinterest in other fields (over half the undergraduates and nearly half of postgraduates gave thisreason, Table 2.2). For most this was despite enjoying their undergraduate course, but 40% hadnot enjoyed it and this was also a reason for not wanting a STEM career. A quarter said theyhad never intended to work in the field of their degree. Potential earnings do not seem to have astrong role (mentioned by less than a third of students who might or definitely don’t want aSTEM career). We found little evidence of students being prevented from pursuing a STEMcareer by an external reason, although there were a few examples (e.g. students being rejectedby STEM employers, too few jobs, or too few jobs in preferred location). Once decided on anon-degree related direction, issues like employer reputation or prestige, or graduate schemequality, became important in rationalising their decisions.
Understanding the actual decisions made by graduates now in the workplace (i.e. why theychose their job) revealed that pragmatic or tactical reasons became increasingly important oncethey left university. Many decisions combined personal aspirations, some knowledge of thelabour market and employers, and pragmatic personal issues, which could result in veryindividual decisions and pathways.

STEM Graduates in Non-STEM Jobs
31
Table 2.2 Most commonly cited reasons for non-degree related career intention(UK final year students and taught postgraduates who might, might not or definitely do not
want to pursue an occupation related to their degree)
Final Year UK studentsUK Taught
Postgraduates
Mig
ht
Mig
htn
ot
Def
inite
lyn
ot
Mig
ht
Mig
htn
ot
Def
init
ely
not
% % % % % %
I have become more interested in anotherfield 31 54 58 21 42 43
There are too few jobs related to my degreein my preferred location 29 17 10 34 17 0
I will find it easier to get a job 27 22 11 12 25 0
There are too few career opportunities inmy field 24 21 19 29 25 0
I will be better paid 20 29 31 18 42 29
My course did not prepare me well enoughto get a degree-related job 15 8 8 6 8 0
I have not enjoyed my degree course 12 23 41 6 8 0
I will have better long-term career prospects 10 26 32 11 25 29
Number of cases 1024 237 101 112 12 7
External influences while at university could pull in different directions. With the majorityof students developing and changing their career ideas while at university, there is much scopefor external influences to play a role in their choice of career direction. Beyond the intrinsicinfluence of their own personal development and ideas, and the impact of their own universitycourse, the most significant extrinsic influence was degree-related work experience, at least forthose students who undertook it (around half of the undergraduates had done so, though thisvaried by subject). Although its impact also varied by subject, generally work experience wasvery positive – more students were minded to pursue similar work in the long-term, some withthat particular employer. For others, although fewer, the experience was pivotal in developingthe understanding that they were not well suited to that kind of work. There was also evidenceof the influence of peer group, and the strong profile of large employers on campus – principallySTEM Generalists and non-STEM employers in our definitions – which were very keen to recruitSTEM graduates. It was clear that for many of the graduates interviewed who did not havestrong prior STEM career plans, entry to the graduate scheme of one of the large accountancyfirms, consultancies or banks was perceived as a ‘mainstream’ route for STEM graduates. Theygained this impression from peers, visits to campus by alumni employed by those firms, andalso some careers services.

STEM Graduates in Non-STEM Jobs
32
STEM Specialist employers, often (but not always) smaller and recruiting fewer graduatesannually than these large recruiters, somehow did not achieve the same profile with undecidedgraduates. Although individual stories varied, it was clear that for many such graduates, theresulting impact of these external influences was greater knowledge and enthusiasm for careersoutside STEM, while the strong ‘pull’ into STEM of work experience tended only to occur forthose who had been sufficiently career-motivated to apply for it in the first place.
As highlighted above (section 2.2), we found fairly low career awareness, or career motivation,when we asked why they had chosen a STEM degree in the first place. Students had chosena STEM degree mostly because of personal interest and enjoyment, and career-relatedreasoning was a less significant factor. Almost four out of five students reported that theyhad chosen their degree course on grounds of personal interest and/or aptitude, and enjoymentat A-level (or similar) at school was cited by two thirds. The desire to follow a career in the fieldcame third in importance, cited by around half. Barely one in six chose their STEM degreebecause it was essential for a known career goal.
Evidence from graduates reflected the student survey results, and those now working outsideSTEM were more likely than those working in STEM to have chosen their degree subjectfor interest alone or because they excelled at the subject at school, i.e. not for careerreasons. Many commented that they had little understanding before university of how degreesubjects and career directions related to each other, and with hindsight wished that they hadknown more about this. Some graduates did have a STEM career in mind when they went touniversity, and a higher proportion of those entered STEM careers than of the remainder. Thissuggests that improved career information prior to university could be beneficial.
Almost all final year students with a career in mind thought that their degree was at leastpreferable to achieve their career goal, but only half thought it essential. Taughtpostgraduates were more likely to think their degree was essential, reflecting the strongercareer motivation behind taking postgraduate study. Students in Engineering, Chemistry andOther Physical Sciences were more likely than students of other subjects to consider theirdegree to be essential for their career goal.
2.5 Influences on career thinking
Changes in students’ career plans were more likely to be influenced by changes inpersonal interests or values or by their course than by employers or employmentexperiences. Course content was more influential on students in Engineering, ForensicScience/Archaeology and Other Physical Sciences than others, while employers andemployment experiences were more influential on Chemistry, Computer Science andEngineering students than others. Graduates tended to see employers and work experience asbeing more of an influencing factor than did students. However, this may be a reflection of thenature of the graduate sample and its bias towards the ‘stronger’ students.

STEM Graduates in Non-STEM Jobs
33
The majority (60%) of final year students had used the careers advisory service at universityand four out of five had found it helpful; this did not appear to vary with their eventual careerdirection. As many as 40% felt they would have benefited from additional help or advice beforethey went to university, chiefly because they had little understanding at that time of how differentdegree courses related to career directions or job opportunities.
2.6 Employment decisions and destinations
The individual career paths of STEM graduates are not simple or always predictable. Withsignificant numbers of students lacking firm career ideas and leaving job applications until theyleave university, it is not entirely surprising that their subsequent career pathways are notstraightforward and reflect individual circumstances. This is partly explained by the absence ofcareer ideas from the outset, and paucity of knowledge about STEM career opportunities.However, it is also due to the wide variety of possible jobs that STEM graduates can take up, aswell as the range of different influences on their career thinking. As seen in the illustrative casestudies presented, some graduates’ paths were directly impacted by external constraints(restricted location due to caring for a parent, or to follow a partner’s career), while othersreflected progressive development and understanding of personal beliefs (desire for publicservice, or recognition that they took the ‘wrong’ degree).
Irrespective of employment sector, most make good use of their broader graduate skillsin their current jobs. Once in the workplace, the number of graduates in this sample thatconsidered they used their specific degree skills and knowledge to a great extent in their currentjob was small (one in six) though rather more (a third) were using them to some extent. Use ofspecialist degree skills or knowledge was much higher in some subjects, especially ComputerScience (almost a third used them to a great extent). Those in STEM Specialist employers orSTEM Core occupations were also more likely to be using them in their current job (70% to atleast some extent), though this seems lower than might have been expected. Most graduates inSTEM Generalists were unlikely to be using their STEM degree specialist skills. By contrast,almost all the graduates said they used the general and broader skills gained while studying aSTEM degree a significant amount in their current job, and there was little variation in this bytype of STEM work, suggesting that these broader skills were universally useful. These weremainly communication/presentation (written stronger than verbal), problem-solving andanalytical skills. Some graduates felt these skills were unique to STEM degrees, notably theirparticular and logical/rigorous (‘scientific’) approach to problem-solving in the workplace, whichwas highly valued by employers. Their inherent numeracy (as a STEM graduate) and ability tounderstand risk and probability were valued in non-STEM work environments, and there wasevidence that some had benefited in career progression within non-STEM work as a result ofpossessing these skills.
STEM Graduates in Non-STEM Jobs
34
Interviews with employers highlighted variations between STEM Specialist, STEM Generalistand non-STEM employers in their STEM graduate skill requirements. STEM Specialists soughtSTEM graduates primarily for their STEM core competences, and in some cases there was atight match between STEM discipline or course and job specification. Academic excellence inscience and engineering was seen as a key requirement, echoing other research on STEMdemand; but broader (employability) skills were needed also from STEM graduates. AmongSTEM Generalists, some focused more on the relevance of their degree subject for certain jobroles (e.g. environmental management), but others said they required the specialist skills (e.g. incomputing, analysis, mathematical modelling) gained in their degree. Though reasons for takingSTEM graduates were sometimes not clear and varied between employers, as a general rule, itwas graduates’ ability to apply STEM knowledge and skills more broadly and other(employability) skills were of most value to employers outside STEM Specialist sectors.
Most of the graduates were very satisfied with their job and career to date. Levels ofsatisfaction with both current job and career progress to date were very high amongst thegraduates interviewed, in all employment sectors, although this may reflect the sample (mainly‘strong’ graduates working in ‘good’ jobs). However, many working outside STEM would inprinciple like more degree-related work – chiefly because they perceived it would be moreinteresting than their current work. This appeared to be most overt in a minority now working forlarge companies in financial and professional services, who essentially now regretted theirchosen career direction. However, few considered it would be feasible to re-enter STEMoccupations in the short term, even if they wanted to, mainly because of an expected resultantdrop in earnings. Many did not aspire to having more degree-related work, largely because theyfeared it would narrow their work and reduce its interest.
2.7 Variations by discipline and other factors
As has already been highlighted, some variance by STEM subject was observed in theevidence, which supported our expectations that certain subjects are more narrowly ‘vocational’than others in terms of careers and employment outcomes. The relatively small number ofstudents in Architecture, Building and Planning, a discipline group within our scope but not acore focus for our attention, came across as the most ‘vocational’ in terms of being more career-motivated than others, with many results related to this. To a somewhat lesser extent,Engineering & Technology and Computer Science students and graduates also displayedsimilar trends in responses, although the Engineers in particular seemed well aware of theirpotential value in other parts of the labour market, some even before they entered university (inthat they chose their subject to keep options open). Their career ‘awareness’ appeared to berelatively high but that did not necessarily drive them into engineering (although the majoritywould take that career route in the end).
Amongst the other subjects, including the ‘core’ sciences, there was less consistent variation.Mathematics students and graduates were perhaps the least straightforward, giving certain

STEM Graduates in Non-STEM Jobs
35
quite ‘vocational’ types of responses (similar to those of Computer Scientists) in some placesbut not in others. This is possibly a reflection of a small number of very significant careerdirections which Mathematics students view as closely degree-related (e.g. accountancy), butnot viewed as closely related to the degrees of other STEM students, while they appear to havefew other clearly degree-related options.
In terms of other factors, there appeared to be relatively little evidence for systematic variationsby gender, other than a slightly greater attraction of earnings for men, and some indication ofhigher importance of pragmatic and tactical factors for women, such as the availability of jobs ortheir location.
There was some evidence that students in Russell Group universities tended to be more‘advanced’ in terms of making job applications than those in other universities, but no clearevidence that students from different institution types were more or less likely to enter STEMcareers. If anything two trends in different directions might have offset each other. More of thoseoutside the Russell and 1994 Groups tended to study the more vocational degrees for career-related reasons, but the ‘higher quality’ graduates in the Russell Group in particular wereperhaps more confident in making earlier applications, and were more likely to secure theprestige jobs, although many of the latter appeared to be outside STEM Specialist sectors. Thelatter trend would be reinforced by the targeting of many graduate recruiters.
2.8 STEM skills mismatch
Employers, especially those in STEM Specialist sectors, commented on deficiencies in someSTEM graduates’ technical ability and subject knowledge and also, for some, their lack ofbusiness awareness. Some STEM students were also criticised for weaker behavioural skills, inparticular time management and organisational, team-working and communications skills. Thiswas a contributing factor to many employers’ recruitment problems, especially for STEMSpecialists. They would like to have a larger and better pool of UK applicants from which toselect. While there would seem to be some evidence to suggest that the skills of STEMgraduates are not well enough matched to STEM employer requirements, which could be areason why some might not apply to them or not succeed in the selection process and so seekjobs elsewhere, employers tended to see other factors as being far more significant reasons forSTEM students applying to other sectors. In particular several felt the greater attractiveness tograduates of many other employers and jobs outside STEM was highly significant. Second, theyworried about the lack of genuine knowledge among students, and young people generally,about what scientists and engineers really do and what careers in STEM are actually like (incontrast to other professionals like doctors and lawyers).
Many large employers, STEM Specialists and Generalists, target their recruitment effort on arelatively small number of universities and/or particular courses. These are mainly universitieswhere (A-level or similar) entry requirements are high or where particular STEM disciplines are

STEM Graduates in Non-STEM Jobs
36
seen as strong, and so are likely to produce candidates of the quality the STEM employersseek. This strategy potentially could exclude other candidates of the quality required who arestudying at other universities – and who could then be driven to look elsewhere. To counter this,employers also operate ‘open’ application systems so that students at non-targeted universitiescan apply, but their profile is much lower at non-targeted institutions. They saw targetingstrategies as beneficial in helping to deliver a stronger set of STEM degree-qualified applicantsbut frequently find they have to compete strongly with large non-STEM employers for thesegraduates at the same targeted universities.
2.9 Overall conclusions and implications
2.9.1 Reasons why STEM graduates are not in STEM jobs
Thus, it seems from the research findings that there is not one clear or simple main reason whymany STEM graduates are not in STEM jobs. While there is partial support for some of thehypotheses proposed by BIS (section 2.1.1) as possible reasons, we found little or no evidencefor others. It is important to note, though, that in detail the situation is often more complex andcareer decision-making more individualised and multi-factorial than could be accounted for byany single hypothesis. In relation to the hypotheses and evidence presented at the start of theresearch (in section 1.1):
Significant numbers of working STEM graduates are not in STEM occupations. Wefound evidence to support this in the graduate and employer strands of the research.STEM graduates are working across all sectors of the economy and in a wide variety ofoccupational roles. The graduates we interviewed, admittedly mostly ‘strong’ graduatesin ‘good’ jobs, were almost all satisfied with their jobs and career progress, and usedtheir degree-related broader skills widely, some of which were highly valued by non-STEM employers. Employers are recruiting STEM graduates into a range of job roles,many of which are also open to non-STEM graduates but where those with STEMdegrees may have an advantage.
Four main career tracks after graduation are evident: (1) obtaining employment relatedto a long-term career plan; (2) enrolling on a full-time postgraduate course (seen as anessential route to a STEM career in some subject areas); (3) taking a gap year or two, totravel or time out; and (4) taking temporary or non-career related employment. Higherproportions of students on tracks (1) and (2) are found in some subjects than others.What is important here is that many of the graduates on tracks (3) and (4), wherenumbers can be fairly substantial (especially in some subjects), are still undecided aboutcareer directions, and many of them end up, in the long term, in work outside STEM.
If a wage premium exists, pay does not seem to be a major motivating factor in mostdecisions about taking up STEM or other work, although it is not unimportant to mostgraduates. There seem to be divergent views from students about whether STEMjobs are actually better paid than those outside STEM, or vice versa. Employers

STEM Graduates in Non-STEM Jobs
37
see students’ higher salary expectations (especially in early careers) outsideSTEM sectors as a major reason for STEM graduates to enter non-STEM jobs.About a quarter of students mentioned better pay as a reason to enter degree-relatedoccupations, but a similar proportion seeking non degree-related work reckoned that paywould be better elsewhere. Pay seems a stronger motivating factor for men thanwomen. Isolating particular factors like pay is made more complex by students’ differentviews of which sectors and occupations are degree-related, especially students indifferent STEM subjects, as we have mentioned. Equally, BIS (2009a) reported anearnings premium for STEM graduates only in scientific and financial occupations, ratherthan for all STEM occupations. To complicate this further, the employers we interviewedthought that the high levels of starting salary available to a small number of recruits insome City firms (particularly investment banks) were a very strong pull factor away fromSTEM, but in reality this only applies to very small proportions of STEM graduatesoverall. Furthermore, most large STEM firms ensure that their initial graduate salariesare competitive with most other graduate schemes. Meanwhile, students and graduatesin our surveys and interviews probably based earnings perceptions on starting salaries,so prospective earnings over a longer period may not have been considered.
There was some evidence from employers, but little or none from the students orgraduates, to support the suggestion of a mismatch between employerrequirements for skills and those offered by graduates as a cause of ‘losses’ fromSTEM Specialist/Core jobs. Very few graduates said that they had been rejected bySTEM employers, and none that such a rejection had changed their intended careerdirection. Instead, they might then have applied to less prestigious employers in thesame sector. This could partly be a reflection of the nature of the graduate sample, i.e.those who were relatively successful in obtaining employment. On the other hand, theemployers interviewed did report insufficient skills in many applicants, although theytended to highlight weaknesses in STEM graduates’ core discipline knowledge andunderstanding, or their mathematical capability, as much as or more than weaknesses inmore generic (‘employability’) skills like communication (although some highlightedboth).
Our research was not designed to obtain direct evidence on levels of unemployment ofSTEM graduates or how long they took to find work, but there was no evidence that thegraduates interviewed had been quicker or slower into work in different sectors. In factas the majority of students are not making applications for career-related jobs prior tograduation, and many are deliberately taking time out for a break, which appears to bean increasing trend in the graduate market generally, this measure may be ofdecreasing value in terms of assessing the long-term employment of graduates.
Of the graduates interviewed, although never intended to be a representative sample,we did find some variety of academic attainment in different employment sectors.Roughly equivalent proportions of those with 1st and 2.1 degrees seemed to haveentered STEM Specialist and STEM Generalist employment, but fewer went into non-STEM jobs. On the other hand, a higher proportion of those with ‘lower’ degree classes

STEM Graduates in Non-STEM Jobs
38
had entered STEM Specialist work than STEM Generalist sectors (in which the majorgraduate schemes tended to be found). The evidence does not provide strong or simplesupport for higher attainment or over-education within STEM Specialist jobs; certainlythere was no evidence that students believed, or graduates had believed, that higheracademic attainment was a requirement of STEM Specialist employers and which hadput them off applying. If anything the graduates reported that the hardest employers tosatisfy were STEM Generalists, such as consultancies, where there was very strongcompetition. The instances recorded where graduates felt their limited academicperformance affected their career decisions were those who chose not to attempt toresearch jobs while within higher education, and some who gained insufficient grades topursue Medicine in the first place, and entered other STEM fields for degree studyinstead. On the other hand, some specifically targeted less prestigious employers withina particular sector, tactically, where they felt they were not strong enough to succeedwith the top employers.
A number of employers expressed the view that certain STEM Specialist firms or sectorswere less attractive environments in which to work than some others outside STEM.They thought this could be a significant factor turning STEM students or graduatesaway. However, there was varying evidence from students or graduates about this.Certainly, amongst those interviewed, many STEM graduates viewed some non-STEM and STEM-related employers as the most prestigious and desirable placesto work, and were motivated by issues like company reputation and the trainingenvironment they offered. However, amongst students there was little or no overtevidence that perception of working environment was a significant reason behind choiceof career direction. A small number of students were put off applying to some STEMemployers, having been influenced by their own work experience, but this was only aminority and the experience in a work placement was positive for most in terms ofconfirming a STEM career direction.
Although some graduates felt that the most prestigious employers were not STEMSpecialists, it was clear that neither students nor graduates had a conscious construct ofa ‘STEM career’ that might be ‘better’ or ‘worse’ than that in another sector. We cameacross only one exception to this (a graduate whose path was determined by herperception that a STEM-focused career would be less respected in her culturalcommunity than a traditional profession like law).
Although detailed work is required to distil the influence of each of these factors independently,in Table 2.3 a series of factors are summarised which appear to have a significant impact on thenumber of STEM graduates that definitely intend to pursue a STEM career.

STEM Graduates in Non-STEM Jobs
39
Table 2.3 Percentage intending definitely to pursue a degree related career with certainfactors/attributes (UK final year undergraduates)
If Yes%
Factor(i.e. Did undergraduate…)r
If No%
68 Choose undergraduate course with career motivation 37
65 Have a definite career in mind at entry to university 49
60 Study an enhanced/M level course (selected subjects) 49
64 Undertake degree-related work experience 41
72 Have definite careers in mind at time of survey 43
63 Not change career plans during university 48
63 Have aim for next year either full-time higher degree oremployment related to longer term career plans
32
2.9.2 Broader implications
Although we found many individual reasons behind STEM graduates’ decisions to enter careersunrelated to the field of their STEM degree, the reasoning for the majority was a perception thatother work would be more interesting. Related to this, for some, their chosen STEM degreeturned out to be less interesting than expected and they actively sought a change. Thedecision for most seems therefore to be very much a matter of individual choice – takinginto account lots of different and rather personal as well as employment factors – rather thanbeing fully based on one or two ‘rational’ factors such as earning potential or career prospects,or external factors such as difficulty or inability to obtain STEM employment due to skills/jobmismatch, or a lack of jobs in the graduate’s desired location. However, for a minority thesemore ‘rational’ reasons were the more significant ones.
We observed a considerable number of cases of what might be called ‘career drift’. Whetherthey end up working in STEM employment or not, many graduates’ paths are affected by alack of career decisiveness at graduation and even later. This may be linked with a lack ofknowledge about real STEM jobs and their environment, about the career opportunities thatexist for STEM graduates, and also the relationship between a STEM degree course, either ingeneral or as a specific subject, with particular jobs and careers. It seems that the firmer thecareer thinking, at any stage, the more likely the STEM student or graduate is to pursue aSTEM job and career.
A positive benefit of this position – where most students are not fully decided on their careergoal – however, is that they remain potentially “influenceable” at university, and even beyond.As such there are opportunities for employers and other stakeholders to make their case morevigorously, in order to compete with others in the labour market. Although many STEMSpecialist employers are relatively small organisations (smaller than the largest graduate

STEM Graduates in Non-STEM Jobs
40
recruiters and with much lower profile), this is not universally the case. Also, it does not appearthat only small STEM employers are reporting recruitment difficulties.
The observation that few students are primarily motivated by pay should offer comfort to STEMemployers. Indeed, if it is interesting work and job satisfaction that students seek, thenopportunities abound within STEM employment fields which promote just those qualities in sucha way that graduates are attracted more strongly. This is reinforced by evidence that degree-related work experience encourages more to apply for STEM jobs in the long term; i.e. that ‘real’knowledge is positive in terms of increasing STEM career attractiveness. If STEM students areexposed to and gain better knowledge of what it is really like to work in STEM employment, thisought to improve the prospect of higher proportions applying for STEM jobs. This appears tobe a similar finding to that reported in CRAC’s work with students considering IT careers (2008),where many chose other fields based on the perception that work in IT would be boring. Acrossthe range of STEM employers and jobs, there will be many opportunities to promote the intrinsicinterest of working in STEM, and its benefit to society and the environment, as well as itscompetitive career returns. It seems, on the surface, somewhat counter-intuitive that manystudents appear to ‘leave’ STEM on grounds of seeking interest at work, yet one of the careerdestinations many such graduates enter is accountancy / financial services, which does nothave a reputation for interest.
Another aspect of this issue of career decisiveness (or rather indecisiveness) is our importantfinding that relatively few STEM students or graduates chose their degree course with aspecific career direction in mind. This has also been found in other studies (see mostrecently the Futuretrack study of 2006 degree entrants, HECSU, 2008a). Also, many of thosethat did give future careers consideration at that stage realised that a STEM degree could keepopen or even advance them in lots of different career directions. This was as apparent forsubjects seen as strongly vocational, like Engineering, as those that are less so like PhysicalSciences, and was stronger still in Mathematics. This is important for policy implications, as itcalls into question, to some extent, the concept of a ‘pipeline’ of STEM-qualified graduates andskills, and the expectation that the ‘default’ direction for STEM graduates will be to adhere to aSTEM career pathway. Not doing so is seen as something ‘wrong’ or a ‘loss’ in the pipelinemodel, but this does not hold true for the graduates. Although our cohort of graduates weremostly strong and many worked for larger employers outside specialist STEM sectors, it wasclear that for them at least the ‘default’ direction while at university had been Generalist or non-STEM corporate graduate schemes.
What this perhaps highlights is that there should at least be some limitation on expectations ofthe proportion of STEM graduates who will emerge from the ‘pipeline’ at the end, i.e. into STEMemployment. Many students appear to enter the pipeline without knowingly intending to travelits length – hence the expectation needs to be reduced that they will emerge at the end intoSTEM occupations. It also is apparent from this study (and others) that there is value in a widerrecruitment of STEM graduates to sectors across the economy and society, in the skills they

STEM Graduates in Non-STEM Jobs
41
bring to job functions and workplaces, and this should be more positively recognised andencouraged (though not at the expense of meeting the needs of the specialised STEM sectors).
The potential ‘broadening’ career benefit of studying STEM qualifications needs morerecognition within the higher education community. It has become recognised within 14-19education policy and in recent initiatives to encourage more young people to study STEMsubjects post-16. Our research has shown that a wide range of jobs are open to STEMgraduates, and that they can be highly sought by employers, in both STEM and non-STEMsectors. This should be an underpinning element of careers advice given prior to highereducation or other post-18 choices.
As the students progress through their degree studies, their career thinking firms up and seemsto shift from purely aspirational early on to a combination of aspiration and pragmatism by thetime of graduation. However, many do not apply for jobs until after they leave university; this isthe case both for those intending to secure career-related employment after university as wellas for those on our ‘tracks’ (3) and (4), described earlier. Accordingly, as it is conducted only sixmonths after graduation, the Destinations of Leavers from Higher Education (DLHE) surveyis unlikely to give a good indication of the career-related employment of graduates, andmore attention needs to be given to measuring employment outcomes at least a year, andideally several years, after graduation.
During their period of degree study, students become more aware of certain issues in the labourmarket, and some develop rather negative perceptions of STEM employment while manyrespond positively to the high profile and substantial public relations efforts of the majorcorporate recruiting employers on campus (mostly non-STEM and STEM Generalistemployers). We observed many cases of such job applications in parallel with those to STEMSpecialist employers, which reinforces the impression of a lack of decisiveness or indicates thatthey were consciously keeping options open. Accordingly, issues like employer reputation,opportunities for professional training and even how corporate cultures might conflict with theirpersonal beliefs, enter their thinking, as well as practical issues such as the ease of getting ajob or its potential location. The net effect of all these influences seemed to be toencourage a higher proportion of them to make job applications and enter jobs unrelatedto their degree than we might have expected from the headline results on students’career intentions, where the vast majority said that they were likely to stay in STEM fields.Their subsequent career decisions seem to have been even more individually orientated thanunderlying subject, HE institution type, gender or other external factors would suggest.
For STEM students, there is clearly a wide range of job opportunities open if they develop theappropriate academic and personal skills and knowledge sought by employers. However, moreopportunities are needed to develop work experience and genuine knowledge aboutwork and careers in STEM, in order that more students can make more informed careerdecisions. For employers, especially those in STEM Specialist sectors, there is the potential to

STEM Graduates in Non-STEM Jobs
42
help students shape and firm up career ideas while at university and beyond. They need tomake their case more visibly and strongly, for the attractive features of STEM jobs and careers,especially where there is interesting work. In that way they might influence more students,especially the less decided and the ‘career drifters’, of whom there are many. Additionalprovision of information of this contextual nature, before students choose their degree courses,would also be welcomed by them.
2.9.3 Recommendations for further research
This study has explored in detail with samples of STEM students and graduates the reasoningbehind their decisions to enter STEM or non-STEM work. It has shown that we may haveunderestimated in the past how complex career choices are and the range of factors, ofteninteracting with each other differently over time, that influence employment outcomes, includingindividual career choice. They are not easy to capture in cross-sectional research studies.Several areas stand out for further research which would help to take forward some of ourfindings.
One is the need to improve our STEM definition, especially in relation to employment.There needs to be consistency in terms of the disciplines and occupations included. Inparticular, further work is needed to see how the Standard Occupational Classificationcodes (SOCs) can be used better to define STEM work, or to develop a better systembased on SOCs specifically for STEM, and also to improve how occupational coding isundertaken in the LFS and DLHE surveys in relation to STEM occupations. This wouldhelp give greater clarity in the evidence base, as well as helping with careers informationand guidance.
The second area is the need to strengthen evidence on the ‘career journey’. Mostresearch, like this study, focuses on career decisions of a cohort of students at one pointin time and, although they are asked about past events and decisions, there is inevitablysome post-hoc rationalisation and also possibly other memory issues. More research oncareer decision-making processes over time is needed and how factors we havehighlighted here, as influential on STEM and potential STEM graduates, actually operateindividually and together at different stages. This can best be done through longitudinalresearch, starting before higher education and going through into employment. We haveone such national study at present, the FutureTrack (HECSU 2008), but it has not yetproduced data on graduate outcomes. We urge that this stage is completed as soon aspossible and that data relevant to STEM can be made accessible for others to use inmore detailed analysis to help explore further some of the issues highlighted here. Thereis also a case for undertaking new longitudinal work, to capture a new cohort of STEMstudents affected by recent changes in higher education financing and the evolvinggraduate labour market. An option could be to follow up cohorts of recent STEMgraduates at intervals after graduation to provide a better evidence base on the differentgraduate employment tracks than we can currently obtain from the DLHE and L-DLHE

STEM Graduates in Non-STEM Jobs
43
surveys in their current form. A follow-up after one, two and five years of samples ofspecific groups of STEM graduates in the DLHE surveys should be considered.
Thirdly, it would help to know much more than currently about why students chooseparticular degree subjects and how this relates to their career goals. So, further researchamong new degree entrants on their motivations for taking a STEM course and theirexpectations of getting a job in their degree discipline would be useful in assessing howclose the ‘fit’ is between choice of degree study and employment and how this mightchange over time, particularly as changes to higher education policy come into effectand employability is increasingly under scrutiny. It would also be helpful to explore inmore detail than possible here how this varies between students, with different socio-economic backgrounds, qualifications or experiences in the discipline they have chosento study.

STEM Graduates in Non-STEM Jobs
46
3. Career intentions of STEM studentsThe results of our survey work with STEM students are presented in this chapter. As describedin Chapter 2, two online surveys were carried out, one for undergraduates and taughtpostgraduates, the other for PhD students. The purpose of the surveys was to understand thefactors that shape STEM students’ career choices and, in particular, to gain insight into whatinfluences their decisions to pursue, or not to pursue, a career in a STEM employment field. Thesurvey questionnaires not only looked at the students’ future career intentions but also collectedinformation about their past decisions including choice of degree course and how their careerideas had changed over time. The intention, therefore, was to understand a students careerjourney from initial entry to university through to either their final year as an undergraduate or,where appropriate, as a postgraduate.
A distinctive feature of the two surveys was that they included students studying at threedifferent levels – undergraduates, Masters and PhD students. This allowed analysis to beconducted by level of qualification as well as by subject. In certain subjects (Chemistry, Physics,Other Physical Sciences, Mathematics and Engineering/Technology), substantial proportions(over 25%) of UK final year students were studying for enhanced/integrated Masters degreesand where appropriate these undergraduates are identified separately.
For convenience, the analysis presented in this chapter focuses mainly on UK final yearundergraduate students who are seen as the core group of respondents. Data frompostgraduates on taught courses and from the final year PhD students are used to highlightsimilarities and differences in the experiences and intentions of survey respondents. In certainsubjects a high proportion of final year undergraduates intend to go on to postgraduate studyand in these subjects a postgraduate qualification is often seen as a prerequisite for entry todegree-related work.
The first three sections of this chapter focus on the students’ current intentions. This has threeaspects:
their intention to work in STEM or not – that is whether they seek STEM degree-relatedwork or not;
the type of work they plan to do; the practical steps they are taking to realise those plans – i.e. their actual plans for the
year after they graduate.
The second part of the chapter examines how the students’ career thinking has developed overtime from their initial choice of university course and their career ideas at that time. In particular,it looks at what has influenced the development of their career thinking and decision-making.

STEM Graduates in Non-STEM Jobs
47
Understanding what has influenced these students is likely to be crucial to the development ofany strategies to encourage more students to consider STEM careers.
3.1 Future career intentions
3.1.1 Are they likely to stay in STEM?
Most final year undergraduates (86%) indicated that they were likely to try to pursue a career inan occupation related to their STEM degree when they left university, with over half (52%)reporting that they definitely wanted to do so and a third (34%) saying they might. Only 3%reported that they definitely did not intend to, a further 8% might not do so, and 2% did not knowwhether they wanted to or not. These indicators of career intention were almost identical formale and female final year students.
UK postgraduates on taught courses were more likely than final year undergraduates to want topursue a career in an occupation directly related to their degree. Over three-quarters (77%) ofthese STEM postgraduates said that they definitely wanted a career in an occupation directlyrelated to their degree and a further 18% said they might want to. The main exception wereMathematics postgraduates where just less than half (49%) wanted a (Mathematics) degree-related career. Female postgraduates were also slightly more likely than male ones (80%compared to 75%) to say they definitely wanted a degree-related career.
For both groups, however, there was some variation by subject (see Figure 3.1 and AppendixTable B3.1). The percentage of UK final year STEM undergraduates definitely wanting topursue a degree-related career was highest among those studying Other Physical Sciences(64%), Engineering and Technology (62%) and Architecture, Building and Planning (62%) andlowest in those studying Geography (42%), Physics (43%), Forensic Science /Archaeology(44%) and Mathematics (45%).
When final year students on M-level courses in the five subject areas where they make up morethan 25% of the cohort are compared with those on conventional 3-year programmes, 60% ofM-level final year students definitely wanted to pursue a degree-related career compared to49% of those on three-year courses (see Appendix Table B3.2). The difference was leastpronounced in Mathematics (47% for M-level compared to 45% of others).

STEM Graduates in Non-STEM Jobs
48
Figure 3.1 Percentage of respondents who definitely want to pursue a career in a degree relatedoccupation (Final year undergraduates and taught postgraduates)
0 10 20 30 40 50 60 70 80 90 100
Other Physical Sciences
Engineering andTechnology
Architecture, Building andPlanning
Computer Science
Subjects allied to Medicine
Biological Sciences
Psychology
Chemistry
Sport Science
Mathematical Sciences
ForensicScience/Archaeology
Physics
Geography
All respondents
Final year undergraduates Taught postgraduates
In contrast to the postgraduates on taught courses, UK final year PhD students were onlyslightly more likely than UK final year students to say that they wanted to pursue a career in adirectly related occupation (see Appendix Table B3.3). Just over half (55%) said they definitelywanted to and 34% that they might want to work in an occupation related to the broad subject oftheir research. PhD students in Mathematical Sciences (45%), Biological Sciences (50%),Physical Sciences (51%) and Engineering/Technology (52%) were less likely than PhD studentsin other STEM subjects to say they definitely wanted to work in an occupation directly related tothe broad subject of their research.

STEM Graduates in Non-STEM Jobs
49
Two conclusions from this analysis are:
1. Only a small minority (about one in eight STEM final year students, one in ten PhDstudents and one in twenty STEM taught postgraduates) did not or might not want topursue a STEM career (or did not know if they wanted to). However, about a third offinal year undergraduates and PhD students and a fifth of taught postgraduates onlymight want to pursue a STEM career. Nevertheless, the majority (more than half thefinal year undergraduates and PhD students and three-quarters of the taughtpostgraduates) said that they definitely wanted to pursue a STEM career.
2. There was clear variation by subject area with, in general, those students studyingtraditionally ‘vocational’ subjects being more likely definitely to want to pursue acareer in STEM. PhD students in Engineering/Technology were the one possibleexception to this but this may indicate only that they were less likely to work in anarea directly related to their research rather than outside STEM.
The implications are that there are some differences in career intentions between students bylevel (undergraduate, taught postgraduate and PhD) and by subject group and we need tounderstand how these differences arise. We start by looking at the reasons students give forwanting or not wanting to stay in STEM.
3.1.2 Reasons for wanting to stay in STEM
Almost nine out of ten of the final year students who definitely wanted to pursue a careerdirectly related to their degree (i.e. those with a definite STEM career intention) said they woulddo so because they ‘will find the work interesting and challenging’ (87% gave this reason).Other important reasons were: ‘want an opportunity to put their learning into practice’ (74%),‘enjoyed their degree course and so it seems logical to work in this field’ (63%), and ‘alwayswanted to work in this field’ (53%). None of the other reasons was chosen by more than half therespondents. The figures for taught postgraduates were very similar (see Table 3.1).
However, 60% of final year students who definitely wanted to pursue a career directly related totheir degree had undertaken some degree-related work experience. Over half (58%) of thesestudents with work experience gave that they ‘enjoyed their degree-related work experience’ asa reason for wanting to pursue a career in an occupation directly related to their degree makingit their fourth most commonly mentioned reason.

STEM Graduates in Non-STEM Jobs
50
Table 3.1 Reasons for STEM career intention (UK final year students and taught postgraduates whodefinitely, might and might not want to pursue an occupation related to their degree)
Final Year UK students UK Taught Postgraduates
Def
inite
Mig
ht
Mig
htn
ot
Def
inite
Mig
ht
Mig
htn
ot
% % % % % %
I will find the work interesting and exciting 87 71 31 85 73 42
I want an opportunity to put my learning intopractice 74 68 43 70 62 33
I enjoyed my degree course and so it seemslogical to work in this field
63 43 24 53 42 8
I have always wanted to work in this field 53 19 4 49 18 17
I will have better long-term career prospects 40 35 11 46 39 0
I enjoyed my degree-related work experience 39 16 5 20 8 8
I will be better paid 28 31 22 34 36 8
I will find it easier to get a job 19 23 18 16 23 8
I know other people who do this kind of work 13 10 7 12 9 0
There are plenty of degree-related jobs in mypreferred location
13 10 10 3 5 0
I have knowledge through a parent/relativewho does this kind of work 7 6 2 4 5 0
I will be letting people down if I don't 3 6 9 3 6 8
Already employed in this field 1 - - 1 - -
Other reason 3 2 5 4 4 17
Not answered 0 0 0 0 0 0
Number of cases 1557 1024 237 474 112 12
Both final year and taught postgraduate students who might want to pursue a degree-relatedcareer had a broadly similar pattern of replies but with slightly lower percentages endorsingeach reason. However, they were much less likely to say that they ‘have always wanted to workin this field’ and also less likely to say that they ‘enjoyed their degree course and so it seemslogical to work in this field’ than those definite about staying in STEM (see Table 3.1). Theywere also less likely to say that they ‘enjoyed their degree-related work experience’.
Not only had fewer of these final year students undertaken any degree-related work experience(40%), but only just over a third (36%) of those with work experience mentioned ‘enjoying theirdegree-related work experience’ as a reason for wanting to pursue a degree-related careercompared to 58% of those with definite career intentions.

STEM Graduates in Non-STEM Jobs
51
Final year students and taught postgraduates who might not want to work in a STEM degreerelated field were even less likely to endorse these reasons for pursuing a STEM career.Nevertheless, 43% of these final year undergraduates and 33% of taught postgraduates cited‘want an opportunity to put their learning into practice’ and 31% of the undergraduates and 42%of the taught postgraduates ‘will find the work interesting and challenging’ as reasons to stay inSTEM.
The pattern of replies from final year PhD students was broadly similar (see Appendix TableB3.4). However, PhD students who might or might not want to work in an area related to theirresearch were much less likely to say they had ‘enjoyed their research so it seems logical towork in this field’, or that they had ‘always wanted to work in this field’, than those who definitelywanted to.
Further analysis was undertaken to explore subject differences in the reasons given for wantinga degree-related career. Among final years who definitely or might want a degree-related careerthe same reasons dominated students’ thinking in all subjects with just a few minor exceptions(see Appendix Tables B3.5 and B3.6). ‘Always wanted to work in this field’ was more frequentlymentioned by Psychologists (69%) and Computer Scientists (66%) who definitely wanted adegree-related career and ‘having better long-term career prospects’ by students inArchitecture, Building and Planning (62%), Engineering/Technology (53%) and Other PhysicalSciences (51%). Being better paid was mentioned by a third or more of students who definitelywanted a degree-related career in Subjects allied to Medicine, Other Physical Sciences,Mathematical Sciences, Computer Science, Engineering/Technology, and Architecture, Buildingand Planning.
‘Being better paid’ was also a more important reason to students who might want a degree-related career in certain subjects, notably Chemistry (37%), Mathematical Sciences (47%),Computer Science (59%) and Engineering/Technology (44%) suggesting that, in some subjects,pay might be a more significant factor in keeping some students in STEM than others.
Only limited analysis by subject is possible among students who might not want a degree-related career, due to the restricted numbers, but it is noteworthy that ‘being better paid’ was themost frequently mentioned reason for considering degree-related work among the relativelysmall number of Mathematicians (67%) and Computer Scientists (50%) and ‘finding it easier toget a job’ among Engineering/Technology students (42%) (see Appendix Table B3.7).
There were only limited gender differences (see Appendix Table B3.8). Male final year studentswho definitely wanted degree-related work were more likely to mention that they will ‘find iteasier to get work’ than female final year students (24% compared to 14%) and male studentswho definitely or might want degree-related work were more likely to mention ‘being better paid’(Males: 31% and 36% compared to Females: 25% and 26%). Female final year students whomight consider degree-related work were more likely than their male counterparts to say they

STEM Graduates in Non-STEM Jobs
52
‘enjoyed their degree course and it seems logical to work in this field’ (49% compared to 38%)but less likely to say they ‘will have better long-term career prospects’ (31% compared to 40%).Female students who might not want to work in a degree-related career were more likely toconsider degree-related work because they ‘will find it interesting and challenging’ than theirmale colleagues (36% compared to 26%).
3.1.3 Reasons for not wanting to pursue a career in STEM
Although only a small minority of final year students and taught postgraduates said that theydefinitely did not (3%) or might not (8%) seek a degree-related career, the most commonlymentioned reason for seeking work not related to their degree was that they ‘have becomemore interested in another field’. This was the case for just over half the undergraduates andslightly under half the postgraduates who definitely or might not want a degree-related career(see Table 3.2). Among the rather small number of final years who were definitely not seeking adegree-related career, ‘not enjoying their degree course’ was mentioned by 41%. Other reasonsmentioned by more than a quarter of this group were ‘being better paid’ and ‘having better long-term career prospects’ (in other sectors).
In order to obtain a better understanding, the larger group (34%) of students who said theymight pursue a degree-related career were also asked why they might not (see Table 3.2). Justunder a third (31%) of these final year undergraduates reported that they had ‘become moreinterested in another field’ and 29% that ‘there are too few jobs related to my degree in mypreferred location’. This suggests that for a minority of STEM students work location is aconstraint.
Analysis was also carried out to examine how reasons for not wanting a STEM career varied bysubject. In order to have larger numbers, final year students who might not and definitely did notwant a degree-related career were combined for this analysis. Even so the number of studentsin six of the subject areas was very small (less than 20). The results are shown in AppendixTable B3.9.

STEM Graduates in Non-STEM Jobs
53
Table 3.2 Reasons for non-degree related career intention (UK final year students and taughtpostgraduates who might, might not or definitely do not want to pursue an occupation related to
their degree)
Final Year UK students UK Taught Postgraduates
Mig
ht
Mig
htn
ot
Def
init
ely
not
Mig
ht
Mig
htn
ot
Def
inite
lyno
t
% % % % % %
I have become more interested in anotherfield
31 54 58 21 42 43
There are too few jobs related to my degreein my preferred location 29 17 10 34 17 0
I will find it easier to get a job 27 22 11 12 25 0
There are too few career opportunities inmy field
24 21 19 29 25 0
I will be better paid 20 29 31 18 42 29
My course did not prepare me well enoughto get a degree-related job 15 8 8 6 8 0
I have not enjoyed my degree course 12 23 41 6 8 0
I will have better long-term career prospects 10 26 32 11 25 29
I was put off by my work experience 7 14 11 3 8 0
I have tried and failed to get jobs directlyrelated to my degree 7 3 1 12 0
0
I was put off by knowledge of other peopledoing that kind of work 6 10 11 8 0 0
I never intended to work in this field 4 18 27 6 33 29
I was put off by knowledge from a relativedoing that kind of work 2 1 2 0 0
0
Other reason 8 17 13 16 25 57
Not answered 1 0 0 6 0 0
Number of cases 1024 237 101 112 12 7
In all the subject areas where there were more than 20 respondents, ‘becoming more interestedin another field’ was the most frequently mentioned reason for not wanting a degree-relatedcareer. ‘Being better paid’ was also mentioned more frequently by final year students in somesubject areas, notably Biological Sciences (39%), Chemistry (49%) and Physics (40%), as areason for not wanting degree-related work. Other reasons were also mentioned morefrequently by students from some subject areas. These included:
‘Having better long-term career prospects’ in Biological Sciences (41%) ‘There are too few career opportunities in my field’: Geography (50%) ‘I will find it easier to get a job’: Psychology (33%), Geography (33%)

STEM Graduates in Non-STEM Jobs
54
‘I was put off by my work experience’: Computer Science (31%), Engineering (30%).
For comparative purposes the same analysis was also carried out with the larger group of finalyear students who might want a degree-related career in order to understand whether there aredifferences by subject area in the reasons given for possibly not wanting to work in a STEMdegree-related occupation (see Appendix Table B3.10).
It is clear that a significant reason for students in some subjects for considering not working intheir field was to do with work availability. The following three reasons that are clearly linked towork availability were mentioned more frequently by students in certain subjects:
‘There are too few jobs related to my degree in my preferred location’ in BiologicalSciences (39%), Sports Science (36%), Psychology (35%), Other Physical Sciences(39%), Architecture, Building and Planning (41%), Geography (37%) and ForensicScience/Archaeology (48%);
‘There are too few career opportunities in my field’ in Subjects allied to Medicine (36%),Sports Science (54%), Psychology (32%) and Forensic/Archaeology (58%);
‘I will find it easier to get a job’: Psychology (39%), Other Physical Sciences (36%),Geography (35%) and Forensic Science/Archaeology (42%).
In addition, it was only within Architecture, Building and Planning that a significantproportion of students reported they ‘tried and failed to get jobs directly related to theirdegree’ (29%), although this was of a small sample. This reason was mentioned by veryfew students of other subjects.
These findings suggest that there are push and pull factors at work. In some subjects, thedifficulty of finding degree-related work is a significant issue, while in others it is the attraction ofother fields and occupations that is more significant.
There were also some gender differences (see Appendix Table B3.11). Male final year studentsin both these groups (those who do not want degree-related work and those who might considerit) were more likely than females to mention being better paid (Males: 23% and 34%; Females:17% and 24%). In contrast, more female students who might consider degree-related workmentioned that there were too few jobs in their preferred location than males (34% compared to24%). More female respondents than equivalent male ones said they have become moreinterested in another field (60% compared to 51%).
Clearly, some of these differences might reflect the different gender balance across subjects.Nevertheless, these findings suggest that more female final year students were geographicallyconstrained, while more male final year students were motivated by potential financial rewards.
The actual number of PhD students who definitely do not or might not want to work in a careerrelated to the subject of their research was very small. About half of them had not enjoyed their

STEM Graduates in Non-STEM Jobs
55
postgraduate research and others had become more interested in another field or wanted touse their high-level skills but not in their current field (see Appendix Table B3.12). Half thosewho might want to work in a career related to their research would consider not doing sobecause there are too few career opportunities in their field, 38% because there were too fewrelevant jobs in their preferred location and 37% because they would be better paid doing otherwork.
Three key findings about reasons for choosing or not choosing degree-related work:
1. Being better paid was mentioned by approximately equal percentages as a reason for
doing degree-related work and also for not doing it. However, it was only ever
mentioned as a reason by a minority of respondents (around a third).
2. Interest in the work was the overwhelming motivating factor influencing the students’
career intentions to work in a degree-related occupation, and becoming more
interested in another field was also the main reason for deciding to pursue a career not
related to their degree.
3. These findings suggest that most STEM students are happy to adopt a ‘satisfying’
approach (i.e. to look for a good enough level) as far as pay is concerned but a
maximising one for intrinsic job interest/satisfaction. However, it is clear that pay is
slightly more important to men than women and more significant in certain subject
areas than others. It also appears that pay both keeps some students in STEM but
tempts others out.
3.2 Current career thinking
3.2.1 Strength of career plans
The survey collected detailed information about STEM students’ current career plans to see howintentions to work in a degree-related occupation might be turned into reality. At the time of thesurvey (January/February 2010), as highlighted above, the vast majority (86%) of final yearstudents appeared to want to pursue a degree-related career, but when asked separately abouttheir specific career plans, only about a third (32%) had a definite career in mind at this time. Asshown in Figure 3.2, rather more (42%) were considering several clear alternatives, while theremainder had only a vague or no idea of possible careers. Taught postgraduates were morelikely to have a definite career in mind (41%) than PhD students (29%).
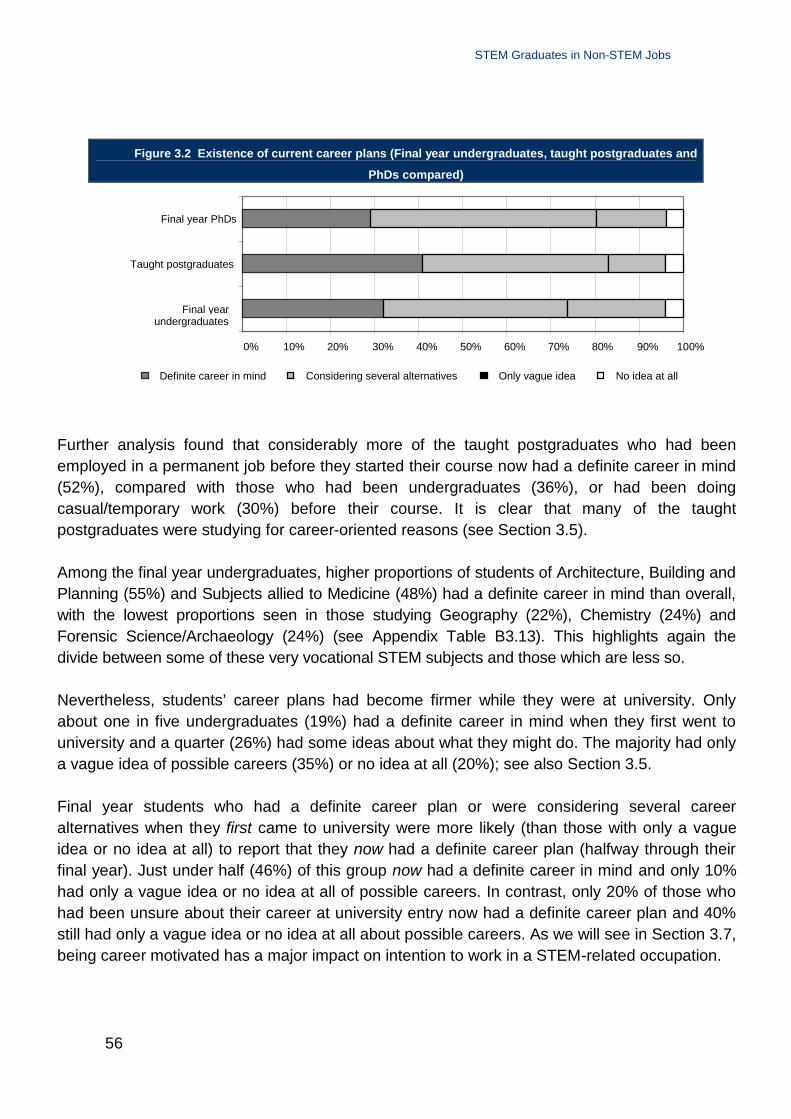
STEM Graduates in Non-STEM Jobs
56
Figure 3.2 Existence of current career plans (Final year undergraduates, taught postgraduates and
PhDs compared)
Further analysis found that considerably more of the taught postgraduates who had beenemployed in a permanent job before they started their course now had a definite career in mind(52%), compared with those who had been undergraduates (36%), or had been doingcasual/temporary work (30%) before their course. It is clear that many of the taughtpostgraduates were studying for career-oriented reasons (see Section 3.5).
Among the final year undergraduates, higher proportions of students of Architecture, Building andPlanning (55%) and Subjects allied to Medicine (48%) had a definite career in mind than overall,with the lowest proportions seen in those studying Geography (22%), Chemistry (24%) andForensic Science/Archaeology (24%) (see Appendix Table B3.13). This highlights again thedivide between some of these very vocational STEM subjects and those which are less so.
Nevertheless, students’ career plans had become firmer while they were at university. Onlyabout one in five undergraduates (19%) had a definite career in mind when they first went touniversity and a quarter (26%) had some ideas about what they might do. The majority had onlya vague idea of possible careers (35%) or no idea at all (20%); see also Section 3.5.
Final year students who had a definite career plan or were considering several careeralternatives when they first came to university were more likely (than those with only a vagueidea or no idea at all) to report that they now had a definite career plan (halfway through theirfinal year). Just under half (46%) of this group now had a definite career in mind and only 10%had only a vague idea or no idea at all of possible careers. In contrast, only 20% of those whohad been unsure about their career at university entry now had a definite career plan and 40%still had only a vague idea or no idea at all about possible careers. As we will see in Section 3.7,being career motivated has a major impact on intention to work in a STEM-related occupation.
0% 10% 20% 30% 40% 50% 60% 70% 80% 90% 100%
Final yearundergraduates
Taught postgraduates
Final year PhDs
Definite career in mind Considering several alternatives Only vague idea No idea at all

STEM Graduates in Non-STEM Jobs
57
3.2.2 What careers are being considered?
Those students with either a definite career in mind now or who were considering severalalternatives were asked to list the careers they were considering. These were coded by STEMsector and function using the coding scheme developed for this survey (see Section 2.2). Eachoccupation listed by students who gave several alternatives was separately coded and then thestudent was allocated as a STEM Specialist if all the occupations were in that sector, and so on. Ifsome of the occupations were in Specialist and others in Generalist sectors, these students wereseparately labelled as STEM Specialist/Generalist. A similar approach was used if they listedsome occupations in non-STEM sectors (labelled as Mixed Sectors). Equivalent coding wascarried out for job function. This resulted in six groups for sector and function to cover the range ofoccupations the students were considering.
Overall, just over half (51%) of the final year STEM undergraduates with either a definite careerin mind or who were considering several alternatives expected to work in a STEM Specialistsector and slightly under half (47%) in a STEM Core function. Roughly a fifth (21%) specifiedboth STEM and non-STEM sectors, while 18% specified both STEM and unrelated jobfunctions. A further 7% listed non-STEM sectors and 9% Unrelated functions (see Tables 3.3and 3.4).
By subject, the percentage considering working in a STEM sector or function ranged widely.The lowest proportions of final year students considering work in a STEM Specialist sector werein Mathematics (11%), Geography (24%) and Psychology (30%), well below the average. Thelowest proportions considering work in STEM core functions were in ForensicScience/Archaeology (16%), Mathematics (13%), and Sports Science (23%).
Subjects in which the highest proportions wanted to work in STEM Specialist sectors wereSubjects allied to Medicine (75%), Architecture, Building and Planning (76%), BiologicalSciences (63%) and Engineering/Technology (64%). In terms of job function, the highestproportions seeking a STEM core function were in Subjects allied to Medicine (65%) andEngineering/Technology (65%).
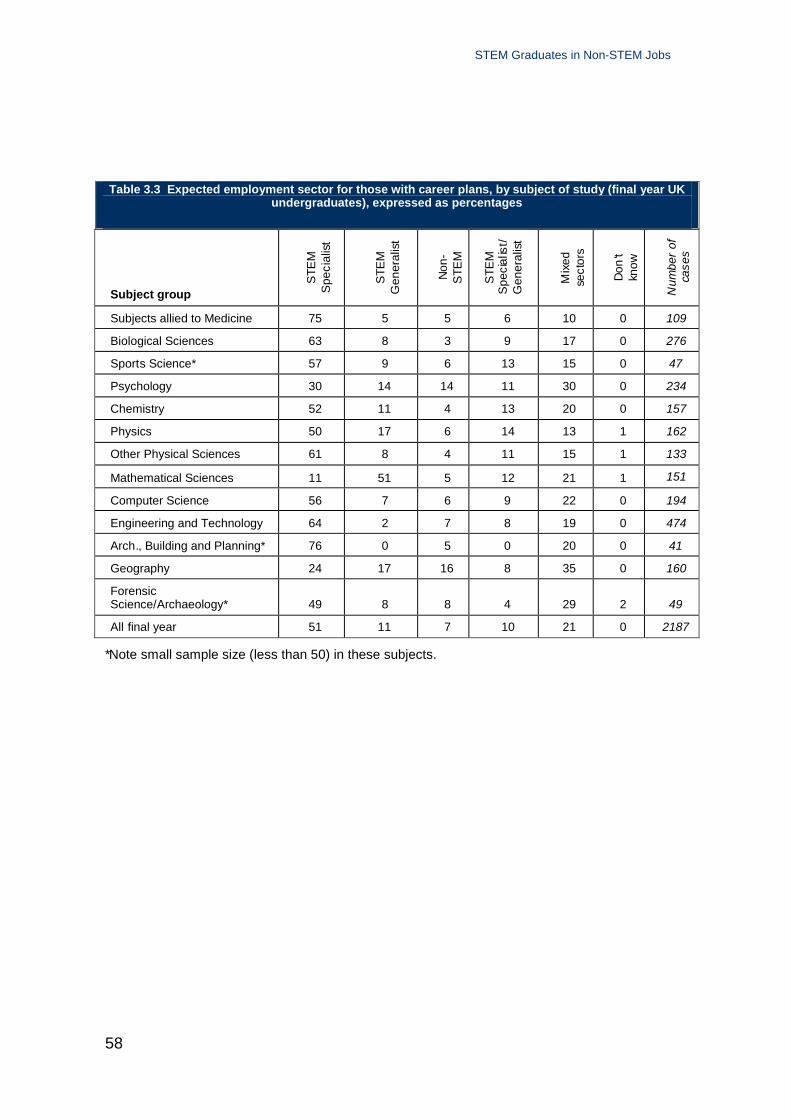
STEM Graduates in Non-STEM Jobs
58
Table 3.3 Expected employment sector for those with career plans, by subject of study (final year UKundergraduates), expressed as percentages
Subject groupS
TEM
Spe
cial
ist
STE
MG
ener
alis
t
Non
-S
TEM
STE
MS
peci
alis
t/G
ener
alis
t
Mix
edse
ctor
s
Don
'tkn
ow
Num
ber
ofca
ses
Subjects allied to Medicine 75 5 5 6 10 0 109
Biological Sciences 63 8 3 9 17 0 276
Sports Science* 57 9 6 13 15 0 47
Psychology 30 14 14 11 30 0 234
Chemistry 52 11 4 13 20 0 157
Physics 50 17 6 14 13 1 162
Other Physical Sciences 61 8 4 11 15 1 133
Mathematical Sciences 11 51 5 12 21 1 151
Computer Science 56 7 6 9 22 0 194
Engineering and Technology 64 2 7 8 19 0 474
Arch., Building and Planning* 76 0 5 0 20 0 41
Geography 24 17 16 8 35 0 160
ForensicScience/Archaeology* 49 8 8 4 29 2 49
All final year 51 11 7 10 21 0 2187
*Note small sample size (less than 50) in these subjects.

STEM Graduates in Non-STEM Jobs
59
Table 3.4 Expected occupational function for those with career plans, by subject of study (final year UKundergraduates), expressed as percentages
Subject group
STE
MC
ore
STE
Mre
late
d
Unr
elat
ed
STE
MC
ore/
rela
ted
Mix
edfu
nctio
ns
Don
'tkn
ow
Num
ber
ofca
ses
Subjects allied to Medicine 65 6 8 9 9 2 109
Biological Sciences 51 9 11 11 18 0 276
Sports Science* 23 19 28 4 21 4 47
Psychology 36 14 16 9 24 1 234
Chemistry 45 13 6 15 19 1 157
Physics 47 19 7 15 11 1 162
Other Physical Sciences 53 7 16 9 15 1 133
Mathematical Sciences 13 50 11 7 17 2 151
Computer Science 50 4 17 8 21 1 194
Engineering and Technology 65 2 7 6 19 1 474
Arch., Building and Planning* 56 2 29 0 12 0 41
Geography 31 18 13 11 23 4 160
ForensicScience/Archaeology* 16 8 35 8 22 10 49
All final year 47 12 12 9 18 2 2187
* Note small sample size (less than 50) in these subjects.
Of those asked to specify their career intention (i.e. those with a definite career in mind or whowere considering several alternatives), under half (43%) the final year students had a definitecareer in mind, but in all cases these students were more likely to be considering STEMSpecialist sectors and, except for Forensic Science/Archaeology, work in STEM Core jobfunctions (see Appendix Table B3.14).
Taught STEM postgraduates asked to specify their career intention were more likely than finalyear STEM undergraduates to want to work in STEM with 61% expecting to work in a STEMSpecialist sector and 59% in a STEM Core function (see Appendix Table B3.15). The percentagementioning STEM and non-STEM sectors was also lower (16% compared to 21%) as was thepercentage specifying STEM Core and unrelated functions (12% compared to 18%). Similarproportions specified non-STEM/other sectors (8%) but slightly more mentioned other/unrelatedfunctions (14%).
Taught postgraduates with a definite career in mind were also more likely than thoseconsidering several alternatives to be considering STEM with 73% of this group expecting to

STEM Graduates in Non-STEM Jobs
60
work in a STEM Specialist sector and 70% in a STEM Core function (see Appendix TableB3.16). The proportion of final year PhDs wanting to work in STEM is very similar to that oftaught postgraduates (see Appendix Table B3.17).
Key findings are that:
1. More taught postgraduates than undergraduates want to work in STEM sectors andfunctions, and this implies that further study (either a taught postgraduate course ordoctoral research) is seen as a major route to a STEM career by many STEMstudents.
2. Certain STEM subjects are much more explicitly vocational in terms of leading directlyto particular careers than others and this confirms the career/vocational focus of thesesubjects.
3.2.3 How essential is the degree subject?
Those students with a career in mind were asked how essential they thought it was to have adegree in their subject to achieve their career goal (or their most favoured career option if theywere considering several alternatives). Over half (56%) of these final year students thought adegree in their particular subject would be essential, a third (32%) that it would be preferred and11% that it was not essential or not needed.
Reflecting their stronger career orientation, it is probably not surprising that 73% of taughtpostgraduates thought a degree in their particular subject would be essential to achieve theircareer goal and that a further 24% thought it would be preferred. However, only half the finalyear PhD students thought a doctorate in their subject was essential (i.e. the job could not bedone without a doctorate in their subject) for the career they had in mind, while a third (34%)thought a doctorate in their subject would be preferred. There are several possibleinterpretations of this finding including that PhD students might still expect to use many of theskills they had gained from their doctoral research even if not working in the precise subjectarea of their doctorate.

STEM Graduates in Non-STEM Jobs
61
Figure 3.3 How essential to have a degree in your particular subject (final year students with a career inmind or considering several alternatives, as percentages, N=2,187)
0 10 20 30 40 50 60 70 80 90 100
All final year
Geography
Computer Science
Mathematical Sciences
Architecture, Building andPlanning
Sports Science
Forensic Science/Archaeology
Subjects allied to Medicine
Psychology
Physics
Biological Sciences
Engineering andTechnology
Chemistry
Other Physical Sciences
Essential Preferred
Figure 3.3 shows that the proportion of final year students who thought that a degree in theirparticular subject was essential to achieve their career goal varied quite considerably by subjectfrom nearly three-quarters (72%) of students in Other Physical Sciences to only just over a third(35%) of Geographers. Overall, 88% thought a degree in their particular subject would beessential or preferred for their chosen career but this varied from 80% in Psychology to 94% inEngineering and Technology. Final year STEM students who thought having a degree in theirsubject was essential to achieve their career goal were much more likely than others to beplanning to work in a STEM Specialist sector (63%) or STEM Core function (56%).

STEM Graduates in Non-STEM Jobs
62
3.3 Plans after graduation
While most of the students had a career goal of working in STEM, others were planning to workoutside STEM and yet others were still undecided in their direction. But how were they takingthis forward in the short and longer term?
3.3.1 Plans for next year
Roughly four in ten (41%) UK final year STEM undergraduates aimed to obtain employmentrelated to their longer-term career plans, a quarter (26%) planned to enrol on a full-time higherdegree course, 3% to undertake further vocational training, 6% to obtain temporary employmentand 5% to take other long-term employment (i.e. a permanent job but not related to their longer-term career plans – possibly just to earn money). Some planned to travel or take time out(11%), while the remainder had other aims or were undecided.
Figure 3.4 shows the different intentions of final year students by subject group for the two mostcommon aims – employment related to longer-term career plans and enrolling on a full-timehigher degree course. It shows that in Architecture, Building and Planning, Engineering andTechnology, and Computer Science, the majority of students expected to obtain employmentrelated to their longer term career plans and relatively few planned to enrol for a full-time higherdegree.
On the other hand, there were a number of subjects where more students expected to enrol ona full-time higher degree course than enter employment related to their long-term career plans.These included Biological Sciences, Psychology, Other Physical Sciences and ForensicScience/Archaeology. Sports Science and Geography were two other subjects where relativelyfew students expected to enter employment related to their longer-term career plans aftergraduation and in both these subjects about one in six expected to travel or take time out. Justover a third of Physics and Chemistry students expected to enrol for a full-time higher degree,almost as many as expected to obtain employment related to their longer-term career plans(see Appendix Table B3.18). This is a similar pattern to findings from the HESA longitudinalDLHE analysis (see Appendix A, section A.1.5).

STEM Graduates in Non-STEM Jobs
63
Figure 3.4 Main aim for year after completion of course, by subject of study (final year UKundergraduates), as percentages
0 10 20 30 40 50 60 70 80 90 100
Biological Sciences
Geography
Sports Science
Psychology
Forensic Science/Archaeology
Subjects allied to Medicine
Other Physical Sciences
Physics
Chemistry
Mathematical Sciences
Computer Science
Engineering andTechnology
Architecture, Building andPlanning
All final years
Enrol on a full-time higher degree course Obtain employment related to longer-term career plans
These differences suggest that by their final year STEM students may have a fairly realisticunderstanding of some distinctive features of the labour markets in which they will be seekingemployment. In particular, we infer that students are aware whether graduate level jobs arerelatively plentiful for students with first degrees in their subject or whether further specialisedstudy is required (or might give them added value).

STEM Graduates in Non-STEM Jobs
64
3.3.2 Further study options
Regardless of their main aim for next year, everyone was asked whether they had applied orexpected to apply for another course, research degree or vocational training on either a full-timeor part-time basis. Overall, 46% of final year students had already applied, or were expecting toapply, with 37% choosing a course directly related to their degree and only 11% a course notrelated to their degree. Relatively fewer students in Computer Science (28%), Engineering andTechnology (27%) and Architecture, Building and Planning (21%) were considering furtherstudy, while students in Biological Sciences (51%) and Other Physical Sciences (52%) were thestudents most likely to be considering further study directly related to their degree (see Figure3.5). Note that students could select more than one further study option as a number wouldhave been considering or have applied for several different types of further study/training.
Figure 3.5 Further study/training, by subject of study (final year UK undergraduates), as
percentages
0% 10% 20% 30% 40% 50% 60% 70% 80% 90% 100%
Biological Sciences
Other Physical Sciences
Chemistry
Physics
Psychology
Subjects allied to Medicine
Sport Science
Forensic Science/Archaeology
Geography
Mathematical Sciences
Computer Science
Engineering and Technology
Architecture, Building and Planning
All final years
Directly related to my degree Not related to degree Not considering

STEM Graduates in Non-STEM Jobs
65
In terms of the type of further study/training that these students were considering, just over a third(36%) were considering a PhD, 42% a Masters degree and 19% teacher training, while 12% wereconsidering other vocational/professional training (see Table 3.5). Not only is there variation in theproportion of students studying different subjects who were considering further study but alsodifferences in the type of study that they were considering. Nearly half (49%) the Mathematiciansand 45% of Sports Science students were considering teacher training, while two-thirds ofChemists and over half (54%) the Physicists were considering studying for a PhD. Studying for aMasters degree was most commonly mentioned by Sports Science students (61%), Psychologystudents (59%), Architecture, Building and Planning students (60%), Geography students (63%)and Forensic Science/Archaeology students (74%).
Table 3.5 Type of further study/training being considered (Final year UK undergraduates, by
subject of study), as percentages
Subject group
Pos
t-gr
adua
teTe
achi
ng
Oth
ervo
catio
nal
train
ing
Oth
erpo
st-
grad
uate
dipl
oma
Mas
ters
degr
ee
PhD
Oth
ertra
inin
g
Num
bero
fca
ses
Subjects allied to Medicine 4 22 4 28 22 27 78
Biological Sciences 13 13 6 39 35 18 234
Sports Science* 45 15 9 61 18 6 33
Psychology 17 13 4 59 33 8 172
Chemistry 20 5 2 19 66 7 122
Physics 21 16 3 23 54 8 132
Other Physical Sciences 14 2 2 46 47 5 96
Mathematical Sciences 49 12 2 27 22 5 94
Computer Science 22 10 4 46 26 5 78
Engineering & Technology 10 13 3 44 39 7 157
Architecture, Building andPlanning* 0 10 40 60 0 0 10
Geography 29 12 3 63 8 4 114
Forensic Science/Archaeology* 8 11 11 74 47 8 38
All final year 19 12 4 42 36 10 1358
*Note small sample size (less than 50) in these subjects.
Four reasons for undertaking further study were mentioned by over the half the students, two ofwhich were clearly career-related. The most commonly mentioned were ‘wanting to developmore specialist knowledge and expertise’ (59%), ‘having access to better career opportunities’(58%), ‘interest in the course’ (57%) and ‘essential for the career I wish to develop’ (56%). Thereasons ‘essential for the career I wish to develop’ was most frequently mentioned by studentsin biologically-related subjects (Subjects allied to Medicine, Biological Sciences, Sports Scienceand Psychology) and Mathematics, while ‘developing more specialist knowledge and expertise’

STEM Graduates in Non-STEM Jobs
66
was most often mentioned by students in Archaeology/ Forensic Science, Other PhysicalSciences, Computer Science and Engineering and Technology. ‘Interest in the course’ wasmost cited by Physicists (Appendix Table B3.19).
Students considering different types of courses were motivated by different reasons (see Table3.6). Three-quarters (74%) of students considering teacher training, and roughly two-thirds ofthose considering other vocational/professional training or other training, said that it wasessential for the career they wished to develop. In contrast, ‘access to better careeropportunities’ was most frequently mentioned by students considering Masters degrees (71%)and other postgraduate diplomas (66%), while ‘developing more specialist knowledge andexpertise’ was most frequently mentioned by those considering a PhD (78%).
Table 3.6 Reasons for undertaking further study/training, by type of course (final year UKundergraduates), as percentages
Pos
tgra
duat
eT
each
ing
Cer
tific
ate
Oth
ervo
catio
nal/
prof
essi
onal
trai
ning
Oth
erpo
stgr
adua
tedi
plom
a
Ma
ste
rsde
gree
PhD
Oth
ertr
aini
ng
Not
answ
ered
All
I want to develop more specialistknowledge and expertise 34 53 55 69 78 35 6 59
It will give me access to bettercareer opportunities 47 53 66 71 64 41 11 58
I am interested in the course 47 39 38 63 70 62 17 57
It is essential for the career Iwish to develop 74 65 63 45 53 67 11 56
I want to continue studying to ahigher level 26 25 32 54 71 24 6 46
I want to develop a broaderrange of knowledge andexpertise
27 43 38 46 40 31 6 37
It will be easier to find the typeof job I want with this additionalqualification
33 37 41 47 38 24 0 36
It is difficult to get the type of jobI want at the present time 15 15 23 23 17 11 0 16
I want to change career direction 9 21 20 9 5 22 6 9
I have been unable to get workdirectly related to myundergraduate degree
5 4 7 5 3 2 0 4
Other 2 2 0 1 1 5 0 2
Not answered 0 0 0 0 0 0 67 1
Number of cases 258 163 56 568 486 130 18 1358

STEM Graduates in Non-STEM Jobs
67
The overall pattern of reasons for undertaking postgraduate study given by the studentscurrently on taught postgraduate courses (discussed in Section 3.4.2) almost exactly matchedthat for final year students who were considering Masters degrees (see Appendix Table B3.20).Getting access to better career opportunities was the most frequently mentioned reason. Themain difference between the final years (intending postgraduates) and the actual postgraduateson taught courses is that more actual postgraduates mentioned changing career direction (21%compared to 9%) and slightly more mentioned being unable to get work related to my degree(12% compared to 5%), while slightly fewer mentioned it being difficult to get the type of job Iwanted (18% compared to 23%).
3.3.3 Relating different career tracks to longer term career plans
It is apparent that there were four main career tracks that final year STEM students were aimingto follow when they graduated. The largest group (41%) were planning to obtain employmentrelated to their longer term career plans, a quarter (26%) were planning full-time further study,12% expected to enter other employment and 12% were planning to travel or take time out. Theremaining 9% had a variety of other aims but no single aim involved many students.
How did those short-term plans of final year undergraduates match up with intention to follow aSTEM degree-related career or not in the long term? Two-thirds of those whose main aim wasto undertake full-time further study definitely wanted to pursue a career in an occupation directlyrelated to their degree, as did 59% of those who aimed to obtain employment related to theirlonger term career plans (see Figure 3.6). In contrast, the majority (59%) of those whose aimwas to obtain other employment only might want to pursue a degree related career, while many(47%) of those who plan to travel or take time out also only might do so.
There is a similar pattern when it comes to whether these students have a definite career inmind. Far fewer of those aiming to obtain other employment (10%) or those planning to travel ortake time out (16%) have a definite career in mind, while 41% of those whose aim is toundertake full-time further study and 35% of those who expect to obtain employment related totheir longer term career plans have a definite career in mind (see Figure 3.7).
When analysis is carried out to look at the nature of the career options that these final yearSTEM undergraduates were considering, those planning full-time further study or long termemployment related to their career plans were more likely to be considering working in STEMSpecialist sectors or STEM Core functions than those aiming for other employment or totravel/take time out (see Table 3.7). Although this analysis excluded those with only vague or noidea of possible careers, which was nearly half of those planning to travel/take time out and halfof those planning to obtain other sorts of employment, the fact that so many of the remainder ofboth these groups were considering a mix of STEM and non-STEM sectors (and STEM andunrelated functions) is a reflection of career uncertainty, and perhaps an indication of a moreexploratory stage of career thinking.

STEM Graduates in Non-STEM Jobs
68
Figure 3.6 Level of STEM career intention, by career track (i.e. short-term plan): final year UKundergraduates
0% 20% 40% 60% 80% 100%
Employment related tocareer plans
Other employment
Travel/take time out
Full-time higher degree
All final year
Definitely want Might want Don't think want Definitely do not want Don't know
Figure 3.7 Firmness of current career plans, by career track (final year UK undergraduates)
0% 10% 20% 30% 40% 50% 60% 70% 80% 90% 100%
Employment related tocareer plans
Other employment
Travel/take time out
Full-time higher degree
All final year
Definite career in mind Considering several alternatives Only vague idea No idea at all

STEM Graduates in Non-STEM Jobs
69
Table 3.7 Expected employment sector and function, by career track (UK final year students with definitecareer plans or considering several alternatives), as percentages
Sector Em
ploy
me
ntre
late
dto
long
er-
term
care
erpl
ans
Oth
erlo
ng-te
rm/
tem
pora
ryem
ploy
me
nt
Tra
velo
rta
ketim
eou
t
Enr
ollo
nfu
ll-tim
ehi
gher
degr
eeco
urse
All
with
pla
ns
STEM Specialist 56 36 31 56 51
STEM Generalist 9 6 11 16 11
Non-STEM/Other 7 8 12 4 7
STEM Specialist/Generalist 8 14 15 11 10
Mixed 20 37 31 14 21
Don't know 0 0 0 0 0
Function
STEM Core 51 35 32 49 47
STEM related 9 6 13 17 12
Other/unrelated 12 16 15 8 12
STEM Core/related 7 11 11 12 9
Mixed 20 29 28 13 18
Don't know 2 4 2 1 2
Number of cases 1001 171 186 637 2187
3.3.4 Job-seeking behaviour
Half way through their final year, the majority (58%) of final year undergraduates had alreadystarted looking for employment (excluding short-term vacation work). The proportion who hadstarted looking varied from 74% of Engineering/Technology students to 47% in BiologicalSciences. Just over a third (37%) had already applied for jobs related to their long-term careerplans but again there was considerable variation by subject with 58% ofEngineering/Technology students having already applied for jobs compared to just 17% ofForensic Science/Archaeology students and 20% of Psychology students (see Figure 3.8).
Just over a fifth (21%) of students in Subjects allied to Medicine and Engineering andTechnology had already been offered a job related to their longer-term career plans as had 17%of Architecture, Building and Planning students. Note that some final year students describedthemselves as already employed either because they had been on secondment from theiremployers while they were at university, or because they had accepted jobs offers from theirwork experience employers (6% of Architecture, Building and Planning students and 4% ofComputer Science students were in this situation).

STEM Graduates in Non-STEM Jobs
70
Figure 3.8 Job-seeking behaviour (final year UK undergraduates), as percentages
0 10 20 30 40 50 60 70 80
Biological Sciences
Psychology
Physics
Forensic Science/Archaeology
Subjects allied to Medicine
Mathematical Sciences
Geography
Computer Science
Other Physical Sciences
Sports Science
Architecture, Building andPlanning
Chemistry
Engineering andTechnology
All final years
Been offered job Applied for job Started looking for employment
Although the overall proportion who had started looking for work or made applications seemsrelatively low (58%), nearly all (80%) of those whose main aim for next year was to obtainemployment related to their longer-term career plan had already started looking for work and62% had applied for jobs related to their longer-term plans. However, only 18% of them hadalready been offered a job related to their career plan at this point in their final year.
There was little variation in job-seeking behaviour related to students’ intention to work in aSTEM employment sector or function, or not (see Appendix Tables B3.21 and B3.22). The onlyexception was students with the intention of seeking work in STEM Generalist sectors or STEMrelated functions. Students with the intention of working in STEM Generalist sectors were lesslikely to have started looking for employment than students intending to work in other sectors(44% compared to over 60% for all other sectors) and also slightly less likely to have alreadyapplied for any jobs related to their long-term career plans (only 38% had started) but were
STEM Graduates in Non-STEM Jobs
71
more likely to have already been offered a job (22%). There was a similar pattern with thosestudents intending to work in STEM-related roles. This may be a function of the fact that somelarge, prestigious recruiters (e.g. large accountancy firms) start their graduate recruitment earlyin the final year and that some of these students had already been successful in this recruitmentprocess.
Final year students with a definite career intention, either to seek degree-related work or not to,were slightly more likely than those who might or might not seek degree-related work, and muchmore likely than those who do not know, to have started looking for employment. The smallnumber of students who had definitely decided not to seek degree-related work were the onesmost likely to have already applied for jobs (50%), or to have been offered one (22%), while thelarger group of students (34%) who might be seeking degree-related work were the ones leastlikely to have applied for jobs (34%) or to have been offered a job (7%) (Ignoring the very smallgroup of ‘Don’t knows’). This may be a reflection of the graduate recruitment cycle of majoremployers but also suggests that students who were less certain of their career plans were morelikely to miss out on recruitment activity early in their final year.
Main conclusions from this analysis:
1. The likelihood of following a STEM career is strongly linked to the career track astudent plans to follow after graduation; not all have firm plans and many of those whoare least definite are likely to end up outside STEM.
2. Some students who plan a career outside STEM have already been recruited ontograduate programmes early in the final year.
3.4 Development of career thinking prior to and at university
The second half of this chapter seeks to understand what factors were most important ininfluencing the development of students’ career plans while they were at university. Thesections that follow explore what influenced their initial decision to choose a STEM degreesubject, the impact of having a career plan when they first went to university, how their planshave changed over time and, in particular, the effect that certain activities, such as undertakingdegree-related work experience or using their university careers service, had on thedevelopment of their plans.
Underpinning this is the clear finding from the survey that most students change their careerplans while they are at university: more than two-thirds (69%) of final year undergraduates hadchanged their career plans, although most only to some extent (52%) rather than completely(17%) (see Appendix Table B3.13). The proportions of taught postgraduates and PhD students

STEM Graduates in Non-STEM Jobs
72
who had changed their career plans completely, or to some extent, while they wereundergraduates were quite similar.
Plans also continue to change during postgraduate study, with slightly more than a half (57%) ofthe PhD students reporting that they had changed their career plans to some extent while theyhad been postgraduates, although only 12% had changed their plans completely.
3.4.1 Reasons for choosing a STEM degree course
It is helpful to understand how the students have made past decisions and how these decisionsmay influence future career intentions. In this case, why students originally chose a STEMdegree could have a direct bearing on whether they intend to pursue at STEM career. Studentswere asked, therefore, to identify the factors that were most important to them when they chosetheir undergraduate course. Five factors were mentioned much more frequently than the others.The two factors cited most frequently by UK final-year undergraduates for their choice of degreecourse were ‘personal interest/aptitude in subject’ (77% overall) and ‘enjoyed studying subjectat A-level’ (67%). Two career-related factors were mentioned by about half the final yearstudents with ‘feeling this course would keep a lot of career options open for me’ and ‘wanting tofollow a career in this field’ being mentioned by 52% and 49% respectively (see Table 3.8 andAppendix Table B3.23).
Table 3.8 shows that there was considerable variation by subject studied in the reasons givenfor choice of undergraduate course. In particular, ‘wanting to follow a career in this field’ was themost frequently mentioned reason by final year students studying Architecture, Building andPlanning (67%) and frequently mentioned by Computer Science students (63%) but was lessfrequently mentioned by final year students in Chemistry (35%), Physics (40%), Mathematics(41%) and Geography (32%).
‘Feeling this course would keep a lot of career options open for me’ was the second mostfrequently mentioned reason by final year students in Engineering and Technology (62%), andwas mentioned frequently by final year students in Physics (63%) and Mathematics (67%) butless frequently by those in Subjects allied to Medicine (28%), Biological Sciences (42%), SportsScience (36%), and Forensic/Archaeological/Other Physical Science (39%).

STEM Graduates in Non-STEM Jobs
73
Table 3.8 Main reasons for choice of undergraduate course, by subject of study (final year UKundergraduates), expressed as percentages
Subject group
Per
sona
lin
tere
st/
aptit
ude
insu
bjec
t
Enj
oyed
stu
dyin
gsu
bje
ctat
A-le
vel
Felt
cour
seke
ptca
reer
optio
ns
Wan
ted
tofo
llow
care
erin
this
field
Like
dun
ive
rsity
/de
partm
entw
hen
visi
ted
Req
uire
dqu
al’n
for
chos
enca
reer
Num
ber
ofca
ses
Subjects allied toMedicine 71 64 27 51 52 23 146
BiologicalSciences 74 77 42 47 40 13 371
Sports Science 77 66 36 64 33 22 64
Psychology 84 68 50 59 39 21 309
Chemistry 72 85 52 35 58 15 213
Physics 83 81 62 40 41 12 236
Other PhysicalSciences 82 61 39 50 55 14 166
MathematicalSciences 81 89 67 41 36 11 233
Computer Science 82 58 59 63 36 12 272
Engineering andTechnology 73 48 61 54 43 25 578
Arch., Building andPlanning* 60 13 47 66 26 26 47
Geography 77 83 45 32 45 5 259
Forensic Science/Archaeology 76 33 39 60 57 21 75
All final year 77 67 52 49 43 16 2969
* Note small sample size (less than 50).
These two career-related reasons for choosing a university course were not correlated. Thismeans that 26% of UK final year students said both that they ‘wanted to keep their career optionsopen’ and ‘follow a career in this field’, 23% only that they ‘wanted to follow a career in this field’,25% only that they ‘wanted to keep their career options open’ and 25% mentioned neither ofthese reasons. The exact proportions will vary for different subjects reflecting the relativepreponderance of these two orientations among students in a particular subject area.
Thus, while personal interest and enjoyment were the most frequently mentioned reasons forchoosing a STEM undergraduate course, career-related reasons were also important for aroundhalf the students, although only about one in six students mentioned that their chosen coursewas a required qualification for their chosen career. Once again there was considerablevariation by subject with 26% of Architecture, Building and Planning students and 25% of
STEM Graduates in Non-STEM Jobs
74
Engineering and Technology students mentioning this reason, compared to only 5% ofGeographers and 11% of Mathematicians.
The reasons given by postgraduates on taught courses and by final year PhD students forchoosing their undergraduate course were broadly similar to those for undergraduates (seeAppendix Tables B3.24 and B3.25) with the same five reasons being mentioned mostfrequently. However, both taught postgraduates and PhD students were less likely to mentionhaving wanted to keep their career options open (43% and 42% respectively) than final yearundergraduates.
3.4.2 Reasons for undertaking postgraduate study
The main reason taught postgraduates gave for undertaking postgraduate study was that ‘it willgive me better access to career opportunities’ (73%), followed by ‘wanted to develop morespecialised knowledge and expertise’ (68%) and ‘interested in the course’ (63%). However,reasons varied by subject (see Table 3.9) with, for example, less than half (44%) of theMathematicians mentioning that postgraduate study ‘will give me better access to careeropportunities’.
Nearly two thirds (65%) of the small number of Sports Scientists, but only 18% ofMathematicians and 23% of Physicists, mentioned that ‘it will be easier to get the type of job Iwant with this additional qualification’. ‘Essential for the career I wish to develop’ was mentionedby over half of postgraduate students in Subjects allied to Medicine, Sports Science andPsychology.
Final year PhD students, on the other hand, were not so focused on career-related reasons butmuch more likely to mention being ‘interested in this subject’ (77%), ‘wanting to continuestudying to a higher level’ (65%), ‘wanting to develop more specialist knowledge and expertise’(58%) and ‘wanting to develop more high-level skills’ (46%) as reasons for undertakingpostgraduate research. There were fewer differences by subject (see Appendix Table B3.26)but final year PhD students in Biological Sciences (51%) and Psychology and Sports Science(50%) were more likely to mention that undertaking postgraduate research was ‘essential for thecareer I wish to develop’.

STEM Graduates in Non-STEM Jobs
75
Table 3.9 Most common reasons for choice of postgraduate course, by subject of study (UK taughtpostgraduates), as percentages
Subject groupA
cces
sto
bette
rca
reer
oppo
rtuni
ties
Wan
ted
tode
velo
psp
ecia
listk
now
-le
dge
Inte
rest
inco
urse
Wan
ted
tost
udy
tohi
gher
leve
l
Eas
iert
oge
tty
peof
job
wan
ted
Wan
ted
broa
der
know
-ledg
e/e
xper
tise
Ess
entia
lfor
care
er
Num
bero
fcas
es
Subjects alliedto Medicine 77 61 81 48 52 26 61 31
BiologicalSciences 76 76 64 66 42 48 46 50
Sports Science* 88 94 47 47 65 35 53 17
Psychology 84 78 68 68 44 42 54 50
Chemistry* 80 70 60 50 50 50 40 10
Physics 58 65 58 52 23 32 39 31
Other PhysicalSciences 79 76 74 69 55 43 43 42
MathematicalSciences 44 62 87 73 18 44 18 45
ComputerScience 76 74 66 63 44 51 28 82
Engineering andTechnology 78 58 53 50 49 43 40 129
Arch., Buildingand Planning 70 38 46 22 38 32 46 37
Geography 70 67 53 45 53 35 35 60
ForensicScience/Archaeology 59 86 72 69 55 34 38 29
All taughtpostgraduates 73 68 63 56 45 41 40 613
* Note very small sample size (less than 20) in these subjects
3.4.3 Changing degree course
Changing degree course is one indicator of unease with initial choice of university degreesubject. Although such a change need not necessarily indicate a change in career plan, giventhat only about half had chosen their course for career-related reasons, it may well have careerconsequences. However, most final year undergraduates had stayed on their originalundergraduate course: 17% changed their undergraduate degree subject at some stage duringtheir time at university, but most of these changed to a different degree course in the samedepartment (12%) (see Appendix Table B3.27). A similar proportion (15%) of the taught

STEM Graduates in Non-STEM Jobs
76
postgraduates and final year PhD students had changed their undergraduate degree subject atsome stage.
Another indicator of unease with career direction or course is whether students would do thesame course again if, hypothetically, they had their time again. Nearly a quarter (24%) of finalyear undergraduates, when asked, said they would do a different undergraduate course if theywere to start their university education again, but only a few (3%) would not go to university atall or delay their entry to higher education (6%). The proportion who said that they wouldchoose a different undergraduate course was highest in Architecture, Building and Planning(34%) and Subjects allied to Medicine (33%), and lowest in Mathematics (16%), Other PhysicalSciences (16%) and Physics (18%) (see Appendix Table B3.28).
While slightly fewer taught postgraduates would do the same/similar undergraduate courseagain (see Appendix Table B3.29), this is mainly because of differences in just a few subjectareas. In particular, more postgraduates who studied Subjects allied to Medicine (38%), Biology(31%) or Chemistry (32%) as undergraduates would do a different undergraduate course. BothBiology and Chemistry are net exporters of students with a higher proportion of studentsstudying these subjects at undergraduate than postgraduate level (see Appendix A, sectionA.3.1) and so this is not altogether surprising. The converse is also true with more students nowstudying Computer Science and Architecture, Building and Planning as postgraduates (both netimporters of students at postgraduate level), as well as more of those studying Physics,reporting they would do a different undergraduate course.
While only a small minority of STEM undergraduates had actually changed course, far more(around a quarter) would choose a different undergraduate course if they had the opportunity tostart their university education again. Whether this means that these students had been badlyadvised, merely lacked information or just that their interests had changed over time is an openquestion. Most likely each of these reasons applies to some of the students.
3.5 Development of career plans
A key purpose of the survey was to explore how the students’ career plans developed overtime, and particularly how that related to an intention to pursue a career in or outside STEM.There is evidence from earlier research that not many students enter higher education withclear career goals (Roberts Review, 2002) but little research evidence about how students, inSTEM in particular, develop or change their career plans while at university. Others may havehad clear plans when they first came to university but have changed them for a variety ofreasons. This research sought to understand not only whether students were being attracted to,or put off, following a career in STEM but also to identify what were the main factors influencingthe development of their career plans.
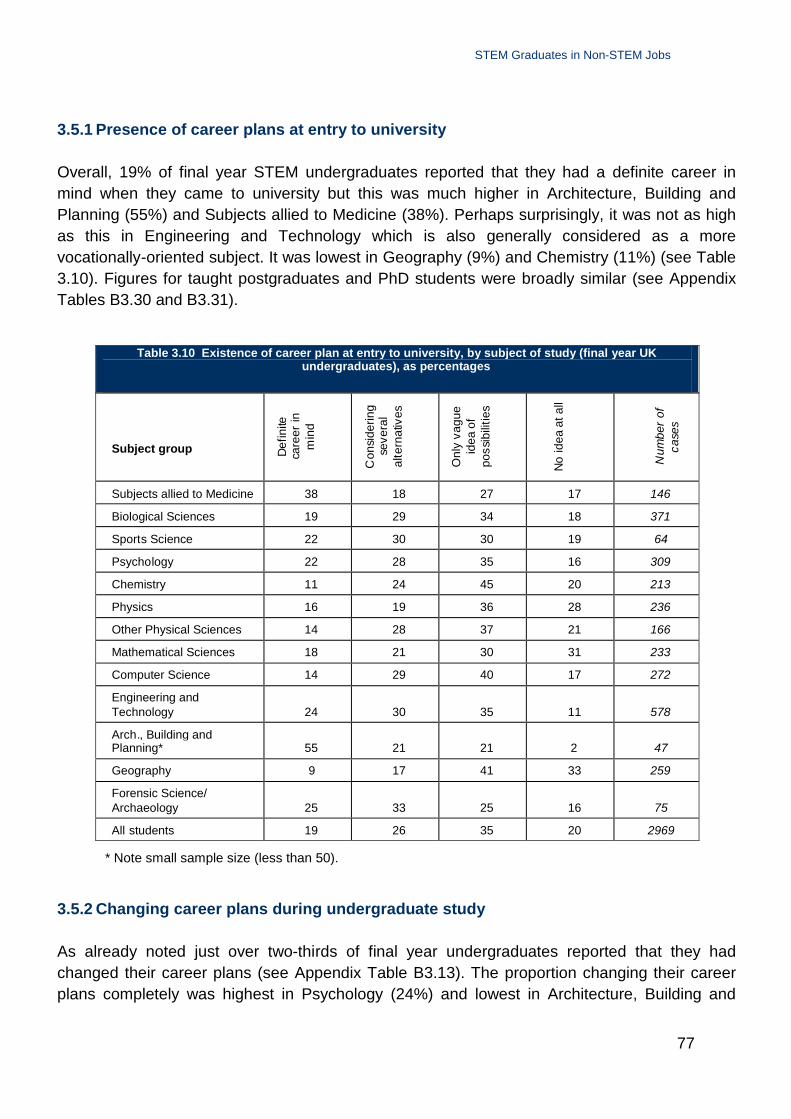
STEM Graduates in Non-STEM Jobs
77
3.5.1 Presence of career plans at entry to university
Overall, 19% of final year STEM undergraduates reported that they had a definite career inmind when they came to university but this was much higher in Architecture, Building andPlanning (55%) and Subjects allied to Medicine (38%). Perhaps surprisingly, it was not as highas this in Engineering and Technology which is also generally considered as a morevocationally-oriented subject. It was lowest in Geography (9%) and Chemistry (11%) (see Table3.10). Figures for taught postgraduates and PhD students were broadly similar (see AppendixTables B3.30 and B3.31).
Table 3.10 Existence of career plan at entry to university, by subject of study (final year UKundergraduates), as percentages
Subject group Def
inite
care
erin
min
d
Con
side
ring
seve
ral
alte
rnat
ives
Onl
yva
gue
idea
ofpo
ssib
ilitie
s
No
idea
atal
l
Num
ber
ofca
ses
Subjects allied to Medicine 38 18 27 17 146
Biological Sciences 19 29 34 18 371
Sports Science 22 30 30 19 64
Psychology 22 28 35 16 309
Chemistry 11 24 45 20 213
Physics 16 19 36 28 236
Other Physical Sciences 14 28 37 21 166
Mathematical Sciences 18 21 30 31 233
Computer Science 14 29 40 17 272
Engineering andTechnology 24 30 35 11 578
Arch., Building andPlanning* 55 21 21 2 47
Geography 9 17 41 33 259
Forensic Science/Archaeology 25 33 25 16 75
All students 19 26 35 20 2969
* Note small sample size (less than 50).
3.5.2 Changing career plans during undergraduate study
As already noted just over two-thirds of final year undergraduates reported that they hadchanged their career plans (see Appendix Table B3.13). The proportion changing their careerplans completely was highest in Psychology (24%) and lowest in Architecture, Building and

STEM Graduates in Non-STEM Jobs
78
Planning (6%) and Engineering/Technology (12%). The proportion of taught postgraduates whohad changed their career plans while undergraduates either completely (21%) or to some extent(38%) was quite similar, as was the proportion of UK final year PhD students (18% completelyand 46% to some extent). However, slightly more than a half (57%) of the PhD students hadchanged their career plans to some extent while they were postgraduates but only 12% hadchanged their plans completely.
3.5.3 Nature of initial career plans
Final year undergraduate students who said they had a definite career in mind (19%) or wereconsidering several alternatives (26%) when they first came to university were asked whatcareer they had in mind at that time (see Figures 3.9 and 3.10). The majority of them (71%) hadexpected to work in a STEM Specialist sector and in a STEM Core function (68%) but therewere some notable exceptions, especially in Mathematics but also to a lesser extent inGeography. Most Mathematics students (83%) had expected to work in STEM Generalistsectors (Education and Training 42%, Investment banking 19% and Accountancy and businessservices 16%).
Results for occupational function were broadly similar with 78% of Mathematics studentsexpecting to work in STEM-related functions (Education/teaching 42% and Accountancy/finance 31%). More than a third (36%) of Geographers and 42% of Sports Science studentsalso expected to work in Education/teaching. Whether teaching is considered to be in a STEMGeneralist sector or a STEM-related function, as we have classified it, clearly has considerableinfluence on these percentages for the subjects where a substantial proportion are consideringteaching as a career.
Replies from UK taught postgraduates were very similar to those of final year students (seeAppendix Table B3.32). When they first went to university most of those with definite plans orconsidering several career alternatives expected to work in a STEM Specialist sector (76%) anda STEM Core function (74%). Mathematicians were once again the main exception with themajority expecting to work in STEM Generalist sectors (54%) and STEM-related functions(62%).
The same pattern was found among final year PhD students with most of those with a definitecareer in mind or considering several career alternatives when they first went to universityexpecting to work in a STEM Specialist sector (71%) and a STEM Core function (76%).
It is apparent that most of the minority with a career plan when they first came to universityexpected to work in STEM employment. There were also clear subject differences; students insome subjects being much more likely to have had clear plans at this stage – justifying labellingthese subjects as more ‘vocational’ not only because of their content but also because theyattract more career-oriented students.

STEM Graduates in Non-STEM Jobs
79
Figure 3.9 Planned employment sector at entry to university, by subject of study (final year UKundergraduates with some initial career plans)
0% 10% 20% 30% 40% 50% 60% 70% 80% 90% 100%
Mathematical Sciences
Geography
Psychology
Physics
Sports Science
Other Physical Sciences
Computer Science
Chemistry
Forensic Science/Archaeology
Architecture, Building andPlanning
Engineering andTechnology
Biological Sciences
Subjects allied to Medicine
All with an initial careerplan
STEM Specialist STEM Generalist Non-STEM Other Don't know
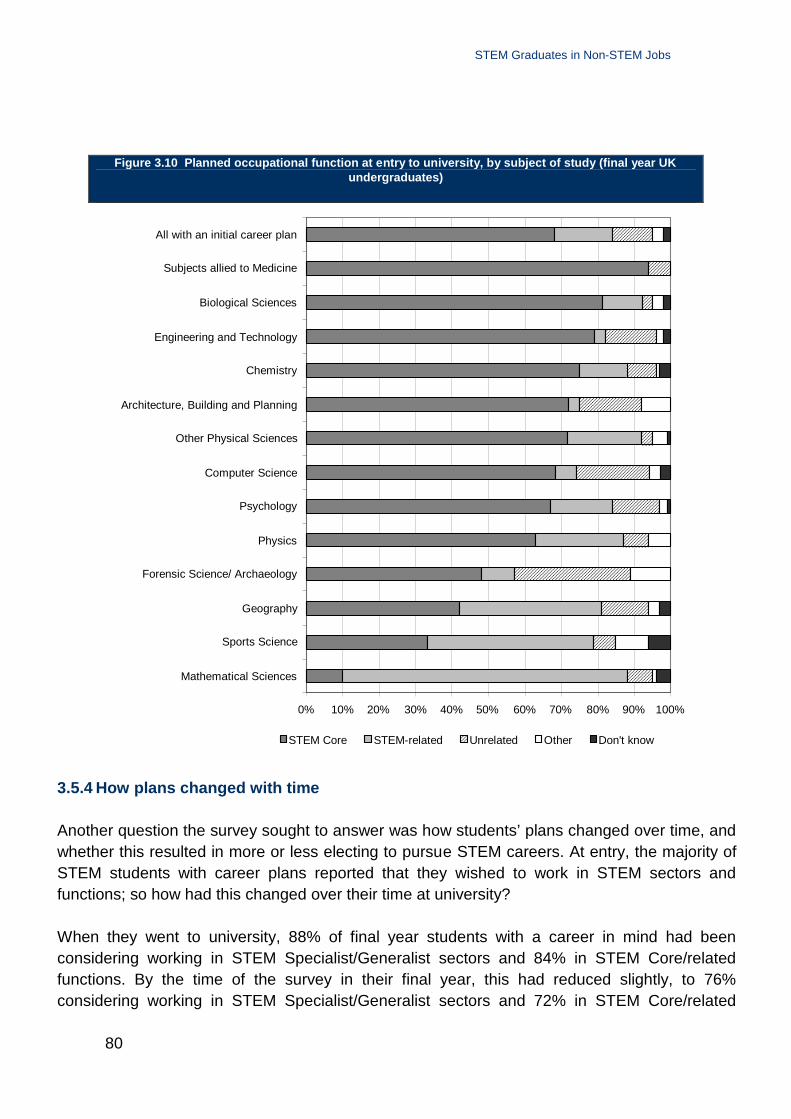
STEM Graduates in Non-STEM Jobs
80
Figure 3.10 Planned occupational function at entry to university, by subject of study (final year UKundergraduates)
0% 10% 20% 30% 40% 50% 60% 70% 80% 90% 100%
Mathematical Sciences
Sports Science
Geography
Forensic Science/ Archaeology
Physics
Psychology
Computer Science
Other Physical Sciences
Architecture, Building and Planning
Chemistry
Engineering and Technology
Biological Sciences
Subjects allied to Medicine
All with an initial career plan
STEM Core STEM-related Unrelated Other Don't know
3.5.4 How plans changed with time
Another question the survey sought to answer was how students’ plans changed over time, andwhether this resulted in more or less electing to pursue STEM careers. At entry, the majority ofSTEM students with career plans reported that they wished to work in STEM sectors andfunctions; so how had this changed over their time at university?
When they went to university, 88% of final year students with a career in mind had beenconsidering working in STEM Specialist/Generalist sectors and 84% in STEM Core/relatedfunctions. By the time of the survey in their final year, this had reduced slightly, to 76%considering working in STEM Specialist/Generalist sectors and 72% in STEM Core/related

STEM Graduates in Non-STEM Jobs
81
functions. However, a further 17% were considering both STEM and non-STEM sectors, and14% were considering both STEM and unrelated functions. The percentage only consideringnon-STEM sectors had reduced to 7% now, from 12% at entry, while the percentageconsidering Unrelated job functions had not really changed (13%).
This appears to show no substantial dilution of the intention to work in STEM among thoseinitially most committed to it. In addition, among those 55% of final year students who wereunsure about their career at entry, 60% now had career plans of whom 67% were consideringworking in STEM Specialist/Generalist sectors and 63% in STEM Core/related functions, while afurther 25% were considering both STEM and non-STEM sectors (and 23% considering bothSTEM and unrelated functions). Just 7% of this group were only considering non-STEM sectorsand 11% Unrelated functions.
Taken altogether, and along with the finding that very few final year students either might not ordefinitely do not want to work in occupations related to their STEM degree (see section 3.1),there seem to be two clear messages from this analysis:
1. No support for the suggestion that large numbers of students in STEM subjects arebeing put off working in STEM while they are at university. It may be of greatersignificance that just over a quarter (26%) still only have a vague or no idea at all ofpossible careers at this stage in their final year.
2. It also seems likely that the many students who mainly selected their undergraduatecourses for interest might now find that occupations linked to their degree subject arealso interesting, and thereby attractive to them.
3.6 Influences on career thinking
Career plans change over time and the survey sought to understand what had influenced thesechanges and how this affected students’ intentions to enter a STEM occupation or not.
Those final year students who had changed their career plans while at university were askedwho or what had influenced them. ‘My personal interests/values’ (69%) and ‘the content of myuniversity course’ (58%) were the most frequently mentioned (see Table 3.11 and AppendixTable B3.33). By comparison, employer or employee influences tended to be mentioned lessfrequently (by around 20-30%) but for those students who had undertaken some degree-relatedwork experience, their work experience employer was the third most frequently mentionedinfluence (51%).

STEM Graduates in Non-STEM Jobs
82
Table 3.11 Most common influences on career plans, by subject of study (final year UK undergraduateswho had changed plans), as percentages
Subject group
Per
sona
lin
tere
sts/
val
ues
Con
tent
ofco
urse
Frie
nds/
stud
ents
/pee
rs
Tuto
rs/
facu
lty
Peo
ple
Ikn
oww
orki
ngin
this
care
er
Wor
kex
perie
nce
empl
oyer
Par
ents
/re
lativ
es/
frie
nds
ofpa
rent
s
Num
bero
fca
ses
Subjects allied toMedicine 72 48 45 34 30 33 29 83
BiologicalSciences 71 58 40 39 27 27 28 259
Sports Science* 71 60 29 40 42 24 22 45
Psychology 77 57 35 35 26 17 28 243
Chemistry 63 58 42 36 31 38 23 166
Physics 70 55 42 30 28 26 32 148
Other PhysicalSciences 74 70 38 54 26 19 27 119
MathematicalSciences 61 47 42 21 26 18 33 142
Computer Science 62 57 40 33 35 39 26 173
Engineering andTechnology 67 64 42 37 28 41 24 392
Arch., Building andPlanning* 79 32 25 36 43 25 32 28
Geography 72 55 33 30 22 15 34 189
Forensic Science/Archaeology 71 72 26 34 24 17 19 58
All who hadchanged plans 69 58 39 35 28 28 28 2045
* Note small sample size (less than 50) in these subjects.
Influences varied for students studying different subjects with, in particular, ‘the content of myuniversity course’ being much less important for Architecture, Building and Planning students(32%) than for others.
Replies from taught postgraduates were very similar with ‘my personal interests/values’ (70%)and ‘the content of my university course’ (59%) being the most commonly mentioned sources ofinfluence (see Appendix Table B3.34). For those postgraduates who had undertaken somedegree-related work experience, ‘my work experience employer’ (43%) was the third mostfrequently mentioned ahead of ‘my tutors/faculty staff’ (38%).

STEM Graduates in Non-STEM Jobs
83
3.6.1 Impact of changing career plans
Final year STEM students who had changed their career plans, either completely (43%) or tosome extent (49%), were less likely than those students who had not changed their careerplans (63%) to say that they definitely wanted to pursue a career in an occupation related totheir degree, that is to say a STEM career of some kind. More significantly, 10% of those whohad completely changed their plans definitely did not want to pursue a career in a degree-related occupation. They were also more likely to have had no idea at all about possible careerswhen they first went to university (29% compared to 18% of other students).
However, these students were now more likely to have a definite career in mind than those whohad only changed their career plans to some extent (36% compared to 22%), although still lesslikely to have a definite career in mind than those who had not changed their plans (47%). Thismeant they were also less likely than other students to have only a vague idea or no idea at allabout possible careers in their final year (19% compared to 28%).
Table 3.12 Expected career sector and function for those with career plans, by extent towhich they had changed their plans (final year UK undergraduates), as percentages
Sector
Cha
nge
dpl
ans
com
plet
ely
Cha
nge
dp
lan
sto
som
eex
ten
t
Not
cha
nged
plan
s
All
with
pla
ns
STEM Specialist 37 49 63 51
STEM Generalist 16 8 14 11
Non-STEM/Other 11 5 7 7
STEM Specialist/Generalist 10 12 7 10
Mixed sectors 26 26 9 21
Function
STEM Core 37 45 57 47
STEM related 17 9 13 12
Other/unrelated 13 10 15 12
STEM Core/related 10 11 5 9
Mixed functions 21 23 9 18
Don't know 2 2 1 2
Number of cases 397 1121 669 2187

STEM Graduates in Non-STEM Jobs
84
Two conclusions are that:
1. The more that plans had changed, the less likely students were to report a desire towork exclusively in a STEM Specialist sector or Core function. Students who hadchanged plans completely were also somewhat more likely to want to work in non-STEM sectors.
2. The greatest difference was that more of those who had changed their plans eithercompletely or to some extent expressed an interest in working in occupations in bothSTEM and non-STEM sectors and functions (see Table 3.12) which might suggest thatmany of these students were still at quite an exploratory stage in relation to their careerthinking.
3.7 Impact of career motivation
Approximately half (49%) of UK final year STEM students said that one reason they chose theiruniversity course was that they wanted to follow a career in this field, although the proportiondid vary by degree subject (see earlier Table 3.8). But do these more career-motivated STEMstudents behave differently from those who seemed less career-motivated (i.e. those who didnot select their degree course for a career-related reason)?
Key findings from this analysis are:
1. More of the career-motivated students had a definite career in mind when they firstwent to university than those who were not career-motivated (28% compared to 11%)and far fewer of them had no idea at all (8% compared to 30%).
2. At the time of the survey, 37% of those who were career-motivated when choosingtheir university course now had a definite career in mind compared to 27% of thosewho had not been career-motivated, so this difference narrows over time but stillpersists. Equally, less than one in five (18%) of career-motivated students still had onlya vague idea of possible careers or no idea at all at the time of the survey which wasmuch lower than the proportion (34%) of the remaining students.
3. More significantly, roughly two-thirds (68%) of these career-motivated students saidthat they now definitely wanted to pursue a career in an occupation directly related totheir degree compared to just 37% of remaining students. Only 5% of them might not,or definitely did not, want to pursue degree-related careers, compared with 18% of theother (i.e. non-career motivated) students.
4. Career-motivated students were also more likely to have undertaken some degree-related work experience than other students (55% compared to 43%), and were lesslikely to have changed their degree subject (14% compared to 19%).
5. Career-motivated students were less likely to have changed their career plans (65%compared to 73%) and, in particular, less likely to have changed their career planscompletely (13% compared to 20%). They were also more likely to say that they would
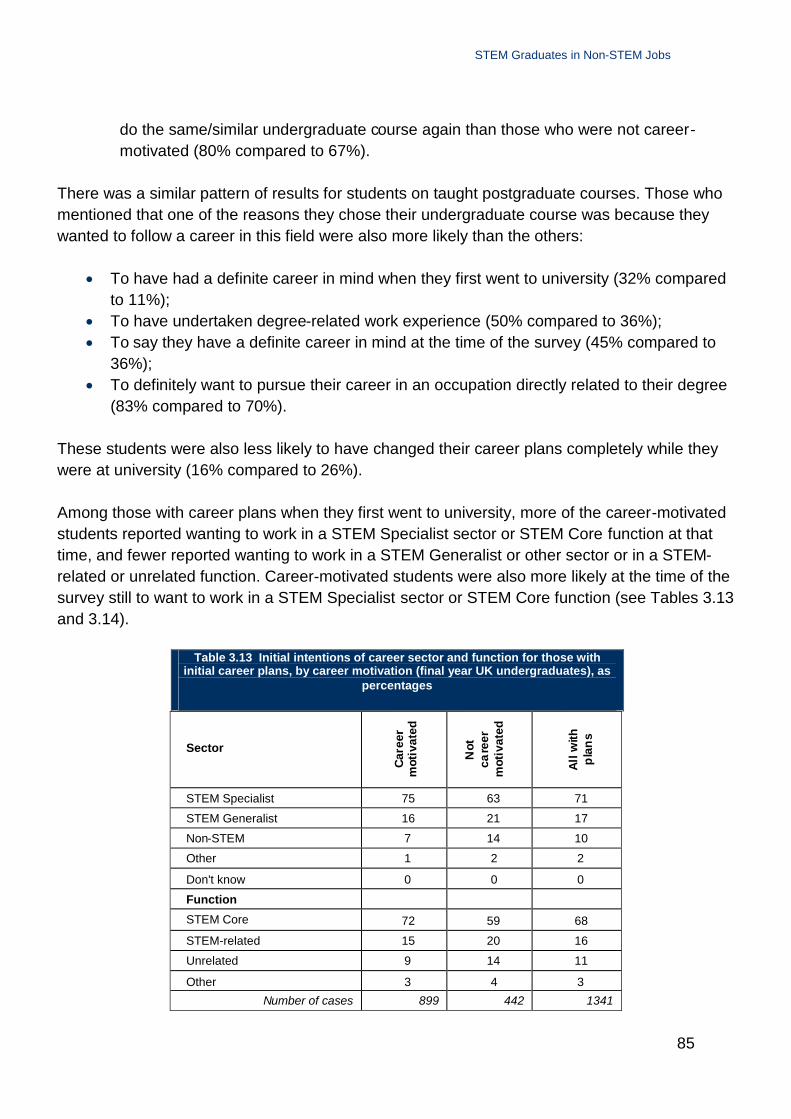
STEM Graduates in Non-STEM Jobs
85
do the same/similar undergraduate course again than those who were not career-motivated (80% compared to 67%).
There was a similar pattern of results for students on taught postgraduate courses. Those whomentioned that one of the reasons they chose their undergraduate course was because theywanted to follow a career in this field were also more likely than the others:
To have had a definite career in mind when they first went to university (32% comparedto 11%);
To have undertaken degree-related work experience (50% compared to 36%); To say they have a definite career in mind at the time of the survey (45% compared to
36%); To definitely want to pursue their career in an occupation directly related to their degree
(83% compared to 70%).
These students were also less likely to have changed their career plans completely while theywere at university (16% compared to 26%).
Among those with career plans when they first went to university, more of the career-motivatedstudents reported wanting to work in a STEM Specialist sector or STEM Core function at thattime, and fewer reported wanting to work in a STEM Generalist or other sector or in a STEM-related or unrelated function. Career-motivated students were also more likely at the time of thesurvey still to want to work in a STEM Specialist sector or STEM Core function (see Tables 3.13and 3.14).
Table 3.13 Initial intentions of career sector and function for those withinitial career plans, by career motivation (final year UK undergraduates), as
percentages
Sector
Car
eer
mot
ivat
ed
Not
care
erm
otiv
ated
All
with
pla
ns
STEM Specialist 75 63 71
STEM Generalist 16 21 17
Non-STEM 7 14 10
Other 1 2 2
Don't know 0 0 0
Function
STEM Core 72 59 68
STEM-related 15 20 16
Unrelated 9 14 11
Other 3 4 3
Number of cases 899 442 1341

STEM Graduates in Non-STEM Jobs
86
Table 3.14 Current career sector and function for those with career plans, bywhether career motivated or not (final year UK undergraduates), as
percentages
Sector
Car
eer
mo
tivat
ed
Not
care
erm
otiv
ated
All
with
plan
s
STEM Specialist 57 44 51
STEM Generalist 9 14 11
Non-STEM/Other 5 9 7
STEM Specialist/Generalist 9 10 10
Mixed sectors 19 23 21
Don't know 0 0 0
Function
STEM Core 52 41 47
STEM related 10 14 12
Other/unrelated 11 13 12
STEM Core/related 8 10 9
Mixed functions 17 20 18
Don't know 2 2 2
Number of cases 1194 993 2187
3.8 Work experience
Approximately half (49%) of UK final year undergraduates, but slightly fewer UK taughtpostgraduates (44%), had undertaken some sort of degree-related work experience as anundergraduate. Among UK final year students, less than 40% of students in Geography (28%),Mathematical Sciences (30%), Physics (36%) or Other Physical Sciences (38%) hadundertaken any degree-related work experience, compared with over 60% in Architecture,Building and Planning (62%), Sports Science (63%) and Engineering and Technology (65%)(see Figure 3.11).

STEM Graduates in Non-STEM Jobs
87
There was a broadly similar trend among taught postgraduates (the few exceptions tend to belinked to relatively small sample sizes for taught postgraduates, i.e. less than 50 respondents ina subject area). A similar proportion (52%) of the UK final year PhD students had undertakensome degree-related work experience as an undergraduate, but only a quarter had undertakenany work experience related to their postgraduate studies/research.
Likelihood of having undertaken some degree-related work experience was correlated withintention to pursue a degree-related career (see Figure 3.12). 60% of those who definitely wantto pursue a degree-related career have undertaken some degree-related work experiencecompared with just 30% of those who might not or definitely do not intend to.
Figure 3.11 Percentage of UK final year and taught postgraduates with degree-related work experience,by undergraduate subject
0 10 20 30 40 50 60 70
Geography
Mathematical Sciences
Physics
Other Physical Sciences
Forensic Science/Archaeology
Biological Sciences
Psychology
Subjects allied to Medicine
Computer Science
Chemistry
Architecture, Building and Planning
Sports Science
Engineering and Technology
Final Year Taught postgraduate

STEM Graduates in Non-STEM Jobs
88
Figure 3.12: Percentage of UK final year students who have undertaken degree-related work experienceby intention to pursue degree-related career
0 10 20 30 40 50 60 70
Do not know
Definitely do not want
Don't think want
Might want
Definitely want

STEM Graduates in Non-STEM Jobs
89
Figure 3.13: Percentage of UK final year students with and without work experience who definitely wantto pursue a career in an occupation related to their degree
0 10 20 30 40 50 60 70 80 90 100
All UK Final Year
Mathematical Sciences
Forensic Science/Archaeology
Chemistry
Sports Science
Geography
Psychology
Biological Sciences
Physics
Architecture, Building andPlanning
Computer Science
Engineering and Technology
Subjects allied to Medicine
Other Physical Sciences
Work experience No work experience
Final year students with work experience were also more likely to say that they definitely wantedto pursue a career in an occupation directly related to their degree when they graduate thanthose without work experience (see Figure 3.13). The difference was smallest in MathematicalSciences (9%) and Architecture, Building and Planning (10%) and greatest in Subjects allied toMedicine (38%).
Just over a third (37%) described the skills and experience they gained from their workexperience as very helpful on their undergraduate course and a further 37% as quite helpful.Far more (61%) described the skills and experience they gained from their work experience asvery helpful to their career and work choices and a further 29% as quite helpful for this. Once

STEM Graduates in Non-STEM Jobs
90
again these figures mask substantial variation between the experiences of students studyingdifferent subjects. For example, work experience appeared to be particularly useful for thecourses of students in Forensic Science/Archaeology (69%) and Architecture, Building andPlanning (66%) but, less useful to Psychology students (16%) and Mathematical Sciencesstudents (17%) (see Appendix Figure B3.1).
There was less variation in the percentage of final year students who rated the skills andexperience gained on their work experience as very helpful for their career and work choices(see Appendix Figure B3.2) with the proportion describing it as very helpful ranging from justunder half of Geography students (48%) and Mathematical Science students (49%) to 68% ofstudents in Subjects allied to Medicine.
When asked about the impact of their work experience, about half (51%) of the final year STEMstudents with such experience reported that they had decided that this was the sort of work theywanted to do. Other ways in which work experience had an impact included: being offered a jobafter they graduate by their work experience employer (17%) and not wanting to work for theirwork experience employer (18%); being put off seeking a career in the area by the kind of work(13%) or for other reasons (8%); and realising that they would need further training/apostgraduate qualification to improve their chances of getting work in this field (17%).
However, the impact of work experience varied subtly by discipline and overall figures disguiseconsiderable variation in their experiences (see Table 3.15). For example, a third of Engineeringand Technology students and almost a quarter (24%) of both Computer Science andArchitecture, Building and Planning students reported that they had been offered a job after theygraduate by their work experience employer whereas the proportion in some other subjects wasvery low. On the other hand, Mathematicians, Engineering and Technology students, andBiological Science students were the three groups most likely to report being put off seeking acareer because of the nature of the work.
The other major difference was in those subjects in which significant numbers of studentsrealised, as a result of their work experience, that they needed a postgraduatequalification/further training to get work and those that did not. In particular, around a quarter ofall the science students had realised they needed a postgraduate qualification/further training. Itis not surprising, therefore, that more students in these disciplines were considering furtherstudy (see Section 3.3.1).

STEM Graduates in Non-STEM Jobs
91
Table 3.15 Most frequently mentioned impacts of work experience on career plans, by subject of study(final year UK undergraduates with degree-related work experience), expressed as percentages
Subject group Dec
ided
this
isor
tofw
ork
wan
tto
do
Dec
ided
did
not
wan
tto
wor
kfo
rem
ploy
er
Was
offe
red
job
afte
rIgr
adua
te
Rea
lised
need
edpo
stgr
adua
tequ
alifi
catio
n/fu
rthe
rtra
inin
g
No
effe
cton
care
erpl
ans
Put
offb
ecau
seof
the
kind
ofw
ork
Put
offf
orot
her
reas
ons
Oth
erre
ason
Num
bero
fcas
es
Subjects allied toMedicine 51 9 18 26 13 13 7 0 76
BiologicalSciences 53 13 7 28 17 16 10 6 176
Sports Science* 63 10 3 25 28 5 3 3 40
Psychology 50 9 2 29 18 11 10 5 147
Chemistry 53 18 8 25 10 13 10 9 127
Physics 48 20 11 27 21 14 10 0 84
Other PhysicalSciences 52 17 8 21 22 6 8 3 63
MathematicalSciences 58 26 14 14 10 17 9 7 69
Computer Science 51 22 24 7 17 12 6 7 162
Engineering andTechnology 49 25 33 4 14 16 7 6 377
Arch., Building andPlanning* 48 10 24 0 24 3 7 3 29
Geography 56 15 3 22 18 5 10 3 73
Forensic Science/Archaeology* 53 13 13 25 25 13 3 3 32
All who hadchanged plans 51 18 17 17 16 13 8 5
1455
* Note small sample size (less than 50) in these subjects.
The pattern of replies from UK taught postgraduates was broadly similar with nearly half (48%)of taught postgraduates deciding that this is the sort of work they wanted to do but almost aquarter (22%) realising that they needed a postgraduate qualification/further training to get workin this field. Just over half (53%) the PhD students said undergraduate work experience wasvery helpful in deciding to undertake postgraduate study/research.
Among the quarter of final year PhD students who had undertaken work experience related totheir research (i.e. while postgraduates), just under half (47%) felt that the skills and experiencegained had been very helpful for their postgraduate study and 61% that it had been very helpfulfor their career and work choices.

STEM Graduates in Non-STEM Jobs
92
3.8.1 Link to work experience
As we have seen, final year students with degree-related work experience were more likely thanthose without it to want definitely to pursue a career in a STEM degree-related occupation, buthow does this interact with career motivation? In particular, is the impact of work experience justa reflection of differences in initial motivation or does it also motivate students towards stayingin a STEM degree-related area of work? Figure 3.14 shows that only a quarter of final yearstudents who were not career-motivated and without degree-related work experience definitelywant to pursue a career in a degree-related occupation. Career-motivated students (as definedabove) both with and without work experience were more likely to definitely want to pursue acareer in STEM degree-related occupation than students with work experience alone. However,having work experience increased the likelihood of definitely wanting to work in degree-relatedoccupations among both groups.
Figure 3.14 Percentage of UK final year students who definitely want to pursue a career in an occupationrelated to their degree
0 10 20 30 40 50 60 70 80
All final year
No work experience
Work experience alone
Career motivated/noexperience
Career motivated/workexperience
It appears, therefore, that undertaking STEM degree-related work experience increases thelikelihood of both career-motivated and non career-motivated students pursuing a degree-related occupation, but with a greater impact on those not initially career motivated whenchoosing their degree. This may be because it was the first time that they had been exposed tothe sort of work they could do once they completed their degree and, by implication, that it gavethem the opportunity to see how interesting work related to their degree would be.

STEM Graduates in Non-STEM Jobs
93
Figure 3.15 Impact of work experience on final year students’ decision to undertake degree-related work
Undertakenworkexperience
Yes49%
No51%
Definitelywant degreerelated work
41%
64%
Decided this issort of workwant to do
Yes 51%
No 49%
Definitely wantdegreerelated work
Put offor not
Definitelywant degreerelated work
73%
54%
No 64%
Yes 36%
64%
38%
Figure 3.15 shows how work experience is linked to intention to definitely want to work in adegree-related occupation. It shows that:
64% of those who have undertaken work experience definitely want to work in a degree-related occupation compared to just 41% without degree-related work experience
Nearly three-quarters (73%) of those with work experience who decided that this wasthe sort of work they wanted to do reported that they definitely wanted to pursue acareer in an occupation directly related to their degree compared to 54% of those whodid not decide this was the sort of work they wanted to do
Among those (49%) who did not decide this is the sort of work they wanted to do, 36%were put off seeking a career in this field either because of the kind of work or for otherreasons.
Of these students only 38% definitely wanted to work in a degree-related occupationcompared to nearly two-thirds (64%) of those not put off seeking a career in this field.
Work experience also had other effects on students. When we compared those who decidedthis is the sort of work they wanted to do with those who did not, and look at how their workexperience influenced them in other ways, we found:
No difference in the proportion who reported they were offered a job after they graduate,but far fewer of those who wanted to do this type of work had decided they did not wantto work for their work experience employer (9% compared to 28%);

STEM Graduates in Non-STEM Jobs
94
Almost a third (31%) of those who had not decided this is the sort of work they wanted todo reported that their work experience had no effect on their career plans, compared toonly 2% of those who wanted to do this sort of work.
In certain subjects (Subjects allied to Medicine, Sports Science, Chemistry, Geographyand Forensic Science/Archaeology) but not others, students who wanted to do this sortof work were much more likely to have realised they needed a postgraduatequalification/ further training to get work.
Work experience and career motivation were also linked to saying that respondents would dothe same/similar undergraduate course again, although the differences were not so marked asfor degree-related career intention.
3.9 Career advice and guidance
What impact does career advice and guidance have on these students’ career choices andwere there times when these students would have benefited from additional career support? Amajority (60%) of final year students had used their university careers service with 39% havingused it so far in their final year and 36% in earlier years, although the nature of that use was notspecified. Roughly one in seven (14%) had used the careers service in both their final year andearlier. Just over a quarter (27%) reported that they found the careers service very helpful andover half (54%) had found it quite helpful with less than one in five (19%) finding it not veryhelpful or not at all helpful.
Nevertheless, 60% of final year students (and similar proportions of taught postgraduates andfinal year PhD students) reported that they would have benefited from additional career support:nearly half (48%) before they went to university and 42% while they were at university. Two-thirdsof Architecture, Building and Planning students and more than half the students in biologically-related subjects (Subjects allied to Medicine, Biological Sciences, Sports Science andPsychology) said they would have benefited from more career support before they went touniversity, while students in the Physical sciences and Mathematics were less likely to feel theywould have benefited from additional support at that time (see Figure 3.16).
In contrast, most taught postgraduates (58%) had never used their university careers serviceeither as a postgraduate or as an undergraduate and those that had used their university careerservices as undergraduates had found it slightly less helpful than the current final year students.The few who had used their university careers service as a postgraduate were slightly morepositive with one in five rating it very helpful and over half (58%) quite helpful.

STEM Graduates in Non-STEM Jobs
95
Figure 3.16 Percentage who believed they would have benefited from additional career support (finalyear UK undergraduates)
0 10 20 30 40 50 60 70 80
Mathematical Sciences
Physics
Other Physical Sciences
Chemistry
Computer Science
Forensic Science/ Archaeology
Engineering and Technology
Sports Science
Biological Sciences
Subjects allied to Medicine
Psychology
Geography
Architecture, Building and Planning
All final years
Before university At university
The consistent overall trend is that many STEM students do not use their university careersservice, although use varies by subject with students in the most narrowly vocational subjectsappearing to be the least likely to use it but also to be the ones who were most likely to thinkthat they would have benefited from additional career support before they went to university.Postgraduates’ use of the career service while they were undergraduates was very similar tothat of the final year students but PhD students seemed less satisfied with their experience ofthe career service both as undergraduates and postgraduates.
Most of the survey respondents believed they would have benefited from additional careersupport at some point. Around a half would have benefited from more support before they wentto university and slightly under half while they were undergraduate students.

STEM Graduates in Non-STEM Jobs
96
3.9.1 Impact of use of the careers service
Final year STEM students were just as likely to definitely want to pursue a degree-related careerregardless of whether they had used their university careers service or not. Students who hadnever used their university careers service were slightly more likely to have a definite career inmind (36%) than others. On the other hand, more of these students also had only a vague or noidea at all about possible careers (30%) than those students who had used their careersservice. In contrast, more of those who had used their university careers service wereconsidering several career alternatives. Those who had used it the most (i.e. in both their finalyear and earlier) were the least likely to have only a vague or no idea about possible careers(18%), perhaps unsurprisingly.
There is, therefore, evidence that using their university careers service had helped somestudents develop their career plans, but not that it promoted STEM careers over others; after all,careers advice should be impartial.
3.9.2 Consequences of a need for additional career support
Reporting that you would have benefited from additional career support at some point seems tohave had a number of impacts on career and educational choices:
1. 30% of STEM final year students reported that they would have benefited from morecareer support both before and while they were at university and these students wereslightly less likely to report that they definitely wanted to pursue a career in a degree-related occupation (48%) than other students (54%)
2. Final year students who would have benefited from additional career support (either onlyat university, or both before and at university) were also less likely to have a definitecareer in mind in their final year (30% and 21% respectively) compared to 38% of otherfinal year students and more likely to have only a vague or no idea at all about possiblecareers (29% and 33% respectively).
3. Although only students who had a definite career in mind or were considering severalalternatives were asked for their current career plans, among these students, those whofelt that they would have benefited from additional career support both before and whilethey were at university were less likely to be considering working in a STEM Specialistsector or STEM Core function and more likely to be considering employment in bothSTEM and non-STEM sectors and in STEM and unrelated functions. As a higherproportion of these students had only vague or no idea at all about possible careers, thisfinding quite probably underestimates the impact of lack of career support on STEMcareer intentions.
4. Lack of career support before students went to university was also associated with beingless likely to do the same/similar course again (67%), being more likely to do a different

STEM Graduates in Non-STEM Jobs
97
course (30%), and to delay or not go to university (12%).5. While it is hard, if not impossible, to quantify the impact that additional career support
would have had on these students, it seems likely that at least some of those who saidthat they would have done a different undergraduate course would have done so. Moreof them might have formulated firmer career intentions by this time in their final year,which could result in a somewhat higher proportion having the intention to work in aSTEM career.
The research evidence suggests that many students miss out on the career support they needat key stages but also that some of the career support available is not as effective as it shouldbe. Effective career support post-16 should enable students to make the link better betweenuniversity courses and career opportunities, which would assist students to make more informedchoices about their future careers. However, some students are not ready to make careerdecisions at that stage; for them, continuation within a broader post-16 curriculum might enablethem to keep their options open for longer.
3.10 Observations and conclusions
3.10.1 Overall observations
The majority of STEM students at all levels definitely wanted to pursue a STEM degree-related career. Higher proportions of taught postgraduates (77%) and students on M-level courses (60%) definitely intended to pursue degree-related work.
Final year undergraduates and taught postgraduates who definitely intended to enterdegree-related work were mainly motivated by expecting to ‘find the work interesting andexciting’ and to ‘want the opportunity to put their learning into practice’. Most had‘enjoyed their degree course’ and about half had ‘always wanted to work in this field’.Potential earnings (pay) seemed only to be factor motivating a minority.
For the minority who might not or definitely did not want to pursue a STEM career,‘becoming more interested in another field’ was the main reason given. A significantproportion of these final year undergraduates had not enjoyed their undergraduatedegree course. Here too, only a minority (29%) of these respondents mentioned pay asa motivating factor to pursue a non-STEM career, while small but significant numbers insome subjects cited location and job availability as reasons.
Career plans became clearer while students were at university. Most students only hada vague idea or no idea at all of possible careers when they first came to university butby the time of the survey, in their final year, most had either a definite career in mind orwere at least considering several alternatives. However, a substantial minority (over aquarter) were still quite uncertain in their final year.
Among those with careers in mind, about half were considering a career in a STEMSpecialist sector and just under half in a STEM Core function. More of the students in

STEM Graduates in Non-STEM Jobs
98
the more narrowly vocational subjects were considering careers in STEM Specialistsectors and STEM Core functions than of the other subjects.
More postgraduates than undergraduates wanted to work in STEM sectors and jobfunctions; further study (either a taught course or doctoral research) was seen as amajor route to a STEM career by many students in certain subject disciplines. Somesubjects were also much more explicitly seen to lead directly to particular careers thanothers.
There were four main career tracks for STEM final year students after graduation:i. to obtain employment related to their longer-term career plan (for 41%);ii. to enrol on a full-time higher degree course (26%);iii. to travel or take time out (12%); oriv. to obtain other long-term or temporary employment (12%).
However, there was a divide between those subjects where the majority of students expected toobtain long-term, career-related employment after graduation and others where more studentsexpected to enrol on a full-time higher degree course.
At the time of the survey (half way through the final year), the vast majority (80%) of thefinal year students whose main aim for next year was to obtain employment related totheir longer-term career plan had already started looking for work and over half (62%)had already applied for jobs.
Most students changed their career plans while they were at university, with more thantwo-thirds (69%) of final year undergraduates reporting that they had changed theircareer plans either completely (17%) or to some extent (52%), while a fifth (21%) oftaught postgraduates had changed their career plans completely.
Personal interest and enjoyment were most frequently mentioned as important reasonsfor students’ original choice of a STEM degree course but career-related reasons werealso important for about half the students. Fewer than one in six said their particularcourse was a required qualification for their chosen career.
About one in six final year undergraduates had changed their undergraduate degreecourse but roughly two-thirds of changes were simply to a different course in the samedepartment. However, far more (around a quarter) would choose a differentundergraduate course if they had the opportunity to start their higher education again.
The majority of students with a career plan when they entered university now expectedto work in STEM employment. There were clear subject differences with students’ insome subjects much more likely to have had clear plans at that stage. Fewer of thosewho had changed their career plans, either completely or to some extent, definitelywanted to pursue a degree-related career.
Personal interest/values and the content of their university course were the reasonsmost commonly mentioned for changing career plans, but for students who hadundertaken degree-related work experience; their work experience employer was one ofthe influences most frequently mentioned.

STEM Graduates in Non-STEM Jobs
99
Being career-motivated (i.e. those for whom wanting a career in this field was animportant factor in their choice of degree subject) and undertaking degree-related workexperience were both strongly related to an intention to seek degree-relatedemployment. However, undertaking STEM degree-related work experience had agreater impact on intention to pursue a degree-related occupation for those not initiallycareer motivated when choosing their degree.
Many STEM students did not use their university careers service, especially thosestudying the more vocationally focused subjects – although many of them thought theywould have benefited from additional support before university. However, most felt theywould have benefited from additional career support at some point, with around halfreporting they would have benefited from more support before they went to universityand slightly under half while they were undergraduate students.
3.10.2 Conclusions
Although most STEM final year students claimed that they definitely or might want to pursue acareer in a degree-related occupation, about a quarter still have no or only vague ideas aboutpossible careers in their final year. These students were more likely to be planning to travel,take time out, or to seek other long-term or temporary employment, presumably therebydelaying their career decisions.
It is possible that some of the trajectories pursued by students make it less likely they willpursue a STEM career. This may simply reflect the fact that a substantial number have not yetformulated career plans. Although they may not have completely rejected the idea of a STEMcareer at this stage, they may be considering non-STEM options too. Others may simply want tocomplete their degree and then take stock.
Few appeared to be strongly motivated by pay. Although some (about a quarter) mentionedbeing better paid as a reason to pursue degree-related work, a similar proportion of those notseeking to pursue degree-related employment reckoned they would be better paid in non-degree-related work. Pay was slightly more often mentioned by male students than femaleones, and by students in some subjects, but appeared to work as a ‘push’ and a ‘pull’ factor:that is to say some students mentioned better pay as a reason for intending to work in STEMand others as a reason for not doing so.
However, what was unambiguous was that interest in the work was the overwhelmingmotivating factor influencing the students’ intentions, especially to work in a degree-relatedoccupation but also in deciding not to do so. This might suggest that STEM students are happyto adopt a ‘satisficing’ approach as far as pay is concerned, but a maximising one for intrinsicjob interest and potential job satisfaction.

STEM Graduates in Non-STEM Jobs
100
Their different career aims indicate that by their final year many STEM students understandsome features of the graduate labour market. In particular, there seemed to be a goodunderstanding of whether they would need a higher degree or further qualification to pursueparticular occupations, some within STEM sectors. Such lessons could have been learned whileundertaking degree-related work experience, or in other ways (i.e. from the careers service,graduates, academic staff). The importance of postgraduate qualifications in some subjectareas also highlights the benefit of including postgraduates in the survey, and suggests thatanalysis purely of employment destinations immediately after graduation will only give a partialpicture of long-term STEM career intentions.
Some STEM students were put off working in a degree-related area either by the content oftheir degree course or by their work experience, but far more realised from these experiencesthat this is what interests them and that they would enjoy working in a degree-related area.Many of these STEM students had few career plans when they first went to university and littlecareer experience, and it is, perhaps, not surprising that they ‘grow up’ to some extent while atuniversity. Although some may have come to realise that they were not interested in a careerrelating to the degree they have been studying, many more recognise that if their degree courseinterests them, then degree-related work may also do so. Nonetheless, there is evidence thatmore of the career-motivated students at entry to university are likely to progress into STEMcareers, and the more “decided” they are, in terms of career thinking at any point in time, themore likely they are to pursue a STEM career. The impact of work experience tends to reinforcethis trend.
However, other students will realise that they have skills that are attractive to, and in demandfrom, a wide range of employers in different employment sectors, and so can competesuccessfully in the wider graduate labour market. Some have this understanding from an earlystage; of those citing career-related reasons to choose their degree, as many did so to keeptheir career options open as to accelerate their path to a particular career.
Additional career support at certain stages might have influenced some students’ career plans.Some would have studied different subjects initially; for some this would have been a course inmore strongly vocational subject and might have eased their transition into a STEM career. Somepostgraduates on taught courses are undertaking a course in a new subject in order to changecareer direction. The fact that a quarter would choose a different undergraduate course if theystarted their university education again indicates that some feel they made the wrong initialchoice, although for others this will reflect more on their interests changing while they were atuniversity.
There is little evidence that significant numbers of students are being ‘put off’ STEM careers whilethey were at university, at least by the time of survey. At the outset, most of those with careerplans tend to be STEM focused and, while most change their plans to some extent and some whodo change plans will move away from STEM, more broaden the range of options they are

STEM Graduates in Non-STEM Jobs
101
considering without necessarily excluding a career in a STEM field. The bigger challenge may bewhether they can find jobs in their chosen career; that is to say whether they are actually recruitedby STEM employers. This is a major subject treated in the next chapter.

STEM Graduates in Non-STEM Jobs
102
4. STEM graduate career decisionsand outcomesIn this chapter, results are reported from the telephone survey and in-depth interviews withworking STEM graduates working in STEM and non-STEM employment and occupations.Details of the methodology and overall parameters of the respondents of sample are given inAppendix A. The sample was not intended to be quantitatively representative, but of sufficientsize and diversity to obtain information and understanding of a range of individuals’experiences, providing coverage of respondents with different characteristics such as degreesubject and gender, as well as occupation and employment sector. Some graduates with non-STEM degrees were included for comparative purposes, selected with broadly similaremployment to many of the STEM graduates.
Numerical figures and percentages are reported for certain closed questions within the 485telephone interviews. However, caution is needed as their statistical significance is limited dueto the deliberately purposive – rather than representative – nature of the sample, which was nota complete cross-section of all types of STEM graduate in employment (nor in non-STEMemployment). As discussed in Appendix A, the way graduates were recruited for interviewmeant that many in the sample were rather ‘strong’ graduates in ‘good’ jobs, and the samplemay not have represented the full range of employment outcomes. Deeper investigation wasprovided through the 70 face-to-face interviews, but information from both interview methods isprincipally intended to provide corroborative support for the student survey findings as well asinsights into experiences after university.
The chapter focuses first on the graduates’ current employment – and reasons they entered it –and how it relates to their career thinking and decision-making at graduation, then considershow their career thinking had developed up to that point and what had influenced it. Thereafterwe highlight the skills the graduates actually use in their current job, as well as theirexpectations in relation to their future careers. These reflections, made with hindsight, on theevolution of career thinking prior to and during higher education offer, an interesting comparisonwith the data obtained from existing students reported in Chapter 3.
Scattered through the chapter are a series of case studies of STEM graduates now working inSTEM Generalist or non-STEM employment, drawn from the in-depth interviews. These areincluded for illustrative purposes, and are not intended to be representative of the overallsample, but aspects of their stories illuminate the survey findings. However, they alsodemonstrate the individuality of graduates’ career decision-making and the complexity ofindividuals’ actions and subsequent pathways.

STEM Graduates in Non-STEM Jobs
103
4.1 Current employment
The employment sectors within which the graduates now worked, and their occupationalfunctions, are detailed in Appendix A (Tables A.18 and A.19). Due to unavoidable limitations inthe recruitment strategies (see Appendix A, section A.3.2), a relatively high proportion of thegraduates interviewed were working for larger and ‘high quality’ employers. Nonetheless thegraduates were widely spread across almost the entire the economic spectrum, with examplesin all 9 segments of the matrix formed using our employment and occupational classification(see Figure A.1 in Appendix A).
The higher education backgrounds of the graduates are summarised in Table A.23 (in AppendixA), which shows that the sample was dominated by graduates with ‘good’ (1st or 2.1) degrees,many from the Russell Group and 1994 Group universities on which larger graduate employerstend to focus their recruitment. The class of undergraduate degree obtained is shown in relationto graduates’ current employment circumstances in Table 4.1. For these graduates, the patternwas relatively similar between sectors, although with a somewhat higher proportion of 1st and2.1 degrees, and lower proportion of lower degree classes, in STEM Generalist sectors andSTEM-related occupations, than either STEM Specialist or non-STEM work. Notably fewer 1st
class degrees were held by those working in non-STEM sectors or jobs, but the proportion withlower degree classes was similar in both specialised STEM and non-STEM work.
Table 4.1 Degree classes obtained by graduates with different employmentcircumstances, shown as percentages (all STEM graduates interviewed by
telephone)
Sector 1st
2:1
Oth
er
All
ST
EM
Nu
mb
ero
fca
ses
STEM Specialist 38 47 15 36 150
STEM Generalist 42 50 8 34 138
Non-STEM 25 59 16 30 104
Function
STEM Core 34 46 17 41 170
STEM-related 38 53 7 37 148
Unrelated 30 52 14 22 74
All 36 51 13 100 392
Count 141 200 51 392
Given the early career stage of the graduates interviewed, most were either in their first ‘serious’job after graduation or a role for the same employer that was a direct progression from it.However, a minority had made several job and employer changes since graduation and it was

STEM Graduates in Non-STEM Jobs
104
felt important, given the focus of the study on why STEM graduates are (now) working in non-STEM jobs, not to restrict the research entirely to those in their first graduate jobs. For thisreason, we obtained information about ‘current’ employment, which for some was their firstgraduate job and for others a subsequent post, and for the latter we sought to obtain informationabout their earlier graduate jobs and choices as well. Information and understanding from thosewhose current job differed significantly from their first graduate job – and the reasons for thechange – are given in a separate section.
4.1.1 Reasons for taking first graduate job
When asked why they had decided to take their current job, half of all STEM graduatesinterviewed reported that they had been attracted by the prospect of interesting work and forover a third (37%) it had been the type of work they were seeking (i.e. it fitted their career plan).Lower, but significant, proportions cited salary and benefits (21%), the employer’s reputation(16%) or the location of the job (15%). These are summarised in Table 4.2. ‘Interesting work’was the most frequently cited reason, and the relative ordering of reasons was roughlymaintained, irrespective of degree subject.
Table 4.2 Main reasons for taking current job by undergraduate subject (graduates interviewed by telephone).For full data see Appendix B Table B4.1
Bio
logy
and
rela
ted
Che
mis
try
Phy
sics
Mat
hs
Com
put
erS
cien
ce
Eng
./Tec
h.
All
STE
M
Non
-S
TEM
Type of workwanted 38 39 41 24 50 35 37 31
Salary/benefits 17 22 18 15 46 25 21 14
Locality/region 13 10 16 17 21 21 15 6
Interesting work 48 56 54 41 71 52 50 51
Needed a job 15 22 18 7 0 6 11 8
Graduate scheme 14 10 9 5 38 10 13 16
Companyreputation 13 15 23 17 8 12 16 24
Not answered 1 0 2 2 0 3 2 0
Count 86 41 56 41 24 99 402 80
When STEM graduates’ responses were analysed by current employment, there weresignificant differences. ‘Interesting work’ and ‘type of work wanted’ were cited by higherproportions of those working for STEM Specialist employers, and also non-STEM employers,than those working for STEM Generalist employers. Salary and benefits, and also location,were important to more graduates in STEM Specialist employers, than others (Figure 4.1). Asimilar pattern was seen according to how STEM-focused the job role was.

STEM Graduates in Non-STEM Jobs
105
Figure 4.1 Main reasons for choosing current job, by employment sector (STEM graduates interviewed bytelephone). For full data see Appendix B Table B4.2
0 10 20 30 40 50 60 70
Career prospects
Opp to gain qualifications
Locality/region
Company reputation
Salary/benefits
Type of work wanted
Interesting work
%
Non-STEM STEM Generalist STEM Specialist All STEM graduates
On the other hand, a higher proportion of those now in STEM Generalist or related employmentrated interest in or type of work markedly lower, as reasons, but rated issues like employerreputation much higher, or the opportunity to obtain professional qualifications. Lesserproportions also mentioned the training and development environment, potential variety of workand long-term career prospects. Graduate scheme quality was mentioned by some in non-STEM sectors. These trends partly reflect the significant number of STEM graduatesinterviewed who were working for large finance and professional services firms (hence the issueof qualifications) and also in the Civil Service ‘Fast Stream’.
None of the graduates reported that they had applied for their current job as a result of a failureto secure degree-related work, although in their additional comments some reported earlierdirectional changes while at university – particularly several who originally aspired to a career inmedicine but obtained insufficient grades and had changed direction as a result.
A somewhat higher proportion of male STEM graduates, than females, cited salary and benefitsas an important reason for taking their job, and also the prospect of interesting work. Otherwisethere was relatively little difference in the reasons cited by males and females or their relativeranking; see Appendix B Table B4.3. Analysed by HE institution type, the only significantdifference appeared to be that a higher proportion (over 50%) of those at “other” institutionsreporting that the type of work was important (i.e. fitted with pre-existing career plans) than ofRussell or 1994 Group graduates (of whom around a third reported this as important). None of

STEM Graduates in Non-STEM Jobs
106
the “other” graduates cited reputation of their employer as important. These variations did notappear to be artefacts of differing sub-populations in the sample, i.e. mostly males inengineering.
Amongst the more detailed individual reasons made, in expansion of “other” categoryresponses, were enjoyment of an internship with the employer, appreciation of a good graduateor training scheme or development environment, and other issues relating to the specificemployer rather than the employment sector or occupation. Perceived employer reputationseemed to be particularly important. Although only a small minority of graduates had stated theirdesire “to make a difference” as a reason, almost entirely from those now working for non-STEM employers and in unrelated roles, this was reinforced as a significant reason in theextended comments, often articulated as desire to “work in the public sector”.
The detailed reasons, for choice of current employment, uncovered in the in-depth interviewsechoed the reasons stated in the telephone research, tending to exemplify a combination ofpragmatic and personal factors and the graduates’ more strategic or aspirational career(direction) thinking which they had developed during university. As the graduates hadprogressed, issues such as their knowledge of the labour market, including reputation ofemployers, and perceived stability of employment, had become embedded in their practicaldecision-making, along with other issues relating to their individual personal circumstances.
Rebecca, finance trainee in a Local AuthorityRebecca enjoyed science and maths at school but felt she was weak at thepractical aspects of science, so studied maths at Durham, gaining 1st class Maths.She had no real ideas about career and did not succeed with applications for workexperience schemes. Having investigated different careers in accountancy, shedisliked the commercial aspects of the City and the private sector but wanted to“make a difference”. Rather cautious, she worried about making a wrong decisionand made no job applications while at university.
Once home she became a purchase ledger clerk for the small music companywhere her father worked. Gaining some confidence, and comfortable in a rolewhere she “enabled other people to do the real work”, she made applications forfinance jobs in the public sector and started a CIPFA qualification. Rebeccaentered the graduate scheme for a county council and enjoyed its placements. Nowa trainee accountant, undertaking CIPFA training, she wants to work in the non-profit or third sector eventually, in order to ‘fit’ personally. Although not undulyambitious, she aspires to a senior accountant role through which she feels shecould contribute her skills of numeracy and analysis to a good cause.
STEM Graduates in Non-STEM Jobs
107
4.1.2 Job changes and reasons
Through the in-depth interviews, it was possible to obtain detailed understanding of the jobchanges made by those graduates who were not in their first job but had changed employer ordirection. This was a minority as most interviewees had worked for the same employer sincegraduation, although many had experienced progression of job roles for that employer. For afew graduates their first long-term employment after graduation was rather pragmatic (i.e.“getting a foot on the ladder”), enabling them to join a more desirable employer or when anopportunity arose, by which time they could cite relevant experience.
A small number of graduates had taken somewhat unexpected pathways due to particularpersonal circumstances; for example, due to responsibilities as a carer for a disabled parent, orrelating to a family or the relocation of a partner.
Jessica, Policy Adviser in central governmentJessica went to university as a first-generation HE student to study what she loved,zoology, and did not worry about longer-term ideas as she was diagnosed with aserious long-term visual impairment. She worked at a zoo in vacations but felt hershyness would severely restrict her options and made no job applications while atuniversity. She also had caring responsibilities at home for her disabled, single-parent mother, and restricted job-hunting to administrative jobs and a few seriousconservation posts locally. Over-qualified for the former, she obtained neither, butfound work in an education project with animals and then an animal re-homing unitwhere she ended up in research.
Her self-confidence grew (“I could make scary choices”) and she also realised shecould have personal impact on conservation research through policy work, whichcould be a more realistic direction than a research career. As a result Jessicaapplied for and entered the Civil Service Fast Stream and has since worked in avariety of posts relating to the environment. She uses her analytical skills and keepsabreast of her beloved zoology in her spare time. She now recognises that thepersonal challenge is as important to her as the field of work itself. Although stillhankering to be ‘on the ground’ in conservation research, she knows that to re-enterthat field with any seniority would probably now be impossible.
Now thriving in London, Jessica muses that with her particular circumstances, shewould have benefited from expert advice at key career stages, which would havestopped her making unrealistic job applications and potentially given her asmoother path.

STEM Graduates in Non-STEM Jobs
108
Very few of the graduates had changed from a STEM Specialist sector to other sectors, or inother ways between our sector groups. More common was a shift away from corporate graduateschemes, most of were within STEM Generalist sectors. Several graduates had entered theCivil Service Fast Stream after having earlier joined – and disliked – a corporate graduatescheme (for example Debbie, in section 4.2.2). Only for one or two graduates interviewed hadthese changes been involuntary, due to redundancy, chiefly where they had worked for verysmall, technical businesses in the IT sector. There were relatively few cases of ‘migration’ fromSTEM Specialist sector jobs outwards and none in the other direction, i.e. ‘into STEM’.
4.1.3 Summary of reasons
The main reasons graduates chose their jobs, for most therefore, appear to have beenindividual choices which were quite aspirational, with their potential interest in the work beingthe dominant reason, supported by some longer-term career-related reasoning. Issues likestarting salary or benefits, the potential for training, and especially employer reputation, werealso significant, particularly for those not entering STEM jobs, but were not primary reasons forchoosing the direction of their career. Individual practical reasons, such as location, or ease ofgetting a job, were displayed by relatively few of these graduates. Extremely few, if any,seemed to have ended up in non-STEM jobs as a result of failed applications for STEMemployment.
We now turn our focus to graduates’ career thinking around the time of graduation which, formost of them, determined their career direction and the nature of their first ‘graduate job’.
4.2 Career thinking at graduation and applying for first graduate job
4.2.1 Career readiness and job applications
Just over one third (36%) of the STEM graduates reported that they had a definite career planby the time they graduated, as shown in Table 4.3 (compared with 16% when they had starteduniversity, see subsequent section 4.4). The proportion with only vague ideas or no idea at allwas around a quarter (26%, compared with around 60% at the outset). There were markedvariations in these proportions by subject of degree, with over half of theEngineering/Technology and Computer Science graduates by that point definite about theircareer plans but much lower proportions of graduates in some Physical and Biological Sciences(of whom around a third still had only vague ideas or none at all).
Higher proportions of the STEM graduates now working in specialised STEM employment had adefinite career idea at graduation (46-43%), compared with those now working outside STEMemployers (37% STEM Generalist and 20% non-STEM), as shown in Table 4.4. A similarpattern was seen by occupational function type.

STEM Graduates in Non-STEM Jobs
109
There was no discernible difference in the proportions with or without career ideas by gender,but a significantly higher proportion of those at “other UK” universities (48%) had definite careerideas at graduation compared with those in the Russell Group (32%), more of whom tended tohave some ideas. The proportions with only vague or no ideas were similar irrespective of HEinstitution type (see Appendix B Table B4.5)
Table 4.3 Career situation at graduation by undergraduate subject (all graduates interviewed by telephone),as percentages. Lowermost section only for those who made applications at university. For full results see
Appendix B Table B4.4
At graduation, didyou have:
Bio
logy
and
rela
ted
Che
mis
try
Phy
sics
Mat
hs
Co
mpu
ter
Sci
ence
Eng
./Tec
h.
All
STE
M
A definite career inmind 31 34 21 38 54 53 36
Some ideas about youmight do 31 32 48 43 42 24 37
Only a vague idea 24 24 18 12 4 16 18
No idea at all 13 10 11 7 0 4 8
Not answered2 0 2 0 0 3 1
Applied for jobswhile at university
Applied for jobsdirectly related tocareer
40 54 52 69 88 68 57
Applied for job notrelated to career
2 7 4 0 4 6 4
Not applied for jobs 58 37 43 29 8 26 38
Not answered 0 2 2 2 0 1 1
Count 88 41 56 42 24 99 405
Jobs directly relatedto degree/subjectcourse
Yes, all the jobs 38 29 45 69 86 75 57
Yes, some of the jobs 15 17 13 17 5 16 14
No 47 54 42 14 9 9 29
Count 34 24 31 29 22 69 288
Over half (57%) the graduates interviewed had made long-term job applications by the time theygraduated but 38% had not made any job applications at all, which reflects the trend of manyfinal year students to delay job applications until after finishing university (consistent with ourstudent survey findings). The proportion was highest for Computer Science (88%),Engineering/Technology and Mathematics graduates (68-69%), and lowest for BiologicalSciences where over half of graduates had not made any job applications by graduation (Table4.3).

STEM Graduates in Non-STEM Jobs
110
When the graduates who had engaged in postgraduate training were excluded, the proportionof STEM graduates who had made applications related to long-term career while at universitywas 68%. This figure probably is a fairer reflection, as it should more closely represent theproportion of those intending to seek employment who had made applications. The equivalentdata, by subject, excluding those with postgraduate training, are presented in Appendix B TableB4.6.
Table 4.4 Career situation at graduation by employment sector (STEM graduates interviewed by telephone;lowermost section results only from those who had applied for jobs while at university), as percentages.
At graduation, did youhave:
STE
MS
peci
alis
t
STE
MG
ener
alis
t
Non
-S
TEM
STE
MC
ore
ST
EM
-re
late
d
Unr
elat
ed
All
ST
EM
A definite career in mind 46 37 20 43 34 22 36
Some ideas about you mightdo 30 37 44 34 33 47 36
Only a vague idea 16 14 26 14 20 23 18
No idea at all 7 9 9 7 11 6 8Not answered
1 3 1 1 3 1 1
Applied for jobs while atuniversity
Applied for jobs directlyrelated to career 62 62 44 67 53 44 57
Applied for job not related tocareer 5 4 5 3 5 6 4
Not applied for jobs 32 34 50 30 41 48 38
Not answered 2 1 1 1 1 1 1
Count 153 142 107 174 151 77 402
Jobs directly related todegree/subject course
Yes, all the jobs 83 44 28 79 42 21 57
Yes, some of the jobs 5 16 28 9 17 26 14
No 12 40 44 12 42 54 29
Count 99 91 50 117 84 39 240
In parallel with their apparent greater ‘decidedness’ about career, higher proportions of thegraduates now working in STEM Specialist or STEM Generalist employment had applied forjobs (over 60%) before graduation, than of those now working for non-STEM employers, seeTable 4.4. A higher proportion of Russell Group and 1994 Group university graduates (59%)had made job applications by time of graduation than graduates of ‘other’ UK universities (47%),as seen in Appendix B Table B4.5. Whether this reflects enthusiasm to enter ‘prestige’ graduatejobs and employers, or other factors such as early targeting of these institutions by certain

STEM Graduates in Non-STEM Jobs
111
major employers, cannot be ascertained from the existing data. There was also somecorrelation between the more ‘decided’ about career and those who had undertaken workexperience as a student; more of those with work experience had developed a definite careerplan by graduation (as also seen in the student surveys), and more wished to enter a careerrelated to their degree, but this did not appear to have much impact on whether they hadactually applied for jobs before graduation.
Joanna, Management trainee for national retailerHaving found science A-levels interesting, Joanna chose Physiological Sciences atOxford although with no ideas about her future career. At university she gainedwork experience in a genetics centre, and obtained a 2.1, but felt she lacked thenecessary passion or commitment for research or medical-related work: “I’m not theright personality for research – it would be too sterile and quiet”.
With few positive career ideas, encouraged by her parents she went full-time intothe little business she had set up during university selling party decorations, whichoffered her progress and some working experience. A year later she sold thebusiness and temped while making a lot of applications to graduate schemes indifferent business sectors, to start a management career in business.
The scheme she entered was with a national retailer, although it was generalmanagement she was seeking: “It [retail] wasn’t planned”. Joanna loves the retailenvironment and, though not using any degree knowledge, does make good use ofbroader skills like her analytical approach and good communications developed atuniversity.
In the longer term Joanna would like to link her continuing interest in science withher career but worries that “I would have to go right back to the beginning”. Shereflects that had she been more aware of different jobs available in STEM atuniversity, she might well “have been persuaded to stay [in STEM]”.
4.2.2 Were the job applications degree-related?
Of those who had made job applications while at university (240 of the STEM graduatesinterviewed), over half (57%) reported that all the jobs they had applied for had been related totheir degree subject, 14% that some had been, but 29% made applications only for jobsunrelated to their degree (shown in lowermost section of Table 4.3).
High proportions of those now working for STEM Specialist employers (over 80%) had onlymade applications for degree-related jobs, many but not all of which were within STEM

STEM Graduates in Non-STEM Jobs
112
Specialist sectors (see lowermost section of Table 4.4). A fair proportion (28%) of those nowworking for non-STEM employers had also only made degree-related job applications while atuniversity, which would seem either to reflect subsequent change in their thinking or that theyregarded a wider range of jobs as ‘degree-related’ than in our definition (exemplifying thecomplexity of defining STEM). At the same time, less than half (44%) of those graduates nowworking ‘outside’ STEM had only made applications for non-STEM jobs. This again apparentlyreflects that many of these graduates had not been fully decided prior to graduation andsubsequently changed their career thinking, either for their own reasons or due to factors suchas employers’ recruitment demands (which could have been significant given the nature of thissample). There was no significant difference by gender.
Debbie, Civil Service Fast Stream in central governmentHaving no career ideas, Debbie studied maths in her native Glasgow, as she hadbeen very good at it at (and liked her teachers). She took several work experienceopportunities, working in a local bank and an internship at a ‘big 4’ accountancyfirm. She quickly realised “what [she] was learning at university would not be thatrelevant in ‘real’ working life”.
By graduation, Debbie had made many applications to finance-related and othergraduate schemes, mostly in Scotland, but ruled out what she saw as lessinteresting work such as actuarial roles or in IT. She felt she aimed high and wasrejected from many schemes, including investment banks (also acknowledging shewas “not itching to become a banker”). Once accepted onto a retail bank’s graduatescheme, she felt there that she did not use her maths but rather the wider skillsdeveloped around her degree. The experience led her to realise she did not want towork in finance, especially with the pressures of selling, but sought a “fairerenvironment”.
Debbie began to recognise personal interests in politics and re-applied to CivilService Fast Stream, having earlier failed entry at university, and was nowaccepted. When interviewed she was an Assistant Private Secretary to a Minister.She makes much use of her logic and rigour in solving problems – and clearly lovesit. She expects to progress further in the Civil Service and then forge a widercareer.
In retrospect, Debbie thinks she chose the wrong degree, and then the wronggraduate scheme as she lacked any passion for where maths was taking her.Reflecting on that, it was probably no coincidence that her father had been a mathsteacher (although he did not overtly advise her). Rather it was not until her mid-twenties that Debbie understood how she could align her career direction with herpersonal interests.

STEM Graduates in Non-STEM Jobs
113
Although fewer had made firm job applications, a higher proportion of the applications made bygraduates of “other UK” universities were only for degree-related jobs, than of the othergraduates, and a lower proportion had made no degree-related applications.
The in-depth interviews indicated widely varying approaches to job applications, with somegraduates making applications only within a narrow sector but many making applications inparallel across different sectors to test the water. Many had made applications to graduateschemes in sectors such as banking or consultancy, or even law, in addition to applications tospecialised STEM employers. The number of applications they made varied but was as high as50 for a few graduates. The majority of STEM graduates, irrespective of primary career intentionat that stage, appeared to have been applying to at least a few ‘mainstream’ graduate schemes(i.e. non-specialist STEM schemes) within their application portfolio.
Interestingly, very few graduates reported that they had received rejections from STEMemployers in response to their applications. If they did report rejections at all, most of thoseinterviewed in-depth tended to remember rejections from employers’ graduate schemes, mostlynot in STEM Specialist sectors, rather than from STEM employers. Their perception was thattheir rejection was due either to a lack of work experience or poor performance ‘on the day’rather than any lack of particular skills. However, some caution should probably be exercised ininterpreting this as graduates may have made this as a ‘defensive’ response (i.e. “not my fault”)rather than admitting a lack of inherent skills or their overall quality.
4.2.3 Reasons for career direction and related job applications
Reasons for degree-related job applications
The main reasons cited by the STEM graduates who had made ‘early’ job applications (i.e. priorto graduation) for making degree-related applications are summarised in Figure 4.2, whileAppendix B Table B4.7 gives full details of their responses. ‘Interest/enjoyment of the work’ wasthe reason given by almost all graduates, while about a quarter cited the desire to use theirspecialist skills/knowledge and a similar proportion positive career prospects. The proportionsciting salary as a driver or practical issues like ease of finding a job were very small. Figure 4.2illustrates that there was some variation with STEM degree subject, while non-STEM graduatesstated rather similar main reasons.

STEM Graduates in Non-STEM Jobs
114
Figure 4.2 Most frequently cited reasons for graduates applying only for degree-related jobs, for selectedundergraduate subjects (graduates interviewed by telephone who had made job applications at
university); for full data see Appendix B Table B4.7
0 10 20 30 40 50 60 70 80 90 100
Pay
Use of specialistskills/knowledge
Career prospects
Interest/enjoyment
%
Non-STEM Physics Maths Engineering/Technology All STEM
Considering in more detail these graduates who had applied only for degree-related jobs atuniversity, their reasons differed somewhat according to the employment sector in which theynow worked. More of those now in STEM Generalist sectors cited career prospects (33%) andthe ability to use specialised skills/knowledge (33%) than overall (22% each) for their degree-related job applications at university. None of the graduates who had originally made onlydegree-related applications but now worked in non-STEM sectors had made those original jobapplications on the basis of pay or career prospects; rather they were almost entirely driventhen by job interest. This seems to suggest that those without career-related reasoning mayhave been particularly subject to a change in direction after graduation. These results areshown in Appendix B Table B4.7
When analysed by gender, rather more of the male graduates cited more practical issues likecareer prospects (27%), pay (9%) and location (6%) than did female graduates (16%, 2% and2% respectively), as reasons for applying for degree-related jobs (also see Appendix B TableB4.8).

STEM Graduates in Non-STEM Jobs
115
Reasons for applications not related to degree subject
Although the number of STEM graduates involved was limited (only 73, most from Biologicaland Physical Sciences), the reasons that they had applied at university only for jobs not relatedto degree were probed. The reasons were much more evenly spread than for those applying fordegree-related jobs (Figure 4.3). The most popular reason (for 38%) was better careerprospects, followed by pay (27%), and personal desire for a change in direction (also 27%).However, interest/enjoyment of the work was also rated by 21%, and the more pragmaticreasons of ease/difficulty of finding a job by 21%. None of the STEM graduates reported thattheir decision was due to a lack of opportunities in their preferred location and almost none thatthey were ‘not good enough’ for degree-related work. When interviewed in depth, severalgraduates had ‘downgraded’ their expectations when they had been predicted or obtainedgrades lower than a 2.1; however, this mostly triggered a tactical change towards lessprestigious employers rather than a change in career direction.
Figure 4.3 Most frequently cited reasons for graduates applying for non-related jobs (STEM graduatesinterviewed by telephone who had made job applications at university), including variation by gender; for
full data see Appendix B Tables B4.9 and B4.10
0 5 10 15 20 25 30 35 40 45
Easier/harder to find job
More interest/enjoyment
Change of career direction
Better pay
Better career prospects
%Females Males All STEM
Some differences in the most frequently reported reasons were seen according to gender, seeFigure 4.3 and full results in Appendix B Table B4.10. Better pay was cited by more males thanfemales (36% vs. 14%), more than could be accounted for by gender differences inherent indifferent subjects. More males also cited desire for change in career direction, while morefemales considered the ease/difficulty of finding a job (29% vs. 16% of males). It should becautioned, however, that the sample size for this analysis was very small.

STEM Graduates in Non-STEM Jobs
116
Due to the sample size it was not feasible to undertake robust analysis of the reasons byundergraduate subject. However, from the data in Appendix B Table B4.9 there was someevidence that more of those studying ‘core’ STEM sciences made non-related applications forpay and career reasons rather than their specific interest in a non-STEM job.
When analysed by the graduates’ current employment circumstances, ‘better career prospects’was cited particularly highly by those who now worked for STEM Generalist employers (47%),and better pay and location-related issues somewhat higher in sectors outside STEM. Thedetailed data are presented in Appendix B Table B4.10.
By their final year, many of these graduates, at least, seemed very aware of ‘corporate’graduate schemes, principally in STEM Generalist or non-STEM sectors, and the careeropportunities that could be open there, of which very few had been aware when they starteduniversity. For many, entry to such graduate schemes was now perceived as the ‘default’pathway for good STEM graduates, rather than entering STEM Specialist work (see Helen’scase study, in section 4.5, among others). This was the pathway they either consciouslydecided to join, or avoid, rather than whether or not to enter STEM careers. At the same time,graduates were now recognising practical matters such as earnings, and for a few issues suchas location which would impact on their long-term personal relationships. The perceptions ofwhat their peers were doing, feedback from previous graduates now in industry, and thereputations of particular employers were now also in their minds.
Simon, auditor with mid-size accountancy firmSimon applied for Medicine at Durham but his college grades were insufficient sohe ended up taking Biomedical Science there, swept along by the thought of a‘good’ university and with little understanding of longer term options. He tookseveral temporary jobs during university in both medical and financial roles, muchpreferring the medical work. However, on track for a 2.2, medicine was firmly closedto him and he decided to avoid a medical-related career altogether; it could begalling to work alongside doctors if he could not be one. With friends working infinance, and a heavy presence on campus by big accountancy firms, Simon appliedto all the accountancy companies ranked 5-50 in the UK, believing he was not goodenough for the “big 4”.
He received just one offer, joining a mid-sized firm near London. He likes clientinteractions but finds continued studying hard. His biomedical background helpswith a systems approach to his work, and he thinks enhances his presentationskills. In future he would like to leave auditing and is mapping a route towards beingFinance Director of a medical charity, through which he could fulfil some of hismedical ambitions another way.

STEM Graduates in Non-STEM Jobs
117
Overall, in very simplistic terms, by the time of graduation many graduates’ career thinkingseemed to be switching from purely aspirational thinking prior to and during university to acombination of aspirational and rational, or more pragmatic, decision-making. However, by nomeans all graduates felt the same way, as some felt strongly that they wished to focus on theirstudies until after graduation, and so spent no time at all thinking about careers or jobs, whileothers had continued on their original STEM-focused pathway, reinforcing their commitment to itby taking opportunities for relevant internships or work placements. There was also evidencefrom some female graduates, in engineering or science, of their commitment to a STEMpathway appearing to be quite reliant on the ‘security’ or reassurance provided by a familymember or close family friend who was in the industry.
4.3 Choice of degree course
The top reason given by the graduates for choosing their undergraduate degree course was‘interest in the subject matter’ (cited by 85% of STEM graduates). The next most commonlycited reasons were ‘personal ability’ (by 34%) and ‘improved job prospects’ (23%) of STEMgraduates, as shown in Table 4.5. Although ‘interest’ was by far the most popular reason forgraduates of all subjects, ‘ability’ was rated by nearly as many Mathematics graduates (67%), amuch higher proportion than for any other degree subject. Responses from non-STEMgraduates were broadly similar to those of STEM graduates overall.
Table 4.5. Most commonly cited reasons for choice of undergraduate course by undergraduate subject (allgraduates interviewed by telephone), as percentages. Only reasons cited by over 10% of STEM graduates
listed; full results in Appendix B Table B4.11
Reason Bio
logy
and
rela
ted
Che
mis
try
Phy
sics
Mat
hs
Com
pute
rS
cien
ce
Eng
/Tec
h
All
ST
EM
Broader skills 5 5 13 12 8 13 11
Improved jobprospects 17 12 14 19 29 38 23
Interest 90 80 89 79 79 80 85
Personal ability 28 32 39 67 21 34 34
Other 5 7 5 5 13 5 5
Not answered 5 0 0 0 0 0 1
Count 88 41 56 42 24 99 405
‘Interest in the subject matter’ was cited by an even higher proportion of those STEM graduateswho were now not working in STEM degree-related occupations, than of those working inSTEM, whereas ‘improved job prospects’ were cited by fewer than in STEM Specialist work orSTEM Core roles (see Table 4.6).

STEM Graduates in Non-STEM Jobs
118
Table 4.6. Most commonly cited reasons for choice of undergraduate course, by employment sectorand function (STEM graduates interviewed by telephone), as percentages; for full data see Appendix
B Table B4.12
Reason STEMSpecialist
STEMGenerali
stNon-
STEMSTEMCore
STEM-related
Unrelated
AllSTEM
Broader skills 12 8 13 10 8 18 11
Improved jobprospects 25 22 21 28 17 22 23
Interest 80 87 89 79 88 91 85
Personalability 24 44 34 28 42 32 34
Other 10 2 2 8 3 4 5
Not answered 1 0 3 2 0 1 1
Count 153 142 107 174 151 77 402
Career-based reasons were cited by fewer of the graduates, although ‘improved job prospects’was the third most cited reason (by 23% of STEM graduates and slightly more non-STEMgraduates). It was cited by a higher proportion of Engineering/Technology graduates (38%), andalso by somewhat higher proportions of those now working in occupations or sectors closelyrelated to their STEM degree, than others. A wide range of other reasons were cited byrelatively small numbers of graduates as being important to them, as can be seen in the fulltables in Appendix B.
Some deeper insights were obtained from the face-to-face interviews. The primary reasonscited by the majority were interest in or enjoyment of the subject (“I had always loved science”),as well as aptitude (“maths was my best subject”). A substantial number cited potential careerbenefit as a secondary reason; interestingly the majority of these recognised that a maths orscience degree would “stand them in good stead” in the future, even if they had not at that stageknown what career they wanted to follow. Very few seemed actually to have identified a distinctcareer direction by that time. In addition, several cited parental or family background as areason to study a STEM course, and more than one that there was some “parental expectation”that they should do so.
When questioned in detail, almost all the face-to-face interviewees reported that they hadstudied their first choice subject/course as an undergraduate, so there was little evidence thatchoosing a STEM subject/course was any compromise or a secondary choice. A few graduateshad wanted to pursue Medicine but, without strong enough grades, had instead enteredsubjects like Psychology or other Subjects allied to Medicine. Nearly three-quarters (72%) of theSTEM graduates would study the same or a similar course again, were they to have thechance, while 23% said they would study a different course (Figure 4.4); this is almost identicalto the result from students in section 3.4. The apparent ‘contentment’ with course was highest

STEM Graduates in Non-STEM Jobs
119
amongst Engineering, Physics and Mathematics (about 80% would study the same course) andlowest for Chemistry (56% would study the same course but 39% would choose a differentcourse).
There was some considerable variation with current employment circumstances, with 31% ofthose now working for non-STEM employers saying they would do a different course, comparedwith only 18% in STEM Specialist employment, although this difference was much less strongwith occupational function, see Appendix B Table B4.14.
Figure 4.4 Whether graduates would study the same or similar degree course again, for selectedundergraduate subjects (graduates interviewed by telephone). For full results see Appendix B Table
B4.13
0 10 20 30 40 50 60 70 80 90 100
Non-STEM
Biology and related
Chemistry
Physics
Mathematical Sciences
Computer Science
Engineering/Technology
All STEM
%
Same or similar course Different course Delay entry Not answered
Around 40% of the STEM graduates felt that they would have benefited from more careeradvice and support prior to university; this was highest (around half) for graduates of thePhysical Sciences. For comparison, the figure for students was about 60% (section 3.9). Manyof these graduates stated they had lacked advice around how university subject choices linkedto longer-term career directions. Many said there had been advice about getting into university,often from subject teachers, but little about longer term career implications (some commentingthat their school might have had self-interest in the outcome of the former issue). Several alsocommented that advisers were more interested in those who were undecided about university,encouraging them to apply almost irrespective of subject, than in those who would apply butwere undecided about degree subject. However, at least as many said no careers advice at allwas provided to them prior to university.
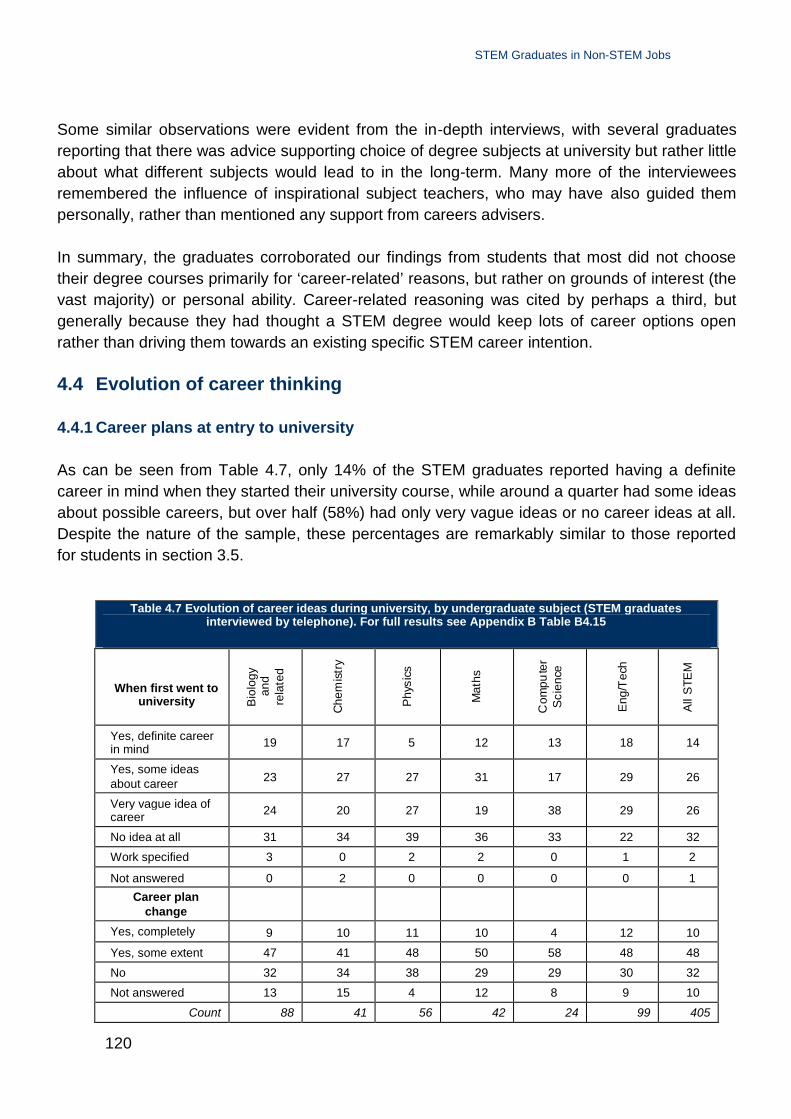
STEM Graduates in Non-STEM Jobs
120
Some similar observations were evident from the in-depth interviews, with several graduatesreporting that there was advice supporting choice of degree subjects at university but rather littleabout what different subjects would lead to in the long-term. Many more of the intervieweesremembered the influence of inspirational subject teachers, who may have also guided thempersonally, rather than mentioned any support from careers advisers.
In summary, the graduates corroborated our findings from students that most did not choosetheir degree courses primarily for ‘career-related’ reasons, but rather on grounds of interest (thevast majority) or personal ability. Career-related reasoning was cited by perhaps a third, butgenerally because they had thought a STEM degree would keep lots of career options openrather than driving them towards an existing specific STEM career intention.
4.4 Evolution of career thinking
4.4.1 Career plans at entry to university
As can be seen from Table 4.7, only 14% of the STEM graduates reported having a definitecareer in mind when they started their university course, while around a quarter had some ideasabout possible careers, but over half (58%) had only very vague ideas or no career ideas at all.Despite the nature of the sample, these percentages are remarkably similar to those reportedfor students in section 3.5.
Table 4.7 Evolution of career ideas during university, by undergraduate subject (STEM graduatesinterviewed by telephone). For full results see Appendix B Table B4.15
When first went touniversity B
iolo
gyan
dre
late
d
Che
mis
try
Phy
sics
Mat
hs
Com
pute
rS
cien
ce
Eng
/Tec
h
All
STE
M
Yes, definite careerin mind 19 17 5 12 13 18 14
Yes, some ideasabout career 23 27 27 31 17 29 26
Very vague idea ofcareer 24 20 27 19 38 29 26
No idea at all 31 34 39 36 33 22 32
Work specified 3 0 2 2 0 1 2
Not answered 0 2 0 0 0 0 1
Career planchange
Yes, completely 9 10 11 10 4 12 10
Yes, some extent 47 41 48 50 58 48 48
No 32 34 38 29 29 30 32
Not answered 13 15 4 12 8 9 10
Count 88 41 56 42 24 99 405

STEM Graduates in Non-STEM Jobs
121
Analysed by subject, higher proportions of graduates in Computer Science and Mathematics(71%) reported that they had only very vague or no career ideas at that time, with the lowestproportion being from Engineering/Technology graduates (but still 51%, meaning that less thanhalf had firm intentions then to become engineers). If anything, the small number of graduatesof non-STEM disciplines had rather more career ideas than these STEM graduates. Again,these figures are very similar to those for students in chapter 3, despite the majority of thissample of graduates being those who now work outside STEM.
Rather fewer of the graduates who had studied at Russell Group or 1994 Group universitiesappeared to have had career plans at this early stage than those who studied at otherinstitutions (although the number of the latter in the sample was rather small). The level ofcareer thinking at this stage did not appear to vary much with gender. However, there was somecorrelation between those without early career ideas and those who did not go on to securework experience at university (which is reported in a later section).
There was evidence that more of the STEM graduates now working for STEM Specialistemployers or in STEM Core roles had had definite career ideas at university entry, than of thosenow working outside STEM, but the proportions were still low (16-18%, Table 4.8).
Table 4.8 Career planning at entry to and change during university, by current employment sector andfunction (STEM graduates interviewed by telephone), as percentages
When first went touniversity S
TEM
Spe
cial
ist
STE
MG
ener
alis
t
Non
-S
TEM
STE
MC
ore
ST
EM
-re
late
d
Unr
ela
ted
All
ST
EM
Yes, definite career inmind 16 14 11 18 13 9 14
Yes, some ideas aboutcareer
19 31 27 22 27 29 25
Very vague idea ofcareer 33 15 30 33 19 26 26
No idea at all 29 38 27 25 40 31 32
Work specified 1 1 3 2 1 3 2
Not answered 1 0 2 1 0 3 1
Career plan change
Yes, completely 6 11 14 9 9 13 10
Yes, some extent 50 46 48 49 46 51 48
No 38 30 27 37 30 25 32
Not answered 6 13 11 6 14 12 10
Count 153 142 107 174 151 77 402

STEM Graduates in Non-STEM Jobs
122
Detailed investigation with the 70 in-depth interviewees revealed a wide range of careerunderstanding when starting university. For most, the level of career thinking was along thelines of “something in business”, although perhaps 1 in 10 had ideas about research in HE anda significant number knew certain sectors that they did not want to work in. Relatively fewgraduates at all mentioned specific employment sectors like accountancy or consultancy, or forthat matter STEM sectors either. A minority expressed very naïve views: from “I thought I wouldbe able to work for NASA” to, worryingly, “I thought once you had a degree they handed you ajob” (the latter from a first-generation HE student).
It seems clear, as from the student data, that few had pre-existing ideas about careers whenthey entered university. A minority had firm aspirations towards a STEM career and would seethose to fruition, while almost none seemed to have forged any firm ideas of careers outsideSTEM at this early stage.
4.4.2 Changes to career thinking during university and influencing factors
The majority of STEM graduates interviewed had changed their career thinking to some extentwhile at university, about 10% changing ideas completely and about half changing to someextent. Only about a third did not change their career ideas (see Table 4.7). There appeared tobe no systematic variation by degree subject, whether more vocational or less, and if anythingfewer of the non-STEM graduates had changed their ideas. Fewer of those graduates nowworking in STEM Specialist employment or STEM Core job functions had changed their careerideas completely (Table 4.8), compared with others, and higher proportions of them reported nochange to their plans. This supports the observation from students (section 3.6) that mostchanges in career thinking tend to be away from more specialised STEM career directions.
The ‘direction’ of the changes to career plans during university was investigated in some detail,along with the graduates’ recollections of which factors had influenced them the most (theywere invited to select the three most important from a list). The top influences on STEMgraduates as students were reported to be their university course (for 42%), their workexperience (34%, and over 50% of Engineering/Technology graduates), personal interests andvalues (27%) and relatives and family friends (24%, see Figure 4.5). Other external influencessuch as employer promotions, industry media, or careers services, were reported as influentialby fewer than 20%; see Figure 4.5 and also Appendix B Table B4.16 for the full results. Salaryprospects were claimed to have been influential by only 10% of the STEM graduates (and farfewer of the non-STEM graduates).

STEM Graduates in Non-STEM Jobs
123
Figure 4.5 Most common ‘top three’ influences on career planning while at university, for selectedundergraduate subjects (all graduates interviewed by telephone). For full detail of responses see
Appendix B Table B4.16
0 10 20 30 40 50 60
Salary prospects
University careers service
Industry media
Employer promotion
Family/family friends
Interest/values
Work experience
University course
%
Physics Maths Engineering/Technology All STEM
Figure 4.6 Most common ‘top three’ influences on career planning at university, by current employment(graduates interviewed by telephone). Full results in Appendix B Table B4.17
0 10 20 30 40 50 60
Salary prospects
University careers service
Industry media
Employer promotion
Family/family friends
Interest/values
Work experience
University course
%
Non-STEM STEM Generalist STEM Specialist All STEM

STEM Graduates in Non-STEM Jobs
124
Analysis by current employment sector showed a roughly consistent relative ordering ofinfluences (Figure 4.6), but with salary prospects and employer presentations being ratedinfluential by many more of those now in STEM Generalist employment (20% for salary, 25% foremployer presentations), compared with those in more specialist STEM work (6% for salary,14% for employer visits). The pattern when split by occupational role was similar.
The in-depth interviews confirmed a growth at this stage in graduates’ understanding both of the‘commercial’ world and also what it would be like to work within it. New awareness of corporateworking environments, partly through the high presence on campus of certain employers, hadbegun to attract some graduates but had put others off, and some had begun to recognise apersonal affinity for working in other sectors, such as in public service. For several there was aclear shift from idealism to pragmatism as they began to recognise their own potential limitationsin a competitive labour market, and realised that they might have to make their own impacts onthe world in more practical ways: “I realised you might have more effect on animal welfarethrough policy than actually practising it”.
Nisha, trainee commercial lawyerNisha was a gifted first-generation HE student from east London, where herfather ran a restaurant and her mother was a healthcare assistant. Althoughunder family pressure to study medicine, because she potentially could, sheloved and instead studied Psychology and gained a 1st at UCL. However,she felt that she needed to enter a professional career in order to maintainthe respect of her community and family, rather than pursuing the academicresearch she dreamed of. Through a combination of her location, and shethinks her ethnic background, she had work experience in top investmentbanks, but that led her to believe such work was “insufficiently professional”.Entering a “proper” profession, in which she could become qualified, in theeye of her community, was critical to her. In addition there was expectationthat she would get married and have a family by the age of 30.
While at university she applied to legal firms and secured a graduate placeto train with one of London’s magic circle. As a trainee commercial solicitorher strong logical and analytical skills are well used and she has progressedfast in the organisation and gained the professional legal qualifications topractice. Nisha’s story was relatively unusual in that her perceivedrequirement to obtain the respect of her community and family, and conformto cultural expectations, overcame her personal passions for a scientificdirection. She maintains hope that “the inner academic” within her will at alater stage be able to take a more central position in her working life, whencircumstances allow.

STEM Graduates in Non-STEM Jobs
125
The influence of parents, family and peers was significant for some, although by no means all,with some indication that it was more important for female graduates. Some individuals seemedto maintain career pathways or make decisions to please their parents, rather than matchingtheir own personalities or aspirations, and in one case a graduate seemed to be living out hismother’s failed career aspiration. In some cases the graduates were aware of this influence,which they generally considered positive or benign, but others had not recognised it untilchallenged. The influence of the decisions of graduates’ peer groups and key friends were assignificant, although in some cases this spurred graduates to take different routes (“everybodyelse was either going into teaching or accountancy”).
Work experience was the highest rated influence by those who studied Computer Science andEngineering/Technology, at least partly reflecting the much higher proportions of thosegraduates who had undertaken it. The limited extent of the sample did not allow for deeperdifferentiation of this issue. From Table 4.9 it can be seen that over three quarters of theseEngineering/Technology and Computer Science graduates interviewed had undertaken workexperience, well above the proportion of the STEM graduates overall (56%). Two thirds of thosewho had undertaken work experience thought it was very helpful in developing their skills andexperience, somewhat higher than the figure cited by students in section 3.8. Many of thoseinterviewed in detail indicated it had been pivotal in either confirming that they did or did notwant to work in a sector – giving them a genuine insight into what, for example, teaching in aschool or working in a lab was actually like: (“lab work just wasn’t me”).
Table 4.9 Percentage with work experience, and perceived usefulness of undergraduate work experiencefor those who had it, for selected undergraduate subjects (all graduates interviewed by telephone). For full
results see Appendix B Table B4.18
Bio
logy
and
rela
ted
Che
mis
try
Phy
sics
Mat
hs
Com
pute
rS
cien
ce
Eng
/Tec
h
All
ST
EM
Done workexperience 48 56 39 40 88 76 56
As anundergraduate 43 54 38 36 88 76 53
As a postgraduate 5 2 5 5 0 1 4
Count 88 41 56 42 24 99 405
Undergraduatework experience
Not at all helpful 0 5 0 0 0 0 0
Not very helpful 5 9 5 0 0 4 5
Quite helpful 38 9 36 31 10 26 28
Very helpful 56 77 59 69 90 70 67
Count 39 22 22 16 20 74 218

STEM Graduates in Non-STEM Jobs
126
4.4.3 Impact of career influences
The impact of these chiefly external influences, outlined in the previous section, and thedevelopment of the students’ and their career thinking at university was also probed. About halfof the STEM graduates (52%) decided that they would want to take up degree-related work, butabout one third decided to seek work not related to their degree. Up to a quarter had found outabout particular employers that they would like to work for, and about 13% had found out aboutnew areas of work they had not considered before.
The proportions reporting these different directions of change varied strongly with the degreesubject studied. The majority of Computer Science (83%), Engineering/Technology andMathematics (69%) graduates confirmed that they wanted degree-related work, but only 34-41% of Chemistry, Biological Sciences and Physics graduates. For the latter, around as manydecided to seek work not related to their degree, see Table 4.10.
In the in-depth interviews, many graduates reported that they had changed their thinking ‘away’from STEM Specialist employment as their career thinking evolved, although few had beendefinite at the start. Others did confirm their existing desire to pursue a STEM career as theylearned about other options. A significant number abandoned their ideas of pursuing PhD orother scientific research, coming to the realisation that such work was less glamorous than theyhad imagined, could be very narrow, and that only the very best would obtain funding whichcould eventually rule them out.
Table 4.10 Main impacts of influences on career plans, for selected undergraduate subjects (graduatesinterviewed by telephone), by percentage. Full results in Appendix B Table B4.19
Bio
logy
and
rela
ted
Che
mis
try
Ph
ysic
s
Mat
hs
Com
pute
rS
cien
ce
Eng
/Tec
h
All
STE
M
Decided wanted towork in degree-relatedwork
38 34 41 69 83 69 52
Decided not want towork in degree-relatedwork
39 29 39 14 29 29 32
Information aboutspecific work 17 29 9 21 38 23 20
Discovered new areasof work 11 7 13 14 25 13 13
Desirable employer 15 24 25 29 33 22 23
Not answered 3 10 4 5 0 4 4
Count 88 41 56 42 24 99 405

STEM Graduates in Non-STEM Jobs
127
When analysed by their current occupation, predictably, much higher proportions of those nowworking for STEM Specialist employers or in STEM Core job functions (around 70%) reportedthat they had decided to seek degree-related work than those now working outside STEM (35-48%), see Table 4.11. The inverse was also seen, with twice as many of those now workingoutside STEM having decided to seek work unrelated to their degrees. However, it was notablethat as many as 20% of those now in specialised STEM jobs had in student days apparentlydecided not to pursue work in STEM, reflecting that individual career decisions and actual pathswere by no means simple or predictable. However, of the small proportion that realised that theyhad to rethink their career plans altogether, the majority were now working outside STEM.
Table 4.11 Main impacts of influences on career plans, by employment sector and function (STEM graduatesinterviewed by telephone). Full results shown in Appendix B Table B4.20
STEMSpecialis
t
STEMGenerali
stNon-STEM
STEMCore
STEM-related
Unrelated
AllSTEM
Decided wanted to workin degree-related work
68 39 48 71 40 35 52
Decided not want towork in degree-relatedwork
20 40 36 21 38 43 31
Information aboutspecific work 18 24 20 18 24 19 20
Discovered new areas ofwork 18 12 7 17 11 9 13
Desirable employer 25 27 14 24 23 19 23
Not answered 5 2 5 5 3 4 4
Count 153 142 107 174 151 77 402
The career thinking of these graduates had evolved considerably while they were at university,which was not unsurprising given that few had fixed ideas when they entered HE. The impact ofvarious different influences, external like work experience, or more local such as their degreecourse learning, was different for different students; for some it confirmed pre-existing intentions(chiefly for those who wanted a STEM career), but for many others – most of whom startedundecided – the evolution was ‘away’ from STEM career ideas. It was also clear that thedirection in which their career thinking was leading at this time was by no means parallel to theemployment which they subsequently gained.
4.4.4 Careers advice and support at university
One of the more significant influences on HE students and their career decision-making wasexpected to be the careers support available to them from within their university careersadvisory service (CAS). Although only cited as a ‘top three’ influence by one in six STEMgraduates, nearly two-thirds (61%) of them reported that they had used their careers service in

STEM Graduates in Non-STEM Jobs
128
some way at least when they were undergraduates, and the majority described this as eithervery (31%) or quite (45%) helpful, see Table 4.12. However, within the telephone interviews themanner in which they had used the careers service was not differentiated, i.e. whether they hadsimply made use of information services or whether they had undertaken personalised guidancesessions.
Table 4.12 Use of university careers service while an undergraduate, and its usefulness, for selecteddegree subjects (graduates interviewed by telephone), as percentages. For full results see Appendix B
Table B4.21
Used CareersService
Bio
logy
and
rela
ted
Che
mis
try
Phy
sics
Mat
hs
Com
pute
rS
cien
ce
Eng
/Tec
h
All
ST
EM
Yes 65 49 66 60 63 66 61
No 32 51 32 40 38 34 37
Not answered 3 0 2 0 0 0 1
Count 88 41 56 42 24 99 405
Usefulness
Not at all helpful 4 15 0 0 7 0 2
Not very helpful 11 25 11 24 0 25 19
Quite helpful 37 45 54 28 53 49 45
Very helpful 49 15 30 40 33 26 31
Not answered 0 0 5 8 7 0 2
Count 57 20 37 25 15 65 249
When analysed by current employment, there was little variation in the proportion who reportedusing their university careers service with current employment sector or job role grouping,although somewhat fewer of those in STEM Generalist work had used the service. There wasno significant, systematic difference in how helpful they had found it. About 30% of STEMgraduates felt that they would have benefited from more career advice and support during theiruniversity time. The main area in which these graduates felt they could have done with moresupport was specialist job information and advice, rather than help in determining their overallcareer direction. Many commented that they received insufficient support or information inrelation to quite specific job ideas or interests.
The in-depth interviews with graduates enabled a more detailed picture to be gained of theirexperiences of university career advisory services. While the majority had taken someadvantage of their CAS, for most this had been limited to using some of its information services,and very few had taken the opportunity of one-to-one guidance sessions. While the support ofinformation about particular employers, and how to make job applications, was welcomed by all,there was less positive feedback about how useful the CAS had been in helping the more

STEM Graduates in Non-STEM Jobs
129
‘undecided’ graduates. Several graduates reported their perception that the CAS was “helpfulprovided you knew what career you wanted”, but less helpful to those who needed assistance inidentifying a career direction. This rather contradicts the evidence from graduates in thetelephone interviews. Certain graduates also felt that the CAS was more effective in helpingSTEM graduates who expressed any interest in entering mainstream graduate sectors such asconsultancy and financial services, more than those who sought to enter more specialisedSTEM sectors and less well-known employers. This impression was summed up, in ratherbinary fashion, by John (see case study in section 4.6): “Corporate finance was the only realoption the CAS suggested if engineering was not an option”.
Overall, the role of careers advisory services did not appear to be pivotal in terms of influencingthe career direction decisions of these STEM graduates – and by its very nature it should beimpartial – but there is anecdotal evidence that it was particularly effective in helping(“accelerating”) some STEM graduates who were considering mainstream graduate schemesrather than more specialised STEM jobs.
4.5 Use of degree knowledge and related skills
Around half of these STEM graduates felt that they were using and building on their specificdegree skills and knowledge to a great (16%) or some (35%) extent within their current work,although this varied quite strongly both by their degree subject and the nature of theiremployment. The proportion was highest for Computer Science graduates, of whom 75% usedtheir degree skills and knowledge to some or a great extent, and lowest for Chemistry graduates(37%), see Figure 4.7. Not surprisingly, the proportion using their degree skills and knowledgeto a great or some extent was highest (about 70%) for those working for STEM Specialistemployers, or in STEM Core roles, but was still about 40% for those working in otheremployment sectors or roles. Graduates in STEM-related roles (or STEM Generalist employers)appeared to use their degree skills/knowledge no more than those in non-STEM work (Figure4.8).
However, the use of broader or more general skills, ways of thinking and behaving which thegraduates had learned as part of their degree, was much higher; around 90% of STEMgraduates believed they used these to a great or some extent in their current jobs, and a similarproportion of non-STEM graduates. There was no significant variation of these proportions byeither employment sector or by occupational function (Figure 4.8), suggesting that these‘broader’ skills were universally useful.

STEM Graduates in Non-STEM Jobs
130
Figure 4.7 Use of degree knowledge and more general skills in current job, for selected undergraduatesubjects (graduates interviewed by telephone). Data in Appendix Table B4.22
Specific degree knowledge
0 10 20 30 40 50 60 70 80 90 100
Non-STEM
Biology and related
Chemistry
Physics
Mathematical Sciences
Computer Science
Engineering/Technology
All STEM
%
To a great extent To some extent Only to a little extent Not at all
General/broader skills
0 10 20 30 40 50 60 70 80 90 100
Non-STEM
Biology and related
Chemistry
Physics
Mathematical Sciences
Computer Science
Engineering/Technology
All STEM
%
To a great extent To some extent Only to a little extent Not at all
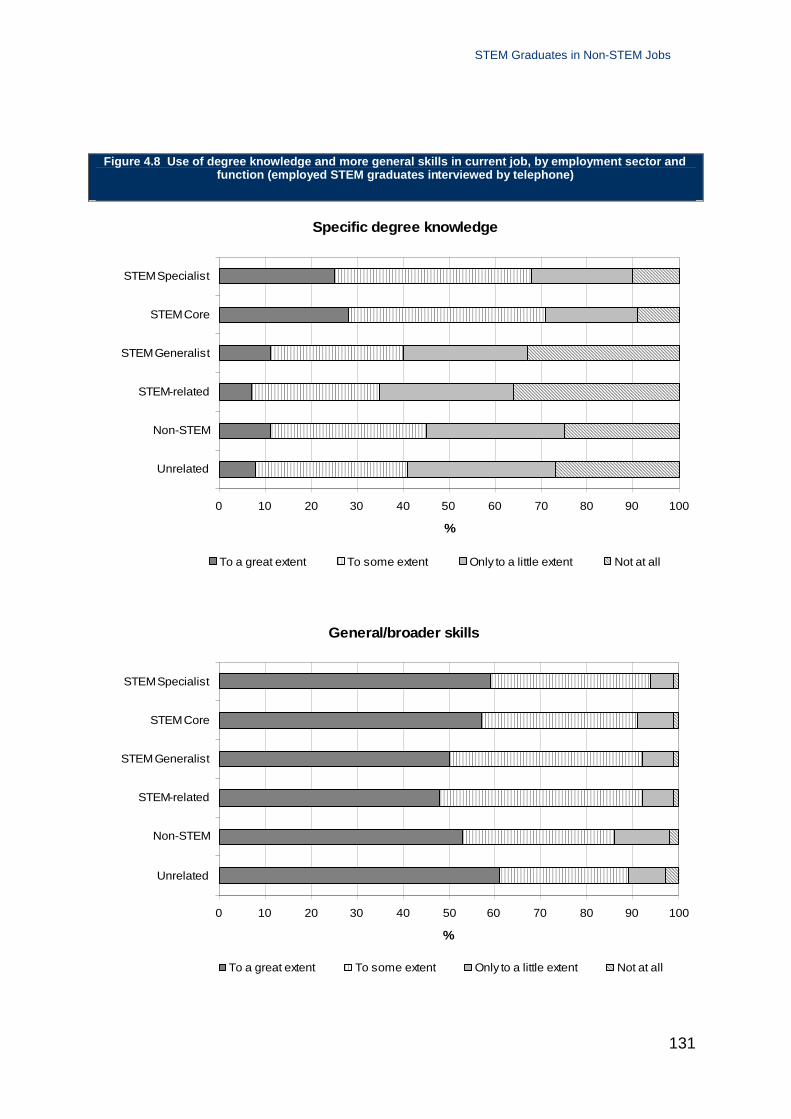
STEM Graduates in Non-STEM Jobs
131
Figure 4.8 Use of degree knowledge and more general skills in current job, by employment sector andfunction (employed STEM graduates interviewed by telephone)
Specific degree knowledge
0 10 20 30 40 50 60 70 80 90 100
Unrelated
Non-STEM
STEM-related
STEMGeneralist
STEMCore
STEMSpecialist
%
To a great extent To some extent Only to a little extent Not at all
General/broader skills
0 10 20 30 40 50 60 70 80 90 100
Unrelated
Non-STEM
STEM-related
STEMGeneralist
STEMCore
STEMSpecialist
%
To a great extent To some extent Only to a little extent Not at all

STEM Graduates in Non-STEM Jobs
132
The graduates were asked to specify which broader or more general skills they believed theyhad learnt through undertaking their degrees, for which selected results are shown by degreesubject in Figure 4.9. Over half of STEM graduates (and 80% of non-STEM graduates) believedthey had learnt written communication and presentation skills as a result of their degree. Theiranalytical approach to problem-solving was also cited over half of the STEM graduates in earlytelephone interviews, as a result of which the question was then revised to probe this moredeeply in the remainder. This revealed that many STEM graduates believed they had learned aparticularly logical/rigorous approach to problem-solving, which fewer of the non-STEMgraduates recognised, while the non-STEM graduates seemed instead to highlight broaderskills of analysis. Amongst the other skills that significant numbers of both STEM and non-STEM graduates thought they had learnt were the more generic skills of team working (30%)and self-discipline (20%). Unsurprisingly, graduates of certain subjects rated particular skillsmore highly than others, although this was perhaps less pronounced than might have beenexpected; many of the Physical Sciences and Maths graduates cited numeracy, while someothers ranked self-discipline strongly which presumably reflected a particular style of learningwithin their degree subject.
Figure 4.9 Most popularly cited general skills learnt from degree by undergraduate subject (graduatesinterviewed by telephone). For full results see Appendix B Table B4.23
0 10 20 30 40 50 60 70 80 90
Project management
Time management
Numeracy
Self-discipline
Team-working
Written communication/presentation skills
Analytical skills
Logical/rigorous approach toproblem-solving
%
Non-STEM Biology and related Physics Maths Computer Science Engineering/Technology All STEM
This analysis was reinforced by more detailed questioning within the in-depth interviews. Manyof the core sciences, and also non-STEM, graduates cited their ability to undertake research, toanalyse data/information and to structure an argument or communication, although many felttheir communications skills were much stronger in writing than verbally or in presentations. Asignificant proportion of the STEM graduates felt they brought a particularly rigorous (“scientific”)

STEM Graduates in Non-STEM Jobs
133
approach to problem-solving in their workplace, which was unique to them as a STEM graduateand also recognised as valuable by their employer.
A higher proportion of graduates interviewed (than in the telephone survey) suggested that theirinherent numeracy, as a STEM graduate, and their ability to understand probability and risk,were very valuable in non-STEM work environments especially, where such skills wereconsidered relatively unusual. For those now working in sectors such as Government andpublishing, several reported that more quantitative work “tended to come their way” and thatthey had been strongly welcomed by their employer and team colleagues when they joined theorganisation because they introduced these skills. Several believed that they had progressedfaster within their organisation as a direct result of having such skills than the majority of theircolleagues, who were mostly not STEM graduates and therefore did not.
Some graduates displayed a greater awareness of the transferability of certain STEM skills thanothers. As one example, a physics graduate now practising law mentioned that his advancedunderstanding of logic, developed when learning computer programming, was extremelyvaluable to him when writing commercial legal contracts.
Helen, production team leader for academic publisherHelen had always been good at maths, and her mother was a clerk in anaccounting firm who had really wanted to be an accountant (but did not havethe right background), so it was not surprising she did a maths degree atYork. She had no ideas about jobs while at university and worried that all herpeers were headed for “either accountancy or teaching, neither of whichappealed to me”. She dabbled with graduate scheme applications butwithout putting her heart into them.After graduating, she decided to follow her heart, which was the world ofbooks. Despite friends saying that it was impossible to get a career inpublishing, she temped in a bookshop and, after a period travelling, enrolledin an MSc in Publishing at Oxford Brookes. There she realised she was veryunusual in having a maths background.A local academic publisher was very keen to hire her – somebody with atalent for spreadsheets and the more numerate aspects of the business.Helen progressed quickly from a lowly administrative role through severaleditorial jobs to lead a production team in the scientific journals division.More quantitative work “always seems to come [her] way”, and her particularskillset is clearly of high value to the employer, whose staff is dominated byarts graduates, and has enabled her to progress very quickly in that sector.

STEM Graduates in Non-STEM Jobs
134
There appeared to be some difference between the strength with which the graduatesarticulated their skills, and the value of them, between the two interview methods, with more ofthose interviewed face-to-face apparently reporting more skills positively. This could suggestthat some STEM graduates tend to underplay the broader skills related to their degree, untilmore actively probed about them.
While almost all the graduates interviewed believed having some kind of degree had beenessential to obtain their job, almost irrespective of their employment sector, 59% of graduatesnow in STEM Specialist employment believed a degree in their subject had been essential(31%) or very important (28%) in getting their job (Table 4.13). Similar proportions in STEM corejobs felt this way. Much lower proportions of all others, unsurprisingly, believed that the subjectof their degree was essential or very important in getting their job; in fact nearly two-thirds ofthose in STEM Generalist or non-STEM sectors, and related or unrelated roles, thought theirdegree subject had either not been very or not at all important.
Table 4.13 Importance of degree in subject was in obtaining current job, by employment sector andfunction (STEM graduates interviewed by telephone), as percentages
How essential ST
EM
Sp
ecia
list
ST
EM
Gen
eral
ist
Non
-S
TE
M
ST
EM
Cor
e
STE
M-
rela
ted
Unr
elat
ed
All
STE
M
Not at allimportant 8 39 36 11 38 39 27
Not very important 12 23 19 10 25 24 18
Important 20 23 22 21 22 22 22
Very important 28 10 10 26 11 8 17
Essential 31 4 12 31 5 7 17
Not applicable 1 0 0 1 0 0 0
Count 153 142 105 174 150 76 400
When asked about whether the degree subject was essential in order to do the job, rather thanto obtain it, about a third overall thought it essential and a third thought it was preferable (Table4.14). By degree subject studied, the proportion thinking it essential was highest (46-47%) forEngineering/Technology and Computer Science graduates, and lowest for Biological Sciences(27%, and lower still for non-STEM graduates). Nearly 60% of those now in STEM Specialistemployment felt their particular degree was essential to do their job. However, interestingly,about 20% of those working in STEM Generalist or non-STEM jobs still believed their particulardegree subject to be essential and about 40% preferable to do their job (Table 4.15).
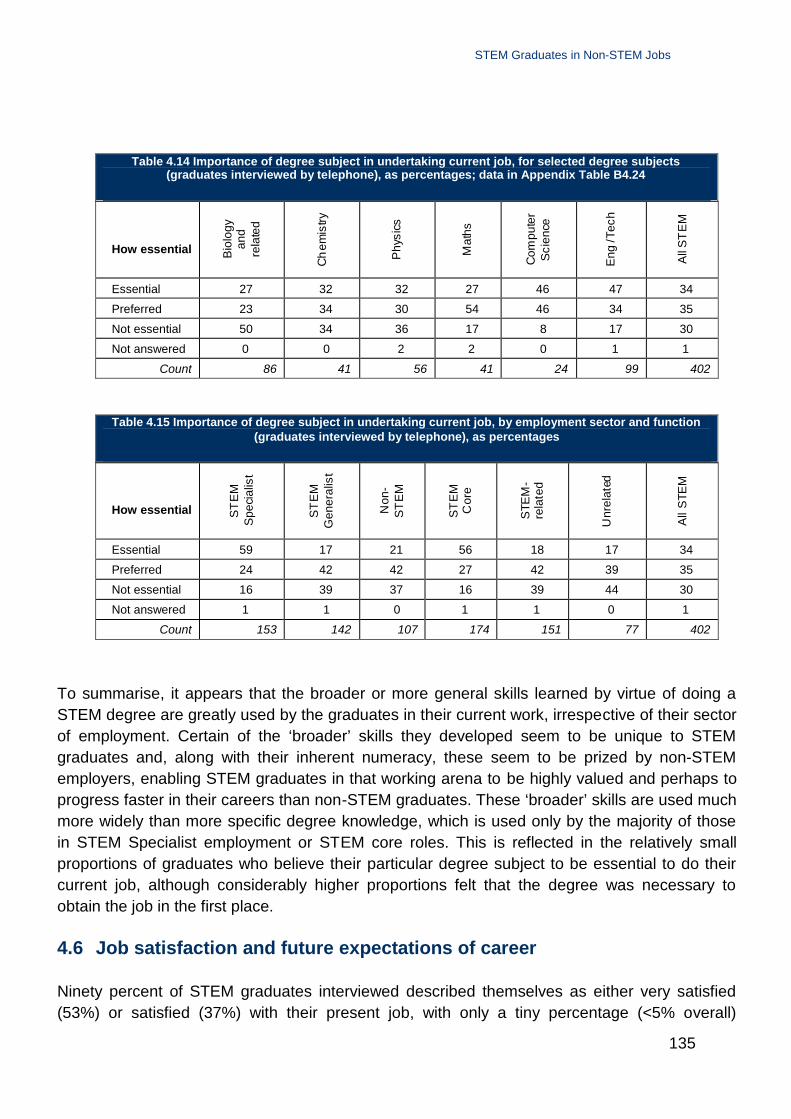
STEM Graduates in Non-STEM Jobs
135
Table 4.14 Importance of degree subject in undertaking current job, for selected degree subjects(graduates interviewed by telephone), as percentages; data in Appendix Table B4.24
How essential Bio
logy
and
rela
ted
Ch
emis
try
Phy
sics
Mat
hs
Com
pute
rS
cien
ce
Eng
/Tec
h
All
ST
EM
Essential 27 32 32 27 46 47 34
Preferred 23 34 30 54 46 34 35
Not essential 50 34 36 17 8 17 30
Not answered 0 0 2 2 0 1 1
Count 86 41 56 41 24 99 402
Table 4.15 Importance of degree subject in undertaking current job, by employment sector and function(graduates interviewed by telephone), as percentages
How essential ST
EM
Spe
cial
ist
ST
EM
Gen
eral
ist
Non
-S
TE
M
ST
EM
Cor
e
STE
M-
rela
ted
Unr
elat
ed
All
STE
M
Essential 59 17 21 56 18 17 34
Preferred 24 42 42 27 42 39 35
Not essential 16 39 37 16 39 44 30
Not answered 1 1 0 1 1 0 1
Count 153 142 107 174 151 77 402
To summarise, it appears that the broader or more general skills learned by virtue of doing aSTEM degree are greatly used by the graduates in their current work, irrespective of their sectorof employment. Certain of the ‘broader’ skills they developed seem to be unique to STEMgraduates and, along with their inherent numeracy, these seem to be prized by non-STEMemployers, enabling STEM graduates in that working arena to be highly valued and perhaps toprogress faster in their careers than non-STEM graduates. These ‘broader’ skills are used muchmore widely than more specific degree knowledge, which is used only by the majority of thosein STEM Specialist employment or STEM core roles. This is reflected in the relatively smallproportions of graduates who believe their particular degree subject to be essential to do theircurrent job, although considerably higher proportions felt that the degree was necessary toobtain the job in the first place.
4.6 Job satisfaction and future expectations of career
Ninety percent of STEM graduates interviewed described themselves as either very satisfied(53%) or satisfied (37%) with their present job, with only a tiny percentage (<5% overall)

STEM Graduates in Non-STEM Jobs
136
dissatisfied, Table 4.16. The proportions for non-STEM graduates were broadly similar andthere was little systematic difference with STEM degree subject studied. The least satisfied withtheir job appeared to be Physics graduates, of whom 11% were dissatisfied or very dissatisfied,compared with 4% for STEM graduates overall; on the other hand more of them (59%) werevery satisfied than overall. Table 4.16 shows the overall figures and for selected degreesubjects, while full results are in Appendix B Table B4.25.
Table 4.16 Satisfaction with present job and career progress to date, for selected undergraduate subjects(all graduates interviewed by telephone), as percentages. For full results see Appendix B Table B4.25
How satisfiedwith present job
Bio
logy
and
rela
ted
Che
mis
try
Phy
sics
Mat
hs
Com
pute
rS
cien
ce
Eng
/Tec
h
All
ST
EM
Very dissatisfied 0 0 2 0 0 1 0
Dissatisfied 3 7 9 2 0 3 4
Neither satisfiednor dissatisfied 8 2 4 10 0 2 5
Satisfied 35 37 27 41 33 43 37
Very satisfied 51 54 59 46 67 51 53
Not answered 2 0 0 0 0 0 0
How satisfiedwith progress ofcareer
Dissatisfied 2 0 4 5 8 8 5
Neither satisfiednor dissatisfied 5 10 11 5 0 3 5
Satisfied 38 41 43 34 42 44 43
Very satisfied 51 46 41 56 50 42 46
Not answered 3 2 2 0 0 2 2
Count 86 41 56 41 24 99 402
Similar results were obtained in relation to satisfaction with graduates’ perceived progress withtheir career to date (again around 90% were satisfied or very satisfied), although with slightlylower figures for Engineering/Technology graduates; however, those were still only at the levelof about 1 in 12 Engineering/Technology or Computer Science graduates expressingdissatisfaction and therefore a small minority.
When analysed according to their current employment circumstances (Table 4.17), there waslittle difference between the proportions between those working in STEM Core job roles, and/orSTEM Specialist employers, and those working in unrelated jobs or non-STEM employment. Onthe other hand there was some evidence that fewer of those in STEM-related roles, and/orworking for STEM Generalist employers, were very satisfied (45%) and a few more of themwere dissatisfied (but still only 7%). The proportions very satisfied or satisfied, or dissatisfied,

STEM Graduates in Non-STEM Jobs
137
with their career progress to date did not vary significantly by the nature of their currentemployment.
Table 4.17 Satisfaction with present job and career progress to date, by employment circumstances (STEMgraduates interviewed by telephone), as percentages.
How satisfiedwith present job
STE
MS
peci
alis
t
STE
MG
ener
alis
t
Non
-S
TEM
STE
MC
ore
ST
EM
-re
late
d
Unr
elat
ed
All
ST
EM
Very dissatisfied 1 1 0 0 1 1 0
Dissatisfied 2 6 4 4 5 1 4
Neither satisfiednor dissatisfied 4 7 3 3 8 1 5
Satisfied 36 41 35 36 39 36 37
Very satisfied 58 45 57 56 47 57 53
Not answered 0 0 2 0 0 3 0
How satisfiedwith progress ofcareer
Dissatisfied 6 4 4 6 5 3 5
Neither satisfiednor dissatisfied 4 5 6 5 5 4 5
Satisfied 46 39 43 41 40 52 43
Very satisfied 43 49 45 47 48 39 46
Not answered 1 2 3 1 3 3 2
Count 153 142 107 174 151 77 402
These almost uniform, high current job-related satisfaction results may in part result from thenature of the sample, i.e. that many of the graduates interviewed had ‘good jobs’ and wereemployed by ‘good employers’, which might mask any differences between differentemployment sectors.
Unsurprisingly, given those results, a similarly large majority (around 90%) expected to continuein their current line of work. Only about 6% of STEM graduates anticipated that they wouldchange career direction within the next few years. More substantial proportions expected eitherto progress in their current job and/or to change job within this timeframe, but only 16%expected to change employer. These apparently ‘conservative’ figures probably reflect both theearly career stage of the majority of interviewees and/or their position working for larger andprestigious employers, with whom they might expect to forge good careers over long periods.
Despite these very positive indications of job satisfaction, about half of the graduates who didnot consider that their degree was essential to their current job would, in principle, like theirwork to be more closely related to their degree. Surprisingly, perhaps, this proportion did notdiffer substantially with the sector in which they now worked (Table 4.18).
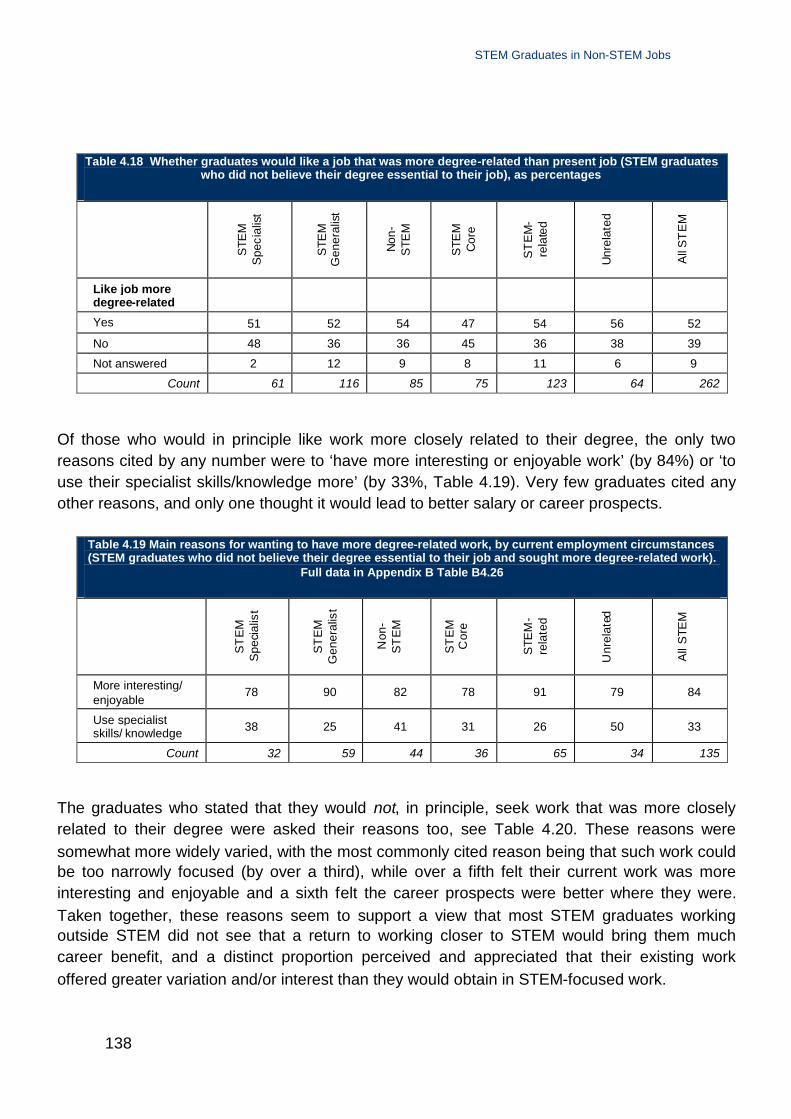
STEM Graduates in Non-STEM Jobs
138
Table 4.18 Whether graduates would like a job that was more degree-related than present job (STEM graduateswho did not believe their degree essential to their job), as percentages
STE
MS
peci
alis
t
STE
MG
ener
alis
t
Non
-S
TEM
STE
MC
ore
ST
EM
-re
late
d
Unr
elat
ed
All
ST
EM
Like job moredegree-related
Yes 51 52 54 47 54 56 52
No 48 36 36 45 36 38 39
Not answered 2 12 9 8 11 6 9
Count 61 116 85 75 123 64 262
Of those who would in principle like work more closely related to their degree, the only tworeasons cited by any number were to ‘have more interesting or enjoyable work’ (by 84%) or ‘touse their specialist skills/knowledge more’ (by 33%, Table 4.19). Very few graduates cited anyother reasons, and only one thought it would lead to better salary or career prospects.
Table 4.19 Main reasons for wanting to have more degree-related work, by current employment circumstances(STEM graduates who did not believe their degree essential to their job and sought more degree-related work).
Full data in Appendix B Table B4.26
ST
EM
Spe
cial
ist
ST
EM
Gen
eral
ist
Non
-S
TE
M
ST
EM
Cor
e
STE
M-
rela
ted
Unr
elat
ed
All
STE
MMore interesting/enjoyable
78 90 82 78 91 79 84
Use specialistskills/ knowledge 38 25 41 31 26 50 33
Count 32 59 44 36 65 34 135
The graduates who stated that they would not, in principle, seek work that was more closelyrelated to their degree were asked their reasons too, see Table 4.20. These reasons weresomewhat more widely varied, with the most commonly cited reason being that such work couldbe too narrowly focused (by over a third), while over a fifth felt their current work was moreinteresting and enjoyable and a sixth felt the career prospects were better where they were.Taken together, these reasons seem to support a view that most STEM graduates workingoutside STEM did not see that a return to working closer to STEM would bring them muchcareer benefit, and a distinct proportion perceived and appreciated that their existing workoffered greater variation and/or interest than they would obtain in STEM-focused work.

STEM Graduates in Non-STEM Jobs
139
Table 4.20 Main reasons for not wanting to have more degree-related work, by current employmentcircumstances (STEM graduates who did not believe their degree essential to their job but did not seek more
degree-related work). Full data in Appendix B Table B4.27
ST
EM
Spe
cial
ist
ST
EM
Gen
era
list
Non
-S
TE
M
ST
EM
Cor
e
ST
EM
-re
late
d
Unr
elat
ed
All
STE
M
More interesting/ enjoyable 38 14 17 41 14 9 22
Change of direction 7 19 30 3 23 35 19
Degree-related too narrow 24 52 27 24 45 39 37
Too competitive 7 10 7 0 14 9 8
Better paid 3 12 3 3 11 4 7
Better career prospects 7 21 17 3 25 17 16
Count 29 42 30 34 44 23 101
STEM graduates who were not in STEM Specialist employment or Core roles were asked abouthow difficult they thought it would now be to get degree-related work. The majority (60-70%)perceived that it would now be difficult or very difficult to do so. Their reasons for this perceptionwere mostly that STEM employers might demand more up-to-date specialist knowledge thanthey could supply, but also that they could themselves would have practical difficulties in makingsuch a change – such as decreased earnings.
Interviewees were asked if they expected to remain in their current line of work. The vastmajority said they were satisfied “for now” and were positive about their career progression todate, and the benefits that would ensue financially or in terms of personal satisfaction. However,a minority of those working in accountancy/professional services felt that they did not want topursue that career direction, but would soon seek career change (generally once they hadqualified professionally). For this small, but distinct, group there was a feeling that they hadmight have made an error in choosing well-rewarded but uninteresting work instead of whatwere potentially more interesting STEM-focused occupations. Whether they could actuallychange sector back, to degree-related work, they realised, might well depend on whether theywere prepared to accept a lower salary. Several others had already identified a compromiseoption, where in the longer term they might find financial work for a STEM Specialist employer,hoping that might maintain some personal interest for them.
When considering their longer term career, however, many more indicated that they did notexpect to remain in their current sector. They maintained more ‘aspirational’ thinking for thelonger term, which they considered to be 5-10 years hence, and many reported some desire toenter quite different sectors, such as teaching, or research, or the third sector, at a later stage oftheir career. They felt such moves would give them more interest or satisfaction in the longterm. Interestingly, when asked whether they thought there was professional (careers) support

STEM Graduates in Non-STEM Jobs
140
available to help them consider such changes, none were aware of any available to them as aworking adult.
The very high levels of satisfaction reported, across the range of degree subjects of thegraduates and their lines of work, reinforces the interpretation that the sample waspredominantly graduates a few years into ‘good’ jobs with ‘good employers’, which they mayhave appreciated for a variety of reasons. The rather low proportions expecting to change job oremployer within a few years reflect this, and are somewhat at odds with overall career trendstowards multiple changes within a working life. Certainly there was no evidence in the samplefor significant numbers of graduates now working in jobs unrelated to their degrees who soughtto change direction back towards degree-related work, other than a minority of those working infinance and professional services (such as accountancy). Many realised that considerablepractical difficulties could ensue if they did make such changes, not least that they would expectto return to “the start of the ladder” with much reduced earnings. On the other hand, many didmaintain aspirations towards or notions of major career direction changes in the longer term.
John, accountancy with one of the ‘Big 4’John studied Mechanical Engineering at Edinburgh because it was a “well-respected and well-recognised degree” he thought would keep lots of careeroptions open. Based on his fellow students, he felt he would not fit in withthose working in engineering. Financial sector employers were regularly oncampus and his careers service suggested that was the sector to enter if youdid not want to follow engineering. Accountancy also had the attraction of agood starting salary and training scheme, and the excitement of living inLondon. This was hard to resist; when he got a “big 4” offer in his secondyear, he stopped worrying about jobs, focused on his degree and obtained a1st.Three years on, as a corporate financial analyst, John finds work ratherboring and wishes he had not turned his back on engineering, which he feelshe did through ignorance, prejudice and arguably laziness. Severalcontemporaries who took 4-year engineering courses including workexperience – of which he had none – were now in engineering careers; headmits he dismissed engineering without ever knowing what it was reallylike.
Shortly to qualify, although he does not expect to stay in financial services,he does not think he could get an engineering job without a large salarydrop, so the accountancy qualification will enable him to enter businessmanagement roles and he hopes eventually to become a senior financialmanager of a science-related company.

STEM Graduates in Non-STEM Jobs
141
4.7 Observations and conclusions
4.7.1 Overall observations from graduate interviewed
STEM graduates were found to be working for a wide range of employers in all sectorsof the economy, in both the private and public sector, across a wide range ofoccupational roles. Many in the sample were working for larger ‘good’ employers, as aresult of the interviewee recruitment strategy, so the results obtained are notrepresentative of all STEM graduates working outside STEM. However, despite thedeliberate focus of the sample, there was good correlation with certain results from thestudent survey.
There was mixed evidence for differential academic ‘quality’ (attainment) between theemployer and occupational groups within this sample of dominantly highly achievinggraduates. The sector with the highest proportion of 1st and 2.1 degrees was the STEMGeneralists, and in STEM-related occupations, while fewer 1st class degree-holderswere working in non-STEM sectors. Fewest of those with lower degree classes were inSTEM-related work, with similar proportions in specialised STEM and non-STEM work.
The majority chose their current job because it offered the prospect of interesting workand/or work of the type they were seeking. More practical issues such as employerreputation and job location were primary reasons for a minority but of secondaryimportance for most. Starting salary and prospective earnings were only reported as amain driver for a minority of graduates, almost exclusively male.
The vast majority had chosen their university degree courses because they wereinterested in the subject or were good at it, rather than overtly for career-relatedreasons. Before university most had little idea of how degree subjects related to careers(and felt that advice on this had been lacking). The minority with career plans at thisstage tended to be studying more ‘vocational’ subjects and were seeking STEM careers,but most believed a STEM degree would open up lots of careers.
Many had still been undecided about career direction when they graduated and delayedjob applications until after university. Their actual employment destinations often did notcorrelate simply with their direction of their career thinking prior to graduation. Significantnumbers who had applied only for STEM jobs at university ended up outside STEMemployment, while the reverse was also the case (i.e. some who had only applied fornon-related jobs ended up in STEM jobs). The majority had applied both to STEMSpecialist employers and also to graduate schemes that were operated by either STEMGeneralist or non-STEM employers.
The main reasons cited for making STEM degree-related job applications were potentialinterest at work and to make use of advanced skills, yet there was some perception thatdegree-related employment could be rather narrow. Salary and career prospects werecited by most as reasons to make applications unrelated to their degree, while most ofthose with genuine degree-related work experience did make degree-related jobapplications.

STEM Graduates in Non-STEM Jobs
142
Although the evolution of STEM graduates’ career thinking during university wasprimarily based on their course and individual personal development, the influence offamily and peers was also significant, as were the promotional efforts of major (non-STEM) graduate employers, which many perceived to be the mainstream destination forstrong graduates; some careers services appeared to support this as the ‘default’ optionfor undecided STEM graduates.
For a minority of these graduates, their particular individual circumstances were moreimportant than any strategic career-thinking, as they took into account their ownpersonal responsibilities or the impact of personal relationships; complex and somewhatunpredictable career pathways could often result.
Once in the workplace, the proportion that considered they used their degree knowledgea great deal was small, and only modest even in STEM Specialist work, but almost allthe graduates – irrespective of employment sector – used the general and broader skillsthey had gained from a STEM degree far more. Skills such as their approach toproblem-solving were highly valued by non-STEM employers, enabling some STEMgraduates to progress faster as a result.
Although interviewed within a few years of graduation, some graduates had changedjobs already, chiefly due to redundancy or to a similar but higher quality job; a few ofsuch moves resulted in a drift away from STEM employment.
Levels of satisfaction with current job and career progress to date were very high, in allsectors, although many would like more degree-related work as they expected it to bemore interesting, including some in financial/professional services who regretted theircareer direction. Few considered it feasible to re-enter STEM occupations in the shortterm even if they wanted to, not least due to the expected resultant drop in earnings, andmany did not want to because of a perceived narrowing of their work.
4.7.2 Conclusions
These STEM graduates seemed not to have any construct of a ‘STEM degree’ but viewed jobsand careers in relation to their own specific degree subject. Hence Mathematics graduatesviewed accountancy or banking as closely related to their degree, whereas Engineeringgraduates did not (within our study this would be classified as ‘related’ rather than ‘Core’ work,mostly undertaken for STEM Generalist employers). When considering degree-related jobs andcareers, these graduates had perceived STEM degree-related jobs to be somewhat lessadvantageous in terms of salary and prospects, and rather narrow, compared with jobsunrelated to their degree.
Few of the graduates had gone to university with a specific career-related rationale (such asengineering), and many of those that did realised that even more ‘vocational’ STEM degreeswould open up lots of different career directions. Although this might be expected from a sampleof graduates which deliberately focused on those working outside STEM, the low proportionswith early career ideas were very similar to those found amongst students in chapter 3. For

STEM Graduates in Non-STEM Jobs
143
many in this particular cohort, admittedly mostly high-calibre graduates working for ‘good’employers, the mainstream career direction became entry to corporate graduate schemes,mostly outside STEM Specialist sectors, which does differ from the intentions reported by moststudents. However, this does call into question any expectation that for all STEM graduates the‘default’ career direction will be into STEM careers.
The progression of their career thinking seemed to have shifted from purely aspirational early inuniversity to a combination of aspiration and pragmatism by the time of graduation; many didnot apply for jobs until after leaving university. During HE some graduates became more awareof certain issues in the labour market, some developing somewhat negative perceptions ofSTEM employment, while many responded positively to the high profile and promotional effortsof major corporate employers on campus. Issues like employer reputation, and how corporatecultures might conflict with their personal beliefs, entered their thinking, but rarely practicalissues such as ease of getting a job or location. The effect of all these influences seemed to beto encourage a higher proportion of them to make job applications unrelated to their degreethan we might have expected from the students’ career intentions recorded in Chapter 3.
Overall, there was evidence that a higher proportion of those who had been more decided (interms of career thinking) at an earlier stage progressed into STEM jobs, and conversely that theless decided they had been, the more likely that they would enter non-STEM employment. Thisseems to corroborate the trend observed in the student data. Factors such as the extremelypositive impact of work experience could also be related to this issue of how ‘career motivated’the graduates had been as students, although deeper investigation confirmed the pivotal natureof genuine work experience for many individuals in their career decision-making.
Employment sector choice therefore seemed for STEM graduates to have been largely a matterof individual choice, taking into account lots of different and rather personal factors, rather thandominated by one or two key predictable/rational factors such as earning potential, careerprospects or the image of industry, or external factors such as inability to obtain STEMemployment or a lack of jobs in their desired location.
Once in employment, there was little evidence that many of these STEM graduates would wishto change career direction within the short to medium term, as levels of satisfaction were high(probably partly a function of the sample interviewed) and the employment-related skills theyhad developed by virtue of studying a STEM degree were greatly valued by their employers,whichever sector they worked in. At the same time, those working outside STEM perceivedsignificant barriers to any ‘re-entry’ to STEM work, which they assumed would have to be at alow level and therefore much more poorly paid. While a minority regretted their career sectorchoice, and the majority would in principle welcome work more related to their degree subject(as it might be more interesting), they clearly weighed this up against the other benefits of theirexisting ‘good’ career progress, and were unlikely to change direction.

STEM Graduates in Non-STEM Jobs
144
5. Employer demand and recruitmentstrategies in relation to STEM graduatesAn employer perspective on STEM graduates and their career choices was sought as part of theresearch project, which is reported on in this chapter. Its aim was to help provide a betterunderstanding of the wider labour market demand for STEM skills, in particular outside traditionalSTEM occupations and STEM sectors, and to explore how employers’ STEM graduaterequirements and recruitment strategies might be an influence upon STEM students’ careerdecisions.
Other research has suggested that there is a mismatch between some STEM employerrequirements and STEM graduate applicants’ skills, which could be a factor behind the widelyreported recruitment difficulties that many STEM employers experience (see earlier discussion insection 2.4 and further details in Appendix A1.4). This could be a reason for some STEMgraduates, unable to find suitable STEM employment, deciding to seek employment in otherareas. Another suggestion is that some STEM students are put off applying to STEM employersbecause they perceive them to have higher entry requirements, or because they hold negativeviews about STEM jobs or careers. Others may feel they have less access to, or are excludedfrom applying for, jobs with some STEM employers (particularly larger firms) because they arenot at universities or courses that are targeted by them in their recruitment strategies. Althoughthe surveys of STEM students and graduates have explored these possibilities, it was felt that anemployer perspective would provide an additional valuable contribution to meeting the researchobjectives. In particular, the question of how much influence employers have on individual careerdecision-making, especially decisions not to take up a STEM career, could be explored. At thesame time, such a perspective could provide further knowledge about employer demand forSTEM graduates outside core STEM occupations/functions, an area highlighted as under-researched in the past.
5.1 The employer sample
The research aimed to seek views from employers in a wide range of industrial and businesssectors. The sample design was structured around the three main employer groups identified inthe scoping of the study (see earlier section 2.2 and also Appendix A, section A.2 and Table A.8which shows our sector classification). These were:
STEM Specialist employers: those seeking to recruit graduates (or postgraduates) forroles where a STEM subject degree (at Bachelor, Masters or Doctoral level) is a corecompetence. They are typically within the biotech/pharmaceuticals, engineering, IT andtelecoms, construction, energy and utilities, processing, transport and health sectors.

STEM Graduates in Non-STEM Jobs
145
STEM Generalist employers: those seeking to recruit STEM graduates where the skillsor subject knowledge gained through studying a STEM subject is seen as an advantage.These job opportunities can also be open to other graduates and a STEM degree is notusually specified as an entry requirement (although it may be stated as a preference).These employers apply STEM skills in a range of sectors, for example financial services,business consultancy, the public sector, and cultural and media services.
Non-STEM employers: those not making any distinction by degree subject duringgraduate recruitment; some of these do not see any need for STEM graduates (althoughthey may be recruiting them into general graduate programmes or jobs).
Thirty interviews and 2 discussion groups were undertaken with a total of 51 employingorganisations, which were mostly of large size. These included 15 STEM Specialists and 36STEM Generalist or non-STEM employers covering the range of sectors in Figure 5.1. Althoughwe focused on private sector employers, we also included some in the public sector but wereunable to include an employer in the education/teaching sector, which is an important STEMGeneralist employment sector for STEM graduates6.
In the interviews, we found that this sector classification worked reasonably well though theboundaries between the three groups turned out to be harder to define, and more fluid, thanexpected. We found an overlap between STEM Generalists and STEM Specialists (as shown inFigure 5.1). Those categorised as STEM Generalist employers could be seeking a variety ofspecialised STEM skills or subject knowledge for certain roles, often in very niche areas. Also,although we did not specifically seek out non-STEM employers for interview, some we initiallyidentified as possible STEM Generalist employers could as easily be seen as non-STEMemployers: they had occasional STEM needs, in very niche areas, but did not seek to recruitSTEM graduates otherwise.
6 There was a representative from TeachFirst in one of our discussion groups

STEM Graduates in Non-STEM Jobs
146
Figure 5.1 Employment sectors typically recruiting STEM graduates
5.2 Research questions for employers
Views were sought on the following:
Where are STEM graduates being sought, both in and outside science and engineeringfirms, and for what jobs?
Why are they recruited, and exactly what is being sought? Are STEM graduates recruitedfor their subject knowledge or for their broader skills? How closely aligned are STEMdegree disciplines, or other aspects of qualification, with criteria to enter certain jobs orcareer paths?
Where, and to what extent, are STEM graduate recruitment difficulties being experiencedby employers? What are the reasons behind them? Is it because of a numerical shortageof STEM graduate applicants or because applicants do not meet requirements?Are there perceived deficiencies in STEM graduates? If so, what are they? Doweaknesses lie more in the quality of their subject knowledge from degree study thantechnical abilities? Or is there a lack of other capabilities, in terms of broader personalskills or work experience?
STEMSpecialistEmployers
STEMGeneralistEmployers
Non-STEMEmployers
Area of overlapwhere specialisedSTEM skillsdeployed in STEMGeneralist employers
Utilities
Energydistribution
Air transport
Internet/IT
BiotechHigh techR&D
Construction
Telecoms
Opticaltechnology
Oil
Pharmaceuticals
Aerospace
Professional
Insurance
Human
Business
Social
Banking
Educati
Retail
Civil service
Arts,media
Local authority

STEM Graduates in Non-STEM Jobs
147
What are the recruitment strategies of STEM graduate recruiters, both in STEM Specialistand Generalist sectors? Is there a filtering-out of some STEM graduates from the potentialSTEM workforce in the way employers target their recruitment?
And why do employers think that some STEM graduates do not want to work inoccupations related to their STEM degree discipline?
The findings that follow are structured in a way that provides responses to each of the questionsposed above. However, it is first worth noting that although the discussions with employersfocused on STEM graduates, there was not a clear or consistent view among employers as towhat the term ‘STEM’ meant. While the acronym was widely recognised, some interviewees weremuch less familiar with it than others. The STEM Specialist employers were, not surprisingly, themost familiar with the term, and more of them identified correctly the disciplines it covered thanwithin the STEM Generalist and non-STEM group. STEM is not a term used commonly withinmany of these organisations, including some STEM Specialists. Rather, there is a preference forusing terms like ‘scientist and technologist’ (S&Ts) or ‘engineering or technical [staff]’, and STEMcan be seen as somewhat ‘jargonistic’. Focusing on certain disciplines within the STEM umbrellawas seen by some interviewees as more helpful for their specific requirements (e.g. ComputerScience, Engineering graduates) than using the more generic term ‘STEM graduates’.
5.3 Research findings
5.3.1 Where are STEM graduates being sought, and for what jobs?
Our interviews confirmed that a large number and wide range of employers recruit STEMgraduates. Not all of the employers were actively seeking to recruit STEM graduates. Somerecruited them into specific engineering or technical training programmes, others to generalgraduate entry programmes or directly into jobs. It was clear that STEM graduates could berecruited by almost any employer in any sector. We found the following practices in the threemain groups of employers (identified above):
In the STEM Specialists:
A STEM degree was a specified requirement for graduate development programmes orspecific vacancies; these would almost all be STEM Core jobs in our definition scheme(see section 2.2 and Appendix A, Table A.9). Specific STEM disciplines tended to betargeted by employers in their links with universities. All employers in this group hadsought to recruit STEM graduates both last and this year (2010), but some were reducingtheir current year’s intake. Two were cutting back severely; partly they said a result of therecession and partly due to restructuring in their global operations. But most employerswere aiming to keep recruitment numbers at a similar level to the previous year despitetheir more difficult business trading conditions.

STEM Graduates in Non-STEM Jobs
148
Planned recruitment intakes among STEM Specialists ranged from a handful to up to 200STEM graduates annually (see Table 5.1); most of those we interviewed had fairly modestintakes, in the 20-50 range, annually.
Most STEM graduates were recruited into graduate development programmes rather thandirectly into STEM jobs, mostly technical or engineering streams but also some towardsengineering management or business leadership. Most graduate recruits were destinedfor early careers as scientists or engineers. It was recognised, however, by many of theemployers that some STEM graduates would in the future move into other roles in thecompany, and so become non-specialists, as in the examples below.
A pharmaceutical company has traditionally sought large numbers of
chemists. Most follow a chemist career in the company, but some move into
other roles, in patenting, project management or commercial development
after a few years as ‘working chemists’.
A R&D /defence systems services business found that some of their STEM
graduate recruits who had initially been taken into technical development
programmes (for core STEM jobs) migrated into roles in commercial
functions after a few years. Their strong technical background and
understanding of the business made them very useful on the commercial
side of their business.
A global oil company recruits STEM graduates into a 2-4 year development
programme within a particular discipline or specialist engineering group. On
completion, the STEM graduates have the choice of moving into commercial
functions or non-discipline groups (like trading, or logistics) or staying in their
specialist technical group.
Many of the STEM Specialist employers also recruited STEM graduates into STEM-related or unrelated job roles, within their commercial and business functions (and sobehaved like STEM Generalists in this respect). For example, a pharmaceuticals grouphad a separate recruitment programme where it took STEM graduates into marketing andsupply functions, health outcomes and drugs regulation; and an energy company tookSTEM graduates into leadership/management development programmes where no

STEM Graduates in Non-STEM Jobs
149
degree subject was specified as an entry qualification. One such employer said it testedSTEM graduate applicants on their motivation for moving away from STEM work. Another(an energy business) might encourage a STEM graduate who applied to their commercialfunction to consider a STEM entry programme but he/she would not be rejected if theycould demonstrate well their commercial interest and other more general competencesbeing sought. In addition, there were several examples of STEM graduates beingpreferred for some non-STEM functions, discussed further in the next section.
In the STEM Generalists:
A STEM degree was seen of value to certain areas of their business. STEM graduatesmight be targeted specifically, such as for a few roles in investment banking, but generallythey were not targeted for their specific degree knowledge in the way that a STEMSpecialist employer would (as above). A STEM degree could be an advantage, and wouldbe welcomed, but it was not usually specified as an entry requirement. Nonetheless, theymight well give a steer in their on-campus presentations or applicant information, or takeSTEM graduate employees to those campus visits, to encourage students from STEMdisciplines to apply. Job roles or areas where STEM graduates were needed rangedwidely; some examples are described here:
In large financial organisations, providing technical support to the tradingdesks or to the branch networks or in business projects, as businessanalysts, support to relationship managers, project support or specialisedcomputing support.
In investment banking, on trading desks or in quantitative research andstrategy roles.
In retail organisations, providing technical support in customer services,marketing or development of new business projects, waste or environmentalmanagement.

STEM Graduates in Non-STEM Jobs
150
In Government organisations, for roles in scientific research policy,management of research projects with a technical focus, inspection functions(e.g. for nuclear or safety industry) and in IT roles.
In business and management consultancy firms, in graduate trainingprogrammes in tax, audit and advisory/consultancy services.
In museums, as ‘public educators’, researchers or contemporary scienceexhibition managers.
By TeachFirst, where STEM graduates are targeted for STEM subjectteaching roles and other secondary teaching.
However, it is worth emphasising that many of these roles can also be open to other graduates(from non-STEM disciplines) who can be equally successful in gaining employment providedthey have some technical or scientific background or expertise (but not necessarily qualified atdegree level in a specific STEM subject). Only in a few cases was there a more specific focuson a STEM degree qualification (and here the overlap with STEM Specialists was morepronounced).
Intakes of STEM-qualified graduate recruits varied from a handful to several hundred perorganisation. Several STEM Generalist employers had higher STEM graduate intakesthan most of the STEM Specialist employers in our sample, for example:
A large business consultancy firm took 200 STEM graduates (a third of theirtotal graduate intake) per year.
An investment bank took 90 annually, comprising 40-50% of their totalgraduate intake.
The technology division of a retail bank aimed to recruit around 50-70graduates per year, of which 80% were STEM graduates.
An estimate from a discussion group comprising financial services organisations indicated thatSTEM graduates represented on average around 20 to 25% of total graduate intakes. However,this ranged from 100% at one firm to almost zero at several others. Nonetheless, the very largeannual graduate intakes of some of these organisations makes them very significant in thisarena.

STEM Graduates in Non-STEM Jobs
151
While we obtained numbers from some of our interviewees, many we spoke with could notprovide figures on the percentage of recruits who were STEM qualified – ‘it’s not a piece of dataof value to us’ as one commented.
In Non-STEM employers:
Whilst STEM graduates could be recruited, sometimes in large numbers (although nospecific data were available to check this), such as in retail businesses or public sectororganisations, little or no effort was put into attracting them or targeting them atuniversities. Degree discipline was not a criterion of relevance to these employers.Rather a ‘good degree’ was sought, usually at least a 2.1, and in a few cases we found aminimum of 360 UCAS points also being required. Other attributes and capabilities of amore generic kind, relating to intelligence, attitude, analytical skills, communication andso on, were of more importance for most of their job vacancies. The exception might bein their IT functions where an IT degree might (although not always) be required, or anoccasional STEM graduate might be sought for a technical role (depending on therespective proportions of these roles, in some cases they could alternatively beclassified as STEM Generalist). Another example of this was in a local authority whereSTEM graduates were recruited into finance jobs (although not sought specifically) but italso liked to have some graduates with STEM backgrounds enter its managementstream to provide a balance of skills/approaches. But in general, focusing graduaterecruitment on specific disciplines (STEM or otherwise) was seen as of little value. Infact some saw it as counter-productive if it narrowed the potential pool of applicants orwent against the openness of the organisation’s resourcing policy. A large mediaorganisation commented: “Some of the competencies used in recruitment may availthemselves to STEM skills but the process deliberately focuses on a range of skills,experiences and attitude, and thus subject preference is not that relevant. There can bea preference for people with good maths and technical ability but also well rounded anda broad perspective”
We found a similar attitude in a public organisation engaged in audit and tax, wherethere was not seen to be a need to target STEM disciplines. It sought high levels ofnumeracy skills in graduates and attracted many STEM graduates, especially inmathematics, for that reason. Equally, many STEM graduates were likely to besuccessful in getting through its selection processes. However, a wide range of otherskills were tested for – verbal, logical as well as numerical reasoning, communicationand behavioural skills – and STEM graduates often did not have any particularadvantage with these.
Thus, the interviews confirmed that STEM graduates can be recruited by a wide range ofsectors to an equally wide range of jobs. A distinguishing feature is that some enter jobs wherea degree discipline is seen as a core competence, where their STEM core knowledge and skills

STEM Graduates in Non-STEM Jobs
152
are crucial (and fundamental). These are mainly in STEM Specialists but could also be nicheoccupational positions in STEM Generalists or even non-STEM employers. Others are recruitedto jobs where their STEM knowledge and skills can be applied more broadly along with theirother (employability) skills. The latter are typically STEM Generalists where the capabilitieswhich have been developed in their degree study such as problem-solving and analytical skillsare strongly valued. In the third group, the non-STEM employers, in the vast majority of casesthe degree discipline is of little relevance at recruitment but STEM graduates may have thegeneral competences (employability skills) to be successful

STEM Graduates in Non-STEM Jobs
153
Table 5.1 Employer annual graduate recruitment requirements, and examples of disciplines
Sector Number of
recruits
STEM disciplines
Utilities 15 12 Mechanical, Electrical or Chemical
Engineering; 3 Design Engineering
Energy
generation and
distribution
34 20 Engineering to engineering management
programme, 2 IT graduates and 12
Engineers, mainly PhDs/masters, to R&D
centre
Air transport 20-30
annually
5-10 Engineering graduates
15-20 IT graduates
Internet/IT
services
supplier
40 -50 Approx 40 Computer Science graduates plus
a few Mathematics graduates
Plant sciences 15 15 postgraduate chemists
High tech R&D
services
100 Computer Engineering, Mathematics,
Physics, Statistics; Electronic, Aeronautical
and Electrical Engineering
Construction 150 Mainly Civil, Mechanical and Building
Engineering graduates, and a few scientists
Telecomms 150 Computer Science and IT-related degrees
Optical
technology
1-2 Very relevant discipline (in optics)
Oil 150 Engineering and science, including a few in
very specialist disciplines like petro-physics
Pharmaceuticals 200 Mainly Chemistry graduates
Financial
services
50-70 80% in STEM
Business
services
650 approx 200 STEM

STEM Graduates in Non-STEM Jobs
154
5.3.2 Why are they recruited and what is being sought?
In STEM Specialist employers and for core STEM jobs, the reasons for recruitment of STEMgraduates were clear and obvious. They were sought for their higher level engineering, IT orscientific knowledge and skills. Often recruited into graduate technical developmentprogrammes, they are generally seen as part of the future talent pipeline of their organisation,destined for careers as technical specialists or technical or general managers.
In the other employers, the reasons for taking STEM graduates were less clear and morevaried. Two main groups were identified – one where their degree (subject knowledge) wasseen as useful, the second where it was their skills that were – and for some employers it wasboth. So, there are some job roles or functions where a background in engineering, IT orscience is required, such as in the technology unit of an international consultancy, or in defenceprocurement in Government, or an engineering team within a local authority; and a relevantscience or technical degree is needed for these. But in others, the degree subject matters lessor not at all, rather it is the skills of the individuals which are of value, for example in businessconsultancy or general management. A STEM degree can indicate to employers that they haveskills being sought, in particular their numeracy and analytical skills. However, having goodnumeracy skills is often not sufficient. We heard from several employers about weaknesses ofgraduates generally in personal and behavioural skills (confirming points highlighted in othergraduate research, see Appendix A, section A1.4), and this seemed to apply equally to STEMand non-STEM graduates. One exception was a quarrying/mining firm where STEM graduateapplicants were often seen as weaker than others in communication skills, and such skills wereimportant in their commercial or management development programmes.
5.3.3 How much do STEM disciplines align with job needs?
We found a varied set of views, mainly from STEM Specialist employers, when asked if aspecific STEM degree subject was specified or preferred. Some specified particular degrees intheir recruitment information, such as Mechanical, Electrical or Chemical Engineering, Physics,analytical Chemistry or Mathematics for particular jobs/roles. In those cases a fairly tight matchexisted (e.g. in aircraft engineering, or electricity generation). But we also found examples ofbroader or more flexible requirements, where degree discipline was less closely aligned with jobrole. In these, applicants from any engineering discipline or a range of science and engineeringsubjects could apply for the vacancies. Some examples of disciplines sought, mainly by STEMSpecialist employers, are shown in Table 5.1.
In one particular case, an IT company, the match between degree and job to be filled was seenas very tight: only graduates from particular degree courses where core IT and computingcompetencies were known to be developed were considered. Similarly, an energy company hadidentified a number of courses which provided specific content that they were increasinglyinterested in, so would be only recruiting from there in the future. More often though, there were

STEM Graduates in Non-STEM Jobs
155
preferences for recruits in specific disciplines or from certain courses but employers would beprepared to recruit from other relevant subjects/courses, for example:
An energy company preferred Electronic or Electrical Engineering but almost anyEngineering course would be considered depending on how much it had anelectricity/energy focus.
An oil company recruited from a range of STEM disciplines but with a biastowards Engineering for many of their recruits. Some Physics or Mathematicsgraduates could enter some of the more specialist areas like petroleumengineering or drilling. It had 17 sub-disciplines in engineering and four sciencespecialisms, so a huge variety of jobs were open to STEM graduates from arange of subjects.
A city bank preferred Mathematics, Physics, Computer Science or ManagementInformation Systems (MIS) but considered others (provided that they had a 2.1or better).
A pharmaceutical company recruited STEM graduates into its commercialfunctions where some jobs needed degrees in specific science disciplines, forexample in Chemistry process development, Chemo-metrics, Physical Chemistry(particles), Bio-engineering, Pharmacology, and Statistics. But alongside thesewere other jobs in functions open to any science-based graduate.
Many industrial firms had an expectation that Engineering graduates would become charteredand so they recruited only from courses recognised by the relevant professional body (this didnot seem to apply as much to science degrees).
We found far fewer examples of very specific STEM degree subjects being sought by STEMGeneralist employers.
Disappointingly for our research objectives, very few employers could give numbers of recruitsfrom individual STEM degree disciplines (unlike for STEM as a whole, where most of the STEMSpecialists could give numbers, though few other employers could). Only a few employers,mostly STEM Specialists, kept details of degree disciplines of their graduate recruits, andusually this was where they targeted specific disciplines. A few larger employers with goodmanagement information infrastructures kept degree discipline details for monitoring purposes(of their graduate recruitment processes and policies), including a public services agency and a

STEM Graduates in Non-STEM Jobs
156
large business consultancy, but they could not provide us with the data for individual STEMdisciplines.
5.3.4 Skills being sought
When asked about the skills sought, again views varied between employers:
The importance of academic excellence in engineering and science fields was stressedby most STEM Specialist recruiters; having a sound grasp of the fundamentals ofEngineering and Physics was seen as very important. This was tested for quite carefullyin selection processes.
Academic and technical excellence was seen by some STEM Specialist employers asmore important than having good ‘soft’ (or employability) skills. Equally there were otherswhich stressed the importance of graduates having a range of such broader capabilitiesalongside a strong technical academic record. Many of our interviewees, both STEMSpecialist and other employers, used corporate skills and behavioural lists in graduateselection (in assessment centres), and applied this testing to STEM graduate applicantsas well as others. Their ‘skills’ priorities varied, but tended to include: team-working,applying their technical knowledge, drive and resilience, ability to deliver results,business focus, interpersonal skills and future leadership potential.
One employer in the science education sector had communications skills as its priority –‘they have to be able to talk about science but not in too detailed a way and alsounderstand what communicating science to the general public means’’. A number ofothers valued numeracy, analytical and problem-solving skills, which tended to be harderto find in graduate recruits generally. STEM graduates were thought more likely to havestrengths in this area and so could be at an advantage over others in getting throughselection processes. However, this seemed to apply mainly to STEM graduates from the‘top’ universities or certain courses where employers said that they were more likely tofind what they considered to be better applicants.
Some roles into which STEM graduates were recruited are highly quantitative ones(such as financial modelling in global banking) so those who have very strongmathematical skills are especially sought for them, but this did not mean they had tohave a Mathematics degree in all instances.
One STEM Generalist employer commented on how some STEM degree coursesdeveloped a structured way of studying which was beneficial when applying for businessconsultancy posts. Another with a similar view (a global investment section of a bank)targeted Engineering and Mathematics graduates ‘because of the way they are used tostudying; they think in structured ways, are familiar with the kind of complex models weuse, are analytical and used to the language we use (some Economics graduates wouldbe too)’.
STEM Graduates in Non-STEM Jobs
157
Some of the public sector employers felt that STEM graduates brought ‘an enquiringmind, the ability to spot trends and to highlight issues’ or had an ‘organised mind’ whichhelped contribute to round-table policy discussions.
For a number of employers (STEM Specialists and others) intellectual capability was animportant requirement, and they specified a minimum of a 2.1 and high A-level results totry to achieve this in their recruitment, rejecting any lower qualified candidates at initialstages of selection. Several STEM Specialists asked for Mathematics and Physics at Aor B grade at A-level.
Several STEM Specialist employers also sought knowledge of particular specialisms, orvery specific skills and knowledge (in, say, Software Engineering, or Mathematics).Overall, however, there was generally less interest in graduates who had taken veryspecialised STEM degrees.
Postgraduates were thought often to bring more independent thinking than first degreegraduates, and the ‘latest thinking’ or contacts in fast-developing areas or new practicaltechniques, so were highly valued generally by many employers.
5.3.5 Preferences for particular qualifications or institutions
As well as having a preference for specific STEM disciplines for certain job roles (although inothers there can be some flexibility), we found also a growing preference among someemployers, especially STEM Specialists, for Masters graduates (MEng or BEng with Masters).This appeared to be because of higher skill needs and their search for high quality and highercapabilities in graduate recruits.
Focusing recruitment towards M-level graduates was a trend seen more in Engineering than insciences where intakes were generally still fairly mixed between BSc and MSc qualifications.Several ‘scientific’ firms had always had specialist roles to fill, where a Masters or PhDqualification in a specific scientific area was required (and definitely seen as an advantage) butalso some where there has been a shift towards higher qualifications. For example – ‘We havemoved significantly away from graduate recruitment and now recruit more PhD students thanother graduates or postgraduates …the industry [pharmaceuticals] has moved radically, and thechallenge is now to ensure that universities recognise this and keep pace’
We also found examples where boundaries between graduate and postgraduate qualificationswere becoming increasingly blurred – “we recruit the best we can get”. For some, however, thisdid mean a trend towards recruiting more at postgraduate level; while others were recruitingacross the spectrum of skills from technician to postgraduate. Several had developed a strongfocus of ‘growing their own talent’, such as investing in technician and foundation engineerprogrammes to fill short- and long-term skill gaps and encouraging progression to charteredstatus.

STEM Graduates in Non-STEM Jobs
158
Most employers (both STEM Specialists and others), and especially all the larger firms, hadpreferences for particular universities and courses. Although they had such preferences, andalso targeting strategies on particular universities, this did not preclude students from otheruniversities applying to them, usually via their websites (all had online recruitment). Most hadmultiple recruitment methods – their own website, agencies, advertising in careers magazines,Facebook, targeted recruitment activities, via alumni networks, research partnerships, workplacements and so on. Placements were seen by several as the best way to recruit futuregraduates as they provided exposure of the industry to students and the company could identifypotential recruits. One large pharmaceuticals company also spoke about placements being ‘anexcellent investment opportunity for upskilling in SMEs in the pharma supply chain’. Another (inutilities) used their placement schemes also to encourage first degree graduates to considerMSc programmes and also to encourage A-level students into their field.
A greater amount of marketing effort is generally put into employers’ ‘target’ universities and, insome cases, senior executives get involved in events and sponsorship programmes to increasethe company’s profile. The ‘target’ universities are chosen usually for a number of reasons,including ‘quality’ (as measured by UCAS entry points, research ratings, league tables andaccredited courses), overall size, and quality of previous recruits. Location could be an addedfactor for some national firms with a branch network where they experienced local recruitmentdifficulties. Some of the large scientific and engineering companies have developed strategicrelationships with a few universities to foster both recruitment and research links.
STEM Specialist firms invested much more in targeting certain STEM departments or courses toencourage applicants than did other employers. They also tended to use their academic contactnetworks and alumni to undertake more informal marketing and identify potential applicants(though some STEM Generalists did so too, to fill particular niche roles, e.g. in investmentbanking). In smaller organisations, STEM graduate recruitment might be more by chance ratherthan specifically sought, through agencies or by job advertisement.
5.3.6 Where are the STEM graduate recruitment difficulties and why?
Employers’ difficulties in filling their vacancies for STEM graduates from UK universities, withsome increasingly looking overseas even in the current recessionary times, have been widelyreported (BIS, 2009a; CBI, 2010; HEFCE, 2010, see also Appendix A1.4). So, it was notsurprising to find confirmation of STEM graduate recruitment difficulties in our research, thoughthis came almost exclusively from STEM Specialists. Few such problems affected STEMGeneralists.
For many employers, the root of the problem was a perceived lack of supply of STEM graduatesfrom UK universities of the calibre they required. It was therefore not so much a problem ofnumerical shortages per se but more a quality problem that many experienced. They felt thatthere was too much variation in the quality of STEM degree output and insufficient numbers of

STEM Graduates in Non-STEM Jobs
159
STEM graduates applying with the required level of skills and knowledge. Often it was too fewapplicants from (what they viewed as) the ‘right’ kinds of STEM courses or with the subjectknowledge that was required. Others put more emphasis on how courses at many universitieswere not sufficiently relevant to their business (the latter particularly for IT employers). Yetothers spoke more generally about wanting more of the ‘better’ graduates.
Weaknesses of many graduates in their core disciplines along with their lack of fundamentalscientific and technical knowledge, relevant to their business, was highlighted as an issue, forexample:
An oil company interviewee spoke about its interest being in core engineeringand science disciplines, not in the very specific undergraduate courses in, forexample, emerging technologies or with a sustainability focus, which are verypopular with potential students and some universities.
An IT employer commented similarly, saying that too much was being driven bystudent demand and not employer demand – ‘courses in UK are offered tostudents as enjoyable experiences – to be fun at the expense of hard graft oflearning the core, quantitative subject that employers want. Other countriesproduce better graduates because they concentrate on more traditional teachingof fundamentals of these hard technical subjects.’
A computer games industry interviewee commented on there being over 40degree subjects offered in the games area, while it, and similar employers:‘needed Software Engineering, Computer Science and perhaps Mathematics –traditional STEM courses, and not ‘games’ courses.’
An engineering business spoke about how crucial it was that universities taughtMathematics and Physics fundamentals – academic excellence was the firstbenchmark in their recruitment, employability skills came second (though theysaw them as necessary to distinguish between candidates beyond their technicalcompetence).
Having a degree programme approved by a professional body was a necessityfor most engineering companies and some scientific roles, for example – ‘abouthalf the students graduating in chemistry do not have their programmesaccredited by the Royal Society of Chemistry – this halves the talent pool fromwhich we recruit’ commented a major pharmaceuticals company director; whilean energy supply company said: ‘we want Engineers for chartership so theyneed to be from courses recognised for that by professional bodies’.

STEM Graduates in Non-STEM Jobs
160
Perceptions by students that an industry sector is relatively unattractive to work in was an addedproblem for several employers, for example ‘The oil and gas industry has an unattractive image,off-putting, not glamorous. It is a problem despite us paying high salaries (though not as high assome investment banks)’, while another commented: ‘students that come out with Engineeringdegrees are not interested in engineering; it’s really difficult to attract them into our sector(energy supply and distribution). Those that apply often want to take our corporate programmes.This is because they don’t know enough about the engineering opportunities that we have andour industry - our own research has told us that they want to go broader. We are at the cuttingedge (e.g. in environmental work, climate change) but they don’t seem to know this… we can’tget it across that it is an exciting business’.
The apparent, relative ignorance about STEM jobs and lack of industrial experience of manySTEM students was a recurring theme in comments from employers. Many felt STEM studentsoften did not have a clear view of what working in an engineering or technology company wouldbe like and so they had to spend more resources on raising awareness of the opportunitiesavailable. Student expectations could be unrealistic, for example: ‘many students do not have aclear view of what their working life will be like, have really no idea, they don’t realise thatworking in marketing is not all about PR but business analysis; these careers are seen as moreglamorous than they really are’ and (from a health sciences employer) ‘they expect exciting jobsbut much of research is not, a lot is automated and is hard work’.
STEM Generalist employers were likely to experience STEM graduate recruitment problemsonly where supply was relatively ‘thin’, for example in a very specialist area, or where acombination of high calibre (intellectually and technically) and the ability to apply degreelearning in the business was needed, or where location was a problem (e.g. in some regionaloffices of a large consultancy organisation). One bank found that IT graduates did not perceivethem as a ‘challenging assignment’ and found such graduates preferred to apply to ITcompanies rather than take up their opportunities in technology roles in trading desks, platformsetc. ‘Students do not understand that banks offer these types of positions – and the recessionhas left many thinking there are no jobs in banking or little job security’. Although STEMGeneralist and non-STEM employers had few or no problems relating to the number of STEMgraduate applicants they received, several said they would like more, especially Engineering,STEM graduates in financial and business services (for their problem-solving skills).
5.3.7 Are there perceived deficiencies in STEM graduates?
As highlighted above, some employers (mainly STEM Specialists) identified deficiencies in theskills of STEM graduate applicants as a reason for their recruitment problems. These tended tobe similar to those raised by other research (reported in Appendix A1.4) but more emphasis wasput on deficiencies of a technical and academic nature than behavioural (though someperceived that both existed) in our research. In the main, STEM Specialists spoke ofweaknesses in the core discipline knowledge of many STEM graduate applicants and a lack of

STEM Graduates in Non-STEM Jobs
161
fundamental knowledge of engineering and science. As highlighted above, several hadconcerns about the relevance of some of the courses being run at some universities, relating toComputer Science in particular.
While technical competencies dominated the discussion about deficiencies in the supply ofskills, there were also concerns expressed about STEM students lacking broader skills,although such deficiencies were less significant for most. Communications, team-working, timemanagement and organisational skills were most frequently mentioned (as being lacking inmany applicants with first degrees in STEM, and more so at PhD level). An engineeringcompany, for example, mentioned the challenges of today’s industrial research which needs anintegrated skills set that is both multi-disciplinary and multi-natured – a project could involvegraduates from conception through to design, testing, manufacture, delivery and support. Theyfound that PhDs with a narrow range of capabilities were not suitable, but Eng Docs often hadthe right combinations of technical capabilities and industry ‘know how’. Another said that he didnot expect commercial and business experience as much as good communications skills ingraduate entrants (as they could train for commercial capabilities), but this comment was morean exception to the general rule.
A few spoke about specific deficiencies, for example, a lack of mathematical expertise amongchemists – ‘something like 50% of Chemistry graduates do not have A level Maths yet it is amust to get top grades in Chemistry at university...there is a serious divide between thosestudents with both the capabilities and the right qualifications and those who really struggle oncourses not accredited by the RSC which do not require Maths A level’, a majorpharmaceuticals recruiter had observed.
The STEM Generalist employers, when asked, tended to put more emphasis on deficiencies in‘soft’ skills of STEM graduates than did STEM Specialists. This seemed to apply to IT graduatesmore than others. For example, a major IT company said – ‘technical qualifications are a given,what we seek is cultural fit’. The consensus of our discussion group with public sectoremployers was that STEM graduates needed to work on developing their communication skills.Other STEM Generalist employers also highlighted deficiencies here and many felt that theywere greater in STEM than other graduates. However, there was a general criticism of allgraduates’ broader employability skills in general, and some employers felt that STEMgraduates were no different from others in this respect.
5.3.8 How do employer recruitment strategies affect students’ career decisions?
Most graduate recruiters, and especially the large ones, have a range of recruitment methods inplace including a targeting strategy on particular courses, universities and/or types of students.But this does not preclude other students (not in the targeted coverage) from applying as theygenerally run on-line recruitment via their websites.

STEM Graduates in Non-STEM Jobs
162
Criteria used to select their core or ‘target’ university/department/course list usually includeduniversity performance, size, and the performance of previous graduates recruited, but couldalso include other specific requirements. The ‘select’ group of universities would then be theones where more resources are put into attracting and recruiting students through campuspresentations, sponsorship or other activities, or where the employer might focus its workplacement offers (see above). The tendency in most of our interviewees was to haveuniversities with high A-level entry requirements on targeted lists, including most of the RussellGroup, but some included also certain other universities with particular STEM specialisms,centres of excellence or research links. The number of institutions targeted tended to bebetween 8 and 20; a few had more where particular courses at the universities were targeted.Both STEM Specialist and Generalist employers targeted STEM graduates but such targetingwas most actively pursued by STEM Specialist employers.
All employers we spoke with saw clear benefits in targeting in this way as part of theirrecruitment strategies. Although some were aware they might be seen as ‘elitist’ in their choiceof target universities, they did not feel they that they were excluding other potentially appropriatecandidates from applying through their open application system. They aimed to get more,stronger applicants by their targeting strategies, and this was backed up by their own research.So although large numbers of STEM graduates are being produced by non-targeteduniversities, there was no evidence from the employers we interviewed that they thought theirrecruitment methods might be filtering-out appropriate candidates.
5.3.9 Why do some STEM graduates not want to work in their STEM degree discipline?
Finally, we present views of employers as to why some STEM graduates are not seeking tofollow careers in STEM.
It is worth saying first that several employers, in IT and engineering in particular, did not see thequestion as relevant – ‘losses’ at the graduation stage were not a significant problem as theyexpected most graduates in these disciplines to enter a STEM job. Rather, their key concernwas at earlier educational stages: they wanted more young people to choose to study IT orEngineering degrees so as to increase the first degree output and also improve the feedstock ofpeople potentially interested in higher STEM qualifications.
However, the majority of employers acknowledged the ‘losses’ of highly able STEM studentsinto other employment sectors and non-STEM work after they graduate and, for STEMSpecialists in particular, this did negatively impact on their own recruitment. Nevertheless, therewere some, mainly STEM Generalists and non-STEM employers, who saw benefits in a widerrecruitment of STEM graduates across the economy and society as they brought valuable skills– for example ‘a client of an IT firm with a good technical grasp can lead to a more profitableand productive relationship for the IT supplier’.

STEM Graduates in Non-STEM Jobs
163
The employers perceived two main reasons for STEM graduates moving away from theirdegree discipline:
The greater attractiveness of working in other sectors, due mainly to higher salaries thatstudents expected to get (especially in financial and business services), especially earlyin careers, and also due to the perceived ‘glamour’ of City businesses (the attraction ofbeing a trader, for instance); and.
A lack of knowledge amongst many STEM undergraduates about what engineers orscientists really do and what their career progression might be like (in contrast to otherprofessions such as lawyers or doctors where they felt a lot more is known).
These two reasons were cited almost equally by STEM Specialist and other employers, thoughthere was some speculation about the current strength of the first as there were doubts that theCity would have a continuing strong ‘pull’ due to the recent banking crisis and ‘fall-out’ from therecession. Several STEM Specialist employers commented on increases in applications theywere receiving this year as an indicator of this, backed up by their own research amongstudents. However, the lure of ‘making a lot of money very quickly’ in the City, was stillperceived to feature, albeit by fewer possibly than in the past.
Some of the STEM Specialists were taking steps to address the first issue (and the second too,as they are seen as linked) by improving their own sector’s acknowledged poor image. This wasbeing attempted through increasing their presence on campuses, attending specific engineeringand science events, or engaging more directly with academic staff to educate them on theopportunities open to undergraduates and postgraduates. Accessing students at an earlier ageto inform them of the career options they have as STEM graduates was seen as an importantactivity to help with the second reason – ‘once we get to the stage where we are recruitinggraduates we can only be reactive due to the fact that the choices around education havealready been made…our graduate community have supported some of the events to engagewith younger students …I have spoken to many candidates in the past who don’t know howtheir academic choices align with our opportunities and as such don’t apply’, commented arecruiter in the energy sector.
Some other reasons were suggested by a few employers for STEM graduates not seeking toenter careers within STEM industries:
A desire to develop a career within a broader field of opportunity and not be restricted totheir initial choice of their degree. For example, an investment bank had noted ‘some ofthe brighter STEM graduates can see that a spell in financial services can involve themin developing other valuable non-technical skills for future career development’;
Possible disillusionment with their STEM subject; The attractiveness of a more structured CPD system, leading to a further qualification,
being offered in other sectors (such as accountancy);

STEM Graduates in Non-STEM Jobs
164
Greater job security or a feeling of ‘doing something for the common good’ in the publicsector;
Better conditions of employment, such as more flexible working hours, or a specificlocation – ‘money isn’t the only determinant as to where they apply for jobs’ commenteda director of a technology division of a financial company.
There was no support from employers for the view that work experience placements might putpeople off a STEM career if they found out about the ‘more boring’ bits of being an engineer orscientist.
5.4 Summary and conclusions
The research confirmed that a wide range of employers recruit STEM graduates. Ourcategorisation of employers into three groups worked reasonably well in helping to distinguishdifferent kinds of employer demand for STEM skills but the boundaries between the groups canbe ‘fuzzy’ in places and there is overlap between STEM Specialist and STEM Generalistemployers relating to certain needs and job roles.
Those employers that are more targeted in their approaches to securing the skills they needtend to be the STEM Specialist employers which recruit graduates for STEM Core jobs (usuallyinto a graduate development programme). After a period of time, some of these graduateswould move to STEM-related or unrelated jobs as their careers progress. Many STEMSpecialists also recruit STEM graduates directly into STEM-related or unrelated job functions.
A range of job roles or functions were identified as likely to be filled by STEM graduates inSTEM Generalist employers, from investment banking to education, and from commercialfunctions to public policy and administration. Many of these were also open to other graduates;although STEM degrees were frequently welcomed, in only a few places was there an apparentspecific need for a STEM degree qualification. Additionally, STEM graduates were recruited byother employers (non-STEM) where the subject of degree qualification is of little relevance.
Reasons why STEM Generalist and non-STEM employers recruited STEM graduates variedand were sometimes rather vague (in contrast to the STEM Specialists). For some, therelevance of degree subject was important for certain job roles, while in others STEM graduates’skills were valued more, especially their expected numeracy and analytical skills. As a generalrule, it was the ability to apply STEM knowledge and skills more broadly, along with other(employability) skills, which was most highly valued. This is in contrast to STEM Specialistemployers where it is generally the STEM core competences that are required and valued most.
The ‘tightness’ of match between STEM degree discipline and jobs to be filled varied; some(mostly STEM Specialists) have preferences for graduates from particular degree courses ortypes of courses to fill certain STEM Core jobs, while others have STEM Core and related jobs

STEM Graduates in Non-STEM Jobs
165
open to graduates from a range of STEM disciplines (both STEM Specialist and Generalistemployers).
Academic excellence in science and engineering was seen as a key requirement by most STEMSpecialist recruiters. Equally, it was important for some specialised functions of STEMGeneralist and other employers. Some STEM Specialists considered this a more importantrequirement than having good broader behavioural skills, but others felt both were required.There was some evidence that STEM Generalist and non-STEM employers were more likely tofind numeracy, problem-solving and analytical skills in STEM graduates than in other graduates.These are skills increasingly being sought generally and are seen as ‘harder to find’ in newgraduates. This would give a STEM graduate an advantage in a competitive employmentmarket.
The interviews confirmed much of the existing research evidence on STEM recruitmentproblems. They were mainly being experienced by STEM Specialists which perceiveddeficiencies in some STEM graduates’ technical ability and subject knowledge, and in somecases also in their lack of business awareness. STEM Specialist employers were more critical ofweaknesses in STEM graduates’ core discipline knowledge and lack of relevance to theirbusiness than STEM Generalists, many of which seemed not to have graduate recruitmentproblems. Some STEM graduates were seen though, by all types of employers, to lack thebroader behavioural skills being sought by all graduate employers, in particular team-working,communications and time management/organisational skills. An additional problem for someSTEM Specialists is their relatively unattractive image as an employer or working environment.In some cases, this perception arose from a lack of up-to-date knowledge about STEM jobs andworkplaces among many STEM graduates.
We did not identify many specific problems associated only, or more with, certain individualSTEM disciplines. However, there were clearly some differences between disciplines wheresome issues were more relevant or significant. It is not easy to generalise from our sample aswe found a diverse range of views, often contrasting, among employers. However, on thewhole, IT employers had greater concerns about the relevance of university Computer Sciencecourses, while engineering and scientific employers were concerned more with simply gettingadequate numbers of high-calibre graduates.
Targeting certain institutions or degree courses is part of most large firms’ graduate recruitmentstrategies. Though it may appear as potentially narrowing the pool of STEM-qualified applicants,employers did not see that this had a significant effect on outcomes. Rather, it helped them tofocus better on the kinds of graduates they wanted to attract, and compete with other recruiters(often in non-STEM) and they were content that their on-line recruitment processes providedgraduates from other institutions with access to vacancy information and their applicationsystem. However, it is almost inevitable that such graduates would not be as fully informed
STEM Graduates in Non-STEM Jobs
166
about job opportunities, or how to present their application to the company, as those in thetargeted institutions or courses.
Employers were actively working with schools and selected universities to try to improve STEMstudents’ and potential STEM students’ knowledge of STEM careers, and some STEMSpecialists in particular were increasingly doing so at earlier education stages, well beforedecisions about university entry were taken.
The majority of STEM Specialist employers were concerned about potential losses of STEMgraduates from STEM Core functions to other employers and unrelated jobs, and its negativeeffect on their ability to satisfy their recruitment requirements; the STEM Generalist and otheremployers were more likely to see economic benefits in the wider dispersion of STEMgraduates. Two main reasons seen by employers as reasons why STEM graduates did not stayin STEM were the perceived greater attractiveness of careers outside STEM, mainly in terms ofexpected higher salaries, and the graduates’ lack of knowledge about careers in STEM Corefunctions.
Thus, in conclusion, the employer strand of the research has provided some new insights intothe demand for STEM graduates, especially in areas outside STEM Specialist employmentwhich is the focus of much of the existing evidence on STEM demand. It has also confirmed thatdeficiencies in some STEM graduate applicants are seen as a key problem, especially forSTEM Specialists seeking to fill core STEM jobs, as it has the effect of reducing markedly thepool of potentially ‘recruitable’ STEM graduates. This could well be an additional reason whySTEM graduates might apply to enter non-STEM jobs instead (as has been suggested, seesection 2.1), either failing to succeed in recruitment processes or filtering themselves outbeforehand on the basis of a job specification.
The STEM Generalist sector offers a range of employment opportunities for STEM graduates,including work for some large and very prestigious employers, some of which are seen bystudents as being more attractive than the work or environment that STEM Specialist employerscan offer. Some, though not all, are likely to pay more. This is another factor affectingrecruitment to STEM Core jobs. Additionally, many STEM graduates have higher levels ofcertain skills, in numeracy and problem-solving, which are generally in high demand across theeconomy. STEM graduates can add value to many businesses so are in demand in manyareas.
These are clearly strong ‘pull’ factors away from core STEM work. However, it seems that manySTEM graduates lack awareness of the range of career opportunities that exist within the STEMworld, in today’s fast-moving, fast-changing high-tech engineering and science environment,both in the STEM Specialist sector and in STEM core roles within STEM Generalist employers.This is something that many of the large STEM Specialist employers are increasinglyaddressing, especially in earlier education stages and through their careers work in schools, but

STEM Graduates in Non-STEM Jobs
167
wider efforts are needed. Our interviews have focused mainly on the larger recruiters who havethe resources to compete in the graduate market and to get their message over to graduatesand students about the jobs and careers they offer. Despite their size, many struggle to do so. Itis inevitably much more difficult for the myriad of smaller firms, which form a large part of theSTEM demand, to get their message to market, and also to show potential recruits that theyhave worthwhile jobs for which to apply.

STEM Graduates in Non-STEM Jobs
174
ReferencesABPI (2008) Skill needs for Biomedical Research, Association of the BritishPharmaceutical IndustriesAGR (2009) The AGR Graduate Recruitment Survey 2008: Winter Review (andSummer Update survey, 2009), Association of Graduate RecruitersAGR (2010) The AGR Graduate Recruitment Survey 2009: Winter Review (andSummer Update survey, 2010), Association of Graduate RecruitersBIS (2009a) The demand for STEM skills, (produced by DIUS, Department forInnovation, Universities & Skills), January 2009BIS (2009b) Innovation Nation, Department for Business, Innovation and Skills, March2009BIS (2009c) New Industry, new jobs: building Britain’s future, Department forBusiness, Innovation and Skills, April, 2009BIS (2009d) Higher Ambition: The Future of Universities in a Knowledge Economy,Department for Business, Innovation and Skills, October 2009BIS (2009e) Who is heading for HE? Young people’s perceptions and decisions aboutHE, by IES for Department for Business, Innovation and Skills Research paper No.3,September 2009CBI (2009a) Stronger together: businesses and universities in turbulent times, reportof the Higher Education Taskforce, Confederation of British Industry, September 2009CBI (2009b) Emerging stronger: the value of education and skills in turbulent times –Education and skills survey. Chapter 6. Confederation of British IndustryCBI (2010) Ready to Grow: buiness priorities for education and skills – Education andskills survey, Confederation of British Industry, March 2010CEM (2008) The Relative difficulty of Examinations in Different Subjects, DurhamUniversityCEI (2009), Lengthening ladders, shortening snakes: embedding careers awarenessin secondary schools, Centre for Education and Industry, University of WarwickCEI/University of Derby (2010) STEM careers awareness timelines: attitudes andambitions towards STEM of year 7 and Year 9 students, further analysis, July 2010CIHE (2007a) International competitiveness and the role of universities, (by RichardBrown), Council for Industry and Higher EducationCIHE (2007b) Review of STEM skills, (by Hugh Smith), the Council for Industry andHigher EducationCIHE (2009) The demand for STEM graduates: some benchmark projections (by IER,Warwick), Council for Industry and Higher EducationCIHE (2010) Talent Fishing: what businesses want form postgraduates, a report toDepartment of Business, Innovation and Skills, March 2010Cogent (2008) Higher Education and the Cogent workforce: Factsheet. www.cogent-ssc.org.uk
STEM Graduates in Non-STEM Jobs
175
CPHC (2008) A study of the IT labour market in the UK, Council of Professors andHeads of ComputingCRAC (2007) The Career Thinking of UK Engineering students, Careers Research &Advisory CentreCRAC (2008) Do undergraduates want a career in IT? Careers Research & AdvisoryCentreDCSF (2009) STEM career choices: Ch10, STEM Literature Review, Centre forScience Education, University of SheffieldDTI. (2006). Science, Engineering and Technology skills in the UK, DTI EconomicsPaper No.16, accessed via:http://www.dius.gov.uk/science/science_and_innovation_analysis/~/media/publications/F/file28174Donnelly J and Jenkins E (2006) ‘Educational reform and the take-up of science post-16’, in Increasing uptake of Science post-16, report of Royal Society ConferenceDyson J (2010) Ingenious Britain: Making the UK the leading high tech exporter inEurope, report commissioned by the Conservative Party, March 2010E-skills (2008) IT and telecoms InsightsE-SKILLS (2009) RESEARCHING GRADUATE EMPLOYMENT IN IT, EXPERIANREPORT (FOR HEFCE)ETB (2006) Factors influencing Year 9 carer choices, by NFER for the Engineeringand Technology BoardETB (2008a). Engineering UK 2008: Engineering and Technology BoardEngineering UK (2009) Engineering UK 2009/10 (previously known as Engineeringand Technology Board)HECSU (2008a) Stage 1 Future Track report: Applying for university: career choices ,report by Elias and Purcell, IER Warwick, for the Higher Education Careers ServicesUnitHECSU (2008b) Postgraduate study in UK 2001-2006 (published as DIUS researchreport 08.16)HECSU (2009a) What do graduates do? Higher Education Careers Services UnitHECSU (2009b) Real prospects (extracted form Graduate Market Trends, summer2009), Higher Education Careers Services UnitHECSU (2010) Real prospects 2010, Higher Education Careers Services UnitHECSU/Prospects (2009) Summaries of reports on research on Recruiting chemistrygraduates and Shaping science careers, Higher Education Careers Services UnitHEFCE (2006) Support for Strategically Important and Vulnerable Subjects, HigherEducation Funding Council for England.HEFCE (2009) Demand for subjects and skills in English HE , report by SQW forHigher Education Funding Council for EnglandHEFCE (2010) Demand for subjects and skills in English HE, report by WMEnterprises, for Higher Education Funding Council for England, RD05/10

STEM Graduates in Non-STEM Jobs
176
HESA (2007). Destinations of Leavers: From Higher Education InstitutionsLongitudinal Survey of the 2002/03 Cohort. Higher Education Statistics AgencyHESA (2009a) Destinations of Leavers: From Higher Education Institutions, 2007/08,Higher Education Statistics AgencyHESA (2009b) Students in UK Higher Educations Institutions, 2008/09, HigherEducation Statistics AgencyHESA (2009c) Destinations of Leavers: From Higher Education InstitutionsLongitudinal Survey of the 2005 Cohort, Higher Education Statistics AgencyHigh Fliers Research (2009) The UK Graduate Careers Survey 2009, Vol 1, GraduateRecruitment ResearchHigh Fliers Research (2010) The Graduate Labour Market in 2010Howard JAK & Taylor M (2008) A higher degree of concern, The Royal SocietyIER Warwick (2008) An investigation into the factors affecting post-universityemployment of chemical sciences graduates, report by Purcell, Atfield and Ball forRoyal Society of ChemistryInstitute of Physics (2009) Tracking careers of UK physics students, by the Centre forEducation and Industry, University of WarwickLichtenstein G, Loshbaugh H, Claar B, Chem H, Jackson K, & Sheppard S (2009) ‘Aengineering major does not necessarily an engineer make: career decision makingamong undergraduate engineer majors’, Journal of Engineering Education, 98 (3)LDA (2007) STEM: achieving world class skills for London, London Skills Commissionfor London Development AgencyMason (1999) The labour market for Engineering, Science and IT graduates: are theremismatches between supply and demand? , Department for EducationMAC (2008) Skilled, Shortage. Sensible: the recommended shortage occupation listsfor the UK and Scotland, Migration Advisory Committee, September 2008Milburn A (2009) Unleashing ambitions, report of Panel on Fair Access to theProfessions for the Cabinet OfficeMcCarthy and Simm (2006) Survey of employers attitudes to postgraduateresearchers, University of SheffieldNIESR (2010) Futuretrack: Part-time students’ career decision-making and careerdevelopment of part-time higher education students,. report to theHigher Education Careers Services Unit (HECSU), National Institute of Economic andSocial ResearchPollard et al. (2003) Ready SET Go: a review of SET study and career choice, byInstitute for Employment Studies for the Engineering and Technology BoardPurcell K and Picher J (1996) Great Expectations, IER, AGCAS. CSUPurcell K and Elias P (2003) Moving on: graduate careers seven years on, IERWarwickPurcell K and Atfield (2008) An Investigation of the Factors Affecting the Post-University Employment of Chemical Science Graduates in the UK, Report for theRoyal Society of Chemistry

STEM Graduates in Non-STEM Jobs
177
Roberts G (2002). SET for success, report of Sir Gareth Roberts’ Review, H MTreasuryRoyal Academy of Engineering (2009) ICT for the UK’s Future: the implications of thechanging nature of Information and Communications Technology, Royal Academy ofEngineeringRoyal Society (2006) A degree of concern? UK first degrees in science, technologyand maths, report by Howard JAK. & Taylor M for The Royal Society, LondonRoyal Society (2008) Science and maths education, 14-19, State of the Nation report,The Royal Society, LondonRoyal Society (2009) Hidden wealth: the contribution of science to service sectorinnovation, Royal Society Policy document 9/09, July 2009Royal Society of Chemistry (2008) The Chemical Skills PipelineScience and Society Expert Group (2010) Science for Careers. Final Report of theScience and Careers Group, Department for Business, Innovation & Skills, March2010Science Council (2010) http://www.sciencecouncil.org/content/chartered-scientist-csciStevens et al (2008) ‘Becoming an engineer: towards a three dimensional view ofengineering learning’, Journal of Engineering Education, 97(3)UKCES (2008) Working Futures: 2007-2017, United Kingdom Commission forEmployment and Skills, December 2008UKCES (2009) Ambition 2020: world class skills and jobs in the UK, United KingdomCommission for Employment and SkillsUKCES (2010) National Strategic Skills Audit for England: Skills for jobs, today andtomorrow, United Kingdom Commission for Employment and Skills, March 2010Vitae (2009) What do researchers do? Career profiles of doctoral graduates, CRACand Research Councils UKVitae (2010a) What do researchers do? Doctoral graduate destinations and impactthree years on, CRAC and Research Councils UKVitae (2010b) Recruiting researchers: survey of employers’ practice, CRACwww.silicon.com/technology/software Tech grads in demand (10/2/2010), based onAGR’s Graduate Recruitment Survey results
STEM Graduates in Non-STEM Jobs
178
Appendix A. Research context,methodology and samplesA.1 Context for the research
Over the last few years, a body of evidence has been accumulated through high level STEMreviews and research, by Government and various other organisations, on the demand forSTEM graduates and the extent to which the supply of STEM graduates may not be meetingemployer needs in the UK. Much of it is familiar to many but it forms an important context for ourresearch study. In particular, it contains the background evidence for questioning why someSTEM graduates are not found in STEM occupations or STEM-related work and seekingexplanations, and so the origins of our research. It has also helped in developing our researchmethodologies, especially how we decided to define ‘STEM’ and ‘non-STEM’ (discussed insection A.2).
A.1.1 Importance of STEM to the UK economy
There is a general consensus that the future UK economy is dependent on a sufficient supply ofSTEM skills. Numerous reports have pointed to the increasing importance of STEM disciplinesin underpinning knowledge- and technology-based industries and also more generally inpromoting innovation and enterprise across society (see most recently CBI, 2009a; BIS, 2009b;BIS, 2009c; UKCES, 2010,). For example, the CBI HE Taskforce report (CBI, 2009a) stated‘The UK has longstanding strengths in business sectors which need scientific, technical,engineering and maths graduates’. It also emphasised ‘value-adding arising from knowledge-intensive services’; while the National Strategic Skills Audit for England: Skills for Jobs, todayand tomorrow (UKCES, 2010) identified technology as one of the key drivers of future change,and whose impact will be widespread but especially in medical and life sciences, use of e-commerce and developments towards a low-carbon economy.
A 1.2 Demand for STEM skills and qualifications
Alongside these has been a range of other reports emphasising the importance of people as akey asset and the need for an increasingly qualified workforce in the UK. A key message of the2010 UKCES Strategic Skills Audit is that ‘there is significant demand for highly skilled workersin the labour market, with the largest number employed now and in the future as managers,professionals, associate professionals and in technical roles with associated requirements forhigher level skills’. Professional skills in the computing and software sectors, in pharmaceuticalsand medical technology, in manufacturing, and in teaching and research, and especially STEMskills, are highlighted as important skill areas (among others) which need to be increased inorder to achieve economic growth.

STEM Graduates in Non-STEM Jobs
179
The BIS (then DIUS) review of the UK’s future needs for STEM skills concluded from anextensive analysis of available data that the continued shift towards a knowledge-intensiveeconomy would increase demand for higher level STEM qualifications (BIS, 2009a).The shareof the workforce with a STEM level 4 (NQF) qualification (equivalent to degree level) wasprojected to increase from 8.2% in 2007 to 9.8% by 2017. Though there were recognised to besome difficulties making projections of future demand for STEM qualifications due touncertainties over future business prospects, and in particular projecting demand in differentSTEM disciplines, the general conclusion was that some limited growth in demand for STEMqualifications in the next decade was expected under most plausible future scenarios.
Further work by the Institute of Employment Research (IER) for CIHE and UKCES in 2009updated these forecasts (see CIHE, 2009). Demand for STEM graduates was forecast to growfaster than the average (i.e. for all graduates) over the next decade (2007-2017). At anindividual STEM discipline level, the fastest rate of growth in demand at both postgraduate andfirst degree equivalent (NQF4) level would be in agricultural and biological sciences, while theslowest would be in medicine at postgraduate level and in medicine, physical sciences andengineering at first degree level.
A number of other reports covering a range of sectors – from IT to health sciences - have alsosuggested mid- to long-term growth in demand for STEM graduates, though growth rates varybetween sectors and disciplines and there are some uncertainties surrounding them, especiallythose based on data from employer surveys.
The recent recession is likely to have had an effect on some growth forecasts. For instance, theAssociation of Graduate Recruiters reported that graduate recruitment forecasts were reviseddownwards considerably in 2009. All sectors, except utilities, reported a fall in graduatevacancies, with some such as IT employers reporting a fall of as much as 40%. Recent reportssuggest some recovery in 2010 though how much is uncertain: some suggest that most leadingemployers will either increase vacancies or hold them steady this year (High Fliers Research,2010), while others report continuing short-term reductions, although not as severe as in 2009(AGR, 2010). The CBI reported increased demand for highly skilled people as the economypartially recovers, with half of employers surveyed in spring 2010 experiencing difficulties fillingposts where STEM skills are needed, and even more expecting to have difficulties continuing inthe next three years (CBI, 2010).
Thus, the general consensus appears to be one of continuing overall growth in demand forSTEM graduates in the longer term, despite the recent dip in graduate recruitment due to therecession, although forecasts vary between STEM disciplines and occupations/areas of work.

STEM Graduates in Non-STEM Jobs
180
A.1.3 STEM graduate output
There is a substantial supply of STEM graduates from UK universities each year. Over 130,000people obtained first degrees in STEM subjects in 2007, with an additional 37,000 qualifiers atmasters level and 12,000 at PhD. STEM subjects (as shown in Table A.1) in aggregaterepresent approximately 42% of the total first degree output.
Table A.1. First degree qualifiers in STEM subjects from UK HE institutions, 2007(excluding Open University). Source: HESA (2008)
Subject of study Qualifiers Percentage
Medicine, Dentistry,Veterinary Science.
8,905 6.8
Subjects allied to Medicine 30,460 23.3
Biology 4,670 3.6
Sports Science 6,325 4.8
other STEM (other sciences,Agriculture, Psychology)
25,230 19.3
Chemistry 2,665 2.0
Physics 2,255 1.7
Forensic and ArchaeologicalScience
1,445 0.5
Mathematics 5,385 4.1
Computer Science 16,255 12.4
Engineering 17,120 13.1
Technology 2,380 1.8
Architecture, Building andPlanning
7,615 5.8
Total STEM 130,710 100
Total others 179,960
Total all subjects 310,665
STEM as % of total 42%

STEM Graduates in Non-STEM Jobs
181
Table A.1 shows how the size of the first degree output varies between STEM subjects.The largest STEM subject group is ‘Subjects allied to Medicine’ (30,000) followed byEngineering (17,000) and Computer Science (16,000); whilst Chemistry, Physics andTechnology (each just over 2,000) are much smaller. The ‘newer’ STEM subject ofSports Science, which has been fast-growing, produces almost as many (at 6,000) asthese three subjects combined.
Amongst the 37,000 Masters graduates in STEM subjects (in 2007), a quarter were inEngineering and Technology and almost a sixth each in Biological Sciences andComputer Science. By comparison, the numbers graduating with masters degrees inChemistry (400), Physics (350) or Mathematics (1200) were relatively small.
The 12,000 STEM PhD graduates produced annually include some 2,500 in BiologicalSciences, 2,100 in Engineering and 1,000 in Chemistry. STEM PhD graduatesoutnumber non-STEM PhDs by a ratio of two to one.
Women and men are roughly equally represented in STEM overall, but considerablyunder-represented in certain individual STEM subjects. In Physics, the femalepercentage is just 21%, Computer Science 18% and Engineering 15%. By contrast, inBiological Sciences and Medicine, women make up the majority, with 62% and 59% ofall first degree entrants respectively; while in Mathematics and Chemistry, women areslightly in the minority (40% and 42%, respectively, female). There is also some genderbias in A-level qualifications, which feeds through to the HE situation: girls are less likelyto gain A-levels in science subjects than boys, though more likely than boys to achieveA-level qualifications in general.
STEM graduates qualify from a large number and wide range of institutions. The extentto which STEM subjects are represented in different kinds of universities varies. Physicalsciences and Mathematics courses are more concentrated in the older universities (inthe Russell and 1994 groups), while Biological Science and Engineering are moreevenly balanced across different types of universities. Computer Science degrees tendto be offered more at the newer and more vocational universities (many of whom are inthe Million+ group). This pattern is affected by institutional admissions policies (some aremore dominated by A-level qualifications than others) as well as a range of historical andother factors.
A.1.4 STEM graduate supply trends
Past trends show a lack of consistent growth in STEM graduate output from UK universities inrecent years, in contrast to the overall growth trend in graduate output. This is despite efforts(following the Roberts Review in 2002) to encourage more young people to study STEMsubjects (see reports from the DTI, Royal Society, Engineering UK, CIHE and others). STEMgraduate output fell in the earlier part of the last decade for most STEM disciplines, althoughsome fared better than others, but there has been an upturn generally in the last few years

STEM Graduates in Non-STEM Jobs
182
(probably at least partly a consequence of the increased ‘Roberts’ investment). Particular pointsof relevance to our research are:
A-levels are still the most common route into STEM degree study, though IT-based andEngineering courses have a broader qualification entry profile than most other STEMsubjects.
Between 2003 and 2006, applications for degree study in Mathematics and ComputerScience dropped more than others subjects, while there were small rises for Physicaland Biological sciences and Engineering. All STEM disciplines showed an increase inapplicants between 2007 and 2008, but Engineering and ‘Subjects allied to Medicine’increased the most. The picture in some subjects varies with student domicile, withgrowth in Engineering, for example, principally due to non-UK students.
Excluding Medicine and Veterinary Science, STEM students at UK HE institutionsincreased by almost 3% from 2003/04 to 2007/08, compared with almost 5% growth forall subjects (HESA, 2009a). However, students in Biological Sciences grew by 13%,Physical Sciences by 17% and Engineering by 8%, while Computer Science fell by 29%and the large subject group ‘Subjects allied to Medicine’ remained almost static over thisperiod. There has also been strong growth in some of the smaller, ‘newer’ STEMdisciplines, such as Sports Science and Forensic Science.
First degree qualifiers in STEM increased by 11% between 2003 and 2007, but thiscompares with a 15% increase in non-STEM subjects. Masters qualifiers in STEMsubjects rose at a faster rate (by 35%), similar to non-STEM, while PhD-level STEMqualifiers rose by 18% (also similar to non-STEM).
A.1.5 STEM skill shortages and employer recruitment concerns
Although we have seen growth in output in many STEM disciplines in the last few years,debates about the widespread existence of STEM skills shortages, and whether the UK isproducing sufficient STEM-qualified personnel, continue, particularly if much of the growth insome subjects is non-UK students. Several organisations have reported on the situation in theirown sector or discipline, highlighting the extent of recruitment difficulties being experienced byemployers seeking to recruit STEM graduates, especially into specialist areas or in very specificroles. There is a considerable body of evidence on skill shortages reported in the BIS report(2009a), and many of them are likely still to be an issue. We have not replicated this here, butaimed to summarise the more significant areas of concern relevant to our study, including morerecent evidence. It is worth highlighting, however, that data on ‘shortages’ are produced indifferent ways and often the evidence is inconsistent between sectors or STEM occupationsmaking it difficult to draw overall conclusions about the extent of STEM skill shortages. The keyevidence on STEM skill shortages comes from:
The Migration Advisory Committee (MAC), which listed a number of ‘shortageoccupations’ (where employment of migrant workers is allowed) in its March 2009 report.

STEM Graduates in Non-STEM Jobs
183
It concluded that, generally speaking, supply and demand in STEM occupations arebroadly in balance, though it included some STEM areas of work in its ‘shortage’ list.This list , updated in December 2009 , identified a number of specific jobs where STEMdegree qualifications were likely to be required: certain (not all) jobs as civil engineers,physicists, geologists, meteorologists, chemical engineers, mechanical engineers,electrical engineers, design and development engineers, production engineers,biological scientists and biochemists (in particular health-related), mathematics andscience secondary school teachers and some engineering and science technicians.EngineeringUK commented in its annual report (2009) that these identified ‘shortageoccupations’ were tied to very specific roles and the needs of employers for specificqualifications, skills, competencies and experiences for the job.
The BIS (2009a) report showed that recruitment difficulties for employers were greatestin particular areas of biosciences, engineering and IT. The concerns were mainly a lackof candidates of the quality sought. To some extent, these related to applicants nothaving specific STEM knowledge and qualifications, but to a greater extent employerswere concerned about a lack of well-rounded candidates with technical skills andbroader competencies, especially mathematical skills and practical work experience.
The Insights report (e-skills, 2008) found that around one in five employers in the IT andtelecoms sector – and a similar proportion in other sectors – both large and small in size,reported difficulties in trying to attract applicants with the right skills for IT jobs. Therewas a reported mismatch between applicants’ abilities and company needs in terms oftechnical and business skill needs. In some cases, recruits who did not fully meet skillsspecifications were being hired. A separate survey of employers by e-skills found thataround 40% of employers experienced mismatches in the business needs andinterpersonal skills of new recruits.
The CBI reported in its 2009 Education and Skills Survey (CBI, 2009b) that a third ofbusinesses recruiting STEM-skilled employees at graduate and postgraduate level werehaving difficulties, and this rose to 50% in manufacturing and 74% in the energy andwater sectors. Over half of employers cited STEM graduates lacking employability skillsas a barrier to recruitment, and a similar proportion cited lack of relevant workexperience. In the 2010 CBI survey report, 45% said they were having difficultiesrecruiting staff with STEM skills, with science and manufacturing-based companieshaving the most difficulties.
A 2008 review of skills needs in the biomedical sector by the Association of BritishPharmaceutical Industries (ABPI) concluded that ‘the UK has substantive skillsdeficiencies in biomedical sciences, many of which are at the heart of translationalmedicine key to the commercialisation of research’. Skills gaps in new recruits which hadbeen identified in an earlier 2005 survey were still problematical and in only a fewinstances had skills improved. Of major concern were graduates’ lack of practicalexperience and application of scientific knowledge and, to a somewhat lesser extent,high-level mathematical and scientific knowledge.

STEM Graduates in Non-STEM Jobs
184
Research on chemical sciences graduates (IER Warwick, 2008) for the Royal Society ofChemistry highlighted weaknesses in some soft skills of graduates but of more concernto employers was a shortage of specialist chemistry skills, e.g. in physical chemistry,analytical chemistry, and handling of hazardous materials. Of particular concern wasgraduates’ ability to work on large-scale chemistry, at the interface between chemicalengineering and chemistry (where UK graduates are seen to be weaker than those ofother European countries). There was also a difficulty in finding graduates with sufficientchemical science knowledge to work in sales roles.
Most recently, a HEFCE commissioned review of evidence on the demand for certainstrategically important and vulnerable subjects (undertaken by WM Enterprises in 2009)confirmed other studies’ findings that many employers were facing difficulties recruitinggraduates in Sciences, Technology, Engineering and Mathematics. But it concluded thatthere was insufficient evidence of actual widespread shortages. Some specific absoluteor near shortages were identified, but these were in highly specialised academic areaswhere numbers needed were very small. Rather the main problem for recruiters was aquality issue – many vacancies were difficult to fill because not enough candidates cameforward to match the standards set by the employers. The employers wanted to seemore graduates emerging from universities who were better prepared for the world ofwork in terms of team-working and related skills. With respect to science graduates, theywanted them better able to handle uncertainty, ambiguity and complexity, to be bettertrained mathematically, to have more understanding of over-arching scientific principles(i.e. less modular learning), and in some cases better basic skills such as laboratorytechniques. However, this research also pointed to employers becoming moredemanding, and so it was not just weaknesses on the part of candidates, and so in parttheir university education, that was being criticised.
Most of the evidence on skill shortages focuses on the traditional STEM sectors and it is notclear how much it relates to other sectors requiring STEM skills and which are more likely to doso in the future, for example the business and service sectors. Furthermore, it is unknown howgrowth in STEM skills demand in some new and emerging sectors, and/or for specific expertise,is contributing to the reported STEM graduate recruitment problems. This is partly because theevidence is rather piecemeal, brought together from a number of sources, and also becausedifferent STEM definitions have been used by organisations depending on the scope of theirinterest. It is also worth noting that many of the concerns of employers on the perceived qualityof STEM graduates are not new but have been cited in many reports over the last decade or so(see, for example Mason, 1999).

STEM Graduates in Non-STEM Jobs
185
A.1.6 Employment outcomes of STEM graduates
Employment outcomes of graduates vary according to their STEM discipline. STEM graduatesin aggregate (taking a wide definition of STEM7 ) are slightly more likely to be in work or furtherstudy than other graduates (87.5% v. 85.1%), at the six month stage after completing degreestudy (according to the DLHE survey, HESA 2009). But this definition of STEM includesMedicine and Nursing whose graduate employment rates are very high. Focusing only on thecore STEM subject group8, which is of primary interest in our research, the percentage in workor further study is slightly lower, 85.5%, but very similar to that of the other (non-STEM)graduates. It varies by individual STEM disciplines, being much lower for computer science(80.9%) and higher for life sciences (88.5%).
Additionally, there are significant variations between STEM subjects in the proportions going onto further study after full-time first degrees (mostly postgraduate study) as shown in Table A.2.Over a third of graduates in life sciences and Physics do so, compared with just 11.5% inEngineering and 10.5% in Mathematics. This may be because graduates in some disciplinessee more value in entering employment than taking a higher qualification or that higherqualifications are more in demand by employers in some disciplines than the others.
7 This wide STEM coverage includes: Medicine, Nursing, Psychology, Geography, Architecture andAgricultural Science as part of science and engineering, while our study’s STEM definition excludesMedicine, Veterinary Science and Nursing (see section A.2)8 Those we call ‘core’ STEM subjects are life sciences (which is the combination of Biological Scienceand Subjects allied to Medicine, excluding Nursing), Physics, Mathematics, Chemistry, ComputerScience and Engineering and Technology.

STEM Graduates in Non-STEM Jobs
186
Table A.2 Destinations of UK domiciled first degree leavers who studied full-time by STEMsubject of study 2007/08
Work Furtherstudy
Unemployed Other N(100%)
Life sciences 70.3% 18.2% 7.1% 4.3% 17,265
Physics 47.4% 36.8% 9.3% 6.5% 1,605
Chemistry 49.1% 36.7% 8.9% 5.2% 1,905
Mathematics 61.4% 23.6% 8.6% 6.4% 3,585
ComputerScience
70.0% 10.9% 14.6% 4.5% 7,975
Engineering andTechnology
72.6% 11.5% 10.5% 5.4% 9,530
Total of above(core STEM)
68.2% 17.3% 9.6% 4.9% 41,865
Total STEM(wide)
72.5% 15.0% 7.8% 4.8% 81,975
Total other(non-STEM)
69.3% 15.8% 9.0% 5.9% 109,765
Total allsubjects
70.6% 15.5% 8.5% 5.4% 191,740
Source: HESA DLHE survey (HESA, 2009)
The HESA DLHE survey gives an indication of the initial outcomes of graduates (at the sixmonth stage) but it is increasingly the case that graduates are taking a longer time to settle intoemployment than in the past, with more taking time off to travel after completing first degrees oronly starting to apply for jobs after graduating. HESA’s ‘longitudinal‘ destinations survey (L-DLHE) undertaken three and a half years after graduation is arguably a better measure ofgraduate outcomes. This shows very high percentages in employment or further study (96.6%)for all first degree graduates qualifying in 2004/05, surveyed in 2008. It is a very similar figurefor STEM graduates (whether considered as ‘wide’ subject coverage of STEM or the narrower‘core’ STEM discipline group). STEM graduates in aggregate are as likely as non-STEMgraduates to be in full-time work (both around 76%). It is also worth noting that around a quarter

STEM Graduates in Non-STEM Jobs
187
of Physics and Chemistry graduates are in further study, compared to the average of 11% forthe core STEM subject group and just 4% for Engineers.
These data show that early career paths vary markedly between STEM subjects. They alsosuggest that demand from employers varies according to STEM discipline, as indicated by initialgraduate unemployment figures.
We now turn to the employment distribution of STEM graduates and, in particular, evidenceshowing the extent to which STEM graduates are found in non-STEM areas of work.Historically, the manufacturing sector has been the main employer of STEM graduates but thispattern has shifted over time and there is now a much broader spread of STEM graduatesacross industrial, business and services sectors. The number of STEM graduates (excludingmedicine from the STEM subject group) employed in the ‘business and other services’ sectornow exceeds the number in the ‘manufacturing’ sector (see IER’s analysis of Labour ForceSurvey data in CIHE, 2009). STEM graduates represent a higher share of total employment inthe ‘business and other services’ sector than in ‘manufacturing’.
This change is a reflection of industrial structural and organisational change over the last fewdecades:
‘..the continuing trends towards specialisation and lengthening of supply chains, with roles inresearch and development being separated out from traditional activities and being re-classifiedas services to business rather than core manufacturing activities’ (CIHE, 2009)
Another factor is that today’s high-tech manufacturing sector is much less labour-intensive thanit was in the past, so many of its employers require relatively small numbers of highly qualifiedpeople with specialist STEM skills. It is also worth noting that a range of different types ofbusinesses are included in the coverage of the ‘business and other services’ sector, from highlyspecialised technical and research organisations to those providing financial and consumerservices. Their needs for STEM graduates are likely to be different but some are likely toemploy STEM graduates in scientific and engineering occupations.
The CIHE report (2009) also shows how STEM graduates and postgraduates are employedacross a number of different occupational categories, though its analysis was limited to broadoccupational categories:
The largest numbers of STEM graduates (NVQ4 level, and excluding medicine fromSTEM subject group) are in two occupational areas – Science or Technical Professionaland Corporate Manager – while smaller but still significant numbers are employed inseveral others: Health Professional, Teaching or Research Professional, and Scientificor Technical Associate Professional;

STEM Graduates in Non-STEM Jobs
188
STEM postgraduates (i.e. NVQ5) are more concentrated in Science and TechnicalProfessional, and Teaching or Research Professional, occupations, with a third slightlysmaller occupation, Corporate Manager, also of importance;
A small number of both STEM graduates and postgraduates are spread across otheroccupational categories, including some lower level occupations.
There are limitations in using the LFS to distinguish between STEM and non-STEM work9. Oneattempt (in the BIS analysis, 2009a) was to group the SOC codes used in the LFS into a‘science’ occupational category. Using this approach and LFS data, just under half of STEM-qualified graduates10 were working in a ‘science’ occupation11. This overall figure, however,masks significant differences between STEM subjects, from over 60% of graduates in ‘Subjectsallied to Medicine’ to 50% in Engineering, about a third in Mathematics and Physical sciences,to just 21% in Biology, considered to be working in ‘science’ occupations.
Other evidence on the types of jobs entered by STEM graduates can be seen in the HESADLHE survey on initial graduate destinations, though it also uses broad occupational categories(see Table A.3). Points of note are:
Chemistry graduates are the most likely of all STEM graduates to enter ScientificProfessional occupations. Engineering graduates, especially Civil and MechanicalEngineering, are clustered in Engineering Professional occupations. For other STEMsubjects, these two occupational areas are entered by relatively fewer graduates.
IT and Computing graduates are clustered in IT Professional occupations. Mathematicsand Sports Science graduates are the most likely to enter Education Professional jobs.Mathematics graduates, and also but to a lesser extent Physics graduates, are the mostlikely to enter Business Professional roles.
Architecture and Building graduates are clustered in Other Professional, Associate andTechnical jobs (including, for example, architectural assistants, quantity surveyors,planning officers). Biological, Environmental, Physical, Geographical and TerrestrialSciences, and IT and Computing, graduates have the next highest percentages enteringthis group of jobs.
Architecture and Building, and Environmental, Physical, Geographical and Terrestrialscience graduates are slightly more likely than other STEM graduates to entermanagement jobs (industrial, commercial, public sector).
Physics graduates have the widest occupational spread.
9 Discussed further in section A 2 on STEM definitions10 includes medicine and dentistry in STEM scope11 As shown later in section A2 on the different definitions of STEM occupations, this covered anumber of jobs closely associated to science or technology (e.g. chemists, engineers, scientificresearchers, statisticians, technicians etc.), but did not include science teaching

STEM Graduates in Non-STEM Jobs
189
Table A.3. Type of work (Job groups) of 2008 first degree graduates in STEM subjects, six months aftergraduation, shown as percentages (only most common job groups are shown).
Nu
mb
er
em
plo
yed
Man
ag
ers
Sc
ien
ce
Pro
f
En
gP
rof
ITP
rof
Ed
uc
atio
nP
rof
Bu
sin
ess
Pro
f
Oth
erP
rof,
As
soc.
Tec
h
Biology * 1945 6.7 12.4 0.7 0..9 4.4 5.0 16.3
Chemistry 1000 6.0 23.5 4.0 2.1 5.1 9.9 8.1
Env., phys.,geog. &earthscience.
1470 12.0 2.1 2.7 1.6 2.5 8.1 17.9
Physics 735 8.9 9.9 7.2 9.5 5.9 18.3 6.9
Sportsscience*
3815 8.4 0.6 0.4 0.4 12.5 4.3 1.6
Mathematics 2120 7.8 1.1 1.8 6.4 9.5 37.4 3.4
IT andcomputing*
6310 9.1 0.1 1.9 43.7 3.0 5.1 10.4
Arch. andbuilding
3820 13.3 0.1 4.5 0.4 0.4 2.9 59.6
Civil eng. 1290 4.7 0.2 74.5 0.5 0.2 2.5 7.9
Elect+elect-ronic Eng. *
1635 7.9 0.3 33.8 21.3 1.0 2.8 4.0
MechanicalEng.
1520 7.1 0.1 62.9 2.1 0.8 4.2 5.8
All subjects 148,800 9.3 1.2 3.2 3.2 7.1 7.5 5.2
* omitted due to lack of space in table are columns for: Health professional and associate professional roles -3.9% of Biologists (but <1% for other STEM subjects); Arts, design, cultural, sports professional roles - 5.2% ofIT and Computing, 7.2% of Electrical and Electronic Engineering, and 23.6 % of Sports Science graduates.
Source HECSU, 2009.
This seems to indicate that the type of work entered by certain STEM graduates, such asengineers and computer scientists, is more likely to be associated with their discipline area thanis the case with others (such as Physics or Mathematics graduates).
A number of organisations have analysed the DLHE survey data in more detail for specificgroups of STEM graduates of relevance to their own sector or discipline. These include somewhich have reworked the occupational data to focus better on STEM and non-STEM types ofwork.
Engineering UK stated that 71% of Engineering and Technology (E&T) graduates in2008 entered an E&T occupation, including 46% as engineering professionals, whileonly 19% went to non-E&T jobs (Engineering UK, 2009). Civil Engineers were the most
STEM Graduates in Non-STEM Jobs
190
likely to be working as engineering professionals and the least likely to be in non-E&Tjobs (just 8%), while Electrical and Electronic Engineers were the most likely to be innon-E&T jobs (21%). In terms of employment sector, 63% of E&T graduates wererecruited to firms whose primary activity is E&T and 11% to firms whose primary activityis associated with E&T. Only 3% joined firms in the financial sector, but around one insix of them were doing E&T work there, mainly in IT. The manufacturing sector was themain recruiter of E&T graduates.
Cogent (the SSC for the energy and process-related industries) has undertaken analysisof DLHE data for Cogent-relevant disciplines (defined as Chemistry, Biology andMechanical, Electrical and Electronic, Chemical, Process and Energy Engineering).Graduates in these STEM subjects enter a range of employers: 20% to manufacturing,25% to business and research services, 9% to education and 7% to the publicadministration and defence sectors.
The Royal Society’s 2006 report showed that manufacturing remains a significantdestination for STEM graduates, though its share of employment has been falling – 27%of all Chemistry and 22% of all Engineering and Technology graduates who enteredemployment in 2004 joined manufacturing firms. By contrast, just 7% of Physicsgraduates did so. These percentages were higher for graduates with enhanced orintegrated Masters (i.e. 4 year) degrees in Chemistry, Engineering and Physics. It alsoshowed that 43% of Mathematics and 30% of Physics graduates entered financial andbusiness activities sectors (including accountancy, management consultancy andPR/marketing), compared with 23% of Engineering, 20% of IT and 18% of Biologygraduates. In relation to Masters graduates, the Royal Society’s 2008 report showed thatthe proportions who enter Science or Research Professional occupations varied fromalmost 40% in Chemistry to under 8% in Engineering and Technology, ComputerScience and Mathematics. Business and Statistical Professionals jobs are takenpredominantly by Mathematics rather than other Masters graduates. With regard toDoctoral graduates, the report showed that a sizeable proportion in all STEM subjectsenter Research Professional jobs, with the highest proportion in Physics (almost 50%),and lowest in Engineering and Technology (20%).
A HECSU study for DIUS in 2008 concluded that employment outcomes forpostgraduates matched their subject studied to a large extent. It highlighted the higherproportion of biosciences, compared to Physical sciences, postgraduates enteringscientific, research, analysis and development professional occupations, and acorresponding lower proportion entering business, IT or financial professional jobs.
Analysis by Vitae (2009; 2010a) of the employment destinations of UK doctoralgraduates has also showed variations in outcomes by STEM discipline. Of particularnote is the extent to which Physical sciences and Engineering Doctoral graduates enteremployment in the business, finance and IT sectors (around 20%), compared to muchlower numbers from Biological Sciences (5-7%). In certain disciplines within the Physicalscience and Engineering grouping, this proportion was higher still: Mathematics 34%,Civil Engineering 31% and Computer Science 26%.

STEM Graduates in Non-STEM Jobs
191
The latest L-DLHE survey (HESA, 2009) provides further evidence relating to outcomes threeand a half years on. STEM graduates in some disciplines are more likely than others to beworking outside manufacturing or other industries, in particular:
22% of first degree Mathematics and 10% of IT graduates were in the finance sector, butvery few from other STEM subjects (under 5%);
The public sector (administration, defence, social security) employed approximately 15%of Biological and Physical sciences graduates;
Education employed 21% of Biological Sciences, 18% of Mathematical Sciences and16% of Physical Sciences graduates.
We also can draw from the interim results of a 5 year follow-up study of Physics graduates (bythe Institute of Physics, due to be completed in 2010) which showed that 30% were employed inindustry with the remainder in a wide range of other sectors, including Government (9%),Services (21%) and Education (13%). The Physics graduates were carrying out a variety ofroles, the most commonly mentioned being technical support and consultancy (each 12%),teaching and development (each 11%) and applied research (8%). A broad range of other jobswere given including work mainly unrelated or loosely associated with their degree, such asauditing, legal, policy and IT work. Interestingly, 59% stated that their current occupation waseither not at all related or not particularly related to physics. However, three quarters stated thatthey found their Physics background either very or quite useful in their current occupation.
A.1.7 Influences on career choice
We finish this contextual section by summarising what is known from the literature about careerchoice in relation to STEM graduates. While it is apparent that labour market factors, such asearnings and relative demand from employers, affect the employment outcomes of STEMgraduates and their likelihood of entering different types of work, other factors are likely also tobe relevant, including individual career choice. These in turn are affected by a myriad of factors,and chance events, as a wide range of literature has shown.
Many of the influences have impact at an earlier stage than the focus of our study (which is thetransition from higher education to work). For some students, the decision to enter a STEMoccupation – or not – is likely to be part of a long-term process of career decision-making withearlier influences at school and home interplaying with subsequent experiences at university orduring work experience and in job search. These earlier and more general influences caninclude curriculum content, subject options, careers advice, parental attitudes, popular imagesand so on, and they impact differentially on people of different gender, ethnicity and socialclass. They have been documented in a number of published literature reviews for variousorganisations (most recently the BIS Science and Society Expert Group), and in research, forexample by Pollard et al (2003), Donnelly and Jenkins (2006) and Vitae (2009). There is also
STEM Graduates in Non-STEM Jobs
192
wider research which includes reference to STEM subjects, for example, the first stage report ofthe Futuretrack study (HECSU, 2008a).
None of these influences acts alone, and some are more important at certain educationalstages. Frequently it is a mixture of factors relating to perceptions about careers, school andpersonal experiences (acting together and interacting with each other) which motivates a youngperson to choose to study a STEM subject at university (see BIS, 2009e). For many youngpeople the focus is on the immediate ‘decision’ (such as subject choice, or degree choice)rather than the broader context of a ‘career decision’.
A weakness of much research undertaken to date is that much of it focuses on career-relateddecisions at particular times, rather than on students’ career decision-making processes takenover time, or on how known factors actually operate individually or together to determine long-term outcomes. Some researchers suggest that students seem to appear more decided insurvey results than they actually are, and that there may be more capriciousness in studentdecision-making than is acknowledged in research reports (this is highlighted in research byLichtenstein et al. 2009 in the USA). Nevertheless, it is still worth highlighting the moresignificant issues identified from previous research relevant to STEM study or STEM careerchoices:
Gender, social class and ethnicity: A main focus of much of the academic research inthis area has been around gendered occupational stereotypes and the influence ofgender on career choice (Pollard et al., 2003). Studies have emphasised the pervasivenature of stereotypes which can have an influence from a very early age and howwomen and girls prefer certain types of work and aspects of work, while boys and menprefer others. Other personal factors, such as social class and ethnicity, can also havean influence and interact with gender (as shown in The Royal Society report, 2008).Recent research on attitudes towards participation in higher education (BIS, 2009e), andthe Futuretrack study (HECSU, 2008) found variations in subject choice were stronglyassociated with gender, ethnicity and class differences. Milner (2009) showed how thosemost likely to aspire to and achieve a professional job had a parent who was aprofessional.
Public image of STEM: A second group of influences identified in research is the publicimage of STEM and public opinions on science and technology careers. Publicawareness about engineering as a profession, for example, is recognised as being poor(see surveys for ETB and the Royal Academy of Engineering, in ETB, 2008, andrecently, the BIS Science and Society Expert Group reports, March 2010). Differenceshave been identified between social class groups, gender and age, with the less well-informed tending to be young people, women and those in lower social class groups.One particular issue repeatedly highlighted has been that relatively few people knowwhat engineers actually do, while another is confusion between the different types ofengineers. Further, the contribution that engineering makes to wealth and human/social
STEM Graduates in Non-STEM Jobs
193
wellbeing is not widely recognised, especially amongst young people. However, somerecent research has found somewhat more positive views (reported in Engineering UK2009).
Levels of well-being in a country: These negative views about science and technologyare not restricted the UK but shared by young people in many other countries. Aninternational comparative study (the ROSE project) found that young people’s desire tochoose a career in science and technology was related to a country’s HDI index (ameasure of well-being combining health, education, GDP, life expectancy, etc), seeSjøberg and Schreiner, 2007. This has been linked to the view in most developedcountries, like the UK, that engineering’s role was crucial at the time of industrialisationbut is less so now. This change in our values may explain the low image and reputationof science and engineering careers among today’s youth.
Subject choices at school: Another key set of issues identified in research is aroundchoices of subjects of study at school. The Roberts review (2002) and otherscommented on the way that many pupils view the choice of science and technology asnarrowing their future career options (which is an incorrect view, many current careersexperts would say) rather than broadening them. The Roberts review reported that alack of knowledge of, or background in, science amongst careers advisers meant thatthey could be unwilling or unable to advise on future options, or at least could not do soin an informed manner.
Ability and subject difficulty: Several reports have highlighted how STEM subjects areperceived to be more difficult to study, and in which to attain high grades, which could beseen as disadvantageous to students seeking high A-level grades for entry to university(see CEM, 2008 and ETB, 2006). There appears to be insufficient evidence to show howperceptions of difficulty of STEM subjects actually change degree application choices,while the link between perceived ability and subject choice is well-established.
Careers ‘interventions’: Numerous research studies have shown that children developopinions about STEM subjects at an early age and, as a consequence, there is now alarge range of interventions and activities supported by and engaged in by theengineering and science communities, at various stages within and outside the schoolcurriculum. Many of these promote young people’s interest in science, mathematics orengineering rather than necessarily their interest in or the benefit of pursuing careers inSTEM.
Careers advice and guidance: Lastly, a volume of evidence exists on the impact andquality of careers advice and guidance. Much of the research has been on subject andcareer choices in general rather than specifically relating to STEM, but some key pointshighlighted in the ETB literature review by Pollard et al. (2003) were:
o how material designed to inform young people about STEM study can be‘filtered out’ by parents and individuals, and also by institutions and careersadvisers themselves, where few have STEM backgrounds or direct experience;
o much careers support, especially by employers, was being targeted at olderchildren where attitudes had already hardened against STEM options;
STEM Graduates in Non-STEM Jobs
194
o there were concerns about the effectiveness of careers advice and informationrelating to STEM subjects at a time when science study was decreasing inpopularity and also when economic factors often affected STEM graduates’ jobprospects, albeit temporarily.
Turning to career intentions at the stage of applying to HE, Purcell and Elias, in the first stagereport of the Futuretrack study (HECSU, 2008), comment on the importance of subject choice intheir choice of university which can affect subsequent career trajectory. There is a morerestricted range of subjects in certain universities (including some STEM subjects, likeChemistry, and particular STEM courses of study). The research showed also that applicants toMathematics, Computing and Physical sciences were more likely to say they applied touniversity to get a good job than applicants to other subjects (other than law). Careers advicewas seen as more influential in this decision by those opting for Engineering and Technologythan for most other subjects. Among the reasons for choosing their degree subject, enjoymentof subject was most likely to be the main reason given by applicants to STEM degree subjects(over 70% .and even higher 89% to Physical sciences). Other reasons included their attainment(they had obtained good grades). Employment- or career-related reasons were mentioned muchless often.
This is similar to findings in an earlier survey (Purcell and Picher, 1996) where graduates fromnatural sciences were much more likely to have chosen their HE course for ‘hedonistic’ reasons(primarily related to interest or enjoyment of the subject) than for ‘pragmatic’ reasons (related tolonger term career plans). These two reasons were equally rated by Engineering andTechnology students in that survey, while Mathematics and Computing students had similarresults to those in the natural sciences.
The Futuretrack stage 2 survey (of first year HE students in 2006) continued this theme. Itshowed that enjoyment of the subject was rated more highly as a reason for taking their courseamong Biology, Veterinary and Agriculture Sciences, Physical Sciences, Mathematics andComputing students than for the sample as a whole (i.e. all subjects). Other research, however,has produced slightly different results. Students interviewed in 2008 in a BIS study, 2009e, whowere intending to take STEM subjects in HE were more likely to do so for economic reasons,including seeing them as being in demand by employers and expecting to get a better paid job,than those taking non-STEM subjects. This is more recent research than the literature citedabove and may reflect some change in views by potential students as a consequence ofchanges in the cost of HE study, or it could be due simply to methodological differences.
A 1.8 Career intentions of HE students
There have been only a small number of studies which have explored career intentions ofstudents while on STEM subject degree courses at university and their reasons for pursuing, ornot, a career related to the subject of their degree course. Evidence from a CRAC survey of

STEM Graduates in Non-STEM Jobs
195
Engineering undergraduates in 2007 (covering all years) showed that most (82%) were happyabout their choice of Engineering as a degree to study (in that they would make the samechoice again) and most did want to pursue engineering as a career. A number of intrinsicreasons were given for choosing engineering as a career, the top three being: the chance towork on exciting projects, an opportunity to put learning into practice, and the chance to shapethe world around them. Women were more interested than men in the latter. The main reasonfor not pursuing a career in engineering was that it did not fit with their self-image (over halfcited this), along with extrinsic reasons such as that salaries were uncompetitive, and thatemployers in other sectors were more assertive with career messages. Women tended to bemore put-off than men by image-related factors and less by salary (although sample numberswere rather small for conclusions on gender differences).
An interesting finding from this CRAC research is how work experience seemed to be a majorfactor of influence on the career choices of Engineering students, as were employerpresentations/information, the latter especially for final year students. Other influences, such asparents, faculty, peers and the careers service, appeared to have some, although lesser, impacton career decision-making. CRAC also noted different levels of commitment to engineering as apotential career between students in different years, with evidence for a decline in commitmentin later years, which was particularly marked for female students.
A small research study in the US (Lichtenstein et al., 2009) on Engineering undergraduates’career decision-making also showed commitment to pursuing engineering careers, but less sothan in the UK study above, with only 42% definitely intending to do so, with 44% showing someuncertainty and 24% definitely not committed. This research covered only two universities, onea state-funded technical institution and the other a private university with a more comprehensivesubject coverage. Engineering students at the technical university reported greater likelihood ofpursuing engineering careers. Other interesting findings from this US study were ‘the fluid andquixotic nature of students’ decision-making’, which was highlighted in their interviews; and thatsingle experiences and events during their undergraduate programmes – such as an internship,advice from a mentor or interaction with faculty staff – could sway their career options, in somecases it seemed disproportionately. This work also found, as others have (see, for example,ETB studies in the UK, cited earlier, and Stevens et al., 2008 in the US), that students’perceptions of engineering are very limited at the time they are making career decisions.External influences, such as family and career websites and career campus centres (careersservices), also have an influence, more so it seems (in that study) than any support from withintheir Engineering departments.
In a survey on attitudes to careers and work in the IT sector, among computing/IT and alsoother undergraduates (also by CRAC, 2008), a high proportion of computing/IT students weresatisfied with their degree choice (80%), and similarly a very high proportion (90%) wereseeking a career in IT, over half with a definite intention to do so. Like the Engineering studentssurveyed, the overwhelming majority had chosen computing/IT at university due to a personal
STEM Graduates in Non-STEM Jobs
196
interest or aptitude in IT (and more men gave this reason than women); and around a half hadenjoyed the subject at A-level. Most had positive views about a future in the IT sector (80%believed it had a bright future and many job vacancies, and 78% agreed that it provided lots ofopportunities to earn a high salary). Those who intended to seek a career in IT gave a variety ofreasons, the most popular being related to applying their specialist knowledge, working onexciting projects and expecting to be suited to the technical work involved. However, somenegative views were also expressed, pertaining to the image of the industry and of being an ITprofessional. The main reason for not intending to work in IT, expressed by undergraduates ofother subjects, was that work was expected to be boring; while amongst the computing/ITstudents it was an active preference for something new or where rewards were better (althoughthose numbers were very small).
Stage 2 of Futuretrack surveyed students in their first year and asked them about their careerexpectations. There is some analysis available on Chemical Science students (reported in RSC,2008) which shows that a little over two thirds of students definitely hoped to use their chemistryor other scientific knowledge in their jobs, and only a small proportion (16%) wanted to changeto a different area of work. The biggest change was in the branch of chemical sciences theywanted to work in, reflecting perhaps their exposure to a wider range of options since startingtheir degrees. The two sectors of preference were healthcare manufacturing (includingpharmaceuticals and biotechnology) and fine chemicals (including oil and paint).
It is perhaps interesting to note that prospective MChem students in that study had chosen thisoption over a BSc course because they expected the additional knowledge and qualification tohelp their employment opportunities. A number of enhanced four-year degree programmes(MEng, MChem, MPhys) are being provided by universities; they offer additional modules, workexperience and take some topics to greater depth than can be accommodated in the three-yearbachelor degree. Some are geared specifically for careers in STEM (as engineers or researchchemists) and universities often market them with this emphasis. However, there does not seemto be much research yet undertaken specifically on the views and experiences in the labourmarket of M-level STEM graduates.
Another source of data on aspirations and behaviour of final year students is provided annuallyby a large-scale commercial survey undertaken by High Fliers Research (with a sample of16,000 focused on the UK’s leading universities, mainly Russell group) to which many businessorganisations subscribe. It is a ‘high calibre’ sample, with most students having at least three A-levels at A or B grade, and is not representative of the whole final year UK university population.However, some interesting and relevant points from the report of students surveyed in February2009 were that, overall:
Of those categorised as ‘job hunters’, almost 10% wanted to work in each ofadvertising/marketing, law and education, with slightly fewer in accountancy (7%) orprofessional services (7%), and very few wanted to work in engineering or R&D;
STEM Graduates in Non-STEM Jobs
197
Being challenged (54%), genuine responsibility (42%) and gaining a professionalqualification (33%) were the key elements being sought in a first job;
For STEM subjects shown in the report:
50-59% of Engineering, science and Computing students wanted to work for a majoremployer, a slightly higher proportions than for the whole sample ( all subjects);
Engineering and Computing students were more likely to be looking for or expecting tostart a graduate job after university (57% and 55% respectively) than science students(35%);
Twice as many science students intended doing a postgraduate course (36%) thanEngineering and Computing students (18% and 15% respectively);
Of the Engineering students, 70% had applied to employers in engineering, and a further11% to R&D, 10% to consultancy and 7% to IT, while 37% had applied to teaching.Relatively small numbers had applied to employers in accountancy (5%) and investmentbanking (8%);
Computing students also had a core employer group, in this case the IT sector where70% of students had applied. The next most popular sector was consulting (15%) andinvestment banking (14%), while 9% had applied to employers in R&D, 7% to media and6% to engineering;
The pattern was different amongst science students where a broader set of employerswas chosen. The main employer group was R&D (34%), a further 14% had applied toteaching, and 11% and 10 % to accountancy and investment banking employersrespectively.
Finally, a few studies have focused on the career intentions of postgraduate students, mostly atdoctoral level rather than Masters students:
Research by the Royal Society of Chemistry in 2006 with Chemistry PhD studentsshowed that the vast majority wanted a career that required their scientific background.However, it also showed that women were more likely to be put off Chemistry researchduring their PhD study than men, and more likely than men to be re-thinking theirintentions to pursue an academic career during their PhD study.
Two follow-up studies focusing on female retention in Chemistry and MolecularBiosciences (reported in HECSU/Prospects summary reports, summer 2009) suggestedthat experiences were different in the two disciplines. In contrast to the Chemistry PhDs,the female Molecular Bioscience PhDs did not change their minds about a researchcareer. It was suggested that a contributing factor was the standard and availability ofcareers advice which can be variable across HE; for example, there was moreawareness of career opportunities outside academia among Chemistry than MolecularBiology PhDs, while more Chemistry graduates were aware of the general skills theypossessed which are attractive to other employers. Cultural differences within the

STEM Graduates in Non-STEM Jobs
198
research communities of the two disciplines were possibly another factor affectingwomen’s career decisions.
In conclusion, there is some evidence from the research literature which provides indications ofundergraduate student career intentions and but this is limited in scope to students of certainSTEM subjects, mainly in engineering, IT and some sciences. There is a much larger body ofresearch which has explored more generally factors likely to affect decisions to pursue a STEMcareer, or not, and in particular those that seem more significant in choosing a STEM subject inundergraduate study. However, this has not explored in any depth the reasons for pursuing aSTEM occupation or career as opposed to other directions, nor has there been muchdifferentiation between students of different STEM subjects. Our own research survey work isspecified to inform this.
A.2 Study definitions – STEM and ‘non-STEM’
Although the term STEM is used widely, there is no uniform agreement on what it covers exactlyand some policy and review documents give no definition at all. Some refer to STEM in terms ofacademic disciplines, others to occupations or sectors. Further, many ‘non-STEM’ jobs actuallyrequire technology skills or knowledge.
The research specification for this project referred to STEM as ‘Science, Technology,Engineering and Mathematics’ with additional guidance as to what should be included in termsof degree subject disciplines. It was important at the outset to reach agreement with BIS on thescope of the research in terms of STEM disciplines, STEM sectors, STEM jobs and ‘non-STEM’jobs. Crucially, we needed to find a simple way to defining different aspects of STEM which wecould use consistently in our research instruments and analysis in order to come up with clearfindings.
We reviewed a number of different approaches, to defining STEM, previously taken by otherorganisations, and the issues these raised, before agreeing definitions for this study.
A.2.1 Previous work on defining and using ‘STEM’
It is apparent from the literature that STEM has become the term used most widely today torefer to a range of subjects (in Science, Technology, Engineering and Mathematics). In recentyears, the term STEM has become widely adopted across Government in policy and delivery;including the former DCSF’s national STEM strategy, the STEM High Level Skills Strategygroup, HEFCE’s National HE STEM programme, STEMNET etc. The acronym STEM is alsoused internationally, for example in the USA, to refer to more or less the same subjects as in theUK.

STEM Graduates in Non-STEM Jobs
199
However, in the past, these subjects have sometimes been referred to as SET or STM, ratherthan STEM; for example, the ‘Roberts Review’ in 2002 defined SET as ‘Science, Engineeringand Technology (including the mathematical sciences)’; while STM was used by The RoyalSociety in its 2006 report on degrees in Science, Technology and Mathematics, althoughengineering subjects were within its scope.
Although STEM (and previously SET/STM) usually refers to a range of subjects or disciplines, itcan also be used to refer to skills – for example, by the CBI (2009a and 2010) and HEFCE(2010). The DTI (in its 2006 report on the demand and supply of people with SET skills) definedSET skills in terms of people holding qualifications in SET. Although holding particularqualifications is often used as a proxy for ‘skills’, it has some flaws as people may havedeveloped capabilities and competencies outside their study for qualifications. However, thisproxy is frequently used in the STEM literature and terms like ‘STEM skills’ and ‘STEMsubjects/qualifications’ tend to be used interchangeably.
A.2.2 STEM as subject of qualification
A number of educational and qualification classifications are currently in use in the UK andthese identify STEM areas of study and/or students. They are generally based on internationallyagreed definitions of science and technology12. At higher education level, STEM is defined byqualification most commonly by reference to certain JACS13 subject codes (as used in HESA,UCAS and Labour Force Survey data, see Table A.4).
12 see EUROSTAT and OECD reports in the 1990s which sought ways of classifying occupations and activitiesrelated to science and technology13 Joint Academic Coding System (HESA)

STEM Graduates in Non-STEM Jobs
200
Although the JACS classification is in common usage for identifying subjects, the definition ofSTEM can vary depending on which JACS subjects are included. Some users have preferred abroad definition for STEM, taking in a wider range of subjects; for example, CIHE includedmedicine and medicine-related subjects within STEM in its 2009 report on STEM demand. TheBIS report on the demand for STEM skills (BIS 2009a) also included medicine (as well asnursing) within its scope.
Meanwhile others have narrower definitions, depending on the focus of their interest, forexample:
COGENT (the Sector Skills Council for the chemicals, pharmaceuticals and polymerprocessing and oil-related industries) used the term ‘science and engineering’ graduatesto cover those with degrees in Chemistry, Biology, and Mechanical,Chemical/Process/Energy and Electrical/Electronic Engineering;
EngineeringUK (previously the Engineering & Technology Board, ETB) used the term‘Engineering and Technology’ for the subject disciplines in JACS codes H and J (seeTable A.4) and excluded the sciences and computing from the group of subjects definedby CIHE, above;
Table A.4. JACS subject groups relating to STEM
(A) Medicine & Dentistry
(B) Subjects allied to Medicine
(C) Biological Sciences
(D1, D2) Veterinary Science
(D0, D3-9) Agriculture & related subjects
(F1-3, 9) Physical sciences
(G0-3,9,91) Mathematical Sciences
(G4-7,92) Computer Science
(H, J) Engineering & Technology
(K) Architecture, Building & Planning

STEM Graduates in Non-STEM Jobs
201
SEMTA, the Sector Skills Council for the science, engineering and manufacturingtechnologies sectors, considers relevant STEM subjects to include only PhysicalSciences (JACS codes F1, F2, F3 and F9), Mathematical Sciences (G0 – G7, G9) andEngineering and Technology (H0-H9).
A.2.3 STEM as an industrial sector
The JACS subject codes above are very helpful in underpinning a common agreement of STEMin terms of disciplines and therefore a common understanding of STEM graduate qualifications.However, there is no such simple classification in common use which captures well the range ofSTEM employment activities or industrial/business sectors.
While it is clear that STEM qualifications and skills are likely to be needed more in certainindustrial and business sectors than others, it is not clear what might comprise a ‘STEM sector’.London Development Agency research on STEM skills in 2007 found little agreement on whatmight be STEM core sectors. One difficulty relates to IT – used in almost all sectors, so ITprofessionals are found in all those sectors as well as in the specialist IT sector itself (RoyalAcademy of Engineering, 2009). According to the CBI (2009b), nine out of ten businessesemploy STEM-skilled people, ‘valuing their analytical capabilities and problem solving skills’.The Science Council has recently highlighted the vast array of settings and professions wherescientists work, from pharmaceuticals and diagnostics to teaching and public policy (ScienceCouncil, 2010). It therefore seems unlikely that there are many business sectors which do notrequire some ‘STEM skills’ to some degree, so trying to define a specific subset of businesssectors as ‘STEM’ may be neither useful or realistic.
There have been attempts, though, to identify specific employment sectors which are morelikely to have significant STEM skills needs, and group those into ‘STEM core sectors’. SIC(Standard Industrial Classification) categories at different levels are used to make sectorgroupings but there are difficulties aligning sectors which have significant STEM skill needs withSIC categories. For example:
EngineeringUK identified a ‘STEM footprint’ (see ETB, 2008), defined as the sectorscovered by seven Sector Skills Councils (SSCs), each of which has a SIC 2-digit codecoverage (as shown in Table A.5). While this captures clearly some key sectors likely tobe employing STEM subject graduates, it almost certainly underplays the prevalence ofSTEM skill requirements across the wider economy, such as in digital media, transport,and parts of Government, which are included in other SSCs.

STEM Graduates in Non-STEM Jobs
202
Table A.5. STEM Footprint’ as defined by SIC codes (2003) within SSC coverages
Sector Skills Council Sectors covered SIC code
Cogent SSC Chemicals,pharmaceuticals,nuclear, oil , gas,petroleum, polymers andsignmaking
11, 23-25 (excl 24.3,24.64, 24.7, 25.11,25.12) 50.5
Construction Skills Construction 45.1, 52.2, 45.32, 45.34,45.4, 45.5, 74.2
e-skills IT, telecoms, contactcentres
22.333, 64.2,72,74.86
Energy &Utilities Electricity, gas, wastemanagement and water
37, 40.1,40.2, 41, 60.,3,90.01, 90.02
Proskills Process andmanufacturing ofextractives, coke,refractories, buildingproducts, paper and print
10, 12-14, 21.24, 22,2,24.3, 26.1, 26.26, 23.4 -26.8
SEMTA Science, engineering andmanufacturingtechnologies
25.11, 25.12, 27-35,51.52, 51.57, 73.10
Summitskills Building servicesengineering
31.1, 31.62, 33.3, 45.31,45.33, 52.72
Source: ETB, 2008, Appendix 3
The Royal Society in its report on STM graduates (2006) identified six key sectors fortheir employment – R&D, manufacturing, financial activities, education, health and socialwork, public administration/defence, and other sectors (based on SIC codes).
The DTI 2006 report identified 20 categories using SIC 2-digit level codes as being themost significant for employment of SET graduates. It defined this as being where SETgraduates represented at least 5% of that sector’s employment. These included R&D,computer-related activities, health/social work, education, and chemicals.
A.2.4 STEM as an occupation or activity
The relatively few reports or documents from organisations that refer specifically to ‘STEMoccupations’ or ‘STEM jobs’ define them, in the main, using clusters of Standard OccupationalCodes (SOCs). As with using SIC codes to try to identify STEM employment sectors, this
STEM Graduates in Non-STEM Jobs
203
approach also suffers (arguably more so) from problems of ‘fitting’ certain identifiably ‘STEM’jobs into categories of SOC, especially in new and emerging employment fields. Additionally, itis recognised there is often some arbitrariness in allocating some jobs to specific occupationcodes from the information available (for example, by respondents in the LFS or HESA surveyson graduates) leading to concerns about reliability of data on STEM jobs which are defined bySOCs.
SOC codes have been used to define STEM occupations, at different levels of detail, forexample, by:
IER in its projections of demand for STEM graduates (in CIHE, 2009a, and also inWorking Futures, UKCES) where it identified a select group of occupations at 2-digitSOC level (see Table A.6);
EngineeringUK which identified a selection of SOC code groups to be engineering andtechnology (E&T) occupations, using a more detailed, 4-digit level (2009);
The DTI which used 3-digit level SOC codes to define SET occupations, shown in TableA.6 (although no SOC codes were actually specified in its report (DTI, 2006);
HECSU which publishes data on the type of work graduates enter in its annual ‘What doGraduates do?’ reports (based on HESA DLHE survey data) which it analyses at 3-digitSOC level (HECSU, 2009a);
BIS which defined a group of ‘STEM’ jobs by combining SOC codes at a 4-digit level,see Table A.6. Rather than calling them ‘STEM jobs’, it referred to them as a ‘scientific’occupation group (although it included engineering and IT jobs).

STEM Graduates in Non-STEM Jobs
204
Table A.6 Examples of SOC categories used to define STEM jobs
Selected occupations and SOC codes used by IER (in CIHE, 2009b)
11. Corporate managers21. Science/tech professionals22. Health professionals23. Teaching/research professionals31. Scientific/Technology associate professionals32. Health Associate professionals33. Protective services occupations34. Culture/media/sport occupations35. Business/public services associate professionals
SET occupations as defined within DTI report (DTI, 2006)
Science professionalsEngineering professionalsScientific researchersICT professionalsHealth professionalsArchitects, town planners and surveyorsScience and engineering techniciansDraughtspersons and building inspectorsIT service delivery occupationsHealth associate professionals and therapistsSOC 4-digit codes comprising ‘scientific occupation’ group (BIS, 2009e)
Managers in construction (1122), mining and energy (1123), IT (1136), R&D(1137), health services (1181), pharmacy (1182), healthcare practice(1183), farming (1211), natural environment (1212);
Chemists (2111), biologists (2112), physicists/mathematicians (2113),engineers (2121, 2122, 2123, 2124, 2125, 2126, 2127, 2128, 2129), ITprofessionals (2131), software professionals (2132), medical occupations(2211), other medical professionals (2212), pharmacists (2213), opticians(2214), dentists (2215), veterinarians (2216), scientific researchers (2321),statisticians (24234), actuaries (24235), architects (24310)
Technicians (3111, 3112, 3113, 3114, 3115, 3119, 3121), draughtspersons(3113), other medical associate professionals (3214, 3215, 3216, 3217,3218, 3221, 3222, 3223, 32290, 32292, 32293)
STEM Graduates in Non-STEM Jobs
205
Additionally, a few reports have defined STEM jobs in other ways, such as:
by job role: for example, IT professionals are defined in roles such as programming,systems design, systems analysis, web design/development, project management(by e-skills, 2009) and Chartered Scientists are identified by the Science Council in tentypes of jobs, from research scientists to roles in communication and policy (ScienceCouncil 2010); or
by discipline area: for example, scientists are defined as clinical pharmacologists,biochemists, molecular biologists, analytical chemists, chemical engineers, statisticians(ABPI, 2008).
This serves to illustrate the range of ways in which STEM jobs can be defined, and also thedifficulties in trying to closely define them.
A.2.5 Our approach to definitions of STEM and non-STEM
We built on the experiences outlined above to decide how to define STEM and non-STEM in away that could be used easily and consistently across the three strands of the research and tostructure our findings clearly. Our proposed approaches were discussed with BIS and thefollowing definitions were agreed.
A.2.5.1 STEM as a subject of qualification
We used JACS broad subject code groups as our primary means of defining the scope of STEMdegree subjects for the research; a detailed list of subjects within these groups is shown inTable A.7. A graduate (with a first or higher degree) in any of these subjects listed above wouldbe eligible and thereby included in our survey samples and within scope of the discussions withemployers. We deliberately excluded certain very vocational subjects, which have beenincluded in the scope of some previous STEM research, like Medicine and Dentistry, VeterinaryScience and Nursing, since graduates from these subjects are known to go predominantly intodirectly related STEM occupations (e.g. doctors, dentists, vets and nurses, respectively).
The question of whether to include students and/or graduates on combined courses (i.e. STEMand non-STEM disciplines, such as computing and business) was considered. We decided toinclude them partly on the grounds that it might be difficult to exclude them completely from thesurvey samples.

STEM Graduates in Non-STEM Jobs
206
Table A.7 Degree subject disciplines within project scope, using JACS subject classification scheme;individual key subjects in bold were considered to be key focus for study
JACS SUBJECT AREA JACS PRINCIPAL SUBJECT
Subjects allied to Medicine
(B0) Broadly-based programmes within Subjects allied toMedicine(B1) Anatomy, physiology & pathology(B2) Pharmacology, toxicology & pharmacy(B3) Complementary medicine(B4) Nutrition(B5) Ophthalmic(B6) Aural & oral sciences(B8) Medical technology(B9) Others in Subjects allied to Medicine
Biological Sciences
(C0) Broadly-based programmes within biological sciences(C1) Biology(C2) Botany(C3) Zoology(C4) Genetics(C5) Microbiology(C6) Sports science(C7) Molecular biology, biophysics & biochemistry(C8) Psychology(C9) Others in Biological Sciences
Agriculture & related subjects
(D0) Broadly-based programmes within agriculture & relatedsubjects(D3) Animal science(D4) Agriculture(D5) Forestry(D6) Food & beverage studies(D7) Agricultural sciences(D9) Others in Veterinary sciences, agriculture & relatedsubjects
Physical Sciences
(F0) Broadly-based programmes within physical sciences(F1) Chemistry(F2) Materials science(F3) Physics(F4) Forensic & Archaeological science(F5) Astronomy(F6) Geology(F7) Ocean sciences(F8) Physical & terrestrial geographical & env. sciences(F9) Others in Physical Sciences

STEM Graduates in Non-STEM Jobs
207
Continued…Table A.7 Degree subject disciplines within project scope, using JACS subjectclassification scheme; individual key subjects in bold were considered to be key focus for study
Mathematical Sciences
(G0) Broadly-based programmes within mathematicalsciences(G1) Mathematics(G2) Operational research(G3) Statistics(G9) Others in Mathematical & Computing Sciences(G91) Others in Mathematical Sciences
Computer Science
(G4) Computer Science(G5) Information systems(G6) Software engineering(G7) Artificial intelligence(G92) Others in Computing Sciences
Engineering & Technology
(H0) Broadly-based programmes within engineering &technology(H1) General engineering(H2) Civil engineering(H3) Mechanical engineering(H4) Aerospace engineering(H5) Naval architecture(H6) Electronic & electrical engineering(H7) Production & manufacturing engineering(H8) Chemical, process & energy engineering(H9) Others in Engineering(J1) Minerals technology(J2) Metallurgy(J3) Ceramics & glasses(J4) Polymers & textiles(J5) Materials technology not otherwise specified(J6) Maritime technology(J7) Industrial biotechnology(J9) Others in technology
Architecture, Building &Planning
(K0) Broadly-based programmes within architecture, building& planning(K1) Architecture(K2) Building(K3) Landscape design(K4) Planning (urban, rural & regional)(K9) Others in architecture, building & planning
After consultation with BIS, we agreed to identify certain individual target subjects, within and inaddition to the broad subject codes proposed above, including: Biology, Sports Science,Forensic science, Chemistry, Physics, Mathematics, Computer Science, and Engineering. Itwas agreed that we would specifically include students of Psychology, Geography andArchaeological sciences – subjects which are within the JACS groups above but for which there

STEM Graduates in Non-STEM Jobs
208
is a spectrum of more and less ‘scientific’ courses and study, although it would not be feasibleto sub-divide within these subjects.
A.2.5.2 STEM as an employment sector
In the employer strand of the research, we considered a number of ways of classifyingindustrial/business sectors as STEM or non-STEM. We started with a list of ‘core’ STEM sectors(based on SIC categories), identified from previous studies and our own preliminary discussionswith key organisations, where there seemed to be significant labour need for STEM graduates.We divided the remainder of sectors into two groups – those which we believed were likely to beemployers of STEM graduates but to a more limited extent and those which we believed wereunlikely to be. We used early employer interviews to explore the demand for STEM graduates inthese three groups, and used this information to refine our initial rough sector categorisation. Akey interview question was whether an employer had specific needs for STEM subjects in itsgraduate recruits, that is to say whether they sought to recruit graduates with specific STEMdegrees to fill certain posts. If not, did they have more general needs for STEM subjectknowledge or STEM skills, and so recruited STEM graduates for other reasons?We identified three clusters and named them ‘STEM Specialist’, ‘STEM Generalist’ and ‘Non-STEM’ employers, defined in the following way:
‘STEM Specialist’ employers which recruit graduates for roles where a degree in acertain STEM subject or group of STEM subjects is required for entry to a graduateprogramme or direct to appropriate jobs;
‘STEM Generalist’ employers which recruit STEM graduates or consider them to bepotentially suitable candidates within graduate programmes or roles which are open toholders of a range of degree subjects. Although they do not list a STEM subject as arequirement for entry, they see the skills or knowledge gained from study of STEMcourses as an advantage for the jobs being filled.
‘Non-STEM’ employers which make no distinction by degree subject at recruitment (atleast in relation to STEM subjects) and have no specific demand for STEM graduates,although they may still recruit them into graduate programmes or directly to jobs.
These groups were used to structure the employer sample in the research. In the student andgraduate surveys, however, we used these clusters as a guide to developing a simpler codingstructure, shown in Table A.8. This was used in the analysis of employment sectors, whichappeared as ‘dropdown’ options within our survey questionnaires. Many are narrower than theSIC group or groups in which they fall, but we found them to be more meaningful sectors forrespondents than pure SIC-based groups or sectors.

STEM Graduates in Non-STEM Jobs
209
Table A.8 STEM employer classification
Table A.8 STEM employer classification
Employment sector
SIC
200
7g
rou
p
SIC
cod
e
ST
EM
Sp
eci
alis
t
ST
EM
Gen
eral
ist
No
n-
ST
EM
Accountancy and businessservices M, K 66,69,70 GAdvertising, marketing and PR M 70,72 NArmed forces, defence andemergency services O 84 NBanking – investment K 64 GBanking – retail K 64 GBuilding and construction F 41,42,43 SCatering and hospitality I 56 NCharity and development work S 94? NChemical/pharmaceutical/biotech M, C 72,20 SCreative arts and cultural R 90,91 NEducation and training P 85 GEnergy and utilities D,E 35,36 SEngineering C,M 26-33,71 SEnvironment and agriculture A 1,2,3 SFashion and design C,M 13-15,74 NGovernment/public administration O 84 NHealth Q 86 SHuman resources and recruitment N 78 NInsurance K 65 GIT and communications J 61,62,63 SLegal services M 69 NManufacturing C VARIOUS SMedia J 58,59,60 NProperty L 68,77,81 NPublishing J 58 NRetail G 45,47 NScience M 72,74 SSocial care Q 87,88 GSport and leisure R 92,93 STourism I,N 55,79 NTransport and logistics H 49-53 S
A.2.5.3 STEM as an occupation
There was no clear model available from previous research for us to use or adapt to classify theoccupations (i.e. types of work or job functions) that STEM graduates hold or students seek.Drawing from the experiences of others, our review of previous research and our initial

STEM Graduates in Non-STEM Jobs
210
interviews with employers, we proposed three categories: ‘STEM core’ jobs, ‘STEM-related’ jobsand ‘Unrelated’ (to STEM) jobs.
‘STEM core’ jobs are the easiest to identify, and are likely to include roles such as:
scientific, research, analysis and development professionals (such as researchchemists, geologists, pharmacists);
engineering professionals (such as electrical, chemical or design engineers); IT professionals (such as computer systems managers, IT consultants, software
engineers); other associate scientific professional and technical jobs (such as lab technicians,
surveyors, ophthalmic opticians, etc).
‘STEM-related’ jobs are more difficult to identify clearly but we found it useful to try to separatethose that are more loosely related to STEM disciplines from those that are clearly ‘STEM core’.They are likely to include:
certain business professionals (such as auditors, financial consultants, underwriters,also some marketing, sales and legal roles relating to STEM Specialist businesses);
certain education professionals (secondary-level science teachers, lecturers); business managers in relevant sectors (healthcare, conservation); associate health professionals (psychologists, therapists); science administrators, policy advisers, etc.
The final category of ‘Unrelated’ jobs covers the remainder of jobs and occupational functionswhich are not within the first two categories.
It is no easy task to map these groups onto SOC codes, as there is some arbitrariness inclassification and some jobs are on the boundaries between the groups. Also, some jobs areseen as more relevant for certain STEM subjects than others – Mathematics graduates enteringfinance jobs, for example. We developed coding for the surveys using this classification andSOC codes at 3-digit level to allocate a respondent’s job function (given on a dropdown list inthe questionnaire) to one of these three STEM groups, as listed in Table A.9.

STEM Graduates in Non-STEM Jobs
211
Table A.9 Classification of STEM job functions
Table A.9 Classification of STEM job functions
Job function SOC codes
ST
EM
core
ST
EM
-re
late
d*
Un
rela
ted
Accountancy/finance 113,115 242 353 R*
Administration/clerical 111,114,115244,356
41,42 N
Building construction/skilled trades 212,312 243 53 SBusiness strategy/analysis 113, 353 N
Business/org. management 111,113 R*
Consulting 242,212 S
Creative/design 342 NCustomer support/client care 114 72 N
Editorial/writing 341 343 R
Education/teaching 231 R
Engineering/technology 212, 213, 311 SEnvironmental management 121 311 355 S
Food services/hospitality 122 621 N
Health and social care 221, 118321,322,323 244 S
Human resources 113,356, N
Equipment installation/maint/repair 311,313,524 S
Insurance 353 R
ICT management/development 113, 213, 313 SLegal 241 352 N
Logistics/distribution/transport 116 351 821 S
Marketing/market research 113, 354 N
Production/operations 112, 212, SProject management 113,212 S
Public relations/advertising 354, N
Purchasing/procurement 354 113 N
Quality assurance/safety 356, 311 SResearch and development 211, 212, 232 311 S
Retailing 116, 354 123 71 N
Sales/business development 71, 113 354 N
Security/protective services 117 331 NNote: * in the R column refers to it being R for some STEM graduates only
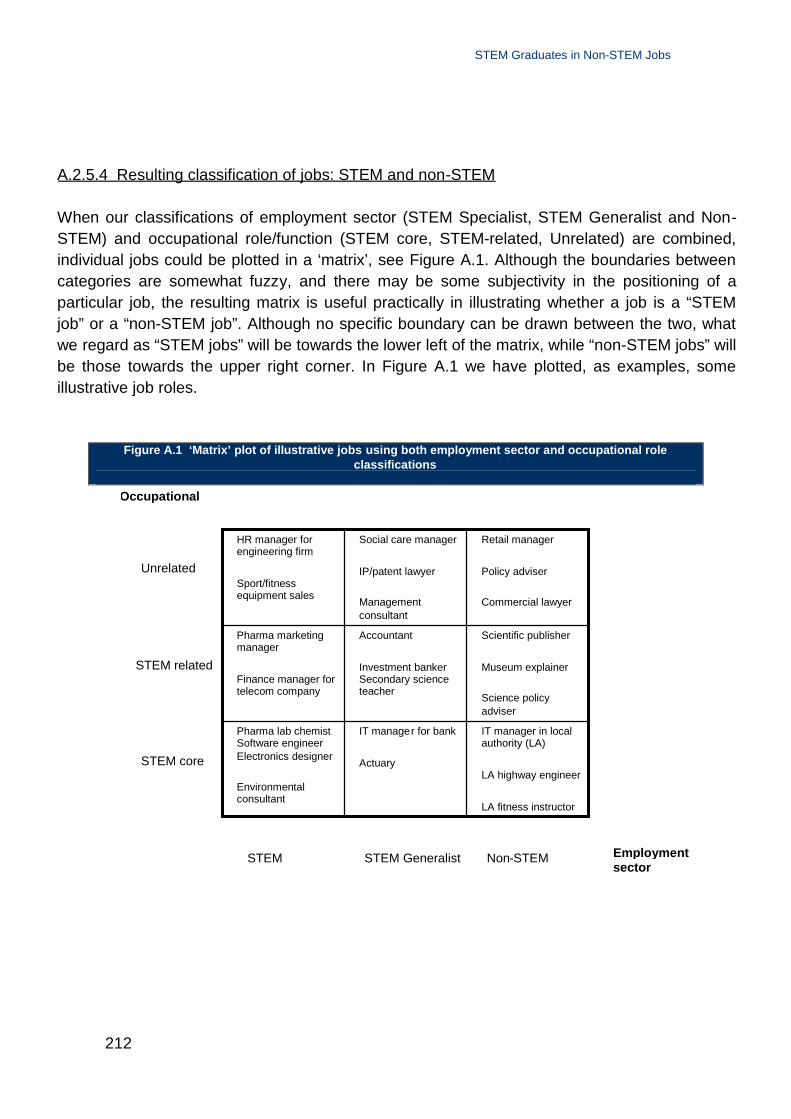
STEM Graduates in Non-STEM Jobs
212
A.2.5.4 Resulting classification of jobs: STEM and non-STEM
When our classifications of employment sector (STEM Specialist, STEM Generalist and Non-STEM) and occupational role/function (STEM core, STEM-related, Unrelated) are combined,individual jobs could be plotted in a ‘matrix’, see Figure A.1. Although the boundaries betweencategories are somewhat fuzzy, and there may be some subjectivity in the positioning of aparticular job, the resulting matrix is useful practically in illustrating whether a job is a “STEMjob” or a “non-STEM job”. Although no specific boundary can be drawn between the two, whatwe regard as “STEM jobs” will be towards the lower left of the matrix, while “non-STEM jobs” willbe those towards the upper right corner. In Figure A.1 we have plotted, as examples, someillustrative job roles.
Figure A.1 ‘Matrix’ plot of illustrative jobs using both employment sector and occupational roleclassifications
IT manager in localauthority (LA)
LA highway engineer
LA fitness instructor
IT manager for bank
Actuary
Pharma lab chemistSoftware engineerElectronics designer
Environmentalconsultant
Scientific publisher
Museum explainer
Science policyadviser
Accountant
Investment bankerSecondary scienceteacher
Product designer
Pharma marketingmanager
Finance manager fortelecom company
Logistics firm analyst
Retail manager
Policy adviser
Commercial lawyer
Social care manager
IP/patent lawyer
Managementconsultant
HR manager forengineering firm
Sport/fitnessequipment sales
Surveyor
Unrelated
STEM related
STEM core
Occupationalrole
STEMSpecialist
STEM Generalist Non-STEM Employmentsector

STEM Graduates in Non-STEM Jobs
213
A.3 Research methodology and samples
A.3.1 Quantitative surveys of STEM student career intentions
In order to obtain information on the career thinking and decision-making of students studying STEMdegree subjects in Higher Education, and their career intentions in particular, a quantitative onlinesurvey approach was devised. Final-year undergraduates were considered to be the core target, butit was decided to extend this to include Masters-level students, since many STEM undergraduatesstudy directly for M-level degrees (e.g. MSc or MEng) and a significant proportion of others undertakeseparate taught Masters courses. For the fullest possible view of those studying STEM in HigherEducation, a parallel survey was devised for PhD students.
The online questionnaire created for undergraduates and taught postgraduate students contained 30questions, of which a small number were open-ended. The questionnaire underwent two phases ofcognitive piloting by a handful of relevant students (in a range of subjects and universities), some ofwhich was observed. The final questionnaire was open for responses between 12 January and 11March 2010. The online questionnaire for doctoral postgraduate students, hereafter referred to asPhD students for brevity, was open for responses from 24 March until 29 April 2010.
A.3.1.1 Attraction strategies
For the online survey of STEM undergraduates and taught postgraduate students, an e-mailcampaign invited relevant students to participate. Outbound e-mails contained a hyperlink to theonline survey site and offered entry to a prize draw as an incentive for participation.
An e-mail was issued by Milkround Online, a commercial recruitment database of HE students, andrepeated two weeks later, to c.28,000 contacts held of final-year and Masters students in relevantsubjects. Concurrently, bespoke e-mails were circulated to a series of organisations and groups withcontacts within HE institutions for many of the target subject disciplines, whose assistance had beensought in advance. The individuals contacted were asked to forward an embedded e-mail to theirstudents inviting them to participate in the online survey. A separate e-mail inviting PhD students toparticipate was issued to contact lists held by CRAC and the Vitae Programme (on behalf ofResearch Councils UK).
The attraction strategy using the co-operation of numerous individuals and third parties to pass oninvitations had an inherent drawback in that there was no control over the number of studentsactually invited to participate. As a result, it was not possible to calculate a response rate. On theother hand, there were two major benefits (in comparison with use purely of a single e-mail list of aknown quantity). First, it enabled a much wider number of relevant students to be invited than wasavailable through any single contact list. Second, the coverage obtained would be somewhatrandomised, due to the wide but varying participation of individuals who forwarded e-mails to entiregroups of students. This more random coverage would avoid any potential bias introduced by

STEM Graduates in Non-STEM Jobs
214
reliance on a single list of contacts from a provider with whom, for example, students would need tohave registered (which might therefore not be representative of all relevant students).
A.3.1.2 Survey responses and sample dimensions: undergraduates and masters
A total of 7,568 students responded to the undergraduate and taught postgraduate survey, of whom91.5% had been recruited via the cooperative ‘referral’ e-mail campaign. In terms of completion rate,96% of those who started the survey completed all compulsory questions and reached the end. Evenamong those who did not complete the whole survey, many completed sufficient questions to beincluded in most analyses.
A number of responses were excluded from the survey analysis; duplicate responses, respondentswho had only completed the first section of the questionnaire, and 26 respondents from non-UKuniversities (some of whom could have been studying in the UK as part of their degree). This left7,294 respondents as the main undergraduate and taught postgraduate student sample.
Some of the respondents were not in their final year and others were not from the UK or EU/EEA,which was inevitable given the attraction strategy used (Table A.10). Overall, 4,298 (59%) ofrespondents were from the UK/EU/EEA and were in their final year or were postgraduate (masters)students, considered to be the core of the sample. Rather than exclude all ‘non-core’ respondentsfrom analysis, it was considered helpful to include them in certain analyses for comparison purposes.
Just over half (52%) of the UK respondents were male, but rather more (59%) of EU/EEA studentswere male and of students from the rest of the world (67%). For comparison, for the range of STEMsubject disciplines under investigation, the proportion of male full-time UK undergraduates was 56%in 2008/09 (derived from HESA, 2009). 38% of the UK taught postgraduate respondents werestudying part-time but only a very small proportion (4%) of UK undergraduates. Students studyingpart-time were coded to the nearest equivalent full-time year for analysis purposes.
Over a third (36%) of the UK taught postgraduates had gone straight on from their undergraduatedegree to postgraduate study and a further 5% had not worked since graduating, while 34% hadbeen employed in a permanent job. Considerably more (52%) of UK postgraduates on full-timetaught courses had entered directly after being undergraduate students, while a further 7% had notworked since graduating. However, most (71%) of those studying part-time had been employed in apermanent job (and 8% were still employed), while only 10% had come straight from being anundergraduate student.
Responses were received from students at 115 Higher Education institutions (see Appendix B, TableB.1 for full listing). Of these 42% students were at Russell Group universities, 23% at 1994 groupinstitutions and 36% at other UK universities (see Table A.11).

STEM Graduates in Non-STEM Jobs
215
Table A.10. Year of study, by nationality (undergraduates and taught postgraduates)
UK EU/EEA Rest of world Not answeredAll
respondentsYear ofStudy
Undergrad Number % Number % Number % Number % Number %
First/Second/Foundation
692 13 69 12 87 8 69 15 917 13
Placement/Penultimate 618 12 38 7 56 5 47 10 759 10
Final 3053 59 216 39 233 22 193 41 3695 51
Other 18 0 0 0 2 0 3 1 23 0
Completed 8 0 0 0 0 0 1 0 9 0
AllUndergrad 4389 85 323 58 378 35 313 66 5403 74
Postgrad 793 15 236 42 700 65 162 34 1891 26
Total 5182 100 559 100 1078 100 475 100 7294 10
0
Table A.11. University type, by nationality (undergraduates and taught postgraduates)
UK EU/EEA Rest of world Not answeredAll
respondents
University Number % Number % Number % Number % Number %
Russell 2179 42 241 43 459 43 161 34 3040 42
1994 1193 23 118 21 239 22 93 20 1643 23
Other UK 1807 35 200 36 379 35 213 45 2599 36
Notanswered 3 0 0 0 1 0 8 2 12 0
Total 5182 100 559 100 1078 100 475 100 7294 10
0
Table A.12 provides a regional breakdown of survey respondents, based on the home regions of theUK students. For comparison purposes HESA data on all UK students by region of their HigherEducation Institution (HEI) are shown in the final (right) column of the table. Although not completelyequivalent, the HESA data suggest that the distribution of survey respondents broadly reflects thenational breakdown, although with an apparent under-representation of London as a domicile amongsurvey respondents.
13% of UK respondents were from minority ethnic backgrounds and 5% reported that they had adisability or long term health condition that might affect their employment prospects.
Table A.12. Regional breakdown of UK undergraduate and taught postgraduate survey

STEM Graduates in Non-STEM Jobs
216
respondents
UK regionUndergraduate
%Postgraduate
%All UK
%
All UKstudents
byregion of
HEI
England: North West 10 9 10 10
England: North East 3 4 3 5
England: Yorkshire & Humber 5 7 5 8
England: East Midlands 6 7 6 7
England: West Midlands 8 9 8 8
England: East of England 4 4 4 5
England: London 11 12 11 17
England: South East 20 18 20 18
England: South West 11 8 10 7
Northern Ireland 6 6 6 2
Scotland 11 9 11 9
Wales 3 4 3 5
Other (e.g. Channel Islands) 2 2 2 *
Not answered 1 1 1 *
Number of cases 4389 793 5182
Only 7% (216) of UK final year undergraduates had been employed full-time in a job that wasintended to be permanent before they went to university. Not surprisingly, these students were older(78% aged 24 and over) than those students who had not worked (6% aged 24 and over), and moreof them were studying part-time (24%) than other finalists (1.5%).
Table A.13 provides a breakdown of respondents by JACS subject group based on the subjectcoding of all respondents. Some key individual subjects of particular focus in the project have beenidentified separately in the table.

STEM Graduates in Non-STEM Jobs
217
Table A.13 Subject breakdown (JACS subject codes): UK final year andpostgraduate respondents to undergraduate and Masters survey. Cohort
proportion derived from HESA, full-time UK undergraduates
Number %% of
cohort
A Medicine and Dentistry 25 1 n/a
B Subjects allied to Medicine 208 5 16C Biological Sciences 895 23 29
Biology and related 428 11 10
Psychology 385 10 11Sports Science 82 2 8
D Veterinary Science / Agriculture 13 0 n/a
F Physical Sciences 1161 30 14
Chemistry 242 6 3Physics 275 7 3
Geology 153 4 1Forensic Science/Archaeology 106 3 2
Geography 320 8 3G Mathematical & Computing Sciences 636 17 20
Mathematics 282 7 6Computer Science 354 9 14
H Engineering 688 18 21
Civil engineering 196 5 4
Mechanical engineering 129 3 4Aerospace engineering 47 1 2
Electronic & electrical 114 3 4Chemical, process & energy 59 2 1
J Technology 41 1 1
K Architecture, Building and Planning 85 2 n/a
Other Science (unspecified / joint degrees) 55 1Non-STEM subjects 26 1Not answered 4 0Total cases 3837 100
For a rough comparison, the proportions of full-time UK undergraduate students for 2008/09 aregiven for the main range of subject groups investigated (derived from HESA, 2009). This showsthat the overall sample obtained under-represented students in Subjects allied to Medicine, andalso under-represented Sports Science, while somewhat over-representing the PhysicalSciences. However, the sample did provide good numbers of respondents from the subjects ofparticular focus in the study.
In subsequent analyses, any respondents studying Medicine and Dentistry, Veterinary Scienceor Agriculture, and Nursing among those studying Subjects allied to Medicine were excludedfrom the analysis, along with those students studying other Science subjects. Students ofTechnology and Engineering group subjects were combined into a single category.

STEM Graduates in Non-STEM Jobs
218
Just over a quarter (27%) of the UK final year undergraduates were studying for enhanced orintegrated Masters degrees. However, these students were concentrated in a small number ofsubject areas where they made up a substantial proportion of the final year undergraduatecohort, particularly Chemistry (69%), Engineering & Technology (60%), Physics (51%) andMathematics (25%), but 10% or less of the final year cohort in most other subjects.
A significant proportion of taught postgraduate students were studying a different subject as apostgraduate from the one they had studied as an undergraduate. While it is difficult to quantifythis accurately, given the relatively small number of respondents and also because many hadmoved into cognate disciplines, it is clearer which subjects are net ‘exporters’ or ‘importers’ (i.e.have fewer or more students studying them as postgraduates than they had asundergraduates). The main ‘importers’ are the more explicitly vocational subjects – notablySubjects allied to Medicine, Computer Science, Engineering & Technology, Architecture,Building and Planning, and Forensic Science/Archaeology – while the net ‘exporters’ are thepure sciences – Physics, Chemistry and Biological Sciences.
A.3.1.3 Survey responses and sample dimensions: PhD students
A total of 4,550 PhD students responded to the survey of doctoral researchers. This survey wasconducted in conjunction with the Vitae Programme and many respondents were studying non-STEM subjects. Once duplicate responses, incomplete responses and respondents from non-UK universities were excluded, 4,307 PhD student responses were retained for analysis, 2,908of these researching STEM subjects. Those studying Medicine and Dentistry; VeterinaryScience, Agriculture and related subjects; and Nursing, were excluded, to leave 2,732respondents as the main STEM PhD student sample.
Inevitably, many of these respondents were in different years of their PhD and others were notfrom the UK or EU/EEA (see Table A.14), but it was considered helpful to include a wider rangeof years (than of the undergraduates) in certain analyses for comparison purposes. The smallnumber of PhD respondents who reported that they were writing up, waiting for their viva, or hadjust completed, were coded as being in final year.

STEM Graduates in Non-STEM Jobs
219
Table A.14 Year of study, by nationality (PhD students in STEM subjects)
UK EU/EEA Rest of world Not answered All respondentsYear ofStudy Number % Number % Number % Number % Number %
First/Second 974 53 217 51 221 60 48 51 1460 53
Third offour 242 13 32 8 32 9 16 17 322 12
Final 627 34 174 41 116 31 30 32 947 35
Other 2 0 0 0 1 0 0 0 3 0
Total 1845 100 423 100 370 100 94 100 2732 100
Just 7% of the STEM PhD students were studying part-time (compared to 24% of thosestudying non-STEM subjects) and they have been coded to the nearest full-time equivalent yearfor analysis purposes.
Table A.15 Regional breakdown of UK (PhDsurvey respondents)
UK region All STEM%
England: North West 9
England: North East 5
England: Yorkshire and theHumber
7
England: East Midlands 6
England: West Midlands 7
England: East of England 4
England: London 6
England: South East 20
England: South West 13
Northern Ireland 5
Scotland 11
Wales 4
Other (e.g. Channel Islands) 2
Not answered 1
Number of cases 1845

STEM Graduates in Non-STEM Jobs
220
The STEM PhD students were studying at 106 UK universities and research institutes (seeAppendix B, Table B.2 for a full listing). Of these, 61% were studying at a Russell Groupuniversity, 21% at a 1994 group university and 19% at other universities and research institutes.
Just over half (51%) of the UK PhD respondents were female, as were 52% of EU/EEAstudents, but the majority (56%) of students from the rest of the world were male. 13% of UKrespondents were from minority ethnic backgrounds and 4% reported that they had a disabilityor long term health condition that might affect their employment prospects. Table A.15 showsthe regional breakdown of the PhD survey respondents, based on the home regions of the UKstudents, which suggests that the survey received good geographical coverage, as had theundergraduate and Masters Survey. A breakdown of the subjects being studied by the PhDstudents is shown in Table A.16.
Almost half (48%) the UK final year PhD students had gone straight on to their PhD from anundergraduate degree and 20% from a Masters degree. Very few (2%) reported that they haddone a research only Masters qualification, while 16% had been employed in a job that wasintended to be permanent and 11% employed in temporary or casual work (including short-termresearch contracts).

STEM Graduates in Non-STEM Jobs
221
Table A.16. Subject of study, by nationality (PhD survey respondents)
UK EU/EEA Rest of world Not answeredAll
respondentsSubject
Number % Number % Number % Number % Number %
Architecture,Building andPlanning
33 2 2 0 14 4 3 3 52 2
BiologicalSciences
370 20 85 20 46 12 15 16 516 19
BiomedicalSciences 190 10 51 12 37 10 11 12 289 11
Engineering 259 14 62 15 104 28 22 23 447 16
EnvironmentalSciences
69 4 30 7 16 4 3 3 118 4
Forensic/Archae-ologicalSciences
28 2 12 3 6 2 1 1 47 2
Geography 41 2 7 2 6 2 6 6 60 2
MathematicalSciences 85 5 17 4 9 2 5 5 116 4
ComputerScience 90 5 23 5 37 10 4 4 154 6
Other subjectsallied toMedicine
98 5 19 4 14 4 1 1 132 5
PhysicalSciences
420 23 73 17 51 14 16 17 560 20
Psychology 114 6 32 8 15 4 3 3 164 6
Sports Science 24 1 6 1 4 1 0 0 34 1
Technology-related subjects 24 1 4 1 11 3 4 4 43 2
Total1845 100 423
100 370
100 94
100 2732 100
A.3.2 Interviews with STEM graduates
A key aspect of the project was to obtain information about the real experiences of STEMgraduates who had entered the labour force, to complement the views and career ‘intentions’ ofSTEM students who mostly were yet to make that transition. The principal targets were STEMgraduates who were not working in STEM occupations or sectors, but STEM graduates whoworked in STEM occupations and sectors were also targeted in order to document and comparetheir experiences, as well as a smaller number of graduates of other disciplines (working outsideSTEM) for comparative purposes. It was agreed that ‘early career’ graduates who had been in

STEM Graduates in Non-STEM Jobs
222
the workplace for 1-5 years would be the core focus, in order that they would have relativelygood recollection of their perceptions and decision-making around graduation, but in work longenough for them to have genuine experiences in the labour force. Some flexibility was adoptedin terms of time since graduation as the sample unfolded and to aid recruitment of intervieweeswith other criteria.
A qualitative method was used because it was not believed feasible to identify or reach asufficiently large sample of STEM graduates working outside STEM occupations for aquantitative survey. On the other hand, a significant number of graduates was needed in orderfor the sample to include graduates with a range of agreed characteristics – key degreesubjects, gender, and occupational and employment sector. However, the sample was neitheraimed to be nor could be representative of the population of STEM graduates.
Telephone interviews were selected as the most appropriate methodology, along with a lessernumber (about 20% by proportion) of face-to-face interviews to provide more in-depth insightsand information. A semi-structured interview was devised for use in telephone interviews, withslight revision for the face-to-face interviews. The structure combined certain closed questionswith open-ended questions and the opportunity to collect deeper insights and personal views.
A total of 555 interviews were conducted during the period December 2009 to early June 2010,of which 70 were face-to-face. The telephone interviews were undertaken by a specialised sub-contractor, Employment Research Ltd. CRAC’s own researchers conducted the face-to-faceinterviews.
A.3.2.1 Attraction strategies
Obtaining a sample of STEM graduates in employment who were prepared to undertakeinterviews, at this large scale, and reflective of a range of characteristics and employmentsectors, was challenging. The very nature of the main target group – STEM graduates not nowworking in STEM occupations – meant that many of the target graduates could be relativelyharder to reach than, for example, Engineering graduates working for engineering companies,and some might be found in somewhat unpredictable occupations. It had originally been hopedthat this could be achieved using a series of parallel strategies:
Contact with graduates via specific employers; Contact with graduates via existing networks of varying kinds; Contact directly with graduates whose details had been recorded in existing research
studies, through which specific occupational and degree subject targeting might befeasible;
Contact directly with graduates selected within other groups, such as university alumni,also potentially enabling some targeting.

STEM Graduates in Non-STEM Jobs
223
E-mails inviting relevant graduates to participate in the research were issued via a variety ofnetworks, including STEM Ambassadors, Bright Futures (student) Societies’ alumni, TeachFirst, the Cambridge Network and others. With the exception of the first of these, from whichnearly 50 volunteers emerged (although all within STEM occupations), response levels to theseinvitations were very poor, and contributed little to the sample.
Discussions took place with a number of university careers services with a view to targetinggraduates within their alumni, but none of these came to fruition. Although careers serviceswere interested in assisting in the project, the relevant data were held by the universities’ alumnioffices which, presumably, saw less value in collaboration and did not respond positively.Respondents to the Destinations of Leavers from Higher Education (DLHE, or L-DLHE) surveys– potentially an ideal dataset – could not be contacted due to privacy restrictions. Contact with anumber of other organisations with databases of graduates in employment did not lead farbecause of limitations in the type of data held.
This left employers as the only major conduit for invitations to relevant graduates to volunteerfor interviews, and the overwhelming majority of graduates interviewed were recruited in thisway. Over 150 employers were approached, one way or another, including organisations withinthe CRAC and CIHE networks, those where icould career stories14 had been filmed, and othersthrough personal contacts. This usually involved dialogue with senior members of HumanResources (HR) or graduate recruitment teams, who generously provided assistance. In mostcases, the employer circulated an e-mail to employees, who responded to CRAC with contactand eligibility details. Relatively few companies were able to identify STEM graduates from theirHR management information systems, which suggested that most did not consider degreesubject to be critical in managing employee development.
Interviews were secured and conducted with individuals from 128 different employers (including10 different Government departments) as well as a few who were self-employed. The number ofgraduates from each particular employer was generally very small (1-5); with 10 or moregraduates recruited from only 12 employers. One employer, a large accountancy firm, provideda particularly large number of potential graduates, but not all of whom were brought into thesample in order to avoid any imbalance.
The volunteer recruitment process was extremely labour-intensive and fieldwork took over sixmonths. However, progressively approaching new employers enabled a continuous re-focus ofrecruitment effort, resulting in the desired balanced range of demographic and employmentcharacteristics in the sample. The rate of completion of telephone interviews was exceptionallyhigh (485 achieved from 513 volunteers, or 94%) because the contacts supplied had allvolunteered for interview and understood why they were being contacted.
14 icould is a national online resource containing films of over 1000 personal career stories, told by individuals across theoccupational spectrum, developed and managed by CRAC.

STEM Graduates in Non-STEM Jobs
224
However, it was reliance on this attraction strategy had other impacts in terms of the samplegenerated. The ‘contactability’ of employers, and the need for assistance of an HR orrecruitment professional, almost certainly led to an over-representation of larger and moreestablished employers of graduates within the sample. The number of graduates working forsmall and medium enterprises (SMEs) was relatively limited, purely due to the difficulty ofreaching and engaging them, while certain professions (teaching, especially) presentedparticular problems as access via their employers was not feasible.
Nonetheless, the substantial number of interviews conducted offered a large amount of detailedinformation from graduates across a wide range of employment sectors and occupations,reflective of graduates with a wide range of degree subjects and other key personalcharacteristics (such as gender and location).
A.3.2.2 Sample characteristics and balance
Table A.17 shows the personal characteristics of all the graduates interviewed. We havedistinguished those with first degrees in STEM subjects from those with degrees in non-STEMsubjects. Overall, 53% of the graduates were male and 89% were aged under 30. More of thenon-STEM graduates were female (70%) than the STEM graduates (43%). Nearly all thoseaged over 30 had recently completed postgraduate courses. A small number had undertakentheir first degree as ‘mature’ students, in a subject closely related to their career, although thesewere deliberately not a major focus for the research due to the very distinct linkage betweendegree and occupation.

STEM Graduates in Non-STEM Jobs
225
Table A.17 Background details of interview respondents
STEM Graduates Non-STEM Graduates All respondents
Gender Number % Number % Number %
Male 266 57 26 30 292 53
Female 200 43 62 70 262 47
Notanswered 1 0 0 0 1 0
Age
21 to 24 179 38 41 47 220 40
25 to 29 228 49 45 51 273 49
30 to 39 50 11 2 2 52 9
40 and over 6 1 0 0 6 1
Notanswered 4 1 0 0 4 1
Nationality
British 435 93 81 92 516 93
EU / EEA 12 3 1 1 13 2
Rest of world 9 2 4 5 13 2
Notanswered 11 2 2 2 13 2
Total cases 467 100 88 100 555 100
Nearly all the graduates interviewed were British nationals (93%) and 11% were from minorityethnic backgrounds, while 8% reported that they had a disability or long-term health condition.
In terms of occupational function, 27% of the STEM graduates worked in Accountancy/ finance,16% in Engineering/technology, 10% in Administration/clerical work (mainly in Governmentdepartments), with smaller proportions in job functions such as ICT, project management andresearch and development. The remaining third were spread thinly over 22 different jobfunctions (see Table A.18).

STEM Graduates in Non-STEM Jobs
226
Table A.18 Occupational function of interview respondents (all graduates interviewed)
STEM Graduates Non-STEM Graduates All respondents
Function Number % Number % Number %
Accountancy/finance 127 27 19 22 146 26
Administration/clerical 48 10 26 30 74 13
Building construction/skilledtrades 2 0 0 0 2 0
Business strategy/analysis 7 1 1 1 8 1
Business/organisationmanagement 11 2 3 3 14 3
Consulting 21 4 2 2 23 4
Creative/design 1 0 0 0 1 0
Customer support/client care 2 0 0 0 2 0
Editorial/writing 9 2 1 1 10 2
Education/teaching 20 4 1 1 21 4
Engineering/technology 74 16 0 0 74 13
Environmental management 1 0 0 0 1 0
Health and social care 5 1 1 1 6 1
Human resources 2 0 5 6 7 1
Insurance 6 1 0 0 6 1
ICT management/development 29 6 1 1 30 5
Legal 17 4 1 1 18 3
Logistics/distribution/transport 7 1 1 1 8 1
Marketing/Market Research 4 1 4 5 8 1
Production/operations 2 0 0 0 2 0
Project management 24 5 6 7 30 5
Public relations/advertising 0 0 1 1 1 0
Purchasing/procurement 10 2 3 3 13 2
Quality assurance/safety 1 0 0 0 1 0
Research and development 24 5 3 3 27 5
Retailing 5 1 6 7 11 2
Sales/business development 7 1 2 2 9 2
Security/protective services 1 0 0 0 1 0
Other 0 0 1 1 1 0
Total cases 467 100 88 100 555 100

STEM Graduates in Non-STEM Jobs
227
By employment sector, 25% of the STEM graduates worked in Accountancy/bbusinessservices, 17% in Government/public administration, 9% in Engineering, 9% in Energy/utilitiesand 6% in Education and training. The rest worked across 20 other employment sectors (seeTable A.19).
Table A.19 Employment sector of interview respondents (all graduates interviewed)
STEM Graduates Non-STEM Graduates All respondents
Sector Number % Number % Number %
Accountancy and businessservices 115 25 16 18 131 24
Armed forces, defence andemergency services 4 1 0 0 4 1
Banking - investment 13 3 0 0 13 2
Banking - retail 1 0 0 0 1 0
Building and construction 3 1 0 0 3 1
Charity and development work 6 1 3 3 9 2
Chemical/pharmaceutical/biotech 7 1 1 1 8 1
Creative arts and cultural 6 1 0 0 6 1
Education and training 28 6 1 1 29 5
Energy and utilities 42 9 1 1 43 8
Engineering 43 9 0 0 43 8
Environment and agriculture 2 0 0 0 2 0
Government and publicadministration 80 17 41 47 121 22
Health 8 2 2 2 10 2
Human resources andrecruitment 0 0 1 1 1 0
Insurance 3 1 1 1 4 1
IT and communications 24 5 0 0 24 4
Legal services 13 3 0 0 13 2
Manufacturing 8 2 2 2 10 2
Media 3 1 0 0 3 1
Publishing 13 3 4 5 17 3
Retail 10 2 10 11 20 4
Science 21 4 0 0 21 4
Sport and leisure 1 0 0 0 1 0
Tourism 4 1 1 1 5 1
Transport and logistics 9 2 3 3 12 2
Other 0 0 1 1 1 0
Total cases 467 100 88 100 555 100

STEM Graduates in Non-STEM Jobs
228
The non-STEM graduates interviewed worked mainly for the large employers who had suppliedmultiple STEM graduate volunteers, and were concentrated in Accountancy/finance (22%) andAdministration/clerical work (30%) with relatively small numbers in a wide range of otherfunctions. By sector they worked mainly in Government/public administration (47%),Accountancy/business services (18%) and Retail (11%).
Both the employment sector and the job functions were broken down into three groups, asdescribed in section A.2, shown in Table A.20. This shows that 41% of STEM graduaterespondents were working in STEM Core jobs, 37% in STEM-related jobs and 22% in Unrelatedjobs. By employment sector, they were split relatively evenly between those working for STEMSpecialist (36%), STEM Generalist (34%) and non-STEM employers (30%), reflecting thetargeting achieved during volunteer recruitment. Consideration of whether any specific jobshould be considered a “STEM job” or not could be made using the combination of sector andfunction classifications, as shown in Figure A.1.
Table A.20 Employment sector and function of interview respondents
STEM Graduates Non-STEM Graduates All respondents
STEM Sector Number % Number % Number %
STEM Specialist 168 36 9 10 177 32
STEM Generalist 160 34 18 20 178 32
Non-STEM 139 30 61 69 200 36
STEM Function
STEM Core 190 41 14 16 204 37
STEM-related 173 37 23 26 196 35
Unrelated 104 22 51 58 155 28
Total cases 467 100 88 100 555 100
While the majority of non-STEM graduates were working in non-STEM employment sectors(69%) and in unrelated job functions (59%), a small number reported that they were working inSTEM Specialist sectors (10%) and in STEM Core functions (16%).
The recruitment of volunteers aimed to provide interviews with respondents across a range ofSTEM degree subjects. A good spread was achieved across the target disciplines (see TableA.21). The graduates who had studied non-STEM subjects mainly had degrees inArts/Humanities (27%), Social Sciences (24%), Modern Languages (13%), Economics (11%)and Business (10%).
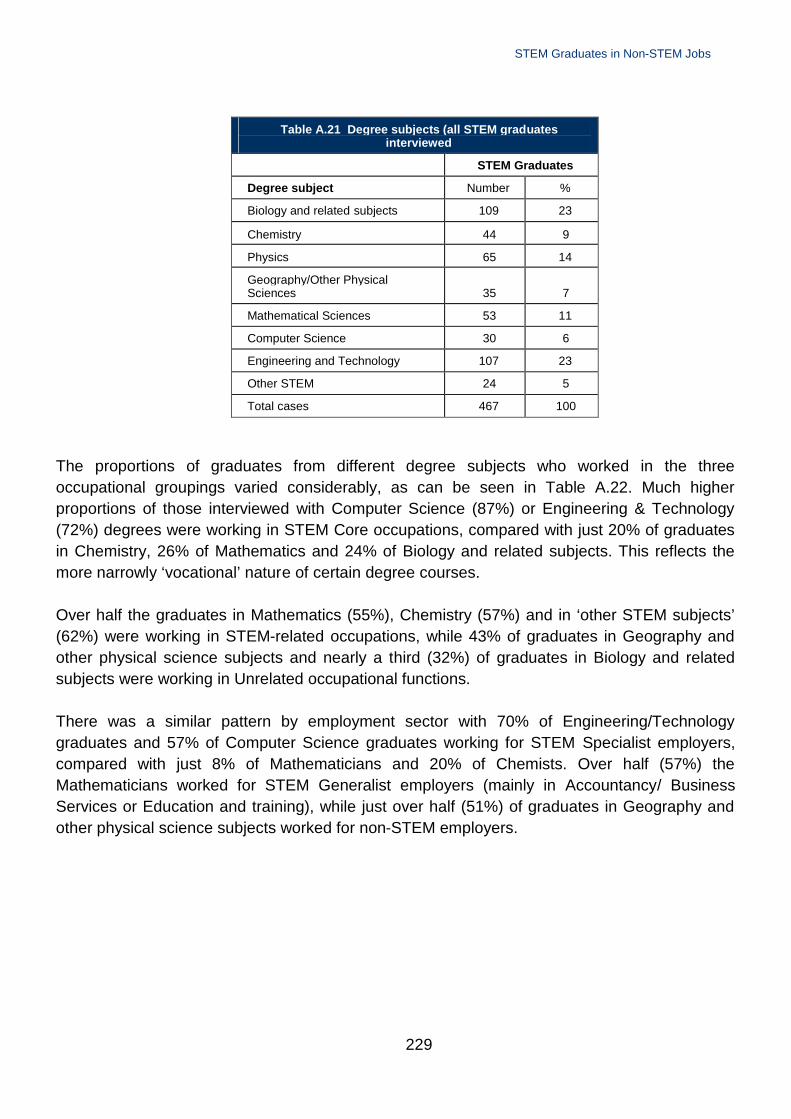
STEM Graduates in Non-STEM Jobs
229
Table A.21 Degree subjects (all STEM graduatesinterviewed
STEM Graduates
Degree subject Number %
Biology and related subjects 109 23
Chemistry 44 9
Physics 65 14
Geography/Other PhysicalSciences 35 7
Mathematical Sciences 53 11
Computer Science 30 6
Engineering and Technology 107 23
Other STEM 24 5
Total cases 467 100
The proportions of graduates from different degree subjects who worked in the threeoccupational groupings varied considerably, as can be seen in Table A.22. Much higherproportions of those interviewed with Computer Science (87%) or Engineering & Technology(72%) degrees were working in STEM Core occupations, compared with just 20% of graduatesin Chemistry, 26% of Mathematics and 24% of Biology and related subjects. This reflects themore narrowly ‘vocational’ nature of certain degree courses.
Over half the graduates in Mathematics (55%), Chemistry (57%) and in ‘other STEM subjects’(62%) were working in STEM-related occupations, while 43% of graduates in Geography andother physical science subjects and nearly a third (32%) of graduates in Biology and relatedsubjects were working in Unrelated occupational functions.
There was a similar pattern by employment sector with 70% of Engineering/Technologygraduates and 57% of Computer Science graduates working for STEM Specialist employers,compared with just 8% of Mathematicians and 20% of Chemists. Over half (57%) theMathematicians worked for STEM Generalist employers (mainly in Accountancy/ BusinessServices or Education and training), while just over half (51%) of graduates in Geography andother physical science subjects worked for non-STEM employers.

STEM Graduates in Non-STEM Jobs
230
Table A.22 Current employment sector and function, by undergraduate subject studied (all STEM graduates)
Sector
Bio
logy
and
rela
ted
Che
mis
try
Phy
sics
Geo
gra
phy/
Oth
erP
hysi
cal
Sci
ence
s
Mat
hs
Com
pute
rS
cien
ce
Eng
inee
ring
and
Tech
nolo
gy
Oth
erS
TE
Msu
bjec
ts
All
STE
M
STEM Specialist 23 20 38 26 8 57 70 29 36
STEM Generalist 38 43 31 23 57 23 25 42 34
Non-STEM 39 36 31 51 30 20 13 29 30
Function
STEM Core 24 20 38 40 26 87 72 21 41
STEM-related 44 57 37 17 55 3 25 63 37
Unrelated 32 23 25 43 19 10 11 17 22
Count 109 44 65 35 53 30 107 24 467

STEM Graduates in Non-STEM Jobs
231
Table A.23 Higher education background of interview respondents
STEM Graduates Non-STEM Graduates All respondentsHighestqualification Number % Number % Number %
Undergraduate 353 76 69 78 422 76
Postgraduate 114 24 19 22 133 24
Degree class
1st 162 35 24 27 186 34
2:1 234 50 54 61 288 52
2:2 45 10 9 10 54 10
3rd 3 1 0 0 3 1
Pass 11 2 1 1 12 2
Other 2 0 0 0 2 0
Missing 10 2 0 0 10 2
University
Russell 300 64 46 52 346 62
1994 88 19 25 28 113 20
Other UK 72 15 12 14 84 15
European 5 1 1 1 6 1
USA/Canada 1 0 2 2 3 1
Rest of world 0 0 2 2 2 0
Not answered 1 0 0 0 1 0
Total cases 467 100 88 100 555 100
Just under a quarter (24%) of the STEM graduates interviewed had a postgraduate degree,while 64% had attended Russell Group universities (see Table A.23) and 86% had aobtained a first or upper second class degree. The background of the non-STEM graduateswas relatively similar, reflecting their similar employers.
A number of the STEM graduates had gone on to study a non-STEM subject atpostgraduate level, to support a move to a new career direction (such as, but notexclusively, teaching or law), while two of the non-STEM graduates had done postgraduatequalifications in IT (i.e. a STEM course).
Almost all had been full-time students. Although the proportion who have undertaken part-time degrees is significant in the overall graduate population, they were not targeted in thisresearch. The majority of part-time degrees are undertaken while working, frequently withsupport from the employer, which almost certainly reflects that the degree subject is closelyrelated to occupation, and it is likely that the qualification has been studied directly for

STEM Graduates in Non-STEM Jobs
232
advancement in that job or career, see NIESR (2010). As a result it was thought that theywould add little to this study.
It is not surprising, given the way that they were recruited, that the non-STEM graduatesinterviewed had similar backgrounds to the STEM graduates in terms of where they hadbeen to university and the level of qualifications obtained. Nonetheless, there are severalkey points to note about both the STEM and non-STEM graduates who were interviewed:
They were highly qualified; The vast majority had been to Russell or 1994 Group universities; Many, but not all, were working for large and prestigious employers.
They therefore mainly represent a group of ‘strong’ graduates who would have been highlyattractive to employers and were now in ‘good’ jobs. Although they were a diverse group interms of subjects studied and qualifications obtained, and worked across a wide range ofemployment sectors and occupations, they were not (and had not been intended to be) afully representative sample of STEM and non-STEM graduates in employment.
A.3.3 Employer interviews
Employers are clearly crucial in any investigation of the employment and practical careerdecisions of graduates. Their recruitment strategies and skills demands impose ‘external’constraints upon graduates’ career decisions and choices. It has been hypothesised thatmany STEM graduates could be working outside STEM occupations not because that wastheir career aim but because they were unable to secure employment within STEMoccupations, conceivably due to the demands of the employers for particular skills.
A series of dialogues with employers was held between October 2009 and March 2010 toobtain information about their recruitment strategies in respect of STEM graduates, andtheir practical experiences of the supply of and demand for STEM-qualified graduates. Theirperceptions of STEM graduate applicants and application strategies could also be useful tocomplement the primary research findings from STEM students and graduates. Theseemployer discussions were conducted by CIHE as individual face-to-face or telephoneinterviews, supplemented by two group discussions.
Employers covering a wide range of industrial and services sectors were targeted,structuring the sample around the three main employer groups utilised throughout thisreport: STEM Specialist employers, STEM Generalist employers and Non-STEMemployers.
Thirty individual interviews and two discussion groups were undertaken, which covered 51different employers (organisations or divisions of business groups) in total. In addition, an

STEM Graduates in Non-STEM Jobs
233
interview with a recruitment consultant was undertaken to provide a broader perspective.The discussion groups were attended by 26 organisations: one was focused on the publicsector and the second on financial services, held with the assistance of the AGR(Association of Graduate Recruiters). Five organisations within the discussion groups hadbeen interviewed individually so have not been counted twice in the total of 51 employers.The 51 employers were classified as 15 STEM Specialists and 36 STEM Generalists ornon-STEM employers.
In the prevailing economic climate, there was some reticence or lack of enthusiasm to takepart in interviews, as a result of which many more employers had to be approached thanhad been envisaged originally. This also meant that many employers preferred to beinterviewed by telephone, which tended to be less time-consuming for the employer. Theinterviews used a semi-structured format, although this evolved with time and tended tovary with the nature of the employer.
A.3.4 Implications of the nature of the samples
The samples achieved in the quantitative surveys of undergraduates and taughtpostgraduate students, and doctoral students, were substantial and also comparedreasonably well with national cohort proportions for some key observable demographiccharacteristics, at least for the main subjects under scrutiny. On this basis, and the in-builtelement of randomness introduced through the attraction strategy, there seems little reasonto believe that the samples are not at least reasonably representative of their respectivenational cohorts (and at least as robust as those used in many other studies).
The sample of graduates interviewed, on the other hand, was never intended to berepresentative of either STEM graduates now in employment, or of STEM graduatesworking in ‘non-STEM’ jobs. Instead the sample was designed to obtain understanding ofthe career decisions of a range of different STEM graduates who had made different careerchoices, with particular emphasis on those who had entered occupations not closely relatedto their degree, across a range of different degree subjects and other key characteristics.
Due to the recruitment strategy, however, numerically there was a concentration ofgraduates who worked for larger organisations with established graduate recruitmentstructures, despite the wide range of 128 employers in total. Given the relatively higherentry criteria for those ‘premier’ graduate employers, it was perhaps inevitable that themajority of the graduates interviewed were high achievers academically, reflected in thehigh proportion with ‘good’ degrees and from Russell Group universities. This certainlymeans that the graduates interviewed are not representative of all STEM graduates, but thissub-population is of strong interest with sufficient qualifications to enter many differentoccupational sectors. As relatively high achievers they would be the type of graduates whowould be targeted by employers competing in the graduate recruitment marketplace. In

STEM Graduates in Non-STEM Jobs
234
many cases the employers interviewed were similar, i.e. many larger firms which sought‘good’ degrees, and this largely mirrored the focus of the graduate interviews
A.3.5 Data presentation
Data from the online surveys and graduate interviews are presented in Chapters 3 and 4 intextual, tabular and graphical formats. All data are unweighted. Percentages in the tablespresented may not always sum to 100% due to rounding of individual items and, in somecases, percentages sum to more than 100% where respondents were able to give multipleresponses to certain questions. The number of cases included in tables varies due to thenumber of respondents who completed each question/section of the questionnaire. Findingsfrom the interviews and discussions with employers are presented in Chapter 5.

STEM Graduates in Non-STEM Jobs
235
Appendix B: Additional tablesThe numbering of tables within this Appendix follows the chapters to which they relate (and inwhich they are referred to). Thus, tables relating to Chapter 3 are numbered Table B3.1onwards, and so on. Tables B.1 and B.2, at the rear, refer to Appendix A, section A.3.1.
All data are expressed as percentages except where shown (i.e. response count figures, N).
Appendix Figure B3.1 How helpful was skills/experience gained from work experience for degree
0% 10% 20% 30% 40% 50% 60% 70% 80% 90% 100%
Forensic Science/Archaeology
Architecture, Building and Planning
Subjects allied to Medicine
Other Physical Sciences
Chemistry
Biological Sciences
Engineering and Technology
Computer Science
Physics
Sport Science
Geography
Psychology
Mathematical Sciences
All UK final years
Not answered Not at all helpful Not very helpful Quite helpful Very helpful

STEM Graduates in Non-STEM Jobs
236
Appendix Figure B3.2 How helpful was skills/experience gained from work experience for career and workchoices
0% 10% 20% 30% 40% 50% 60% 70% 80% 90% 100%
Subjects allied to Medicine
Computer Science
Engineering and Technology
Forensic Science/Archaeology
Architecture, Building and Planning
Chemistry
Biological Sciences
Other Physical Sciences
Physics
Sport Science
Psychology
Mathematical Sciences
Geography
All UK final years
Not answered Not at all helpful Not very helpful Quite helpful Very helpful

STEM Graduates in Non-STEM Jobs
237
Appendix Table B3.1: Career plans by subject of study (UK final year undergraduates and taught postgraduates)
UK Final YearUndergraduates
Sub
ject
sal
lied
toM
edic
ine
Bio
logi
calS
cien
ces
Spo
rtS
cien
ce
Psy
chol
ogy
Ch
emis
try
Phy
sics
Oth
erP
hysi
calS
cien
ces
Mat
hem
atic
alS
cien
ces
Co
mpu
terS
cien
ce
Eng
inee
ring
and
Tec
hnol
ogy
Arc
hite
ctur
e,B
uild
ing
and
Pla
nnin
g
Geo
grap
hy
For
ensi
cS
cien
ce/
Arc
haeo
logy
All
Definitely want to pursuecareer in occupation directlyrelated to degree
55 51 47 48 48 43 64 45 59 62 62 42 44 52
Might want to pursue career inoccupation related to degree
31 32 44 36 33 36 27 40 33 30 36 45 41 34
Don't think want to pursuecareer in occupation related tomy degree
6 9 5 11 11 12 4 10 5 6 2 6 11 8
Definitely do not want topursue career in occupationrelated to degree
7 5 3 4 7 6 4 2 1 1 0 3 3 3
Do not know 1 3 2 2 1 3 1 2 1 1 0 3 1 2
Count 146 371 64 309 213 236 166 233 272 578 47 259 75 2969UK Taught PostgraduatesDefinitely want to pursuecareer in occupation directlyrelated to degree
90 86 82 88 80 68 74 49 77 84 81 65 79 77
Might want to pursue career inoccupation related to degree 6 12 12 12 20 29 21 29 20 12 19 32 17 18
Don't think want to pursuecareer in occupation related tomy degree
0 0 0 0 0 0 2 7 4 2 0 3 3 2
Definitely do not want topursue career in occupationrelated to degree
0 0 6 0 0 0 0 9 0 2 0 0 0 1
Do not know 3 2 0 0 0 3 2 7 0 1 0 0 0 1Count 31 50 17 50 10 31 42 45 82 129 37 60 29 613

STEM Graduates in Non-STEM Jobs
238
Appendix Table B3.2: Career plans by subject of study (UK final year undergraduates by level: selected subjects)
3 year undergraduates Enhanced M-Level students
UK Final Year UndergraduatesC
hem
istry
Phy
sics
Oth
erP
hysi
calS
cien
ces
Mat
hem
atic
alSc
ienc
es
Eng
inee
ring
and
Tech
nolo
gy
All
3ye
ar
Che
mis
try
Phy
sics
Oth
erP
hysi
calS
cien
ces
Mat
hem
atic
alSc
ienc
es
Eng
inee
ring
and
Tech
nolo
gy
All
Mle
vel
Definitely want to pursue career inoccupation directly related to degree 32 37 59 45 57 49 55 49 76 47 65 60
Might want to pursue career inoccupation related to degree
42 36 32 41 34 36 29 37 15 37 27 29
Don't think want to pursue career inoccupation related to my degree 15 15 3 11 6 9 9 10 7 8 7 8
Definitely do not want to pursue career inoccupation related to degree
8 9 5 2 2 4 6 3 2 3 1 2
Do not know 3 3 1 2 2 2 1 2 0 3 0 1
Count 66 116 112 174 232 700 147 120 54 59 346 726

STEM Graduates in Non-STEM Jobs
239
Appendix Table B3.3: Career plans by subject of study (UK PhD students)
Arc
hite
ctur
e,B
uild
ing
and
Pla
nnin
g
Bio
logi
cal
Sci
ence
s
Bio
med
ical
Sci
ence
s
Eng
inee
ring/
Tech
nolo
gy
Env
ironm
ent
alS
cien
ces/
Geo
grap
hy/
Arc
haeo
logy
Mat
hem
atic
alS
cien
ces
Com
pute
rS
cien
ce
Oth
ersu
bjec
tsal
lied
toM
edic
ine
Phy
sica
lS
cien
ces
Psy
chol
ogy/
Spo
rtsS
cien
ce
All
Definitely want to pursue a career in anoccupation directly related to the broadsubject of my research
71 50 55 52 68 45 65 64 51 65 55
Might want to pursue a career in anoccupation related to the broad subjectof my research
0 40 36 39 27 45 26 36 32 24 34
Don't think I want to pursue a career inan occupation related to the broadsubject of my research
0 5 4 3 2 10 6 0 10 6 6
Definitely don't want to pursue a careerin an occupation related to the broadsubject of my research
14 3 1 5 0 0 0 0 2 0 2
Don't know 14 2 3 1 2 0 3 0 4 6 3
Count 7 112 67 97 41 31 34 36 168 34 627

STEM Graduates in Non-STEM Jobs
240
Appendix Table B3.4: Reasons for STEM career intention (UK final year PhD students)
Final Year UK PhD students
Definite Might Might not
% % %
I will find the work interesting and exciting 90 72 35
To put my knowledge/subject expertise intopractice 85 79 59
I enjoy my research so it seems logical to work inthis field
70 44 5
To use my high-level skills (developed duringresearch) 63 67 43
I have always wanted to work in this field 38 9 5
I have enjoyed related work experience 24 15 0
I will have better long-term career prospects 17 16 3
I will be better paid (than in other types of work) 10 12 14
It will enable me to work in my preferred location 10 12 0
I know other people who do this kind of work 10 12 3
I will find it easier to get a job 8 17 16
I will be letting people down if I don't 4 6 16
Other reason 2 2 5
Not answered 0 0 0
N of cases 343 216 37

STEM Graduates in Non-STEM Jobs
241
Appendix Table B3.5: Reason for STEM career intention by subject of study (UK final year undergraduates with definite intention for occupation related to degree)
alli
edto
Med
icin
e
Bio
logi
cal
Sci
ence
s
Sp
ort
Sci
ence
Psy
chol
ogy
Che
mis
try
Ph
ysic
s
Ph
ysic
alS
cien
ces
Mat
hem
atic
alS
cien
ces
Com
pute
rS
cien
ce
and
Tec
hnol
ogy
Bu
ildin
gan
dP
lann
ing
Geo
grap
hy
Sci
ence
/A
rcha
eolo
gy
All
I will find the work interesting andexciting 79 89 90 91 92 92 95 75 81 88 86 87 94 87
I want an opportunity to put mylearning into practice
79 78 70 74 78 78 79 71 68 74 62 69 82 74
I enjoyed my degree course andso it seems logical to work in thisfield
70 70 60 76 69 58 76 52 50 56 34 72 61 63
I have always wanted to work inthis field 49 51 57 69 36 49 54 43 66 52 55 52 58 53
I will have better long-term careerprospects 40 33 40 39 24 24 51 36 45 53 62 19 30 40
I enjoyed my degree-related workexperience 47 37 40 29 56 34 27 10 47 53 34 21 30 39
I will be better paid 36 16 13 24 18 15 37 39 36 40 38 11 15 28
I will find it easier to get a job 33 11 3 3 18 15 22 24 30 27 31 8 12 19
There are plenty of degree-relatedjobs in my preferred location 12 8 7 6 10 8 14 24 18 19 7 9 6 13
I know other people who do thiskind of work
17 8 23 9 12 13 13 13 22 12 21 10 12 13
I have knowledge through aparent/relative who does this kindof work
10 4 7 5 5 3 7 6 6 11 21 7 3 7
I will be letting people down if Idon't 2 5 3 2 2 5 4 3 2 4 3 2 3 3
Other reason 1 3 3 3 3 3 3 4 3 4 3 2 6 3
Already employed in this field 0 0 0 0 0 1 0 0 1 2 7 0 0 1
Not answered 0 0 0 0 0 0 0 0 0 0 0 0 0 0
Count 81 191 30 148 102 102 107 106 161 358 29 109 33 1557

STEM Graduates in Non-STEM Jobs
242
Appendix Table B3.6: Reason for STEM career intention by subject of study (UK final year undergraduates who might want occupation related to degree)
allie
dto
Med
icin
e
Bio
logi
cal
Sci
enc
es
Spo
rtS
cie
nce
Psy
cho
log
y
Che
mis
try
Phy
sics
Phy
sica
lS
cie
nces
Mat
hem
atic
alS
cie
nces
Com
pute
rS
cie
nce
and
Tech
nolo
gy
Bui
ldin
gan
dP
lann
ing
Geo
grap
hy
Sci
enc
e/A
rcha
eolo
gy
All
I will find the work interesting andexciting 76 72 82 85 63 79 70 57 52 69 59 76 77 71
I want an opportunity to put mylearning into practice 76 72 64 70 70 60 73 61 59 69 82 65 74 68
I enjoyed my degree course andso it seems logical to work in thisfield
51 47 43 55 39 49 55 41 20 33 24 56 45 43
I will have better long-term careerprospects 13 29 18 37 37 34 34 47 49 47 47 15 19 35
I will be better paid 20 16 14 25 37 29 30 47 59 44 35 8 13 31
I will find it easier to get a job 9 18 18 16 21 24 18 34 35 31 18 11 13 23
I have always wanted to work inthis field 13 22 50 28 8 14 25 12 23 15 35 11 32 19
I enjoyed my degree-related workexperience
18 16 14 16 30 10 14 10 19 19 29 8 16 16
I know other people who do thiskind of work 9 9 21 11 11 7 16 5 19 11 24 3 13 10
There are plenty of degree-relatedjobs in my preferred location 4 6 4 7 6 3 18 17 22 13 0 9 0 10
I will be letting people down if Idon't 4 7 7 4 10 3 7 8 4 6 18 5 10 6
I have knowledge through aparent/relative who does this kindof work
7 5 7 4 1 3 11 9 8 6 6 9 0 6
Other reason 0 1 4 2 1 7 2 1 3 3 6 1 3 2
Not answered 0 0 0 0 0 1 0 0 0 0 0 0 0 0
Count 45 119 28 110 71 86 44 93 91 172 17 117 31 1024

STEM Graduates in Non-STEM Jobs
243
Appendix Table B3.7: Reason for STEM career intention by subject of study (UK final year students with possible intention to pursue occupation related to degree)
allie
dto
Med
icin
e
Bio
logi
cal
Sci
enc
es
Spo
rtS
cie
nce
Psy
cho
log
y
Che
mis
try
Phy
sics
Phy
sica
lS
cie
nces
Mat
hem
atic
alS
cie
nces
Com
pute
rS
cie
nce
and
Tech
nolo
gy
Bui
ldin
gan
dP
lann
ing
Geo
grap
hy
Sci
enc
e/A
rcha
eolo
gy
All
I want an opportunity to put mylearning into practice 67 44 33 42 70 55 14 21 21 39 100 50 38 43
I will find the work interesting andexciting 33 29 33 61 26 38 43 29 0 11 100 25 38 31
I enjoyed my degree course andso it seems logical to work in thisfield
33 35 0 36 39 17 43 17 7 11 0 25 0 24
I will be better paid 0 12 33 9 17 14 29 67 50 25 0 6 13 22I will find it easier to get a job 0 15 0 3 9 14 14 33 14 42 100 19 13 18I will have better long-term careerprospects 0 6 0 12 0 14 14 13 7 19 0 13 38 11
There are plenty of degree-relatedjobs in my preferred location 0 3 0 15 13 7 29 4 21 14 0 13 0 10
I will be letting people down if Idon't 0 9 0 3 9 7 0 13 21 17 0 6 13 9
I know other people who do thiskind of work 11 12 0 12 4 7 0 0 0 8 0 13 0 7
I enjoyed my degree-related workexperience 11 3 0 6 17 3 14 0 7 0 0 6 13 5
I have always wanted to work inthis field 11 6 33 0 9 3 0 0 0 0 0 13 0 4
I have knowledge through aparent/relative who does this kindof work
0 3 0 3 0 3 0 4 0 0 0 0 0 2
Other reason 11 6 0 6 0 7 0 4 0 8 0 0 0 5Not answered 0 0 0 0 0 0 0 0 0 0 0 0 0 0
Count 9 34 3 33 23 29 7 24 14 36 1 16 8 237

STEM Graduates in Non-STEM Jobs
244
Appendix Table B3.8 Reasons for STEM career intention (UK final year undergraduates by gender whodefinitely, might and might not want to pursue an occupation related to their degree)
Male students Female students
%Definit
e%
Might
%Mightnot
%Defini
te
%Migh
t% Might
not
I will find the work interesting andexciting 88 70 26 87 71 36
I want an opportunity to put my learninginto practice 74 66 42 75 69 45
I enjoyed my degree course and so itseems logical to work in this field
59 38 21 66 49 27
I have always wanted to work in this field 56 19 4 51 18 3
I will have better long-term careerprospects 42 40 12 37 31 10
I enjoyed my degree-related workexperience
40 16 5 37 15 6
I will be better paid 31 36 22 25 26 22
I will find it easier to get a job 24 24 19 14 21 17
There are plenty of degree-related jobsin my preferred location 13 11 12 13 9 9
I know other people in this kind of work 15 11 8 12 10 6
I have knowledge through aparent/relative who does this kind ofwork
8 7 1 6 4 3
I will be letting people down if I don't 4 5 11 3 7 8
Already employed in this field 1 0
Other reason 4 4 5 3 1 4
Count 793 503 121 764 521 116

STEM Graduates in Non-STEM Jobs
245
Appendix Table B3.9: Reason for non-STEM career intention by subject of study (UK final year undergraduates who might not or definitely did not want a degree-related occupation)
allie
dto
Med
icin
e
Bio
logi
cal
Sci
ence
s
Spo
rtS
cien
ce
Psy
chol
ogy
Che
mis
try
Phy
sics
Phy
sica
lS
cien
ces
Mat
hem
atic
alS
cien
ces
Com
pute
rS
cien
ce
and
Tech
nolo
gy
Bui
ldin
gan
dP
lann
ing
Geo
grap
hy
Sci
ence
/A
rcha
eolo
gy
All
I have become more interested inanother field 58 63 40 74 62 45 43 41 63 50 0 50 50 56
I will be better paid 37 39 40 11 49 40 21 14 6 30 0 33 10 29I have not enjoyed my degreecourse 21 22 20 26 30 38 14 34 50 36 0 4 30 28
I will have better long-term careerprospects 47 41 40 20 32 26 36 10 13 30 0 29 0 28
I never intended to work in thisfield 26 29 0 13 22 26 14 31 6 5 0 42 10 21
There are too few careeropportunities in my field
21 20 100 28 22 17 7 0 0 7 100 50 50 20
I will find it easier to get a job 21 22 40 33 14 24 14 3 0 7 0 33 10 18There are too few jobs related tomy degree in my preferredlocation
21 12 40 22 16 10 7 7 6 16 0 25 20 15
I was put off by my workexperience 0 20 0 7 24 2 0 7 31 30 0 4 0 13
I was put off by knowledge ofother people doing that kind ofwork
11 12 20 9 14 7 14 7 13 11 0 13 0 10
My course did not prepare mewell enough to get a degree-related job
0 4 40 17 8 10 7 3 13 0 0 13 0 8
I have tried and failed to get jobsdirectly related to my degree 0 0 0 2 3 0 7 7 0 5 0 4 0 2
I was put off by knowledge from arelative doing that kind of work 0 2 0 0 3 0 0 0 13 2 0 0 0 1
Other reason 21 18 0 20 16 19 29 14 0 11 100 8 20 16Not answered 0 0 0 0 0 0 0 0 0 0 0 0 0 0
Count 19 51 5 46 37 42 14 29 16 44 1 24 10 338

STEM Graduates in Non-STEM Jobs
246
Appendix Table B3.10: Reason for non-STEM career intention by subject of study (UK final year undergraduates who might want a degree-related occupation)
allie
dto
Med
icin
e
Bio
logi
cal
Sci
enc
es
Spo
rtS
cie
nce
Psy
cho
log
y
Che
mis
try
Phy
sics
Phy
sica
lS
cie
nces
Mat
hem
atic
alS
cie
nces
Com
pute
rS
cie
nce
and
Tech
nolo
gy
Bui
ldin
gan
dP
lann
ing
Geo
grap
hy
Sci
enc
e/A
rcha
eolo
gy
All
I have become more interested inanother field 33 30 14 28 31 33 20 32 35 42 12 22 29 31
There are too few jobs related tomy degree in my preferredlocation
27 39 36 35 32 21 39 16 16 21 41 37 48 29
I will find it easier to get a job 24 24 32 39 30 22 36 17 14 22 24 35 42 27
There are too few careeropportunities in my field 36 28 54 32 28 13 25 11 12 17 24 26 58 24
I will be better paid 29 21 11 17 23 29 30 3 9 22 12 25 29 20My course did not prepare mewell enough to get a degree-related job
9 15 11 18 15 9 16 14 27 9 24 17 6 15
I have not enjoyed my degreecourse
4 9 7 5 10 14 14 14 22 18 12 5 3 12
I will have better long-term careerprospects 13 17 11 7 14 12 2 1 5 11 18 10 13 10
I was put off by my workexperience 13 10 4 2 6 3 7 5 11 13 12 1 6 7
I have tried and failed to get jobsdirectly related to my degree 9 3 4 3 10 2 11 8 7 10 29 5 3 7
I was put off by knowledge ofother people doing that kind ofwork
4 4 7 6 7 2 7 8 14 5 6 3 10 6
I never intended to work in thisfield 4 5 4 3 7 2 5 6 5 1 0 3 3 4
I was put off by knowledge from arelative doing that kind of work 0 3 0 0 3 0 5 3 5 1 6 0 0 2
Other reason 0 3 7 9 6 14 11 8 5 8 18 9 6 8Not answered 0 2 0 3 1 3 0 3 1 1 0 1 0 1
Count 45 119 28 110 71 86 44 93 91 172 17 117 31 1024

STEM Graduates in Non-STEM Jobs
247
Appendix Table B3.11 Reasons for non-degree related career intention (UK final yearundergraduates, by gender, comparing those who might want with those who might
not/definitely do not want to pursue an occupation related to their degree)
Might want Definitely/might not
Male Female Male Female
% % % %
I have become more interested in anotherfield
34 28 51 60
There are too few jobs related to my degreein my preferred location 24 34 15 15
I will find it easier to get a job 27 26 16 21
There are too few career opportunities inmy field
20 27 20 21
I will be better paid 23 17 34 24
My course did not prepare me well enoughto get a degree-related job 12 18 7 8
I have not enjoyed my degree course 13 10 28 28
I will have better long-term career prospects 11 9 29 27
I was put off by my work experience 7 7 15 11
I have tried and failed to get jobs directlyrelated to my degree 8 5 3 2
I was put off by knowledge of other peopledoing that kind of work 6 6 13 7
I never intended to work in this field 4 3 22 20
I was put off by knowledge from a relativedoing that kind of work 2 1 3 0
Other reason 8 7 16 16
Not answered 1 2 0 0
Number of cases 503 521 174 164

STEM Graduates in Non-STEM Jobs
248
Appendix Table B3.12: Reasons for non-degree related career intention (UK final year PhDstudents)
Final Year UK PhD students
Might Might notDefinitely
not
% % %There are too few career opportunities in my field 50 35 21Too few relevant jobs in my preferred worklocation 38 16 21
I will be better paid doing other work 37 35 29Better long-term career prospects doing somethingelse 31 30 36
I have become more interested in another field 23 54 29I want to use my high-level skills but not in thisfield 20 57 7
I will find it easier to get different kind of job 19 16 14I have not enjoyed my postgraduate research 17 43 57Knowledge of others doing this kind of work hasput me off
15 27 29
Insufficient ability/experience to get a job related tomy research 11 19 14
I never intended to work in this field 9 8 14I have been put off by my work experience 6 14 29I have tried and failed to get jobs related to myresearch
6 0 0
Other reason 7 5 14Not answered 1 0 0
N of cases 216 37 14

STEM Graduates in Non-STEM Jobs
249
Appendix Table B3.13: Career plans by subject of study (UK final year undergraduates)
Career plan when firstwent to university
Sub
ject
sal
lied
toM
edi
cine
Bio
logi
cal
Sci
ence
s
Spo
rtSc
ienc
e
Psy
chol
ogy
Che
mis
try
Phy
sics
Oth
erP
hysi
cal
Sci
ence
s
Ma
them
atic
al
Sci
ence
s
Com
pute
rSci
ence
Eng
inee
ring
and
Tech
nolo
gy
Arc
hite
ctur
e,B
uild
ing
and
Pla
nnin
g
Geo
grap
hy
Fore
nsic
Sci
enc
e/A
rch
aeo
log
y
All
Definite career in mind 38 19 22 22 11 16 14 18 14 24 55 9 25 19
Considering severalcareer alternatives 18 29 30 28 24 19 28 21 29 30 21 17 33 26
Only vague idea ofpossible careers 27 34 30 35 45 36 37 30 40 35 21 41 25 35
No idea at all 17 18 19 16 20 28 21 31 17 11 2 33 16 20
Changed career plan
Yes - completely 20 17 13 24 20 14 15 16 15 12 6 20 20 17
Yes - to some extent 37 53 58 55 58 49 57 45 49 56 53 53 57 52
No 43 30 30 21 22 37 28 39 36 32 40 27 23 31
Current career plan
Definite career in mind 48 35 30 31 24 34 28 35 28 34 55 22 24 32
Considering severalcareer alternatives 27 40 44 44 49 34 52 30 43 48 32 40 41 42
Only vague idea ofpossible careers 22 21 20 22 25 27 16 24 25 16 13 32 32 22
No idea at all 3 5 6 3 1 5 4 11 4 2 0 7 3 4
Count 146 371 64 309 213 236 166 233 272 578 47 259 75 2969

STEM Graduates in Non-STEM Jobs
250
Appendix Table B3.14: Career sector and occupational function for those with definite career plans, by subject of study (UK final year undergraduates)
Sector
Sub
ject
sal
lied
toM
edic
ine
Bio
logi
calS
cien
ces
Spo
rtS
cien
ce
Psy
chol
ogy
Che
mis
try
Phy
sics
Oth
erP
hysi
calS
cien
ces
Mat
hem
atic
alS
cien
ces
Com
pute
rS
cien
ce
Eng
inee
ring
and
Tech
nolo
gy
Arc
hite
ctur
e,B
uild
ing
and
Pla
nnin
g
Geo
grap
hy
Fore
nsic
Sci
ence
/A
rcha
eolo
gy
All
STEM Specialist 89 80 63 55 54 59 70 14 73 82 92 32 56 65
STEM Generalist 7 15 21 30 33 30 19 80 16 5 0 41 22 23
Non-STEM 4 5 16 15 8 9 4 2 10 13 8 27 22 10
Other 0 0 0 0 6 1 4 2 1 1 0 0 0 1
Don't know 0 0 0 0 0 1 2 1 0 0 0 0 0 0
Function
STEM Core 84 70 26 58 62 57 66 17 71 85 69 39 6 63
STEM-related 7 16 37 27 29 30 15 70 8 5 4 41 22 22
Unrelated 1 4 16 13 6 4 2 5 14 9 8 7 28 8
Other 7 10 16 2 4 10 15 5 6 1 19 7 22 7
Don't know 0 0 5 0 0 0 2 2 0 1 0 5 22 1
Count 70 128 19 97 52 81 47 81 77 196 26 56 18 948

STEM Graduates in Non-STEM Jobs
251
Appendix Table B3.15: Career sector and occupational function for those with career plans, by subject of study (UK taught postgraduates)
SectorS
ubje
cts
allie
dto
Med
icin
e
Bio
logi
calS
cien
ces
Spo
rtS
cien
ce
Psy
chol
ogy
Che
mis
try
Phy
sics
Oth
erP
hysi
calS
cien
ces
Mat
hem
atic
alS
cien
ces
Com
pute
rS
cien
ce
Eng
inee
ring
and
Tech
nolo
gy
Arc
hite
ctur
e,B
uild
ing
and
Pla
nnin
g
Geo
grap
hy
Fore
nsic
Sci
ence
/A
rcha
eolo
gy
All
STEM Specialist 78 66 81 44 67 79 62 26 57 73 61 57 42 61
STEM Generalist 0 5 0 9 0 7 12 39 13 1 0 2 8 7
Non-STEM/Other 4 0 0 16 11 0 6 6 4 7 24 11 17 8
STEMSpecialist/Generalist 7 17 6 9 0 11 6 16 7 5 0 4 8 7
Mixed sectors 11 12 13 22 22 4 15 13 16 15 15 26 25 16
Don't know 0 0 0 0 0 0 0 0 1 0 0 0 0 0
Function
STEM Core 81 56 38 64 67 64 62 35 54 65 67 60 33 59
STEM related 0 7 19 4 0 7 18 32 9 2 0 9 4 8
Other/unrelated 7 5 38 13 22 14 9 19 12 8 15 13 42 14
STEM Core/related 7 20 0 4 0 11 9 6 4 7 6 2 13 7
Mixed functions 4 12 6 13 11 4 3 6 21 17 12 15 8 12
Don't know 0 0 0 0 0 0 0 0 0 0 0 2 0 0
Count 27 41 16 45 9 28 34 31 68 107 33 47 24 510

STEM Graduates in Non-STEM Jobs
252
Appendix Table B3.16 Career sector and occupational function for those with definite career plans, by subject of study (UK taught postgraduates)
Sector
Sub
ject
sal
lied
toM
edic
ine
Bio
logi
calS
cien
ces
Spo
rtS
cien
ce
Psy
chol
ogy
Che
mis
try
Phy
sics
Oth
erP
hysi
calS
cien
ces
Mat
hem
atic
alS
cien
ces
Com
pute
rS
cien
ce
Eng
inee
ring
and
Tech
nolo
gy
Arc
hite
ctur
e,B
uild
ing
and
Pla
nnin
g
Geo
grap
hy
Fore
nsic
Sci
ence
/A
rcha
eolo
gy
All
STEM Specialist 93 88 100 65 80 89 63 36 57 88 71 67 55 73
STEM Generalist 0 12 0 15 0 11 25 55 32 2 0 7 18 15
Non-STEM 7 0 0 15 0 0 13 5 4 10 29 27 27 10
Other 0 0 0 4 20 0 0 5 4 0 0 0 0 2
Don't know 0 0 0 0 0 0 0 0 4 0 0 0 0 0
Function
STEM Core 87 76 46 85 80 68 56 45 57 86 88 67 36 70
STEM-related 0 12 15 8 0 11 38 41 21 2 0 13 9 13
Unrelated 0 0 0 4 0 0 0 5 21 4 6 0 27 6
Other 13 12 38 4 20 21 6 9 0 8 6 20 27 11
Count 15 17 13 26 5 19 16 22 28 50 17 15 11 254

STEM Graduates in Non-STEM Jobs
253
Appendix Table B3.17 Career sector and occupational function for those with career plans by subject of study (UK PhD students)
Sector
Arc
hite
ctur
e,B
uild
ing
and
Pla
nnin
g
Bio
logi
calS
cien
ces
Bio
med
ical
Sci
ence
s
Eng
inee
ring/
Tech
nolo
gy
Env
ironm
enta
lSci
ence
s/G
eogr
aphy
/Arc
haeo
logy
Mat
hem
atic
alS
cien
ces
Com
pute
rS
cien
ce
Oth
ersu
bjec
tsal
lied
toM
edic
ine
Phy
sica
lSci
ence
s
Psy
chol
ogy/
Spo
rtsS
cien
ce
All
STEM Specialist 60 71 58 69 71 44 78 39 65 47 63
STEM Generalist 20 2 2 6 0 19 3 0 8 0 5
Non-STEM/Other 0 5 17 9 3 7 3 25 5 23 9
STEM Specialist/Generalist 0 5 2 8 3 19 3 0 5 0 5
Mixed sectors 20 11 19 8 23 7 6 32 14 23 14
Don't know 0 4 2 0 0 4 6 4 3 7 3
Function
STEM Core 60 63 63 71 52 37 59 71 61 57 61
STEM related 40 9 8 3 16 22 9 4 5 17 9
Other/unrelated 0 7 8 8 0 15 16 7 5 7 7
STEM Core/related 0 13 10 12 23 15 6 11 9 10 11
Mixed functions 0 9 12 5 10 11 9 7 19 7 11
Don't know 0 0 0 1 0 0 0 0 1 3 1
Count 5 91 52 77 31 27 32 28 130 30 503

STEM Graduates in Non-STEM Jobs
254
Appendix Table B3.18 Main aim for year after complete course, by subject of study (UK final year UK undergraduates)
Sub
ject
sal
lied
toM
edic
ine
Bio
logi
cal
Sci
ence
s
Spo
rtS
cien
ce
Psy
chol
ogy
Che
mis
try
Phy
sics
Oth
erP
hysi
cal
Sci
ence
s
Mat
hem
atic
alS
cien
ces
Com
pute
rS
cien
ce
Eng
inee
ring
and
Tech
nolo
gy
,Bui
ldin
gan
dP
lann
ing
Geo
grap
hy
Sci
ence
/A
rcha
eolo
gy
All
Obtain employment related tolonger-term career plans 35 27 28 31 39 35 35 41 53 62 62 28 35 41
Obtain other long-termemployment 5 4 5 1 4 5 7 7 6 6 0 7 3 5
Obtain temporary employment 4 8 8 11 5 6 1 6 8 2 4 14 11 7
Travel or take time out 10 12 16 12 9 8 11 15 10 12 6 17 7 12
Become self-employed 1 0 0 0 0 1 0 0 2 1 2 0 1 1
Enrol on a full-time higherdegree course 25 37 27 31 34 32 38 20 12 11 6 26 37 25
Undertake vocational training 3 3 5 3 2 3 2 3 2 1 2 2 0 2
PGCE 0 2 0 2 1 2 0 3 0 0 0 1 0 1
Continue in currentemployment 0 0 2 0 0 1 1 0 0 1 4 0 0 0
Study medicine 8 2 0 0 0 0 1 0 0 0 0 0 1 1
Another undergraduate course 1 0 0 0 0 0 1 0 0 0 0 0 0 0
Complete Pre-Reg year 2 0 0 0 0 0 0 0 0 0 0 0 0 0
Other 3 2 3 5 2 3 1 1 1 2 6 2 4 2
Don't know 3 3 8 3 3 4 3 3 4 3 6 3 1 3
Count 145 371 64 309 213 235 166 233 271 575 46 259 75 2962

STEM Graduates in Non-STEM Jobs
255
Appendix Table B3.19 Reasons for undertaking further study/training, by subject of study (UK final year undergraduates)
Sub
ject
sal
lied
toM
edic
ine
Bio
logi
cal
Sci
ence
s
Spo
rtS
cien
ce
Psy
chol
ogy
Che
mis
try
Phy
sics
Oth
erP
hysi
cal
Sci
ence
s
Mat
hem
atic
alS
cien
ces
Com
pute
rS
cien
ce
Eng
inee
ring
and
Tech
nolo
gy
,Bui
ldin
gan
dP
lann
ing
Geo
grap
hy
Sci
ence
/A
rcha
eolo
gy
All
I want to develop morespecialist knowledge andexpertise
44 57 64 63 61 61 68 41 62 60 40 56 76 59
It will give me access to bettercareer opportunities 49 65 61 67 64 46 58 45 42 59 90 60 68 58
I am interested in the course 58 56 36 64 62 70 60 51 49 55 30 51 61 57
It is essential for the career Iwish to develop 72 65 85 76 45 55 49 63 36 28 60 50 55 56
I want to continue studying to ahigher level 35 46 33 49 55 55 53 37 38 41 0 41 53 46
I want to develop a broaderrange of knowledge andexpertise
27 36 30 46 37 36 39 38 40 32 40 35 53 37
It will be easier to find the typeof job I want with this additionalqualification
28 37 48 52 40 16 50 23 26 36 40 38 47 36
It is difficult to get the type ofjob I want at the present time
12 15 27 20 21 8 20 5 12 24 10 14 13 16
I want to change careerdirection 13 11 0 9 11 11 4 9 13 11 0 5 11 9
I have been unable to get workdirectly related to myundergraduate degree
5 2 6 6 3 2 1 2 5 6 10 4 3 4
Other 0 2 0 1 2 2 0 0 4 3 0 1 0 2
Not answered 0 0 0 0 2 0 2 1 6 2 0 1 0 1
Count 78 234 33 172 122 132 96 94 78 157 10 114 38 1358

STEM Graduates in Non-STEM Jobs
256
Appendix Table B3.20 Reasons for undertaking postgraduate course, by subject of study (UK taught postgraduates)
Sub
ject
sal
lied
toM
edic
ine
Bio
logi
cal
Sci
ence
s
Spo
rtS
cien
ce
Psy
chol
ogy
Che
mis
try
Phy
sics
Oth
erP
hysi
cal
Sci
ence
s
Mat
hem
atic
alS
cien
ces
Com
pute
rS
cien
ce
Eng
inee
ring
and
Tec
hnol
ogy
,Bui
ldin
gan
dP
lann
ing
Geo
grap
hy
Sci
ence
/A
rcha
eolo
gy
All
It will give me access to bettercareer opportunities
77 76 88 84 80 58 79 44 76 78 70 70 59 73
I wanted to develop morespecialist knowledge andexpertise
61 76 94 78 70 65 76 62 74 58 38 67 86 68
I was interested in the course 81 64 47 68 60 58 74 87 66 53 46 53 72 63
I wanted to continue studyingto a higher level 48 66 47 68 50 52 69 73 63 50 22 45 69 56
It will be easier to get the typeof job I want with this additionalqualification
52 42 65 44 50 23 55 18 44 49 38 53 55 45
I wanted to develop a broaderrange of knowledge andexpertise
26 48 35 42 50 32 43 44 51 43 32 35 34 41
It is essential for the career Iwish to develop 61 46 53 54 40 39 43 18 28 40 46 35 38 40
I wanted to change careerdirection 16 10 6 4 0 23 17 16 24 25 46 37 17 21
It was difficult to get the type ofjob I wanted at the time 13 24 18 18 20 10 10 7 23 22 11 22 24 18
I had been unable to get workdirectly related to myundergraduate degree
13 14 18 10 20 19 7 7 12 9 8 20 21 12
Other 10 6 0 4 10 13 0 4 7 4 16 2 14 6
Not answered 0 0 0 0 0 0 0 2 0 0 0 0 0 0
Count 31 50 17 50 10 31 42 45 82 129 37 60 29 613

STEM Graduates in Non-STEM Jobs
257
Appendix Table B3.21 Career sector expectation, by job seeking behaviour (UK final year students with career plan)
STEMSpeciali
st
STEMGenerali
stNon-
STEM
STEMSpeciali
st/Generali
st MixedDon'tknow
All withplan
Started looking for employment 63 44 62 65 69 50 62
Applied for jobs related to long-term career plans 45 38 50 40 43 25 44
Been offered job related to long-term career plans 15 22 19 12 8 25 14
Count 1120 249 151 213 450 4 2187
Appendix Table B3.22 Career function expectation, by job seeking behaviour (UK final year students with career plan)
STEMCore
STEMrelated
Unrelated
STEMCore/
related MixedDon'tknow
All withplan
Started looking for employment 64 44 57 64 72 70 62
Applied for jobs related to long-term career plans 48 33 38 38 45 43 44
Been offered job related to long-term career plans 17 17 14 9 9 8 14
Count 1030 261 263 195 401 37 2187

STEM Graduates in Non-STEM Jobs
258
Appendix Table B3.23 Most important factors for choice of undergraduate course, by subject of study (UK final year undergraduates)
Sub
ject
sal
lied
toM
edic
ine
Bio
logi
cal
Sci
ence
s
Spo
rtS
cien
ce
Psy
chol
ogy
Che
mis
try
Phy
sics
Oth
erP
hysi
cal
Sci
ence
s
Mat
hem
atic
alS
cien
ces
Com
pute
rS
cien
ce
Eng
inee
ring
and
Tec
hnol
ogy
,Bui
ldin
gan
dP
lann
ing
Geo
grap
hy
Sci
ence
/A
rcha
eolo
gy
All
I had a personalinterest/aptitude in this subject 71 74 77 84 72 83 82 81 82 73 60 77 76 77
I enjoyed studying this subjectat A-level (or equivalent) 64 77 66 68 85 81 61 89 58 48 13 83 33 67
I felt this course would keep alot of career options open forme
27 42 36 50 52 62 39 67 59 61 47 45 39 52
I wanted to follow a career inthis field 51 47 64 59 35 40 50 41 63 54 66 32 60 49
I liked theuniversity/department when Ivisited it
52 40 33 39 58 41 55 36 36 43 26 45 57 43
It is a required qualification formy chosen career 23 13 22 21 15 12 14 11 12 25 26 5 21 16
My teacher at school/collegerecommended it 11 10 23 13 26 21 16 23 7 13 4 18 5 15
I was influenced by myparents/relatives 14 10 16 10 9 13 8 13 13 16 17 9 12 12
I wandered into this courseafter my A-levels (orequivalent)
9 10 8 9 12 8 11 10 8 13 11 9 15 10
I was influenced by otherpeople I know who had studiedit
7 8 16 7 7 6 8 7 13 11 13 7 1 9
Other factor 4 4 3 2 2 1 2 2 3 4 9 1 3 3Not answered 1 0 0 0 0 0 0 0 0 1 2 0 0 0
Count 146 371 64 309 213 236 166 233 272 578 47 259 75 2969

STEM Graduates in Non-STEM Jobs
259
Appendix Table B3.24 Reason for choice of undergraduate course, by subject of study (UK taught postgraduates)
Sub
ject
sal
lied
toM
edic
ine
Bio
logi
cal
Sci
ence
s
Spo
rtS
cien
ce
Psy
chol
ogy
Che
mis
try
Phy
sics
Oth
erP
hysi
cal
Sci
ence
s
Mat
hem
atic
alS
cien
ces
Com
pute
rS
cien
ce
Eng
inee
ring
and
Tec
hnol
ogy
,Bui
ldin
gan
dP
lann
ing
Geo
grap
hy
Sci
ence
/A
rcha
eolo
gy
All
I had a personalinterest/aptitude in this subject 55 88 71 78 70 71 83 78 74 67 46 73 86 73
I enjoyed studying this subjectat A-level (or equivalent) 61 74 82 58 90 58 48 67 48 38 43 70 31 54
I wanted to follow a career inthis field 45 58 53 58 40 61 57 38 48 60 38 43 59 52
I felt this course would keep alot of career options open forme
39 40 29 52 40 52 33 31 43 50 41 43 31 43
I liked theuniversity/department when Ivisited it
32 44 41 38 50 35 38 20 23 28 30 37 34 32
It is a required qualification formy chosen career 6 24 24 26 10 23 17 9 9 16 11 8 17 15
I was influenced by myparents/relatives 16 6 0 12 10 10 7 11 13 12 14 12 10 11
I wandered into this courseafter my A-levels (orequivalent)
13 12 6 10 0 23 10 7 13 5 14 12 7 10
My teacher at school/collegerecommended it 3 12 18 4 10 13 10 7 10 12 8 10 10 10
I was influenced by otherpeople I know who had studiedit
10 0 0 8 10 13 5 4 11 8 8 15 7 8
Other factor 10 2 6 4 0 6 7 4 4 4 11 3 7 5
Not answered 0 0 0 0 0 0 0 0 1 3 5 0 0 1
Count 31 50 17 50 10 31 42 45 82 129 37 60 29 613
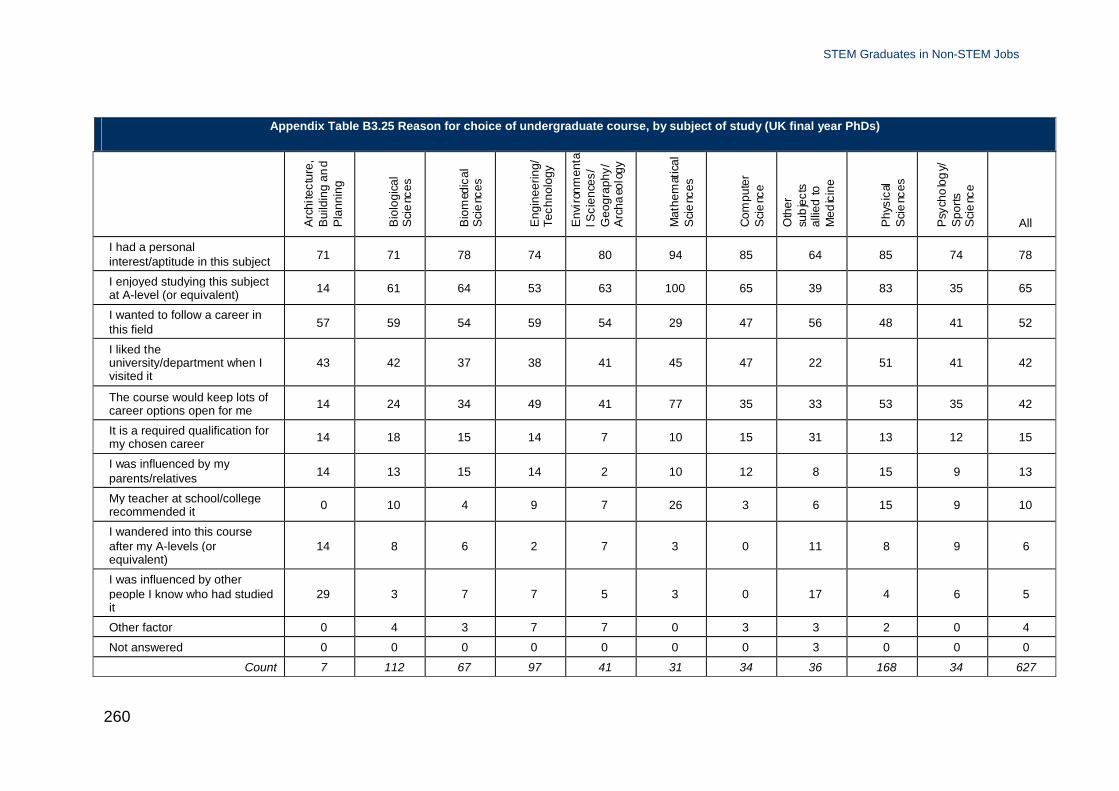
STEM Graduates in Non-STEM Jobs
260
Appendix Table B3.25 Reason for choice of undergraduate course, by subject of study (UK final year PhDs)
Arc
hite
ctur
e,B
uild
ing
and
Pla
nnin
g
Bio
logi
cal
Sci
enc
es
Bio
med
ical
Sci
enc
es
Eng
inee
ring/
Tech
nolo
gy
Env
iron
men
talS
cien
ces/
Geo
grap
hy/
Arc
haeo
logy
Mat
hem
atic
alS
cie
nces
Com
pute
rS
cie
nce
Oth
ersu
bje
cts
allie
dto
Med
icin
e
Phy
sica
lS
cie
nces
Psy
cho
log
y/S
ports
Sci
enc
e
All
I had a personalinterest/aptitude in this subject 71 71 78 74 80 94 85 64 85 74 78
I enjoyed studying this subjectat A-level (or equivalent) 14 61 64 53 63 100 65 39 83 35 65
I wanted to follow a career inthis field 57 59 54 59 54 29 47 56 48 41 52
I liked theuniversity/department when Ivisited it
43 42 37 38 41 45 47 22 51 41 42
The course would keep lots ofcareer options open for me 14 24 34 49 41 77 35 33 53 35 42
It is a required qualification formy chosen career 14 18 15 14 7 10 15 31 13 12 15
I was influenced by myparents/relatives 14 13 15 14 2 10 12 8 15 9 13
My teacher at school/collegerecommended it 0 10 4 9 7 26 3 6 15 9 10
I wandered into this courseafter my A-levels (orequivalent)
14 8 6 2 7 3 0 11 8 9 6
I was influenced by otherpeople I know who had studiedit
29 3 7 7 5 3 0 17 4 6 5
Other factor 0 4 3 7 7 0 3 3 2 0 4
Not answered 0 0 0 0 0 0 0 3 0 0 0
Count 7 112 67 97 41 31 34 36 168 34 627

STEM Graduates in Non-STEM Jobs
261
Appendix Table B3.26 Reasons for undertaking postgraduate study, by subject of study (UK PhD students)
Arc
hite
ctur
e,B
uild
ing
and
Pla
nnin
g
Bio
logi
cal
Sci
ence
s
Bio
med
ical
Sci
ence
s
Eng
inee
ring/
Tec
hnol
ogy
Env
ironm
ent
alS
cien
ces/
Geo
grap
hy/
Arc
haeo
logy
Mat
hem
atic
alS
cien
ces
Com
pute
rS
cien
ce
Oth
ersu
bjec
tsal
lied
toM
edic
ine
Phy
sica
lS
cien
ces
Psy
chol
ogy/
Spo
rts
Sci
ence
All
I was interested in this subject 71 72 60 73 88 97 71 78 85 76 77
I wanted to continue studying to a higherlevel 71 58 52 52 76 90 59 58 79 56 65
I wanted to develop more specialistknowledge and expertise 14 58 54 57 59 68 68 64 57 50 58
I wanted to develop more high-level skills 0 40 51 49 34 39 50 64 51 38 46
It will broaden the range of potentialcareer opportunities 29 45 46 48 37 39 47 36 46 38 44
It is essential for the career I wish todevelop 43 51 46 12 39 29 26 22 38 50 36
It should help me get the type of job Iwant in the long term 14 40 28 36 44 26 35 42 35 24 35
I wanted to change career direction 29 10 15 11 7 3 12 0 4 12 8
It was difficult to get the type of job Iwanted at the time 0 8 1 10 7 10 6 6 8 3 7
I was unable to get degree-related workwith my first degree 14 10 3 1 5 0 3 6 2 6 4
Other 14 2 3 3 5 0 6 6 2 6 3
Not answered 14 0 0 0 0 0 0 0 0 0 0
Count 7 112 67 97 41 31 34 36 168 34 627

STEM Graduates in Non-STEM Jobs
262
Appendix Table B3.27 Percentage that changed course at any stage, by subject of study (UKstudents)
UK Final year undergraduates UK Taught postgraduates
Subject group
Newsubjec
t
Different
degreein same
dept
Notchange
dcourse
N ofcase
s
Newsubjec
t
Different
degreein same
dept
Notchange
dcourse
N ofcase
s
Subjects allied toMedicine 6 19 75 145 13 6 81 31BiologicalSciences 4 18 78 368 0 12 88 50
Sports Science 8 0 92 63 6 6 88 17
Psychology 6 3 91 307 4 8 88 50
Chemistry 4 14 82 213 10 0 90 10
Physics 3 14 83 235 10 6 84 31Other PhysicalSciences 7 18 75 166 10 10 81 42MathematicalSciences 6 15 79 232 7 13 80 45
Computer Science 6 15 79 271 11 7 81 81Engineering andTechnology 4 10 86 575 7 7 86 128Architecture,Building andPlanning 2 4 93 46 19 5 76 37
Geography 7 7 86 259 8 5 87 60Forensic Science/Archaeology 3 0 97 74 3 0 97 29
All students 5 12 83 2954 8 7 85 611

STEM Graduates in Non-STEM Jobs
263
Appendix Table B3.28 Percentage who would choose same undergraduate course again, by subject ofstudy (final year UK undergraduates)
Subject group
Same/similarcourse
Differentcourse
Delayentry
Not goat all
Do notknow N of
cases
Subjects allied to Medicine 64 33 7 1 3 146
Biological Sciences 72 26 10 2 4 371
Sports Science 70 28 8 2 3 64
Psychology 74 24 5 3 5 308
Chemistry 74 24 9 3 6 212
Physics 81 18 6 1 2 236
Other Physical Sciences 82 16 4 4 3 165
Mathematical Sciences 76 16 8 2 5 233
Computer Science 69 28 8 2 5 269
Engineering andTechnology 76 22 4 4 5 574
Architecture, Building andPlanning 57 34 6 4 11 47
Geography 66 31 5 4 3 258
Forensic Science/Archaeology 73 32 4 0 4 75
All students 73 24 6 3 4 2958

STEM Graduates in Non-STEM Jobs
264
Appendix Table B3.29 Whether would choose same undergraduate course again, by subject of study (UK students)
Final Year UKundergraduates
Sub
ject
sal
lied
toM
edic
ine
Bio
logi
calS
cien
ces
Spo
rtS
cien
ce
Psy
chol
ogy
Che
mis
try
Phy
sics
Oth
erP
hysi
calS
cien
ces
Mat
hem
atic
alS
cien
ces
Com
pute
rSci
ence
Eng
inee
ring
and
Tec
hnol
ogy
Arc
hite
ctur
e,B
uild
ing
and
Pla
nnin
g
Geo
grap
hy
For
ensi
cS
cien
ce/A
rcha
eolo
gy
All
Same/similar undergraduatecourse 64 72 70 74 74 81 82 76 69 76 57 66 73 73
Different undergraduate course 33 26 28 24 24 18 16 16 28 22 34 31 32 24Delay your entry to highereducation 7 10 8 5 9 6 4 8 8 4 6 5 4 6
Not go to university at all 1 2 2 3 3 1 4 2 2 4 4 4 0 3Do not know 3 4 3 5 6 2 3 5 5 5 11 3 4 4
Count 146 371 64 308 212 236 165 233 269 574 47 258 75 2958UK Taught PostgraduatesSame/similar undergraduatecourse 65 70 76 76 80 58 76 89 57 70 46 68 72 68
Different undergraduate course 29 26 24 18 20 32 24 16 38 22 43 32 17 27Delay your entry to highereducation
3 4 0 12 0 6 7 0 10 12 11 8 0 8
Not go to university at all 0 4 0 0 0 0 2 0 4 3 9 5 3 3Do not know 10 6 0 4 0 6 0 2 2 5 11 2 7 4
Count 31 50 17 50 10 31 42 44 82 128 35 59 29 608Note: column percentages do not sum to 100% as students could choose more than one option.

STEM Graduates in Non-STEM Jobs
265
Appendix Table B3.30 Career plans, by subject of study (UK taught postgraduates)
Career plan when firstwent to university
Sub
ject
sal
lied
toM
edi
cine
Bio
logi
cal
Sci
ence
s
Spo
rtSc
ienc
e
Psy
chol
ogy
Che
mis
try
Phy
sics
Oth
erP
hysi
cal
Sci
ence
s
Ma
them
atic
al
Sci
ence
s
Com
pute
rSci
ence
Eng
inee
ring
and
Tech
nolo
gy
Arc
hite
ctur
e,B
uild
ing
and
Pla
nnin
g
Geo
grap
hy
Fore
nsic
Sci
enc
e/A
rch
aeo
log
y
All
Definite career in mind 16 18 12 30 20 39 17 22 17 28 32 10 28 23
Considering several careeralternatives 32 32 41 22 30 13 24 7 18 18 22 17 21 21
Only vague idea of possiblecareers 23 40 29 26 30 29 36 44 46 36 22 38 31 35
No idea at all 29 10 18 22 20 19 24 27 18 18 24 35 21 22
Changed career plan
Yes - completely 13 20 47 16 10 23 19 16 28 18 30 18 21 21
Yes - to some extent 65 58 41 50 40 35 52 42 45 43 41 55 52 48
No 23 22 12 34 50 42 29 42 27 40 30 27 28 32
Current career plan
Definite career in mind 48 34 76 52 50 61 38 49 34 39 46 25 38 41
Considering several careeralternatives 39 48 18 38 40 29 43 20 49 44 43 53 45 42
Only vague idea of possiblecareers 10 14 6 8 0 6 17 16 15 13 11 20 17 13
No idea at all 3 4 0 2 10 3 2 16 2 4 0 2 0 4
Count 31 50 17 50 10 31 42 45 82 129 37 60 29 613

STEM Graduates in Non-STEM Jobs
266
Appendix Table B3.31 Career plans, by subject of study (UK PhD students)
Career plan when firstwent to university
Arc
hite
ctur
e,B
uild
ing
and
Pla
nnin
g
Bio
logi
cal
Sci
ence
s
Bio
med
ical
Sci
ence
s
Eng
inee
ring/
Tec
hnol
ogy
Env
ironm
enta
lS
cien
ces/
Geo
grap
hy/
Arc
haeo
logy
Mat
hem
atic
alS
cien
ces
Com
pute
rSci
ence
Oth
ersu
bjec
tsal
lied
toM
edic
ine
Phy
sica
lSci
ence
s
Psy
chol
ogy/
Spo
rts
Sci
ence
All
Definite career in mind 29 20 10 24 22 0 18 33 10 12 16
Considering several career alternatives 14 28 31 33 17 13 26 31 24 35 27
Only vague idea of possible careers 29 36 39 35 49 61 41 14 45 26 39
No idea at all 29 17 19 8 12 26 15 22 21 26 18
Changed career plan
Yes - completely 14 21 16 14 22 23 18 19 14 24 18
Yes - to some extent 57 37 46 47 39 58 50 31 55 41 46
No 29 42 37 38 39 19 32 50 31 35 36
Current career plan
Definite career in mind 57 29 30 30 24 29 38 28 23 44 29
Considering several career alternatives 14 52 48 49 51 58 56 50 54 44 51
Only vague idea of possible careers 29 15 13 15 22 13 3 19 20 9 16
No idea at all 0 4 9 5 2 0 3 3 3 3 4
Count 7 112 67 97 41 31 34 36 168 34 627

STEM Graduates in Non-STEM Jobs
267
Appendix Table B3.32 Planned career sector and function at initial entry to university, by subject of study (UK taught postgraduates)
SectorS
ubje
cts
allie
dto
Med
icin
e
Bio
logi
calS
cien
ces
Spo
rtS
cien
ce
Psy
chol
ogy
Che
mis
try
Phy
sics
Oth
erP
hysi
calS
cien
ces
Mat
hem
atic
alS
cien
ces
Com
pute
rSci
ence
Eng
inee
ring
and
Tec
hnol
ogy
Arc
hite
ctur
e,B
uild
ing
and
Pla
nnin
g
Geo
grap
hy
For
ensi
cS
cien
ce/
Arc
haeo
logy
All
STEM Specialist 93 96 78 65 80 81 82 38 59 85 65 69 79 76
STEM Generalist 7 4 11 12 0 13 18 54 21 2 15 13 7 12
Non-STEM 0 0 11 12 20 6 0 8 17 12 20 19 14 11
Other 0 0 0 12 0 0 0 0 0 2 0 0 0 2
Don't know 0 0 0 0 0 0 0 0 3 0 0 0 0 0
Function
STEM Core 87 92 44 81 100 69 76 38 69 80 60 75 71 74
STEM-related 0 4 44 8 0 19 24 62 24 2 10 13 0 13
Unrelated 7 0 11 12 0 13 0 0 7 14 10 6 21 9
Other 7 0 0 0 0 0 0 0 0 5 15 6 0 3
Don't know 0 4 0 0 0 0 0 0 0 0 5 0 7 1
Count 15 25 9 26 5 16 17 13 29 59 20 16 14 264

STEM Graduates in Non-STEM Jobs
268
Appendix Table B3.33 Influences on career plans, by subject of study (Final Year UK undergraduates who had changed plans)
Sub
ject
sal
lied
toM
edic
ine
Bio
logi
cal
Sci
ence
s
Spo
rtS
cien
ce
Psy
chol
ogy
Che
mis
try
Phy
sics
Oth
erP
hysi
cal
Sci
ence
s
Mat
hem
atic
alS
cien
ces
Com
pute
rS
cien
ce
Eng
inee
ring
and
Tec
hnol
ogy
Arc
hite
ctur
e,B
uild
ing
and
Pla
nnin
g
Geo
grap
hy
For
ensi
cS
cien
ce/
Arc
haeo
logy
All
My personal interests/values 72 71 71 77 63 70 74 61 62 67 79 72 71 69The content of my universitycourse 48 58 60 57 58 55 70 47 57 64 32 55 72 58
My friends/fellow students/peergroup 45 40 29 35 42 42 38 42 40 42 25 33 26 39
My tutors/faculty staff 34 39 40 35 36 30 54 21 33 37 36 30 34 35People I know working in aparticular career 30 27 42 26 31 28 26 26 35 28 43 22 24 28
My work experience employer 33 27 24 17 38 26 19 18 39 41 25 15 17 28My parents/relatives/friends ofmy parents 29 28 22 28 23 32 27 33 26 24 32 34 19 28
Employer websites, brochuresor information
22 21 7 23 28 30 26 35 29 31 32 23 10 26
Employer presentations orvisits to employers 14 15 7 16 22 21 34 31 27 31 21 13 12 22
University careers service 14 18 9 29 22 18 11 28 10 15 14 18 3 18Other career/recruitmentwebsites or resources
14 16 13 19 17 16 18 23 14 19 4 13 9 17
Other student activities 20 12 13 14 11 14 8 14 8 18 0 15 10 14General media (newspapers,TV etc) 7 11 9 11 12 10 18 11 14 11 11 14 7 12
Other reason 4 4 7 5 7 7 2 8 4 5 11 4 3 5Not answered 0 0 0 0 0 1 0 0 0 1 0 0 0 0
Count 83 259 45 243 166 148 119 142 173 392 28 189 58 2045

STEM Graduates in Non-STEM Jobs
269
Appendix Table B3.34 Influences on career plans, by subject of study (UK taught postgraduates who had changed plans)
Sub
ject
sal
lied
toM
edic
ine
Bio
logi
cal
Sci
ence
s
Spo
rtS
cien
ce
Psy
chol
ogy
Che
mis
try
Phy
sics
Oth
erP
hysi
cal
Sci
ence
s
Mat
hem
atic
alS
cien
ces
Com
pute
rS
cien
ce
Eng
inee
ring
and
Tec
hnol
ogy
Arc
hite
ctur
e,B
uild
ing
and
Pla
nnin
g
Geo
grap
hy
For
ensi
cS
cien
ce/
Arc
haeo
logy
All
My personal interests/values 67 74 80 70 40 67 67 81 72 67 58 70 81 70
The content of my universitycourse 67 67 53 55 60 56 77 46 58 46 46 75 76 59
My tutors/faculty staff 29 54 47 52 80 22 50 38 32 31 19 39 52 38
My friends/fellow students/peergroup 25 26 13 30 80 22 40 31 47 38 35 27 14 33
People I know working in aparticular career 33 44 33 24 0 33 20 23 33 19 23 23 29 27
My work experience employer 17 26 27 21 20 39 13 23 30 23 35 5 14 22
My parents/relatives/friends ofmy parents 25 15 7 15 40 11 27 19 28 23 23 11 19 20
Employer websites, brochuresor information 4 15 13 15 0 28 23 19 20 23 12 18 14 18
Employer presentations orvisits to employers 0 18 7 9 20 11 17 19 18 27 8 16 5 16
Other career/recruitmentwebsites or resources 4 10 0 12 0 28 13 27 15 21 27 14 5 15
University careers service 8 15 0 9 40 22 0 35 5 10 12 11 14 11
Other student activities 8 5 20 6 0 11 3 15 18 6 4 11 0 9
General media (newspapers,TV etc) 0 8 7 6 40 17 3 4 8 10 4 14 10 8
Other reason 8 8 7 12 0 17 13 0 8 10 12 5 19 9
Not answered 0 0 0 0 0 0 0 0 0 1 0 0 0 0
Count 24 39 15 33 5 18 30 26 60 78 26 44 21 419

STEM Graduates in Non-STEM Jobs
270
Appendix Table B4.1 Reasons for taking current job, by undergraduate subject (all graduates interviewed by telephone)
Biologyand
relatedChemistr
y Physics
Geog./Other Phys
Sci MathsComputer Science
Eng. andTechnol.
OtherSTEM
AllSTEM
Non-STEM
Allresponden
tsType of work wanted 38 39 41 42 24 50 35 33 37 31 36Salary/benefits 17 22 18 10 15 46 25 29 21 14 20Locality/region 13 10 16 6 17 21 21 4 15 6 13Previous employer 2 2 4 6 2 4 2 4 3 4 3Interesting work 48 56 54 42 41 71 52 38 50 51 50Experience 7 2 0 6 2 0 5 4 4 0 3Job security 0 0 4 0 5 0 4 0 2 5 2Partner's is main career 0 0 0 3 0 0 0 0 0 0 0Short term suitability 0 2 4 0 0 4 1 0 1 1 1Needed a job 15 22 18 6 7 0 6 8 11 8 11Could not get or wasrejected for degree work 0 0 0 0 0 0 0 0 0 0 0
Graduate scheme 14 10 9 23 5 38 10 8 13 16 13Training and development 9 10 11 6 7 8 8 17 9 11 10Opp to gain qualifications 10 5 13 3 5 0 6 13 7 6 7Reputation/Big company 13 15 23 23 17 8 12 25 16 24 17Opp to work abroad 3 0 4 13 5 4 6 8 5 6 5Variety of work 9 0 7 6 15 13 11 8 9 20 11Public sector 1 12 2 10 7 0 0 4 3 28 7Career prospects 12 10 5 6 5 0 5 8 7 10 7Done work experience/internship there
2 2 2 10 17 13 11 13 8 1 7
Liked people 5 5 2 6 20 4 8 4 7 8 7Friend recommended 3 0 2 6 7 0 2 0 3 6 3Make a difference 2 5 4 0 0 0 1 4 2 6 3Other 15 20 11 19 15 17 15 13 15 25 17Not answered 1 0 2 3 2 0 3 0 2 0 1
Count 86 41 56 31 41 24 99 24 402 80 482

STEM Graduates in Non-STEM Jobs
271
Appendix Table B4.2 Reasons for taking current job, by employment sector and function (STEM graduates interviewed bytelephone)
STEMSpecialist
STEMGeneralis
tNon-
STEMSTEMCore
STEM-related Unrelated All STEM
Type of work wanted 44 25 44 43 29 40 37Salary/benefits 28 21 12 26 19 16 21Locality/region 18 15 11 19 15 5 15Previous employer 4 2 3 3 3 4 3Interesting work 58 35 60 56 40 55 50Experience 4 4 5 2 5 5 4Job security 3 1 2 3 1 1 2
Compatible with partner's career 0 1 0 0 1 0 0Short term suitability 1 1 2 1 2 1 1Needed a job 12 11 10 12 10 12 11Could not get or was rejected fordegree work 0 0 0 0 0 0 0
Graduate scheme 14 8 18 13 7 22 13Training and development 7 13 8 7 12 9 9Opp to gain qualifications 2 17 3 1 19 0 7Reputation/company 10 30 6 9 28 9 16Opp to work abroad 7 4 3 6 5 4 5Variety of work 7 12 8 7 11 9 9Public sector 0 1 11 1 2 12 3Career prospects 5 10 6 5 10 6 7Done work experience/ internshipthere 7 13 1 9 9 3 8
Liked people 6 12 1 7 9 3 7Friend recommended 1 5 2 1 5 3 3Make a difference 0 1 7 2 1 5 2Other 18 13 15 16 15 16 15Not answered 2 1 2 2 1 4 2
Count 153 142 107 174 151 77 402

STEM Graduates in Non-STEM Jobs
272
Appendix Table B4.3 Reasons for taking current job, by gender and university type (STEM graduatesinterviewed by telephone)
Male Female Russell 1994 Other UK All STEM
Type of work wanted 36 38 35 35 52 37Salary/benefits 24 18 21 22 23 21Locality/region 14 16 15 15 12 15Previous employer 3 3 3 1 5 3Interesting work 54 45 49 50 55 50Experience 3 5 4 5 3 4Job security 3 1 2 1 2 2
Compatible with partner'scareer 0 1 0 0 2 0
Short term suitability 0 2 2 0 2 1Needed a job 11 12 10 17 11 11Could not get or wasrejected for degree work 16 14 13 17 23 0
Graduate scheme 0 0 0 0 0 13Training and development 14 10 15 5 14 9Opp to gain qualifications 9 9 9 14 5 7Reputation/company 7 8 9 8 0 16Opp to work abroad 17 15 18 15 11 5Variety of work 6 4 5 5 5 9Public sector 9 8 10 8 8 3Career prospects 3 5 4 4 0 7Done work experience/internship there 8 5 9 5 3 8
Liked people 7 9 8 5 9 7Friend recommended 3 12 7 5 9 3Make a difference 3 2 2 4 5 2Other 3 1 1 8 0 15Not answered 2 1 2 4 0 2
Count 236 165 256 78 66 402

STEM Graduates in Non-STEM Jobs
273
Appendix Table B4.4 Career situation at graduation, by undergraduate subject (all graduates interviewed by telephone)
At graduation, did youhave:
Biologyand
relatedChemistr
y Physics
Geography/ OtherPhysicalSciences
Mathema-tical
SciencesComputer Science
Engineering and
Technology
OtherSTEM
subjects All STEMNon-STEM
Allresponden
ts
A definite career in mind 31 34 21 6 38 54 53 33 36 35 35
Some ideas about youmight do 31 32 48 61 43 42 24 42 37 41 37
Only a vague idea 24 24 18 16 12 4 16 21 18 9 16
No idea at all 13 10 11 16 7 0 4 4 8 11 9Not answered
2 0 2 0 0 0 3 0 1 4 2
Applied for jobs whileat university
Applied for jobs directlyrelated to career
40 54 52 48 69 88 68 58 57 61 58
Applied for job notrelated to career 2 7 4 10 0 4 6 4 4 5 5
Not applied for jobs 58 37 43 42 29 8 26 38 38 34 37
Not answered 0 2 2 3 2 0 1 0 1 1 1
Count 88 41 56 31 42 24 99 24 405 80 485
Jobs directly relatedto degree/subjectcourse
Yes, all the jobs 38 29 45 38 69 86 75 33 57 65 58
Yes, some of the jobs 15 17 13 13 17 5 16 13 14 4 13
No 47 54 42 50 14 9 9 53 29 31 30
Count 34 24 31 16 29 22 69 15 240 48 288

STEM Graduates in Non-STEM Jobs
274
Appendix Table B4.5 Career situation at graduation, by gender/university type (STEM graduatesinterviewed by telephone)
At graduation, did youhave:
Male Female Russell 1994 Other UK All STEM
A definite career in mind 36 36 32 36 48 36
Some ideas about youmight do
37 35 39 36 26 36
Only a vague idea 19 17 18 19 17 18
No idea at all 7 11 9 8 9 8Not answered
2 1 2 1 0 1
Applied for jobs whileat university
Applied for jobs directlyrelated to career 56 58 59 59 47 57
Applied for job notrelated to career 5 4 5 1 8 4
Not applied for jobs 37 39 35 38 45 38
Not answered 2 1 1 1 2 1
Count 236 165 256 78 66 402
Jobs directly relatedto degree/subjectcourse
Yes, all the jobs 56 57 57 50 67 57
Yes, some of the jobs 13 15 15 11 12 14
No 30 28 28 39 21 29
Count 142 97 160 46 33 240

STEM Graduates in Non-STEM Jobs
275
Appendix Table B4.6 Career situation at graduation, by undergraduate subject (all graduates interviewed by telephone without postgraduate qualification)
At graduation, did youhave:
Biologyand
relatedChemistr
y Physics
Geography/ OtherPhysicalSciences
Mathema-tical
SciencesComputer Science
Engineering and
Technology
OtherSTEM
subjects All STEMNon-
STEM
Allrespondent
s
A definite career in mind 33 38 26 7 45 57 54 35 40 33 39
Some ideas about youmight do 33 29 43 67 39 39 24 40 35 40 36
Only a vague idea 18 21 21 13 6 4 15 20 16 10 15
No idea at all 13 13 7 13 9 0 4 5 8 13 8Not answered
2 0 2 0 0 0 4 0 2 5 2
Applied for jobs whileat university
Applied for jobs directlyrelated to career 48 75 60 73 82 87 74 65 68 68 68
Applied for job notrelated to career 2 8 5 13 0 4 7 5 5 6 5
Not applied for jobs 50 17 36 20 15 9 19 30 27 25 27
Not answered 0 0 0 0 3 0 1 0 1 2 1
Count 60 24 42 15 33 23 85 20 302 63 365
Jobs directly relatedto degree/subjectcourse
Yes, all the jobs 34 26 41 25 74 86 74 36 56 60 57
Yes, some of the jobs 14 11 15 17 11 5 17 7 13 5 12
No 52 63 44 58 15 10 9 57 31 35 32
Count 29 19 27 12 27 21 65 14 214 43 257
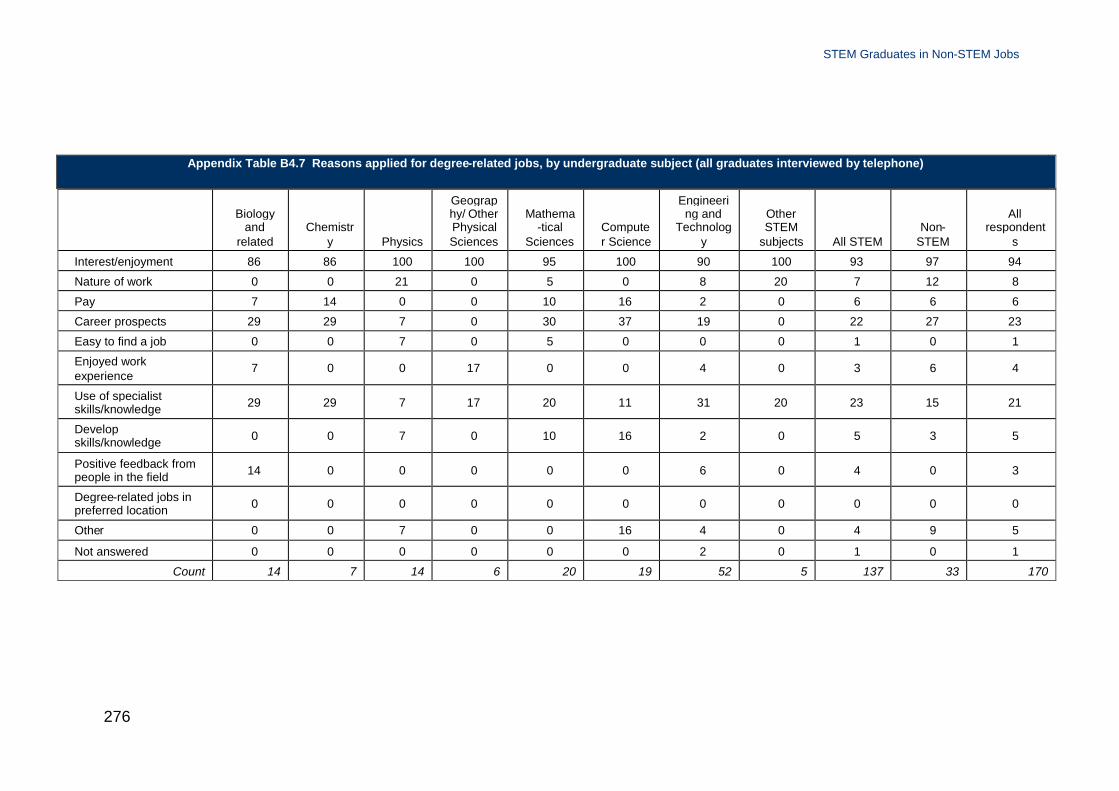
STEM Graduates in Non-STEM Jobs
276
Appendix Table B4.7 Reasons applied for degree-related jobs, by undergraduate subject (all graduates interviewed by telephone)
Biologyand
relatedChemistr
y Physics
Geography/ OtherPhysicalSciences
Mathema-tical
SciencesComputer Science
Engineering and
Technology
OtherSTEM
subjects All STEMNon-
STEM
Allrespondent
s
Interest/enjoyment 86 86 100 100 95 100 90 100 93 97 94
Nature of work 0 0 21 0 5 0 8 20 7 12 8
Pay 7 14 0 0 10 16 2 0 6 6 6
Career prospects 29 29 7 0 30 37 19 0 22 27 23
Easy to find a job 0 0 7 0 5 0 0 0 1 0 1
Enjoyed workexperience
7 0 0 17 0 0 4 0 3 6 4
Use of specialistskills/knowledge 29 29 7 17 20 11 31 20 23 15 21
Developskills/knowledge 0 0 7 0 10 16 2 0 5 3 5
Positive feedback frompeople in the field 14 0 0 0 0 0 6 0 4 0 3
Degree-related jobs inpreferred location 0 0 0 0 0 0 0 0 0 0 0
Other 0 0 7 0 0 16 4 0 4 9 5
Not answered 0 0 0 0 0 0 2 0 1 0 1
Count 14 7 14 6 20 19 52 5 137 33 170

STEM Graduates in Non-STEM Jobs
277
Appendix Table B4.8 Reasons for applying for degree-related jobs, by gender, and employment sector and function (STEM graduatesinterviewed by telephone who made only degree-related job applications at university)
Male FemaleSTEM
Specialist
STEMGeneralis
tNon-
STEMSTEMCore
STEM-related Unrelated All STEM
Interest/enjoyment 92 96 93 93 100 91 97 100 93
Nature of work 9 4 7 5 7 7 6 0 7
Pay 9 2 6 8 0 6 6 0 6
Career prospects 27 16 21 33 0 20 31 0 22
Easy to find a job 3 0 0 5 0 0 6 0 1
Enjoyed workexperience
3 4 2 3 7 3 3 0 3
Use of specialistskills/knowledge 21 23 19 33 13 23 20 14 22
Developskills/knowledge
5 5 6 5 0 4 6 14 5
Positive feedback frompeople in the field 3 5 2 5 7 3 6 0 4
Degree-related jobs inpreferred location 6 2 7 0 0 5 3 0 4
Other 0 2 1 0 0 1 0 0 1
Not answered 1 0 1 0 0 1 0 0 1
Count 78 57 81 40 15 94 35 7 136

STEM Graduates in Non-STEM Jobs
278
Appendix Table B4.9 Reasons for applying for non-related jobs, by undergraduate subject (graduates interviewed by telephone who applied only for non-related jobs whileat university)
Biologyand
relatedChemistr
y Physics
Geography/ OtherPhysicalSciences
Mathema-tical
SciencesComputer Science
Engineering and
Technology
OtherSTEM
subjects All STEMNon-
STEM
Allrespondent
sInterest/enjoyment 24 15 14 38 20 0 33 13 21 33 23Nature of work 18 0 0 0 0 0 0 0 4 7 5Not enjoyed course 18 0 14 13 20 0 33 13 14 0 11Better pay 29 31 36 0 0 50 33 38 27 0 23Better career prospects 35 38 36 50 20 0 50 50 38 7 33Easy to find a job 12 15 0 13 20 0 0 25 11 20 13Hard to find a job 6 8 21 13 0 0 0 13 10 0 8
Lack of experience 6 0 0 0 0 0 0 0 1 0 1Change of careerdirection
35 31 21 25 20 50 33 13 27 20 26
Not good enough fordegree-related work 6 0 0 0 0 0 0 0 1 0 1
Enjoyed work experience 0 0 0 0 0 0 0 0 0 0 0Put off by workexperience 12 15 7 0 0 0 0 13 8 13 9
Use of specialistskills/knowledge 0 8 0 0 0 0 0 0 1 13 3
Opportunity to developnew skills/knowledge 18 8 7 0 0 0 0 0 7 20 9
Positive feedback frompeople in the field 12 15 14 25 0 0 0 13 12 33 16
Priority to findemployment 6 0 0 0 0 0 0 13 3 13 5
Limited degree-relatedjobs in preferred location 0 0 0 0 0 0 0 0 0 7 1
Other 6 15 14 13 0 0 17 0 10 0 8Not answered 18 15 7 0 20 50 17 0 12 13 13
Count 17 13 14 8 5 2 6 8 73 15 88

STEM Graduates in Non-STEM Jobs
279
Appendix Table B4.10 Reasons applying for non-related jobs, by gender, employment sector and function (STEM graduates who made applications only fornon-related jobs while at university)
Male FemaleSTEM
Specialist
STEMGeneralis
tNon-STEM
STEMCore
STEM-related Unrelated All STEM
Interest/enjoyment 20 21 14 26 14 33 19 14 21
Nature of work 7 0 0 5 5 0 5 5 4
Not enjoyed course 16 11 14 16 10 13 14 14 14
Better pay 36 14 21 29 29 13 30 33 27
Better career prospects 38 39 29 47 29 20 49 33 38
Easy to find a job 7 18 7 18 0 7 19 0 11
Hard to find a job 9 11 14 8 10 20 5 10 10
Lack of experience 2 0 0 0 5 0 0 5 1
Change of career direction 31 21 29 26 29 40 24 24 27
Not good enough for degree-relatedwork 0 4 0 3 0 0 3 0 1
Enjoyed work experience 0 0 0 0 0 0 0 0 0
Put off by work experience 9 7 7 8 10 13 11 0 8
Use of specialist skills/knowledge 2 0 0 0 5 0 3 0 1
Opportunity to develop newskills/knowledge 7 7 0 8 10 0 8 10 7
Positive feedback from people in thefield
11 14 7 16 10 0 19 10 12
Priority to find employment 2 4 0 3 5 0 3 5 3
Limited degree-related jobs inpreferred location 0 0 0 0 0 0 0 0 0
Other 4 18 0 13 10 7 11 10 10
Not answered 13 11 29 8 10 20 11 10 12
Count 45 28 14 38 21 15 37 21 73

STEM Graduates in Non-STEM Jobs
280
Appendix Table B4.11 Reasons for choice of undergraduate course, by undergraduate subject (all graduates interviewed by telephone)
Reason
Biologyand
relatedChemistr
y Physics
Geography/ OtherPhysicalSciences
Mathema-tical
SciencesComputer Science
Engineering and
Technology
OtherSTEM
subjects All STEMNon-STEM
Allrespondent
s
Broader skills 5 5 13 16 12 8 13 21 11 15 11
Specialist skills 3 5 2 0 2 0 2 4 2 1 2
Improved jobprospects 17 12 14 19 19 29 38 25 23 26 24
Career qualification 2 2 0 0 0 0 0 0 1 3 1
Interest 90 80 89 94 79 79 80 92 85 90 86
Enjoyment 3 2 11 10 10 4 4 0 5 6 6
Personal ability 28 32 39 26 67 21 34 17 34 36 35
Status 0 0 0 0 0 0 0 0 0 0 0
Student lifestyle 1 0 0 3 0 0 1 0 1 0 1
Influenced byfriends/family 3 10 4 3 0 0 11 4 5 0 5
Influenced by peoplewho have studied thesubject
1 5 0 0 0 4 1 4 1 0 1
Teacher/schoolrecommendation 5 12 0 13 5 0 4 0 5 6 5
Impressed aftervisiting 5 0 2 3 5 21 8 4 5 6 6
Close to home 1 5 0 0 0 4 0 0 1 0 1
Lack of competition 1 0 0 3 2 4 1 0 1 0 1
Other 5 7 5 3 5 13 5 0 5 4 5
Not answered 5 0 0 0 0 0 0 0 1 0 1
Count 88 41 56 31 42 24 99 24 405 80 485

STEM Graduates in Non-STEM Jobs
281
Appendix Table B4.12 Reasons for choice of undergraduate course, by current employment sector and function(STEM graduates interviewed by telephone)
Reason STEMSpecialist
STEMGeneralis
tNon-
STEMSTEMCore
STEM-related Unrelated All STEM
Broader skills 12 8 13 10 8 18 11
Specialist skills 3 1 4 3 3 0 2
Improved jobprospects
25 22 21 28 17 22 23
Career qualification 1 0 1 1 1 0 1
Interest 80 87 89 79 88 91 85
Enjoyment 7 4 6 6 3 8 5
Personal ability 24 44 34 28 42 32 34
Status 0 0 0 0 0 0 0
Student lifestyle 1 0 1 1 0 1 1
Influenced byfriends/family
6 4 7 6 5 4 5
Influenced by peoplewho have studied thesubject
1 3 1 2 1 1 1
Teacher/schoolrecommendation 3 6 6 2 7 6 5
Impressed aftervisiting 10 3 2 9 2 4 5
Close to home 1 1 1 1 1 1 1
Lack of competition 1 1 1 2 1 0 1
Other 10 2 2 8 3 4 5
Not answered 1 0 3 2 0 1 1
Count 153 142 107 174 151 77 402

STEM Graduates in Non-STEM Jobs
282
Appendix Table B4.13 Whether graduates would do the same/similar degree course again, by undergraduate subject (all graduates interviewed by telephone)
Biologyand
relatedChemistr
y Physics
Geography/ OtherPhysicalSciences
Mathema-tical
Sciences
Computer
Science
Engineering and
Technology
OtherSTEM
subjectsAll
STEMNon-
STEMAll
respondents
Same or similar course 67 56 79 68 79 75 80 58 72 79 73
Different course 28 39 11 26 21 25 15 42 23 18 22
Delay entry 5 5 4 6 0 0 2 0 3 3 3
Not answered 0 0 7 0 0 0 3 0 2 1 2
Count 88 41 56 31 42 24 99 24 405 80 485
Appendix Table B4.14 Whether graduates would do the same/similar course, by current employment sector andfunction (STEM graduates interviewed by telephone)
STEMSpecialist
STEMGenerali
stNon-
STEMSTEMCore
STEM-related
Unrelated
AllSTEM
Same or similar course 78 72 63 74 70 71 72
Different course 18 23 31 21 26 23 23
Delay entry 2 3 4 3 2 5 3
Not answered 1 2 2 2 1 1 2
Count 153 144 108 174 151 80 405

STEM Graduates in Non-STEM Jobs
283
Appendix Table B4.15 Career planning at entry to, and change during, university, by undergraduate subject (all graduates interviewed by telephone)
When first went touniversity
Biologyand
relatedChemistr
y Physics
Geography/ OtherPhysicalSciences
Mathema-tical
SciencesComputer Science
Engineering and
Technology
OtherSTEM
subjects All STEMNon-STEM
Allrespondent
s
Yes, definite career inmind 19 17 5 6 12 13 18 13 14 24 16
Yes, some ideasabout career 23 27 27 19 31 17 29 25 26 19 25
Very vague idea ofcareer 24 20 27 29 19 38 29 25 26 16 24
No idea at all 31 34 39 42 36 33 22 29 32 39 33
Work specified 3 0 2 0 2 0 1 4 2 3 2
Not answered 0 2 0 3 0 0 0 4 1 0 1
Career plan change
Yes, completely 9 10 11 6 10 4 12 13 10 13 10
Yes, some extent 47 41 48 61 50 58 48 33 48 23 44
No 32 34 38 23 29 29 30 46 32 38 33
Not answered 13 15 4 10 12 8 9 8 10 28 13
Count 88 41 56 31 42 24 99 24 405 80 485

STEM Graduates in Non-STEM Jobs
284
Appendix Table B4.16 ‘Top three’ influences on career planning while at university, by undergraduate subject (all graduates interviewed by telephone)
Reason
Biologyand
relatedChemistr
y Physics
Geography/ OtherPhysicalSciences
Mathema-tical
SciencesComputer Science
Engineering and
Technology
OtherSTEM
subjects All STEMNon-
STEM
Allrespondent
sUniversity course 41 44 36 48 38 38 48 42 42 45 43Work experienceemployer
24 37 21 10 24 54 56 33 34 25 32
Interest/values 31 22 23 42 31 21 23 25 27 45 30Family and familyfriends 25 12 29 32 26 21 23 17 24 16 22
Employer visits/presentation 15 17 23 10 36 13 16 4 18 19 18
Personal friends/peers 16 20 30 10 14 25 15 21 18 11 17University careersservice 20 5 16 10 10 13 7 13 12 15 13
Industry specificwebsites/magazines 14 10 20 6 17 13 13 13 14 8 13
Faculty staff 6 17 11 10 5 17 15 17 11 8 11Salary prospects 14 15 7 0 10 21 8 13 10 1 9People in a particularcareer 2 7 5 0 7 8 12 17 7 5 7
Employer website/information 3 7 5 3 0 17 8 4 6 11 7
General media 2 10 5 10 0 13 6 8 6 8 6Other employers 6 2 0 10 0 4 4 4 4 13 5Career websites/magazines 2 0 2 6 5 0 0 0 2 8 3
Course performance 3 2 2 0 0 0 2 0 2 3 2Recruitment websites 2 0 0 0 0 0 0 0 0 0 0Other 1 2 2 0 0 0 2 0 1 1 1Not answered 3 2 2 0 2 0 1 0 2 3 2
Count 88 41 56 31 42 24 99 24 405 80 485
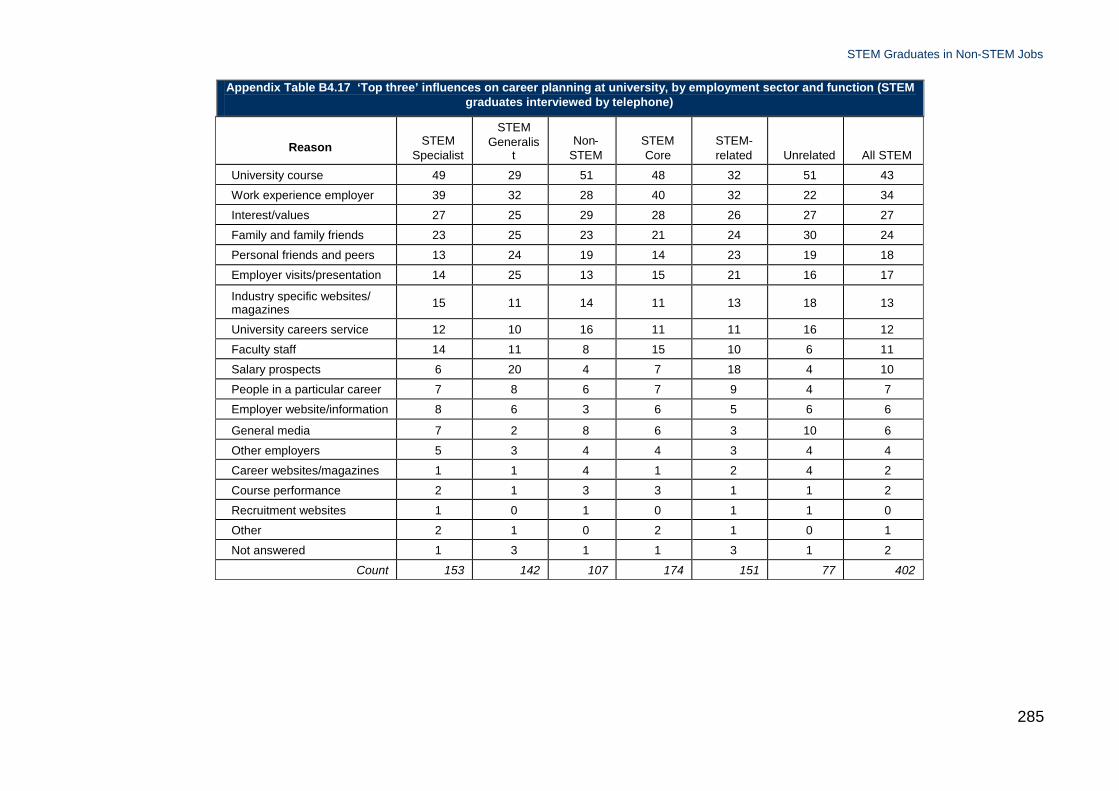
STEM Graduates in Non-STEM Jobs
285
Appendix Table B4.17 ‘Top three’ influences on career planning at university, by employment sector and function (STEMgraduates interviewed by telephone)
Reason STEMSpecialist
STEMGeneralis
tNon-
STEMSTEMCore
STEM-related Unrelated All STEM
University course 49 29 51 48 32 51 43
Work experience employer 39 32 28 40 32 22 34
Interest/values 27 25 29 28 26 27 27
Family and family friends 23 25 23 21 24 30 24
Personal friends and peers 13 24 19 14 23 19 18
Employer visits/presentation 14 25 13 15 21 16 17
Industry specific websites/magazines 15 11 14 11 13 18 13
University careers service 12 10 16 11 11 16 12
Faculty staff 14 11 8 15 10 6 11
Salary prospects 6 20 4 7 18 4 10
People in a particular career 7 8 6 7 9 4 7
Employer website/information 8 6 3 6 5 6 6
General media 7 2 8 6 3 10 6
Other employers 5 3 4 4 3 4 4
Career websites/magazines 1 1 4 1 2 4 2
Course performance 2 1 3 3 1 1 2
Recruitment websites 1 0 1 0 1 1 0
Other 2 1 0 2 1 0 1
Not answered 1 3 1 1 3 1 2
Count 153 142 107 174 151 77 402

STEM Graduates in Non-STEM Jobs
286
Appendix Table B4.18 Percentage with work experience, and its usefulness, by undergraduate subject (all graduates interviewed by telephone)
Biologyand
relatedChemistr
y Physics
Geography/ OtherPhysicalSciences
Mathema-tical
SciencesComputer Science
Engineering and
Technology
OtherSTEM
subjects All STEMNon-STEM
Allresponde
nts
Done workexperience 48 56 39 42 40 88 76 58 56 47 55
As anundergraduate
43 54 38 35 36 88 76 54 53 46 52
As a postgraduate 5 2 5 10 5 0 1 4 4 1 3
Count 88 41 56 31 42 24 99 24 405 80 485
Undergraduatework experience
Not at all helpful 0 5 0 0 0 0 0 0 0 0 0
Not very helpful 5 9 5 0 0 0 4 14 5 3 4
Quite helpful 38 9 36 45 31 10 26 29 28 24 27
Very helpful 56 77 59 55 69 90 70 57 67 73 68
Count 39 22 22 11 16 20 74 14 218 37 255

STEM Graduates in Non-STEM Jobs
287
Appendix Table B4.19 Impact of influences on career plans, by undergraduate subject (all graduates interviewed by telephone)
Biologyand
relatedChemistr
y Physics
Geography/ OtherPhysicalSciences
Mathema-tical
SciencesComputer Science
Engineering and
Technology
OtherSTEM
subjects All STEMNon-
STEM
Allrespondent
s
Decided wanted to workin degree-related work 38 34 41 48 69 83 69 42 52 70 55
Decided not want towork in degree-relatedwork
39 29 39 32 14 29 29 33 32 15 29
Needed further training 7 0 4 3 2 0 3 0 3 0 3
Information aboutspecific work 17 29 9 13 21 38 23 25 20 19 20
Discovered new areasof work 11 7 13 16 14 25 13 13 13 5 12
Desirable employer 15 24 25 23 29 33 22 25 23 38 25
Undesirable employers 1 5 4 0 0 0 1 0 1 3 2
Needed to rethinkcareer plans 7 10 11 6 5 0 4 4 6 9 7
Put off looking for work 1 0 2 6 0 0 2 0 1 1 1
No degree-related jobsin preferred location
2 2 0 0 0 0 0 0 1 0 1
Other 1 2 2 3 0 0 1 4 1 0 1
Not answered 3 10 4 3 5 0 4 0 4 3 4
Count 88 41 56 31 42 24 99 24 405 80 485

STEM Graduates in Non-STEM Jobs
288
Appendix Table B4.20 Impact of influences on career plans, by employment sector and function (STEM graduatesinterviewed by telephone)
STEMSpecialist
STEMGeneralis
tNon-
STEMSTEMCore
STEM-related Unrelated All STEM
Decided wanted to work indegree-related work 68 39 48 71 40 35 52
Decided not want to work indegree-related work
20 40 36 21 38 43 31
Needed further training 5 3 2 3 3 3 3
Information about specificwork 18 24 20 18 24 19 20
Discovered new areas ofwork
18 12 7 17 11 9 13
Desirable employer 25 27 14 24 23 19 23
Undesirable employers 1 3 1 1 3 0 1
Needed to rethink careerplans 5 6 9 5 5 10 6
Put off looking for work 2 1 1 2 1 1 1
No degree-related jobs inpreferred location
0 1 1 0 1 1 1
Other 1 2 1 1 2 1 1
Not answered 5 2 5 5 3 4 4
Count 153 142 107 174 151 77 402

STEM Graduates in Non-STEM Jobs
289
Appendix Table B4.21 Whether used University Careers Service as an undergraduate and, if so, its usefulness, by undergraduate subject (all graduates interviewed bytelephone)
Biologyand
relatedChemistr
y Physics
Geography/ OtherPhysicalSciences
Mathema-tical
Sciences
Computer
Science
Engineering and
Technology
OtherSTEM
subjectsAll
STEMNon-
STEM
Allrespondent
s
Yes 65 49 66 48 60 63 66 63 61 69 63
No 32 51 32 52 40 38 34 33 37 31 36
Not answered 3 0 2 0 0 0 0 4 1 0 1
Count 88 41 56 31 42 24 99 24 405 80 485
Not at all helpful 4 15 0 0 0 7 0 0 2 0 2
Not very helpful 11 25 11 40 24 0 25 33 19 24 20
Quite helpful 37 45 54 47 28 53 49 60 45 40 44
Very helpful 49 15 30 13 40 33 26 7 31 36 32
Not answered 0 0 5 0 8 7 0 0 2 0 2
Count 57 20 37 15 25 15 65 15 249 55 304

STEM Graduates in Non-STEM Jobs
290
Appendix Table B4.22 Use of degree knowledge and more general skills, by undergraduate subject (all graduates interviewed by telephone)
Using and building onspecific skills andknowledge
Biologyand
relatedChemist
ry Physics
Geography/ OtherPhysicalSciences
Mathema-tical
Sciences
Computer
Science
Engineering and
Technology
OtherSTEM
subjectsAll
STEMNon-
STEM
Allrespond
ents
Not at all 38 29 27 10 15 0 14 25 22 19 22
Only to a little extent 16 34 20 32 37 25 25 33 26 25 26
To some extent 30 10 39 39 29 46 45 42 35 35 35
To a great extent 13 27 14 19 17 29 15 0 16 19 17
Not answered 2 0 0 0 2 0 0 0 1 3 1
General skills
Not at all 2 0 2 0 2 0 1 0 1 1 1
Only to a little extent 6 7 13 13 5 13 6 0 7 3 7
To some extent 41 34 32 39 41 38 30 50 37 31 36
To a great extent 49 59 54 48 49 50 63 50 54 63 55
Not answered 2 0 0 0 2 0 0 0 1 3 1
Count 86 41 56 31 41 24 99 24 402 80 482

STEM Graduates in Non-STEM Jobs
291
Appendix Table B4.23 General skills learnt from degree, by undergraduate subject (all graduates interviewed by telephone)
Biologyand
relatedChemistr
y Physics
Geography/ OtherPhysicalSciences
Mathema-tical
Sciences
Computer
Science
Engineering and
Technology
OtherSTEM
subjectsAll
STEMNon-
STEM
Allresponde
ntsWritten communication/presentation skills 69 54 57 61 51 58 55 58 58 80 62
Spoken communication 45 49 38 55 44 46 33 46 42 59 45Analytical 52 69 72 71 83 54 48 63 59 - -Logical/rigorousapproach to problemsolving 65 64 84 42 48 45 59 44 60 29 52Analytical skills 7 0 3 12 24 9 10 0 9 68 24Ability to assessrisk/probability 4 0 0 0 0 0 3 0 1 5 2Numeracy 14 20 25 19 27 4 12 8 16 10 15Computer literacy 10 0 14 10 2 8 7 8 8 6 8Team working 35 24 14 32 17 38 39 29 30 30 30Leadership skills 2 5 0 0 2 13 6 4 4 6 4Self-confidence 2 5 4 10 2 8 3 0 4 4 4Self-discipline 16 22 16 16 29 42 21 21 21 15 20Creativity 1 7 2 6 5 0 0 4 2 0 2Project management 7 12 0 10 0 4 17 17 9 3 8Time management 17 20 5 23 12 8 9 25 14 8 13Research Skills 21 7 7 19 2 4 5 17 10 18 12Organisation Skills 6 10 0 0 5 4 7 25 6 8 6Other 10 7 5 3 2 4 8 8 7 1 6Not answered 2 2 2 0 2 4 4 4 3 1 2
Count 86 41 56 31 41 24 99 24 402 80 482Notes:1. Question wording was revised part-way through interviews.2. Percentages for Analytical based on first 170 interviews.3. Percentages for Logical/rigorous approach to problem solving, Analytical skills and Ability to assess risk/probability based on remaining 315 interviews4. Percentages for Time management, Research Skills and Organisation Skills are based on recoding ‘Other’ replies.
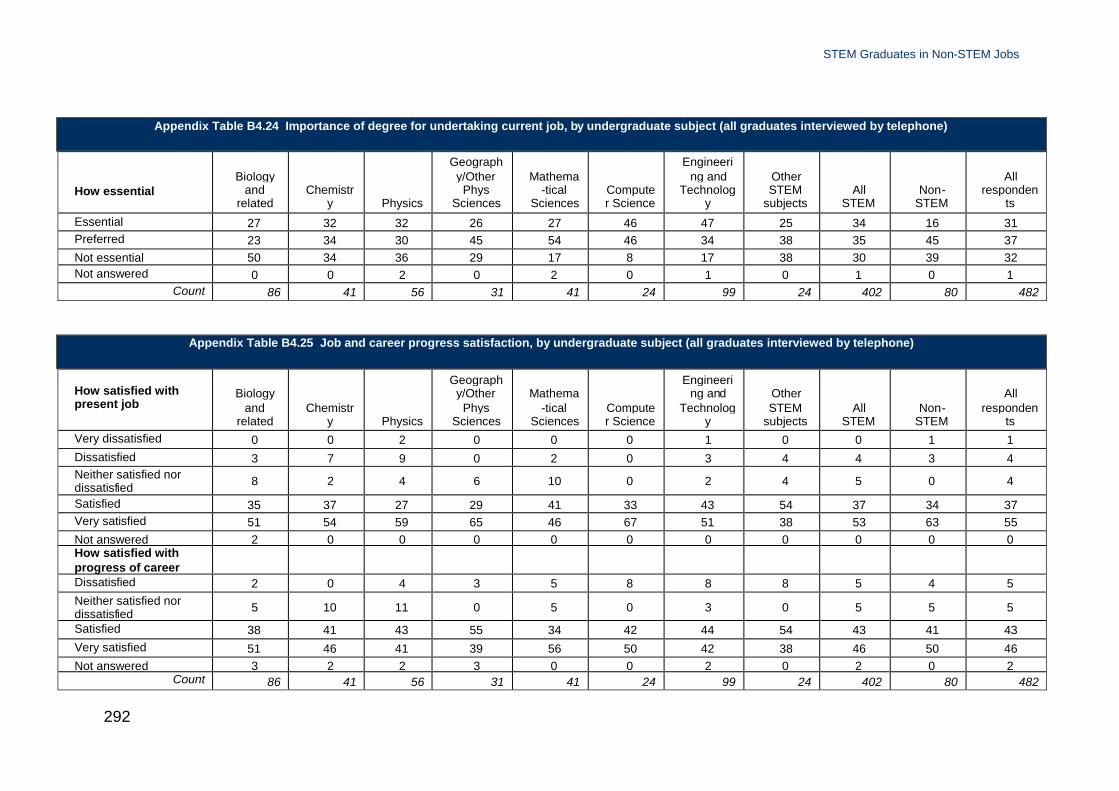
STEM Graduates in Non-STEM Jobs
292
Appendix Table B4.24 Importance of degree for undertaking current job, by undergraduate subject (all graduates interviewed by telephone)
How essentialBiology
andrelated
Chemistry Physics
Geography/OtherPhys
Sciences
Mathema-tical
SciencesComputer Science
Engineering and
Technology
OtherSTEM
subjectsAll
STEMNon-
STEM
Allresponden
ts
Essential 27 32 32 26 27 46 47 25 34 16 31Preferred 23 34 30 45 54 46 34 38 35 45 37Not essential 50 34 36 29 17 8 17 38 30 39 32Not answered 0 0 2 0 2 0 1 0 1 0 1
Count 86 41 56 31 41 24 99 24 402 80 482
Appendix Table B4.25 Job and career progress satisfaction, by undergraduate subject (all graduates interviewed by telephone)
How satisfied withpresent job
Biologyand
relatedChemistr
y Physics
Geography/OtherPhys
Sciences
Mathema-tical
SciencesComputer Science
Engineering and
Technology
OtherSTEM
subjectsAll
STEMNon-
STEM
Allresponden
tsVery dissatisfied 0 0 2 0 0 0 1 0 0 1 1Dissatisfied 3 7 9 0 2 0 3 4 4 3 4Neither satisfied nordissatisfied 8 2 4 6 10 0 2 4 5 0 4
Satisfied 35 37 27 29 41 33 43 54 37 34 37Very satisfied 51 54 59 65 46 67 51 38 53 63 55Not answered 2 0 0 0 0 0 0 0 0 0 0How satisfied withprogress of careerDissatisfied 2 0 4 3 5 8 8 8 5 4 5Neither satisfied nordissatisfied 5 10 11 0 5 0 3 0 5 5 5
Satisfied 38 41 43 55 34 42 44 54 43 41 43Very satisfied 51 46 41 39 56 50 42 38 46 50 46Not answered 3 2 2 3 0 0 2 0 2 0 2
Count 86 41 56 31 41 24 99 24 402 80 482

STEM Graduates in Non-STEM Jobs
293
Appendix Table B4.26 Reasons for desire for more degree-related work, by current employment sector and function(STEM graduates interviewed by telephone who were not in degree-related jobs but would like degree-related work)
STEMSpecialist
STEMGeneralis
tNon-
STEMSTEMCore
STEM-related Unrelated
AllSTEM
More interesting/enjoyable 78 90 82 78 91 79 84
Nature of work 0 3 7 3 5 3 4
Change of direction 0 2 0 0 2 0 1
Degree-related toonarrow 0 0 0 0 0 0 0
Too competitive 3 0 0 3 0 0 1
Better paid 3 0 0 3 0 0 1
Better career prospects 3 2 0 3 2 0 1
Enjoyed workexperience 0 0 2 0 0 3 1
Not enjoyed working inthis area 3 0 0 3 0 0 1
Use specialist skills/knowledge 38 25 41 31 26 50 33
Develop skills 6 0 2 6 0 3 2
Positive feedback frompeople in the field 0 0 0 0 0 0 0
Other 3 5 5 6 5 3 4
Count 32 59 44 36 65 34 135

STEM Graduates in Non-STEM Jobs
294
Appendix Table B4.27 Reasons for not wishing to have more degree-related work, by employment sector andfunction (STEM graduates interviewed by telephone not in degree-related jobs who would not like more degree-related
work)
STEMSpecialist
STEMGeneralis
tNon-
STEMSTEMCore
STEM-related Unrelated All STEM
More interesting/enjoyable 38 14 17 41 14 9 22
Nature of work 0 2 3 0 2 4 2
Change of direction 7 19 30 3 23 35 19
Degree-related toonarrow 24 52 27 24 45 39 37
Too competitive 7 10 7 0 14 9 8
Better paid 3 12 3 3 11 4 7
Better career prospects 7 21 17 3 25 17 16
Enjoyed workexperience 0 0 0 0 0 0 0
Not enjoyed working inthis area 14 12 20 18 14 13 15
Use specialist skills/knowledge 0 0 0 0 0 0 0
Develop skills 3 2 0 3 2 0 2
Positive feedback frompeople in the field 0 2 0 0 2 0 1
Other 14 2 0 12 2 0 5
Count 29 42 30 34 44 23 101

STEM Graduates in Non-STEM Jobs
295
Appendix Table B.1 List of Higher Education Institutions (undergraduate and taught postgraduate survey)
Aberdeen
University of Abertay Dundee
Aberystwyth
Anglia Ruskin
Aston
Bangor
Bath Spa
Bath
Bedfordshire
Birkbeck, University of London
Birmingham City
Birmingham
Bournemouth
Bradford
Brighton
Bristol
Brunel
Bucks New University
Cambridge
Canterbury Christ Church
Cardiff
University of Wales Institute, Cardiff
Central Lancashire
Chester
Chichester
City University London
Coventry
University College for the Creative Arts
Cumbria
De Montfort
Derby
Dundee
Durham
East Anglia
East London
Edge Hill University
Edinburgh
Essex
Exeter
Glamorgan
Glasgow Caledonian
Glasgow
Gloucestershire
Glyndwr University
Goldsmiths, University of London
Greenwich
Heriot-Watt
Hertfordshire
Huddersfield
Hull
Imperial College London
Keele

STEM Graduates in Non-STEM Jobs
296
Kent
King's College London
Kingston
University of Wales Lampeter
Lancaster
Leeds Metropolitan
Leeds
Leicester
Lincoln
Liverpool Hope
Liverpool John Moores
Liverpool
London Metropolitan
London School of Economics and PoliticalScience
London South Bank
University College London
Loughborough
Manchester Metropolitan
Manchester
Middlesex
Edinburgh Napier University
Newcastle
Northampton
Northumbria
Nottingham Trent
Nottingham
Open University
Oxford Brookes
Oxford
Plymouth
Portsmouth
Queen Mary, University of London
Queen's University Belfast
Reading
Robert Gordon
Roehampton
Royal Holloway, University of London
Royal Veterinary College
Salford
Sheffield Hallam
Sheffield
Southampton Solent University
Southampton
St Andrews
St George's, University of London
Staffordshire
Stirling
Strathclyde
Sunderland
Surrey
Sussex
Swansea
Teesside
Ulster

STEM Graduates in Non-STEM Jobs
297
Warwick
University of the West of England
University of the West of Scotland
Westminster
Winchester
Wolverhampton
Worcester
York
York St John
Appendix Table B.2 List of universities and research institutes (STEM PhD student survey)
Aberdeen
University of Abertay Dundee
Aberystwyth
Anglia Ruskin
Armagh Observatory
Aston
Bangor
Bath
Birkbeck, University of London
Birmingham City
Birmingham
Bolton
Bradford
Brighton
Bristol
Brunel
Cambridge
Canterbury Christ Church
Cardiff
University of Wales Institute, Cardiff
Central Lancashire
City University London
Coventry
Cranfield
Cumbria
De Montfort
Derby
Dundee
Durham
East Anglia
East London
Edinburgh
Essex
Exeter
Glamorgan
Glasgow Caledonian
Glasgow
Gloucestershire
Glynd?r University
Goldsmiths, University of London
Greenwich
Heriot-Watt

STEM Graduates in Non-STEM Jobs
298
Hertfordshire
Huddersfield
Hull
Imperial College London
Keele
Kent
King's College London
Kingston
Lancaster
Leeds Metropolitan
Leeds
Leicester
Liverpool John Moores
Liverpool
London School of Hygiene & Tropical Medicine
London South Bank
University College London
Loughborough
Manchester Metropolitan
Manchester
Edinburgh Napier University
Newcastle
Northampton
Northumbria
Norwich University College of the Arts
Nottingham Trent
Nottingham
Open University
Oxford Brookes
Oxford
Plymouth
Portsmouth
Queen Margaret University, Edinburgh
Queen Mary, University of London
Queen's University Belfast
Reading
Robert Gordon
Roehampton
Royal Holloway, University of London
Royal Veterinary College
Salford
School of Pharmacy, University of London
Sheffield Hallam
Sheffield
Southampton
St Andrews
St George's, University of London
Stirling
Strathclyde
Sunderland
Surrey
Sussex
Swansea
UHI Millennium Institute

STEM Graduates in Non-STEM Jobs
299
Ulster
Warwick
University of the West of England
University of the West of Scotland
Westminster
York
York St John
Institute of Animal Health
Rothamstead
Highlands and Islands

© Crown copyright 2010
You may re-use this information (not including logos) free of charge in any format or medium, under the terms ofthe Open Government Licence. To view this licence, visit http://www.nationalarchives.gov.uk/doc/open-government-licence/ or write to the Information Policy Team, The National Archives, Kew, London TW9 4DU, or e-mail: [email protected].
This publication is also available on our website at http://www.bis.gov.uk
Any enquiries regarding this publication should be sent to:
Department for Business, Innovation and Skills1 Victoria StreetLondon SW1H 0ETTel: 020 7215 5000
If you require this publication in an alternative format, email [email protected], or call 020 7215 5000.
URN 11/771