steady-state wind loading on parabolic trough solar...
TRANSCRIPT

, .
. SAND79-2134
Steady-State Wind Loading on ParabolicTrough Solar Collectors
. Duane E. Randall, Donald D. McBride, Roger E. Tate
When printing a copy of any digitized SAND Report, you are required to update the
markings to current standards.
Issued by Sandia National Laboratories, operated for the United States Depar1ment of Energy by Sandia Corporation. NOTICE: This report was prepared as an account of work sponsored by an alency of the Untted States Government. Neither the United States Government nor any agency thereof, nor any of their employees, nor any of their contractors, subcontractors, or their employees, makes any warranty. express or impUed or assumes any leal lt8bility or responsibility for the accuracy. completeness, or usefUlness of any information, apparatus, product. or process disclosed, or represents that its use would not infringe privately owned riahts. Reference herein to any specific commercial product. process, or service by trade name, trademark. manufacturer, or otherwise does not necessarily constitute or imply its endorsement, recommendation, or favoring by the United States Government, any agency thereof or any of their contractors or subcontractors. The views and opinions expressed herein do not necessarUy state or reflect those of the United States Govemment, any alency thereof or any of their contractors or subcontractors.
Printed in the United StetlS of Americe Avallabl. from
N.tional T.chnicellnformation S.rvlce U. S. Ceperlment of Commerce 6286 Port Royal Roed Springfield, VA 22181
NTIS price codas Printed copy: $5.00 Microfiche copy: ADI
· . ,
Date: March 20, 1981
To: Distribution
From: D. E. Randall
Sandia National Laboratories Albuquerque. New Mexico 87185
Subject: Steady-State Wind Loading on Parabolic-Trough Solar Collectors,
SAND79-2134 (Albuquerque: Sandia National Laboratories, August 1980).
Errata Sheet.
Page 16: Interchange Figures 12(b) and 13(b); leave captions as they are.
Distribution:

SAND79-2134 Unlimited Release Printed August 1980
Steady-State Wind Loading on Parabolic-Trough Solar Collectors
Duane E. Randall Small Power Systems Applications Division, 4725
Donald D. McBride Roger E. Tate Experimental Aerodynamics Division, 5634
Sandia National Laboratories Albuquerque, NM 87185
ABSTRACT Two wind tunnel force and moment tests have been conducted on parabolic-trough solar collector configurations. The two tests were conducted in different flow field environments, one a uniform flow infinite airstream, the second a simulated atmospheric boundary layer flow with the models simulating a ground-mounted installation. The force and moment characteristics of both isolated single-module troughs and of trough modules within array configurations have been defined over both operational and stow attitudes. The influence of various geometric design parameters for collector modules and arrays has been established. Data indicate that forces and moments increase with mounting height and with trough aspect ratio. Collector modules interior to large arrays experience wind force reductions as high as 50-65%, while appropriate fences or berms surrounding the arrays can provide exterior modules with protection of this order.
3

ACKNOWLEDGMENTS This work was supported by the United States Department of Energy. The authors wish to acknowledge the contributions of: R. L. Champion, Division 4722, Sandia National Laboratories, who was the project engineer on Test I; J. L. Lindsey, Vought Corporation, who was the test engineer on Test I; and J. A Peterka, J. M. Sinou, and J. E. Cermak, Colorado State University, who conducted Test II under contract from Sandia National Laboratories.
4

Contents Introduction .................. ............ .... ......... ..... ...... ........... ........ ... ..... ...... .......... 7 Experimental Configurations and Test Techniques ............................... 7
Test I .......................................................................................................... 7 Test II ........................................................................................................ 8
Axis and Load Nomenclature .................................................................... 9 Data Reduction and Presentation ............................................................. 9 Analysis of Test Results ............................................................................. 10
Single Collector Modules ....................................................................... 10 Attitude Influence ............................................................................... 10 Reynolds Number Effects ................................................................... 12 Mounting Height Influence .............................................................. 12 Aspect Ratio Influence ........................................................................ 13 Collector Rim Angle Influence ......................................................... 13
Collector Array Effects ........................................................................... 14 Gap Spacing Within Rows ................................................................. 14 Row Spacing Within Arrays .............................................................. 15 Array Force and Moment Characteristics ........................................ 15
Fence and Berm Effects .......................................................................... 17 'Summary and Conclusions ........................................................................ 18 References ..................................................................................................... 18
Illustrations Figure
1 Model Nomenclature for Single Models....................................... 8 2 Model Nomenclature for Collector Arrays ................................... 8 3 Model Axis System... ...... .......... ...... ........... ...... ........... ....................... if 4 Coefficients vs Pitch Angle for Trough atO-Deg yaw............... 10 5 Effect of Yaw Angle on Force Coefficients ................................... 11 6 Reynolds Number Effect on Peak Lateral Force .......................... 12 7 Mounting Height Effect on Force and Moment Coefficients.... 12 8 Aspect Ratio Effect on Force and Moment Coefficients ............. 13 9 Rim Angle Effect on Force Coefficents ......................................... 14
10 Gap Spacing Effect on Force and Moment Coefficients ............. 15 11 Row Spacing Effect on Force Coefficients .................................... 15 12 Effect of Downstream Row on Windward Row Force and Mo-
ment Coefficients .............................................................................. 16 13 Effect of Array Shielding OI;l Force and Moment Coefficients.. 16 14 Effect of Fences and Berms on Force Coefficients ....................... 17 15 Force and Moment Coefficients for Multiple Row Arrays with
Upstream Fence ................................................................................. 17
5-6

Steady-State Wind Loading on Parabolic-Trough Solar Collectors
Introduction Among the various solar collector alternatives,
the line-focus parabolic-trough concept has attained an advanced stage of development and currently appears to be an important competitor for applications in the midtemperature regime « 350°C). The economic competitiveness of solar energy in this regime depends heavily upon the cost of the solar collector field. A prime contributing factor to this cost lies in the collector rigidity anq foundation requirements necessary to withstand adverse wind loading
Evaluation of the wind forces exerted upon parabolic-trough collectors configured in an array of many rows with multiple troughs per row is beyond the current state of aerodynamic analysis. As a part of the solar collector development program at Sandia National Laboratories, wind tunnel tests have been run in two facilities in an effort to characterize the wind loads experienced on a parabolic trough, both as a single isolated collector module and as part of an array.
This report summarizes the results of those tests along with comments on their significance. It is hoped that the results of this program may provide a set of guidelines to the engineers and architects throughout the country engaged in the design and installation of large arrays of parabolic-trough solar collectors.
Experimental Configurations and Test Techniques
The first test was run in 1976 in the Vought Low Speed Wind Tunnel (an inviscid uniform flow of 2.13 x 3.05 m [7 x 10 ft] cross section) to obtain basic force and pressure data. Overall wind loads were measured as were pressures on both sides of the parabolic trough. Obviously, the overall forces and moments are needed from the standpoint of foundation and other structural design while the pressure distribution is a valuable tool to be used in the detail design
of the parabolic collector itself. The second test was run in 1979 under wind conditions more closely modeling the full-scale problem. The Meteorological Wind Tunnel at the Fluid Dynamics and Diffusion Laboratory at Colorado State University was chosen as the test site since it was capable of producing a flow tailored to simulate, as closely as possible,an atmospheric boundary layer developed over open flat terrain by wind that has a velocity of 40.2 m/s (90 m/h) at 9.14 m (30 it) altitude. This atmospheric boundary layer was modeled by a 1.14 m (45 in) deep shear layer whose mean velocity power law exponent was 0.15. That is to say
(1)
where u = mean wind velocity at height z
u,ef = mean wind velocity at reference height Yref
The turbulent intensity increased from approximately 4% in the free stream to more than 20% at the wind tunnel wall and was about 16% at trough centerline. The I/25-scale models were placed in this shear layer.
This section describes the configurations and procedures used in the two tests.
Test I The 19.5 cm (7.70 in) aperture, 90-deg rim angle
collector models were molded of fiberglass and supported on the convex side by a steel backing and' angle indexing structure (Figure Ia). This structure attached to the support strut and provided tilt angle rotation from 0 deg (concave surface forward) to 180 deg (convex surface forward). Aspect ratios (length/aperture) of 1.25, 3.74, 6.85, and 9.97 were tested
7
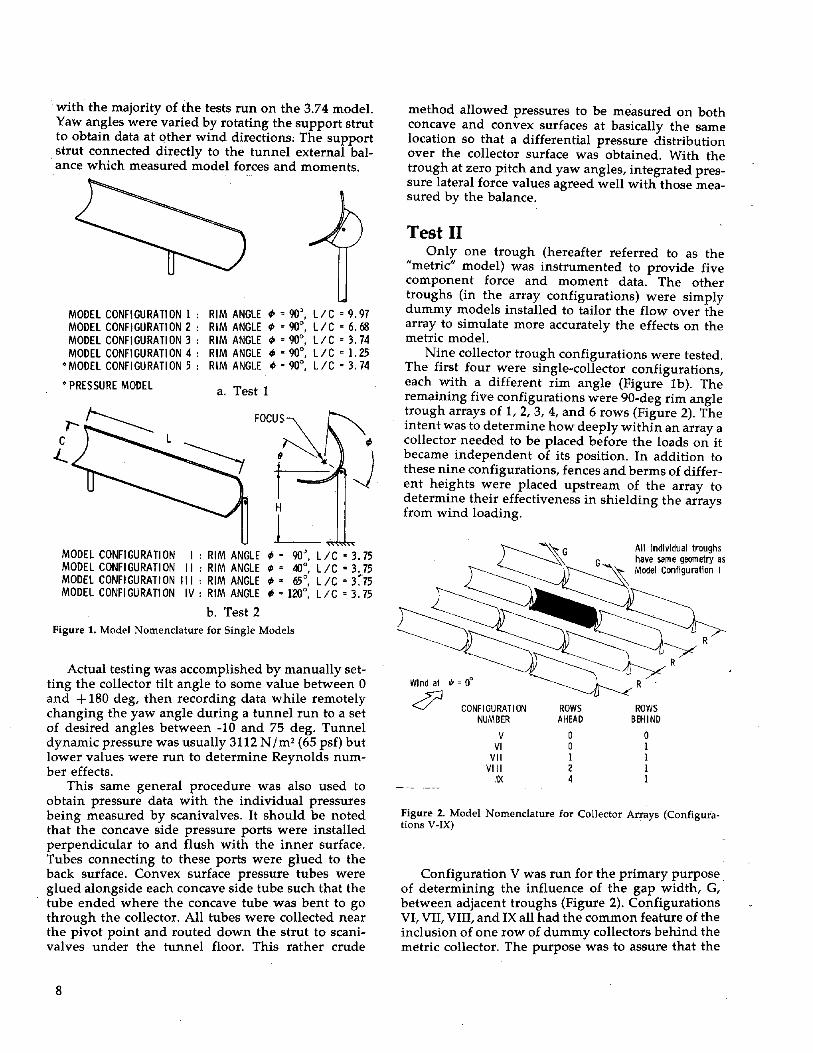
with the majo·rity of the tests run on the 3.74 model. Yaw angles were varied by rotating the support strut to obtain data at other wind directions; The support
. strut connected directly to the tunnel external balance which measured model forces and moments.
MODEL CONFIGURATION 1 : MODEl CONFIGURATION 2 : MODEl CONFI GURA TI ON 3 : MODEL CONFI GURATI ON 4 :
• MODEl CONFIGURATION 5 :
• PRESSURE MODEL
RIM ANGLE 41=90' L/C=9.97 RIM ANGLE I/> = 90°: L/C = 6.68 RIM ANGLE I/> = 90°, L/C = 3.74 RIM ANGLE q,. 90°, L IC = 1. 25 RIM ANGLE q,. 90°, Lie = 3.74
a. Test 1
C
~
MODEL CONFIGURATION I: RIM ANGLE q,. 90' Lie· 3.75 MODEL CONFIGURATION \I : RIM ANGLE I/> = 40< Lie = 3.75 MODEl CONFIGURATION III : RIM ANGLE q, = 65°, Lie = 3~75 MODEL CONFIGURATION IV: RIM ANGLE q,. 120°, L/C = 3.75
b. Test 2 Figure 1. Model Nomenclature for Single Models
Actual testing was accomplished by manually setting the collector tilt angle to some value between 0 and + 180 deg, then recording data while remotely changing the yaw angle during a tunnel run to a set of desired angles between -10 and 75 deg. Tunnel dynamic pressure was usually 3112 N I m2 (65 psf) but lower values were run to determine Reynolds number effects.
This same general procedure was also used to obtain pressure data with the individual pressures being measured by scanivalves. It should be noted that the concave side pressure ports were installed perpendicular to and flush with the inner surface. Tubes connecting to these ports were glued to the back surface. Convex surface pressure tubes were glued alongside each concave side tube such that the tube ended where the concave tube was bent to go through the collector. All tubes were collected near the pivot point and routed down the strut to scanivalves under the tunnel floor. This rather crude
8
method allowed pressures to be measured on both concave and convex surfaces at basically the same location so that a differential pressure distribution over the collector surface was obtained. With the trough at zero pitch and yaw angles, integrated pressure lateral force values agreed well with those measured by the balance.
Test II Only one trough (hereafter referred to as the
"metric" model) was instrumented to provide five component force and moment data. The other troughs (in the array configurations) were simply dummy models installed to tailor the flow over the array to simulate more accurately the effects on the metric model.
Nine collector trough configurations were tested. The first four were single-collector configurations, each with a different rim angle (Figure Ib). The remaining five configurations were 90-deg rim angle trough arrays of 1, 2, 3, 4, and 6 rows (Figure 2). The intent was to determine how deeply within an array a collector needed to be placed before the loads on it became independent of its position. In addition to these nine configurations, fences and berms of different heights were placed upstream of the array to determine their effectiveness in shielding the arrays from wind loading.
Wind at ",. 0°
d CONFIGURATION NUMBER
V VI
VII VIII
IX
ROWS AHEAD
o o I 2 4
All Individual troughs have same geometry as
~ Model Configuration I
ROWS BEHIND
o I I I I
Figure 2. Model Nomenclature for Collector Arrays (Configurations V-IX)
Configuration V was run for the primary purpose. of determining the influence of the gap width, G, between adjacent troughs (Figure 2). Configurations VI, VII, VIII, and IX all had the common feature of the inclusion of one row of dummy collectors behind the metric collector. The purpose was to assure that the
breakup of the wake of the metric collector was modeled properly. (A familiar example of this effect is found in automobile racing where it is well known that "slipstreaming" reduces the drag of the lead car as well as the following car.) It was felt that, for this purpose, one row was sufficient to satisfy the data accuracies obtainable in this test. Therefore, the data collected on configuration VI represented the loads to be expected on collector troughs in the windward row of an array. Configurations VII, VIII, and XI represented troughs imbedded one, two, or four rows deep in an array. It will be shown later in the report that the loads on configurations VIII and IX were not significantly different, so it was concluded that four rows deep could be considered "totally imbedded" in the array and no further drop-off in loads could be expected interior to that point.
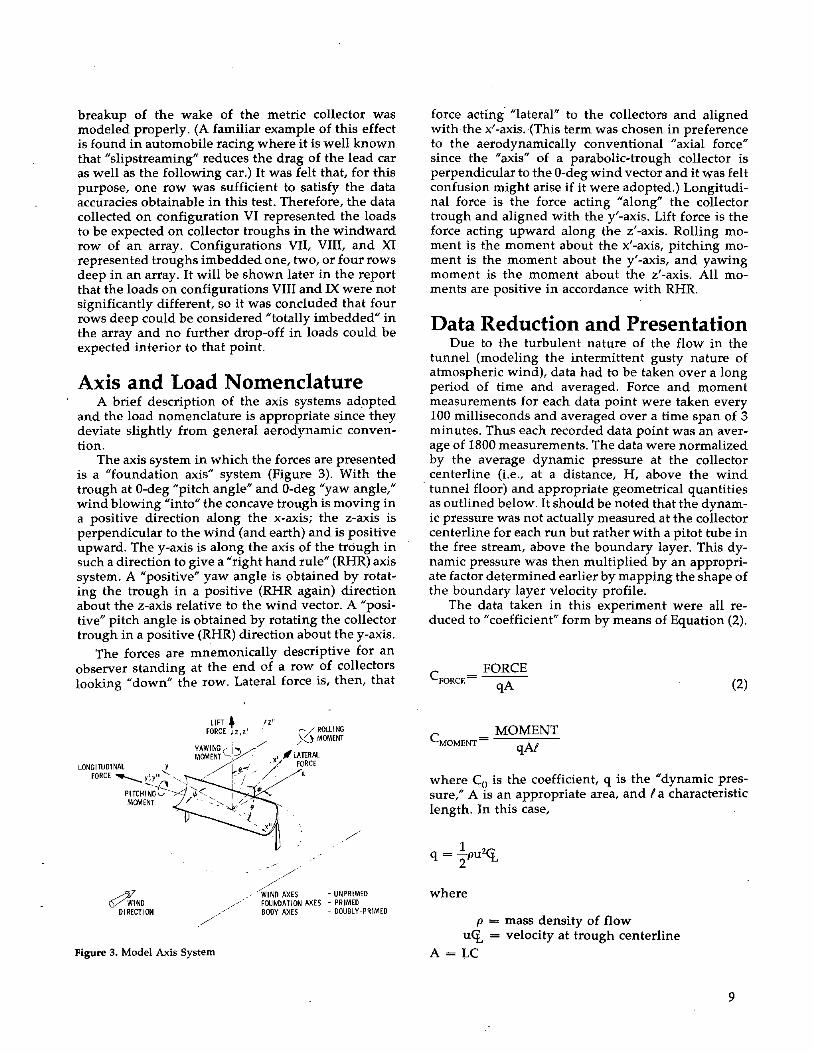
Axis and Load Nomenclature A brief description of the axis systems adopted
and the load nomenclature is appropriate since they deviate slightly from general aerodynamic convention.
The axis system in which the forces are presented is a "foundation axis" system (Figure 3). With the trough at O-deg "pitch angle" and O-deg "yaw angle," wind blowing "into" the concave trough is moving in a positive direction along the x-axis; the z-axis is perpendicular to the wind (and earth) and is positive upward. The y-axis is along the axis of the trough in such a direction to give a "right hand rule" (RHR) axis system. A "positive" yaw angle is obtained by rotating the trough in a positive (RHR again) direction about the z-axis relative to the wind vector. A "positive" pitch angle is obtained by rotating the collector trough in a positive (RHR) direction about the y-axis.
The forces are mnemonically descriptive for an observer standing at the end of a row of collectors looking "down" the row. Lateral force is, then, that
~ND DIRECTION
LIFT. ,Izl<
FORCE I' z'· r /. ROLLING , \~ MOMENT
YAWING,I..,//, / MOMENT '-'7 , , ~ LArrRAt
/k~1 /)" FORCE
L;' .'
//~
~AXES FOUNDATION AXES BODY AXES
- UNPRIMED - PRIMED - DOUBLY-PRIMED
Figure 3. Model Axis System
force acting' "lateral" to the collectors and aligned with the x'-axis. -(This term was chosen in preference to the aerodynamically conventional "axial force" since the "axis" of a parabolic-trough collector is perpendicular to the O-deg wind vector and it was felt confusion might arise if it were adopted.) Longitudinal force is the force acting "along" the collector trough and aligned with the y' -axis. Lift force is the force acting upward along the z' -axis. Rolling moment is the moment about the x'-axis, pitching moment is the moment about the y'-axis, and yawing moment is the moment about the z'-axis. All moments are positive in accordance with RHR.
Data Reduction and Presentation Due to the turbulent nature of the flow in the
tunnel (modeling the intermittent gusty nature of atmospheric wind), data had to be taken over a long period of time and averaged. Force and moment measurements for each data point were taken every 100 milliseconds and averaged over a time span of 3 minutes. Thus each recorded data point was an average of 1800 measurements. The data were normalized by the average dynamic pressure at the collector centerline (Le., at a distance, H, above the wind tunnel floor) and appropriate geometrical quantities as outlined below. It should be noted that the dynamic pressure was not actually measured at the collector centerline for each run but rather with a pitot tube in the free stream, above the boundary layer. This dynamic pressure was then multiplied by an appropriate factor determined earlier by mapping the shape of the boundary layer velOcity profile.
The data taken in this experiment were all reduced to "coefficient" form by means of Equation (2).
C = FORCE FORCE qA (2)
C = MOMENT MOMENT qAt
where Co is the coefficient, q is the "dynamic pressure," A is an appropriate area, and I a characteristic length. In this case,
1 q = -PU2<i
2
where
p = mass density of flow u<i = velocity at trough centerline
A = LC
9

where
L = collector length
C = collector aperture
and t = C - - -
The laws of dynamic similarity enable the ex-trapolation of these wind tunnel results to the fullscale situation whenever geometric similarity is present.'
Thus, to scale the results of this test to full scale, one simply inverts Equation (2):
FORCE = CFoRcEqA (3)
MOMENT = CMOMENTqAi
. where the q, A, and t are the full scale quantities.
Analysis of Test Results Little previous work has been uncovered which
would provide a data base or shed significant insight into the basic aerodynamic characteristics of parabolic-trough solar collector configurations. Therefore, a significant part of the test effort described herein has been devoted to evaluating the behavior of isolated single-collector modules, even though this is not a usual collector deployment mode. The initial test was characterized by running in a uniform, infinite airstream. Under these conditions flow symmetry prevails about the O-deg pitch orientation. Therefore during Test I data was taken only through the 0 to + 180-deg pitch range representative of the normal suntracking mode for collectors. Test II was run in a boundary layer flow with models attached to the tunnel floor to simulate ground-mounted collectors. The force and moment data accumulated during these tests is summarized herein. Analysis of the pressure distribution data taken during Test I is not included here but will be reported elsewhere. A complete tabulation of the data taken during Tests I and II is presented in References 2 and 3, respectively.
Single Collector Modules
Attitude Influence The force and moment characteristics for a typical
parabolic-trough collector module having a parabolic section rim angle of 90 deg and an aspect ratio of 3.8 are illustrated in Figure 4. Figure 4a presents the lateral force characteristics over the complete pitch angle range. The lateral force coefficient varies with pitch angle basically as the projected frontal area of the collector, showing peaks at 0 deg and ± 180 deg
10
and minimums at ± 90 deg. The peak at approximately O-deg results in the maximum lateral force as the concave surface presents a blunter, higher drag profile than does the convex surface. This peak at O-deg pitch defines the maximum lateral load and the overturning moment for collector support and foundation requirements. The concave shape results in a coefficient approximately 20% higher than the 1.20 value obtained by previous investigators' for flat plates with similar aspect ratios.
ASPECT RATIO Lie' 3.15 R 1M ANGlE.' ~o
PITCH ANGl£ - 0 DEGREES ,.) 1.0 r--.-,---,,--"".--,--,----,--.---.-... -,--,
u'" 1.0
is g
ASPECT RATIO UC • 3.75 RIM ANGLI •• ~o o TEST 1 o lE5y2
~ 0 f-----------~\----II----=""""~_1'
~ § ·1.0
PITCH ANGLE - (J DEGREES
(0)
~ ~-r-~--r-==r--=-=i'==-r_--~T'~,..._,-_,-_._-,..._,-,
., ,J .3
~ .2
~ .1
~ § ~ ".1
~ -.2 I
OJ -.3 0: -.,
ASPECT RATIO L'e· 3. 75 R 1M ANGlE. ;Ij(l' MOMENT CENTER' I NTERSECTION OF MO[)El REAR SlJRFACE AND AXIS OF PARABOLA 1 .... 1116" BEI-IINCl VERTEXI
D TEST I o TEST 2
-,S_IIlI -191 -120 -IX) -/(I -Xl 30 60 Ij(l 120 I" 180 PITCH ANGLE - 6 DEGREES
(0'
Figure 4. Coefficients vs Pitch Angle for Trough @ O-Deg Yaw
""Reynolds number equality is also requiredl but while Reynolds number was not duplicated l it was not considered important except when the collector was pitched such that the leading edge was close to alignment with the stream. It was feared that at this angle the separation could be strongly Reynolds number dependent causing lift and pitching moment coefficient errors. This did not prove to be a significant problem, as discussed below.

Figure 4b presents the lift force characteristics over the complete pitch angle range. With the collector inclined to the flow at an attitude somewhat analogous to a wing configuration at angle of attack, peak positive (upward) and negative (downward) lift coefficients exist. For the 90-deg rim angle collector, these two peaks occur at pitch angles of ± 60 deg. (The pitch angle at which these peaks occur, as well as the sharpness with which the peak is defined, varies with the parabolic section rim angle, but generally the pitch angle falls in the range of ± 45 deg to ± 70 deg.) It should be noted that several contemporary collector designs use a stow orientation for nighttime or inclement weather conditions which is very near the maximum lift attitude.
Figure 4c illustrates the pitching moment data over the pitch angle range. The data from Test I shows a rather broad flat maximum over the pitch angle range of 90 to 150 deg. In this region, the Test II .pitching moment data is in good agreement. However, outside this pitch angle range, the pitching moment data of Test II reflect a rather strong influence of the boundary layer velocity profile in combination with the ground effect.
Except where load characteristics may be particularly influenced by the nonsymmetrical boundary layer flow and/or ground effects, data from Tests I and II exhibit good agreement in both the lateral and lift force components and the pitching moment. The lateral force reflects this influence with nonsymmetrical characteristics about zero pitch. The peak lateral force coefficient is shifted from 0 deg to approximately + 15-deg pitch. The lift force also exhibits this influence with lift coefficients at both 0 arid ± IS0-deg pitch showing positive magnitudes. In addition, the peak lift load experiences a larger magnitude in the upward direction than in the downward direction. The pitching moment data from Tests I and II show good agreement over the positive pitch angle range of 75 to 135 deg. In this region the collector presents a smaller profile over which the boundary layer velocity gradient may act. Also, in this pitch range the spacing between the collector and the ground (tunnel floor) is greatest thus minimizing ground effects. Conversely, in the pitch angle range of 0 to + 60 deg, significant differences exist in the pitching moments from Tests I and II. Here the collector presents a greater frontal profile over which the boundary layer velocity gradient may act and the closer proximity of the ground to the lower collector rim may influence the moment through restriction of flow around this edge.
The influence of yaw attitude (wind direction) on the lateral and lift force characteristics for selected parabolic-trough configurations is illustrated in Figure 5. Data is presented for two different aspect ratio troughs run during Test I and for troughs of two different rim angles run during Test II. Figure 5a presents the lateral force coefficient versus yaw angle
at O-deg pitch, which is representative of the maximum lateral force attitude. Figure 5b presents similar data for a pitch angle of ISO deg. At both pitch attitudes the lateral force reflects similar behavior with respect to the yaw influence. Yaw angle has little effect on the lateral force coefficient within ± 30 deg of the O-deg yaw orientation. In general, for yaw angles from ± 30 deg to ± 60 deg the trend of the lateral force coefficient is to exhibit a steepening monotonic decrease. However, the 120-deg rim angle configuration contradicts this trend and shows a slight increase in lateral force beyond 30-deg yaw at the ISO-deg pitch orientation. Due to the onset of model vibrational problems, it was not possible to run the high aspect ratio configuration (L/C = 9.97) beyond 20-deg yaw at the zero pitch orientation.
Figure 5c illustrates the yaw angle effect on lift force coefficient at pitch angles corresponding to maximum and minimum (max negative) lift. The lift force coefficient behavior with yaw is basically similar to that of the lateral force coefficient.
2,0 ,-,--.... --,---,--,.--,--,---r--,
o TESfl LIe· 3.14, •• oo~ o TEST I Lie· 9. 97, ." 0;(10 • TEST 2 Lie· 3. 75, ... 'Xl" ... TEST 2 LIe· 3. 75, •• 120°
iO
PITCH ANGLE 8 ~ 0°
YAW ANGLE Ib (JEGREES
c·, "'
1.5,-.--..,----,--,.--.--..,---.--;.---,
o TEST I LlC·3.14,';-\(l° [] TESTllfC-9.97 ... f1J" • TEST 2 LIe' 3.75: ... 90° • TEST 2 Lie· 3. 15, .;. 120°
PITCH ANGLE e "' 1800
3D YAW ANGLE - '" DEGREES
(b'
., 70
2.0 I',.o:::::"=----=::::::;c:=:::::::::~-~-
~ ~ .,. y'" 1.0
o TEST} L1C'3.14, .'000
§ a TEST I UC·9.97, .'900 I u • TEST 2 Lie '3.75, f- 90° 8' BminCz
~ 0 r- ;i~~g ~~:~:~~: ::~o -------------1 -* TEST 2 Lie' 3,15, ... 12(A 8 • 9 ma~Cl
: :=: .::::? § -I. 0 : YAW ANGLE -" DEGREES
co,
Figure 5. Effect of Yaw Angle on Force Coefficients
11

Reynolds Number Effects A limited investigation of Reynolds number
(Rn = puC I JL where p is the free stream density, u is the free stream velocity, C is the aperture width, and JL is the free stream dynamic viscosity) influence on t~e test results was conducted during Test I by runmng one model configuration over a range of free stream velocities from 34.1 mls (112 ft/s) to 71.6 mls (235 ft/s). This investigation was limited to the 6.85 aspect ratio configuration at O-deg pitch attitude. Figure 6 presents the resulting lateral force coefficient data versus Reynolds number. Flow conditions for Test II resulted in a significantly lower Reynolds number which provides the opportunity to extend this range of comparisons. Reynolds numbers in this study ranged from approximately .065 million to one million, while a typical full-scale Reynolds number would be approximately 3.8 million. (This would be the Reynolds number for a collector with a 1.83 m [6
.ft] aperture in a wind that averaged 30.2 mls [67.5 mph] at collector centerline.) The lateral force coefficients from Tests I and II for the 3.8 aspect ratio, 90-deg rim angle configurations are also included in Figure 6. These data suggest that within the range of test conditions covered by Tests I and II no significant Reynolds number effects on peak lateral force are observed.
J20r-------------------.-----------------~
~ ;! 18 ~ .
'"
OIESTl ASP[CTRAJIOllC-6.SS o TEST I ASPECT RATIO lie -3.14 _TEST 2 ASPECT R~TlO lie "3. 86
E 1.6 0 ooooOOCW:
i1.4'-;--______________ -=-__ "-________________ -.J 104 105 ,0'
REYNOLD'S NUMBER
Figure 6. Reynolds Number Effect on Peak Lateral Force
Additional comparisons from Tests I and II have b~en made of t~e l~ft force coefficients at +60-deg pItch and the pltchmg moment coefficients at + 90-deg pitc~ for .the same configuration (3.8/90 deg). These onentatlOns were selected to minimize effects of the two different flow fields. These comparisons lend further credence to the observation of minimal Reynolds number effects on collector loads.
Mounting Height Influence Because of the boundary layer velocity profile,
together with possible ground effects, collector mounting height may significantly influence the wind loading. During the initial phase of Test II, an in~estigation ?f the effect of collector mounting heIght on loadmg was conducted so that a fixed value of the height parameter might be defined for subse~uent runs. The influence of mounting height is Illustrated in Figure 7. Figure 7a presents the variation of the peak lateral force coefficient (0 = 0 deg)
12
and the peak lift force coefficient (0 = -65 deg) versus the mounting height nondimensionalized by the collector aperture. The peak lateral force coefficient exhibits no significant effect of the mounting height over the range investigated. The peak lift force coefficient exhibits an increase of approximately 20% over the mounting height range from 0.75 to 1.25 aperture widths. For mounting heights beyond 1.25C no additional significant change occurs. It should be noted, however, that the vertical velocity gradient coupled with the proportionality between forces and the square of the velocity result in a monotonic increase in t~e lateral and lift forces with mounting height.
FIgure 7b presents the pitching moment coefficient versus nondimensionalized mounting height for the two attitudes representative of the maximum lateral and lift force coefficients. At the peak lift attitude the effect of mounting height on the pitchmg moment coefficient is insignificant. However, at the O-deg pitch orientation the pitching moment coefficient exhibits rather large variations with mounting height. In the mounting height range of 0.67C to 1.25C the pitching moment coefficient experiences a significant decrease in magnitude which tends to offset the increasing velocity and dynamic pressure, thereby lessening the variation in pitching moment.
For mounting heights greater than 1.25C the pit~hing moment ~oefficient increases in magnitude ,,:,hlch, coupled WIth the increasing velocity, magnifIes the mcrease in the magnitude of the pitching moment.
2.0 I~-,----,r;:;:::====::;::::::::; =----,...-0
~ 1.5 u
8 ~ 1.0
"
~o-~ __ ------~o--------o ASPECT RATIO Lie ~ 1 75 RIM ANGLE ~_ ~o a LIFT COEFFICIENT - C @6' -650
LATERALCOEFFICIENr- CyfP> 9'O~
0.50, 'c. 6"---'0;1-;. ';----;1"'. 0-----01.""------e1.74 ------e1.76 -----+1~' --~,"'. O;--~'. 2
MOUNTING HEIGHT ABOVE GROUND -we (aJ
g ~ ~ O~~~--------------------~----~ 8 -,I
~ -,2
§!! <:J -.3 z ~ -.4
ASPECT RATIO Lie: 3.7S· RIM ANGlE4" 90"
a IJ: .650
o 8: 00
~ -.S~l-~'~~~'~--~'~~~'~--~';__--~,~-~~~~ 0.6 0.8 1.0 1.2 1.4 1.6 1.8
MOUNTING HEIGHT ABOVE GROUNO -Hie
(b)
Figure 7. Mounting Height Effect on Force and Moment Coefficients (Yaw Angle'" = 0 Deg

The remainder of Test II was conducted with the model mounting height fixed to simulate, in the full scale situation, a 6-ft parabolic-trough collector mounted to provide a minimum I-ft clearance between the lower edge of the trough and the ground. These mounting heights were HIC = 0.68,0.70,0.75, and 0.85 for configurations I, II, III, and IV, respectively.
It is recognized that the design of the model (or full-scale) mounts could have a significant effect on foundation loads. Due to the diverse nature of possible designs, this factor is not addressed in this study. The model mounts used were 0.65 cm (.25 in) diameter cylindrical rods.
Aspect Ratio Influence Flow around the ends of the collector provides a
pressure relief which influences the loads exper-, ienced. The extent of this influence is significantly
dependent upon the collector length in relation to the aperture width or aspect ratio. The influence of collector aspect ratio was investigated during Test I. The variation of the force and moment coefficients for aspect ratios up to ten are illustrated in Figure 8.
Figure 8a presents the influence of aspect ratio on the lateral force coefficient at pitch attitudes of 0 deg and ± 180 deg and on the peak lift force coefficient. Included for comparison are drag coefficient data on two-dimensional concave and convex configurations.' The two-dimensional configurations are equivalent to an infinite aspect ratio shape. The increase in both force coefficients with aspect ratio reflects the decreasing significance of end losses with an increase in relative collector length. The lateral force coefficient data indicate that for the concave configuration (O-deg pitch), end-loss effects still significantly influence the load for aspect ratios of 10 and above. An aspect ratio significantly greater than 10 is required to achieve independence of end losses or two-dimensional flow. However, for the convex configuration (180-deg pitch) the data suggests that the two-dimensional flow condition is achieved for aspect ratios equal to or greater than 10.
The lift force coefficient presented in Figure 8a and the pitching moment coefficient illustrated in Figure 8b are both strong functions of the collector aspect ratio within the range of 1 to 10.
Collector Rim Angle Influence The influence of the parabolic section rim angle
on the lateral force coefficient at pitch angles of 0 deg and 180 deg and the peak lift force coefficient is illustrated in Figure 9. The collector rim angle represents a measure of the relative fineness or bluntness of the parabolic-trough section. This parameter may be related to the thickness ratio of the parabolic section which is defined as the ratio of the distance
tJ-,
>-i5 u ~ ~
'" 0 u
'" u
'" 0 ~
, >-z ~ u ~ ~
~ u >-z '" :;: 0 :;: to Z :I: U >-"-
2.3 ,'---,-------,---.-----,-----.- ). __ -I
I.2
LO
",8 0
...,
,25
,20
TROUGH R'IM ANGLE ~. 90' o LIFT COEFFICIENT - Cz@9-8maxcz
~~i~:~t ~~~~~:~:~~i: ~~::: ~~o )---1 Cx FOR 2D CONCAVE 112 CYLlNDR ICAl SHEll IREF. 4) 1---1 Cx FOR 2D CONVEX 112 CYLINDRICAL SHEll IREF. 41
~---i
ASPECT RATIO - LlC (a)
PITCH ANGLE9'9 max Cmy TROUGH RIM ANGLE ¢. 900
MOMENT CENTER' 0, 101 C BEH I ND VERTEX OF PARABOLA
ASPECT RATIO LlC (b)
12
Figure 8. Aspect Ratio Effect on Force and Moment Coefficients (Yaw Angle If; ~ 0 Deg)
from the vertex to the plane of the aperture divided by the aperture width. As the rim angle approaches zero, the thickness ratio also approaches zero, At pitch angles of both 0 deg and 180 deg the O-deg rim angle trough is the equivalent of a flat plate normal to the airstream. Thus a O-deg rim angle trough should
13
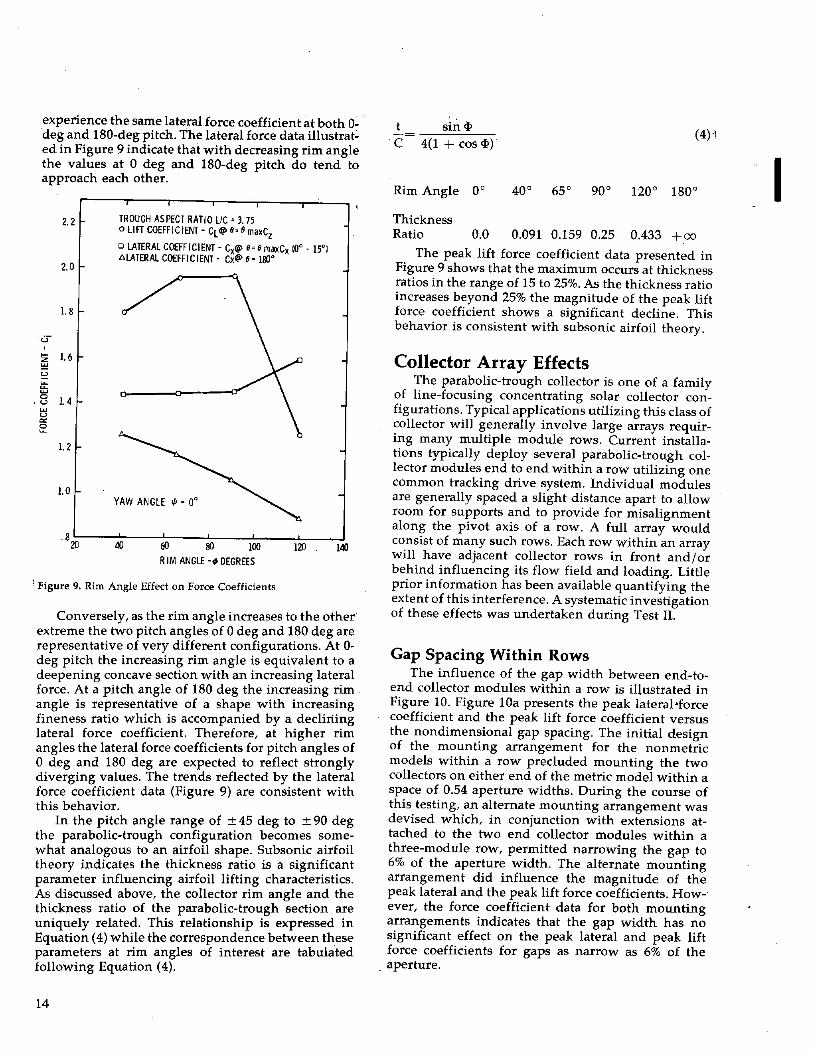
experience the same lateral force coefficient at both 0--deg and 180-deg pitch. The lateral force data illustrated in Figure 9 indicate that with decreasing rim angle the values at 0 deg and 180-deg pitch do tend to approach each other.
TROUGH ASPECT RATIO llC • 3. 75 o LIFT COEFFIC lENT - Cl@ 6.0 maxCz o LATERAL COEFFICIENT - Cx@ 6- 8 maxCx {Oc - WI "LATERAL COEFFICIENT - Cx@ 8· lSO°
YAW ANGLE'" • 0'
. 8 2O:;;-----:;4O;----6O'!:::--------:'SO:----1:':00:---'---:1'::2O--1..14O
R 1M ANGLE -4; DEGREES
I Figure 9. Rim Angle Effect on Force Coefficients
Conversely, as the rim angle increases to the other extreme the two pitch angles of 0 deg and 180 deg are representative of very different configurations. At 0-deg pitch the increasing rim angle is equivalent to a deepening concave section with an increasing lateral force. At a pitch angle of 180 deg the increasing rim _ angle is representative of a shape with increasing fineness ratio which is accompanied by a declining lateral force coefficient. Therefore, at higher rim angles the lateral force coefficients for pitch angles of o deg and 180 deg are expected to reflect strongly diverging values. The trends reflected by the lateral force coefficient data (Figure 9) are consistent with this behavior.
In the pitch angle range of ± 45 deg to ± 90 deg the parabolic-trough configuration becomes somewhat analogous to an airfoil shape. Subsonic airfoil theory indicates the thickness ratio is a significant parameter influencing airfoil lifting characteristics. As discussed above, the collector rim angle and the thickness ratio of the parabolic-trough section are uniquely related. This relationship is expressed in Equation (4) while the correspondence between these parameters at rim angles of interest are tabulated following Equation (4).
14
t sin <I>
C 4(1 + cos <1» (4)1
Thickness Ratio 0.0 0.091 0.159 0.25 0.433 +00
The peak lift force coefficient data presented in Figure 9 shows that the maximum occurs at thickness ratios in the range of 15 to 25%. As the thickness ratio increases beyond 25% the magnitude of the peak lift force coefficient shows a significant decline. This behavior is consistent with subsonic airfoil theory.
Collector Array Effects The parabolic-trough collector is one of a family
of line-focusing concentrating solar collector configurations. Typical applications utilizing this class of collector will generally involve large arrays requiring many multiple module rows. Current installations typically deploy several parabolic-trough collector modules end to end within a row utilizing one common tracking drive system. Individual modules are generally spaced a slight distance apart to allow room for supports and to provide for misalignment along the pivot axis of a row. A full array would consist of many such rows. Each row within an array will have adjacent collector rows in front and/or behind influencing its flow field and loading. Little prior information has been available quantifying the extent of this interference. A systematic investigation of these effects was undertaken during Test II.
Gap Spacing Within Rows The influence of the gap width between end-to
end collector modules within a row is illustrated in Figure 10. Figure lOa presents the peak lateral·force coefficient and the peak lift force coefficient versus the nondimensional gap spacing. The initial design of the mounting arrangement for the non metric models within a row precluded mounting the two collectors on either end of the metric model within a space of 0.54 aperture widths. During the course of this testing, an alternate mounting arrangement was devised which, in conjunction with extensions attached to the two end collector modules within a three-module row, permitted narrowing the gap to 6% of the aperture width. The alternate mounting arrangement did influence the magnitude of the peak lateral and the peak lift force coefficients. However, the force coefficient data for both mounting arrangements indicates that the gap width has no significant effect on the peak lateral and peak lift force coefficients for gaps as narrow as 6% of the
_ aperture.
I

Figure lOb presents similar data for the pitching moment coefficient. Although the pitching moment coefficient data occupy a significant band about a mean value, no significant trend with respect to gap width is observable.
'.5r--~--,.--~r--~--.-----'--~---,
ASPECT RATIO Lie • 3. 75 RIMANGLf~·rg
15 '.0 .0
~ :i 1.5 ~ ~ o LIFT COEFFICIENT -Cz@(jo-W
o LATERAL COEfFICIENT - ex. 9' 0° FILlID SYMBOLS REPRESENT AlTERNATE lfG MOUNTING COM'IGURATION
1.0 LO--O~.'--~1.0~---=::I.L.'==Z="0:"-"=:.:'2."-' ----:-'.':-0 --',:':. ,--7'.0 GA P SPACING BfTVI{EN COllECTORS WITH IN ROW - GIC
(0'
.'r--~--~-~--~-~--~----r--
-.. o 9' -65Q
o 9. 0° FILLED SYMBOLS REPRES£NT ALTERNATE LEG MOUNTING CONFI C;URATION
-,50~----'0;!-;.''-------,'1.0;;--'I.'" ------;,C;;.o---;-,." -~,.';;-o ----;,;';.,-------.! •. ,' GAP SPACING BETWEEN COLLECTORS WITHIN ROW - GIC
co,
Figure 10. Gap Spacing Effect on Force and Moment CoeHicients (Conf. V @ Yaw Angle '" ~ 0 Deg)
These data suggest that the presence of intermodule gaps within rows as small as 6% of the aperture provides aerodynamic independence for individual collector modules. Thus, no aspect ratio effects as a result of row length are incurred. All subsequent runs during Test II were conducted at a nondimensional gap width of 0.57.
Row Spacing Within Arrays The influence of spacing between rows within an
array was investigated for array configuratio~ IX. The variation of the peak lateral and the peak lift force coefficients was evaluated at row spacing of 2.0, 2.5, and 3.0 aperture widths (Figure 11). These d~ta indicate that both peak force coefficients tend to mcrease slightly with increased row spacing in this range. All subsequent array testing was conducted at a row spacing of 2.25 aperture widths.
Array Force and Moment Characteristics In addition to a single three-module row, a series
of multiple row configurations were run during Test II to evaluate the force and moment characteristics of collector modules imbedded within arrays. The various array configurations tested are defined in Figure
i1 ~
0.6 r---r--,..--.,---.,r----,----::;----, ASPECT RATiO Lie • J. 75 RIM ANGLE.' 90 0
§ 0.4 u
t:; o
o LIFT COEFFICIENT - Cz @" _600
o LATERAL COEFFICIENT - Cx@ ,.00
~ 0.2
'" i:2
OL-_-L_~L-_~_~~-~--~~~ 1.8 2.0 2.6 2.8 J.O 3.2
COLLECTQR ARRAY ROW SPACING - RIC
Figure 11. Row Spacing Effect on Force Coefficients (Conf. IX @ Yaw Angle '" ~ 0 Deg)
2. The coefficient data presented herein represents the loads measured on the center module of the appropriate three-module row.
The load characteristics for configurations V and VI are illustrated in Figure 12. Configuration V represents a single row of three end-to-end collector modules. Configuration VI represents the loading of the windward row of an array with one row mounted downstream to evaluate the influence of the wake distrubance resulting from the presence of the downstream row.
Figure 12a presents the lateral force coefficient versus pitch angle for these two configurations. Except for the concave and convex peak values, the data for configuration V agree well with the lateral force data for single-collector modules. The data for configuration V reflect a 12% and a 16% increase at the concave and the convex peaks, respectively. As with the single-module trough, the maximum lateral force coefficient for configurations V and VI occurs at a positive pitch angle in the range of 0 to 30 deg. The addition of a row of collectors behind the windward row (configuration VI) has a negligible effect except in the neighborhood of the concave and convex peaks where the lateral force coefficient is increased by 10% and 12%, respectively. This was surprising since a decrease was expected. No reason has yet been hypothesized for the increase.
Figure 12 presents the lift force coefficient and the pitching moment coefficient, respectively. These data are in good agreement with the single-module data throughout the pitch angle range. The data indicate that the presence of the downstream row has no significant effect on the lift force coefficient or the pitching moment coefficient of the windward row collector module.
For those configurations having one or more collector rows upstream of the metric module row, the load characteristics are illustrated in Figure 13. Configurations VII, VIII, and IX are representative of arrays having one, two, and four collector rows upstream in addition to the one collector row downstream of the metric model row. Figure 13a presents the lateral force coefficient data over the pitch angle range. The data indicates that even a single collector
15
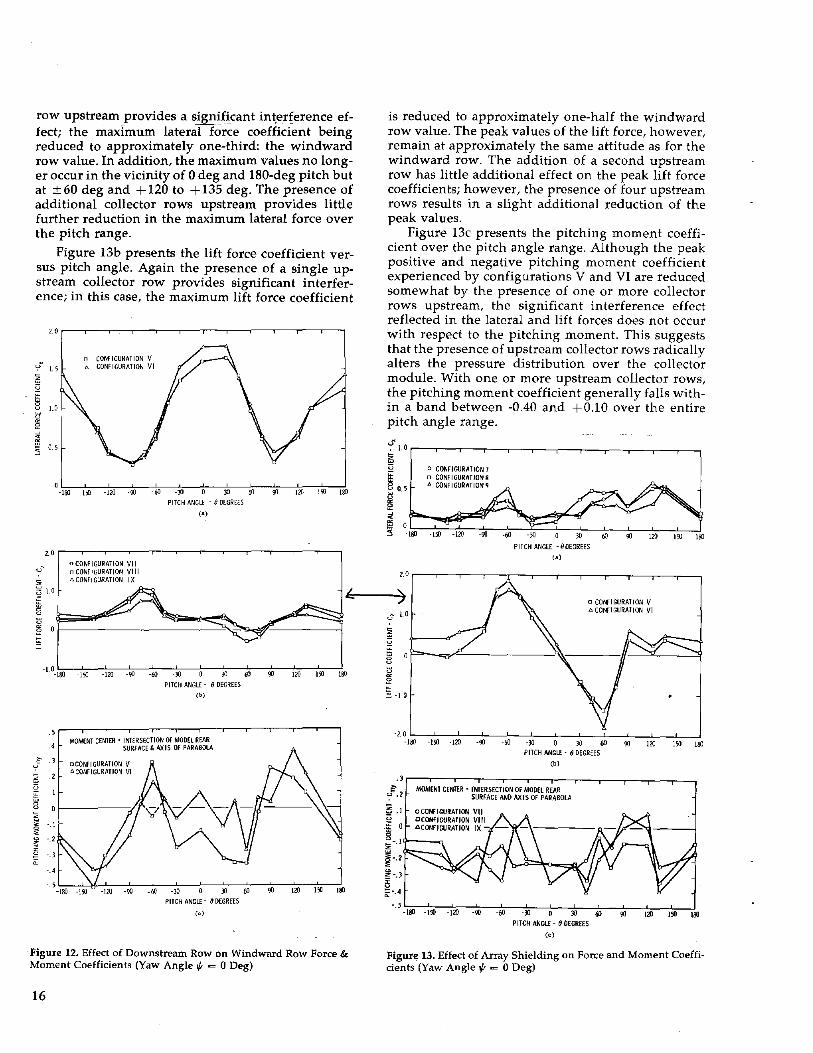
row upstream provides a signif~cant in~erference effect; the maximum lateral force coefficient being reduced to approximately one-third: the windward row value. In addition, the maximum values no longer occur in the vicinity of 0 deg and 180-deg pitch but at ± 60 deg and + 120 to + 135 deg. The presence of additional collector rows upstream provides little further reduction in the maximum lateral force over the pitch range.
Figure 13b presents the lift force coefficient versus pitch angle. Again the presence of a single upstream collector row provides significant interference; in this case, the maximum lift force coefficient
n CONFICURATION V u 1.5 f> CONFIGURATION VI
§ <;;
§ 1.0
g '" ~ 0.5
PITCH ANGLE - 80ECREES
Co)
2.0 ,~~~-~---'--~-"--~----.-__r---'--"T"--,
u"
z ~ l.[)
8 ~
oCONFIGURATION VII o CONFI(JURATION VIII ACONFIGlIRATlON IX
2 °r------------~~~~r------,
';I) 1'" PITCH ANGLE - 6 DEGREES
Cb)
.5~__r-~-,-_r--r_~--,_--,_____.--,__,r_,
.4
l·3 ~ u
8 z i -.1
~ -2
§ -.3 a:
'.'
MOMENT CENTER· INTERSECTION OF MODEL REAR SURFACE & AXIS Of PARABOLA
oCONFIGURATlON V 6CONFIGURATION VI
-. ~ _L,I"':--"'\!---'=----:';--.""60:--.="--:---:JO:---;';1/I--:.,0:--.....,'1O;;:---;';'''';--::,''' PITCH ANGLE - 9 DEGREES
Co)
Figure 12. Effect of Downstream Row on Windward Row Force & Moment Coefficients (Yaw Angle'" = 0 Deg)
16
is reduced to approximately one-half the windward row value. The peak values of the lift force, however, remain at approximately the same attitude as for the windward row. The addition of a second upstream row has little additional effect on the peak lift force coefficients; however, the presence of four upstream rows resul ts in a slight additional reduction of the peak values.
Figure 13c presents the pitching moment coefficient over the pitch angle range. Although the peak positive and negative pitching moment coefficient experienced by configurations V and VI are reduced somewhat by the presence of one or more collector rows upstream, the significant interference effect reflected in the lateral and lift forces does not occur with respect to the pitching moment. This suggests that the presence of upstream collector rows radically alters the pressure distribution over the collector module. With one or more upstream collector rows, the pitching moment coefficient generally falls within a band between -0.40 and +0.10 over the entire pitch angle range.
'f 1.0 ,-r---'r----'-__r---'--r--r---'---"--.--r-~ ~ ~ 0.5
i '" ~
o CONFIGURATION 7 o CONFIGURATIONS Il CONFIGURATION\!
JO PITCH ANGLE - BOECREES
Co)
120 "0 1'"
2.0 ,-r---,---.----r---,---r--,---.,.--r-----.----,---,
rS 1.0
~ u
o CONFIGURATION V 4. CONFIGURATION VI
~ o~--~yC~-------------~,---------H'--~~----~ ~ e :3 -1. (l
PITCH ANGLE - 6 DEGREES Cb)
MOMENT CENTER· fNTERSECTION OF MODEL REAR SURFACE AND AXIS OF PARABOLA
§ .1 u
it 0 !i ~-.l~-"" ~ .. 21"':::----' \
'" ~-.3 iJ ii:·. 4
PITCH ANGt! - e DEGREES
(0)
Figure 13. Effect of Array Shielding on Force and Moment Coeffi· cients (Yaw Angle'" = 0 Deg)

Fence and Berm Effects The significant interference effect on the lateral
and lift forces provided by even one upstream collector row indicates that most collector modules within an array experience the force reduction this interference provides. In the interest of incorporating uniformity among all modules, alternate methods of providing similar protection to the two perimeter rows of an array are desirable. During Test II a limited investigation of the influence of selected fence and berm configurations on the loads was conducted. A simulated fence consisting of perforated steel strip stock was mounted to the tunnel floor across the full span of the wind tunnel test section. This material has an average porosity of approximately 23%. No attempt was made to vary the porosity; however, fence displacement upstream of the first row of the array was varied.
The influence of fence height on the peak lateral . and peak lift force coefficients for a fence of varying
height placed three aperture widths upstream of the first row is illustrated in Figure 14a. These data indicate that a fence height somewhat less than the
1.0
.8
~ .6 u
i1l ~ .4
'" ~ .2
1.2
U
~ .... u u:: u.. .... 0 u ....
0.2 u
"" 0 u.. 0
-0.2 0.2
CONFIGURATION VI
ARRAYTO FENCE SPACING FSIC' 3 a LIFT COEFFICIENT - C @ 0' -61t o LATERAL COEFFICIENf- C,@O,OO
FENCE HE I GHT - FHIC
<al
0.4 0.6 0.8 1.0 BERM HEIGHT - BH Ie
(b)
1.2
Figure 14. Effect of Fences and Berms on Force Coefficients (Yaw Angle f ~ 0 Oeg)
full colleCtor height achieves the major part of the force reduction which is attainable from the fence. The effect of berm height on the peak lateral and peak lift force coefficients is illustrated in Figure 14b. These data indicate that the influence of berm height on the collector forces is similar to the influence of fence height.
The load data taken at selected pitch attitudes for three array configurations and two fence spacings are presented in Figure 15. The three figures present the fence effects on the lateral force coefficient, the lift force coefficient, and the pitching moment coefficient, respectively. These results indicate that the appropriate fence will provide aerodynamic interference effects on the lateral and lift forces at least equivalent to the presence of an upstream collector row. Based upon the limited data collected, the magnitude of the pitching moment load is not significantly different whether aerodynamic interference results from an upstream collector row or a fence . These data indicate that utilization of appropriate protective barriers enclosing an array extends equivalent interference effects to the perimeter rows permitting a uniform wind load design for all collector modules and foundations within the array.
0.;'" 1.0
~ u
~ 0
i:i i2 t;:
6 CONFIGURATION 6 [FENCE SPACE' 30 • CONFIGURATION 6 WITH TORQUE TUBE i. CONFIGURATION 6 (FENCE SPACE' SCI o CONFIGURATION 1lFENCE SPACE ~ 3el o CONFIGURATION 9lFENCE SPACE' 3el
FENCE I-I£IGHT - FHIC -1.07
-120 -00 -60 -JIl JIl 60 '" 110 150 PITCH ANGLE - , DEGREES
(.)
FENC£HEIGHT nflc -1.07
~ ~ '" A CONFIGURATION6 IFENCESPACE~3C)
£ ~g~~lg~:1~:g~ ~ ~~~:~~Tc~ ~U:ci 0 CONFI GURATION 1 (FENCE SPACE' 3C) 0 CONFI GURATION 9 (FENCE SPACE -3 C)
:::; -1.0 ISO 150 l20 ~ 60 3D 30 60 «l )20 150 180
" § § i'l u Z !l! 0
" ., ~ 0:
. s .. - .
PITCH ANGLE - tI [)E"GREES (h)
MOMENT CENTER' INTERSECTION OF MODEL 'REAR, I SURFACE &AXIS OF PARABOLA
.3 - FENCE HEI GHT - FHIC • 1.01 [!, CONFIGURATlON61FENCE SF'ACE· 3C! .6. CONFIGURATION 6 WITH TORQUE TUBE
.1
.1
0
-.1
-.1
-.3
-.' -.S
.6 CONF I GURATION 6 IF [NCE S F'ACE • 5Cl
" o CONfiGURATION 71FENCE SPACE' 3CI o CONFIGURATION91FENCE SPACE' 3CI
A . 8
0
0 L 0
~
-ISO -150 -120 -IJO -tIJ -)0 :J) 6l IJO 120 ISO ISO PITCH ANGLf - tlDEGREES
(,)
Figure 15. Force and Moment Coefficients for Multiple Row Arrays with Upstream Fence (Yaw Angle f = 0 Oeg)
17
Summary and Conclusions Two wind tunnel force and moment tests have
been conducted on parabolic-trough solar collector configurations. The two tests were conducted in different flow field environments, one a uniform flow infinite airstream, the second a simulated atmospheric boundary layer flow with the models simulating a ground-mounted installation. The force and moment characteristics of both isolated single module troughs and of trough modules within array configurations have been defined over both operational and stow attitudes. The data from the two tests are in generally good agreement except at particular attitudes where specific influences of the boundary layer velocity profile or ground effects assume particular'significance with respect to the load characteristics. The influence of various geometric design parameters for collector modules and arrays has been established.
The results of these two tests have led to the 'following conclusions:
18
• The forces and moments on parabolic-trough collector modules increase monotonically with mounting height above the ground.
• The peak forces and moments of individual collector modules increase with aspect ratio up to ratios of ten or greater.
• Intermodule gaps as narrow as 6% of the aperture between end-to-end collectors within a row are sufficient to permit collectors to function aerodynamically as individual modules
effectively nullifying any long row aspect ratio influence.
• Collector mod~les installed within large arrays,even those within the second row of an array, experience an interference effect which provides a significant reduction (50-65%) of the p~ak lateral and lift forces originating with the wind.
• The interference-induced load reduction does ~ot. ex~end to the collector pitching moment indIcating that a pressure distribution change accompanies the interference effect.
• Appropriate fence or berm configurations can provide reduction of lateral and lift forces in perimeter rows equivalent to the· interference effect within collector arrays.
• A fence or berm height of approximately threefourths the maximum collector height provides the major fraction of the force reduction achievable.
References 1. A. M. Kuethe and C. Y. Chow, Foundation of Aerodynamics, (New
York: john Wiley & Sons, 1976), p.15. 2. j. L. Lindsey, Force and Pressure Tests of Solar Collector Models in
the Vought Corporation Systems Division Low Speed Wind Tunnel, SAND76·7007 (Albuquerque, NM: Sandia Laboratories, 1976).
3. j. A. Peterka, j. M. Sinou, and j. E. Cermak, Mean Wind Forces on Parabolic Trough Solar Collectors, SAND80-7023 (Albuquerque, NM: Sandia Laboratories, 1979).
4. S. F. Hoerner, Fluid-Dynamic Drag (Midland Park, Nj: By the Author, 1965).
I

DISTRIBUTION: DOE/TIC-4500-R68, UC-62 (301)
Acurex Corporation (4) Aerospace Systems Division 485 Clyde Avenue Mountain View, CA 94042 Attn: A. Balakrishnan
H. Dehne J. Vindum S. Youngblood
The BDM Corporation 2600 Yale Boulevard SE Albuquerque, NM 87106 Attn: A. Fong
The Budd Company Port Washington, PA 19034 Attn: W. W. Dickhart
The Budd Company Plastic R&D Center 356 Executive Drive Troy, MI 48084 Attn: J. N. Epel
CH2M Hill 770 Clearwater Lane Boise, ID 83707 Attn: N. Little
Chilton Engineering 1570 Linda Way Sparks, NV 89512 Attn: S. Gordon
Columbia Gas Service System Corp. 1600 Dublin Road Columbus, OH 43215 Attn: J. P. Dechow
Del Manufacturing Co. (2) 905 Monterey Pass Road Monterey Park, CA 91754 Attn: M. Delgado
G. Herrera
Energetics Corporation 833 E. Arapaho Road Suite 202 Richardson, TX 75081 Attn: L. E. Wilson
Exxon Enterprises P.O. Box 592 Florham Park, NJ 07923 Attn: J. Hamilton
Ford Aerospace & Communications Corp. (2) Western Development Laboratories Div. 3439 Fabian Way Palo Alto, CA 94303 Attn: I. E. Lewis
H. J. Sund
Foster Wheeler Development Corp. (2) 12 Peach Tree Hill Road Livingston, NJ 07039 Attn: D. Allen
G. Gupta
General Atomic Company P. O. Box 81608 San Diego, CA 92138 Attn: J. R. Schuster
General Electric Company (2) P.O. Box 8661 Room 20B56 Philadelphia, PA 19101 Attn: M. Dilello
V. Dinenna
General Motors Corporation Technical Center Warren, MI 48090 Attn: J. F. Britt
General Motors Corporation (2) Harrison Radiator Division Lockport, NY 14094 Attn: L. Brock
A. Stocker
H. A. Williams and Associates 980 W. Henderson Columbus, OH 43220 Attn: M. Gelderloos
Hexcel Corporation 11711 Dublin Blvd. Dublin, CA 94566 Attn: G. Branch
Higgins, Auld & Associates, Inc. 2601 Wyoming Blvd. NE Suite H-l Albuquerque, NM 87112 Attn: H. E. Auld
19

DISTRIBUTION (cant):
Honeywell, Inc. Energy Resources Center 2600 Ridgeway Parkway Minneapolis, MN 55413 Attn: J. R. Williams
Hyperian, Inc. 7214 Valtec Court Boulder, CO 80301 Attn: J. Bogetich
Jacobs-Del Solar Systems, Inc. (2) 251 South Lake Avenue Pasadena, CA 91101 Attn: B. Eldridge
M. Mitchell
. Jet Propulsion Laboratory 1333 North Altadena Drive Bldg. 506, Rm. 340 Pasadena, CA 91103 Attn: H. Bank
Jet Propulsion Laboratory (3) 4800 Oak Grove Drive Pasadena, CA 91103 Attn: L. Jaffe, Stop 507-228
H. Steele, Stop 507-239 R. W. Weaver
Lockwood Greene P.O. Box 491 Spartanburg, SC 29301 Attn: B. Bercik
McDonnell Douglas Astronautics Co. 5301 Bolsa Avenue Huntington Beach, CA 92647 Attn: J. Rogan
Solar Energy Research Institute 1536 Cole Boulevard Golden, CO 80401 Attn: D. Kearney
Solar Kinetics, Inc. 8120 Chancellor Row Dallas, TX 75247 Attn: G. Hutchinson
Southwest Research Institute 6220 Culebra Road San Antonio, TX 78284 Attn: D. Deffenbaugh
20
Suntec Systems (2) 2101 Wooddale Drive St. Paul, MN 55119 Attn: G. Brucker
V. Reese
TRW, Inc. Energy Systems Group One Space Park Redondo Beach, CA 90278 Attn: J. Cherne
Team, Inc. 140 W. Broadway #41 Tuscon, AZ 85701 Attn: J. Maginnis
Union Carbide Corp . P. O. Box X Oak Ridge, TN 37830 Attn: C. G. Lawson
u.s. Department of Energy (3) Albuquerque Operations Office P. O. Box 5400 Albuquerque, NM 87185 Attn: G. N. Pappas
J. Weisiger C. Quinn
u.S. Department of Energy (4) Division of Solar Thermal Energy Systems Washington, DC 20545 Attn: G. W. Braun
M. U. Gutstein J. E. Rannels W. Auer
U. S. Department of Energy San Francisco Operations Office 1333 Broadway Oakland, CA 94612 Attn: W. D. Nettleton
Viking Solar Systems, Inc. 3467 Ocean View Blvd. Glendale, CA 91208 Attn: G. Goranson
400 C. Winter 1472 L. G. Rainhart 1500 W. A. Gardner 2320 K. Gillespie 2323 C. M. Gabriel

DISTRIBUTION (cont):
2323 S. B. Martin 2324 R. S. Pinkham 3151 C. J. Mora -3161 J. E. Mitchell 3700 J. c. Strassel 4700 J. H. Scott 4710 G. E. Brandvold 4719 D. G. Schueler 4719 H. N. Post 4720 V. L. Dugan 4721 J. V. Otts 4722 J. F. Banas 4722 R. L. Champion 4722 S. Thunborg 4723 W. P. Schimmel 4725 J. A. Leonard 4725 D. E. Randall (100)
.4725 K. Wally 5100 F. L. Vook
5500 O. E. Jones Attn: D. B. Hayes
5520 T. B. Lane 5523 R. C. Reuter, Jr. 5600 D. B. Shuster 5630 R. C. Maydew 5631 H. R. Vaughn 5632 C. W. Peterson 5633 S. McAlees, Jr. 5634 D. D. McBride (50) 5634 R. E. Tate 5635 W. R. Barton 5636 J. K. Cole 5800 R. S. Claassen 8450 R. C. Wayne 8266 E. A. Aas 3141 T. L. Werner (5) 3151 W. L. Garner (3)
For: DOE/TIC (Unlimited Release)
21