steady-state local diffusive fluxes in porous geo ...steady-state local diffusive fluxes in porous...
TRANSCRIPT

Transp Porous Med (2012) 93:657–673DOI 10.1007/s11242-012-9976-1
Steady-State Local Diffusive Fluxes in PorousGeo-Materials Obtained by Pore-Scale Simulations
Yoshito Nakashima · Tsukasa Nakano
Received: 5 September 2011 / Accepted: 27 February 2012 / Published online: 21 March 2012© The Author(s) 2012. This article is published with open access at Springerlink.com
Abstract Computer simulations of non-sorbing tracers diffusing in fluid-saturated poroussediment/rock were performed using pore-scale X-ray microtomographic images to revealthe following. (i) The histogram of the magnitude of the local diffusive flux vector obeys aunimodal log-normal distribution having a long positive tail. Simulations using model imageswere also performed to show that the flux broadening in large pores and the flux mixing at thepore network junctions are responsible for the log-normal shape. (ii) The simulation enabledus to directly visualize pore voxels with large and small fluxes, confirming the existence oftransport pores and stagnant pores. Because of the unimodal nature, however, it was diffi-cult to distinguish transport pores from stagnant pores using an objective threshold in thehistogram. (iii) Another histogram of the flux vector component along the direction of themacroscopic concentration gradient was analyzed. A negative tail was found in the histo-gram, indicating that local counter diffusion exists in the porous geo-materials. However, thepopulation and intensity of the counter diffusion fluxes are too small and weak to contributeto the overall diffusive transport across the porous media system. A long positive tail repre-senting a large-flux diffusive pathway was also observed in the histogram. However, again,the population of the large-flux transport pores is small. As a result, the main conveyer of thetracer is the stagnant pores (not the transport pores), which have small positive flux valuesbut a large population.
Keywords Archie’s law · Electric conductivity · Diffusion coefficient · Formation factor ·Resistivity · X-ray CT
Electronic supplementary material The online version of this article (doi:10.1007/s11242-012-9976-1)contains supplementary material, which is available to authorized users.
Y. Nakashima (B) · T. NakanoNational Institute of Advanced Industrial Science and Technology (AIST),Central 7, Higashi 1-1-1, Tsukuba, Ibaraki 305-8567, Japane-mail: [email protected]
123

658 Y. Nakashima, T. Nakano
1 Introduction
The diffusion is an important mode of tracer transport in porous media systems with smallPéclet numbers in earth science (e.g., Nakashima 1995; Grathwohl 1998; Takeda et al. 2011).The tracer diffuses in the pore network having large pores (pools) and narrow throats (e.g.,Roberts and Schwartz 1985; Lindquist et al. 2000) as illustrated in Fig. 1. Thus, pore-scaleanalysis is one of the useful approaches to understanding the diffusive transport in porousmedia. Computer simulations are useful in investigating the pore-scale diffusion process ingeo-materials (e.g., Nakano 1995; Nakashima et al. 2004; Promentilla et al. 2009; Han et al.2009; Sugiyama et al. 2010). Thus, we performed extensive simulations to understand steady-state non-sorbing tracer diffusion in fluid-saturated porous geo-materials. Three-dimensional(3D) pore-scale images of sandy sediments and sandstone having various porosities anddegrees of the pore anisotropy were prepared by X-ray microtomography followed by imageprocessing. We numerically solved the Laplace equations within these pore-scale domainswith respect to the tracer concentration and calculated the local steady-state diffusive fluxvector in the pore space.
In the present study, we focused on the following problems concerning the pore-scalestatistics of the local diffusion flux vector in the complex porous geo-materials. (i) The localcounter flow was already found for the Darcy flow (not diffusion) in porous media (Kutsovskyet al. 1996; Maier et al. 1998; Ogawa et al. 2001; Li et al. 2010). The local flux obeys thelog-normal distribution for the random resistor network (de Arcangelis et al. 1985) and for theDarcy flow (Cenedese and Viotti 1996; Lebon et al. 1996). We examined whether the counterdiffusive flux and log-normal distribution were realized with respect to the tracer diffusionin porous media without Darcy flow. (ii) According to the conventionally accepted concept(e.g., Pérez-Rosales 1982; Lever et al. 1985; Skagius and Neretnieks 1986; Nakashima 1995;Tiab and Donaldson 2004), percolated pore space can be divided into two regions (transportpores with large flux and stagnant pores with small flux) as expressed in Eq. (A1). However,to the best of our knowledge, the validity of this concept has not been directly confirmedthrough pore-scale simulations. We calculated the spatial distribution and statistical histo-gram of the magnitude of the local flux vector, and attempted to find the fraction of transportpores and stagnant pores for a few different threshold numbers. (iii) The conventionallyaccepted concept described above implies that the degree of the contribution to the overalltracer diffusive transport across the porous media system is small for stagnant pores and largefor transport pores (e.g., Skagius and Neretnieks 1986; Tiab and Donaldson 2004). In orderto examine this implication, we analyzed a different histogram (flux-weighed histogram) ofthe longitudinal flux component.
Fig. 1 Two-dimensionalschematic diagram of thediffusion through the porenetwork. Some pools areconnected by narrow throats. Thelocal diffusion directions in thethroats are indicated by blackarrows. The direction of themacroscopic concentrationgradient is shown by an orangearrow
123

Steady-State Local Diffusive Fluxes in Porous Geo-Materials 659
2 Description of Diffusion Simulations
The method to simulate the tracer diffusion in the 3D digital images of porous geo-materialsand to analyze the obtained data on the local diffusive fluxes is outlined. The detail of theequations used is described in Appendix, and the symbol list and some remarks on the simula-tion programs are noted in ESM_1.pdf. First, the 3D pore-scale Laplace equation, Eq. (A2),was solved numerically by assuming the steady-state diffusion of non-sorbing species influid-saturated porous geo-materials (Zhang and Knackstedt 1995; Knackstedt et al. 2007;Øren et al. 2007; Zhan et al. 2010). The boundary conditions are such that a constant con-centration difference was applied to the two opposite faces (normal to the z-plane), whereasno-flow boundary conditions are assumed on the other four faces. As a result, we obtainedthe 3D distribution of the tracer concentration for each pore voxel.
Second, we performed the following data analysis using the obtained concentration data,C . Based on Fick’s first law, the local diffusive flux vector was calculated voxel by voxel bytaking the spatial difference of C :
(J x, J y, J z)T = −DbulkgradC (1)
where Jx, Jy, and Jz are the x-, y-, and z-components of the local flux vector of the porevoxels, respectively, and T refers to the transposing operation. In the program of the pres-ent study, the operation of taking the spatial derivative in Eq. (1) was replaced with takingthe finite difference of the concentration between adjacent voxels. Note that the diffusioncoefficient in Eq. (1) is not Deff , but rather Dbulk. We assumed that the direction of themacroscopic concentration gradient imposed on the 3D image system was the z-direction.Thus, Jz summed over the entire x–y plane at a fixed z position is proportional to Deff ofthe fluid-saturated porous media. The quantity Dbulk is a given or known parameter of thesystem. The formation factor can then be calculated by substituting the Deff and Dbulk valuesinto Eq. (A3). As a result, we obtain the distribution of the flux vector (J x, J y, J z) and itsmagnitude, J = (J x2 + J y2 + J z2)1/2 as 3D images, and the formation factor as a scalar.The obtained histogram of J was fitted to a log-normal distribution:
N = k1√2πk2 J
exp
(− (ln J − k3)
2
2k22
)for J > 0 (2)
where N is the number of pore voxels, and k1, k2, and k3 are parameters.The Jz histogram (i.e., plot of N as a function of Jz) is useful in detecting the local counter
flow having a negative Jz value. However, the Jz histogram is not appropriate to quantita-tively evaluate the degree of the contribution of pore voxels having various Jz values. Forexample, the degree of the contribution to the overall diffusive transport across the imagesystem of a single voxel of J z = 100 (arbitrary unit, au) is equivalent to that of fifty voxelsof J z = 2, and to four voxels of J z = 25 (i.e., 1 × 100 = 50 × 2 = 4 × 25). In order toavoid this undesirable underestimation of large-flux voxels, a flux-weighed histogram (i.e.,plot of N × J z as a function of Jz) was calculated.
Although solving Eq. (A2) to obtain steady-state local diffusive flux data is the mainsimulation in the present study, a different diffusion simulation was also performed as a sup-plement. This simulation is a random walk of non-sorbing tracers in the percolated pore clusterto calculate the normalized apparent diffusivity of Eq. (A4). The details of the random walksimulation are described elsewhere (Nakashima and Kamiya 2007; Nakashima et al. 2008).
The methods of the diffusion simulation and of data analysis described above was appliedto 5123-voxel microtomographic images of four real geo-materials: Kinugawa sand (Fig. 2a),
123

660 Y. Nakashima, T. Nakano
Fig. 2 Kinugawa sandy sediment images with various porosities without affine transformation. The dimen-sions of each image are 5123 voxels=4.43 mm3. Solid areas are indicated in purple. The computed localconcentration, C , is superimposed on the percolated pore space. The macroscopic concentration gradient wasapplied along the z-axis. a Original image, porosity 41 vol%. b Slightly pore-eroded image, porosity 18 vol%.c Significantly pore-eroded image, porosity 8 vol%
Kagoshima sand (Fig. ESM_1_1), monosized bead (Fig. ESM_4_1), and Berea sandstone(Fig. 3a). The details of the image processings of the four geo-materials are described inESM_1.pdf. Based on Fig. 1, two types of 3D model images were also investigated to helpone interpret the simulation results for the real microtomographic images. One model (Fig. 4)consists of a straight narrow cylindrical pipe (throat) and a large spherical pore (pool). Thisthroat–pool structure is a characteristic pore structure of sandstones and sandy sediments(e.g., Roberts and Schwartz 1985). The other model is a random network of equiradii porepipes without pools (Fig. 5). Numerous cylindrical straight pipes having a tortuosity of unityare connected randomly to mimic the pore channel network having a specific coordinationnumber at the network junctions in natural sedimentary rocks (Lindquist et al. 2000). Affinetransformation and pore-erosion operation were applied to the two models. The Laplaceequation for the pore space of Figs. 4 and 5 was solved to analyze the statistics of the localflux vector for comparison with the results for real sediment/sandstone images.
3 Results
All the obtained values of the formation factor, diffusion coefficient, and porosity are cross-plotted to confirm the reliability of the 3D images used (see ESM_2.pdf for detail). The Jdistribution for a model image of Fig. 4 is shown as 3D images (Fig. 4) and histograms(Fig. 6). In Fig. 6, a peak appears at J = 205 (au), but this is an artifact due to the truncation.All four distributions were confirmed to be unimodal by the full-scale plot of the J -axis.Thus, this artifact-derived undesirable peak is omitted for other histograms in the presentstudy. Figure 4 shows important features of the diffusive flow in porous media. The flowinjected from the inlet (throat) into the spherical or spheroidal pool diffuses in the broadspace, and the magnitude of the local flux vector decreases in the pool. The comparison withthe original structure (Fig. 4a) and the affine-transformed or pore-eroded structure (Fig. 4b–d) demonstrates that (i) the small-flux region appears due to the image compression in thez-direction and due to the pore erosion, and (ii) the large-J region becomes more dominantby the image elongation along the z-direction. The features also appear in the J -histogram
123

Steady-State Local Diffusive Fluxes in Porous Geo-Materials 661
Fig. 3 Same as Fig. 2, but for Berea sandstone having various degrees of the affine transformation. Thewireframe rendering of the normalized direction-dependent apparent diffusivity is also shown. The red, green,and blue lines indicate the major, intermediate, and minor axes of the diffusion tensor, respectively. a Originalimage (φ = 20 vol%). The image dimensions are 5123 voxels=0.643 mm3. b Uniaxially elongated along thez-axis by a factor of two (φ = 19 vol%). c Uniaxially compressed along the z-axis by a factor of one half(φ = 20 vol%). A mirrored image of the half-compressed image was merged at z = 256 to obtain a cubicsystem of 5123 voxels
(Fig. 6). The peak positions of the histograms for Fig. 4b–d shift leftward, leftward, andrightward, respectively. The log-normal distribution, Eq. (2), was reasonably fitted to thefour histograms for 0 < J < 205.
Results for another model image are shown in Figs. 5 and 7. The magnitude of the fluxvector differs from pipe to pipe due to the difference of the 3D pipe position in the porenetwork (Fig. 5). The mixing of the diffusive fluxes having different J values occurs ateach pipe junction. As a result, the broad distribution having a long tail (i.e., log-normaldistribution) similar to that in Fig. 6 appears in Fig. 7. The effects of the pore cementation(Fig. 5b) and image compression/elongation (Fig. 5c, d) on the peak shift of the log-normaldistribution of Fig. 7 are the same as those of Fig. 6. These log-normal behaviors observedfor the model images of Figs. 4 and 5 also appeared in the microtomographic images of thereal geo-materials, which are shown later in Figs. 9a and 11a.
Some simulation results related to the 3D distribution of the local tracer concentration areshown in Figs. 2 and 3. The local concentration gradually varies along the direction of themacroscopically applied concentration gradient, i.e., the z-axis. Examples of the normalizeddirection-dependent apparent diffusivity are shown in Fig. 3. The shape of the shell-likerepresentation of the apparent diffusivity is sensitive to the pore anisotropy induced by theuniaxial elongation/compression along the z-axis. The maximum-to-minimum ratio of theeigen-values of the diffusion tensor exceeds a critical value of 3/2 (Nakashima and Kamiya
123

662 Y. Nakashima, T. Nakano
Fig. 4 Model having a throat–pool structure. Solid areas are indicated in purple. The magnitude of the com-puted local diffusive flux vector, J , is superimposed on the pore space. The macroscopic concentration gradientwas applied along the z-axis. a The diameters of the cylindrical throat and spherical pool are 21 and 181 voxels,respectively. b Longitudinally compressed by a factor of one half to obtain an oblate pool. The throat diameterremains as 21 voxels. c Pore erosion or solid dilation was performed to obtain a throat diameter of 7 voxels.d Longitudinally elongated by a factor of two to obtain a prolate pool. The throat diameter remains as 21 voxels
2010) for the elongated and compressed images. Thus, the shape of the normalized direction-dependent apparent diffusivity is no longer convex, but a constriction appears in Fig. 3b, c.
Typical examples of 3D images of the local diffusive fluxes for real geo-materials areshown in Fig. 8 for the Kinugawa sand images of Fig. 2a, c. Two-dimensional examples forthe Kagoshima sand are also shown in Fig. ESM_3_1 to show the effects of the porosityreduction on the local diffusive flux more clearly. Figure 8 indicates that the spatial dis-tribution of the flux is very complicated and that both stagnant (Fig. 8c, g) and percolatedlarge-flux (Fig. 8b, f) zones exist. The growth of the green stagnant zones having small-Jvalues with decreasing porosity is shown by the 2D images (Fig. ESM_3_1a–d). Note alsothat the local counter flux occurs and grows with decreasing porosity (blue voxels in Fig. 8d,h and ESM_3_1e-h). As for the Kinugawa sand images of Fig. 2a, c (i.e., Fig. 8a, e), thedecrease in porosity from 41 to 8 vol% yields the increase in the formation factor valuefrom 4 to 211 (Fig. ESM_2_1a) according to Archie’s law. This increase in the macroscopicquantity of the formation factor is a consequence of the significant microscopic change inthe local fluxes as shown in Fig. 8.
123

Steady-State Local Diffusive Fluxes in Porous Geo-Materials 663
Fig. 5 Random network model of equiradii cylindrical pore pipes. The image dimensions are 5003 voxels.Solid voxels are made transparent. The calculated J value is superimposed on the pore space. a The diameterof the cylindrical pipe is 17 voxels, the characteristic coordination number of pipes at each junction is 6,φ = 20 vol%, and F = 12. b The pipe diameter is 13 voxels, the characteristic coordination number is 3,φ = 7 vol%, and F = 81. The image b is a model of cementation of (a) obtained by reducing the coordinationnumber and pipe diameter. c Obtained by the uniaxial compression of (a) along the z-axis by a factor of onehalf. F = 22. d Obtained by the uniaxial elongation of (a) along the z-axis by a factor of two. F = 8
The effects of the porosity on the statistics of the local diffusive fluxes are shown in Fig. 9for the Kinugawa sandy sediments. Figure 9a indicates that the log-normal distribution fitsthe simulation data of J well. Three parameters, k1, k2, and k3 in Eq. (2) were determined bythe least squares method in the log-normal fitting processing. The mode or distribution peakin Fig. 9a is systematically located at the left-side of the vertical dotted line, indicating thatthe diffusive flow in real geo-materials is significantly reduced compared to that in straightpores due to the tortuous pore structure having throats, pools, and various pore connectivi-ties. The log-normal distribution is characterized by the dominant component of the stagnantregions having small J values (e.g., Fig. 8c, g) and a long tail corresponding to the largeJ components (e.g., Fig. 8b, f). However, it is difficult to objectively find a unique thresh-old of the J value for discrimination between the stagnant and transport porosities becausethe obtained distribution of Fig. 9a is unimodal. For example, the threshold values for the
123

664 Y. Nakashima, T. Nakano
Fig. 6 Histogram of themagnitude of the local diffusiveflux vector, J , for each image,(a)–(d), in Fig. 4. The totalnumber of pore voxels is adjustedto be the same between (a), (b),and (d). The data were fitted tothe log-normal distribution,Eq. (2), by the least squaresmethod
Fig. 7 Same as Fig. 6 but for the random pipe network of Fig. 5. The vertical dotted line indicates the J valuefor the straight pipes completely parallel to the z-axis
percolation from the inlet of z = 0 to the outlet of z = 511 are J = 164 and 27 for Fig. 8b,f, respectively. Thus, it is possible to put a threshold for discrimination between the stagnantand transport pores to be J = 164 and 27 in Fig. 8b, f, respectively, if one wishes to obtainthe critical percolation state of the transport pores. However, there is no reasonable physicalbasis for choosing the percolation threshold of the large-flux pore voxels as the threshold fordiscrimination between the stagnant and transport porosities. Thus, in order to clearly show
123

Steady-State Local Diffusive Fluxes in Porous Geo-Materials 665
Fig. 8 Calculated local diffusive fluxes for Kinugawa sand images of Fig. 2a (a–d) and of Fig. 2c (e–h). Themagnitude, J (a–c and e–g) and z-component, Jz (d,h) of the local diffusive flux vector are shown. Solidareas in (a) and (e) are indicated in purple. Only pore voxels having large J values >160 and 20 are visualizedin (b) and (f), respectively, and voxels having small J values equal to or <160 and 20 are visualized in (c) and(g), respectively. The thresholds of 160 and 20 were chosen tentatively. Only pore voxels having negative Jzvalues are shown in blue in (d) and (h). The graphic display condition for the view direction and image cutoutis common to (a)–(h)
the simulation results in Figs. 8, 10, ESM_3_1, and ESM_6_1, different threshold valueswere tentatively used in the present study.
In Fig. 9a, the peaks shift leftward with decreasing porosity, indicating that the porosityreduction causes the stagnant regions to grow. This systematic growth of the stagnant regionshaving small Jz values caused by the porosity reduction also appears in Fig. 9b. The increasein pore tortuosity due to the pore reduction (Fig. ESM_2_1b) is probably responsible for thesystematic growth. Figure 9b indicates a small amount of local counter flux having negativeJz values, which is clearly confirmed by Fig. 9c. The population of the negative Jz increasesalmost systematically with decreasing porosity due to the increase in tortuosity.
The histogram of N × J z allows us to quantitatively evaluate the degree of the contributionof pore voxels having various Jz values. Figure 9d clearly shows that the contribution of thelocal counter flow having a negative Jz value is negligible. The Jz values of the histogrampeaks indicated by the arrows in Fig. 9d are smaller than the value for the straight cylindricalpore having a tortuosity of unity, suggesting that the peaks correspond to the stagnant regions.Figure 9d clearly shows that the stagnant regions are responsible for the main transport of thetracer across the system. The long positive tail corresponding to the transport pores havinglarge Jz values expands significantly beyond the vertical dotted line (Fig. 9e). However, thepopulation is small compared with that for each peak in the histogram. Thus, the long positivetail does not dominantly contribute to the tracer transport across the 5123-voxel system.
While Figs. 8, 9, and ESM_3_1 are used to examine the effects of the porosity reductionon the local diffusive flux, Figs. 10, 11, and ESM_6_1 are used to investigate the effects ofthe pore anisotropy. Figure 10 is the same as Fig. 8, except for the elongated (Fig. 10a–d)
123

666 Y. Nakashima, T. Nakano
Fig. 9 Effects of the porosity on the histogram of the local diffusive flux vector for the Kinugawa sand imageswithout affine transformation. The results for the images in Figs. 2 and 8 are also shown. The porosity valuesare indicated in vol%. The legend is common to (b)–(e). The dotted line indicates the value for the straightpores that are completely parallel to the z-axis. A wider range was needed for the scaling of Jz having positiveand negative values compared with that of J having only positive values. As a result, the position of the dottedline is slightly different (i.e., 160 for (a) and 134 for (b, d, e)). a Magnitude of the flux vector. The log-normaldistribution, Eq. (2), was fitted. The full-scale plot of (a) is shown in ESM_5.pdf. b z-component of the fluxvector. c Magnification of the negative tail of (b). d Same as (b), but the vertical axis was modified to be theproduct of N and Jz. The peak position of each distribution is indicated by a downward arrow. e Full-scaleplot of the long positive tail of (d). Downward arrows in (d) are omitted. The bin size or column width of thehistogram is different between (d) and (e), resulting in the difference in scale of the vertical axis
123
Steady-State Local Diffusive Fluxes in Porous Geo-Materials 667
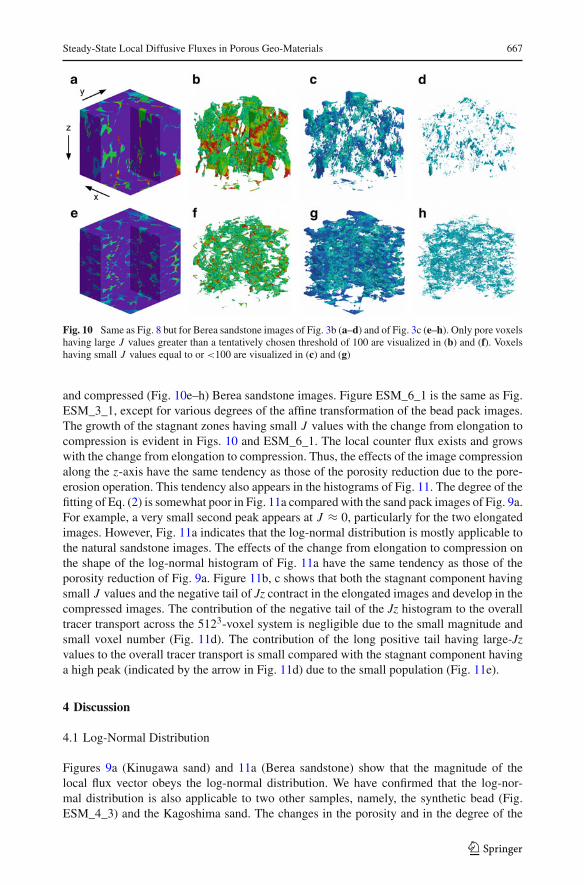
Fig. 10 Same as Fig. 8 but for Berea sandstone images of Fig. 3b (a–d) and of Fig. 3c (e–h). Only pore voxelshaving large J values greater than a tentatively chosen threshold of 100 are visualized in (b) and (f). Voxelshaving small J values equal to or <100 are visualized in (c) and (g)
and compressed (Fig. 10e–h) Berea sandstone images. Figure ESM_6_1 is the same as Fig.ESM_3_1, except for various degrees of the affine transformation of the bead pack images.The growth of the stagnant zones having small J values with the change from elongation tocompression is evident in Figs. 10 and ESM_6_1. The local counter flux exists and growswith the change from elongation to compression. Thus, the effects of the image compressionalong the z-axis have the same tendency as those of the porosity reduction due to the pore-erosion operation. This tendency also appears in the histograms of Fig. 11. The degree of thefitting of Eq. (2) is somewhat poor in Fig. 11a compared with the sand pack images of Fig. 9a.For example, a very small second peak appears at J ≈ 0, particularly for the two elongatedimages. However, Fig. 11a indicates that the log-normal distribution is mostly applicable tothe natural sandstone images. The effects of the change from elongation to compression onthe shape of the log-normal histogram of Fig. 11a have the same tendency as those of theporosity reduction of Fig. 9a. Figure 11b, c shows that both the stagnant component havingsmall J values and the negative tail of Jz contract in the elongated images and develop in thecompressed images. The contribution of the negative tail of the Jz histogram to the overalltracer transport across the 5123-voxel system is negligible due to the small magnitude andsmall voxel number (Fig. 11d). The contribution of the long positive tail having large-Jzvalues to the overall tracer transport is small compared with the stagnant component havinga high peak (indicated by the arrow in Fig. 11d) due to the small population (Fig. 11e).
4 Discussion
4.1 Log-Normal Distribution
Figures 9a (Kinugawa sand) and 11a (Berea sandstone) show that the magnitude of thelocal flux vector obeys the log-normal distribution. We have confirmed that the log-nor-mal distribution is also applicable to two other samples, namely, the synthetic bead (Fig.ESM_4_3) and the Kagoshima sand. The changes in the porosity and in the degree of the
123

668 Y. Nakashima, T. Nakano
Fig. 11 Same as Fig. 9, with the exception of the effects of the degree of the affine transformation on theBerea sandstone images. The results for the images in Figs. 3 and 10 are also shown
affine transformation affect the tortuosity of the pore structure (Fig. ESM_2_1b), resultingin a significant change in the shape of the distribution. For example, the porosity reductionand image compression lead to the leftward shift of the histogram (Figs. 9a, 11a). The image
123
Steady-State Local Diffusive Fluxes in Porous Geo-Materials 669
elongation causes a rightward shift (Fig. 11a). Although the effects of the image deformationand porosity reduction on the macroscopic formation factor value have been discussed by anumber of authors (e.g., Sen et al. 1981; Roberts and Schwartz 1985; Schön 2004; Nakashimaand Nakano 2011), the present pore-scale study is the first systematic report on their effectson the microscopic statistics of the local diffusive/electric flux.
Based on the pore structure of Fig. 1, two model images of Figs. 4 and 5 were investigatedto explore the mechanism that yields the log-normal distribution. We observed that the twomodels successfully reproduced the log-normal distribution. The diffusive flux having a largeJ value was injected from the throat into the large pool in Fig. 4. Owing to the geometriccontrast in pore diameter between the throat and the pool, the diffusive flux is broadened inthe pool. This broadening is an inevitable outcome of the nature of the Laplace equation ofEq. (A2) and yields the log-normal distribution having a long positive tail shown in Fig. 6.Figure 5 depicts that the magnitude of the flux vector is different from pipe to pipe becausethe 3D pipe position in the pore network is different. The mixing of the diffusive flow havingdifferent J values occurs at each pipe junction to yield a broad log-normal distribution of J .Note that an pipe system with equiradii can reproduce the log-normal distribution (pools arenot essential). In conclusion, the flux broadening in large pores and the flux mixing at thepore network junctions are responsible for the log-normal distribution.
The log-normal distribution has been reported for the electric current in the random resistornetwork (de Arcangelis et al. 1985) and for the longitudinal velocity component for the Darcyflow in porous media (Cenedese and Viotti 1996; Lebon et al. 1996). The electric potentialobeys the Laplace equation of Eq. (A2) as well as the tracer concentration. Thus, the electriccurrent in the random network and the diffusive flux in the complex porous geo-materialswould appear to obey the same log-normal distribution. On the other hand, the Darcy flowvector obeys a different equation, namely, the Stokes equation (e.g., Lebon et al. 1996) with aviscous boundary condition on the solid–fluid interface. Thus, it may appear strange that thediffusive flux and Darcy flux obey the same log-normal distribution. However, the local porefluid pressure driving the Darcy flow obeys the Laplace equation as well as the concentration.The throat–pool structure (Fig. 4) and pore-network structure (Fig. 5) yield qualitatively thesame effects (i.e., broadening and mixing of flows) on both the diffusive flow and Darcy flowdriven by the concentration or pressure gradient. Thus, it is not surprising that the diffusiveflux and the Darcy flux obey the same log-normal distribution.
4.2 Negative Tail and Long Positive Tail
The local counter diffusive flux, as well as the Darcy counter flow (Kutsovsky et al. 1996;Maier et al. 1998; Ogawa et al. 2001; Li et al. 2010), was observed in the present study(Figs. 9c, 11c). The porosity and pore anisotropy affect the population of the counter fluxsignificantly. For example, the porosity reduction generally increases the population (Figs. 8d,h, 9c, and ESM_3_1e–h). The image elongation and compression decreases and increasesthe population, respectively (Figs. 10d, h, 11c, and ESM_6_1d–f). The diffusion is a scalarpotential flow that obeys Fick’s first law. Thus, the separation of flow at a high Reynoldsnumber (e.g., Andrade et al. 1997; Watanabe and Katagishi 2006) cannot be responsible forthe local counter diffusive flux. Rather, the complex tortuous pore geometry produced by thepore reduction and image compression (Fig. ESM_2_1b) is responsible for the generation ofthe counter flux.
Although the existence of the local counter flux is evident in Figs. 8, 10, ESM_3_1, andESM_6_1, the magnitude and population are both small compared with the pore voxelshaving positive Jz values. As a result, the contribution of the negative tail to the overall
123
670 Y. Nakashima, T. Nakano
transport of the tracer across the image system is negligible (Figs. 9d, 11d). This is consistentwith Li et al. (2010), who reported that the contribution of the counter flow was insignificantfor the Darcy flow in porous media.
The long positive tail corresponding to the transport pores having large Jz values was iden-tified in the Jz histogram (Figs. 9b, 11b). Although it is difficult to find an objective thresholdfor the discrimination of the large-Jz voxels and stagnant voxels owing to the almost uni-modal nature of the distribution, the Jz value of 134 (vertical dotted line in Figs. 9d, e, 11d,e) was chosen as a tentative threshold. Then, the contribution of all voxels having Jz valueslarger than the threshold to the total diffusive transport of the system can be calculated asthe ratio of the area in the histogram. The ratio was as small as 13–19 % for the six cases ofFig. 9e and 13–24 % for those of Fig. 11e. This calculation demonstrates that the long positivetail corresponding to the transport pores shares a fraction of the tracer transport across thesystem, but its contribution is not the most dominant, and the stagnant pores are the mainconveyer of the tracer.
4.3 Concept of φ = φtrans + φstag
The systematic Laplace simulations of the present study for the 3D images having variousporosities and degrees of deformation revealed that a broad spectrum of diffusion flux valuesis realized in the J and Jz histograms. It is possible to assign the large-flux pore voxels toφtrans and the small-flux pore voxels to φstag. The porosity reduction makes φstag more dom-inant than φtrans (Fig. 9). While the image compression increases φstag, the image elongationdecreases φstag (Fig. 11). By properly choosing the threshold, it is possible to depict thepercolated cluster of φtrans having large-flux values, as demonstrated in Figs. 8b, f and 10b,f. In this sense, the conventional concept of φ = φtrans + φstag is confirmed in the presentstudy through pore-scale simulations.
However, this concept may give the impression that there is a distinct and objective thresh-old that distinguishes φtrans and φstag in terms of the flux value. We found that this is not truebecause the histograms in Figs. 9 and 11 are almost unimodal due to the flux broadening inlarge pores and the flux mixing at the pore network junctions (Figs. 4, 5, 6, 7). As a result, itis difficult to find an objective threshold.
Most importantly, although the contribution of the transport porosity is not negligible,the stagnant porosity, φstag, having relatively small flux values is the main conveyer of thetracer across the porous media system. Figures 9d, e and 11d, e clearly show that the peaks(indicated by arrows) that have smaller Jz values than the tentative threshold of the verticaldotted line significantly contribute to the overall tracer transport. This is a consequence ofthe number of pore voxels in the stagnant region being large enough to compensate for thesmall value of Jz. Andrade et al. (1997) has reported that the stagnant region is important forthe momentum transport of the Darcy flow in porous media. The present study revealed thatthe stagnant region is also important in the diffusive transport in porous media.
Because no Darcy flow was assumed in the simulations of the present study, the Pécletnumber of the porous media system studied is infinitesimal. The Péclet number would befinite for some real geological environments where the Darcy flow is not negligible. It ispossible to qualitatively discuss the tracer transport with a finite Péclet number. Supposethat the Péclet number increases with the increase of the Darcy velocity. The tracer migratesin the porous system by the Fickian diffusion and Darcy flow, and the contribution of thelatter would be more dominant with increasing flow magnitude. For a system with a suffi-ciently large Péclet number, the local tracer flux vector mostly agrees with the local Darcyflux vector. Then the histogram of the local tracer flux depends on the Reynolds number
123

Steady-State Local Diffusive Fluxes in Porous Geo-Materials 671
(Maier et al. 1998), the negligible local counter flux occurs (Kutsovsky et al. 1996; Ogawaet al. 2001; Li et al. 2010), and the Jz component obeys the log-normal distribution (Cenedeseand Viotti 1996; Lebon et al. 1996). It should be also noted that the 3D migration trajectoryof tracers dissolved in the flowing fluid would switch from the less tortuous path to moretortuous one having larger local pore diameters (Zhang and Knackstedt 1995).
5 Conclusions
Pore-scale diffusion simulations were performed for the non-sorbing tracers diffusing in thefluid-saturated porous sediment/rock to obtain the spatial distribution of the local diffusiveflux vector. The main outcomes are as follows: (i) The histogram of the magnitude of theflux vector obeys a unimodal log-normal distribution. The flux broadening at large pores andflux mixing at pore junctions are responsible for the log-normal shape. (ii) The conventionalunderstanding that pores consist of transport pores with large flux and stagnant pores withsmall flux was confirmed directly by the pore-scale simulation. Owing to the unimodal nature,however, it is difficult to distinguish transport pores and stagnant pores using an objectivethreshold. (iii) The local counter diffusion was observed. However, the population and theintensity of the counter fluxes are too small and weak to contribute to the overall diffusivetransport across the porous media system. The population of the transport pores having largeflux values was also too small to be the most dominant in the overall diffusive transport. Asa result, the main conveyer of the tracer across the 3D image system is the stagnant poreshaving small positive flux values but a large population.
Acknowledgments Comments by three anonymous reviewers were very helpful. Mathematica� program-ming was performed by S. Kamiya. The Berea sandstone sample was imaged by Canon Marketing Japan Inc.using a MicroXCT system (Xradia, California, USA). Rock samples other than the Berea sandstone wereimaged at the Japan Synchrotron Radiation Research Institute (Proposal No. 2001B0501-NOD-np) for thepreliminary study. The present study was supported in part by JSPS KAKENHI (No. 23241012).
Open Access This article is distributed under the terms of the Creative Commons Attribution License whichpermits any use, distribution, and reproduction in any medium, provided the original author(s) and the sourceare credited.
Appendix: Basic Equations Used
The percolated pore porosity, φ, in porous media can be divided into transport porosity,φtrans, having relatively large diffusive flux and stagnant porosity, φstag, having relativelysmall diffusive flux (e.g., Tiab and Donaldson 2004):
φ = φtrans + φstag (A1)
The stagnant pores can comprise not only dead-end pores (e.g., Skagius and Neretnieks 1986)but also open pores (e.g., Pérez-Rosales 1982).
The non-sorbing tracer diffuses in the fluid-saturated percolated pore driven by the localconcentration gradient (Fick’s first law). Assuming steady-state diffusion, the concentrationobeys the 3D Laplace equation with a no-flux boundary condition on the solid/pore interface(e.g., Adler et al. 1992; Øren et al. 2007):
�C = 0 (A2)
123

672 Y. Nakashima, T. Nakano
where C is the tracer concentration in pore fluid.The formation factor, F , refers to the electrical resistivity of porous rock/sediment satu-
rated with a conductive fluid, normalized by that of the bulk fluid. It is well known that theformation factor obeys Archie’s law (e.g., Schön 2004; Tiab and Donaldson 2004). Archie’slaw was originally developed for the electric current flowing in conductive pore fluid. Thesteady-state spatial distribution of the electric potential and tracer concentration in porousmedia obeys the same partial differential equation, i.e., the Laplace equation. Thus, it ispossible to convert Archie’s law for electrical resistivity into that for diffusivity as follows:
F = Dbulk
Deff∝ φ−m (A3)
where Deff is the effective diffusivity, Dbulk is the tracer diffusivity in bulk fluid, and m isthe exponent (e.g., Grathwohl 1998; Boving and Grathwohl 2001).
There is another important diffusivity, apparent diffusivity, Dapp. The normalized appar-ent diffusivity is the reciprocal of the tortuosity of the pore structure of the porous media andobeys a power law similar to Archie’s law:
normalized apparent diffusivity = Dapp
Dbulk∝ φn (A4)
where n is the exponent (e.g., Nakashima 1995; Tiab and Donaldson 2004). The exponents,m and n, were computed in the present study by the least squares method using the diffusionand porosity data. The exponents are sensitive to the degree of the rock deformation (e.g.,Sen et al. 1981; Schön 2004).
The relationship between the apparent diffusivity and effective diffusivity is simple fornon-sorbing tracer: Dapp = Deff/φ (e.g., Nakashima 1995). Substituting this expression intoEq. (A4) and comparing the result with Eq. (A3), we obtain the following:
n = m − 1 (A5)
References
Adler, P.M., Jacquin, C.G., Thovert, J.F.: The formation factor of reconstructed porous media. Water Resour.Res. 28, 1571–1576 (1992)
Andrade, J.S. Jr.., Almeida, M.P., Mendes Filho, J., Havlin, S., Suki, B., Stanley, H.E.: Fluid flow throughporous media: the role of stagnant zones. Phys. Rev. Lett. 79, 3901–3904 (1997)
Boving, T.B., Grathwohl, P.: Tracer diffusion coefficients in sedimentary rocks: Correlation to porosity andhydraulic conductivity. J. Contam. Hydrol. 53, 85–100 (2001)
Cenedese, A., Viotti, P.: Lagrangian analysis of nonreactive pollutant dispersion in porous media by means ofthe particle image velocimetry technique. Water Resour. Res. 32, 2329–2343 (1996)
de Arcangelis, L., Redner, S., Coniglio, A.: Anomalous voltage distribution of random resistor networks anda new model for the backbone at the percolation threshold. Phys. Rev. B 31, 4725–4727 (1985)
Grathwohl, P.: Diffusion in Natural Porous Media: Contaminant Transport, Sorption/Desorption and Disso-lution Kinetics. Kluwer, London (1998)
Han, M., Youssef, S., Rosenberg, E., Fleury, M., Levitz, P.: Deviation from Archie’s law in partially saturatedporous media: wetting film versus disconnectedness of the conducting phase. Phys. Rev. E 79, articlenumber 031127 (2009)
Knackstedt, M.A., Arns, C.H., Sheppard, A.P., Senden, T.J., Sok, R.M., Cinar, Y., Olafuyi, A.O.,Pinczewski, W.V., Padhy, G., Ioannidis, M.: Pore scale analysis of electrical resistivity in complex corematerial. In: International Symposium of the Society of Core Analysts, Calgary, SCA2007-33 (2007)
Kutsovsky, Y.E., Scriven, L.E., DavisH.T. Hammer, B.E.: NMR imaging of velocity profiles and velocitydistributions in bead packs. Phys. Fluids 8, 863–871 (1996)
Lebon, L., Oger, L., Leblond, J., Hulin, J.P., Martys, N.S., Schwartz, L.M.: Pulsed gradient NMR measurementsand numerical simulation of flow velocity distribution in sphere packings. Phys. Fluids 8, 293–301 (1996)
123

Steady-State Local Diffusive Fluxes in Porous Geo-Materials 673
Lever, D.A., Bradbury, M.H., Hemingway, S.J.: The effect of dead-end porosity on rock-matrix diffusion.J. Hydrol. 80, 45–76 (1985)
Li, X., Li, Z., Zhang, D.: Role of low flow and backward flow zones on colloid transport in pore structuresderived from real porous media. Environ. Sci. Technol. 44, 4936–4942 (2010)
Lindquist, W.B., Venkatarangan, A., Dunsmuir, J., Wong, T.-F.: Pore and throat size distributions mea-sured from synchrotron X-ray tomographic images of Fontainbleau sandstones. J. Geophys. Res 105,21509–21527 (2000)
Maier, R.S., Kroll, D.M., Kutsovsky, Y.E., Davis, H.T., Bernard, R.S.: Simulation of flow through bead packsusing the lattice Boltzmann method. Phys. Fluids 10, 60–74 (1998)
Nakano, T.: Numerical flow simulation through a two-dimensional network using X-ray CT imagery. Bull.Geol. Surv. Jpn. 46, 605–627 (1995) (In Japanese with English abstract)
Nakashima, S.: Diffusivity of ions in pore water as a quantitative basis for rock deformation rate estimates.Tectonophysics 245, 185–203 (1995)
Nakashima, Y., Kamiya, S.: Mathematica programs for the analysis of three-dimensional pore connectivityand anisotropic tortuosity of porous rocks using X-ray computed tomography image data. J. Nucl. Sci.Technol. 44, 1233–1247 (2007)
Nakashima, Y., Kamiya, S.: Anisotropic diffusion in fibrous porous media. J. Porous Media 13, 1–11 (2010)Nakashima, Y., Nakano, T.: Accuracy of formation factors for three-dimensional pore-scale images of geo-
materials estimated by renormalization technique. J. Appl. Geophys. 75, 31–41 (2011)Nakashima, Y., Nakano, T., Nakamura, K., Uesugi, K., Tsuchiyama, A., Ikeda, S.: Three-dimensional
diffusion of non-sorbing species in porous sandstone: computer simulation based on X-ray microto-mography using synchrotron radiation. J. Contam. Hydrol. 74, 253–264 (2004)
Nakashima, Y., Kamiya, S., Nakano, T.: Diffusion ellipsoids of anisotropic porous rocks calculated by X-raycomputed tomography-based random walk simulations. Water Resour. Res. 44, article number W12435(2008)
Ogawa, K., Matsuka, T., Hirai, S., Okazaki, K.: Three-dimensional velocity measurement of complex inter-stitial flows through water-saturated porous media by the tagging method in the MRI technique. Meas.Sci. Technol. 12, 172–180 (2001)
Øren, P.-E., Bakke, S., Held, R.: Direct pore-scale computation of material and transport properties for NorthSea reservoir rocks. Water Resour. Res. 43, article number W12S04 (2007)
Pérez-Rosales, C.: On the relationship between formation factor and porosity. Soc. Petrol. Eng. J. 22,531–536 (1982)
Promentilla, M.A.B., Sugiyama, T., Hitomi, T., Takeda, N.: Quantification of tortuosity in hardened cementpastes using synchrotron-based X-ray computed microtomography. Cem. Concr. Res. 39, 548–557 (2009)
Roberts, J.N., Schwartz, L.M.: Grain consolidation and electrical conductivity in porous media. Phys. Rev.B 31, 5990–5997 (1985)
Schön, J.H.: Physical Properties of Rocks: Fundamentals and Principles of Petrophysics. Elsevier, Amster-dam (2004)
Sen, P.N., Scala, C., Cohen, M.H.: A self-similar model for sedimentary rocks with application to the dielectricconstant of fused glass beads. Geophysics 46, 781–795 (1981)
Skagius, K., Neretnieks, I.: Porosities and diffusivities of some nonsorbing species in crystalline rocks. WaterResour. Res. 22, 389–398 (1986)
Sugiyama, T., Promentilla, M.A.B., Hitomi, T., Takeda, N.: Application of synchrotron microtomographyfor pore structure characterization of deteriorated cementitious materials due to leaching. Cem. Concr.Res. 40, 1265–1270 (2010)
Takeda, M., Hiratsuka, T., Ito, K., Finsterle, S.: An axisymmetric diffusion experiment for the determinationof diffusion and sorption coefficients of rock samples. J. Contam. Hydrol. 123, 114–129 (2011)
Tiab, D., Donaldson, E.C.: Petrophysics: Theory and Practice of Measuring Reservoir Rock and Fluid Trans-port Properties, 2nd edn. Elsevier, Amsterdam (2004)
Watanabe, T., Katagishi, Y.: Deviation of linear relation between streaming potential and pore fluid pres-sure difference in granular material at relatively high Reynolds numbers. Earth Planets Space 58,1045–1051 (2006)
Zhan, X., Schwartz, L.M., Toksöz, M.N., Smith, W.C., Morgan, F.D.: Pore-scale modeling of electrical andfluid transport in Berea sandstone. Geophysics 75, F135–F142 (2010)
Zhang, X., Knackstedt, M.A.: Direct simulation of electrical and hydraulic tortuosity in porous solids.Geophys. Res. Lett. 22, 2333–2336 (1995)
123