status of recruitment resources and...
TRANSCRIPT
Status of Recruitment Resources and Strategies
Primary Care and Rural Health Unit Office of the Commissioner
Department of Health and Social Services P.O. Box 110601
Juneau, AK 99811-0601 (907) 465-3091
This project was prepared by the Alaska Center for Rural Health, UAA, under contract with the Alaska Department of Health and Social Services.
This project was supported by funds from Primary Care Office Grant U68 CS 00157 and Rural Hospital
Flexibility Program grant H54 RH 00014, HRSA.
1
June 30, 2004

ACKNOWLEDGEMENTS Funding and Project Oversight Primary Care and Rural Health Unit, Alaska Dept. of Health & Social Services Pat Carr, Director Jean Findley, Health Program Manager Alice Rarig, Health and Social Services Planner Advisory Committee Alaska Dept. of Labor and Workforce Development – Brynn Keith Alaska Mental Health Trust Authority – Bill Herman Alaska Native Tribal Health Consortium – Tim Gilbert and Cindy Hamlin Alaska Primary Care Association – Marilyn Kasmar and Pat Fedrick Alaska State Hospital and Nursing Home Association – Randall Burns (ASHPIN) Research Team Alaska Center for Rural Health, College of Health and Social Welfare, UAA Beth Landon, Director Mariko Selle, Research Associate Linda Van Houten, Research Associate Sanna Doucette, Institute for Circumpolar Health Studies, Research Associate
2

TABLE OF CONTENTS ACKNOWLEDGEMENTS .............................................................................................................................2 TABLE OF CONTENTS................................................................................................................................3 EXECUTIVE SUMMARY ..............................................................................................................................4 LITERATURE REVIEW.................................................................................................................................8
A. Methodology..........................................................................................................................................8 B. Descriptive Statistics Regarding Publications.......................................................................................8 C. General Findings...................................................................................................................................9 D. Alaskan Workforce Studies.................................................................................................................13
METHODOLOGY........................................................................................................................................16 A. Project Advisory Committee...............................................................................................................16 B. Survey development ...........................................................................................................................16 C. Pilot study ...........................................................................................................................................17 D. Respondents.......................................................................................................................................17 E. Data Collection....................................................................................................................................18
ANALYSIS & FINDINGS.............................................................................................................................19 A. Study Participants ...............................................................................................................................19 B. Strategies Used to Recruit Providers..................................................................................................21 C. Most Effective Recruitment Strategies................................................................................................24 E. Making Recruitment Efforts More Effective.........................................................................................28 F. Barriers to Recruitment .......................................................................................................................29 G. Cost of Recruitment ............................................................................................................................32 H. Outcome of This Study .......................................................................................................................37
DISCUSSION AND RECOMMENDATIONS...............................................................................................40 A. Barriers to Recruitment .......................................................................................................................40 C. Recruitment Costs ..............................................................................................................................41 D. Collaborations .....................................................................................................................................41 E. Recommendations ..............................................................................................................................42
APPENDIX A-D in separate document .......................................................................................................43
3

EXECUTIVE SUMMARY Alaskan health care employers, professionals and policy makers have a tacit understanding of the challenges to recruit health care providers in Alaska. However, these difficulties have never before been systematically quantified. As a measure of awareness and concern, the Alaska Department of Health and Social Services, Primary Care and Rural Health Unit, contracted with the Alaska Center for Rural Health, University of Alaska Anchorage, to conduct a statewide assessment of rural recruitment resources, strategies and costs. The Primary Care and Rural Health Unit initiated the project partially in response to expectations of their Alaska Primary Care Office, Alaska Office of Rural Health, and Rural Hospital Flexibility programs. ACRH conducted telephone surveys to collect data on strategies used by 76 small hospitals, rural clinics, and rural mental health centers (henceforth “rural health care facilities”) to recruit physical, behavioral, and oral health providers. ACRH also documented the costs associated with recruiting these professionals. The analyzed information will allow the State of Alaska and other Alaskan entities to identify strategies for better coordination and integration of rural recruitment practices. Key findings include: • Rural health care facilities spent over $12,000,000 in the last year on the combined
recruitment of physicians, pharmacists, midlevel providers, nurses, dentists, hygienists, psychiatrists, clinical psychologists, masters-level therapists, and LCSWs. Due to reporting limitations, another $7,000,000 could not be included in this figure.
• Excluding the cost of locums and training for new recruits, the average cost-per-hire
for rural Alaska was $28,000. Including training and the cost of locums and travelers to support the facility while waiting for a new hire drove the cost up to $38,000 per hire.
• Word of mouth was often emphasized as the best recruitment tool. As an example of
this, current staff were often the best resource for recruiting other providers. • Websites and other internet resources, as well as newspaper advertising were highly
rated as “most effective” method of recruitment. Interestingly, websites and other internet resources, as well as newspaper advertising, were highly rated as both the “most effective” and “least effective” method of recruitment. Open ended comments reveal that these resources are can be useful when it is appropriately targeted, but indiscriminate advertising can be a waste of money.
• Word of mouth, advertising in newspapers, and on websites were reported to be the
most common methods used by rural Alaska health care facilities to market vacant positions. Newspaper advertising was used commonly across the board, but was used particularly frequently in the recruitment of LCSWs (81%) and Masters Level
4

Therapists (81%). The majority of facilities also used websites, and many advertised in journals.
• Respondents emphasized the difficulty of identifying candidates that were applicable
to their organization. Many articulated that their recruitment efforts could be improved if there was a centralized pool of candidates available.
Recommendations from surveyed rural health care employers included the belief that their organizations would benefit from:
1. Using newspapers and websites that target providers interested in rural and underserved employment.
2. Investing more effort in identifying appropriate advertising venues that elicit more appropriate position respondents;
3. Analyzing their recruitment strategies and comparing them to those strategies identified as most effective; and
4. Analyzing what they spend on recruitment in comparison to other entities and whether these expenditures were invested in the most effective recruitment strategies. If they are not, they should be clear about why strategies were employed at each facility.
5. Coordinating the formation of a statewide clearinghouse for recruitment. The collaborative would facilitate identification of appropriate candidates and possibly provide background screening. It could be web-based, and link to websites of participating organizations, thus facilitating the flow of information about different organizations and their communities. As a result, internal recruitment efforts could be stream-lined and, hopefully, result in faster turnaround for facilities in need.
5

BACKGROUND In November 2003, the Alaska Department of Health and Social Services, Primary Care and Rural Health Unit, contracted with the Alaska Center for Rural Health (ACRH), University of Alaska Anchorage to describe and document current recruitment strategies, effectiveness, costs, and resources used by rural primary care clinics and small hospitals, as related to the following provider types:
• Physician; • Pharmacist; • Physician assistant; • Nurse practitioner; • Certified nurse midwife; • Registered nurse generalist; • Registered nurse specialist; • Dentist; • Dental hygienist; • Psychiatrist; • Clinical psychologist; • Licensed clinical social worker; and • Master’s level therapist/counselor.
Data on Alaskan health professional recruitment has not been systematically compiled. The Alaska Department of Labor and Workforce Development, Research and Analysis Section, regularly tracks and compiles information on employment in health care, but the precise costs of recruiting health care professionals are unknown. The challenges of recruiting health care professionals in rural Alaska are familiar to many, but this project is the first known comprehensive survey and analysis of the specific strategies used and their effectiveness. Several agencies and organizations currently assist with the recruitment of health care professionals in Alaska. These include governmental agencies, statewide non-profit organizations, health professional organizations, and educational institutions. Job candidates and rural health organizations can use recruitment websites managed by: the Alaska Department of Labor and Workforce Development; Alaska Native Tribal Health Consortium; Alaska Primary Care Association; Indian Health Service; National Health Service Corps; Northwest Regional Primary Care Association; Rural Recruitment and Retention Network (3R Net); and others. All these entities work together on several workforce development initiatives. In Alaska, the demand for health care workers is reaching a crisis situation. The April 2003 Economic Trends magazine of the Alaska Dept of Labor and Workforce Development explains that health care “is a billion-dollar industry and it employs about 22,000 people. It would be hard to find an industry in Alaska with a growth pattern as strong and sustained as that of health care.” The report documents that health care employs 7% of Alaska’s workforce, primarily in the private sector, and enjoys recession
6

proof growth. As they report in the April 2004 Economic Trends magazine, the health care and social assistance industry added a total of 4,800 jobs in 2002 and 2003. Another measure of demand for health care providers is the Health Professional Shortage Area (HPSA). This is a federal term to denote shortages in primary care physicians, dentists or mental health providers. The entire state of Alaska is designated as a HPSA. To complicate matters, Alaska has limited training capacity, with no pharmacy school, dental school, or physical therapy and occupational therapy programs. It has developed a strong relationship with the University of Washington School of Medicine for training Alaskans as physicians, and has one residency program in Family Practice. Many higher level health care providers must be “imported” from other states. On a larger level, it is understood that the difficulties and expense of recruiting health care professionals into rural health systems are especially difficult. The circumstances unique to rural settings stem from a variety of factors. These include the overall national health professional shortages, the lack of rural facilities’ recruiting resources, provider preference for metropolitan placements, and poor retention rates that cause a constant demand for new hires. Both international and domestic health care organizations have begun to study these problems and implement strategies to expand the pipeline of rural care providers and reduce the time and costs associated with recruitment. Results from this study are intended to help rural health care facilities and policy makers better understand the range of recruitment strategies available to them, identify the costs that health care facilities and other organizations invest in this arena, and form a background for strategizing new collaborations and initiatives on a statewide level.
7

LITERATURE REVIEW A. Methodology A comprehensive literature review was performed to identify publications released between January 1998 and December 2003 relevant to the recruitment issue. Two health sciences databases were utilized: PubMed and HealthSTAR. The PubMed database provides access to MEDLINE citations and international journals focusing on clinical medicine and other health fields. The HealthSTAR database focuses on health planning and administration publications. The search resulted in over 200 citations, of which 57 discrete citations were determined to be relevant to the topic of health care provider recruitment. Some citations appeared in both databases. PubMed identified forty-nine pertinent articles, using the search keywords “personnel selection-methods,” “rural health or rural health services,” and “cost or costs.” HealthSTAR found sixteen additional pertinent articles, using the search keywords “personnel selection-methods,” “rural health or rural health services,” and “cost or cost analysis.” Research related to all health care provider types was included in the search. B. Descriptive Statistics Regarding Publications Of the 57 publications found to meet inclusion criteria, nearly half (46%) were published in the last two years, indicating that interest in the subject may be increasing. Figure 1: Publication Year
Year # Publications % Publications 1998 5 9% 1999 10 18% 2000 8 14% 2001 8 14% 2002 14 25% 2003 12 21% TOTAL 57 100%
In general, the relevant publications can be categorized into six major topic categories. Articles focusing on community and organizational strategies for health professional recruitment and retention accounted for nearly one-third (32%) of all citations. Other publications focused on health professional training issues, the costs of recruitment, large scale strategies (generally national or state policies aimed at increasing rural providers), and employment selection behaviors. Several publications focused solely on describing the problems of rural health profession shortages and the difficulties with recruitment. The main theses of publications included in this review are described below in Figure 2.
8

Figure 2: Publication Topic
Publication Topic # Publications
% Publications
Community/organizational strategies for health professional recruitment and retention 18 32% Health professional training issues 13 23% Large scale strategies for health professional recruitment & retention 8 14% Health professional employment selection behaviors 8 14% Cost of recruitment/turnover 6 11% Problem Description 4 7% Total 57 100%
The vast majority of articles included in the literature review were descriptive in nature, providing a report of programs employed by communities, universities, or rural hospitals and clinics to improve the recruitment and retention of rural providers. In fact, nearly three-quarters of the publications (72%) illustrated various approaches used in rural locations in the United States, the United Kingdom, and Australia. Surveys accounted for the next largest number of citations (23%). The surveys were generally aimed at rural providers and asked for information regarding their selection of rural practice or their ideas to improve retention in rural settings. The research tended to focus on recruitment strategies for physicians (65%). Recruitment strategies for multiple types of health professions, or health professions in general, were the next most common research focus (18%). Programs aimed at nurses (14%), Physicians Assistants (2%), and allied health professions (2%) were researched less frequently. The literature review used “rural health or rural health services” as one of the key word search terms for defining criteria for the literature review, so it follows that the majority (75%) of articles have a focus on rural health recruitment. One-quarter (25%) of the citations are focused on recruitment of health professionals in general and do not focus on the specific difficulties of recruiting to rural locations. C. General Findings The findings of the literature review can be generalized within the five main topic categories outlined in Figure 2. Community and Organizational Strategies for Health Professional Recruitment
1. Empowered communities can work together to make themselves more attractive to healthcare workers. Several researchers found that rural communities can be more successful recruiting and retaining providers when they take an active role in the process.
9

Some specific methods cited to help communities become more “recruitable” include:
• Using a regional recruiter to guide the community through community development activities aimed at making communities more attractive to physicians (Felix et al);
• Empowering communities to be more active in community planning to define community health workforce needs, determine community barriers to achieving these goals, and build solutions to make communities more attractive to health workers (Shannon et al; Veitch et al); and
• Developing lists of community and facility assets that will appeal to physicians (Allen).
2. Rural recruitment and retention efforts should take into account the needs of the entire family. The literature indicated that the needs of spouses and children of health care professionals are often neglected when health organizations partake in recruitment and retention efforts. However, even if a physician and a particular rural facility are a good fit, the physician is unlikely to stay long-term if the needs of the whole family are not met (Kennedy). The literature suggests, then, the importance of “recruiting” the entire family (Thornhill). One survey of rural physicians found that the biggest barriers to practicing in a rural location were family related, including spousal employment and children’s schooling (Simmons et al). One solution described in the literature was to create a Spousal Network to address the needs and concerns of rural physician spouses, including spousal employment help, mentoring, stress management, and spouse get-aways (MacKay).
3. Organizations can improve recruitment and retention by finding creative ways to provide clinical, professional, and financial support. Several authors mentioned providing excellent financial support to rural providers as an important recruitment tool. Romano discusses the importance of bold and innovative recruitment methods that include generous compensation packages. Creative types of compensation include local loan repayment programs, repayment of relocation expenses, car allowances, percentage of gross revenue bonus structures, and retention bonuses. One program offers bonuses to clinical providers who recruit their colleagues to practice in the community. Practicing rural physicians were also surveyed to solicit their ideas on possible solutions for recruiting and sustaining physicians in rural practice. A wide variety of clinical support solutions were identified, with the top four solutions including:
• Better planning and compensation for locums; • Access to local/regional locums for rapid deployment when needed; • Creation of on-call strategies to decrease physician call; and • Greater access to specialty referral networks (Rourke et al).
10

One program found success by providing professional support to rural physicians through strong ties with a university medical center. Support from a University was found to reduce professional isolation. Providing rural physicians with academic appointments also provided an attractive incentive for rural practitioners (Wilkinson et al). A suggestion for nursing bears mention. Specifically, mentorship programs for nurses beginning practice in rural locations have been found to positively influence nurse retention (Gibbs et al).
Health Profession Training Issues
1. Rural training programs are successful at recruiting and retaining providers and should be focused at all aspects of the training continuum. Interdisciplinary health training programs with a rural rotation are an integral factor in recruiting health workers to practice in rural locations (Brand et al). In fact, Brooks et al found that exposure to rural training curriculum and rotations were the factors most strongly correlated to provider retention. Likewise, Acosta found that fellows who complete a rural health fellowship have a higher tendency to locate in rural settings. Much research has been done over the past 20 years to document and analyze rural training programs. The research shows that strategies should encompass the entire educational pipeline, although there are still many opportunities for attrition at each point along the educational pathway (Geyman et al). Training programs focusing on high school students, undergraduates from rural locations, and postresidency have been found effective (Rackley et al, Vickery et al, Acosta).
2. Strategies can be developed to minimize provider concerns regarding rural training tracks and encourage participation. Barriers to providers participating in rural training tracks have been identified through several surveys. Top barriers cited include:
• Low number of patients in rural communities; • Lack of exposure to large training conferences; • Lack of exposure to peer residents; • Rural hospital politics; • Inability to access attending teaching; and • Heavy call schedules (Abercrombie).
However, strategies have been implemented to encourage rural training by minimizing some of the problems most associated with rural training. These strategies have included the creation of flexible joint rural-metropolitan positions, the creation of rural physician conferences, and the introduction of individualized management consultant support to rural physicians (Simmons).
11

Large Scale Strategies (Policy Issues)
1. National and state financial incentive programs aimed at encouraging practice in underserved areas are effective but funded too modestly. Jackson et al found that financial incentives were successful in recruiting physicians to medically underserved areas in the United States. National Health Service Corps is one such example (Schneck). However, such efforts should have greater funding and more marketing in order to fully meet the vast needs of underserved communities.
Financial incentives have also been used to recruit physicians to rural British Columbia (Kent), military physicians in Canada (Sullivan), and both nurses (Duffin) and physicians (Salvage) to rural areas in the United Kingdom. Evaluation of these programs is not provided; rather the programs are described in the literature.
Health Professional Employment Selection Behaviors
1. Healthcare workers who grow up in a rural location are more likely to be recruited to rural practice. Authors have found that the factor correlating strongest to rural practice is growing up in a rural location. The strong association has been found for a wide variety of healthcare workers including physical therapists and occupational therapists (Hegney et al), nurses (Gorton et al), and primary care physicians (Brooks et al , Easterbook et al). It is important to note that while Brooks et al also found that growing up in a rural location had the strongest correlation for recruitment to a rural location, they also found that training factors (such as students who had training rotations in rural areas) were more strongly related to retention.
2. Many issues affect healthcare workers’ decision to practice in a rural location so training, recruitment and retention efforts should be multi-faceted. Although growing up in a rural location was most strongly correlated to recruitment, a wide variety of issues are cited by healthcare workers explaining why they were recruited to a rural practice and what they like about their rural location. Many of the same issues are cited by several health professions, including PT’s, OT’s, nurses, and physicians. They include:
• Proximity to leisure and recreational activities; • Proximity to extended family; • Rural lifestyle (less stress, less hurried); • Professional autonomy; • Influence of spouse; and • Financial compensation.
12

Physicians, nurses, and allied health workers also cite similar dislikes that may lead to low retention in rural practice. The most heavily cited dislikes include isolation, long hours, lack of locums, low pay, and lack of specialists. (Gorton et al; Alexander et al). Retention solutions, therefore, must look at a variety of factors.
Cost of Recruitment and Turnover
1. The cost of turnover is large, so recruiting and retaining the right person is important. Provider turnover is expensive to organizations, although specific estimates of cost per hire vary greatly and are influenced by geography, profession, and assumptions used in financial calculations. The largest study found on the subject looked at the cost of turnover of primary care physicians in both rural and urban settings. The authors found that recruitment and replacement costs for individual Primary Care Providers (PCP) were around $236,383 for general/family practice, $245,128 for internal medicine and $264,645 for pediatrics, based on costs of interviewing, relocation, search firms, sign-on bonuses, and loss of productivity (gross production minus starting salary) (Buchbinder). Another author estimated the average cost of a $47,000 RN turnover at $33,000. This figure included the entire spectrum of turnover costs, from separation and replacement, to training a new RN (Contino). Physicians costs were estimated at $20,000-$26,000 per physician, just for recruitment (Scott). Although the cited costs per hire vary greatly, the authors agree that the cost of turnover is high and that a variety of different costs should be taken into consideration when calculating these costs, including:
• separation costs;
• replacement costs; and
• training costs (Wilkinson); as well as
• lost revenue as a result of the open vacancy (Buchbinder). Tracking recruitment costs can help an organization develop better methodologies for recruitment (Jossi). Hiring the right person can help decrease turnover and save an organization from incurring the high turnover costs (Contino).
D. Alaskan Workforce Studies Several Alaskan health workforce studies conducted within the past five years bear mention. Because Alaska lacks funding for longitudinal monitoring of changes in the health workforce to support program planning, these individually funded studies provide a useful glimpse into specific components of the health workforce.
13

1. Colleagues in Caring http://www.dced.state.ak.us/occ/pub/RN_finalreport.pdf Funded by the Robert Wood Johnson, Alaska State Board of Nursing and the UAA School of Nursing, this study tracked the characteristics and work-related intentions of Alaska Registered Nurses in 1996, 1998, 2000 and 2002. Survey instruments were included in their licensure packets. Response rates varied between 43% and 80%. Key findings include: • The average age of respondents in 2002 is 46 and the percentage reported to be
American Indian/Alaska Native has grown to 2.4%; • Alaskan nurses are, on average, more educated than their colleagues nationally; • The biggest reason for deciding to stay in nursing was “salary/financial security”
(54%); and • Annual hourly salaries increased incrementally by age and level of nursing degree,
but the average was $28.55/hour.
2. CHA/P Retention Study http://www.ichs.uaa.alaska.edu/acrh/projects/report_chap-retention.pdf Funded by the Office of Rural Health Policy, Health Resources and Services Administration (HRSA), the purpose of this study was to identify factors contributing to retention in Alaska’s Community Health Aide/Practitioners program. Key informant interviews were conducted with 41 community health aides/practitioners (CHA/Ps) in 15 villages statewide. Efforts were made to ensure the sample included a mix of villages with high retention of health aides and villages with lower retention. Geographic and ethnic diversity were also considered. Transcripts were coded using NUD*IST software and data analyzed for differences between high retention and low retention villages, and between more experienced and less experienced CHA/Ps. Five fundamental needs of health aides were identified as critical for retention of personnel. These needs include strong co-worker support, access to basic training, a fully staffed clinic, good community support, and supportive families.
3. Alaska’s Allied Health Workforce: A Statewide Assessment http://www.ichs.uaa.alaska.edu/acrh/projects/archives/report_allied.pdf Funded by University of Alaska President Mark Hamilton, the purpose of this assessment was to learn the current and projected allied health workforce needs of Alaska by surveying employers of the allied health workforce, with results that include projections for 3-5 years into the future. The study covered 78 allied health professions, organized by academic requirements, in 369 organizations. The project relied heavily on collaboration with many key agencies: the Alaska State Hospital and Nursing Home Association, the Alaska Primary Care Association, the Alaska Native Health Board, the Alaska Native Tribal Health Consortium, the Alaska Mental Health Trust Authority, the Alaska Mental Health Board, the Advisory Board on Alcoholism and Drug Abuse, the Governor’s Council on Disabilities and Special Education, the Substance Abuse and Director’s Association, the Alaska Community Mental Health Services Association, Division of Senior Services and the Alaska
14

Department of Labor. This team assisted in the development of the assessment instrument, conducting phone interviews, reviewing results and making recommendations to the University of Alaska.
4. Physician Workforce 2000 http://www.ichs.uaa.alaska.edu/acrh/projects/archives/report_phys.pdf Funded with Alaska’s Area Health Education Center grant, this study assessed the demographic characteristics and professional behavior of Alaska physician workforce. Variables were selected based on their interest to health care employers and planning agencies statewide. The Alaska Division of Occupational Licensing mailed 2,020 surveys with license application materials (biannual licensing cycle). For the 960 (44.7%) returned, Alaska learned about the age, gender, ethnicity, location of primary practice, months worked during the year, and hours worked per week. In addition, the study identified how respondents access CME, provision of itinerant services, residency training and ABMS certification.
6. Attrition Among Alaska Emergency Medical Technicians For a copy of this survey contact Kathy McLeron at 907-465-2262 or [email protected] This study surveyed former Emergency Medical Technicians whose certifications expired between 1995 and 2000 to determine why they failed to recertify. 249 of the 2,968 surveys were returned, for an 8% response rate. Nearly half were returned as undeliverable. Key findings included: • attrition in moderate-sized communities may not be amenable to efforts by local EMS
programs or by the State EMS program; • Sufficient efforts are being made to deliver EMT courses in communities with
populations greater than 1,000; • EMTs in the smallest communities drop their certifications due to the lack of
opportunity to practice their skills, lack of local recertification classes, and family/personal reasons; and
• EMTs in larger communities drop their certifications due to health, stress, and expectations that differ from reality.
7. Alaska Economic Trends: Health Care Industry
http://labor.state.ak.us/trends/apr03.pdf Funded by the State of Alaska, and conducted by the Dept of Labor and Workforce Development, Research and Analysis Section, this report documents the size of the health workforce, employment type, location, and contribution to the economy. It also assesses growth and projections for the sector as a whole as well as changes in demand for many of the health professions.
15
METHODOLOGY A. Project Advisory Committee In collaboration with the Alaska Primary Care and Rural Health Unit, ACRH developed an advisory committee to oversee this study. Membership was intended to cover the spectrum of rural health provider constituents, yet be small enough to convene and advise research staff throughout the project. Committee membership included:
• Alaska DHSS Primary Care and Rural Health Unit – Jean Findley, Facilitator; Pat Carr, Alice Rarig
• Alaska Department of Labor and Workforce Development – Brynn Keith • Alaska Mental Health Trust Authority – Bill Herman • Alaska Native Tribal Health Consortium – Tim Gilbert and Cindy Hamlin • Alaska Primary Care Association – Marilyn Kasmar and Pat Fedrick • Alaska State Hospital and Nursing Home Association – Randall Burns (ASHPIN)
This group convened four times throughout the project period. The first meeting was in December 2003 to discuss the project purpose and determine how Alaskans would use the information. In addition, committee members reviewed and edited a list of respondent agencies, offered to include letters of introduction in the survey mailing to their membership, and recommended pilot sites for the draft instrument. In February 2004, the Advisory Committee convened to review the survey instrument and planned survey packet, and to provide substantive feedback on the range of primary care providers included. Members also suggested data be collected in a manner comparable to select national studies. To this end, one member provided contact information and a report from a national project that looked at recruitment costs. In May 2004, the Advisory Committee convened to review collected data. Members provided input to additional analyses and made recommendations for data organization in the final document. A subset of the Advisory Committee reviewed a draft of the report in June 2004 and provided input for final revisions.
B. Survey development Survey instrument development involved a comprehensive process including a literature review, input from Alaska Department of Labor and Workforce Development, Research and Analysis Section (DoL) staff, and review from the Project Advisory Committee. First, ACRH conducted a literature review of electronic databases. A detailed description of the process and findings is included in the previous section of this report. From this review, ACRH developed a list of identified recruitment strategies which were incorporated into the draft telephone survey instrument. The Project Advisory Committee reviewed the second draft of the instrument and provided recommendations for its evolution. This committee also recommended pilot study sites.
16
The instrument was then tested on a pilot study group (see C. below). A debriefing meeting with the interview team was convened at the conclusion of each pilot interview, where the instrument was further revised. The instrument was finalized by ACRH staff after the final pilot interview session. The Alaska DOL evolved the final content into a user-friendly version for mailing. Though this was a telephone survey, respondents were mailed a written version so they could prepare for the interview. The DOL also recommended some minor content changes. A copy of the final survey is in Appendix C.
C. Pilot study The pilot study of the survey instrument and other interview logistics was conducted in late January 2004. Four organizations were selected and asked to volunteer their time to pilot the tol. Organizations were selected for the pilot based on their ability to contribute different perspectives because of their unique size, organizational structure, affiliation, and geographic location. The pilot study participants were:
• Norton Sound Health Corporation (Nome); • Dahl Memorial Clinic (Skagway) • Cross Road Medical Center (Glennallen); and • Valdez Regional Health Authority.
The biggest challenge to instrument design was ensuring that the survey questions were broadly applicable to all organizations, despite the diversity of organizational structures. The pilot interviews were especially useful in developing a survey tool broad enough to account for participant diversity. At the conclusion of each pilot interview, respondents were asked to give their honest feedback on both the interview session and the survey instrument. Specifically, the team probed for missing answer categories, questions that were awkward to answer, or questions that did not apply to the participant. Based on this feedback, as well as interviewer observations, substantial revisions were made to the survey instrument.
D. Respondents ACRH updated a 2002 database of rural providers provided by the Alaska Primary Care and Rural Health Unit, and added rural mental health centers. The revised version was distributed to members of the Project Advisory Committee for further input. Through this process, an attempt was made to include in the database of potential rural respondents all:
1. small hospitals; 2. rural health clinics and community health centers; and 3. rural mental health centers in Alaska.
The resulting list totaled 79 organizations. Respondents were medical directors, human resource directors, and other representatives of small hospitals, rural clinics, community health centers, and rural
17

mental health centers in Alaska. Interviewers asked to speak with individuals who were typically responsible for the oversight of their organization’s recruitment processes. E. Data Collection Following the final rewrite of the survey instrument in late January/early February 2004, data collection occurred February 16 – April 26, 2004. An ACRH research team of three individuals conducted all of the interviews. Having a small, commonly located data collection team better ensured consistency of data collection and team problem-solving when individual respondents brought up unforeseen challenges or interpretations to the interview questions. Each facility was continuously contacted up to the conclusion of the data collection date, unless they refused participation. A survey packet was sent to all respondent organizations. Efforts were made to identify the most appropriate packet recipient. In some cases, specific individuals could not be identified, and letters were addressed to the “Health Director” or “Hospital Administrator.” The packet included:
1) a letter explaining the purpose of the study and asking for participation; 2) a project background sheet; and 3) an actual hardcopy of the survey.
Depending on their relationship with the respondent, the Alaska Primary Care and Rural Health Unit, APCA, ANTHC, AMHTA, and ASHNHA each wrote and signed letters to their constituents. Respondents were then contacted by phone to ensure receipt of the survey packet, answer any questions about the project, and to schedule an interview. They were asked to review the hardcopy questionnaire prior to the interview, particularly questions pertaining to recruitment costs. In most cases, the call was followed up by an email with attachments of “soft copies” of previously mailed project information. An average of 11 ACRH-initiated telephone contacts were made before the telephone interview was completed. Many interviews were initially “partial complete” status, indicating that the respondent could not answer all questions in the survey, and needed additional time to look up the information being asked, or needed to consult with another person or department for the answers. These interviews had to be rescheduled for completion. Seventy-six (76) of the 79 organizations participated, resulting in a very successful response rate of 96%.
18

ANALYSIS & FINDINGS Telephone interview responses were initially recorded on hardcopy, and then entered into an MS Access database. The MS Access database was designed by Doucette Information Systems Management. Closed-ended data were analyzed using the Statistical Package for the Social Sciences (SPSS). ACRH initially ran simple frequencies, statistics (mean, median, and mode), and several cross- tabulations. In May 2004, the Project Advisory Committee reviewed the preliminary data analysis and recommended additional analyses and report structure changes. A. Study Participants ACRH interviewed human resource directors and other staff self-identified to be knowledgeable about their organizations’ recruitment practices and costs. Organizations qualified for interview if they were a health care facility outside of Anchorage, Juneau, or Fairbanks, and employed any of the following provider types: physicians, pharmacists, midlevels (PA, NP, ANP, CNM), nurses (RN generalist or specialist), dentists, dental hygienists, psychiatrists, psychologists, masters level therapists, or LCSWs. Only facilities that were directly involved in the recruitment of the providers listed above were surveyed. For example, if clinic X was a satellite site of clinic Z, only clinic Z was surveyed. Clinic Z was then asked to submit data regarding their entire operation, including staffing for their satellite clinics. Figure 3: Facility Type Breakdown of Study Participants
n=13Regional Tribal Health
Organization
n=16Independent Tribal Health
Organization
n=10Community Health Center
n=10Non-Tribal Hospital
n=8Private Rural Health Clinic
n=19Mental/Behavioral Health or
Substance Abuse
19

Non-tribal Hospitals (n=10): Non-tribal Hospitals in this report refer to rural Alaskan hospitals located outside of Anchorage, Fairbanks, and Juneau. Regional Tribal Health Organizations (n=13): This refers to tribal health organizations operating multiple clinics across multiple communities. This category encompasses tribally affiliated Community Health Centers, as Regional tribal health organizations recruited providers for these subregional and village clinics, as well as for their hospitals. Independent Tribal Health Organizations (n=16): These refer to the small, independently-operated tribal health organizations. These entities are single tribes running the operation of health for their individual village. Community Health Centers (n=10): The community health centers included in this category were non-tribally affiliated 330 clinics. Since tribal community health centers do not typically finance and recruit providers independent of their larger organization, they were considered “satellite clinics” of regional tribal health organizations. Private Rural Health Clinics (n=8): These refer to privately owned and operated clinics located in rural Alaska. Mental/Behavioral Health or Substance Abuse Facilities (n=19): These refer to mental health or substance abuse treatment facilities that operate independently, and recruit and employ their own providers. Data of behavioral health departments incorporated within larger organizations were collected from the larger organization. Figure 4: Regional Breakdown of Study Participants
n=35Southcentral
n=11Interior
n=19Southeast
n=4Southw est
n=4Northern
n=3Aleutian
20

B. Strategies Used to Recruit Providers Figure 5: Top 10 Most Common Strategies Used to Recruit Providers
72%
72%
79%
79%
79%
79%
80%
83%
91%
92%
0% 10% 20% 30% 40% 50% 60% 70% 80% 90% 100%
Emphasize time off/vacationperks
Emphasize community need
Use websites
Positive working environment
Emphasize good community
Conduct on-site visit
Newspaper ads
Introductions/spend time withstaff
Emphasize rural lifestyle
Word of mouth/networking
Figure 6: Onsite Visits
Onsite Visits % Conduct onsite visit 79% Arrange tour of community 76% Accommodation/travel arrangements 72% Introductions to community members 58% Arrange recreational activities* 51%
Invite family to onsite interview 45% Examples include fishing, boat ride, drive, potluck or other gatherings, etc. It was common practice for facilities to invite out-of-town (or out-of-state) candidates to the community for an “onsite visit,” as indicated by 79% of respondents. Families (particularly spouses) were often also invited. In most cases, the hosting facility made accommodation and travel arrangements for the candidate and arranged for meetings or introductions with community members. In many cases, a site visit also included recreational activities.
21
Though not a formal survey question, some respondents elaborated on their onsite visits. A handful of facilities arranged community-wide gatherings to welcome and meet the potential new employee. Some sites put concerted effort into this strategy, and went the extra mile to impress the new recruit. Others kept their onsite visits low-key. The following are open-ended comments on how some communities conducted their onsite visits:
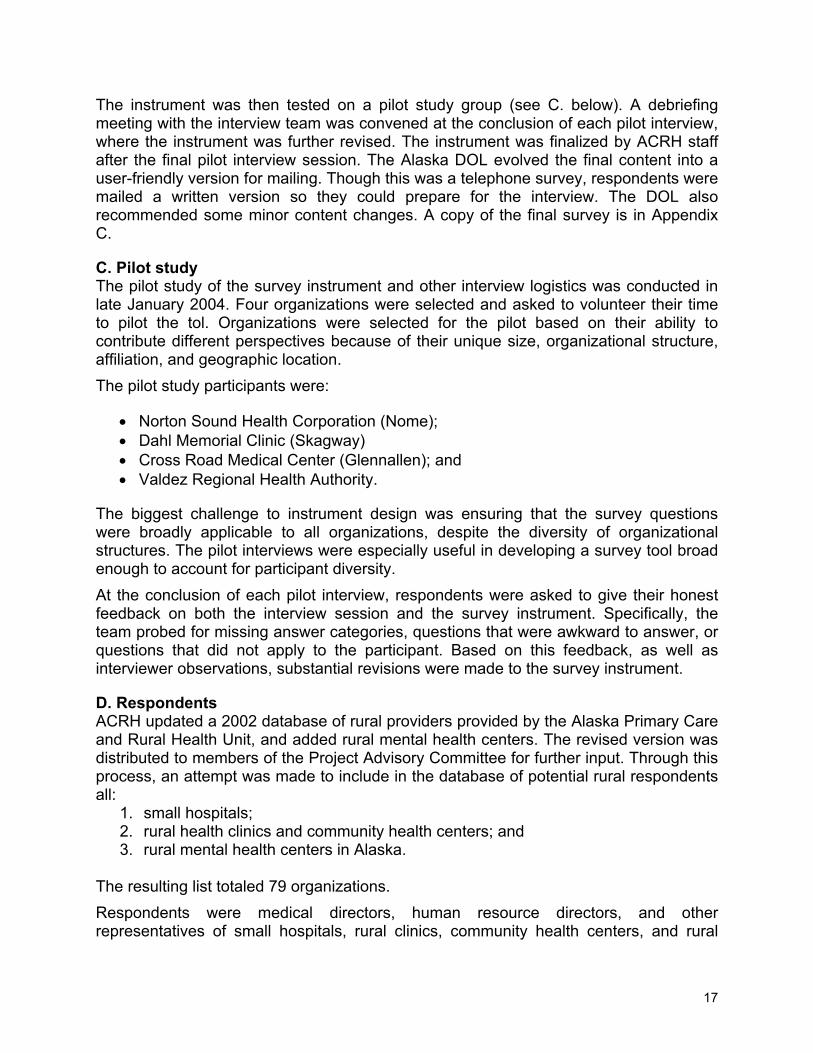
“Have put on a reception to meet more people in the community” “Pay for rental car, flowers in hotel, wine & dine them. Look for opportunities to build relationship. Meet principals, clergy if they are religious.” “Team candidates up with other people they might bond with.” Figure 7: Strategies Used To Market Vacant Positions
5%
15%
16%
24%
25%
29%
53%
79%
80%
92%
0% 10% 20% 30% 40% 50% 60% 70% 80% 90% 100%
Visa waiver program
Community involvement
Direct mail
Professional recruiting firm
Job fairs
ANTHC recruiting program
Journal ads
Use websites
Newspaper ads
Word of mouth/networking
The figure above compares the frequency of methods used to actively market an open position. Word of mouth and advertising in the newspaper appeared to be the most common methods. The majority of facilities also used websites, and many advertised in journals.
22

Figure 8. Job Marketing Strategies Used For Specific Professions Job Marketing Strategies Used For Specific Professions
Phy
sici
an
Pha
rmac
ist
Mid
leve
l
RN
Den
tist
Hyg
ieni
st
Psy
chia
trist
Clin
ical
P
sych
olog
ist
LCS
W
MLT
*n=36 n=16 n=47 n=39 n=16 n=12 n=12 n=13 n=31 n=41 Word of mouth/networking 86% 94% 98% 87% 100% 100% 83% 92% 97% 86% Journal ads 50% 75% 49% 49% 38% 25% 58% 62% 42% 33% Newspaper ads 50% 63% 70% 62% 69% 75% 67% 77% 81% 81% Other website 47% 50% 53% 46% 63% 50% 75% 69% 74% 60% Professional recruiting firm 42% 31% 9% 13% 19% 8% 25% 8% 10% 7% State of AK website** 36% 38% 45% 49% 31% 25% 50% 38% 55% 48% Direct mail 25% 19% 11% 10% 13% 8% 17% 15% 6% 2% Job fairs 22% 44% 17% 31% 19% 8% 17% 23% 26% 14% Community involvement 11% 6% 17% 8% 6% 8% 8% 8% 10% 5%
Visa waiver program 6% 6% 0% 3% 0% 0% 0% 0% 0% 0% * "n" denotes the number of facilities that employed the provider type listed. **No particular State of Alaska website was specified.
Different recruitment methods were used for different types of providers. Journal ads were most commonly used to recruit pharmacists (75%), clinical psychologists (62%), psychiatrists (58%), and physicians (50%). Newspaper advertising was used commonly across the board, but was used frequently in the recruitment of LCSWs (81%) and Masters Level Therapists (81%). Professional recruiting firms were used especially to recruit physicians (42%) and pharmacists (31%). Direct mail was used most often in the recruitment of physicians (25%).
23

C. Most Effective Recruitment Strategies Figure 9: Most Effective Recruitment Strategies
12%
3%
3%
3%
3%
3%
3%
3%
4%
4%
5%
5%
7%
7%
7%
8%
9%
11%
16%
26%
28%
0% 5% 10% 15% 20% 25% 30%
Other
Emphasize career potential
Emphasize need
Good follow-up w/ candidates
Job Fairs
Leave benefits
Recruiter
Well-equipped facility
Emphasizing loan repayment
Don't know/no answer
ANTHC
Journals
Good work environment
Onsite visit
Professional association
Temporary to full-time
Financial/benefit incentives
Emphasize quality of rural life
Newspapers
Word of mouth
Websites
*Categories above were created from verbatim responses to the open-ended question, “Which strategies have you found to be most effective for recruiting providers into your organization?” Websites Respondents were asked in an “open answer” format what recruitment methods were most effective. Websites and other internet resources were most commonly mentioned.
“Web advertising has been effective -- Job website we subscribe to.” “State of AK website [referring to DOL website] -- that’s where you look if you are interested in coming to AK.”
Word of Mouth Those who mentioned word of mouth as the best recruitment tool emphasized that it was a very important resource. Often, current staff were the best resource for recruiting other providers.
”Word of mouth -- when a provider is already working for us, we'll get them to recruit
24

people they know. Recently recruited an RN, who brought along people she knew looking for jobs.” “Word of mouth is key, tapping into who current employees know.”
Figure 10: Most Effective Strategies by Organization Type
Most Effective Strategies by Organization Type
All facilities
Non-tribal Hospital
Regional THO*
Independent THO* CHC
Private Clinic
Mental Health
(n=76) (n=10) (n=13) (n=16) (n=10) (n=8) (n=19) Websites 28% 30% 31% 19% 30% 25% 32% Word of mouth 26% 20% 23% 31% 30% 13% 32% Newspapers 16% 0% 8% 25% 40% 38% 16% Emphasizing quality of rural life 11% 0% 8% 6% 20% 0% 21% Financial/benefit incentives 9% 10% 31% 6% 0% 0% 5% Hiring temporary to full-time 8% 10% 0% 6% 10% 13% 11% Good work environment 7% 0% 8% 6% 10% 13% 5% Onsite visit 7% 0% 0% 25% 0% 0% 5% Professional association 7% 0% 15% 13% 0% 13% 0% ANTHC 5% 10% 15% 0% 0% 0% 5% Journals 5% 0% 0% 6% 20% 0% 5% Emphasizing loan repayment 4% 0% 0% 19% 0% 0% 0% Emphasizing career potential 3% 10% 0% 0% 10% 0% 0% Emphasizing need 3% 10% 0% 0% 10% 0% 0% Good follow-up w/ candidates 3% 0% 0% 0% 20% 0% 0% Job Fairs 3% 0% 0% 6% 0% 13% 0% Leave benefits 3% 10% 8% 0% 0% 0% 0% Recruiter 3% 10% 8% 0% 0% 0% 0% Well-equipped facility 3% 0% 15% 0% 0% 0% 0% Other 12% 20% 15% 13% 10% 25% 0% Don't know/no answer 4% 0% 8% 0% 0% 0% 11%
*Tribal Health Organization The table above describes how different organizations viewed what strategies were effective. Most facilities cited websites and word of mouth as their most effective recruitment strategies. Interestingly, smaller facilities, such as CHCs, Private Clinics, and Independent THOs were more likely to cite newspaper advertising as their most effective recruitment strategy.
25
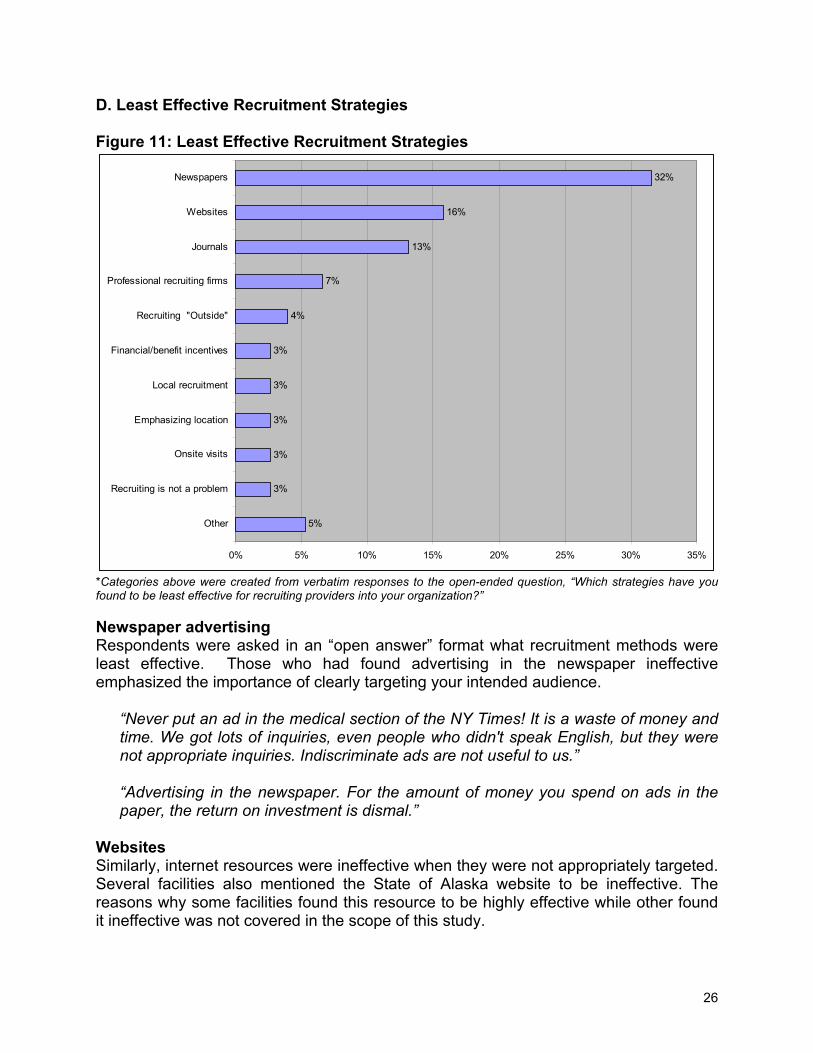
D. Least Effective Recruitment Strategies Figure 11: Least Effective Recruitment Strategies
5%
3%
3%
3%
3%
3%
4%
7%
13%
16%
32%
0% 5% 10% 15% 20% 25% 30% 35%
Other
Recruiting is not a problem
Onsite visits
Emphasizing location
Local recruitment
Financial/benefit incentives
Recruiting "Outside"
Professional recruiting firms
Journals
Websites
Newspapers
*Categories above were created from verbatim responses to the open-ended question, “Which strategies have you found to be least effective for recruiting providers into your organization?” Newspaper advertising Respondents were asked in an “open answer” format what recruitment methods were least effective. Those who had found advertising in the newspaper ineffective emphasized the importance of clearly targeting your intended audience.
“Never put an ad in the medical section of the NY Times! It is a waste of money and time. We got lots of inquiries, even people who didn't speak English, but they were not appropriate inquiries. Indiscriminate ads are not useful to us.” “Advertising in the newspaper. For the amount of money you spend on ads in the paper, the return on investment is dismal.”
Websites Similarly, internet resources were ineffective when they were not appropriately targeted. Several facilities also mentioned the State of Alaska website to be ineffective. The reasons why some facilities found this resource to be highly effective while other found it ineffective was not covered in the scope of this study.
26

“Previously used advertising chain (internet clearinghouse). We got a lot of possible candidates but they were not necessarily interested in working in [in this community].” “Website where they let you list all positions for $300 a year - nothing came of it.”
Figure 12: Least Effective Recruitment Strategies by Organization Type
Least Effective Strategies by Organization Type
All facilities
Non-tribal Hospital
Regional THO
Independent THO CHC
Private Clinic
Mental Health
(n=76) (n=10) (n=13) (n=16) (n=10) (n=8) (n=19) Newspapers 32% 50% 23% 25% 40% 13% 37% Websites 16% 0% 8% 19% 30% 13% 21% Journals 13% 40% 8% 13% 0% 13% 11% Professional recruiting firms 7% 0% 8% 6% 10% 0% 11% Recruiting "Outside" 4% 0% 8% 6% 0% 0% 5% Onsite visits 3% 0% 8% 0% 10% 0% 0% Emphasizing location 3% 0% 8% 0% 0% 0% 5% Local recruitment 3% 0% 0% 0% 0% 13% 5% Financial/benefit incentives 3% 0% 0% 0% 10% 13% 0% Recruiting is not a problem 3% 0% 0% 6% 0% 0% 5% Other 5% 10% 15% 6% 0% 0% 0% Don't know/no answer 24% 20% 23% 31% 20% 38% 16%
Regional tribal health organizations and non-tribal rural hospitals nearly all used newspapers in their recruitment mix. Yet newspaper advertising was commonly referred to as the least effective recruitment method for these organizations. Similarly, journals were also commonly used by hospitals, but it was also commonly identified as an inefficient recruitment tool. Additional research on the professions being recruited and the newspapers used for advertising, may clarify the apparent discrepancy in findings for newspaper and website effectiveness.
27
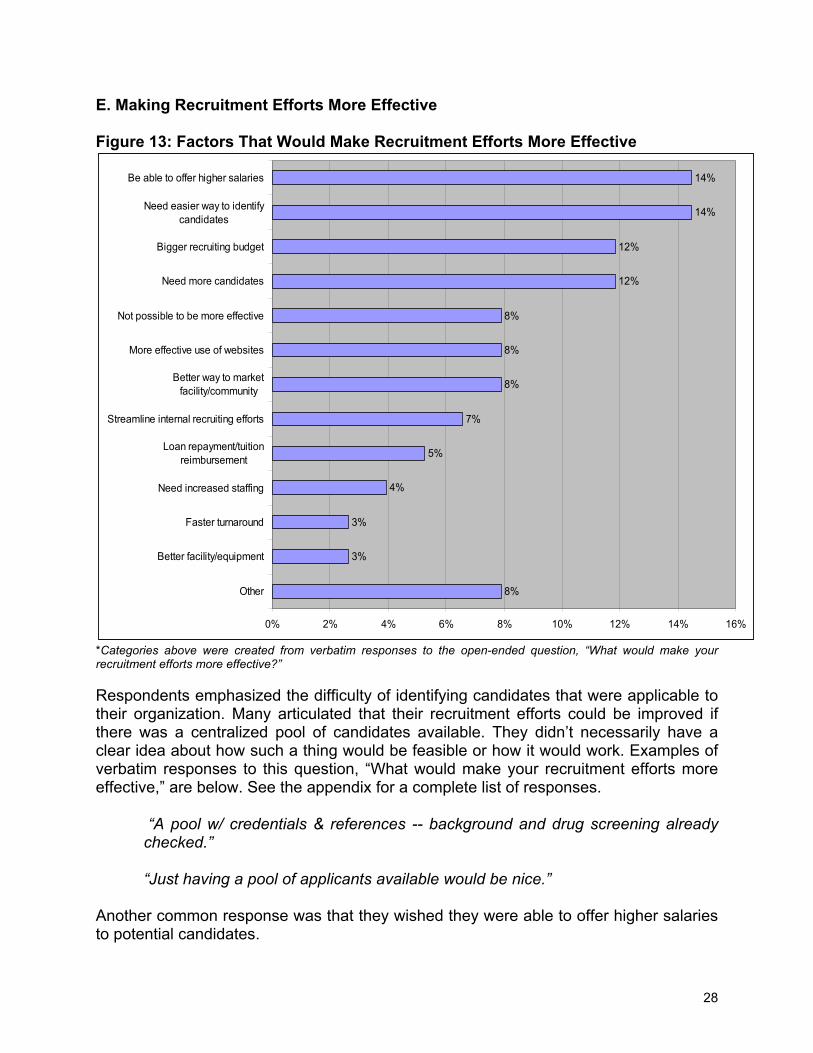
E. Making Recruitment Efforts More Effective Figure 13: Factors That Would Make Recruitment Efforts More Effective
8%
3%
3%
4%
5%
7%
8%
8%
8%
12%
12%
14%
14%
0% 2% 4% 6% 8% 10% 12% 14% 16%
Other
Better facility/equipment
Faster turnaround
Need increased staffing
Loan repayment/tuitionreimbursement
Streamline internal recruiting efforts
Better way to marketfacility/community
More effective use of websites
Not possible to be more effective
Need more candidates
Bigger recruiting budget
Need easier way to identifycandidates
Be able to offer higher salaries
*Categories above were created from verbatim responses to the open-ended question, “What would make your recruitment efforts more effective?” Respondents emphasized the difficulty of identifying candidates that were applicable to their organization. Many articulated that their recruitment efforts could be improved if there was a centralized pool of candidates available. They didn’t necessarily have a clear idea about how such a thing would be feasible or how it would work. Examples of verbatim responses to this question, “What would make your recruitment efforts more effective,” are below. See the appendix for a complete list of responses.
“A pool w/ credentials & references -- background and drug screening already checked.” “Just having a pool of applicants available would be nice.”
Another common response was that they wished they were able to offer higher salaries to potential candidates.
28
“More competitive salary given isolation and geographic location” “Having higher salaries to be competitive or a notch above the going rate”
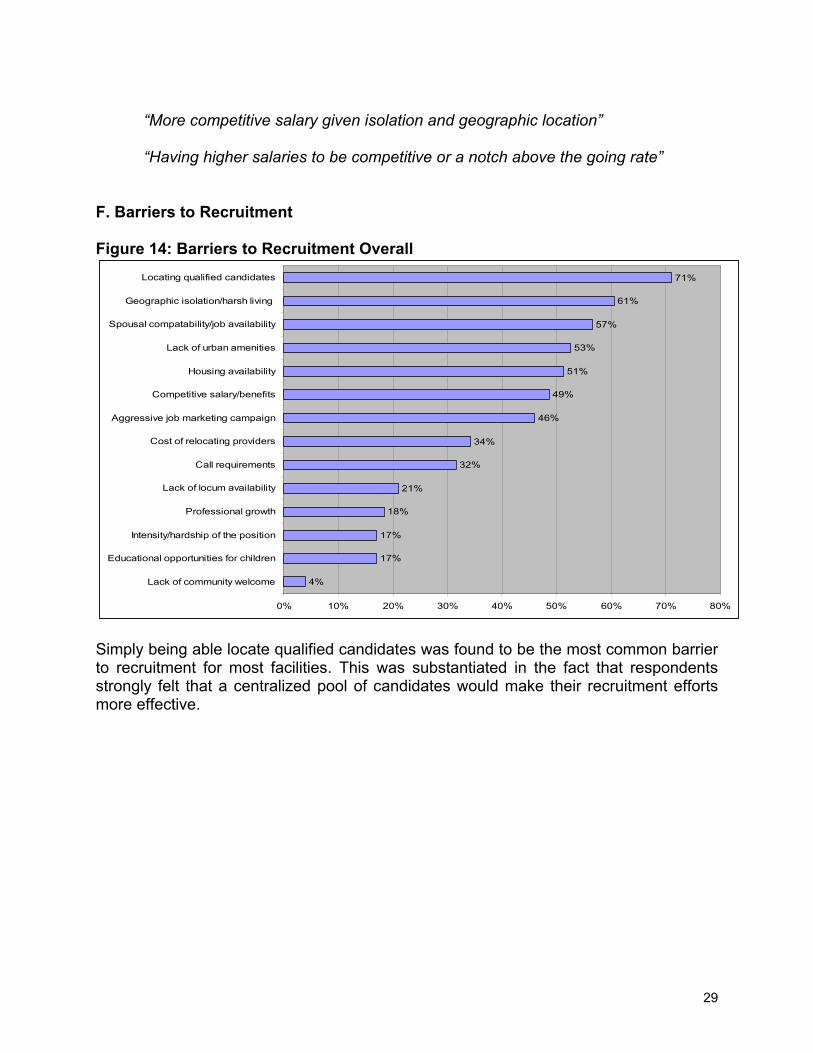
F. Barriers to Recruitment Figure 14: Barriers to Recruitment Overall
4%
17%
17%
18%
21%
32%
34%
46%
49%
51%
53%
57%
61%
71%
0% 10% 20% 30% 40% 50% 60% 70% 80%
Lack of community welcome
Educational opportunities for children
Intensity/hardship of the position
Professional growth
Lack of locum availability
Call requirements
Cost of relocating providers
Aggressive job marketing campaign
Competitive salary/benefits
Housing availability
Lack of urban amenities
Spousal compatability/job availability
Geographic isolation/harsh living
Locating qualified candidates
Simply being able locate qualified candidates was found to be the most common barrier to recruitment for most facilities. This was substantiated in the fact that respondents strongly felt that a centralized pool of candidates would make their recruitment efforts more effective.
29

Figure 15: Biggest Barrier to Recruitment
Geographic issues, 29%
Locating qualified candidates, 24%
Internal financial Issues, 22%
High cost of living, 5%
Uncertainty about future of org., 5%
Spousal compatibility/job availability, 5%
Housing, 4%
Other, 11%
Respondents were also asked to identify the biggest barrier to recruitment. As shown in the graph above, when probed about their biggest barrier, geographic isolation issues topped the list. Factors associated with rural life, such as geographic isolation, lack of urban amenities, housing availability were other commonly mentioned “biggest barriers.”
30

Figure 16: Other Barriers to Recruitment
4%
3%
4%
4%
5%
7%
8%
9%
16%
0% 2% 4% 6% 8% 10% 12% 14% 16% 18%
Other
Lack of Internal Capacity to Recruit
Uncertainty About Future of Org.
Emphasized Locum Availability
State Funding/Infrastructure Issues
Emphasized Internal Financial Issues
High Cost of Living
General Shortage Problems
Emphasized Geographic Issues
Respondents had the opportunity to tell interviewers “other issues” not listed on the survey that were barriers to recruitment. Many re-emphasized difficulty recruiting due to geographic and isolation issues. Other issues included general provider shortage problems, the high cost of living in rural areas, and internal financial issues that made recruitment difficult.
31

G. Cost of Recruitment Sites surveyed spent over $12 million in the last year on the combined recruitment of the following professions: physicians, pharmacists, midlevels, nurses, dentists, hygienists, psychiatrists, clinical psychologists, masters-level therapists, and LCSWs. Due to reporting limitations, almost $7,000,000 could not be included in this figure. Figure 17: Breakdown of Recruitment Costs by Organization Type
Breakdown of Recruitment Costs by Organization Type
Total Non-tribal Hospital
Regional THO
Independent THO CHC
Private Clinic
Mental Health
Recruiting firms $588,164 $50,000 $472,864 $0 $0 $65,000 $300 Advertising $301,534 $66,200 $177,350 $17,578 $7,356 $1,150 $31,900 Recruitment related staff travel $55,681 $0 $48,181 $0 $0 $0 $7,500 Travel/accommodations for on-site interview $240,070 $20,100 $135,338 $30,412 $17,905 $1,500 $34,815 Moving expenses (inc. travel) $792,156 $113,860 $496,742 $66,754 $26,300 $44,000 $44,500 Cost of locums $4,944,266 $968,657 $3,429,959 $154,050 $126,000 $91,000 $174,600 Training and orientation $258,134 $24,100 $170,830 $8,180 $11,666 $5,300 $38,058 Other costs* $1,265,818 $150,200 $1,043,473 $19,400 $0 $37,800 $14,945 Staff time costs $3,604,870 $718,268 $2,263,871 $98,860 $250,691 $24,400 $248,780 Total $12,050,693 $2,111,385 $8,238,608 $395,234 $439,918 $270,150 $595,398
* Other costs include: background checks, consulting fees, licensure fees, legal fees, contract buyouts, salary guarantees, website management, membership organization fees, and other miscellaneous costs. The table above lists the breakdown of recruitment costs for each type of organization surveyed. Regional tribal health organizations are larger and recruit more providers. Thus, their recruitment expenses are shown here to be considerably higher than other facility types. Figure 18a: Breakdown of Recruitment Costs by Provider Type
Breakdown of Recruitment Costs by Provider Type Total Physician Pharmacist Midlevel Registered Nurse
Recruiting firms $588,164 $102,447 $82,447 $78,394 $74,894 Advertising $301,534 $20,309 $40,032 $37,883 $135,505 Recruitment related staff travel $55,681 $2,500 $3,330 $7,330 $22,770
Travel/accommodations for on-site interview $240,070 $96,167 $18,000 $44,125 $32,963 Moving expenses (inc. travel) $792,156 $191,814 $72,411 $152,880 $226,838 Cost of locums $4,944,266 $871,423 $256,808 $794,664 $2,375,480 Training and orientation $258,134 $31,522 $43,888 $44,819 $66,658 Other costs* $1,265,818 $411,626 $550 $18,334 $777,687 Staff time $3,604,870 $631,842 $313,052 $528,240 $1,353,588
Total $12,050,693 $2,359,650 $830,518 $1,706,669 $5,066,383
32
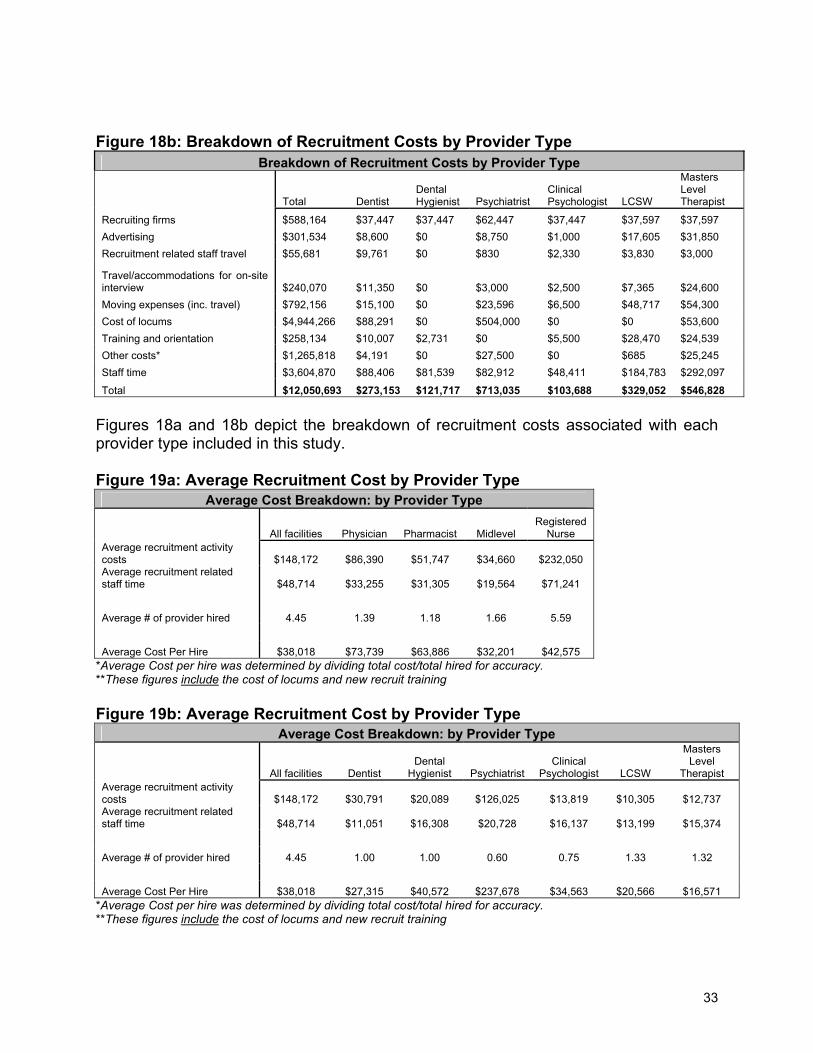
Figure 18b: Breakdown of Recruitment Costs by Provider Type
Breakdown of Recruitment Costs by Provider Type
Total Dentist Dental Hygienist Psychiatrist
Clinical Psychologist LCSW
Masters Level Therapist
Recruiting firms $588,164 $37,447 $37,447 $62,447 $37,447 $37,597 $37,597 Advertising $301,534 $8,600 $0 $8,750 $1,000 $17,605 $31,850 Recruitment related staff travel $55,681 $9,761 $0 $830 $2,330 $3,830 $3,000
Travel/accommodations for on-site interview $240,070 $11,350 $0 $3,000 $2,500 $7,365 $24,600 Moving expenses (inc. travel) $792,156 $15,100 $0 $23,596 $6,500 $48,717 $54,300 Cost of locums $4,944,266 $88,291 $0 $504,000 $0 $0 $53,600 Training and orientation $258,134 $10,007 $2,731 $0 $5,500 $28,470 $24,539 Other costs* $1,265,818 $4,191 $0 $27,500 $0 $685 $25,245 Staff time $3,604,870 $88,406 $81,539 $82,912 $48,411 $184,783 $292,097
Total $12,050,693 $273,153 $121,717 $713,035 $103,688 $329,052 $546,828 Figures 18a and 18b depict the breakdown of recruitment costs associated with each provider type included in this study. Figure 19a: Average Recruitment Cost by Provider Type
Average Cost Breakdown: by Provider Type
All facilities Physician Pharmacist Midlevel Registered
Nurse Average recruitment activity costs $148,172 $86,390 $51,747 $34,660 $232,050 Average recruitment related staff time $48,714 $33,255 $31,305 $19,564 $71,241 Average # of provider hired 4.45 1.39 1.18 1.66 5.59 Average Cost Per Hire $38,018 $73,739 $63,886 $32,201 $42,575
*Average Cost per hire was determined by dividing total cost/total hired for accuracy. **These figures include the cost of locums and new recruit training Figure 19b: Average Recruitment Cost by Provider Type
Average Cost Breakdown: by Provider Type
All facilities Dentist Dental
Hygienist Psychiatrist Clinical
Psychologist LCSW
Masters Level
Therapist Average recruitment activity costs $148,172 $30,791 $20,089 $126,025 $13,819 $10,305 $12,737 Average recruitment related staff time $48,714 $11,051 $16,308 $20,728 $16,137 $13,199 $15,374 Average # of provider hired 4.45 1.00 1.00 0.60 0.75 1.33 1.32 Average Cost Per Hire $38,018 $27,315 $40,572 $237,678 $34,563 $20,566 $16,571
*Average Cost per hire was determined by dividing total cost/total hired for accuracy. **These figures include the cost of locums and new recruit training
33

Figures 19a and 19b depict the average number of each provider type hired and average cost per hire, for facilities recruiting that specific provider. For example, facilities that looked for new physicians in the past year, hired 1.39 of them on average, and it cost an average of $73,700 per successful hire. The cost of hiring a psychiatrist was found to be disproportionately high. Much of the expense was due to the high cost of temporary psychiatrists filling in for vacancies. Without this cost, the average cost per hire was closer to $70,000. Also note that only 6 Psychiatrists were recruited, and only 3 were hired. As a percentage of recruitment efforts to successful hire, this is considerably lower than other provider types. The data presented in the remainder of this section compares the cost of recruitment in Alaska with a study titled, “2003 Recruiting Metrics and Performance Benchmark Report” conducted by Staffing.org1. Staffing.org is an independent nonprofit corporation and leading proponent and provider of standard human resources performance metrics. Cost-Per-Hire data is a commonly used method of reviewing recruitment costs among organizations. The major limitation of this method is that Cost-Per-Hire data is not comparable among different locations, industries, and job levels since staffing costs vary widely depending on these different factors. The Cost-Per-Hire equation is
Total staffing costs Total # of hires
The average Cost-Per-Hire for all rural Alaskan providers included in this study was $38,000.
*This figure include the cost of locums and new recruit training Comparison data with the continental U.S. are only available for hospitals and clinics. For this reason, Figure 20 only shows data for Alaskan hospitals and clinics. Figure 20: Cost Per Hire
Cost Per Hire: Alaska Versus Continental U.S.
Rural Alaska Hospitals
Continental U.S. (staffing.org study)
All Other Rural Alaska Facilities
(Clinics, Mental Health
Centers)
Continental U.S. Clinics (Nursing and Specialty
Services) (staffing.org study)
Total cost* $1,700,245 308,314,688 $5,406,182 $20,944,949 Total hires 87 70,753 198 5789 Cost Per Hire $19,543 $4,358 $27,304 $3,618
*These figures excludes the cost of locums and new recruit training
1 www.staffing.org
34

Data in Figure 20 suggest that Alaska spends considerably more per health professional hired than facilities in the continental U.S.. Additional clarification on two factors is necessary. First, respondents in the staffing.org study are a mix of urban and rural facilities. In fact, in a phone call with the agency, they suggested a disproportionate volume of respondents are located in Chicago. The sheer number of health professions schools in greater Chicago and other urban centers is likely to reduce their recruitment effort. Secondly, respondents in the staffing.org study self-selected. Thus organizations that knew they spent a great deal of resources on recruitment were less likely to participate, effectively deflating the overall numbers. Nevertheless, rural Alaskan health facilities often compete with these continental U.S. agencies to recruit health professionals. The data suggest that facilities outside Alaska invest less in the process, retaining more internal resources for other purposes. Cost of recruitment in this report is also gauged using the Recruiting Efficiency Index, developed by Staffing.org and the Human Capital Metric Consortium. The Recruiting Efficiency Index takes differences of geography, industry and job level into account by using compensation of recruits, instead of total number of recruits. This method assumes that compensation of hires is greater in labor markets with higher cost of living as well as for positions that are more difficult to fill. The Recruiting Efficiency Index equation is:
Total staffing costs Total Compensation Recruited
Figure 21: Recruiting Efficiency Index (REI)
Recruiting Efficiency Index: Alaska Continental U.S.
Rural Alaska Hospitals
Continental U.S. Hospitals
(staffing.org study)
All Other Rural Alaska Facilities
(Clinics, Mental Health
Centers)
Continental U.S. Clinics (Nursing and Specialty
Services) (staffing.org study)
Total cost* $1,700,245 308,314,688 $5,406,182 $20,944,949 Total compensation $5,635,660 $2,390,036,340 $14,723,863 $222,818,610 REI 30% 13% 37% 9%
With the Recruiting Efficiency index, the lower the index, the more “efficient” the recruiting processes. Findings for the REI correspond with the cost-per-hire data. The REI for rural Alaska hospitals was more than double the index for hospitals in the continental U.S. In other words, rural Alaska hospitals experienced double the difficulties of recruitment of continental U.S. hospitals. The REI for Alaskan clinics and other services were more than quadruple that of the continental U.S. This suggests that rural Alaskan facilities face more difficulties in recruitment and must invest more in the process.
35

What do these figures really include? Regardless of the way in which these costs are depicted, the business of recruiting providers in Rural Alaska is staggeringly expensive. It is important to note that these figures presented here are limited in the following ways: • Rural Alaska is staffed with many more provider types than is covered in this report.
The figures in this study represent the recruitment costs of these provider types only: physicians, midlevel providers (PA/NP/CNM), RNs, pharmacists, dentists, dental hygienists, psychiatrists, psychologists, masters-level therapists, and LCSWs. Thus, support staff, non-clinical management staff, paraprofessionals, and many, many other positions critical to the function of rural health facilities are not included.
• The cost data is an underestimate of true costs, as it was collected only when facilities could directly attribute costs to the provider types described above. For example, if a rural hospital reported to have spent $150,000 in advertising for all positions within the last year, but could not break the cost down to specific providers, this information was not included in the final analysis. Almost 7 million dollars reported could not be directly attributed to the category of providers featured in this study.
• One study in the literature review noted, "80% of corporate America does not track recruiting costs, and most do not keep records of cost, length of time per hire, acceptance ratios, and other measures to help organizations understand the price of recruiting” (Jossi). Similarly, a large percentage of Alaskan health facilities did not systematically track recruitment costs. These facilities were asked to make an estimate based on their typical recruitment practices.
36

H. Outcome of This Study Figure 22: Desired Outcome of This Study
16%
11%
3%
3%
4%
4%
4%
5%
8%
11%
13%
13%
25%
0% 5% 10% 15% 20% 25% 30%
Don't know/no answer
Other
Loan repayment program eligibility
Shift emphasis to retention issues
Increased State/Medicare-Medicaid funding
More in-state health training programs
Recruitment assistance (non-financial)
Want salary data
Information on good recruiting practices
Collaboration
Statewide clearinghouse of job seekers
Increased awareness of recruitment challenges
Access to study data
Respondents were asked in an open-ended format, “What would you like to see happen as a result of this study.” One-fourth of the respondents asked for access to the study results. Many also remarked that they would like state and federal government to become more aware of the enormity of the challenges they face in recruiting health care providers. Many respondents remarked that they would like to have access to a pool or clearinghouse of potential job candidates, and many others wanted to see increased collaboration towards recruitment. The following are verbatim responses to illustrate the data. See Appendix B for a complete list of verbatim responses. Access to study data
“I'd like the data. How much is it running everyone else? I'd like it on a website. MGMA doesn't do it for rural.”
Statewide Clearinghouse of job seekers
“I would like to see a pool for potential locums or applicants. We're very lucky to be able to use ANTHC, but would like to see other lists generated.”
37

“A site set up where people could see a database showing people who are looking for work and those looking to hire. Would like to see a statewide clearinghouse, so everyone has access to the same applicants. “ “A pool of candidates available on an as-needed basis with all credentials checked and verified -- background and drug screening already checked and a flexible collaborative agreement in place for P.A.s.”
Increased Awareness of recruitment challenges
“Filter to legislator and influential people to see how hard it is to get doctors and psychiatrists. To identify some of the problems in the health care industry so that the general public develops a better understanding of the present situation.”
Collaboration
“Partnering together to find qualified staff.” “Sharing of ideas and information.”
Figure 23: Interest in Collaboration
Yes, 61%
Maybe, 16%
No, 7%
Already doing it, 7%
Don't know/no answer, 17%
Most respondents were interested in collaborating with other organizations to recruit providers. Those that answered “Maybe” (16%) or “No” (7%) were cautious about losing
38
potential candidates to collaborative partners. The following verbatim comments describe the various sentiments regarding collaboration.
Absolutely, if there was a way to spread out this pain. I call it pain, because it is painful to recruit for a midlevel. Locums are expensive and don't work well with the community. In spirit - yes, but in practice we don't want to compete with others (small rural providers) Probably not, as competition is an issue. Afraid if we are sharing providers, we will lose out to bigger organizations.
39

DISCUSSION AND RECOMMENDATIONS Recruitment of health professionals is an enormous issue in Alaska, the United States, and abroad. A review of this project’s open and closed question responses, beside a review of the literature, provides relevant insights to rural Alaska’s recruitment process and how it compares to the rest of the country and elsewhere. A. Barriers to Recruitment Before addressing recruitment strategies, it is important to address the question, “What makes recruitment difficult for rural Alaskan facilities?” This study confirmed two major factors posing a barrier to recruitment in rural Alaska. First of all, the dearth of qualified candidates available to fill positions made recruitment extremely difficult. Working in rural Alaska requires a unique skill set. Strong clinical skills are often required, as an individual must have the capacity to work in an unpredictable environment, often with no direct supervision, no colleagues for support, and no specialists to refer special cases. For these reasons, many rural facilities are unable to fill positions with new recruits, making it even more difficult to locate potential employees. Secondly, geographic isolation made recruitment very difficult for rural Alaskan facilities. Housing issues, personal and professional isolation, spousal compatibility, lack of urban amenities are all related to the difficulties of attracting workers to remote locations. B. Recruitment Strategies In many cases, rural Alaskan hospitals, community health centers, clinics, and mental health facilities reported using recruitment strategies that correspond with recommendations from the literature. According to the literature, some of the issues affecting a provider’s decision to practice in a rural location include: proximity to recreation; proximity to family; rural lifestyle; professional autonomy; influence of spouse; and financial compensation. In this study, 91% of respondents emphasize the “rural lifestyle”, 79% emphasize the “good community” and 72% emphasize “time off/vacation perks.” In fact, emphasizing the “quality of rural life” was the rated the 4th most effective recruitment strategy, followed immediately by “financial/benefit incentives”. This suggests that rural Alaskan facilities are employing strategies that are well-regarded in the literature. The literature also emphasized the need to include the needs of the entire family in recruitment efforts. Spousal employment and schools for children are a significant factor in recruitment and retention. Respondents echoed this finding. Spousal compatibility/job availability was the 3rd most frequently mentioned barrier to recruitment (57%) and the 4th biggest barrier to recruitment (5%). As demonstrated in the closed question responses, “word of mouth” is the most common, and one of the most effective, recruitment strategies. 92% of respondents reported use of this method. Interestingly, it is not frequently mentioned in the literature. Respondents’ use and reported efficacy of websites and newspapers for recruitment displayed some apparent contradictions. Websites (28%) were listed as the single most
40

effective recruitment strategy, followed by “word of mouth” (26%) and newspapers (16%). However, newspapers were also listed as the least effective recruitment strategy (32%), followed by websites (16%). An analysis of respondents by organization type did not elucidate the cause for this apparent discrepancy. An analysis by written responses provides a glimpse of a possible underlying reason. Advertising in national newspapers and internet clearinghouses were found to be ineffective. Respondents may have received a high volume of inquiries from these advertising venues, but candidates were largely inappropriate. A qualitative methodology, such as a focus group regarding successful and unsuccessful advertising techniques would help clarify this issue. Extrapolation from open ended comments can help us understand how advertising can be more effective. Advertising on websites and in newspapers that attract providers with a rural orientation could be a far more useful investment of resources. Respondents repeatedly emphasized the need for employing recruitment tools that targeted the intended audience. Also, “more effective use of websites” to make recruitment efforts more effective, was spontaneously suggested by 8% of respondents. C. Recruitment Costs This study confirmed what many have hypothesized – that it is costly to recruit primary providers in rural Alaska. As shown in the Appendix, on average, rural Alaska invests approximately $38,000 for each successful primary care hire. Rural Alaska’s cost-per-hire data was significantly higher than data collected by staffing.org, despite including the same variables in the calculation. As Cost-per-hire numbers vary considerably for different markets, regions, and jobs, this study also examined recruitment cost in terms of a Recruitment Efficiency Index, developed by staffing.org. Even then, recruitment was shown to be double the difficulty of recruitment of providers in the contiguous U.S. Similarly, rural Alaska’s recruitment costs are considerably higher than data in the literature. Contino and Buchbinder’s estimates of provider turnover may seem comparable ($33,000 for nurses and $264,000 for general/family practice physicians, respectively) but it encompassed an array of turnover and replacement costs not included in this study. D. Collaborations Of the 76 organizations that participated in this study, 17 currently reported some level of partnering with other organizations in recruitment efforts. Of the 76 participating organizations, 46 (61%) responded positively to an inquiry for further collaboration and another 12 (16%) said “maybe”. Respondents’ biggest concern with collaboration was the fear of losing potential employees to partners. As one respondent stated, “When there is a global pool, rural Alaska loses.” Respondents were evenly distributed across the state, organization type and organization size. This suggests that 61-77% of respondent organizations are interested in some level of collaboration to improve recruitment. The types of collaboration were not specifically discussed. However, suggestions can be found in the reported “desired outcomes” of this study. The most frequently
41
requested outcomes are a “statewide clearinghouse of job seekers” and “increased awareness of recruitment challenges”, followed by “collaboration”. Collaborating towards development of a statewide clearinghouse of job seekers could eliminate many of the recruitment barriers mentioned in the study and addressed the reported factors that would make recruitment efforts more effective. Specifically, the most frequently cited barrier to recruitment was “locating qualified applicants” (71%), and was also the second biggest barrier to recruitment (24%). Of the 15 reported factors that would make recruitment efforts more effective, the second factor was “need easier way to identify candidates” (14%) and the fourth factor was “need more candidates” (12%). Clearly, developing a common pool of candidates, in a clearinghouse mechanism, would address the largest reported recruiting barriers and respond to the ideas suggested by respondents. E. Recommendations Recommendations from surveyed rural health care employers included the belief that their organizations would benefit from:
1. Using newspapers and websites that target providers interested in rural and underserved employment.
2. Investing more effort in identifying appropriate advertising venues that elicit more appropriate position respondents;
3. Analyzing their recruitment strategies and comparing them to those strategies identified as most effective; and
4. Analyzing what they spend on recruitment in comparison to other entities and whether these expenditures were invested in the most effective recruitment strategies. If they are not, they should be clear about why strategies were employed at each facility.
5. Coordinating the formation of a statewide clearinghouse for recruitment. The collaborative would facilitate identification of appropriate candidates and possibly provide background screening. It could be web-based, and link to websites of participating organizations, thus facilitating the flow of information about different organizations and their communities. As a result, internal recruitment efforts could be stream-lined and, hopefully, result in faster turnaround for facilities in need.
42

43
APPENDIX A-D in separate document