status of philippine seafoods export in comparison with other asean communities with focus on...
TRANSCRIPT

Status of Philippine Seafoods Export in Comparison with Other ASEAN Communities
With Focus on Shrimp, Crab & Tuna
Nelson BasconesPresident, Philexport Cebu
Part 1:Shrimps Export

Philippine Shrimp Export Quantity(For all shrimp species and all forms)
Top 5 Countries
2010 2011 2012 2013 2014
Tons
Japan 7,066 6,984 4,330 2,420 3,568
USA 1,470 1,364 579 1,809 2,817
Korea 414 356 131 423 1,311Taipei, Chinese 1,477 666 262 33 621
UAE 130 139 191 0 294TOTAL WORLD 12,085 10,715 6,538 4,685 9,631
Sources: ITC calculations based on UN COMTRADE statistics.
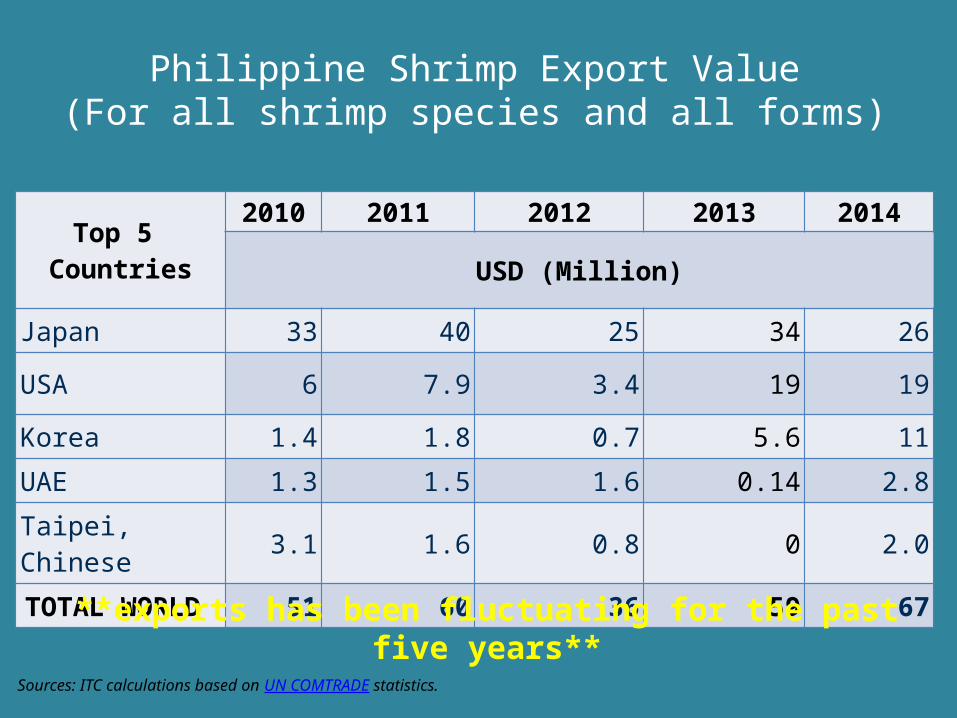
Philippine Shrimp Export Value(For all shrimp species and all forms)
Top 5 Countries
2010 2011 2012 2013 2014
USD (Million)
Japan 33 40 25 34 26
USA 6 7.9 3.4 19 19
Korea 1.4 1.8 0.7 5.6 11
UAE 1.3 1.5 1.6 0.14 2.8
Taipei, Chinese 3.1 1.6 0.8 0 2.0
TOTAL WORLD 51 60 36 59 67
**exports has been fluctuating for the past five years**
Sources: ITC calculations based on UN COMTRADE statistics.

Case in Point 1: Japan Shrimp Imports from ASEAN Communities
ASEANCountries
2010 2011 2012 2013 2014
USD (Million)
Viet Nam 411 402 402 436 449
Indonesia 347 382 376 412 357
Thailand 300 352 339 215 141
Myanmar 46 52 59 65 63
Malaysia 52 76 63 47 39
Philippines 41 42 36 34 34
**imports from the Philippines is very low**
Sources: ITC calculations based on UN COMTRADE statistics.

Case in Point 2: USA Shrimp Imports from ASEAN Communities
ASEANCountries
2010 2011 2012 2013 2014
USD (Million)
Indonesia 440 613 586 791 1,126
Vietnam 418 385 350 485 683
Thailand 944 1,000 714 481 373
Malaysia 145 201 168 78 176
Philippines 6.2 6.5 4.3 19.5 26.4
Myanmar 0 0 0 4.3 11.7
**imports from the Philippines is very low**But the volume is increasing since 2013 and expected to increase further in 2015 onwards as more farmers
are growing shrimps.Sources: ITC calculations based on UN COMTRADE statistics.

Imports (Tons) 2012 2013 2014 2015Thailand 136,376 84,324 64,713 21,815India 65,732 94,408 108,716 35,048Indonesia 74,232 81,268 103,592 39,705Ecuador 81,678 74,682 92,694 29,970Vietnam 41,248 59,886 73,753 16,246China (mainland) 35,738 32,572 32,614 8,614Mexico 26,489 18,525 20,277 7,793Malaysia 23,524 10,307 17,951 5,636Peru 8,401 9,014 11,803 3,501Guyana 8,998 8,752 6,697 3,254Honduras 9,140 8,550 8,011 1,302Panama 3,192 4,812 4,118 779Nicaragua 4,687 3,209 2,746 405Bangladesh 2,704 3,576 1,495 1,075Venezuela 2,640 2,071 3,431 655Argentina 686 1,730 4,504 1,450Guatemala 2,603 2,378 2,260 1,047Philippines 1,244 2,473 2,908 690
Case in Point 3: USA Vannamei Shrimp Imports (HLSO, P&D)
SOURCE: Urner Barry Publications and U.S. Department of Commerce and Census BureauCreated on: 6/15/2015 9:12:34 AM

Part 2: Crabs Export
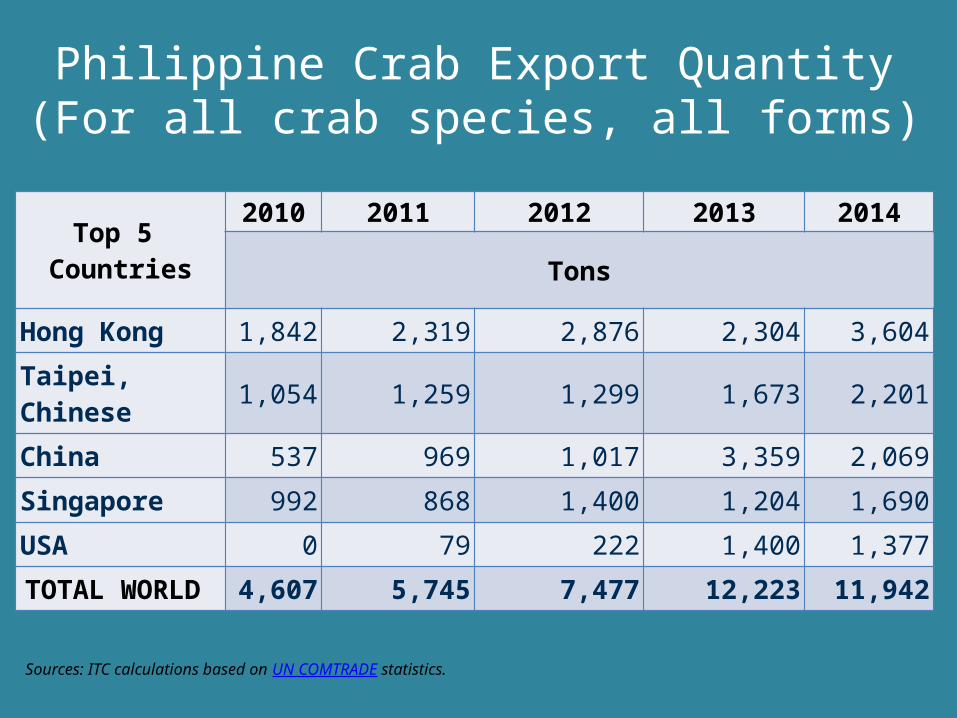
Philippine Crab Export Quantity(For all crab species, all forms)
Top 5 Countries
2010 2011 2012 2013 2014
Tons
Hong Kong 1,842 2,319 2,876 2,304 3,604
Taipei, Chinese 1,054 1,259 1,299 1,673 2,201
China 537 969 1,017 3,359 2,069
Singapore 992 868 1,400 1,204 1,690
USA 0 79 222 1,400 1,377
TOTAL WORLD 4,607 5,745 7,477 12,223 11,942
Sources: ITC calculations based on UN COMTRADE statistics.

Philippine Crab Export Value
Top 5 Countries
2010 2011 2012 2013 2014
USD (Million)
USA 0 0.3 1.7 9.3 19.7
Hong Kong 8.8 11.4 13.4 11.6 17.2
China 3.0 4.6 4.6 9.4 11.2
Taipei, Chinese 4.4 5.4 6.6 8.1 10.8
Singapore 5.0 4.2 6.7 6.0 8.3
TOTAL WORLD 22 27 37 50 71
**exports has been increasing for the past five years**
Sources: ITC calculations based on UN COMTRADE statistics.

Case in Point 4: USA Crab Imports from ASEAN Communities
**imports from the Philippines is very low**
Sources: ITC calculations based on UN COMTRADE statistics.
ASEAN Countries2010 2011 2012 2013 2014
USD (Millions)Viet Nam 14 19 19 15 164Singapore 52 61 61 62 67Indonesia 13 38 42 51 45Malaysia 17 18 23 23 24Thailand 11 12 13 12 17Brunei Darussalam 1.4 1.9 1.7 2.4 1.7Myanmar 0 0.003 0.006 0.003 0.5Philippines 0.393 0.234 0.146 0.181 0.389Cambodia 0.014 0.018 0 0 0.031ASEAN 111 151 162 168 322
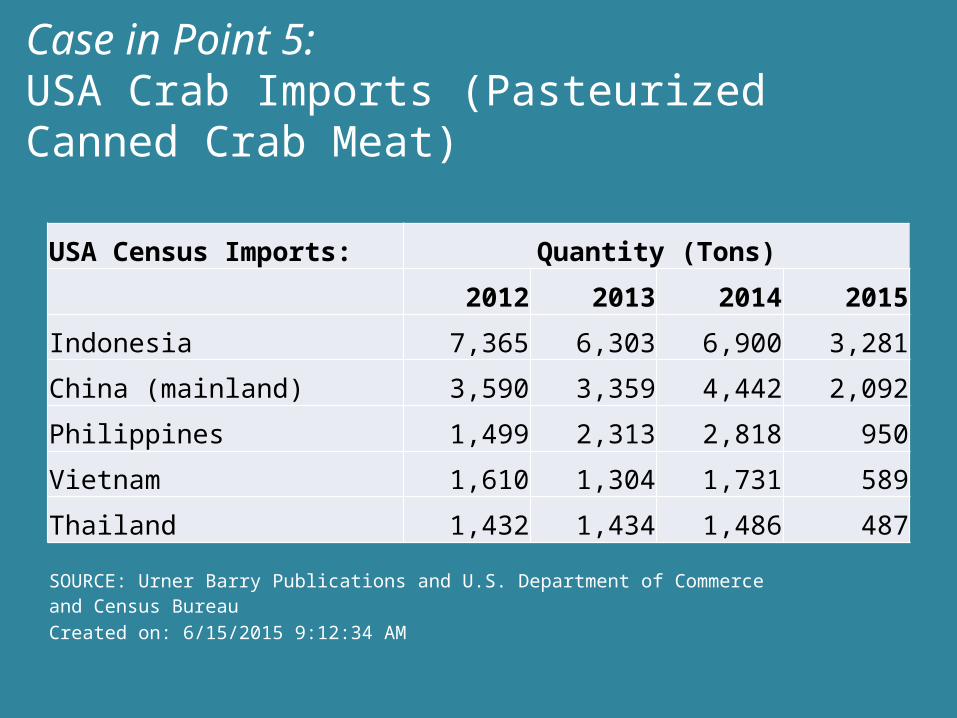
USA Census Imports: Quantity (Tons)
2012 2013 2014 2015
Indonesia 7,365 6,303 6,900 3,281
China (mainland) 3,590 3,359 4,442 2,092
Philippines 1,499 2,313 2,818 950
Vietnam 1,610 1,304 1,731 589
Thailand 1,432 1,434 1,486 487
Case in Point 5: USA Crab Imports (Pasteurized Canned Crab Meat)
SOURCE: Urner Barry Publications and U.S. Department of Commerce and Census BureauCreated on: 6/15/2015 9:12:34 AM

Part 3: Tuna Export
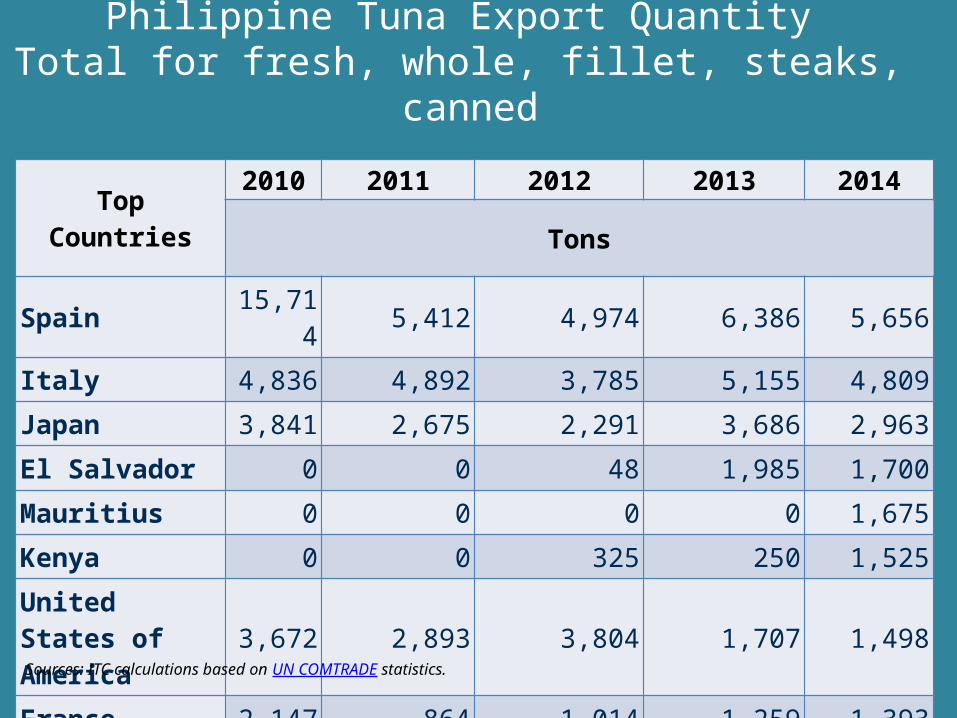
Philippine Tuna Export QuantityTotal for fresh, whole, fillet, steaks,
cannedTop
Countries
2010 2011 2012 2013 2014
Tons
Spain 15,714 5,412 4,974 6,386 5,656
Italy 4,836 4,892 3,785 5,155 4,809
Japan 3,841 2,675 2,291 3,686 2,963
El Salvador 0 0 48 1,985 1,700
Mauritius 0 0 0 0 1,675
Kenya 0 0 325 250 1,525
United States of America 3,672 2,893 3,804 1,707 1,498
France 2,147 864 1,014 1,259 1,393
World 34,267 21,556 21,162 26,960 25,787
Sources: ITC calculations based on UN COMTRADE statistics.
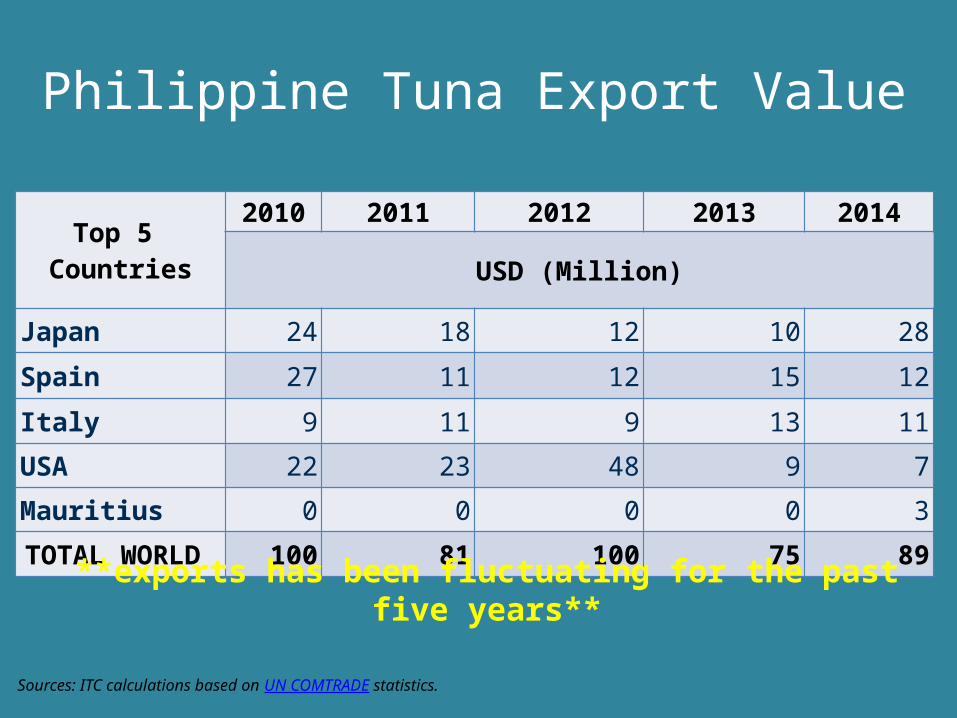
Philippine Tuna Export Value
Top 5 Countries
2010 2011 2012 2013 2014
USD (Million)
Japan 24 18 12 10 28
Spain 27 11 12 15 12
Italy 9 11 9 13 11
USA 22 23 48 9 7
Mauritius 0 0 0 0 3
TOTAL WORLD 100 81 100 75 89
**exports has been fluctuating for the past five years**
Sources: ITC calculations based on UN COMTRADE statistics.

Case in Point 6: Japan Tuna Imports from ASEAN Communities
ASEANCountries
2010 2011 2012 2013 2014
USD (Million)
Thailand 331 362 525 428 381
Viet Nam 56 74 126 100 77
Philippines 38 24 32 46 39
Singapore 21 20 30 15 15
Malaysia 4 2 4 5 6
Indonesia 13 10 12 5 3
ASEAN 465 495 732 602 524
**imports from the Philippines is very low**
Sources: ITC calculations based on UN COMTRADE statistics.

There is still big opportunity in the global seafood sector... But we need to work hand in hand to
capture that opportunity.
Thank You!