status of organic tree fruit in washington state
TRANSCRIPT

W A S H I N G T O N S T A T E U N I V E R S I T Y E X T E N S I O N • E M 0 4 6 E
Status of Organic Tree Fruit in Washington State
Status of Organic Tree Fruit in Washington State
Elizabeth Kirby and David Granatstein
Contents
Purpose ........................................................................................................................................1
Executive Summary ......................................................................................................................1
Introduction .................................................................................................................................1
Methods .......................................................................................................................................1
Washington Organic Apples Acreage and Varieties ..............................................................................................................3 Sales Volume and Price ...........................................................................................................4
Washington Organic Pears Acreage and Varieties ..............................................................................................................7 Sales Volume and Price ...........................................................................................................8
Washington Organic Cherries Acreage and Varieties ..............................................................................................................9 Sales Volume and Price .........................................................................................................11
Other Washington Organic Stone Fruit .......................................................................................12
Organic Tree Fruit Distribution by County ...................................................................................13
National and Global Acreage ......................................................................................................14
Overall Value and Production ......................................................................................................15
Market Outlook and Export ........................................................................................................16
Conclusion .................................................................................................................................18
References ..................................................................................................................................19
Acknowledgements ....................................................................................................................20
Appendix Tables .........................................................................................................................20

1
Purpose
The data presented in this report are intended to provide a reference for those trying to understand the historical trends for organic tree fruit production in the state of Washington. The discussion focuses exclusively on the fresh fruit market since most of Washington’s fruit is produced for and sold to this market. It also includes price and sales volume infor-mation and national and global production acreage trends where these data could be gathered.
Executive Summary
Washington State is the leading U.S. producer of organic apples, pears, and cherries. Organic apples represented nearly 10% of the state’s total apple acreage and 7% of sales volume in 2010. Following several years of rapid expansion in Washington (more than 100% from 2004 to 2009), certified apple acreage dropped 6%, from 15,735 acres in 2009 to 14,800 acres in 2010. Gala and Fuji varieties made up 45% of the total organic apple acreage, while less than 10% of the acres were Red Delicious. Despite the downturn in number of acres, Washington organic apple sales volume increased to 6.8 million boxes (40 lb. SEB)1 for the 2010/2011 market year, ex-ceeding the 5.9 million boxes sold the previous year. Growth in sales volume despite a decline in acreage was likely due, in part, to less diversion of organic fruit to conventional markets. Aver-age prices for Washington organic apples de-creased nearly 30% in the 2008/09 season when compared to the previous year, and premiums were reduced 50% to around $5 per box. Prices increased modestly in the following two seasons, but premiums remained low.
Washington organic pear acreage increased 4%, to 2,033 acres in 2010, although growth was slower than the previous three seasons. Organic pears had an 8.5% share of all state pear acres. Green Bartlett and D’Anjou varieties made up 64% of the state’s organic pear acres; 15% were Bosc. Washington organic pear sales volume increased 50% between 2005 and 2010, with an organic sales share estimated at 6%, similar to the previous few years. The shipped volume of Washington organic pears totaled 649,000 boxes (44 lb. SEB) for the 2010/11 season, down from 775,000 boxes in the previous year (with its record crop for Northwest pears). Average organic pear prices decreased 30% between the 2006/07 and 2009/10 market seasons, and average premi-ums fell 50% to around $6 per box.
1
Washington organic cherries represented a 5.8% share of total state cherry acreage in 2010, while organic cherry acreage declined 12% in 2010 to 2,147 acres, following significant growth in each of the previous 5 years. Bing was the leading va-riety reported, with at least 18% of the acres. The organic share of Washington cherry sales volume was 2.7% in 2010. The shipped organic volume, just under 245,000 boxes (20 or15 lb. SEB), was well below early 2010 season forecasts as well as the previous year’s volume. After dropping 47% to $35 per box in 2009, average prices for Wash-ington organic cherries rebounded in 2010 to $57 per box. However, transition acreage for all Washington tree fruit has declined steadily since peaking in 2007, signaling slower expansion of this sector in the near term. Little, if any, growth in state organic tree fruit acreage is predicted for 2011.
Introduction
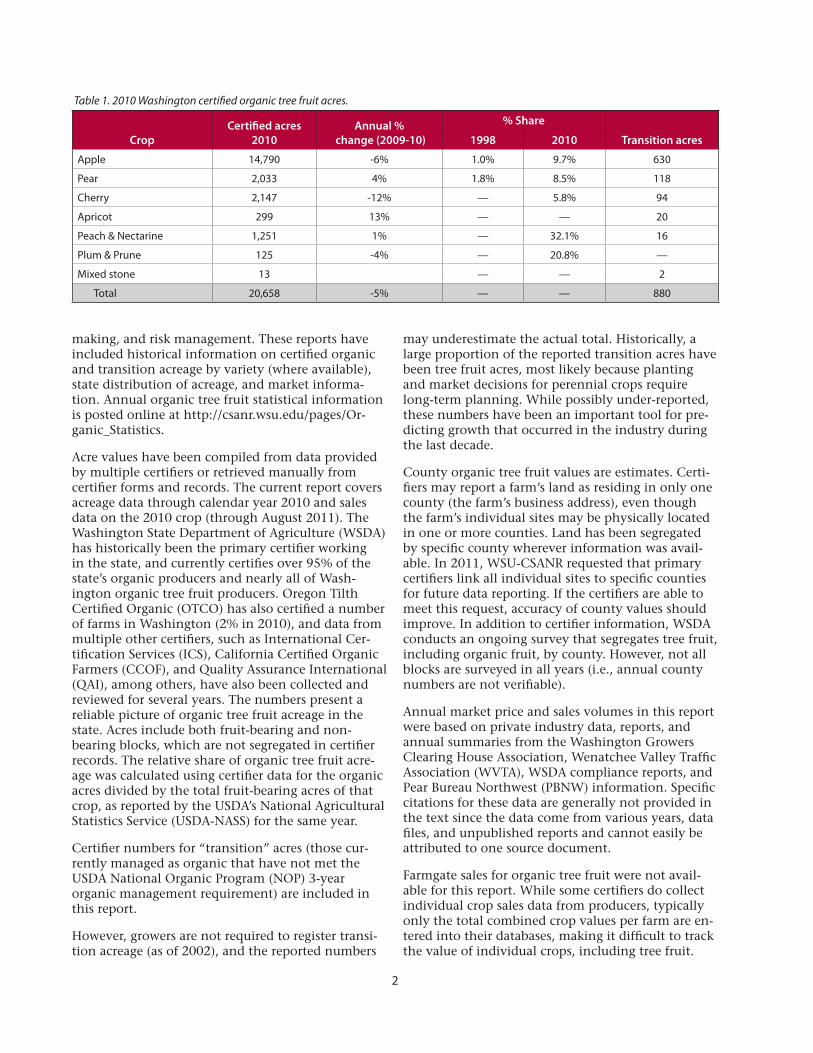
As the leading producer of conventional (non-organ-ic) apples, pears, and cherries, it is not surprising that Washington State is also the leader in organic pro-duction of these fruits. In 2010, the state had 20,658 acres of certified organic tree fruit, the result of two decades of growth. In 1998, organic apples were only 1% and organic pears were only 2% of the total acres for those crops (Granatstein et al. 2000), compared to the nearly 10% share for organic apples in 2010 (Tables 1 and A1). These crops contribute significant economic value to the state economy, with FOB2 organic apple sales (at the packing house) of nearly $150 million for the 2009 crop. However, despite recent growth, the organic sector is still relatively small and is subject to considerable price and market volatility.
Methods
Washington State University’s Center for Sustaining Agriculture and Natural Resources (WSU-CSANR) has compiled statistics on organic tree fruit produc-tion in Washington since 1998 in order to provide annual updates containing current, detailed informa-tion that can be used for industry planning, decision 1 SEB is Standard Equivalent Box, currently set at 40 lb. for Washington State apples; 44 lb. for pears, 20 lb. for dark sweet cherries, and 15 lb. for Rainier cherries.2 FOB stands for Free On Board or Freight on Board and indi-cates the price of the fruit prior to transportation costs or the price as it is loaded on the truck. Transportation is a separate expense and is most generally paid for by the buyer.
2
Table 1. 2010 Washington certified organic tree fruit acres.
CropCertified acres
2010Annual %
change (2009-10)
% Share
Transition acres1998 2010
Apple 14,790 -6% 1.0% 9.7% 630
Pear 2,033 4% 1.8% 8.5% 118
Cherry 2,147 -12% — 5.8% 94
Apricot 299 13% — — 20
Peach & Nectarine 1,251 1% — 32.1% 16
Plum & Prune 125 -4% — 20.8% —
Mixed stone 13 — — 2
Total 20,658 -5% — — 880
making, and risk management. These reports have included historical information on certified organic and transition acreage by variety (where available), state distribution of acreage, and market informa-tion. Annual organic tree fruit statistical information is posted online at http://csanr.wsu.edu/pages/Or-ganic_Statistics.
Acre values have been compiled from data provided by multiple certifiers or retrieved manually from certifier forms and records. The current report covers acreage data through calendar year 2010 and sales data on the 2010 crop (through August 2011). The Washington State Department of Agriculture (WSDA) has historically been the primary certifier working in the state, and currently certifies over 95% of the state’s organic producers and nearly all of Wash-ington organic tree fruit producers. Oregon Tilth Certified Organic (OTCO) has also certified a number of farms in Washington (2% in 2010), and data from multiple other certifiers, such as International Cer-tification Services (ICS), California Certified Organic Farmers (CCOF), and Quality Assurance International (QAI), among others, have also been collected and reviewed for several years. The numbers present a reliable picture of organic tree fruit acreage in the state. Acres include both fruit-bearing and non-bearing blocks, which are not segregated in certifier records. The relative share of organic tree fruit acre-age was calculated using certifier data for the organic acres divided by the total fruit-bearing acres of that crop, as reported by the USDA’s National Agricultural Statistics Service (USDA-NASS) for the same year.
Certifier numbers for “transition” acres (those cur-rently managed as organic that have not met the USDA National Organic Program (NOP) 3-year organic management requirement) are included in this report.
However, growers are not required to register transi-tion acreage (as of 2002), and the reported numbers
may underestimate the actual total. Historically, a large proportion of the reported transition acres have been tree fruit acres, most likely because planting and market decisions for perennial crops require long-term planning. While possibly under-reported, these numbers have been an important tool for pre-dicting growth that occurred in the industry during the last decade.
County organic tree fruit values are estimates. Certi-fiers may report a farm’s land as residing in only one county (the farm’s business address), even though the farm’s individual sites may be physically located in one or more counties. Land has been segregated by specific county wherever information was avail-able. In 2011, WSU-CSANR requested that primary certifiers link all individual sites to specific counties for future data reporting. If the certifiers are able to meet this request, accuracy of county values should improve. In addition to certifier information, WSDA conducts an ongoing survey that segregates tree fruit, including organic fruit, by county. However, not all blocks are surveyed in all years (i.e., annual county numbers are not verifiable).
Annual market price and sales volumes in this report were based on private industry data, reports, and annual summaries from the Washington Growers Clearing House Association, Wenatchee Valley Traffic Association (WVTA), WSDA compliance reports, and Pear Bureau Northwest (PBNW) information. Specific citations for these data are generally not provided in the text since the data come from various years, data files, and unpublished reports and cannot easily be attributed to one source document.
Farmgate sales for organic tree fruit were not avail-able for this report. While some certifiers do collect individual crop sales data from producers, typically only the total combined crop values per farm are en-tered into their databases, making it difficult to track the value of individual crops, including tree fruit.
3
Tree fruit sales values reported in the 2008 Organic Production Survey (OPS) (USDA-NASS 2010) are included in this report.
The USDA’s Economic Research Service (USDA-ERS) and National Agricultural Statistics Service (USDA-NASS) have collected state and national information on organic crops when funding and support have been available; however, publication typically lags well behind production year. The ERS data sets are based on certifier-reported values and are limited by category, with apples being the sole segregated tree fruit. Currently, the ERS has data available through 2008. Certifiers vary in the degree of crop detail they report, which can affect ERS numbers. The USDA-NASS has administered a few surveys on organic crops, most recently the detailed 2008 OPS. This survey was administered as a supplement to the 2007 Census of Agriculture and included information on many tree fruits, as well as both certified and “exempt” producer information. Producer response to the survey was 87%. An additional survey is planned for the 2011 calendar year. A review of the 2008 OPS revealed that certifier data for tree fruit covered 99.6% of total harvested organic fruit acres (certified and exempt) in Washington State. The number of fruit producers varied to a greater extent, with 348 producers reported by certifiers versus 421 certified and exempt producers tallied in the survey.
Washington State national rankings were based on the USDA-NASS 2008 OPS, WSU-CSANR compiled data, and USDA-ERS organic crop tables. Global acreage percentages were computed using data from a collaborative project between WSU-CSANR and the Research Institute of Organic Agriculture (FiBL)
in Frick, Switzerland. FiBL, in association with the International Federation of Organic Agriculture Movements (IFOAM), conducts an annual worldwide survey of organic crop acreage (Willer and Kilcher 2010). Survey information varies widely in terms of crop detail, and results typically lag by 2 years. WSU-CSANR also collects available detailed organic information from Washington and California, along with countries that have important organic tree fruit production, with the intent of producing current, detailed crop information for the annual survey. An-nual California crop numbers have been provided by the California Department of Food and Agriculture (CDFA unpublished data). Some individual countries (e.g., Argentina, Chile, Turkey, and Austria) have annual information available, while it is more dif-ficult to obtain current information from others (e.g., China and the U.S.). The most recent national and global data reported are for 2008.
Washington Organic Apples
Acreage and Varieties
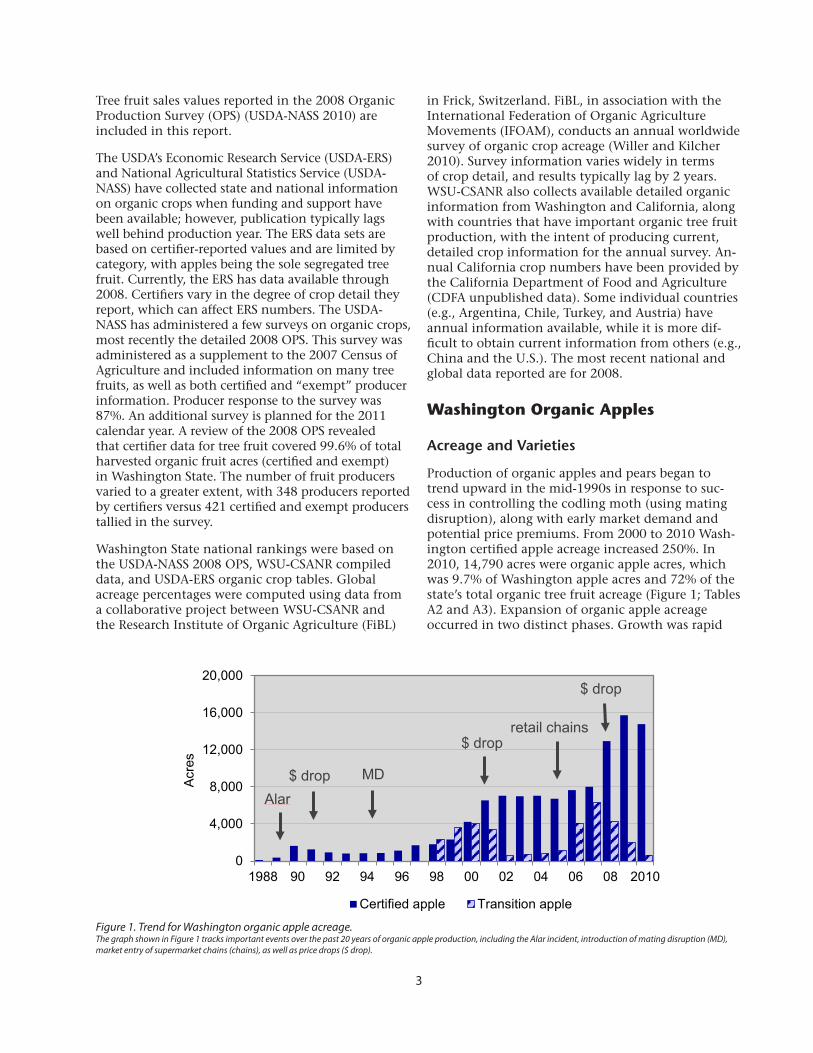
Production of organic apples and pears began to trend upward in the mid-1990s in response to suc-cess in controlling the codling moth (using mating disruption), along with early market demand and potential price premiums. From 2000 to 2010 Wash-ington certified apple acreage increased 250%. In 2010, 14,790 acres were organic apple acres, which was 9.7% of Washington apple acres and 72% of the state’s total organic tree fruit acreage (Figure 1; Tables A2 and A3). Expansion of organic apple acreage occurred in two distinct phases. Growth was rapid
Figure 1. Trend for Washington organic apple acreage. The graph shown in Figure 1 tracks important events over the past 20 years of organic apple production, including the Alar incident, introduction of mating disruption (MD), market entry of supermarket chains (chains), as well as price drops ($ drop).
0
4,000
8,000
12,000
16,000
20,000
1988 90 92 94 96 98 00 02 04 06 08 2010
Acre
s
Certified apple Transition apple
Alar$ drop
$ drop
MD
retail chains$ drop
4
from 1998 to 2001 and then leveled off from 2002 through 2005 following downward price adjustments in the 2001/02 market season. Beginning in 2006, as markets further expanded, spurred by supermarket chain purchases and increased consumer demand, producers again transitioned large apple-growing acreage to organic management. Organic acreage had annual increases of 61% (nearly 5,000 acres) in 2008 and 22% (2,800 acres) in 2009, to reach a peak of 15,735 acres. However, acreage declined 6% in 2010. Reported Washington apple acreage be-ing transitioned to organic peaked in 2007 at 6,291 acres and fell to just over 600 acres in 2010. The combined totals for certified organic plus transition apple acres were similar in 2008 and 2009, signaling that growth had leveled off. This was most likely a response to the 2008/09 market year drop in apple prices (both organic and conventional) and/or to producers removing acres planted with varieties such as Red Delicious, which have experienced softer market demand. In the future, some of these acres may be replanted with newer varieties and returned to organic production.
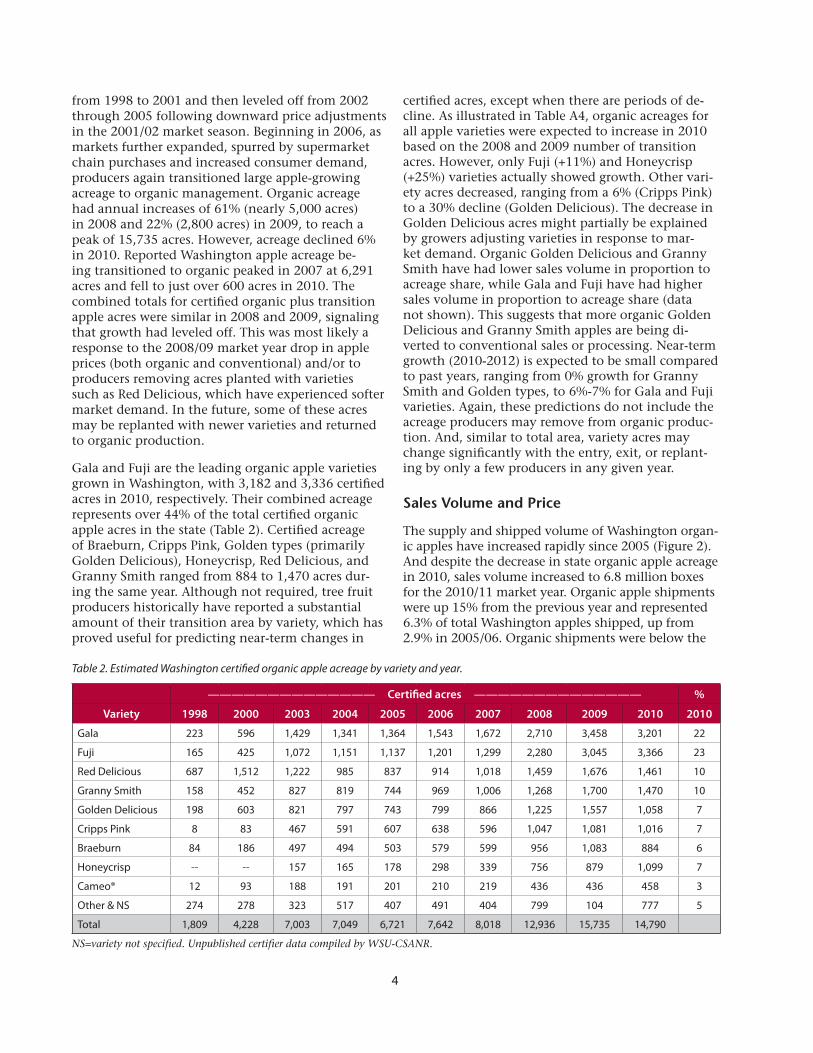
Gala and Fuji are the leading organic apple varieties grown in Washington, with 3,182 and 3,336 certified acres in 2010, respectively. Their combined acreage represents over 44% of the total certified organic apple acres in the state (Table 2). Certified acreage of Braeburn, Cripps Pink, Golden types (primarily Golden Delicious), Honeycrisp, Red Delicious, and Granny Smith ranged from 884 to 1,470 acres dur-ing the same year. Although not required, tree fruit producers historically have reported a substantial amount of their transition area by variety, which has proved useful for predicting near-term changes in
certified acres, except when there are periods of de-cline. As illustrated in Table A4, organic acreages for all apple varieties were expected to increase in 2010 based on the 2008 and 2009 number of transition acres. However, only Fuji (+11%) and Honeycrisp (+25%) varieties actually showed growth. Other vari-ety acres decreased, ranging from a 6% (Cripps Pink) to a 30% decline (Golden Delicious). The decrease in Golden Delicious acres might partially be explained by growers adjusting varieties in response to mar-ket demand. Organic Golden Delicious and Granny Smith have had lower sales volume in proportion to acreage share, while Gala and Fuji have had higher sales volume in proportion to acreage share (data not shown). This suggests that more organic Golden Delicious and Granny Smith apples are being di-verted to conventional sales or processing. Near-term growth (2010-2012) is expected to be small compared to past years, ranging from 0% growth for Granny Smith and Golden types, to 6%-7% for Gala and Fuji varieties. Again, these predictions do not include the acreage producers may remove from organic produc-tion. And, similar to total area, variety acres may change significantly with the entry, exit, or replant-ing by only a few producers in any given year.
Sales Volume and Price
The supply and shipped volume of Washington organ-ic apples have increased rapidly since 2005 (Figure 2). And despite the decrease in state organic apple acreage in 2010, sales volume increased to 6.8 million boxes for the 2010/11 market year. Organic apple shipments were up 15% from the previous year and represented 6.3% of total Washington apples shipped, up from 2.9% in 2005/06. Organic shipments were below the
Table 2. Estimated Washington certified organic apple acreage by variety and year.
—————————————— Certified acres —————————————— %
Variety 1998 2000 2003 2004 2005 2006 2007 2008 2009 2010 2010
Gala 223 596 1,429 1,341 1,364 1,543 1,672 2,710 3,458 3,201 22
Fuji 165 425 1,072 1,151 1,137 1,201 1,299 2,280 3,045 3,366 23
Red Delicious 687 1,512 1,222 985 837 914 1,018 1,459 1,676 1,461 10
Granny Smith 158 452 827 819 744 969 1,006 1,268 1,700 1,470 10
Golden Delicious 198 603 821 797 743 799 866 1,225 1,557 1,058 7
Cripps Pink 8 83 467 591 607 638 596 1,047 1,081 1,016 7
Braeburn 84 186 497 494 503 579 599 956 1,083 884 6
Honeycrisp -- -- 157 165 178 298 339 756 879 1,099 7
Cameo® 12 93 188 191 201 210 219 436 436 458 3
Other & NS 274 278 323 517 407 491 404 799 104 777 5
Total 1,809 4,228 7,003 7,049 6,721 7,642 8,018 12,936 15,735 14,790
NS=variety not specified. Unpublished certifier data compiled by WSU-CSANR.

5
Figure 2. Washington organic apple sales volume and price trend. The graph shown in Figure 2 is based on unpublished industry data (42 lb. SEB through 06/07 and 40 lb. SEB beginning in 07/08). The numeric labels along the X-axis indicate market year, approximately Sept 1-Aug 31. Prices are not reported for all shipments; thus, “priced volume” is less than “shipped volume.” Average prices are based on the priced volume only.
early season forecast of 8.6 million boxes (Washing-ton Growers Clearing House unpublished). With 5.9 million boxes sold as organic in 2009/10, an estimated 2 million boxes of organic apples were apparently sold on the conventional market or were diverted to other uses such as peelers or slicers.
Gala and Fuji will continue to have the highest sup-ply volumes of organic apples in Washington. These varieties ranked first and second for organic sales volume at nearly 2 million (Gala) and 1.57 million (Fuji) boxes for the 2010/11season (Figure 3). Fewer boxes of Red Delicious (665,000), Granny Smith (613,000), and Golden Delicious (317,000) were shipped as well as smaller amounts of other varieties,
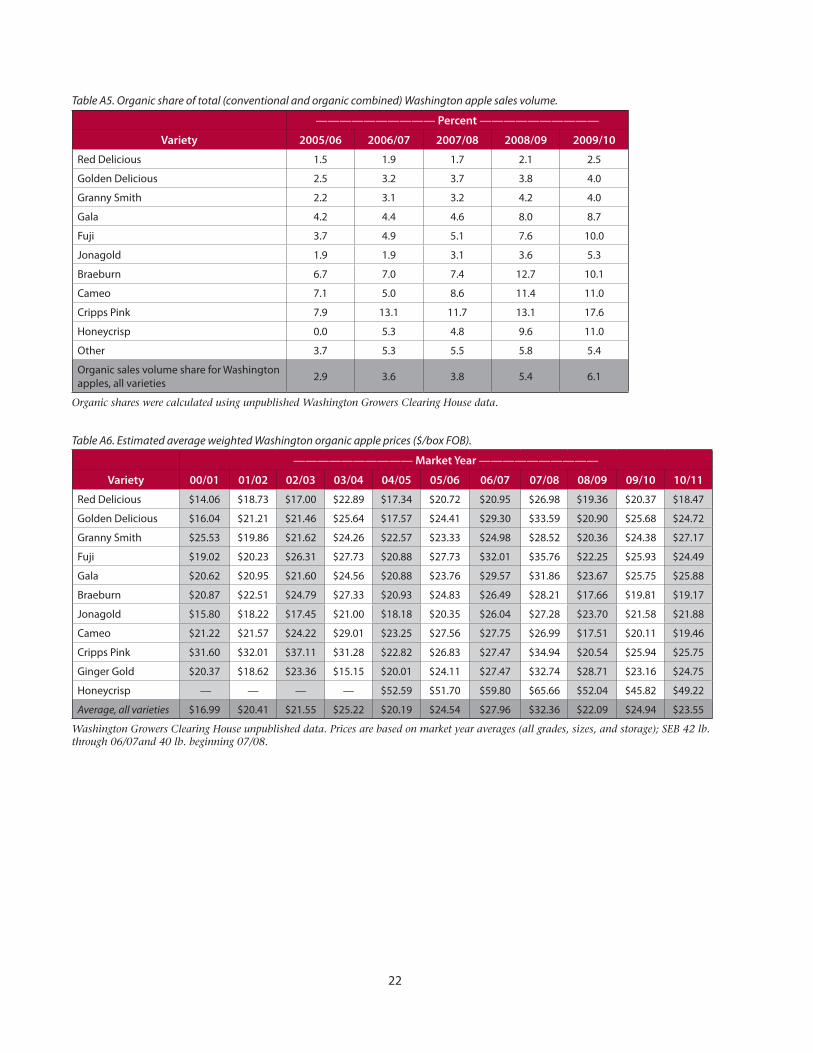
such as Cripps Pink and Honeycrisp. Organic Galas represented 9% of all Washington Galas shipped in 2010/11, and organic shares for other varieties ranged from 2% for Red Delicious to 18% for Cripps Pink (Table A5). Continued growth in the sales of organic fresh apples, despite fewer certified acres, may have resulted from an increase in fruit-bearing acres relative to total acres or from a decrease in the number of organic apples diverted to other markets and for other uses.
The most commonly cited economic indicator for organic food is the price premium. This premium is the price difference between organic and conven-tional fruit expressed as a percent or a dollar differ-
Figure 3. Washington organic apple sales volume by variety (annual season-end 2003/04 through 2010/11). The graph shown in Figure 3 is based on unpublished industry data (42 lb. SEB through 06/07 and 40 lb. SEB beginning in 07/08). Numeric labels along the X-axis indicate market year, approximately Sept 1 to Aug 31.
$0
$5
$10
$15
$20
$25
$30
$35
$40
0
1,000
2,000
3,000
4,000
5,000
6,000
7,000
8,000
$/Bo
x FO
B
Boxe
s *1
000
Priced Boxes Shipped Boxes US$ per Box
0
500
1,000
1,500
2,000
Gala Fuji RedDelicious
GrannySmith
GoldenDelicious
Boxe
s *1
000
03/04 04/05 05/06 06/07 07/08 08/09 09/10 10/11
6
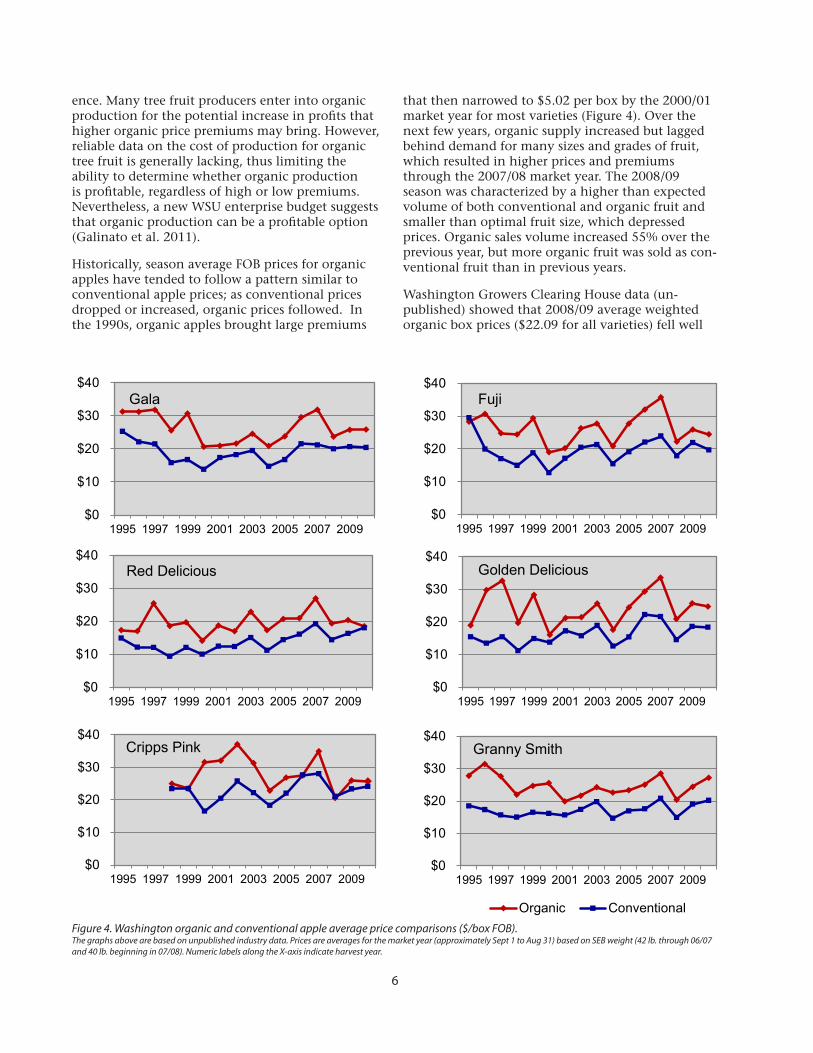
ence. Many tree fruit producers enter into organic production for the potential increase in profits that higher organic price premiums may bring. However, reliable data on the cost of production for organic tree fruit is generally lacking, thus limiting the ability to determine whether organic production is profitable, regardless of high or low premiums. Nevertheless, a new WSU enterprise budget suggests that organic production can be a profitable option (Galinato et al. 2011).
Historically, season average FOB prices for organic apples have tended to follow a pattern similar to conventional apple prices; as conventional prices dropped or increased, organic prices followed. In the 1990s, organic apples brought large premiums
that then narrowed to $5.02 per box by the 2000/01 market year for most varieties (Figure 4). Over the next few years, organic supply increased but lagged behind demand for many sizes and grades of fruit, which resulted in higher prices and premiums through the 2007/08 market year. The 2008/09 season was characterized by a higher than expected volume of both conventional and organic fruit and smaller than optimal fruit size, which depressed prices. Organic sales volume increased 55% over the previous year, but more organic fruit was sold as con-ventional fruit than in previous years.
Washington Growers Clearing House data (un-published) showed that 2008/09 average weighted organic box prices ($22.09 for all varieties) fell well
Figure 4. Washington organic and conventional apple average price comparisons ($/box FOB). The graphs above are based on unpublished industry data. Prices are averages for the market year (approximately Sept 1 to Aug 31) based on SEB weight (42 lb. through 06/07 and 40 lb. beginning in 07/08). Numeric labels along the X-axis indicate harvest year.
$0
$10
$20
$30
$40
1995 1997 1999 2001 2003 2005 2007 2009
Gala
$0
$10
$20
$30
$40
1995 1997 1999 2001 2003 2005 2007 2009
Red Delicious
$0
$10
$20
$30
$40
1995 1997 1999 2001 2003 2005 2007 2009
Cripps Pink
$0
$10
$20
$30
$40
1995 1997 1999 2001 2003 2005 2007 2009
Fuji
$0
$10
$20
$30
$40
1995 1997 1999 2001 2003 2005 2007 2009
Golden Delicious
$0
$10
$20
$30
$40
1995 1997 1999 2001 2003 2005 2007 2009
Granny Smith
Organic Conventional
7
below the previous year’s average ($32.36) as well as the previous 5-year (2003-2007) average, result-ing in an average box premium of $5.39, compared to $11.19 in the 2007/08 market season. Premiums shrank for all varieties (Figure 4; Tables A6-A9). Gen-erally prices fell more steeply for organic fruit, with an average drop of more than $10 per box compared to conventional fruit with an average drop of less than $5 per box.
In 2009/10 crop prices recovered slightly, with a market season average value of $24.94 per box, repre-senting a $5.85 average box premium for all varieties. Price gains were similar for conventional and organic fruit, increasing by an average $2.39 and $2.85 per box, respectively. Organic premiums for listed variet-ies (2009/10) ranged from $2.59 for Cripps Pink to $8.64 for Ginger Gold. Honeycrisp had the highest sales value at $45.82, with a premium of $5.21. How-ever, the continued economic recession increased de-mand for the lower value grades and smaller sizes of organic fruit. By November 15, 2010, average season-to-date prices ($28.75) were up 15% over prices on the same date the previous year (data not shown). Prices later fell and 2010/11 market season values averaged $23.55, which is $1.39 lower than the pre-vious year, and average box premiums decreased to $3.76. The season average premium for Red Delicious fell to $0.45 compared to $4 in 2009/10, and while Honeycrisp prices increased in 2010/11, the organic premium continued to fall. However, premiums im-proved for some varieties; Granny Smith, Fuji, Gala, and Jonagold received average premiums of $7.02, $4.77, $5.50, and $4.95, respectively, each up from the previous season.
Box prices, premiums, and actual grower returns will be affected by the available fruit supply, variety, grade, quality, and size, as well as by the time of year the product is sold. Five-year (2006-2010) average premi-ums for Red Delicious at $4.86 were well below Gala and Fuji premiums of $6.61 and $6.97, respectively (Tables A7 and A9). Supply of both Gala and Fuji varieties has increased, with sales volume doubling between 2007/08 and 2009/10. Organic Cripps Pink prices have been inconsistent, with premiums rang-ing from $0 to nearly $7 in the last few years. Using the historical correlation between organic apple prices and conventional prices, Dr. D. O’Rourke developed an economic model for analyzing apple prices under varying supply conditions (O’Rourke 2008). Ac-cording to the modeling predictions, organic apple premiums may approach zero when organic sales volume reaches 12% of the total sales volume of Washington apples. Recent prices are similar to what the model had predicted. For example, with the 6% organic share of total apple shipments in the
2009/10 season, average organic box prices were at $24.89 for all grades and sizes, close to the model prediction (Table A10).
Smaller fruit have typically received lower aver-age box prices. For example, values obtained using Washington Growers Clearing House sales data (un-published) revealed that in the fall of 2007, Organic Gala Washington Extra Fancy (WAXF) #1 grade (size 80-100) brought premiums ranging from 66%-82% compared to 22% for size 113. There was very little price difference between the larger fruit (size 72) and the smaller fruit (size 88), but there was a 50% lower premium for the smaller fruit (data not shown). In addition, Organic Gala WAXF#1 season average price differences (2005/06 to 2010/11) have ranged from 4% to 15% lower for size 100, and from 17% to 35% lower for size 113 as compared to size 80-88 (Table A11). As total supply and demand have increased, especially in the last 2 years, the price penalty for size 100 has decreased, indicating a growing accep-tance of smaller fruit size on the organic market, which creates the potential for using the smaller sizes to supplement supply. Consequently, an increasing proportion of apples grown as organic may end up being sold as organic fruit rather than being diverted to conventional markets or other uses.
Washington Organic Pears
Acreage and Varieties
Organic pear production, like apple production, began to increase in the mid-1990s, just on a smaller scale. Certified pear acreage in Washington increased 228%, from 619 acres in 2000 to 2,033 acres by 2010. Including the annual growth of 3.5% in 2009, organic pears represented 8.5% of all Washington pear acres in 2010. Early expansion of organic pear acreage was rapid, with an annual increase of over 100% in 2001 and with an additional 35% increase in 2002, for a total of 1,771 acres. Acreage temporar-ily decreased 32% from 2002 to 2005, most likely in response to lower premiums experienced from 2001 to 2003. Organic pear acreage continued to increase at a moderate rate during a second expansion period that began in 2006. However, transition acreage decreased annually beginning in 2007, and with just 118 acres reported in 2010, there will likely be little short-term growth (Figure 5; Tables A2 and A3).
The Bartlett and D’Anjou pear varieties, with 692 and 636 acres, respectively, comprised 65% of the total certified organic pear acres in 2010 (Figure 6; Table A12), which is similar to the past several years. Prior to 2005, D’Anjou had the greater share of acres; however, Bartlett had a slightly higher proportion from 2007

8
to 2010. Organic Bosc pear acreage peaked in 2002 with 370 acres, followed by a decline to 214 acres in 2005 and a rebound to 300 acres by 2010. Acreage of organic red pear varieties doubled from 2005 to 2009 but remains a smaller share (217 acres). Producers also reported a minor number of acres of organic specialty pears, including Concorde, Tosca, Taylor’s Gold, Forelle, Starkrimson, and Comice.
Sales Volume and Price
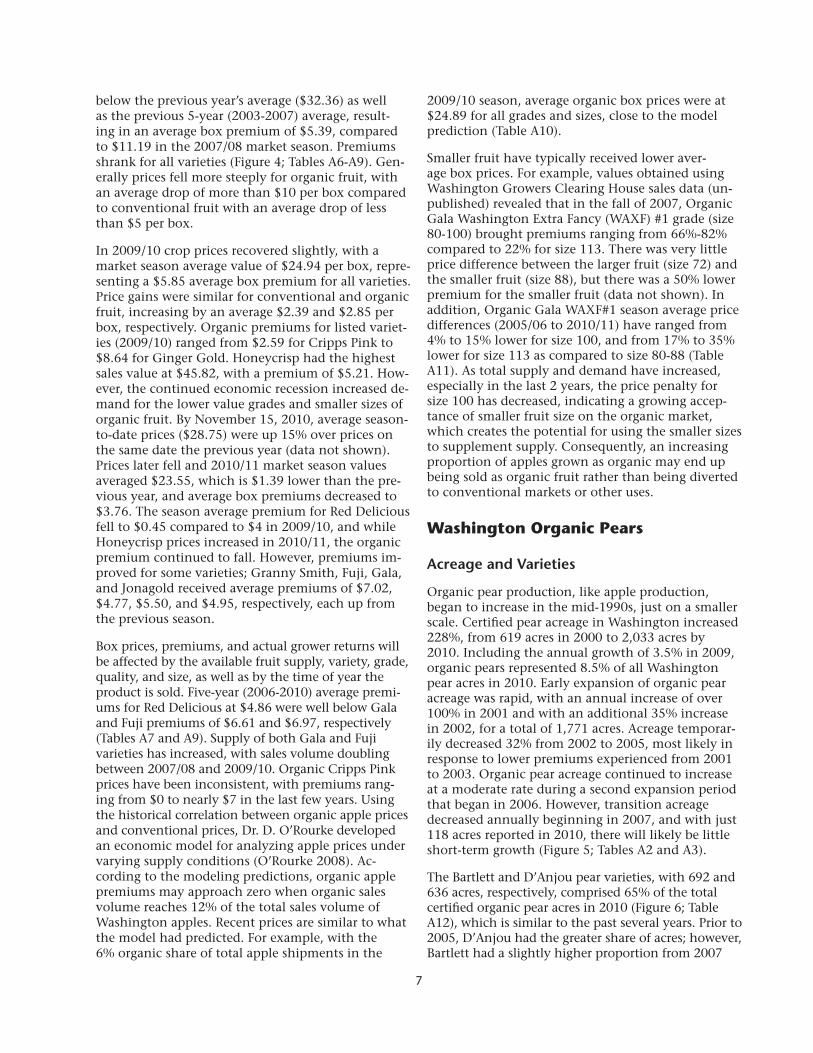
Washington organic pear sales volume increased 50% between 2005 and 2010, from a reported 435,000 to 649,000 boxes, respectively (Figure 7). The organic share of total pear sales volume was 6% in 2010/11, similar to the previous few years. A record Northwest
pear crop of over 20 million boxes (conventional and organic) harvested in 2009 resulted in a peak Wash-ington organic sales volume of 775,000 boxes. The crop size for all Northwest pears declined the follow-ing year, and organic pear volume declined as well. D’Anjou and Bartlett varieties accounted for 43% and 28% of organic pear sales volume, respectively, in 2010/11, with Bosc pears at 15% (Figure 8). The D’Anjou and Bartlett varieties will continue to be in the greatest supply based on their certified acres.
Washington organic pear prices do not track con-ventional prices as closely as organic apple prices do. Early (mid-1990s) organic pear prices were double that of conventional pears. Average organic and conventional Bartlett box prices were approximately $41 and $20, respectively (Figure 9). Like apple premiums, early organic pear premiums were not sustained. Prices dropped to near conventional pear prices by 2001/02, with an average premium of $2.53 for all pear varieties and premiums for the major varieties ranging from zero dollars per box for Red Bartlett to $5.43 for Bartlett. Premiums improved gradually from 2002 onward and increased signifi-cantly (to $14.77 per box) in the 2006/07 season (Tables A13–A16). Both conventional and organic pears again brought reduced average prices (FOB) and organic premiums from 2007/08 to 2009/10.
The high supply volume of D’Anjous likely helps explain why D’Anjou box premiums of $6.92 were well below the average premium of $9.49 (for all pears) in the 2008/09 season. Average premiums fell about 40% to $5.86 for the 2009/10 season (compared to the previous season) as prices dropped an estimated $2.50 per box for conventional pears and $6 per box for organic pears (to $23.40). Organic prices and pre-miums recovered some value in the 2010/11 market
Figure 6. Variety share (% of acres) for Washington organic pears in 2010. (*NS = not specified).
Bartlett34%
D'Anjou31%
Bosc15%
Red Types11%
Other/NS*7%
Asian2%
Figure 5. Trend for Washington organic pear acreage.
619
2033
0
500
1,000
1,500
2,000
2,500
1998 99 00 01 02 03 04 05 06 07 08 09 10
Acre
s
Certified pear Transition pear
9
Figure 7. Washington organic pear sales volume and price trend. The graph shown in Figure 7 is based on unpublished industry data. Numeric labels along the X-axis indicate market year, approximately Sept 1 to Aug 31. Prices are not reported for all shipments; thus, “priced volume” is less than “shipped volume.” Average prices are based on the priced volume only.
Figure 8. Washington and Oregon organic pear sales volume by variety. The graph shown in Figure 8 is based on unpublished PBNW industry data (44 lb. SEB). Numeric labels along the X-axis indicate market year.
$0$5$10$15$20$25$30$35$40$45
0100200300400500600700800900
$/Bo
x FO
B
Boxe
s *1
000
Priced Boxes Total Shipped Boxes US$ per Box
050
100150200250300350400
D'Anjou Bartlett Bosc Red Anjou Red Bartlett
Boxe
s *1
000
05/06 06/07 07/08 08/09 09/10 10/11
season but remained well below peak 2006/07 prices. The market season average premium for all pear varieties decreased to $5.16, which is $0.70 below the previous year. Premiums for the major varieties ranged from $2.87 to $9.33 for D’Anjou and Red D’Anjou, re-spectively, and Bartlett, Red Bartlett, and Bosc premi-ums showed improvement in the 2010/11 season.
Washington Organic Cherries
Acreage and Varieties
Organic cherry production became a viable option in Washington State with the advent of effective cherry fruit fly controls that were compliant with organic
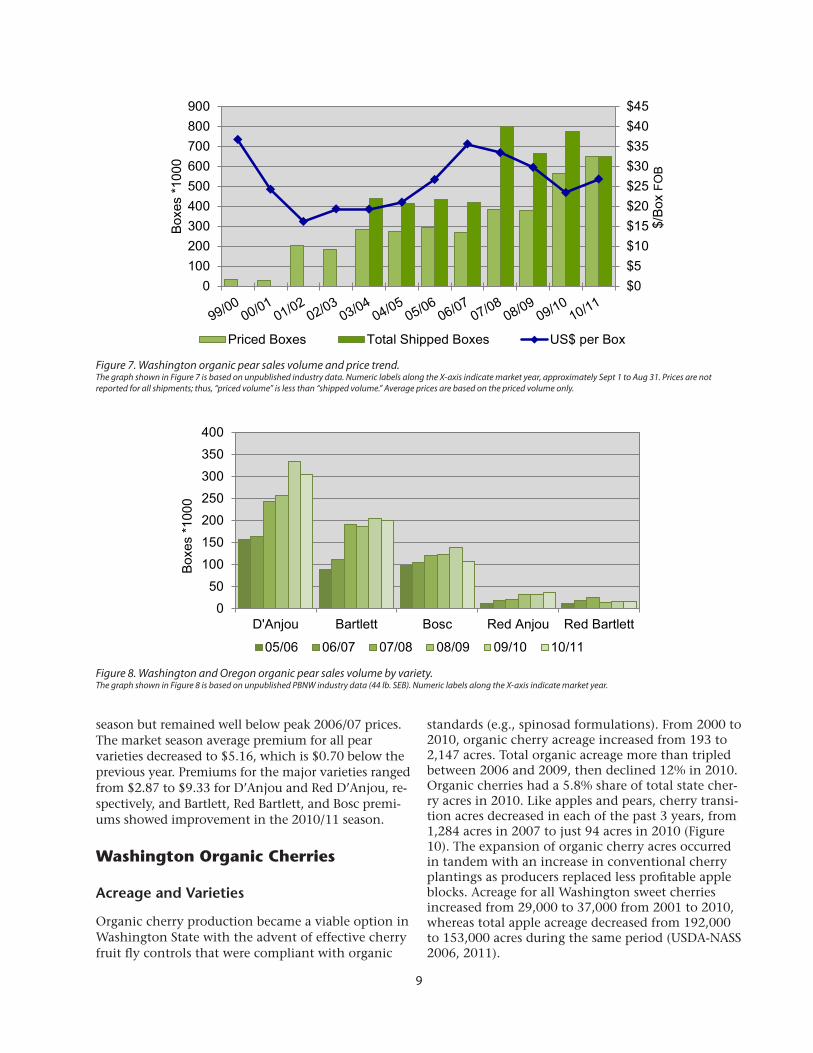
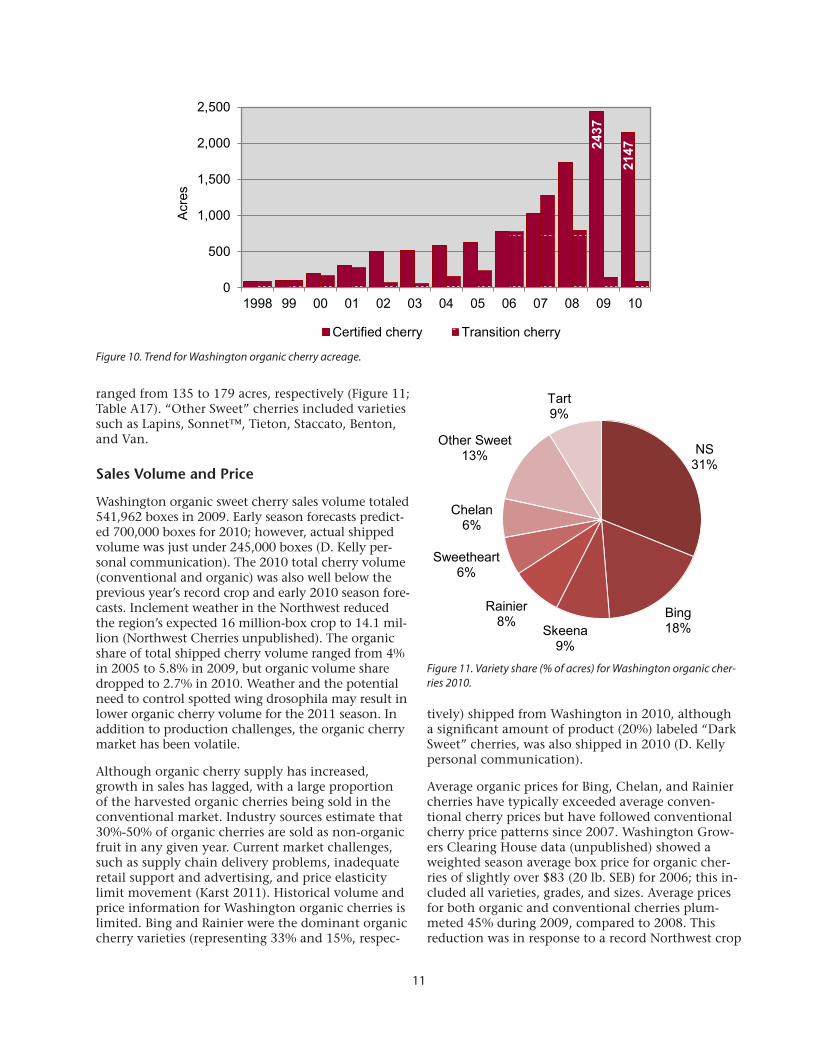
standards (e.g., spinosad formulations). From 2000 to 2010, organic cherry acreage increased from 193 to 2,147 acres. Total organic acreage more than tripled between 2006 and 2009, then declined 12% in 2010. Organic cherries had a 5.8% share of total state cher-ry acres in 2010. Like apples and pears, cherry transi-tion acres decreased in each of the past 3 years, from 1,284 acres in 2007 to just 94 acres in 2010 (Figure 10). The expansion of organic cherry acres occurred in tandem with an increase in conventional cherry plantings as producers replaced less profitable apple blocks. Acreage for all Washington sweet cherries increased from 29,000 to 37,000 from 2001 to 2010, whereas total apple acreage decreased from 192,000 to 153,000 acres during the same period (USDA-NASS 2006, 2011).

10
The slight downward trend for organic cherries in 2010 may have been in response to production chal-lenges and/or market signals. Weather conditions in the spring of 2009 favored disease development and smaller fruit size. These factors likely prompted producers to move some organic blocks into con-ventional production by 2010. There were 20% fewer organic acres reported by certifiers for both the Sweetheart and Rainier cherry varieties in 2010 com-pared to the previous year. The Sweetheart variety is also more susceptible to brown rot and powdery mildew and can be more difficult to manage for fruit size. Concerns over the recent establishment of spotted wing drosophila (SWD) in the state may also have caused producers to scale back or hold off on transitioning additional cherry acres into organic production.
The Washington cherry season overlaps slightly with California’s season. Organic sweet cherries are now available in larger quantities during a longer market window due to variety diversification. California of-fers an early supply of cherry varieties such as Brooks, Chelan, Coral Champagne, Garnet, Bing, Rainier, and Sweetheart. Subsequently, Washington provides early season Chelan cherries followed by Van, Bing, and Rainier cherries mid-season, and Lapins, Sweetheart, and Skeena cherries later in the season.
Certifier information for Washington organic cherry varieties has been improving. Seventy percent of cherry acres were reported by variety in 2010, compared to just 40% identified as such in 2008. The largest variety by area was Bing, reported at 380 acres, while the Chelan and Rainier varieties
$0
$10
$20
$30
$40
$50
1996 1998 2000 2002 2004 2006 2008 2010
Bartlett
$0
$10
$20
$30
$40
$50
1996 1998 2000 2002 2004 2006 2008 2010
D'Anjou
$0
$10
$20
$30
$40
$50
1996 1998 2000 2002 2004 2006 2008 2010
Red D'Anjou
$0
$10
$20
$30
$40
$50
1996 1998 2000 2002 2004 2006 2008 2010
Bosc
$0
$10
$20
$30
$40
$50
1996 1998 2000 2002 2004 2006 2008 2010
Red Bartlett
Organic Conventional
Figure 9. Washington organic and conventional pear average price comparisons ($/box FOB). The graphs above are based on unpublished industry data. Prices are averages for the market season (approximately Sept 1 to Aug 31) based on SEB weight (44 lb). Numeric labels along the X-axis indicate harvest year.
11
ranged from 135 to 179 acres, respectively (Figure 11; Table A17). “Other Sweet” cherries included varieties such as Lapins, Sonnet™, Tieton, Staccato, Benton, and Van.
Sales Volume and Price
Washington organic sweet cherry sales volume totaled 541,962 boxes in 2009. Early season forecasts predict-ed 700,000 boxes for 2010; however, actual shipped volume was just under 245,000 boxes (D. Kelly per-sonal communication). The 2010 total cherry volume (conventional and organic) was also well below the previous year’s record crop and early 2010 season fore-casts. Inclement weather in the Northwest reduced the region’s expected 16 million-box crop to 14.1 mil-lion (Northwest Cherries unpublished). The organic share of total shipped cherry volume ranged from 4% in 2005 to 5.8% in 2009, but organic volume share dropped to 2.7% in 2010. Weather and the potential need to control spotted wing drosophila may result in lower organic cherry volume for the 2011 season. In addition to production challenges, the organic cherry market has been volatile.
Although organic cherry supply has increased, growth in sales has lagged, with a large proportion of the harvested organic cherries being sold in the conventional market. Industry sources estimate that 30%-50% of organic cherries are sold as non-organic fruit in any given year. Current market challenges, such as supply chain delivery problems, inadequate retail support and advertising, and price elasticity limit movement (Karst 2011). Historical volume and price information for Washington organic cherries is limited. Bing and Rainier were the dominant organic cherry varieties (representing 33% and 15%, respec-
tively) shipped from Washington in 2010, although a significant amount of product (20%) labeled “Dark Sweet” cherries, was also shipped in 2010 (D. Kelly personal communication).
Average organic prices for Bing, Chelan, and Rainier cherries have typically exceeded average conven-tional cherry prices but have followed conventional cherry price patterns since 2007. Washington Grow-ers Clearing House data (unpublished) showed a weighted season average box price for organic cher-ries of slightly over $83 (20 lb. SEB) for 2006; this in-cluded all varieties, grades, and sizes. Average prices for both organic and conventional cherries plum-meted 45% during 2009, compared to 2008. This reduction was in response to a record Northwest crop
Figure 10. Trend for Washington organic cherry acreage.
Figure 11. Variety share (% of acres) for Washington organic cher-ries 2010.
2437
2147
0
500
1,000
1,500
2,000
2,500
1998 99 00 01 02 03 04 05 06 07 08 09 10
Acre
s
Certified cherry Transition cherry
NS31%
Bing18%Skeena
9%
Rainier8%
Sweetheart6%
Chelan6%
Other Sweet 13%
Tart9%
12
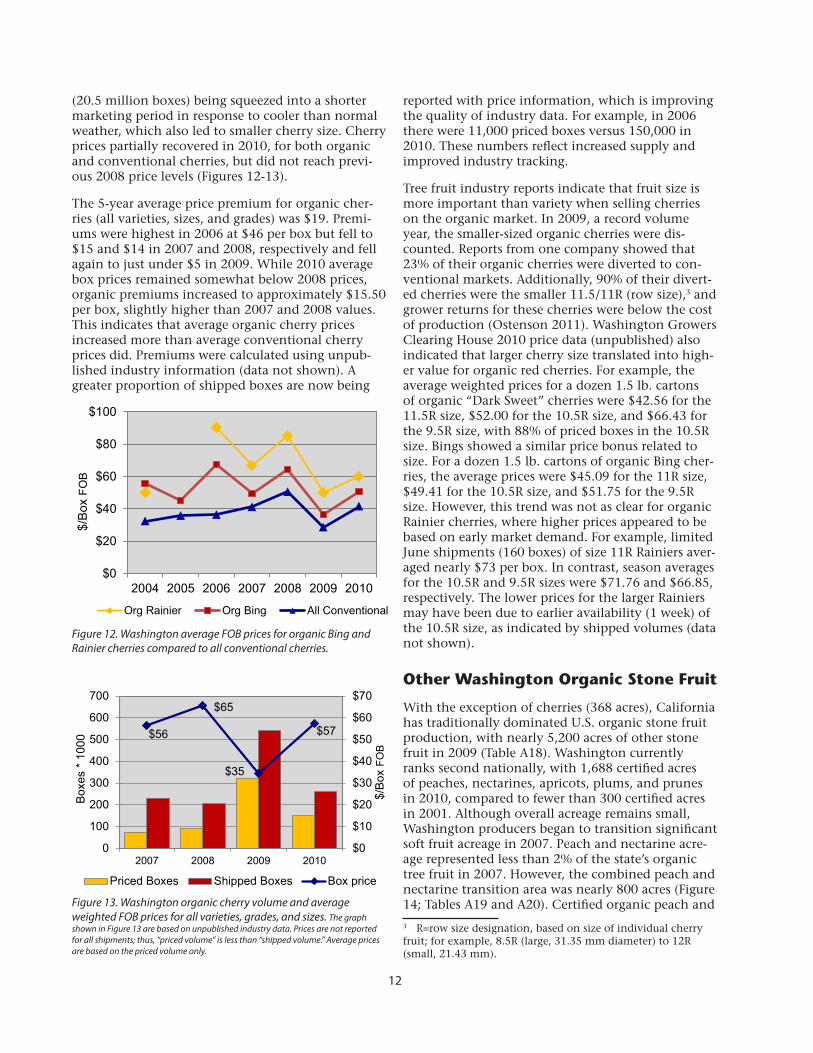
(20.5 million boxes) being squeezed into a shorter marketing period in response to cooler than normal weather, which also led to smaller cherry size. Cherry prices partially recovered in 2010, for both organic and conventional cherries, but did not reach previ-ous 2008 price levels (Figures 12-13).
The 5-year average price premium for organic cher-ries (all varieties, sizes, and grades) was $19. Premi-ums were highest in 2006 at $46 per box but fell to $15 and $14 in 2007 and 2008, respectively and fell again to just under $5 in 2009. While 2010 average box prices remained somewhat below 2008 prices, organic premiums increased to approximately $15.50 per box, slightly higher than 2007 and 2008 values. This indicates that average organic cherry prices increased more than average conventional cherry prices did. Premiums were calculated using unpub-lished industry information (data not shown). A greater proportion of shipped boxes are now being
reported with price information, which is improving the quality of industry data. For example, in 2006 there were 11,000 priced boxes versus 150,000 in 2010. These numbers reflect increased supply and improved industry tracking.
Tree fruit industry reports indicate that fruit size is more important than variety when selling cherries on the organic market. In 2009, a record volume year, the smaller-sized organic cherries were dis-counted. Reports from one company showed that 23% of their organic cherries were diverted to con-ventional markets. Additionally, 90% of their divert-ed cherries were the smaller 11.5/11R (row size),3 and grower returns for these cherries were below the cost of production (Ostenson 2011). Washington Growers Clearing House 2010 price data (unpublished) also indicated that larger cherry size translated into high-er value for organic red cherries. For example, the average weighted prices for a dozen 1.5 lb. cartons of organic “Dark Sweet” cherries were $42.56 for the 11.5R size, $52.00 for the 10.5R size, and $66.43 for the 9.5R size, with 88% of priced boxes in the 10.5R size. Bings showed a similar price bonus related to size. For a dozen 1.5 lb. cartons of organic Bing cher-ries, the average prices were $45.09 for the 11R size, $49.41 for the 10.5R size, and $51.75 for the 9.5R size. However, this trend was not as clear for organic Rainier cherries, where higher prices appeared to be based on early market demand. For example, limited June shipments (160 boxes) of size 11R Rainiers aver-aged nearly $73 per box. In contrast, season averages for the 10.5R and 9.5R sizes were $71.76 and $66.85, respectively. The lower prices for the larger Rainiers may have been due to earlier availability (1 week) of the 10.5R size, as indicated by shipped volumes (data not shown).
Other Washington Organic Stone Fruit
With the exception of cherries (368 acres), California has traditionally dominated U.S. organic stone fruit production, with nearly 5,200 acres of other stone fruit in 2009 (Table A18). Washington currently ranks second nationally, with 1,688 certified acres of peaches, nectarines, apricots, plums, and prunes in 2010, compared to fewer than 300 certified acres in 2001. Although overall acreage remains small, Washington producers began to transition significant soft fruit acreage in 2007. Peach and nectarine acre-age represented less than 2% of the state’s organic tree fruit in 2007. However, the combined peach and nectarine transition area was nearly 800 acres (Figure 14; Tables A19 and A20). Certified organic peach and
3 R=row size designation, based on size of individual cherry fruit; for example, 8.5R (large, 31.35 mm diameter) to 12R (small, 21.43 mm).
Figure 12. Washington average FOB prices for organic Bing and Rainier cherries compared to all conventional cherries.
Figure 13. Washington organic cherry volume and average weighted FOB prices for all varieties, grades, and sizes. The graph shown in Figure 13 are based on unpublished industry data. Prices are not reported for all shipments; thus, “priced volume” is less than “shipped volume.” Average prices are based on the priced volume only.
$0
$20
$40
$60
$80
$100
2004 2005 2006 2007 2008 2009 2010
$/Bo
x FO
B
Org Rainier Org Bing All Conventional
$56
$65
$35
$57
$0
$10
$20
$30
$40
$50
$60
$70
0
100
200
300
400
500
600
700
2007 2008 2009 2010
$/Bo
x FO
B
Boxe
s * 1
000
Priced Boxes Shipped Boxes Box price

13
nectarine acreage more than quadrupled between 2007 and 2009, to 1,238 acres but then leveled off in 2010 at 1,250 acres. Apricot acreage tripled over a 3-year period, with 300 certified acres in 2010. Washington plum and prune acreage doubled after 2007 but leveled off in 2010 at 125 acres. Stone fruit acreage increased slightly in 2010, except for plum and prune acreage, which decreased by 5 acres. Stone fruits, not including cherries, comprised 8% of Wash-ington organic tree fruit acreage. With few transition acres now being reported, minimal growth is pre-dicted for the near future. As with cherries, spotted wing drosophila may emerge as a potential barrier to continued expansion of organic stone fruit produc-tion in the region.
Organic Tree Fruit Distribution by County
Washington tree fruit production, both conventional and organic, is located primarily in the irrigated central regions of the state. Some producers may have acres in more than one county, which, histori-cally, have not been segregated by the certifier but instead have been reported in the producer’s primary county. Estimated values are presented to show tree fruit production trends and contributions to differ-ent county economies. Figures 15 and 16 and Tables A21 through 27 present the current and historical county distribution for organic and transition tree fruit acreage. Grant County leads in certified apple acreage, with an estimated 40% (over 6,000 acres) of the state total in 2010. The county experienced rapid growth in organic apple acreage beginning in 2007, and acreage continued to increase (6%) from 2009 to 2010, while during the same period, Douglas (1,869),
Yakima (1,400), and most other county apple acres decreased. The Okanogan County certified organic apple acreage also experienced annual growth (12%) in 2010, while Grant and Benton Counties had the highest number of transition apple acres, with 238 and 212 acres, respectively (Tables A21 and A22).
Organic pear acres are located primarily in Yakima (567), Okanogan (535), and Chelan (436) Counties, representing 75% of all organic pear acreage. Okanogan County was an early leader with nearly 800 acres in 2001, but by 2005 this number had dropped 55%, to 350 acres. Chelan and Yakima Counties experienced a somewhat different growth pattern, trending upward until 2005 at which time they also went through a few years of declining acreage. Since 2008, moderate growth has occurred in each of these counties, and in 2010, the amount of Yakima County acreage appears to have surpassed the acreage in Okanogan County. Also, Klickitat County producers transitioned the highest number of pear acres (164) during 2007 and 2008 (Tables A23 and A24). Again, with these smaller acreages, just one or two producers entering or exiting organic production can have a large impact on the total amount of county and state acreage.
In 2010, Grant, Yakima, and Chelan Counties had 527, 443, and 346 acres of organic cherries, respec-tively. These counties experienced rapid expansion from 2006 to 2009, followed in 2010 by declines in acreage of 6% for Chelan County and 30% each for Grant and Yakima Counties. Bucking the downward trend, Benton and Walla Walla Counties organic cherry acreage increased to 308 and 108 acres, re-spectively. Grant, Walla Walla, and Chelan County producers had a minor number of transition acres in 2010 (Tables A25 and A26).
0
100
200
300
400
500
600
700
800
2001 2003 2005 2007 2009 2011
Acre
s
Plum/Prune Apricot Nectarine Peach
Figure 14. Washington certified organic stone fruit acreage (excluding cherry).

14
Figure 15. Distribution of certified organic Washington tree fruit acres by county in 2010.
Figure 16. Historical distribution of certified organic Washington apple acres by county.
Other organic stone fruit acres are primarily located in Franklin County, which, in 2010, had 436 acres of peaches, 315 acres of nectarines, 102 acres of apricots, 27 acres of plums, as well as 52% of the total number of other stone fruit acres. Benton and Yakima Counties each had about 12% of other stone fruit acres. Only 36 transition acres were reported statewide in 2010, including 20 acres of apricot in Franklin County and 16 acres of nectarine in Yakima County (Table A27).
National and Global Acreage
According to the 2008 Organic Production Survey (OPS), Washington State ranked first, nationally, for harvested acres of organic apples (65%), pears
(61%), and cherries (72%), second for organic plums and prunes, and third for organic peaches (USDA-NASS 2010). More recent U.S. information is only available for a few states. National organic tree fruit production is primarily located in the irrigated, semi-arid regions of the western U.S., where climatic conditions and reduced pest pressure make organic production of high quality fruit most feasible. Over 95% of organic apple acres are located in this region (Figure 17; Table A28). Washington organic acreage expansion fueled the national organic apple trend, and by 2003, more than 50% of U.S. organic apple acres were located within the state, increasing to an estimated 74% in 2009. Washington organic tree fruit producers are major suppliers for national markets, and state production acreage makes up a
01,0002,0003,0004,0005,0006,0007,0008,000
Acre
s
Apple Pear Cherry Other Stone Fruit
0
1,000
2,000
3,000
4,000
5,000
6,000
7,000
2001 02 03 04 05 06 07 08 09 2010
Acre
s
Grant Yakima DouglasOkanogan Franklin Chelan

15
Figure 17. Trend in estimated U.S. organic apple acreage. (East/Midwest trend line based on ERS and select certifier data. The OPS data point is for 2008 only.)
substantial percentage of global acreage as well. A few western states (e.g., Colorado and Arizona) have experienced considerable declines in organic apple acreage, likely a result of market competition, lower demand varieties, or production challenges.
The USDA-ERS (2010) reported Midwestern certified organic apple acres at 655 for 2008, with over 500 of those acres located in Michigan, according to certifier data. Northeastern organic apple acreage exceeded 400 acres in 2006 (a 12% increase from 2005), with over 90% of the acres located in New York and Maine. The certifier data showed a decrease (to 189 acres) in Northeastern acres by 2008. However, it is likely that numbers reported to the ERS underestimate that region’s organic apple acreage since several certifiers in that region only report aggregate fruit and vegetable acreage numbers. The 2008 OPS (USDA-NASS 2010), which showed just over 900 certified apple acres in the Northeast, is likely a better measure for that region (C. Greene personal communication).
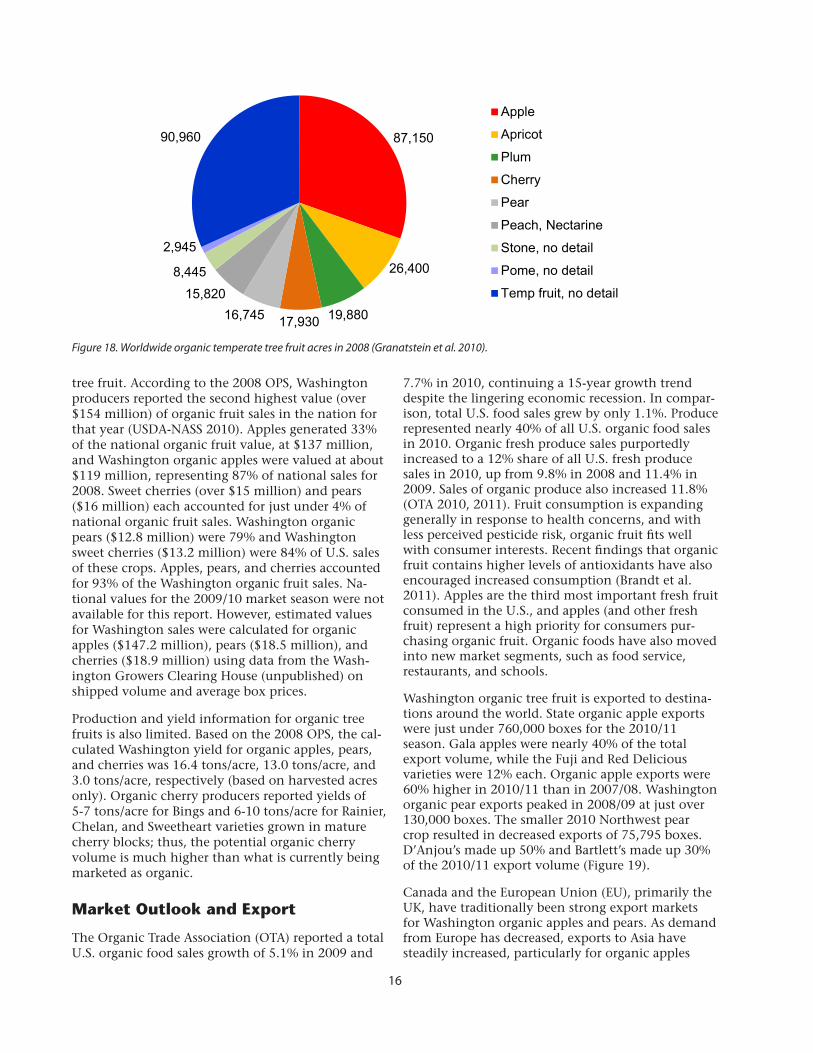
The amount of national organic tree fruit acreage is important globally. Worldwide organic temperate tree fruit acreage for 2008 is shown in Figure 18. The U.S. led the world in reported organic apple acreage, with nearly 20% of the acres under organic manage-ment (including transition acres) located in the state of Washington. Argentina and Chile combined had 6,400 acres of organic apples in 2008, while Europe had over 57,000. Poland, Italy, Turkey, and Germany all have substantial production acreages as well (Granatstein et al. 2010a). In the South Tyrol region of Italy, organic apple acreage more than doubled, from 1,280 acres in 2000 to over 2,800 acres in 2010, representing 7% of the region’s total apple acreage (U. Kiem personal communication).
Washington producers managed 13% of the world’s reported organic pear acres (ranking just behind Argentina and Italy with reported acreages of 3,900 and 3,600 acres, respectively). Italy is the primary European organic pear producer with over half the region’s acres (Granatstein et al. 2010a). China also has grown organic tree fruit, and the Organic Food Development Center (OFDC) reported that in 2005, 3,900 acres of apples and 2,900 acres of pears were under organic management (Z. Zejiang personal communication). However, no specific data have been made available beyond this time period.
The U.S. ranked third, behind Italy (7,400) and Turkey (3,500), for global organic sweet cherry acres, and Washington’s share was 15%. Together, Cali-fornia and Washington accounted for 20% of the world’s reported organic peach and nectarine acre-age, and 15% of the world’s organic plum and prune acres were located in California (Granatstein et al. 2010a) (Figure 18).
Unfortunately, worldwide organic tree fruit data are not always segregated by fruit type. Thus, nearly one-third of the area reported to FiBL as temperate tree fruit acres (as part of their 2008 global survey) provided no further detail.
Overall Value and Production
Annual farmgate sales figures for Washington organic tree fruit were not available for this report. While some certifiers do collect producer sales data by specific crop, typically only the total crop values per farm are entered into their databases, making it dif-ficult to track the value of individual crops, including
0
5,000
10,000
15,000
20,000
25,000
1997 1999 2001 2003 2005 2007 2009
Acre
s
USA West WA East/Midwest
16
tree fruit. According to the 2008 OPS, Washington producers reported the second highest value (over $154 million) of organic fruit sales in the nation for that year (USDA-NASS 2010). Apples generated 33% of the national organic fruit value, at $137 million, and Washington organic apples were valued at about $119 million, representing 87% of national sales for 2008. Sweet cherries (over $15 million) and pears ($16 million) each accounted for just under 4% of national organic fruit sales. Washington organic pears ($12.8 million) were 79% and Washington sweet cherries ($13.2 million) were 84% of U.S. sales of these crops. Apples, pears, and cherries accounted for 93% of the Washington organic fruit sales. Na-tional values for the 2009/10 market season were not available for this report. However, estimated values for Washington sales were calculated for organic apples ($147.2 million), pears ($18.5 million), and cherries ($18.9 million) using data from the Wash-ington Growers Clearing House (unpublished) on shipped volume and average box prices.
Production and yield information for organic tree fruits is also limited. Based on the 2008 OPS, the cal-culated Washington yield for organic apples, pears, and cherries was 16.4 tons/acre, 13.0 tons/acre, and 3.0 tons/acre, respectively (based on harvested acres only). Organic cherry producers reported yields of 5-7 tons/acre for Bings and 6-10 tons/acre for Rainier, Chelan, and Sweetheart varieties grown in mature cherry blocks; thus, the potential organic cherry volume is much higher than what is currently being marketed as organic.
Market Outlook and Export
The Organic Trade Association (OTA) reported a total U.S. organic food sales growth of 5.1% in 2009 and
7.7% in 2010, continuing a 15-year growth trend despite the lingering economic recession. In compar-ison, total U.S. food sales grew by only 1.1%. Produce represented nearly 40% of all U.S. organic food sales in 2010. Organic fresh produce sales purportedly increased to a 12% share of all U.S. fresh produce sales in 2010, up from 9.8% in 2008 and 11.4% in 2009. Sales of organic produce also increased 11.8% (OTA 2010, 2011). Fruit consumption is expanding generally in response to health concerns, and with less perceived pesticide risk, organic fruit fits well with consumer interests. Recent findings that organic fruit contains higher levels of antioxidants have also encouraged increased consumption (Brandt et al. 2011). Apples are the third most important fresh fruit consumed in the U.S., and apples (and other fresh fruit) represent a high priority for consumers pur-chasing organic fruit. Organic foods have also moved into new market segments, such as food service, restaurants, and schools.
Washington organic tree fruit is exported to destina-tions around the world. State organic apple exports were just under 760,000 boxes for the 2010/11 season. Gala apples were nearly 40% of the total export volume, while the Fuji and Red Delicious varieties were 12% each. Organic apple exports were 60% higher in 2010/11 than in 2007/08. Washington organic pear exports peaked in 2008/09 at just over 130,000 boxes. The smaller 2010 Northwest pear crop resulted in decreased exports of 75,795 boxes. D’Anjou’s made up 50% and Bartlett’s made up 30% of the 2010/11 export volume (Figure 19).
Canada and the European Union (EU), primarily the UK, have traditionally been strong export markets for Washington organic apples and pears. As demand from Europe has decreased, exports to Asia have steadily increased, particularly for organic apples
Figure 18. Worldwide organic temperate tree fruit acres in 2008 (Granatstein et al. 2010).
87,150
26,400
19,88017,93016,74515,820
8,445
2,945
90,960
Apple
Apricot
Plum
Cherry
Pear
Peach, Nectarine
Stone, no detail
Pome, no detail
Temp fruit, no detail

17
Figure 19. Washington organic apple and pear exports. The chart shown in Figure 19 is based on unpublished industry data.
(Figure 20). Exports to Mexico have been volatile in response to tariff issues, while markets in the Middle East and Africa, particularly Dubai, India, and Israel have grown. Canada’s share of Washington organic apple exports increased to 57% (435,000 boxes) by 2010/11, up from a 40% share in the 2007/08 season. In contrast, shipments to Europe decreased from 43% of the total state exports in 2008/09 to just 13% in 2010/11. Washington organic apple exports to Asia increased from a 5% share (31,864 boxes) in 2007/08 to 15% (111,308 boxes) in 2010/11. Shipments to Mexico ranged from 8% (2008/09) to 3% (2009/10) of total Washington organic apple exports. Exports to the Middle East and African regions, although not steady, have increased from 2% to 4%.
Export patterns for Washington organic pears were similar to those of apple exports, with a few excep-
tions. Canada’s share of Washington organic pear exports increased from 50% to 65% (47,996 boxes) from 2007/08 to 2010/11. Exports to Europe de-creased from a peak of 35% to a low of 10%. Wash-ington organic pear shipments to Asia more than doubled, reaching 7% of the state’s total shipments, while pear shipments to the Middle East and African regions dropped from 4% to 2% during the same period. Export share to Mexico increased to 13% in 2010/11, after falling to less than 7% the previous year; less than 2% of organic apple exports and 5% of organic pear exports were destined for Latin America.
It appears that European countries are meeting more of their own organic fruit demand by means of increased internal production as well as counter-sea-sonal imports from Argentina and Chile. Such trends may limit U.S. sales in the EU markets. For example,
0100200300400500600700800900
07/08 08/09 09/10 10/11
Org
anic
Exp
orts
(Box
es*1
000)
Washington Apple Washington Pear
0
100
200
300
400
500
2007/08 2008/09 2009/10 2010/11
Org
anic
App
le E
xpor
ts
(Box
es*1
000)
Canada EU Asia/S. Pac Mexico MidEast/Africa
Figure 20. Washington organic apple exports by region.The chart shown in Figure 20 is based on unpublished industry data.

18
the South Tyrol region of Italy produced 2.1 million boxes of organic apples in 2008, mostly for export within the EU. And Germany, for the first time, was able to supply its internal market demand up until June of the 2007/08 market season, and their organic apple sales volume increased to 1.4 million boxes in 2008 (A. Kasbohm personal communication).
According to Servicio Nacional de Sanidad y Cali-dad Agroalimentaria (SENASA), Argentina exported 0.9 million boxes of organic apples (40 lb. SEB) in 2009, with 78% destined for the EU and 9% going to the U.S. Argentine organic apple exports were up nearly 10% compared to 2008. Argentina also ex-ported 1.1 million boxes of organic pears (44 lb. SEB) in 2008, and in 2009 it exported 1.46 million boxes, with 57% destined for the EU and 22% going to the U.S. This volume of Argentine organic pears exported to the U.S. (~328,000 boxes) was about half the total volume of organic pears shipped by Washington and Oregon in the 2008/09 season.
Washington organic cherry export information was not available for this report. Although the organic sweet cherry area in Chile is small (150 acres in 2008), counter-season product is making its way to the U.S. market. Off-season prices appear to be much lower than U.S. summer product prices, according to the USDA’s Agricultural Marketing Service (USDA-AMS) Fruit and Vegetable Market News online data (unpublished).
Conclusion
The long-term outlook for organic tree fruit produc-tion in Washington continues to be positive. How-ever, the challenge of matching the growth in supply with the growth in demand continues. With Wash-ington’s favorable climate, producers can increase supply rapidly and overshoot demand. Washington organic apple sales volume increased significantly during the 2008/09 and the 2009/10 marketing years. Prices for both organic and conventional tree fruit, particularly apples, dropped during the 2008/09 marketing year, resulting in much lower organic pre-miums. Growers apparently responded to this market shift by scaling back on additional new acreage for organic production.
Pest management research for conventional fruit has increasingly provided technology that is useful to organic growers. However, the loss of antibiotics used for fire blight control, such as streptomycin and oxytetracycline (de-listing currently slated for Octo-ber 2014 by the National Organic Standards Board) will increase the economic risk of organic apple and pear production, at least until suitable replacements
are found. According to a growers’ survey, 76% of the organic apple and pear growers in the state said they would reduce or eliminate their organic apple and pear production if a de-listing of antibiotics occurred (Granatstein et al. 2010b). Organic tree fruit produc-tion may also be negatively affected by the emer-gence of new pests in the region, such as spotted wing drosophila and brown marmorated stink bug, along with the potential lack of effective organically compliant control methods. However, in June 2011, the EPA approved an additional-use label for an insecticide containing azadirachtin and pyrethrins that may help manage stink bugs that infest organic fruit production systems.
Economic factors will clearly influence future acre-age trends for organic tree fruit in Washington. Price fluctuations for organic apples are strongly corre-lated with fluctuations in conventional apple prices, which indicate that both sectors are influenced by similar forces, such as overall crop or fruit size in a given year. In a 2010 organic tree fruit growers’ sur-vey, about 20% of respondents said that yields and packouts were either unchanged or increased with organic production, whereas 30% said yields and packouts declined by 10% (Granatstein unpublished data). Alternate bearing (a heavy crop one year, a light crop the next) and small fruit size were the main causes cited for reduced yields. Fifteen percent said their organic cost of production was similar to or lower than comparable conventional costs, while 57% said it was more expensive by 20% or more. Thus, if many growers experience both reduced out-put and increased costs, a substantial organic pre-mium will be needed if they are to remain in organic production. Additional economic studies are needed to understand the cost structure for organic produc-tion and to determine what areas of research could best contribute to lowering expenses. A WSU enter-prise budget for organic Gala apples that calculates total costs and break-even prices for different yield levels has been completed (Galinato et al. 2011). Since enterprise budgets for organic pears have not been developed, it is not possible to evaluate the profitability of organic pears given the limited data currently available. Information on organic premi-ums is not enough to determine producer profit-ability, since the costs of organic production as well as yields, packout percentages, and packing costs will strongly affect the prices that will be required if growers are to reach a break-even point. Understand-ing the cost of production is necessary in order to determine if the prices reflected in this report indi-cate profitability. This information is also needed to determine what levels of profitability can sustain the organic tree fruit sector.
19
References
Brandt, K., C. Leifert, R. Sanderson, and C. Seal. 2011. Agroecosystem management and nutri-tional quality of plant foods: The case of organic fruits and vegetables. Critical Reviews in Plant Sciences 30: 177-197.
Galinato, S., D. Granatstein, and M. Taylor. 2011. 2010 Cost estimates of establishing and pro-ducing organic apples in Washington. Wash-ington State University Extension Fact Sheet FS041E. https://pubs.wsu.edu/ItemDetail.aspx?ProductID=15437.
Granatstein, D., E. Kirby, and H. Willer. 2010a. Organic horticulture expands globally. Chronica Horticulturae 50 (4): 31-38. http://www.actahort.org/chronica/pdf/ch5004.pdf.
Granatstein, D., N. Leher, and M. LaPierre. 2010b. Organic orchards: Needs and priorities. Presen-tation and grower survey at the Wilbur-Ellis organic grower meeting, Prosser, WA, Feb. 19, 2010. Accessed Mar. 12, 2012. http://csanr.wsu.edu/publications/presentations/Research_Priori-ties_WE_2010.pdf.
Granatstein, D. and P. Dauer. 2000. Trends in or-ganic tree fruit production in Washington State. Washington State University Extension Bulletin EB1898E. http://cru.cahe.wsu.edu/CEPublica-tions/eb1898e.pdf.
Karst, T. 2011. Organic cherry shipments grow slowly. The Packer Organic Insider. May 27, 2011. http://www.thepacker.com/fruit-vegetable-news/crops-markets/Organic-cherry-shipments-grow-slowly-122723559.html.
Kirby, E. and D. Granatstein. 2010. Recent trends in organic tree fruit production: 2010. Revised Dec.12, 2010. http://csanr.wsu.edu/publications/presentations/wa_orgtreefr_2010.pdf.
Organic Trade Association. 2011. U.S. Organic Industry Overview. OTA, Greenfield, MA. Accessed Mar. 12, 2012. http://www.ota.com/pics/documents/2011OrganicIndustrySurvey.pdf.
Organic Trade Association. 2010. U.S. Organic Industry Overview. OTA, Greenfield, MA. Accessed Mar.12, 2012. http://www.ota.com/pics/documents/2010OrganicIndustrySurveySummary.pdf.
O’Rourke, D. 2008. Will the organic gamble pay off? Presentation at the Annual Meeting of the Wash-ington State Horticulture Association, Yakima, WA, Dec. 3, 2008. Accessed Mar.12, 2012. http://
organic.tfrec.wsu.edu/OrganicIFP/OrganicFruit-Production/Will_the_Organic_Gamble.pdf.
Ostenson, H. 2011. Considering organic cherries as part of your orchard business game plan suc-cess. Presentation at the University of California Cooperative Extension Organic Tree Fruit Meet-ing, Courtland, CA, Feb. 23, 2011. Accessed Mar. 12, 2012. http://cesacramento.ucdavis.edu/files/77586.pdf.
Servicio Nacional de Sanidad y Calidad Agroalimen-taria (SENASA). 2010. Situacion de la Produccion Organica en la Argentina Durante el Ano 2009. Issued March 2010. http://www.senasa.gov.ar/Archivos/File/File3277-informe-estadistico-2009.pdf.
USDA-ERS. 2010. Table 11: Acres of tree nuts, citrus, apples, grapes, and unclassified fruits by state, 1997 and 2000-2008. Organic Production Data Sets. Last modified Sept.14, 2010. http://www.ers.usda.gov/Data/Organic/.
USDA-NASS. Washington State Field Office. 2011. Washington fruit & nut crops: Production, price, and value, 2008–2010. Washington Agri-Facts. Posted online July 13, 2011. http://www.nass.usda.gov/Statistics_by_State/Washington/Publi-cations/Agri-facts/agri1jul.pdf.
USDA-NASS. 2010. 2007 Census of Agriculture: 2008 Organic Production Survey. Updated July 2010. http://www.agcensus.usda.gov/Publica-tions/2007/Online_Highlights/Organics/.
USDA-NASS. 2009. 2007 Census of Agriculture. Updat-ed December 2009. http://www.agcensus.usda.gov/.
USDA-NASS. Washington State Field Office. 2006. Tree fruit: Acres by area, Washington, January 1, 1986, 1993, 2001, 2006. Washington Fruit Survey Highlights. Posted online Dec. 4, 2006. http://www.nass.usda.gov/Statistics_by_State/Washing-ton/Publications/Fruit/WaFruitHighlights2006.pdf.
Willer, H. and L. Kilcher, eds. 2010. The World of Organic Agriculture. Statistics and Emerging Trends 2010 (Data 2008). IFOAM, Bonn, Germany and FiBL, Frick Germany. http://www.organic-world.net/fileadmin/documents/yearbook/2010/world-of-organic argriculture-2010.pdf.
20
Appendix Tables
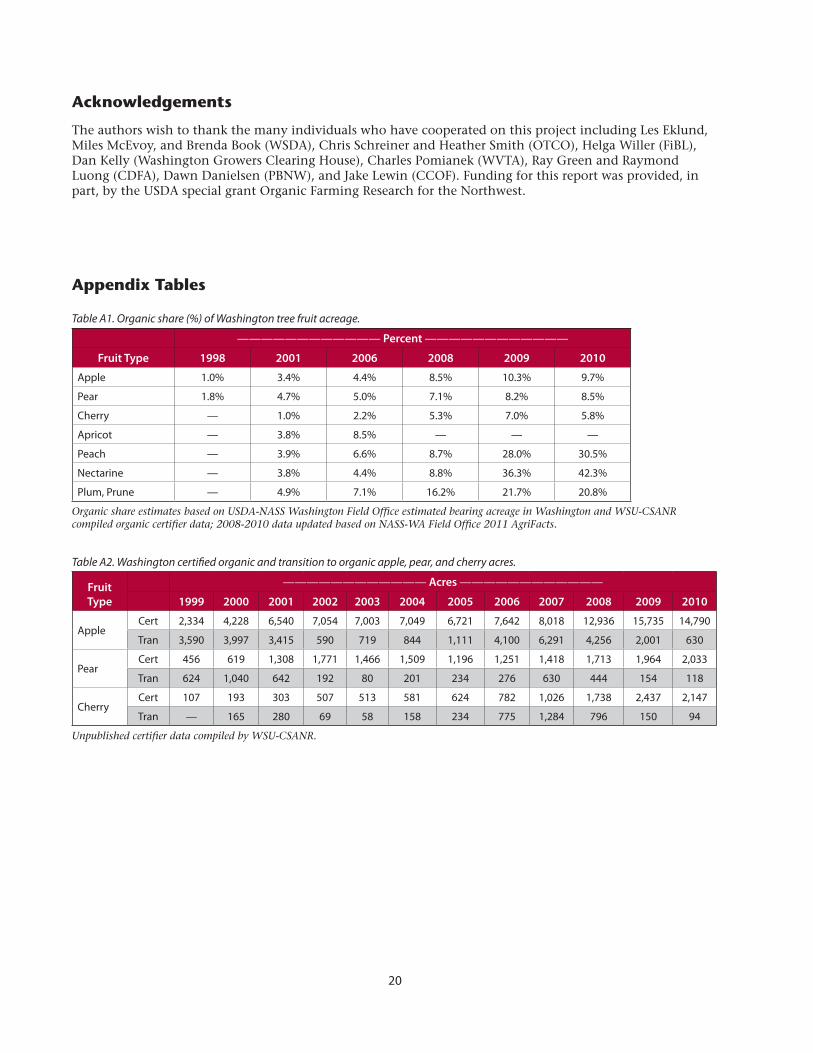
Table A1. Organic share (%) of Washington tree fruit acreage.
———————————— Percent ————————————
Fruit Type 1998 2001 2006 2008 2009 2010
Apple 1.0% 3.4% 4.4% 8.5% 10.3% 9.7%
Pear 1.8% 4.7% 5.0% 7.1% 8.2% 8.5%
Cherry — 1.0% 2.2% 5.3% 7.0% 5.8%
Apricot — 3.8% 8.5% — — —
Peach — 3.9% 6.6% 8.7% 28.0% 30.5%
Nectarine — 3.8% 4.4% 8.8% 36.3% 42.3%
Plum, Prune — 4.9% 7.1% 16.2% 21.7% 20.8%
Organic share estimates based on USDA-NASS Washington Field Office estimated bearing acreage in Washington and WSU-CSANR compiled organic certifier data; 2008-2010 data updated based on NASS-WA Field Office 2011 AgriFacts.
Table A2. Washington certified organic and transition to organic apple, pear, and cherry acres.
Fruit Type
———————————— Acres ————————————
1999 2000 2001 2002 2003 2004 2005 2006 2007 2008 2009 2010
AppleCert 2,334 4,228 6,540 7,054 7,003 7,049 6,721 7,642 8,018 12,936 15,735 14,790
Tran 3,590 3,997 3,415 590 719 844 1,111 4,100 6,291 4,256 2,001 630
PearCert 456 619 1,308 1,771 1,466 1,509 1,196 1,251 1,418 1,713 1,964 2,033
Tran 624 1,040 642 192 80 201 234 276 630 444 154 118
CherryCert 107 193 303 507 513 581 624 782 1,026 1,738 2,437 2,147
Tran — 165 280 69 58 158 234 775 1,284 796 150 94
Unpublished certifier data compiled by WSU-CSANR.
Acknowledgements
The authors wish to thank the many individuals who have cooperated on this project including Les Eklund, Miles McEvoy, and Brenda Book (WSDA), Chris Schreiner and Heather Smith (OTCO), Helga Willer (FiBL), Dan Kelly (Washington Growers Clearing House), Charles Pomianek (WVTA), Ray Green and Raymond Luong (CDFA), Dawn Danielsen (PBNW), and Jake Lewin (CCOF). Funding for this report was provided, in part, by the USDA special grant Organic Farming Research for the Northwest.

21
Table A3. Changes in estimated Washington certified organic tree fruit acreage.
YearApples (acres)
Annual Change (acres)
Annual Change
%Pears
(acres)
Annual Change (acres)
Annual Change
%
Stone Fruit
(acres)
Annual Change (acres)
Annual Change
%
1988 109 — — 29 — — 36 — —
1989 365 256 235 31 2 7 85 49 136
1990 1,632 1,267 347 164 133 429 269 184 216
1991 1,253 -379 -23 344 180 110 197 -72 -27
1992 930 -323 -26 336 -8 -2 173 -24 -12
1993 807 -123 -13 323 -13 -4 131 -42 -24
1994 849 42 5 339 16 5 161 30 23
1995 861 12 1 320 -19 -6 149 -12 -7
1996 1,115 254 30 361 41 13 163 14 9
1997 1,634 519 47 411 50 14 194 31 19
1998 1,809 175 11 449 38 9 208 14 7
1999 2,334 525 29 456 7 2 216 8 4
2000 4,228 1,894 81 619 163 36 385 169 78
2001 6,540 2,312 55 1,308 689 111 588 203 53
2002 7,054 514 8 1,771 470 36 899 311 53
2003 7,003 -51 -1 1,466 -305 -17 884 -15 -2
2004 7,049 46 0.7 1,509 43 3 910 26 3
2005 6,721 -328 -5 1,196 -313 -21 1,038 128 14
2006 7,642 921 14 1,251 55 5 1,217 179 17
2007 8,018 376 5 1,418 167 13 1,523 306 25
2008 12,936 4,918 61 1,713 295 21 2,334 811 53
2009 15,735 2,799 22 1,964 251 15 4,100 1,766 76
2010 14,790 -945 -6 2,033 69 4 3,835 -265 -6
Unpublished certifier data compiled by WSU-CSANR.
Table A4. Projected short-term growth for Washington organic apples.
Acres Transition (T) or Certified (C) %
GrowthProjected % Growth
Boxes shipped(1000s)
% Variety acres
% *Variety shipped
Variety T2008 C2009 T2009 C2010 T2010 2009-10 2010-12 2009/10* 2009 2009
Gala 838 3,458 365 3,201 195 -8% 6% 1,678 22% 28%
Fuji 1,179 3,045 865 3,366 267 11% 7% 1,288 19% 22%
Red Delicious 468 1,676 38 1,461 31 -13% 2% 758 11% 13%
Granny 360 1,700 18 1,470 -- -14% 0% 479 11% 8%
Golden Types 286 1,557 42 1,058 -- -32% 0% 410 10% 7%
Cripps Pink 206 1,081 133 1,016 44 -6% 4% 472 7% 8%
Braeburn 219 1,083 113 884 14 -18% 2% 328 7% 6%
Honeycrisp 300 879 246 1,099 44 25% 4% 210 6% 4%
Others & NS 400 1,256 181 1,235 -- -2% 3% 291 8% 5%
Total 4,256 15,735 2,001 14,790 630 -6% 4% 5,914 100% 100%
*Shipped box values are from unpublished Washington Growers Clearing House data. Shipped volume totaled 6.9 million boxes of organic apples in the 2010/11 market season, based on 40 lb. standard equivalent boxes (SEB). Unpublished certifier acreage data was compiled by WSU-CSANR.
22
Table A5. Organic share of total (conventional and organic combined) Washington apple sales volume.
—————————— Percent ——————————
Variety 2005/06 2006/07 2007/08 2008/09 2009/10
Red Delicious 1.5 1.9 1.7 2.1 2.5
Golden Delicious 2.5 3.2 3.7 3.8 4.0
Granny Smith 2.2 3.1 3.2 4.2 4.0
Gala 4.2 4.4 4.6 8.0 8.7
Fuji 3.7 4.9 5.1 7.6 10.0
Jonagold 1.9 1.9 3.1 3.6 5.3
Braeburn 6.7 7.0 7.4 12.7 10.1
Cameo 7.1 5.0 8.6 11.4 11.0
Cripps Pink 7.9 13.1 11.7 13.1 17.6
Honeycrisp 0.0 5.3 4.8 9.6 11.0
Other 3.7 5.3 5.5 5.8 5.4
Organic sales volume share for Washington apples, all varieties 2.9 3.6 3.8 5.4 6.1
Organic shares were calculated using unpublished Washington Growers Clearing House data.
Table A6. Estimated average weighted Washington organic apple prices ($/box FOB).
—————————— Market Year ——————————
Variety 00/01 01/02 02/03 03/04 04/05 05/06 06/07 07/08 08/09 09/10 10/11
Red Delicious $14.06 $18.73 $17.00 $22.89 $17.34 $20.72 $20.95 $26.98 $19.36 $20.37 $18.47
Golden Delicious $16.04 $21.21 $21.46 $25.64 $17.57 $24.41 $29.30 $33.59 $20.90 $25.68 $24.72
Granny Smith $25.53 $19.86 $21.62 $24.26 $22.57 $23.33 $24.98 $28.52 $20.36 $24.38 $27.17
Fuji $19.02 $20.23 $26.31 $27.73 $20.88 $27.73 $32.01 $35.76 $22.25 $25.93 $24.49
Gala $20.62 $20.95 $21.60 $24.56 $20.88 $23.76 $29.57 $31.86 $23.67 $25.75 $25.88
Braeburn $20.87 $22.51 $24.79 $27.33 $20.93 $24.83 $26.49 $28.21 $17.66 $19.81 $19.17
Jonagold $15.80 $18.22 $17.45 $21.00 $18.18 $20.35 $26.04 $27.28 $23.70 $21.58 $21.88
Cameo $21.22 $21.57 $24.22 $29.01 $23.25 $27.56 $27.75 $26.99 $17.51 $20.11 $19.46
Cripps Pink $31.60 $32.01 $37.11 $31.28 $22.82 $26.83 $27.47 $34.94 $20.54 $25.94 $25.75
Ginger Gold $20.37 $18.62 $23.36 $15.15 $20.01 $24.11 $27.47 $32.74 $28.71 $23.16 $24.75
Honeycrisp — — — — $52.59 $51.70 $59.80 $65.66 $52.04 $45.82 $49.22
Average, all varieties $16.99 $20.41 $21.55 $25.22 $20.19 $24.54 $27.96 $32.36 $22.09 $24.94 $23.55
Washington Growers Clearing House unpublished data. Prices are based on market year averages (all grades, sizes, and storage); SEB 42 lb. through 06/07and 40 lb. beginning 07/08.

23
Table A7. Price premiums ($/box FOB) for Washington organic apples by variety.
—————————————— Market Year——————————————
Variety 00/01 01/02 02/03 03/04 04/05 05/06 06/07 07/08 08/09 09/10 10/11
Red Delicious $4.02 $6.27 $4.66 $7.86 $6.14 $6.29 $4.87 $7.75 $4.99 $4.04 $0.45
Goldens $2.25 $3.96 $5.73 $6.73 $4.95 $9.03 $7.09 $11.94 $6.37 $6.55 $6.34
Granny Smith $9.42 $4.19 $4.25 $4.48 $7.92 $6.40 $7.42 $7.69 $5.48 $5.28 $7.02
Fuji $6.30 $3.13 $5.85 $6.42 $5.42 $8.61 $9.94 $11.82 $4.37 $3.94 $4.77
Gala $6.86 $3.58 $3.38 $5.10 $6.20 $7.03 $8.08 $10.67 $3.67 $5.12 $5.50
Braeburn $7.17 $4.77 $6.03 $8.62 $7.15 $8.56 $7.68 $9.26 $2.37 $3.82 $2.36
Jonagold $2.14 $2.39 $0 $1.53 $3.02 $3.13 $6.46 $7.10 $5.98 $3.87 $4.95
Cameo $6.62 $4.06 $6.54 $10.27 $8.21 $9.97 $8.02 $7.22 $2.02 $3.09 $1.29
Cripps Pink $15.08 $11.57 $11.33 $9.11 $4.53 $4.78 $0.00 $6.91 $0 $2.59 $1.68
Ginger Gold — — — — — — — $8.95 $5.49 $8.64 $6.53
Honeycrisp — — — — — — — $21.00 $7.86 $5.21 $3.41
Average, all varieties $5.02 $5.59 $6.24 $7.30 $6.94 $8.35 $9.54 $11.19 $5.39 $5.85 $3.76
Price premium is difference between organic and conventional prices. Premiums were calculated using unpublished Washington Growers Clearing House market year averages (all grades, sizes, and storage); SEB 42 lb. through 06/07and 40 lb. beginning 07/08.
Table A8. Price premiums (in percent) for Washington organic apples by variety.
—————————————— Market Year—————————— ————
Variety 00/01 01/02 02/03 03/04 04/05 05/06 06/07 07/08 08/09 09/10 10/11
Red Delicious 40% 50% 38% 52% 55% 44% 30% 40% 35% 25% 2%
Goldens 16% 23% 36% 36% 39% 59% 32% 55% 44% 35% 34%
Granny Smith 58% 27% 24% 23% 54% 38% 42% 37% 37% 28% 35%
Fuji 50% 18% 29% 30% 35% 45% 45% 49% 24% 18% 24%
Gala 50% 21% 19% 26% 42% 42% 38% 50% 18% 25% 27%
Braeburn 52% 27% 32% 46% 52% 53% 41% 49% 16% 24% 14%
Jonagold 16% 15% 0% 8% 20% 18% 33% 35% 34% 22% 29%
Cameo 45% 23% 37% 55% 55% 57% 41% 37% 13% 18% 7%
Cripps Pink 91% 57% 44% 41% 25% 22% 0% 25% 0% 11% 7%
Ginger Gold — — — — — — — 38% 24% 60% 36%
Honeycrisp — — — — — — — 53% 82% 87% 93%
Price premium is percentage difference between organic and conventional prices. Premiums were calculated using unpublished Washington Growers Clearing House market year averages (all grades, sizes, and storage); SEB 42 lb. through 06/07and 40 lb. beginning 07/08.

24
Table A9. Washington organic apple price premium comparisons by variety ($/box FOB).
——————— Market Year ———————
Variety5-year average
2003/04 to 07/08 07/08 10/115-year average
2006/07 to 10/11
Gala $7.42 $10.67 $5.50 $6.61
Fuji $8.44 $11.82 $4.77 $6.97
Red Delicious $6.58 $7.75 $0.45 $4.86
Golden Delicious $7.95 $11.94 $6.34 $7.66
Granny Smith $6.78 $7.69 $7.02 $6.58
Cripps Pink $5.07 $6.91 $1.68 $2.24
Braeburn $8.25 $9.26 $2.36 $5.10
Price premium is difference between organic and conventional prices. Premiums were calculated using unpublished Washington Growers Clearing House market year averages (all grades, sizes, and storage); SEB 42 lb. through 06/07and 40 lb. beginning 07/08.
Table A10. Modeled prices for Washington organic apples with increasing sales volume.
Organic shipments as % of all Washington apple shipments
6% 8% 10% 12%
Model box price, all apples Predicted organic price ($/box FOB)
$20.00 $ 26.77 $ 24.45 $ 22.13 $ 19.82
$17.00 $ 22.75 $ 20.78 $ 18.81 $ 16.85
$14.00 $ 18.74 $ 17.11 $ 15.49 $ 13.87
Actual organic share of sales volume = 6% for 2009/10 season
All Apples Organic Apples
Actual average box price (FOB) $19.05 $24.89
Model: D. O’Rourke, 2008; 2009/10 Washington Growers Clearing House price data.
Table A11. Effect of fruit size on average box price (expressed as percent difference from size 80-88) for organic Gala apple (WAXF#1).
Market Year Size 100 Size 113
2005/06 -15% -29%
2006/07 -10% -25%
2007/08 -14% -24%
2008/09 -15% -35%
2009/10 -9% -22%
2010/11 -4% -17%
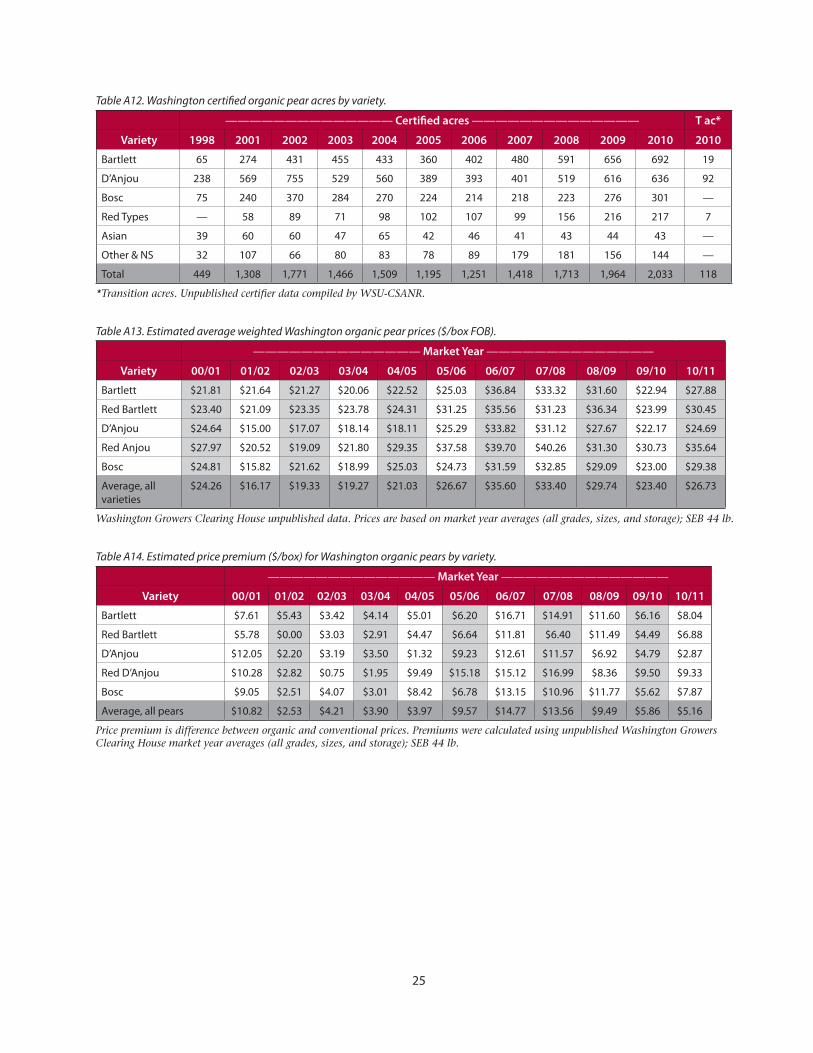
25
Table A12. Washington certified organic pear acres by variety.
—————————————— Certified acres —————————————— T ac*
Variety 1998 2001 2002 2003 2004 2005 2006 2007 2008 2009 2010 2010
Bartlett 65 274 431 455 433 360 402 480 591 656 692 19
D’Anjou 238 569 755 529 560 389 393 401 519 616 636 92
Bosc 75 240 370 284 270 224 214 218 223 276 301 —
Red Types — 58 89 71 98 102 107 99 156 216 217 7
Asian 39 60 60 47 65 42 46 41 43 44 43 —
Other & NS 32 107 66 80 83 78 89 179 181 156 144 —
Total 449 1,308 1,771 1,466 1,509 1,195 1,251 1,418 1,713 1,964 2,033 118
*Transition acres. Unpublished certifier data compiled by WSU-CSANR.
Table A13. Estimated average weighted Washington organic pear prices ($/box FOB).
—————————————— Market Year ——————————————
Variety 00/01 01/02 02/03 03/04 04/05 05/06 06/07 07/08 08/09 09/10 10/11
Bartlett $21.81 $21.64 $21.27 $20.06 $22.52 $25.03 $36.84 $33.32 $31.60 $22.94 $27.88
Red Bartlett $23.40 $21.09 $23.35 $23.78 $24.31 $31.25 $35.56 $31.23 $36.34 $23.99 $30.45
D’Anjou $24.64 $15.00 $17.07 $18.14 $18.11 $25.29 $33.82 $31.12 $27.67 $22.17 $24.69
Red Anjou $27.97 $20.52 $19.09 $21.80 $29.35 $37.58 $39.70 $40.26 $31.30 $30.73 $35.64
Bosc $24.81 $15.82 $21.62 $18.99 $25.03 $24.73 $31.59 $32.85 $29.09 $23.00 $29.38
Average, all varieties
$24.26 $16.17 $19.33 $19.27 $21.03 $26.67 $35.60 $33.40 $29.74 $23.40 $26.73
Washington Growers Clearing House unpublished data. Prices are based on market year averages (all grades, sizes, and storage); SEB 44 lb.
Table A14. Estimated price premium ($/box) for Washington organic pears by variety.
—————————————— Market Year ——————————————
Variety 00/01 01/02 02/03 03/04 04/05 05/06 06/07 07/08 08/09 09/10 10/11
Bartlett $7.61 $5.43 $3.42 $4.14 $5.01 $6.20 $16.71 $14.91 $11.60 $6.16 $8.04
Red Bartlett $5.78 $0.00 $3.03 $2.91 $4.47 $6.64 $11.81 $6.40 $11.49 $4.49 $6.88
D’Anjou $12.05 $2.20 $3.19 $3.50 $1.32 $9.23 $12.61 $11.57 $6.92 $4.79 $2.87
Red D’Anjou $10.28 $2.82 $0.75 $1.95 $9.49 $15.18 $15.12 $16.99 $8.36 $9.50 $9.33
Bosc $9.05 $2.51 $4.07 $3.01 $8.42 $6.78 $13.15 $10.96 $11.77 $5.62 $7.87
Average, all pears $10.82 $2.53 $4.21 $3.90 $3.97 $9.57 $14.77 $13.56 $9.49 $5.86 $5.16
Price premium is difference between organic and conventional prices. Premiums were calculated using unpublished Washington Growers Clearing House market year averages (all grades, sizes, and storage); SEB 44 lb.
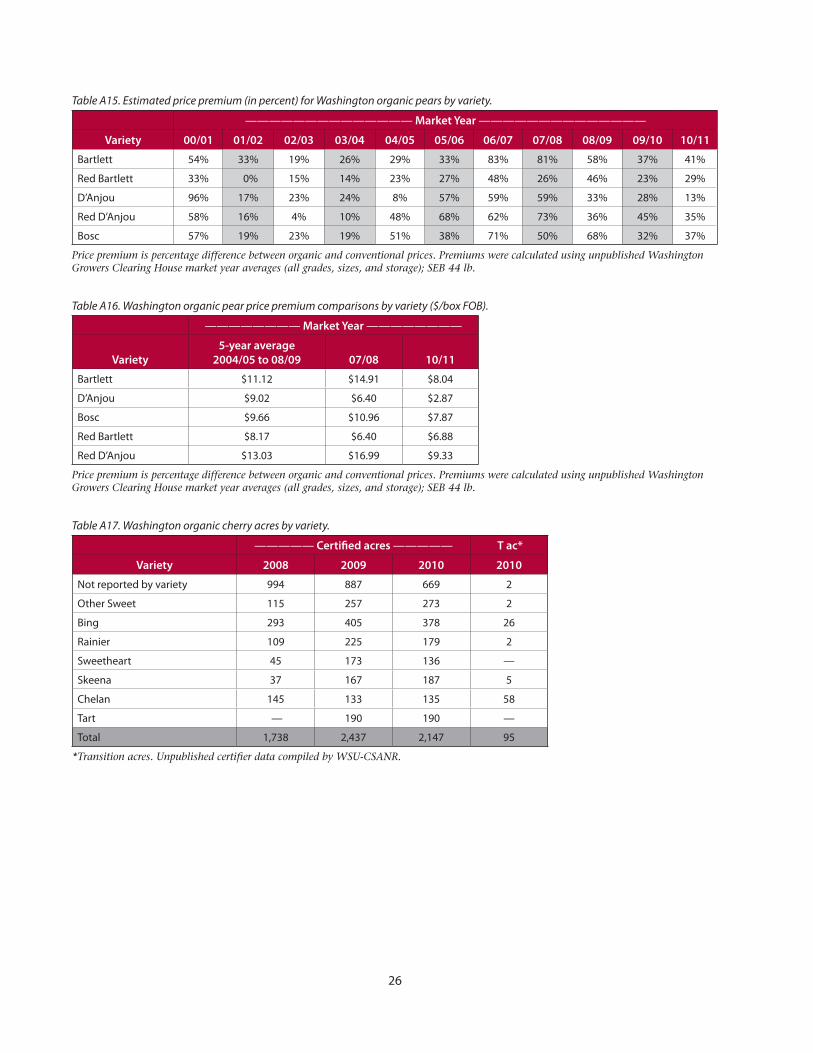
26
Table A15. Estimated price premium (in percent) for Washington organic pears by variety.
—————————————— Market Year ——————————————
Variety 00/01 01/02 02/03 03/04 04/05 05/06 06/07 07/08 08/09 09/10 10/11
Bartlett 54% 33% 19% 26% 29% 33% 83% 81% 58% 37% 41%
Red Bartlett 33% 0% 15% 14% 23% 27% 48% 26% 46% 23% 29%
D’Anjou 96% 17% 23% 24% 8% 57% 59% 59% 33% 28% 13%
Red D’Anjou 58% 16% 4% 10% 48% 68% 62% 73% 36% 45% 35%
Bosc 57% 19% 23% 19% 51% 38% 71% 50% 68% 32% 37%
Price premium is percentage difference between organic and conventional prices. Premiums were calculated using unpublished Washington Growers Clearing House market year averages (all grades, sizes, and storage); SEB 44 lb.
Table A16. Washington organic pear price premium comparisons by variety ($/box FOB).
———————— Market Year ————————
Variety 5-year average
2004/05 to 08/09 07/08 10/11
Bartlett $11.12 $14.91 $8.04
D’Anjou $9.02 $6.40 $2.87
Bosc $9.66 $10.96 $7.87
Red Bartlett $8.17 $6.40 $6.88
Red D’Anjou $13.03 $16.99 $9.33
Price premium is percentage difference between organic and conventional prices. Premiums were calculated using unpublished Washington Growers Clearing House market year averages (all grades, sizes, and storage); SEB 44 lb.
Table A17. Washington organic cherry acres by variety.
————— Certified acres ————— T ac*
Variety 2008 2009 2010 2010
Not reported by variety 994 887 669 2
Other Sweet 115 257 273 2
Bing 293 405 378 26
Rainier 109 225 179 2
Sweetheart 45 173 136 —
Skeena 37 167 187 5
Chelan 145 133 135 58
Tart — 190 190 —
Total 1,738 2,437 2,147 95
*Transition acres. Unpublished certifier data compiled by WSU-CSANR.

27
Table A18. California organic stone fruit acres.
——————————— Organic acres ———————————
Fruit Type 2004 2005 2006 2007 2008 2009
Prune & Plum 2,019 — 2,493 2,609 2,698 2,469
Peach 663 743 913 976 1,107 1,215
Nectarine 324 387 546 720 841 906
Apricot 404 434 455 505 411 382
Cherry 184 282 267 272 307 368
Mixed Stone 98 149 170 154 158 226
California Department of Food and Agriculture, unpublished data; may include non-certified, exempt acres.
Table A19. Washington certified organic stone fruit acres.
—————————— Certified acres ——————————
Fruit Type 2001 2002 2003 2004 2005 2006 2007 2008 2009 2010
Cherry 303 507 513 581 624 782 1,026 1,738 2,437 2,147
Peach 126 187 175 148 179 184 194 199 644 701
Nectarine 57 66 57 50 67 68 82 114 472 550
Mixed Peach/Nect — — — — — — — — 122 —
Apricot 49 77 78 96 95 93 96 107 265 299
Plum/Prune 54 61 63 35 51 57 62 97 130 125
Mixed Stone — — — — 22 33 64 78 30 13
Totals 589 898 886 910 1,038 1,217 1,524 2,333 4,100 3,835
Unpublished certifier data compiled by WSU-CSANR.
Table A20. Washington stone fruit acres in transition to organic.
—————————— Transition acres ——————————
Fruit Type 2001 2002 2003 2004 2005 2006 2007 2008 2009 2010
Cherry 280 69 58 158 234 775 1,284 797 150 95
Peach 31 — — 9 9 29 456 463 7 —
Nectarine 26 3 — 8 8 8 336 369 4 16
Apricot 4 12 12 — 12 12 146 179 20 20
Plum/Prune 14 3 — — 3 19 110 49 5 —
Stone, Mixed — — — 4 8 185 164 — 2
Totals 355 87 70 175 270 851 2,517 2,021 186 133
Unpublished certifier data compiled by WSU-CSANR.
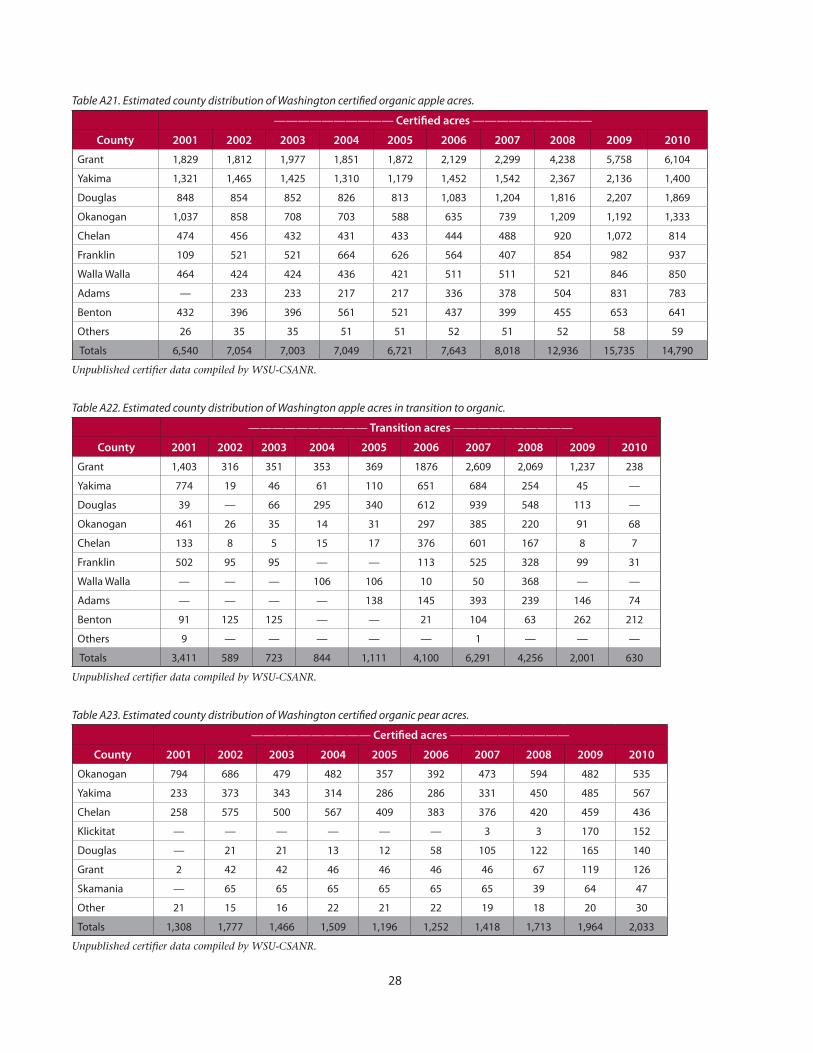
28
Table A21. Estimated county distribution of Washington certified organic apple acres.
—————————— Certified acres ——————————
County 2001 2002 2003 2004 2005 2006 2007 2008 2009 2010
Grant 1,829 1,812 1,977 1,851 1,872 2,129 2,299 4,238 5,758 6,104
Yakima 1,321 1,465 1,425 1,310 1,179 1,452 1,542 2,367 2,136 1,400
Douglas 848 854 852 826 813 1,083 1,204 1,816 2,207 1,869
Okanogan 1,037 858 708 703 588 635 739 1,209 1,192 1,333
Chelan 474 456 432 431 433 444 488 920 1,072 814
Franklin 109 521 521 664 626 564 407 854 982 937
Walla Walla 464 424 424 436 421 511 511 521 846 850
Adams — 233 233 217 217 336 378 504 831 783
Benton 432 396 396 561 521 437 399 455 653 641
Others 26 35 35 51 51 52 51 52 58 59
Totals 6,540 7,054 7,003 7,049 6,721 7,643 8,018 12,936 15,735 14,790
Unpublished certifier data compiled by WSU-CSANR.
Table A22. Estimated county distribution of Washington apple acres in transition to organic.
—————————— Transition acres ——————————
County 2001 2002 2003 2004 2005 2006 2007 2008 2009 2010
Grant 1,403 316 351 353 369 1876 2,609 2,069 1,237 238
Yakima 774 19 46 61 110 651 684 254 45 —
Douglas 39 — 66 295 340 612 939 548 113 —
Okanogan 461 26 35 14 31 297 385 220 91 68
Chelan 133 8 5 15 17 376 601 167 8 7
Franklin 502 95 95 — — 113 525 328 99 31
Walla Walla — — — 106 106 10 50 368 — —
Adams — — — — 138 145 393 239 146 74
Benton 91 125 125 — — 21 104 63 262 212
Others 9 — — — — — 1 — — —
Totals 3,411 589 723 844 1,111 4,100 6,291 4,256 2,001 630
Unpublished certifier data compiled by WSU-CSANR.
Table A23. Estimated county distribution of Washington certified organic pear acres.
—————————— Certified acres ——————————
County 2001 2002 2003 2004 2005 2006 2007 2008 2009 2010
Okanogan 794 686 479 482 357 392 473 594 482 535
Yakima 233 373 343 314 286 286 331 450 485 567
Chelan 258 575 500 567 409 383 376 420 459 436
Klickitat — — — — — — 3 3 170 152
Douglas — 21 21 13 12 58 105 122 165 140
Grant 2 42 42 46 46 46 46 67 119 126
Skamania — 65 65 65 65 65 65 39 64 47
Other 21 15 16 22 21 22 19 18 20 30
Totals 1,308 1,777 1,466 1,509 1,196 1,252 1,418 1,713 1,964 2,033
Unpublished certifier data compiled by WSU-CSANR.
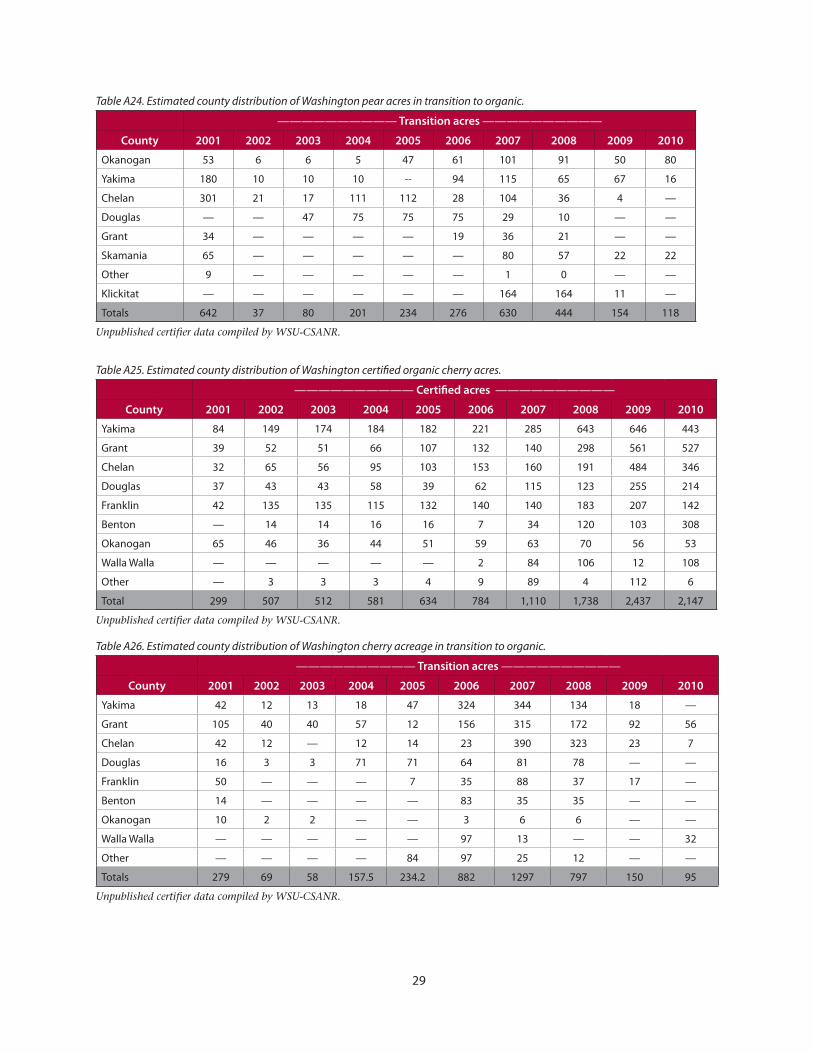
29
Table A24. Estimated county distribution of Washington pear acres in transition to organic.
—————————— Transition acres ——————————
County 2001 2002 2003 2004 2005 2006 2007 2008 2009 2010
Okanogan 53 6 6 5 47 61 101 91 50 80
Yakima 180 10 10 10 -- 94 115 65 67 16
Chelan 301 21 17 111 112 28 104 36 4 —
Douglas — — 47 75 75 75 29 10 — —
Grant 34 — — — — 19 36 21 — —
Skamania 65 — — — — — 80 57 22 22
Other 9 — — — — — 1 0 — —
Klickitat — — — — — — 164 164 11 —
Totals 642 37 80 201 234 276 630 444 154 118
Unpublished certifier data compiled by WSU-CSANR.
Table A25. Estimated county distribution of Washington certified organic cherry acres.
—————————— Certified acres ——————————
County 2001 2002 2003 2004 2005 2006 2007 2008 2009 2010
Yakima 84 149 174 184 182 221 285 643 646 443
Grant 39 52 51 66 107 132 140 298 561 527
Chelan 32 65 56 95 103 153 160 191 484 346
Douglas 37 43 43 58 39 62 115 123 255 214
Franklin 42 135 135 115 132 140 140 183 207 142
Benton — 14 14 16 16 7 34 120 103 308
Okanogan 65 46 36 44 51 59 63 70 56 53
Walla Walla — — — — — 2 84 106 12 108
Other — 3 3 3 4 9 89 4 112 6
Total 299 507 512 581 634 784 1,110 1,738 2,437 2,147
Unpublished certifier data compiled by WSU-CSANR.
Table A26. Estimated county distribution of Washington cherry acreage in transition to organic.
—————————— Transition acres ——————————
County 2001 2002 2003 2004 2005 2006 2007 2008 2009 2010
Yakima 42 12 13 18 47 324 344 134 18 —
Grant 105 40 40 57 12 156 315 172 92 56
Chelan 42 12 — 12 14 23 390 323 23 7
Douglas 16 3 3 71 71 64 81 78 — —
Franklin 50 — — — 7 35 88 37 17 —
Benton 14 — — — — 83 35 35 — —
Okanogan 10 2 2 — — 3 6 6 — —
Walla Walla — — — — — 97 13 — — 32
Other — — — — 84 97 25 12 — —
Totals 279 69 58 157.5 234.2 882 1297 797 150 95
Unpublished certifier data compiled by WSU-CSANR.

By Elizabeth Kirby and David Granatstein, Center for Sustaining Agriculture and Natural Resources, Washington State University, Wenatchee, WA.
Photos on the cover are courtesy of K. Evans and D. Granatstein.
Copyright 2012 Washington State University
WSU Extension bulletins contain material written and produced for public distribution. Alternate formats of our educational materials are available upon request for persons with disabilities. Please contact Washington State University Extension for more information.
You may order copies of this and other publications from WSU Extension at 1-800-723-1763 or http://pubs.wsu.edu.
Issued by Washington State University Extension and the U.S. Department of Agriculture in furtherance of the Acts of May 8 and June 30, 1914. Extension programs and policies are consistent with federal and state laws and regulations on nondiscrimination regarding race, sex, religion, age, color, creed, and national or ethnic origin; physical, mental, or sensory disability; marital status or sexual orientation; and status as a Vietnam-era or disabled veteran. Evidence of noncompliance may be reported through your local WSU Ex-tension office. Trade names have been used to simplify information; no endorsement is intended. Published May 2012.
EM046E