statistics psy302 quiz. 1. what percent of the population scores above a z score of –1? a.62%...
TRANSCRIPT

Statistics PSY302 Quiz

1. What percent of the population scores above a Z score of –1?
A. 62%
B. 70%
C. 84%
D. 98%
E. 72%

1. What percent of the population scores above a Z score of –1?
A. 62%
B. 70%
C. 84%
D. 98%
E. 72%

2. Which of the following is a measure of variability?
A. spread
B. mean
C. kurtosis
D. Standard deviation
E. skewness

2. Which of the following is a measure of variability?
A. spread
B. mean
C. kurtosis
D. Standard deviation
E. skewness

3. Which of the following is an example of a parameter?
A. mean
B. margin of error
C. P-value
D. pi
E. Table A

3. Which of the following is an example of a parameter?
A. mean
B. margin of error
C. P-value
D. pi
E. Table A

4. The results of large samples are ______ the results of small samples.
A. more variable than
B. the same as
C. less variable than
D. all of the above
E. none of the above
4. The results of large samples are ______ the results of small samples.
A. more variable than
B. the same as
C. less variable than
D. all of the above
E. none of the above

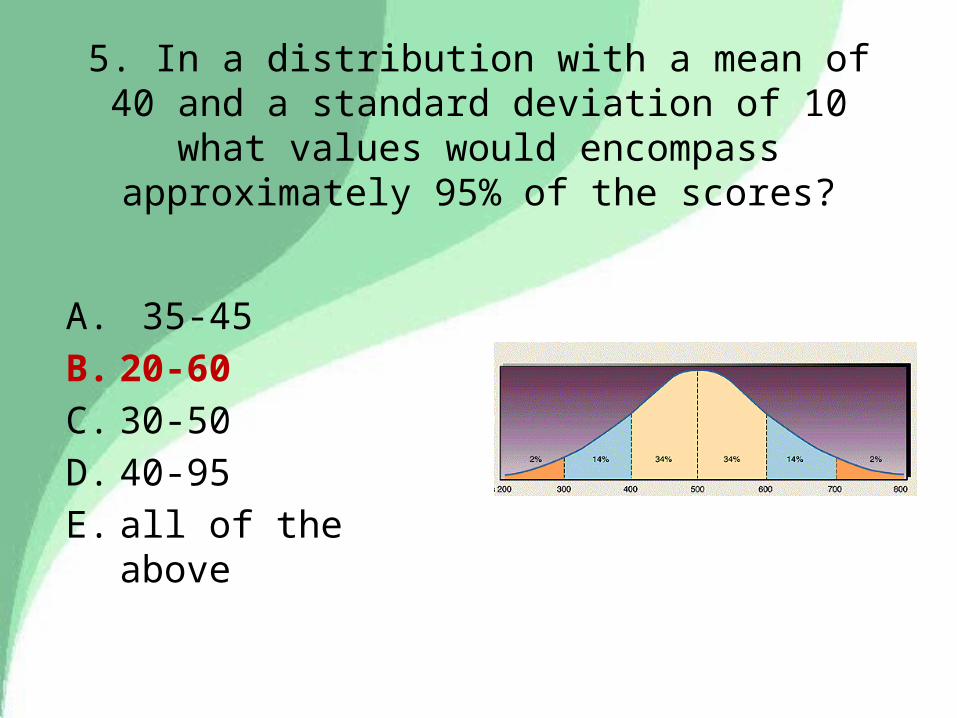
5. In a distribution with a mean of 40 and a standard deviation of 10 what values would
encompass approximately 95% of the scores?
A. 35-45
B. 20-60
C. 30-50
D. 40-95
E. all of the above
5. In a distribution with a mean of 40 and a standard deviation of 10 what values would
encompass approximately 95% of the scores?
A. 35-45
B. 20-60
C. 30-50
D. 40-95
E. all of the above

6. A z-score tells:
A. the likelihood of getting a value as high as the test statistic by chance.
B. the standard deviation of the distribution
C. the square root of the distribution
D. on standard deviation less than the mean
E. How many standard deviations from the mean a score lies

6. A z-score tells:
A. the likelihood of getting a value as high as the test statistic by chance.
B. the standard deviation of the distribution
C. the square root of the distribution
D. on standard deviation less than the mean
E. How many standard deviations from the mean a score lies

7. The alpha value for your paper will be:
A. 100
B. .05
C. .50
D. .10
E. Depends on the variance

7. The alpha value for your paper will be:
A. 100
B. .05
C. .50
D. .10
E. Depends on the variance

8. If we reject Ho when in fact Ho is truethis is called:
1. a Type I error2. Statistical significance3. Failing to reject the null hypothesis4. Inferential statistics5. Homogeneity of variance

8. If we reject Ho when in fact Ho is truethis is called:
1. a Type I error2. Statistical
significance3. Failing to reject the
null hypothesis4. Inferential statistics5. Homogeneity of
variance

9. A study comparing students who live in South Carolina with those who live in Maine on school
attendance would be a _____ design.
A. Single Sample
B. Matched Pairs
C. Independent Samples

9. A study comparing students who live in South Carolina with those who live in Maine on school
attendance would be a _____ design.
A. Single Sample
B. Matched Pairs
C. Independent Samples

10. A study comparing students scores on the final to their scores on the mid-term would be a ____
design.
A. Single Sample
B. Matched Pairs
C. Independent Samples

10. A study comparing students scores on the final to their scores on the mid-term would be a ____
design.
A. Single Sample
B. Matched Pairs
C. Independent Samples
