statistics 300: introduction to probability and statistics section 2-2
TRANSCRIPT
Statistics 300:Introduction to
Probability and Statistics
Section 2-2
Chapters 2 and 3
• Describing data
• Exploring data
• Comparing data
Describe or Infer?
• Descriptive statistics
• Inferential statistics
Descriptive Statistics
• Describe characteristics of (statistics) data samples as they are without extending their meaning beyond the data sample
• Chapters 2 through 6
Inferential Statistics
• Based on a sample or multiple samples, make inferences (judgments) about the population(s) from which the sample(s) came.
• Chapters 7 through 12
Descriptive Statistics
• Distribution
• Center
• Variation
• Position

Distribution
• How are the data spread out?
• Where are data plentiful?
• Where are data rarely found?
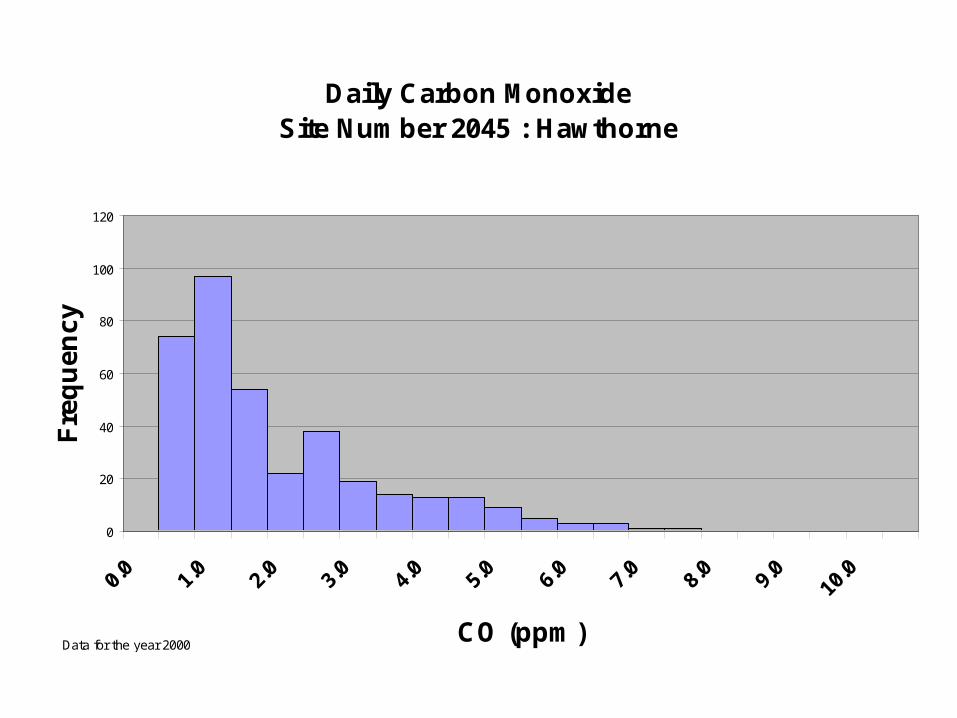
Daily Carbon MonoxideSite Number 2045 : Hawthorne
0
20
40
60
80
100
120
0.0
1.0
2.0
3.0
4.0
5.0
6.0
7.0
8.0
9.0
10.0
CO (ppm)
Fre
qu
ency
Data for the year 2000
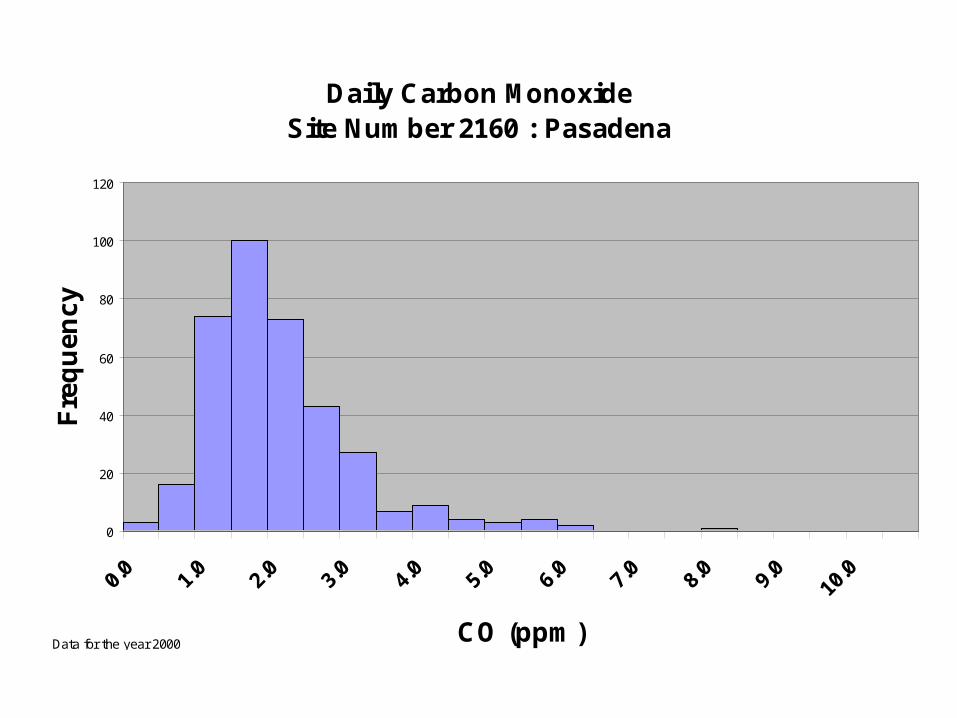
Daily Carbon MonoxideSite Number 2160 : Pasadena
0
20
40
60
80
100
120
0.0
1.0
2.0
3.0
4.0
5.0
6.0
7.0
8.0
9.0
10.0
CO (ppm)
Fre
qu
ency
Data for the year 2000

Distribution
• Frequency tables
• Pictures

Frequency Tables• Identify categories for the data
– Nominal categories or– Interval categories
• Count the number of observations in each category
Frequency TablesInterval Categories
• Class Limits
• Class Midpoints
• Class Boundaries

Lower Upper CumulativeClass Class Relative Cumulative Relative Class ClassLimit Limit Freq. Frequency Frequency Frequency Boundaries midpoints
10 20 3 0.38 3 0.38 25 1530 40 3 0.38 6 0.75 45 3550 60 2 0.25 8 1.00 55
8
18 24 17 50 4132 50 25
Class Limits
• Convenient values representing the range of values in a class
• Lower class limit
• Upper class limit
Class Midpoints
• Values that are midway between the lower and upper class limits of each class
• To compute, average the two class limits

Class Boundaries
• Values that truly separate one class from the next
• To compute: average the upper class boundary and the following lower class boundary
Frequency Tables
• Frequency
• Relative frequency
• Cumulative frequency
• Cumulative relative frequency
Frequency
• Count of the observations that belong to each class
Relative Frequency
• Frequency divided by the total number of observations
Cumulative Frequency
• Sum of the frequencies in the first class through the current class
Cumulative Relative Frequency
• Sum of the relative frequencies in the first class through the current class

Distribution
• Frequency tables
• Pictures

Pictures
• Histograms and Bar Charts
• Pareto Charts
• Pie Charts