statistical analysis with msstats
TRANSCRIPT

Meena ChoiGroup of Prof. Olga Vitek
Department of Statistics, Purdue University
Statistical analysis with MSstats
Skyline User Meeting 2014 Baltimore
2
Outline
1. MSstats : statistical tool for quantitative MS proteomics
1. Workflow of MSstats
2. MSstats as an external tool
2. Integration of Skyline improves analysis workflow
1. User interface
2. Checking quality of features
3. Different workflows require different
1. statistical models
2. normalization
4. How to access MSstats

3
MSstats : statistical tool for quantitative MS
proteomics
MSstats 2.0
Open-source R-based package for statistical relative quantification of
peptides and proteins in mass spectrometry-based proteomic experiments.

4
MSstats workflow : Experimental design
QC andNormalization
Statisticalmodeling
Experimental design
Model-basedconclusion
Design offollow-up
study
Type of experimental design
- Label-free workflows or workflows that use stable isotope labeled reference
proteins and peptides
- SRM, DDA or shotgun, DIA or SWATH
- Comparisons of experimental conditions or times, or paired design
Input format
RunConditionProtein PeptidePrecursor
charge FragmentProductcharge Label Subject Intensity

5
MSstats workflow : QC and normalization
Data preparation
- Formatting
- Visualization : 2 plots
- Normalization : equalize medians, quantile, with standard protein
Reference Endogenous
●
●
●
●
●●
●
●
●
●
●●
●
●
●
●
●●
●
●
●
●
●●
●
●
●
●
●●
●
●
●
●
●●
●
●
●
●
●●
●
●
●
●
●●
●
●
●
●
●●
●
●
●
●
●●
●
●
●
●
●●
●
●
●
●
●●
●
●
●
●
●●
●
●
●
●
●●
●
●
●
●
●●
●
●
●
●
●●
●
●
●
●
●●
●
●
●
●
●●
●
●
●
●
●●
●
●
●
●
●●
●
●
●
●
●●
●
●
●
●
●●
●
●
●
●
●●
●
●
●
●
●●
●
●
●
●
●●
●
●
●
●
●●
●
●
●
●
●●
●
●
●
●
●●
●
●
●
●
●
●
●
●
●
●
●●
1 2 3 4 5 6 7 8 9 10
●
●
●●
●●
●
●
●
●
●
●
●
●
●●
●
●
●
●
●
●
●●
●
●
●
●
●●
●
●
●
●
●
●
●
●●
●
●●
●
●
●
●
●
●
●
●●
●●
●
●
●●
●
●
●
●●
●
●
●●
●
●
●
●
●
●
●
●
●
●
●●
●
●
●●
●●
●
●
●
●
●●
●
●
●
●
●●
●
●
●
●
●
●
●
●●
●
●
●
●
●
●
●
●●
●
●
●
●
●
●
●
●
●
●
●
●
●
●
●
●
●●
●
●
●
●
●
●
●
●
●
●
●●
●
●
●
●
●●
●
●
●
●
●●
●
●
●
●
●●
●
●
●
●
●●
●
●
●
●
●●
●
●
●
●
●●
1 2 3 4 5 6 7 8 9 10
0
10
20
30
3 6 9 12 15 18 21 24 27 30 3 6 9 12 15 18 21 24 27 30
MS runs
Lo
g2−
inte
nsitie
s
IDHCReference Endogenous
1 2 3 4 5 6 7 8 9 10 1 2 3 4 5 6 7 8 9 10
0
10
20
30
3 6 9 12 15 18 21 24 27 30 3 6 9 12 15 18 21 24 27 30
MS runs
Lo
g2−
inte
nsitie
s
IDHC
QC andNormalization
Statisticalmodeling
Experimental design
Model-basedconclusion
Design offollow-up
study
MS runs
Log2
-In
ten
siti
es
MS runs
Log2
-In
ten
siti
es
Reference Endogenous Reference EndogenousQC plot : All proteins Profile plot : One protein
6
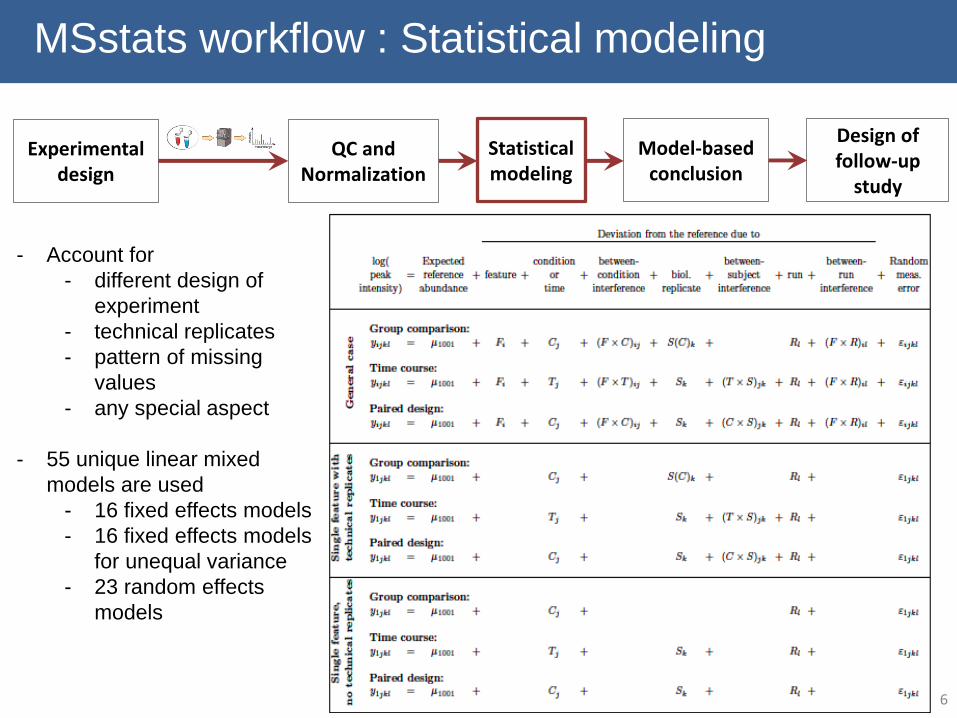
MSstats workflow : Statistical modeling
- Account for
- different design of
experiment
- technical replicates
- pattern of missing
values
- any special aspect
- 55 unique linear mixed
models are used
- 16 fixed effects models
- 16 fixed effects models
for unequal variance
- 23 random effects
models
QC andNormalization
Statisticalmodeling
Experimental design
Model-basedconclusion
Design offollow-up
study

7
MSstats workflow : Statistical modeling
Verify the assumptionsDeviations from independence or from constant variance are often mistaken for deviations
from Normality
Reference Endogenous
●
●
●
●●
●
●
●
●
●●
●
●
●
●
●●
●
●
●
●
●●
●
●
●
●
●
●
●
●
●●
●●
●
●
●
●
●
●
●
●
●
●
●●
●
●
●●
●●
●
●
●
●
●●
●
●
●
●
●●
●
●
●
●
●●
●
●
●
●
●●
●
●
●
●
●●
●
●
●
●
●
●
●●
●
●
●●
●
●
●
●
●●
●
●
●
●
●●
●
●
●●
●●
●
●
●
●
●●
●
●
●
●
●●
● ●
●●
●●
●
●
●
●●●
●
●
●●
●●
●
●
●
●
●●
●
●
●
●
●●
●
●
●
●
●●
●
●
●
●
●●●
●
●●
●●
●
●
●
●
●●
●
1 2 3 4 5 6 7 8 9 10
●
●●●●●
●
●●●●●
●
●●●●●
●
●●
●●●
●
●●●●●
●
●●●●●
●
●●
●
●●
●
●●●●●
●
●●●●●
●
●●●●●
●
●●
●●●
●
●●
●●
● ●
●●
●●●
●
●●
●●●
●
●●●●●
●
●●
●●●
●
●●
●●●
●
●●●●●●
●●
●
●●
●
●●
●
●
●
●
●●
●
●●●
●●
●●●●
●●●
●●
●
●●
●
●
● ●
●●
●
●●●
●●
●
●
● ●
●●
●
●●●
●●
●●●
●
●●
●
●
●●
●●
●
●
●
1 2 3 4 5 6 7 8 9 10
0
10
20
30
3 6 9 12 15 18 21 24 27 30 3 6 9 12 15 18 21 24 27 30
MS runs
Lo
g2−
inte
nsitie
s
PMG2 Per features
Normal quantiles
Qu
anti
les
of
resi
du
als
QC andNormalization
Statisticalmodeling
Experimental design
Model-basedconclusion
Design offollow-up
study
MS runs
Log2
-In
ten
siti
es
Reference Endogenous

8
MSstats workflow : Model-based conclusion
Model-based group comparison
- Quantify the uncertainty
- Adjust p-values to control FDR
Relative protein quantification
- by sample
- by condition
T3−
T1
T5−
T1
T7−
T1
ACONACH1CISY1DHSAFUMHHXKAIDH1IDH2MDHCMDHMODO1ODO2SDH3SUCAODPBENO1DHSBHXKGSUCBCISY2ACEAF16PIDHCMASYADH2PDC5HXKBK6PF2ADH1ENO2ALFALDH6DHSDG6PIK6PF1KPYK1KPYK2ODPAPDC1PDC6PGKPMG1PMG2PMG3ADH4
QC andNormalization
Statisticalmodeling
Experimental design
Model-basedconclusion
Design offollow-up
study
Log2 Fold Change
-Lo
g2 (
adju
ste
d p
-val
ue)
9
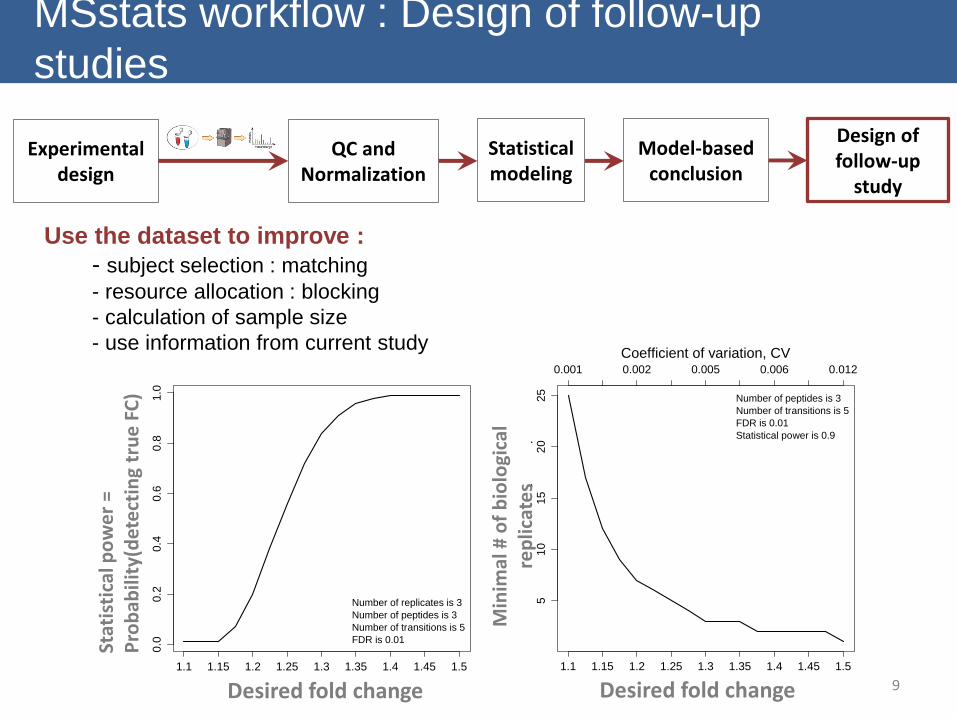
MSstats workflow : Design of follow-up
studies
Use the dataset to improve :
- subject selection : matching
- resource allocation : blocking
- calculation of sample size
- use information from current study
51
015
20
25
1.1 1.15 1.2 1.25 1.3 1.35 1.4 1.45 1.5
0.001 0.002 0.005 0.006 0.012
Coefficient of variation, CV
Desired fold change
Min
ima
l num
be
r o
f b
iolo
gic
al re
plic
ate
s Number of peptides is 3
Number of transitions is 5
FDR is 0.01
Statistical power is 0.9
0.0
0.2
0.4
0.6
0.8
1.0
1.1 1.15 1.2 1.25 1.3 1.35 1.4 1.45 1.5
Desired fold change
Pow
er
Number of replicates is 3
Number of peptides is 3
Number of transitions is 5
FDR is 0.01Stat
isti
cal p
ow
er
=P
rob
abili
ty(d
ete
ctin
g tr
ue
FC
)QC and
NormalizationStatisticalmodeling
Experimental design
Model-basedconclusion
Design offollow-up
study
Desired fold change
Min
imal
# o
f b
iolo
gica
l re
plic
ate
s
Desired fold change

10
Outline
1. MSstats : statistical tool for quantitative MS proteomics
1. Workflow of MSstats
2. MSstats as an external tool
2. Integration of Skyline improves analysis workflow
1. User interface
2. Checking quality of features
3. Different workflows require different
1. statistical models
2. normalization
4. How to access MSstats
11
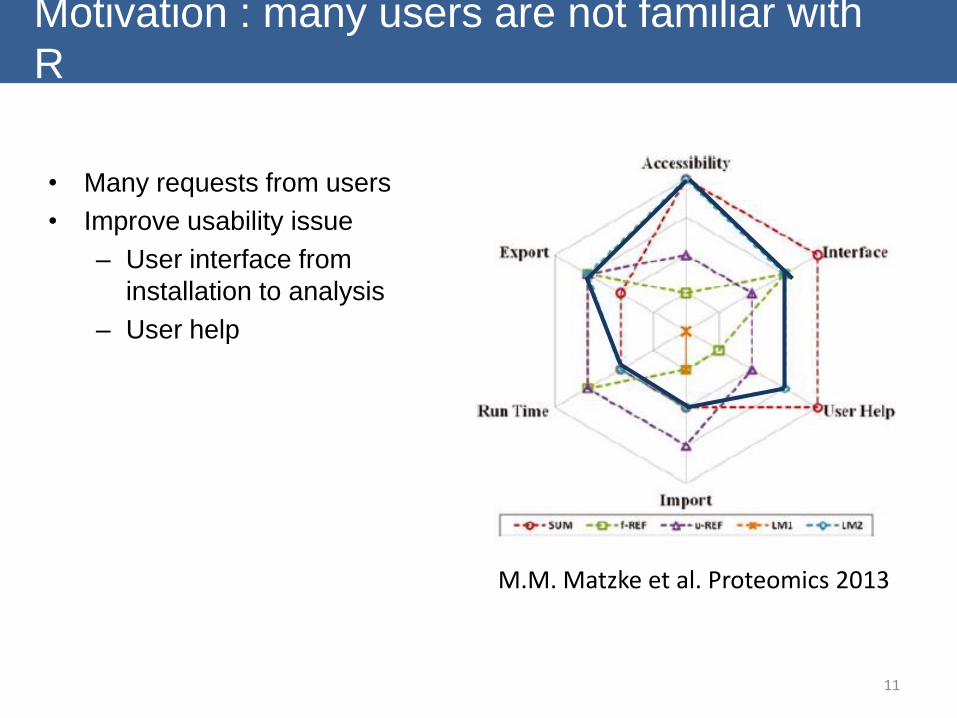
Motivation : many users are not familiar with
R
M.M. Matzke et al. Proteomics 2013
• Many requests from users
• Improve usability issue
– User interface from
installation to analysis
– User help
12
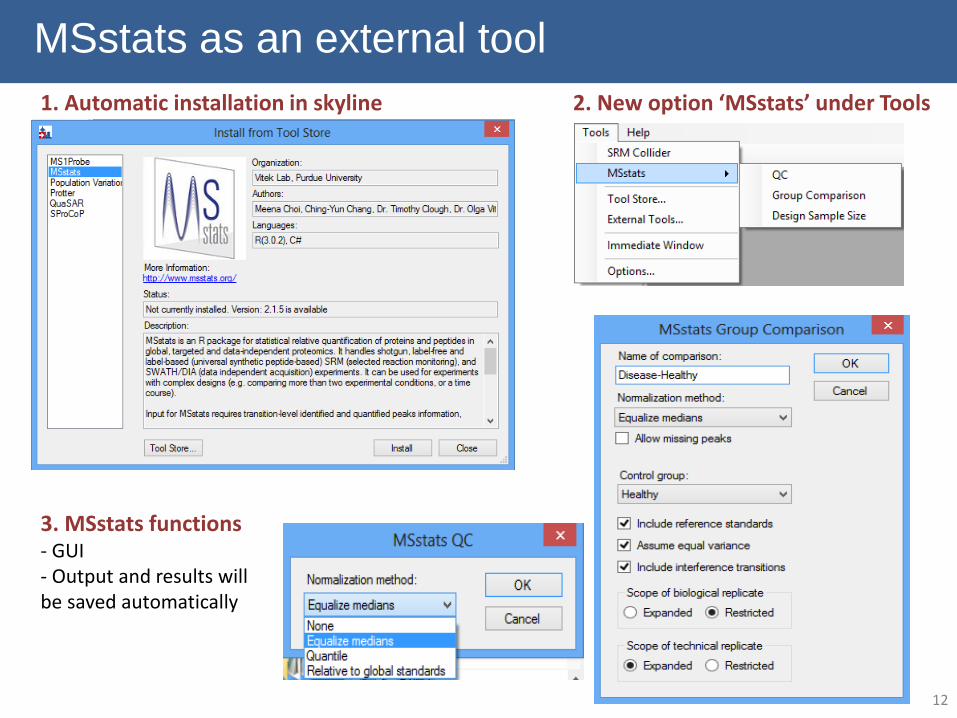
MSstats as an external tool
1. Automatic installation in skyline 2. New option ‘MSstats’ under Tools
3. MSstats functions - GUI- Output and results will be saved automatically

13
Skyline and MSstats provide complementary
QCVisualization in Skyline
Reference Endogenous
●
●●
●
●●
●
●
●
●
●
●
●
●●
●
●
●
●
●●
●
●
●
●
●
●
●
●● ●
●
●
●
●●
●
●
●
●
●
●
●
●●
●
●●
●
●
●
●
●
●
●
●
●●
●●
●
●
●
●
●●
●
●
●
●
●
●
●
●
●
●
●
●
●
●
●
●
●
●
●
●
●●
●●
●
●
●
●
●
●
●
●
●
●
●
●●
●●
●
●●
●
●
●
●
●
●
●
●
●●
●● ●
●
●
●
●
●
●
●●
●
●
●●
●●
●
●●
●
●
●
●
●
●
●
●
●
●
●●
5
10
15
20
1 2 3 4 5 1 2 3 4 5
MS runs
Log2−
inte
nsitie
s
# peptide: 3 ● ● ●GLAAGLDPNTATAGELAR_2 HLPEHAIVQFVK_3 LVGIVTEADIAR_2
Visualization in MSstats
• Example dataset in ‘Advanced peak picking models’ Skyline tutorial.
• SRM with stable isotope labeled reference peptides
MS runs
Log2
-In
ten
siti
es
Reference Endogenous
Re
ten
tio
n T
ime
Pe
ak A
rea
%Replicate
Replicate
Retention time
Inte
nsi
ty
Reference Endogenous
●
●
●
●
●
●
●
●
●
●
●
●●
●
●
●
●
●●●
●
●
●
●
●
●
●
●
●
●
●
●●●●
●
●
●
●
●
●
●●
●
●
●
●
●●●
●
●
●
●
●
●
●●
●
●
●
●●●●
●
●
●
●
●
●
●
●
●
●
●
●●
●
●
●
●
●
●
●
●
●●
●
●
●
●
●●●
●
●
●
●
●
●
●
●
●
●
●
●●●●
●
●
●
●
●
●
●
●
●
●
●
●
●●●
●
●
●
●
●
●
●
●
●●
●
●
●
●●
●
●
●
●
●
●
●
●
●●
5
10
15
20
2 5 2 5
MS runs
Log2−
inte
nsitie
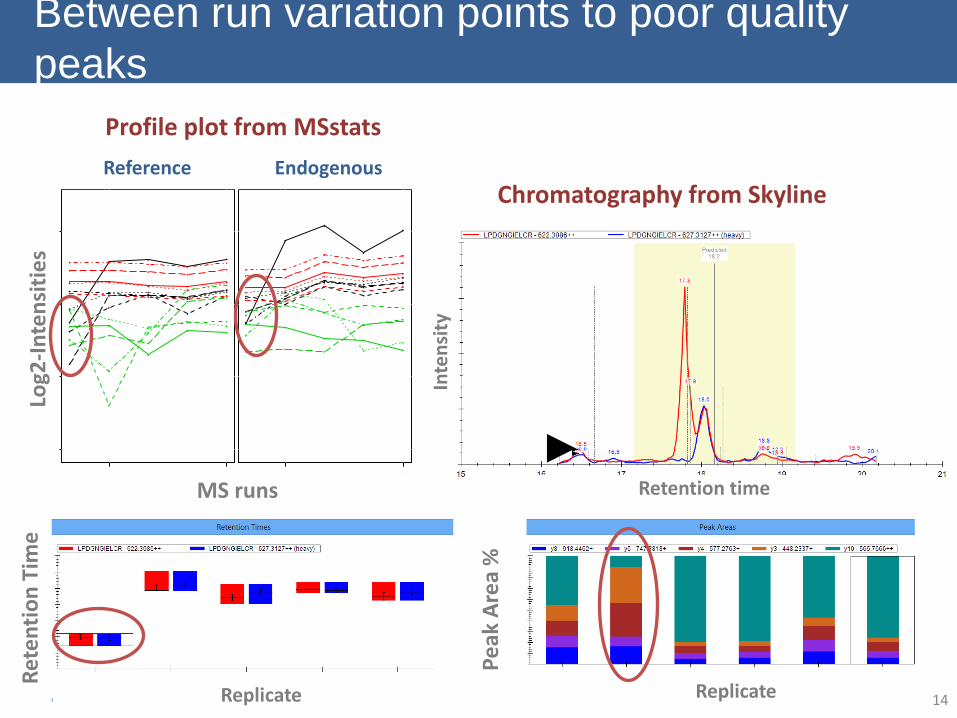
sBetween run variation points to poor quality
peaks
Profile plot from MSstats
Chromatography from Skyline
MS runs
Log2
-In
ten
siti
es
Reference Endogenous
Ret
en
tio
n T
ime
Pe
ak A
rea
%
Replicate Replicate 14
Retention time
Inte
nsi
ty

Reference Endogenous
●
●
●●
●
●
●
●
●
●
●
●
●
●
●
●
●
●●●
●
●
●
●
●
●
●●
●
●
●
●●●●
●
●
●
●
●
●●
●
●
●
●
●
●●●
●
●
●
●
●
●
●●
●
●
●
●●●●
●
●
●
●
●
●
●
●
●
●
●
●
●
●●
●
●
●
●
●
●
●
●
●
●
●
●
●●●
●
●
●
●
●
●
●
●
●
●
●
●●●●
●
●
●
●
●
●
●
●
●
●
●
●
●●●
●
●
●
●
●
●
●
●
●●
●
●
●
●●
●
●
●
●
●
●
●
●
●●
5
10
15
20
2 5 2 5
MS runs
Log2−
inte
nsitie
sRefinement for picking peaks improves the
quality
Profile plot from MSstatsChromatography from Skyline
MS runs
Log2
-In
ten
siti
es
Reference Endogenous
Ret
en
tio
n T
ime
Pe
ak A
rea
%
Replicate Replicate15
Retention timeIn
ten
sity

Reference Endogenous
●
●
●
●
●
●
●
●
●
●
●
●
●
●
●
●
●
●
●
●
●
●
●●
●
●
●
●
●
●
●
●
●
●
●
●●
●●
●
●
●
●
●
●
●
●
●
●
●
●●
●
●
●
●
●
●
●
●
●
●●●
●
●
●
●
●
●
●
●
●
●
●
●
●
●
●●●
●
●
●●●
●
●
●
●
●
●
●
●
●
●
●
●
●
●
●
●
●
●
●
●
●
●
●
●
●
●
●
●
●
●
●
●
●
●
●
●
●
●
●
●
●
●
●
●
●
●
●
●
●
●
●
●
●
●
●
●
●
●
●
●
●
●
●
●
●
●
●●
●
●
●
●
●
●
●
●
●
●
●
●
●
●
●●
●
●
●●
●●
●
●
●
●
●
●
●
●
●
●
●
●
●
●
●
●
●
●
●
●
●
●
●
●
●
●
●
●
●
●
●
●●
●
●
●
●
●
●
●
●
●
●
●
●
●
●
●
●
●
●
●
●
●
●●
●
●
●●
●●
●
●
●
●
●
●
●
●
●
●
●
●
●
●
●
●
●
●
●
●
●
●
●●
●
●
●
●
●
●
●
●
●
●
●
●
●
●
●●●
●
●
●●
●
●●
●
●
●
●●
●
●
●
●
●
●●
●
●
●
●
●
●
●
●●
●
●●
●
●
●
●
●
●
●
●
●
●●
●
●
●
●●
●
●
●
●
●
●
●
●
●
●
●
●
●
●
●
●
● ●
●
●
●●
●
●
●
●
●
●
●
●
●
●
●
●●
●
●
●
●
●●
●
●●
●
●●
●
●
●
●
●
●
●●
●
●
●
●
●
●
●●
●
●
●
●
●
●
●
●
●
●
●
●
●
●
●
●●
●
●
●
●
●
●
●
●
●
●
●
●
●
●
●
●
●
●
●
●
●
●
●
●
●
●
●
●
●
●
●
●
●
●
●
●
●
●●
●
●
●●
●
●
●
●
●
●
●
●
●
●
●
●
●
●
●●
●
●
●
●
●
●
●
●
●
●
●
●
●
●
●
●
●
●
●
●
●
●
●●●
●
●
●
●
●
●
●
●
●
●
●
●
●
●
●●
●
●
●
●
●
●
●
●
●
●
●
●
●
●
●
●
●
●
●
●
●
●
●
●
●
●
●
●
●
●
●
●
●
●
●
●
●
●
●
●
●
●
●
●
●
●
●
●
●
●●
●
●●●
●
●
●
●●
●
●
●
●
●
●
●
●
●
●
●●
●
●
●
●●
●
●
●
●
●
●
●●
●
●
●
●
●
●
●
●
●
●
●
●
●
●
●
●●
●
●●
●
●
●
●●
●
●
●
●
●
●
●
●
●
●
●
●
●
●
●
●
●
●
●
●
●
●
●
●
●
●
●
●
●
●
●
●
●
●
●
●
●
●●
●
●●
●
●
●
●
●
●
●
●
●
●
●
●
●
●
●
●
●
●
●
●
●
●
●
●
●
●
●
●
●
●
●
●
●
●
●
●
●
●
●
●
●
●●
●
●
●
●
●
●
●
●
●
●
●●●●
●
●●
●
●
●●●
●
●
●
●
●
●
●
●
●
●
● ●●
●
●
●
●
●
●
●
●●
●
●
●
●
●
●
●
●
●
●
●
●
●
●
●
●
●
●
●
●
●
●
●
●
●
●
●
●
●
●
●
●
●
●
●
●
●
●
●●
●
●
●
●
●
●
●
●
●
●
●●
●●
●
●●●
●
●
●
●
●
●
●
●
●
●
●
●
●
●
●
●
●
●
●
●
●
●
●
●
●
●
●
●
●
●
●
●
●
●
●
●●
●
●
●
●
●
●
●
●
●
●
●
●
●
●
●
●
●
●
●
●
●
●●
●
●
●
●
●
●
●
●
●
●
cases control healthy
●
●●
●
●
●
●
●
●
●
●
●
●
●
●
●
●
●
●
●
●
●
●
●
●
●
●
●
●
●
●
●
●
●
●
●
●
●
●
●●
●
●
●
●
●
●
●
●
●
●
●
●
●
●
●
●
●
●
●
●
●
●
●
●
●
●
●
●
●
●
●
●●
●
●
●
●
●
●
●●
●
●
●
●
●
●
●
●
●
●●
●
●
●
●
●
●
●
●
●
●
●
●
●
●
●
●
●●
●
●
●
●
●
●
●
●
●
●
●
●
●
●
●
●
●
●
●
●
●
●●
●
●
●●
●
●●
●
●
●
●
●
●
●
●
●●
●
●
●
●
●
●
●
●
●●
●
●
●
●
●
●
●
●
●
●
●
●●
●
●
●
●
●
●●
●
●●
●
●
●
●
●
●
●
●
●
●
●
●
●
●
●
●
●
●
●
●
●
●
●
●
●
●
●●
●
●
●
●
●
●
●
●
●
●
●
●
●
●
●
●
●
●
●
●
●
●
●
●
●
●
●●
●
●
●●
●
●●
●
●
●
●
●●●
●
●
●
●
●
●
●
●
●
●
●
●
●
●●
●
●
●
●
●
●
●
●
●
●
●
●
●
●
● ●●
●
●
●
●
●
●●
●
●
●
●
●
●
●
●
●
●
●
●
●●
●
●
●
●
●
●
●
●
●
●
●
●
●
●
●
●
●
●
●
●●
●●
●
●
●
●
●
●
●
●
●
●●
●
●
●
●
●
●
●
●
●
●
●
●
●
●
●
●
●
●
●
●
●
●
●
●
●
●
●
●
●
●
●
●
●
●
●
●●●
●
●
●
●
●
●
●
●
●
●
●
●
●
●
●
●
●
●
●
●
●
●
●
●
●
●
●
●
●
●
●
●
●
●
●●
●
●
●
●
●
●
●
●
●
●
●
●
●
●
●
●●
●
●●
●
●
●
●
●
●
●
●
●
●
●
●●
●
●
●
●
●
●
●
●
●
●
●
●
●
●
●●
●
●
●
●
●
●
●
●
●
●
●
●
●
●●
●
●
●
●
●
●
●●
●●
●
●
●
●
●
●
●
●
●
●
●
●
●
●
●
●
●
●
●
●
●
●
●
●
●
●
●
●
●
●
●
●
●
●
●
●
●
●
●
●
●
●
●
●
●
●
●
●
●●
●
●
●
●●
●
●
●
●
●
●
●
●
●●
●
●
●
●
●
●
●
●
●
●
●
●
●
●
●●
●
●
●
●
●
●
●
●
●
●
●
●
●
●
●
●●
●
●
●
●
●
●
●
●
●
●
●
●●
●
●
●
●
●
●
●
●
●
●
●
●
●
●
●
●●
●
●
●
●
●
●
●●
●
●
●
●
●
●
●
●
●●
●●●
●
●
●
●
●
●
●●
●
●
●
●
●
●
●
●
●
●
●
●
●
●
●
●
●
●
●
●
●
●
●
●
●
●●
●
●
●
●
●
●
●
●
●
●
●
●
●●
●
●
●
●
●
●
●
●
●
●
●
● ●
●
●
●
●
●
●
●●
●
●●
●
●●
●
●
●
●
●
●
●
●
●
●
●
●
●
●
●
●
●
●
●
●
●
●
●
●●
●
●
●
●
●
●
●
●
●
●
●
●●
●
●●
●
●●
●●
●
●
●
●
●
●
●
●
●
●
●
●
●
●
●
●
●
●
●
●
●●
●
●
●
●
●
●
●
●
●
●
●
●
●
●
●
●
●
●●
●
●
●
●
●●
●
●●
●
●
●
●
●
●●
●
●●
●
●
●
●
●
●●
●
●
●
●
●
●
●
●
●
●
●
●
●●
●
●
●
●●
●
●
●
●
●
●
●
●●
●
●
●
●
●
●
●
●
●●
●
●
●
●
●
●
●
●
●
●
●
●
●
●
●
●
●●
●●●●
●
●
●
●
●
●
●
●●
●●●
●●
●
●
●●
●
●
●
●
●
●
●
●
●●
●
●
●
●
●
●
●
●
●
●
●
●
●
●
●
●
cases control healthy
0
10
20
30
77 199 215 77 199 215
MS runs
Lo
g2−
inte
nsitie
s
●
●
●
●
●
●
DIAPTLTLYVGK_2_y8_1
DIAPTLTLYVGK_2_y9_1
DIAPTLTLYVGK_2_y9_2
VTSIQDWVQK_2_y4_1
VTSIQDWVQK_2_y5_1
VTSIQDWVQK_2_y6_1
HPT
Reference Endogenous
●
●
●
●
●
●
●
●
●
●
●
●
●
●
●
●
●
●
●
●
●
●
●
●
●
●
●
●●
●
●
●
●
●
●
●
●
●
●
●
●
●
●
●●
●●
●
●
●
●
●
●
●
●
●
●
●
●
●
●
●
●●
●
●
●
●
●
●
●
●
●
●
●
●●●
●
●
●
●●
●
●
●
●
●●
●
●
●
●
●
●
●
●
●
●
●●●
●
●
●
●●●
●
●
●
●
●
●
●
●
●
●
●
●
●
●
●
●
●
●
●
●
●
●
●
●
●
●
●
●
●
●
●
●
●
●
●
●
●
●
●
●
●
●
●
●●
●●
●
●
●●
●
●
●
●●
●
●●●
●
●
●
●
●
●
●
●
●
●
●
●
●
●
●
●
●
●
●
●
●
●●
●
●
●
●
●
●
●
●
●
●●
●
●
●
●
●
●●
●
●
●●
●●
●
●
●
●
●
●
●
●
●
●
●
●●
●
●
●
●
●
●
●
●
●
●
●
●
●
●
●
●
●
●
●
●
●●
●
●
●
●
●
●●
●
●
●
●
●
●
●
●
●
●
●
●
●
●
●
●●
●
●
●
●
●
●
●●
●
●
●●
●●
●
●
●
●
●
●
●
●
●
●
●
●
●
●
●
●
●
●
●
●
●
●
●●
●
●
●
●
●
●
● ●
●
●
●
●
●
●
●
●
●
●
●
●
●●●
●
●
●
●
●
●●
●
●●
●
●
●
●●
●●
●●
●
●
●
●
●●
●●
●
●
●
●
●●●
●
●
●
●●
●
●●
●
●
●
●
●
●
●
●
●
●●
●
●
●
●●
●
●
●
●
●
●
●
●
●
●
●
●
●
●
●
●
●
●
●
●
●
●
●●
●
●●
●
●
●
●
●
●
●
●
●
●
●
●
●
●
●
●
●
●
●
●●
●
●
●
●
●
●
●
●
●
●
●
●
●●
●
●
●
●
●
●
●
●
●
●●●
●
●●
●
●●
●
●
●
●
●
●
●
●
●
●
●●●
●
●
●
●
●
●
●
●
●
●●
●
●
●
●
●
●
●
●
●
●
●
●
●
●
●
●
●●
●
●
●
●
●
●
●
●
●
●
●
●
●
●
●
●
●
●
●
●
●
●
●
●
●
●
●
●
●
●
●
●
●
●
●
●
●
●
●
●
●●
●
●
●
●
●●
●
●
●
●
●
●
●
●
●
●
●
●
●
●
●
●
●
●●
●
●
●
●
●
●
●
●
●
●
●
●
●
●
●
●●●
●
●
●
●
●
●
●
●
●
●●●
●
●
●
●●
●
●
●
●
●
●
●
●
●
●
●
●
●
●
●●
●●●
●
●
●●
●
●
●
●
●
●●●
●
●
●
●
●
●
●
●
●
●
●
●
●
●
●●
●
●
●
●
●
●
●
●
●
●●
●
●
●
●
●
●
●
●
●
●
●
●
●
●
●
●
●
●
●
●
●
●
●
●
●●●
●●
●
●●●
●
●
●
●●
●
●
●
●
●
●
●
●
●
●
●
●
●
●
●
●●
●
●
●
●●
●
●
●
●
●
●
●
●
●
●●
●
●
●●●●
●
●
●
●
●
●
●
●
●
●
●
●
●
●
●
●
●
●
●
●●
●
●
●
●
●●
●
●
●
●●
●
●
●
●
●
●
●
●
●
●
●
●
●
●
●
●
●
●
●●
●
●
●
●
●●
●
●
●
●
●●
●
●
●
●
●
●
●
●
●
●
●●
●
●
●
●
●
●
●
●
●
●
●●
●
●
●
●
●
●
●
●
●●
●
●
●
●
●
●
●
●
●●●
●
●
●
●
●
●
●
●
●
●●
●
●
●
●
●
●
●
●
●
●
●
●
●
●
●
●
●
●
●
●
●
●
●
●
●
●
●
●
●
●
●
●
●
●
●
●
●
●
●
●
●
●
●
●
●
●
●
●
●
●
●
●
●
●
●●
●
●
●
●
●
●
●
●●
●
●
●
●
●●●●
●
●●
●
●●
●
●●●
●
●●
●
●
●●
●
●
●
●
●
●
●
●
●
●
●
●
●●
●●●
●
●
●
●
●
●
●
●
●
●
●●
●●
●
●
●
●
●
●
●
●
●
●
●
●
●
●
●
●
●
●
●
●
●
●
●●
●
●
●
●
●
●
●
●
●
●
●
●
●
●
●
●
●
●
●
●
●
●
●
●
●
●
●●
●
●
●
●
●
●
●
●
●
●●
●
●
●
●
●●
●●
●
●●●
●
●
●
●
●
●
●
●
●
●
●
●
●
●
●
●
●
●
●
●
●
●
●
●
●
●
●
●
●
●
●
●
●
●
●
●
●
●
●
●
●
●
●
●
●
●
●
●●
●
●
●
●
●●
●
●
●
●
●
●
●
●
●
●
●
●
●
●
●
●
●
●
●
●
●
●
●
●
●
●
●
●
●
●
●●
●
●●
●
●
●
●
●
●
●
●
●
●
●
●
●
●
●
●
●
●
●
●
●
●
●
●
cases control healthy
●
●●
●
●
●
●●
●
●
●
●
●
●
●
●
●
●
●
●
●
●
●
●
●
●
●
●
●
●
●
●
●
●
●
●
●
●
●
●
●
●
●●
●
●
●
●
●
●
●
●
●
●
●
●
●
●
●
●
●
●
●
●
●
●
●
●
●
●
●
●
●
●
●
●
●
●
●
●
●
●●
●
●
●
●
●●
●
●
●
●
●
●
●
●
●
●
●●
●
●
●
●
●
●
●
●
●
●
●●
●
●
●
●
●
●
●
●
●
●
●
●
●
●
●
●
●●
●
●
●
●
●
●
●
●
●●
●
●
●
●
●
●
●
●
●
●
●
●
●
●
●
●
●
●
●
●
●
●
●
●
●●
●
●
●
●●
●
●
●●
●
●●
●
●
●
●
●
●
●
●
●●
●
●
●
●
●
●
●
●
● ●●
●
●
●
●
●
●
●
●
●
●
●
●
●
●●
●
●
●
●
●
●●
●
●●
●
●
●
●
●
●
●
●
●
●
●
●
●
●
●
●
●
●
●
●
●
●●
●
●
●
●
●
●
●
●●
●
●
●
●
●
●
●
●
●
●
●
●
●
●
●
●
●
●
●
●
●
●
●
●
●
●
●
●
●●
●
●
●●
●
●●
●●
●
●
●
●
●●●
●
●
●
●
●●
●
●
●
●
●
●●
●
●
●
●
●
●
●
●●
●
●
●
●
●
●
●
●
●
●
●
●
●
●
●
●
●
●
●
●
●
●
●
●●
●
●
●
●
●
●●
●
●
●
●
●
●
●●
●
●
●
●
●
●
●
●
●
●
●●
●
●
●
●
●●
●
●
●
●
●
●
●
●
●
●
●
●
●
●
●
●
●
●
●
●
●
●
●●
●●
●
●
●
●
●
●●
●
●●
●
●
●
●
●
●
●
●●
●●●
●
●
●
●●●
●
●
●
●
●
●
●
●
●
●
●
●
●
●
●
●
●
●
●
●
●
●
●
●
●
●
●
●
●
●
●
●
●●
●
●
●
●
●
●
●
●
●
●
●
●
●
●
●
●●●
●
●
●
●
●
●
●
●
●
●
●
●
●
●
●
●
●
●
●
●
●
●●
●
●
●
●
●
●
●
●
●
●
●●
●
●
●
●
●
●
●
●
●
●
●
●
●
●
●
●
●
●
●
●
●
●
●●
●●
●●
●
●
●
●
●
●
●
●
●
●
●
●
●●
●
●
●
●
●
●
●
●
●
●
●●
●
●
●
●
●
●
●
●●
●
●
●
●
●
●
●
●●
●
●
●
●
●
●
●
●
●●
●
●
●
●
●
●
●
●●
●●
●
●
●
●
●●
●
●●
●
●
●
●
●
●
●
●
●
●
●
●
●
●
●
●
●
●
●
●
●
●
●
●
●
●
●
●
●
●
●
●
●
●
●
●
●
●
●
●
●
●
●
●
●
●
●
●
●
●
●
●
●
●
●
●●
●
●●
●
●●
●
●
●
●
●
●
●
●
●●
●
●
●
●
●
●
●
●
●
●
●
●
●●
●
●
●
●
●●
●
●
●
●
●
●
●
●
●
●
●
●
●
●
●
●●
●
●
●
●
●
●
●
●
●
●●
●
●●
●
●
●
●
●
●
●
●
●
●
●
●
●
●
●●
●
●
●
●
●
●
●
●
●●
●
●
●
●
●
●
●
●●
●
●
●
●
●
●
●
●
●●
●●●
●
●
●
●
●
●
●
●
●
●
●
●
●●
●
●
●●
●
●
●
●
●
●
●
●
●
●
●
●
●
●
●
●
●
●
●
●
●
●
●
●
●
●
●
●
●
●
●
●●
●●
●
●
●
●
●
●
●
●
●
●
●
●
●
●
●
●
●
●
●
●
●
●
●
●
●
●
●●
●
●
● ●
●
●●
●
●
●
●
●
●
●●
●
●●●
●
●
●
●
●
●
●
●
●
●
●
●
●●
●
●
●
●
●
●
●
●
●
●
●
●
●
●
●
●
●
●
●
●
●
●
●
●
●●
●
●
●
●
●
●●
●
●
●
●
●
●
●
●
●
●
●●
●
●
●
●
●
●
●
●
●
●
●
●
●●
●
●●
●
●
●
●
●●
●
●
●
●
●
●
●
●
●
●
●
●
●
●●
●
●
●
●
●●
●
●
●
●
●
●
●
●
●
●
●
●
●
●
●
●
●●
●
●
●
●
●
●
●
●
●
●
●
●
●
●
●
●
●
●
●
●
●●
●
●●
●
●
●
●
●
●●
●
●●
●
●
●
●
●
●●
●
●●
●
●
●
●
●
●●
●
●
●
●
●
●
●
●
●
●
●
●
●●
●
●
●
●●
●
●
●
●●
●
●
●
●
●
●
●
●
●
●
●
●●
●
●
●
●
●●
●
●
●
●
●
●
●
●
●
●
●
●
●●
●
●
●
●
●
●●
●
●
●
●
●
●
●
●
●
●
●
●
●
●●
●
●
●●●●●
●
●
●
●
●
●
●
●●
●●●
●●
●
●
●●
●
●
●
●
●
●
●
●
●
●●
●
●●●
●
●
●●
●
●
●
●●
●
●
●
●
●
●
●
●●
●
●
●
●
●
●
●
cases control healthy
0
10
20
30
77 199 215 77 199 215
MS runs
Lo
g2−
inte
nsitie
s
●
●
●
●
●
●
DIAPTLTLYVGK_2_y8_1
DIAPTLTLYVGK_2_y9_1
DIAPTLTLYVGK_2_y9_2
VTSIQDWVQK_2_y4_1
VTSIQDWVQK_2_y5_1
VTSIQDWVQK_2_y6_1
HPT
16
Truncated peaks also introduce between run
variation
with truncated peaks :log2FC=-0.342, adjust p-value=0.0277
without truncated peaks :log2FC=-0.155, adjust p-value=0.4999
MS runs
Log2
-In
ten
siti
es
MS runs
Log2
-In
ten
siti
es
Reference Endogenous
Reference Endogenous
Retention time
Inte
nsi
ty
Retention time
Inte
nsi
ty

17
Feature selection is available in MSstats
Oral session : MOG 3:50pm, Statistical Elimination of Spectral Features with Large Between-Run Variation Enhances Quantitative Protein-Level Conclusions in Experiments with Data-Independent Spectral Acquisition (Lin-Yang Cheng)
Endogenous
●●
●
●
●
●
●●●●
●
●
●
●
●●
●
●
●
●
●
●
●●
●
●
●
●
●
●●
●●
●
●
●●
●●
●
●
●
●
●
●
●
●
●
●●
●●●
●●
●
●
●
●
●●
●
●
●
●
●●
●●
●
●●
●
●●●●●
●●
●
●
●
●
●
●
●●
●●●
●
●
●●
●
●●
●
●
●
●
●●●
●
●●
●
●
●
●
●
●
●
●
●
●●●
●
●
●
●
●
●●
●●●
●
●●
●●
●
●
●
●
●
●
●
●●
●●
●●●
●●
●
●
●
●
●●
●
●
●
●
●●
●●
●
●●
●
●
●
●●●●
●
●
●
●
●
●
●
●●
●
●●
●
●
●●
●
●●
●
●
●
●
●●●●
●
●
●
●
●●
●
●
●
●
●
●
●●
●
●
●
●
●
●●
●●●
●
●●
●●
●
●
●
●
●
●
●
●●
●●
●●●
●●
●
●
●
●
●●
●
●
●
●
●●
●●
●
●●
●
●●
●●●●
●
●●
●
●
●
●
●●
●●
●
●
●
●●
●
●●
●
●
●
●
●●●
●
●●
●
●
●
●
●
●●
●
●●●●
●
●
●●●
●●
●
●
●
●
●
●
●●
●●
●
●
●
●
●
●
●
●
●
●●
●
●●
●
●
●
●●●
●
●
●
●
●●
●●
●
●●
●
●●
●●●●
●
●
●
●●
●
●
●●
●●
●
●
●
●●
●
●●
●
●
●
●
●●●
●
●
●
●
●
●
●
●
●●●
●●●●
●
●
●●●
●●
●●
●
●
●●
●
●
●
●
●
●
●
●
●
●
●
●
●
●
●
●
●
●
●
●
●
●●●
●●
●
●
●●
●●
●
●●
●
●●
●●●●
●
●
●
●●
●
●●●
●●
●
●
●
●●
●
●●
●
●
●
●
●
●●
●
●
●
●
●
●
●
●
●●●
●●●●
●
●
●●●
●●
●
●
●
●
●●
●●
●●
●
●
●
●
●
●
●
●
●
●
●
●
●●
●
●
●
●●●
●●
●
●
●●
●●
●
●●
●
●●
●●●●
●
●
●
●●
●
●●●
●●
●
●
●
●●
●
●●
●
●
●
●
●
●●●
●●
●
●
●
●
●
●●●
●●●●
●
●
●
●
●
●
●
●
●
●
●
●●
●●
●
●
●
●
●
●
●
●
●
●
●
●●●
●
●
●●
●
●●●
●
●
●
●
●●
●●
●
●●
●
●●
●●●●
●
●
●
●
●
●
●
●●●●
●
●
●
●●
●
●●
●
●
●
●
●
●●
●
●
●
●
●
●
●
●
●●●
●●●●
●
●
●
●
●
●
●
●
●
●
●
●●
●
●
●
●
●
●
●
●
●
●
●
●
●
●●●
●
●
●●
●
●●●
●●
●
●
●●
●
●
●
●●
●
●●
●●●●
●
●
●
●
●
●
●
●●
●●●
●
●
●●
●
●●
●
●
●
●
●
●●
●
●●
●
●
●
●
●
●●●
●●●●
●
●
●
●
●
●
●
●●
●
●
●●
●
●
●
●
●
●
●
●
●
●
●
●
●
●
●
●
●●
●●
●
●●●
●●
●
●
●●
●
●
●
●●
●
●●
●●●●
●
●
●
●●
●
●
●●●●
●
●
●
●●
●
●●
●
●
●
●
●
●●●
●●
●
●
●
●
●
●●●
●●●●
●
●
●
●
●
●
●
●
●
●
●
●●
●
●
●
●
●
●
●
●
●●●
●
●
●
●●
●
●
●●
●
●●●
●●
●
●
●●●
●
●
●●
●
●●
●●
●●●
●
●
●●
●
●
●●
●
●●
●
●
●
●
●
●●
●
●
●
●
●
●●●
●
●
●
●
●●
●
●
●●
●●●●
●
●
●
●
●
●
●●●
●
●
●●
●●
●
●
●
●
●
●●
●●
●
●
●
●●
●
●●●
●
●●●
●●
●
●
●●
●
●
●
●●
●
●●
●●
●●●
●
●●●
●●
●
●
●
●
●
●
●
●●
●
●●
●
●
●
●
●
●●
●
●●
●
●
●
●
●
●●●
●●●●
●
●
●
●
●
●
●
●
●
●
●
●●●
●
●
●
●
●
●
●
●
●●●
●
●●
●
●
●
●●
●
●●●
●●
●
●
●●●
●
●
●●
●
●●
●●●●●
●
●●
●
●
●●●
●●●
●
●
●●
●
●●
●
●
●
●
●
●
●●
●●●
●
●●
●
●
●●
●●●●
●
●
●
●
●
●
●●
●
●
●●
●
●
●
●
●
●
●
●
●
●
●
●●
●●
●
●
●
●●●
●
●●
●
●●
●
●
●
●
●●
●
●●
●
●●
●●
●●●
●
●
●
●
●
●
●
●●●●
●
●
●
●
●
●
●
●
●
●
●
●
●●
●
●
●
●
●
●
●
●
●
●●
●●●●
●
●
●
●
●
●
●●
●
●●
●●
●
●
●
●
●
●
●
●
●
●●●
●
●
●●
●
●●●
●
●
●
●
●●
●
●
●
●●
●
●
●●
●
●●
●●
●●●
●
●
●
●
●
●
●
●
●●
●●
●●
●
●
●●
●
●
●
●
●
●●●
●●●
●
●
●
●
●
●●
●●●●
●
●
●
●
●
●
●●●
●●
●
●●
●
●
●
●
●
●
●
●
●
●
●
●
●●
●
●
●●●
●
●●●
●●
●
●
●
●
●
●
●
●●
●
●●
●●
●●●
●
●
●
●
●
●●●
●●
●
●
●
●●
●
●
●
●
●
●
●
●
●
●
●
●●●
●
●
●
●
●
●●
●●●●
●
●
●
●
●
●
●
●●
●
●
●
●
●
●
●
●
●
●
●
●
●
●●
●
●
●
●
●
●
●●●
●
●●
●
●●
●
●
●
●
●
●
●
●●
●
●●●
●
●●
●
●
●
●
●
●
●●
●
●
●
●
●
●
●
●
●●
●
●
●
●
●
●
●●
●
●●
●
●
●
●
●
●
●●
●●●●
●●
●●
●
●
●
●●
●●●●●●
●
●
●
●
●
●
●
●●
●
●
●
●
●
●●●●
●
●●
●
●
●
●
●
●
●
●
●
●
●●
●
●●●●
●●
●
●
●
●
●
●
●
●
●
●
●
●
●
●
●
●
●
●
●
●
●
●
●
●
●●
●
●
●●
●
●
●
●
●
●●
●●●●
●
●
●●
●
●
●
●●
●
●
●
●
●●
●
●
●
●
●
●
●
●
●
●
●
●
●
●
●
●●●
●
●●
●
●●
●
●
●
●
●
●
●
●●
●
●●●●
●
●
●
●
●
●
●
●
●
●
●
●●
●
●
●
●
●
●
●
●
●
●
●
●
●
●
●●●
●
●
●
●
●
●
●
●●
●●●●
●
●
●
●
●
●
●●
●
●●
●
●●
●
●
●
●
●
●
●
●
●●
●●
●
●
●
●
●●●
●
●●
●
●
●
●
●
●
●●
●
●
●●
●
●●●
●●
●●
●
●
●
●
●
●
●
●
●
●
●
●
●
●
●
●
●
●
●●
●
●
●
●
●●
●
●
●
●
●●
●
●
●
●
●●●●
●
●
●
●
●
●
●
●●
●●●
●
●
●
●
●
●
●
●
●
●
●●
●
●
●
●●
●●
●●
●
●●
●
●
●
●
●
●
●●
●
●
●●
●
●●●●●
●●
●
●
●
●
●
●●
●
●
●
●
●
●
●
●
●
●
●
●
●
●
●
●
●
●
●●
●
●
●
●
●
●
●
●
●
●●●
●
●
●
●
●
●
●
●
●●●
●
●●
●
●
●
●
●
●
●
●
●
●●
●
●
●
●
●
●
●●●
●
●●
●
●
●
●
●
●
●
●
●●
●●
●
●●●●●
●●
●
●
●
●●
●
●
●
●
●
●
●
●
●
●
●
1 2 3 4 5 6 7
0
5
10
15
20
25
3 6 9 12 15 18 21
MS runs
Lo
g2−
inte
nsitie
s
Endogenous
●●
●
●
●
●
●
●
●
●
●●●●
●
●
●
●
●●
●
●
●
●
●
●
●
●●
●
●
●
●
●
●
●
●●
●●
●
●
●●
●
●●
●
●
●
●
●
●
●
●
●
●
●
●
●●
●
●
●
●
●
●
●●
●
●
●
●
●●
●
●
●
●
●
●●
●
●
●
●
●●
●
●
●
●
●●
●
●
●
●
●
●
●
●
●
●
●
●
●
●●●
●●
●
●●●●●
●●
●
●
●
●
●●
●
●
●●
●●●
●
●
●●●
●●
●
●
●
●
●
●●●
●
●
●●
●
●
●
●
●
●
●
●
●●●
●
●●
●
●
●
●
●
●
●
●
●
●
●●●
●
●
●
●
●
●
●
●●
●●●
●
●●
●
●●
●
●
●
●
●
●
●
●
●
●
●●
●●
●
●
●
●
●
●
●●
●
●
●
●
●●
●
●
●
●
●
●●
●
●
●
●
●●
●
●
●
●
●●
●
●
●
●
●
●
●
●
●
●
●
●
●
●
●
●
●●
●
●
●
●●●●
●
●
●
●
●
●●
●
●
●●●●●●
●
●
●●
●●
●●
●
●
●
●●●
●
●
●●
●
●
●
●
●
●
●
●
●●●●
●
●
●
●
●●
●
●
●
●
●
●
●
●●
●
●
●
●
●
●
●
●●
●●●
●
●●
●
●●
●
●
●
●
●
●
●
●
●
●
●●
●●
●
●
●
●
●
●
●●
●
●
●
●
●
●
●
●
●
●
●
●●
●
●
●
●
●●
●
●
●
●
●●
●
●
●
●
●
●
●
●
●
●
●
●
●
●
●
●
●●
●
●●
●●●●
●
●
●
●
●●●
●
●
●●
●●●
●
●
●●
●
●●
●●
●
●
●
●●●
●
●
●●
●
●
●
●
●
●
●
●
●●●
●
●●
●
●
●
●
●
●●●
●
●●●●
●
●
●
●
●●●
●●
●
●
●
●
●
●
●
●●
●●
●
●
●
●
●
●
●
●
●
●
●
●
●
●
●
●
●
●
●
●
●
●
●
●
●●
●
●
●
●
●
●●
●
●
●
●●●
●
●
●
●
●●
●
●
●
●
●
●
●
●
●
●
●
●
●
●
●
●
●●
●
●●
●●●●
●
●
●
●
●
●●
●
●
●●
●●●●
●
●●
●
●●
●●
●
●
●
●●●
●●
●●
●
●
●
●
●
●
●
●
●●●
●
●
●
●
●
●
●
●
●●●
●
●●●●
●
●
●
●
●●●
●●
●●
●
●
●●
●
●
●
●
●
●
●
●
●
●
●
●
●
●
●
●
●
●
●
●
●
●
●
●
●
●
●
●
●
●
●
●
●
●
●
●
●
●
●
●
●
●●●
●●
●
●
●●
●
●
●
●
●
●
●
●
●
●
●
●
●
●●●
●●
●
●●
●●●●
●
●
●
●
●
●●
●
●●●
●●●●
●
●●
●●
●
●●
●
●
●
●●
●
●●
●●
●
●
●
●
●
●
●
●
●
●●
●
●
●
●
●
●
●
●
●●●
●
●●●●
●
●
●
●
●●●
●●
●
●
●
●
●●
●
●●
●●
●
●
●
●
●
●
●
●
●
●
●
●
●
●
●
●
●
●
●
●
●
●
●●
●●●
●
●
●
●
●●
●
●
●
●●●
●●
●
●
●●
●
●
●
●
●
●
●
●
●
●
●
●
●
●
●●
●●
●
●●
●●●●
●
●
●
●
●
●●
●
●●●
●●●●
●
●●
●
●
●
●●
●
●
●
●●
●
●●
●●
●
●
●
●
●
●
●
●
●
●●●
●●
●
●
●
●
●
●●●
●
●●●●
●
●
●
●
●
●
●
●
●
●
●
●
●
●●
●
●●
●
●
●
●
●
●
●
●
●
●
●
●
●
●
●
●
●
●
●
●
●●
●
●
●
●
●
●
●
●
●
●●
●
●
●●
●
●●●
●
●
●
●
●●
●
●
●
●
●●
●
●
●
●
●
●
●
●●●
●●
●
●●
●●●●
●
●
●
●
●●●
●
●
●●
●●
●●
●
●●
●
●●
●●
●
●
●
●●●
●●
●●
●
●
●
●
●
●
●
●
●
●●
●
●
●
●
●
●
●
●
●●●
●
●●●●
●
●
●
●
●
●
●
●
●
●
●
●
●
●●
●
●
●
●
●
●
●
●
●
●
●
●
●
●
●
●
●
●
●
●
●
●
●
●●
●
●
●
●
●●
●
●
●
●
●
●
●
●●
●
●●●
●●
●
●
●●
●
●
●
●
●●
●
●
●
●
●
●
●
●●●
●●
●
●●
●●●●
●
●
●
●
●
●●
●
●
●
●
●●●●
●
●●●
●●
●●
●
●
●
●●●
●●
●●
●
●
●
●
●
●
●
●
●
●●
●
●●
●
●
●
●
●
●●●
●
●●●●
●
●
●
●
●
●
●
●
●
●●
●
●
●●
●
●
●
●
●
●
●
●
●
●
●
●
●
●
●
●
●
●
●
●
●●
●●
●
●
●
●
●
●
●
●
●
●
●
●
●●
●●
●
●●●
●●
●
●
●●
●
●
●
●
●●
●
●
●
●
●
●
●
●●●
●●
●
●●
●●●●
●
●
●
●
●
●
●
●
●
●●
●●●●●
●●
●
●●
●●
●
●
●
●●●
●●
●●
●
●
●
●
●●
●
●
●
●●●
●●
●
●
●
●
●
●●●
●
●●●●
●
●
●
●
●
●
●
●
●
●
●
●
●
●●
●
●
●
●
●
●
●
●
●
●
●
●
●●●
●
●
●
●
●
●
●
●
●●
●
●
●
●
●
●
●
●
●
●
●
●
●
●●
●
●●●
●●
●
●
●●●
●
●
●
●
●
●
●
●
●
●
●
●
●●●
●●
●
●●
●●
●●●
●
●
●
●●●
●
●
●●
●●
●
●
●
●
●●●●
●●
●
●
●
●
●●
●●
●●
●
●
●
●
●●
●
●
●
●●●
●
●
●
●
●●
●
●
●●●
●●●●
●
●
●
●
●
●
●
●
●●●
●
●
●●
●
●●
●
●
●
●
●
●
●
●
●●
●●
●
●
●
●
●
●
●●
●●
●
●
●
●
●
●
●
●
●
●
●
●
●●●
●
●●●
●●
●
●
●●
●
●
●
●
●
●
●
●
●
●
●
●
●
●●●
●●
●
●●
●●
●●●
●
●
●●
●
●
●●
●
●
●
●●
●
●
●
●
●
●
●
●●
●
●
●
●●●
●●
●
●
●
●
●
●
●●
●
●
●
●●
●
●●
●
●
●
●
●
●●●●
●●●●
●
●
●
●
●
●
●
●
●
●
●
●
●
●●
●
●
●
●
●
●
●
●
●
●
●
●
●
●●●
●
●
●
●
●
●
●
●
●
●
●
●
●
●
●
●●
●
●
●
●
●
●●
●
●●●
●●
●
●
●●●
●
●
●
●
●
●
●
●
●
●
●
●
●●●
●●
●
●●
●●●●●
●
●
●●
●●
●
●●●●
●●
●
●●●●
●●
●●
●
●
●
●●●
●
●
●●
●
●
●
●
●
●
●
●
●
●
●●
●●●
●
●●
●
●
●●●
●●●●
●
●
●
●
●
●
●
●
●●
●
●
●●
●
●
●
●
●
●
●
●
●
●
●
●
●
●
●
●●
●
●
●
●
●
●
●
●
●
●
●
●
●
●●
●
●
●
●
●
●
●●●
●
●●
●
●●
●
●
●
●
●
●
●
●
●
●
●
●
●
●
●
●
●
●
●
●
●●
●
●●
●●
●●●
●
●
●
●
●●
●
●
●
●
●●●
●
●●●●
●
●
●●
●
●
●
●
●●
●
●
●●
●
●
●
●
●
●
●
●
●
●●
●
●
●
●
●
●
●
●
●
●●●
●●●●
●
●
●
●
●
●
●
●
●●
●
●●
●●
●●
●
●
●
●
●
●
●
●
●
●
●
●●●
●
●
●
●
●
●
●
●●
●
●
●
●
●●
●
●
●
●
●
●
●●●
●
●
●
●
●●
●
●
●
●●
●
●●
●
●
●
●
●●
●
●
●
●●
●
●●
●
●●
●●
●●●
●
●
●
●
●
●
●
●
●
●●
●●
●
●
●●
●
●
●
●●
●
●
●
●
●●
●
●
●●
●
●
●
●
●
●
●
●
●
●●●
●●●
●
●
●
●
●
●●●
●●●●
●
●
●
●
●
●
●
●
●●●
●●
●
●
●
●
●
●
●
●
●
●
●
●
●
●
●
●
●
●
●
●
●
●
●
●
●
●
●
●
●
●
●
●
●●
●●
●
●
●
●●●
●
●●●
●●
●
●
●
●
●
●
●
●
●
●
●
●
●
●
●
●
●
●
●
●
●●
●
●●
●●
●●●
●
●
●
●
●●
●
●●●
●●●●
●
●●
●
●
●
●●
●
●
●
●●●
●
●
●●
●
●
●
●
●
●
●
●
●
●
●
●
●●●
●
●
●
●
●
●
●
●
●●●●
●
●
●
●
●
●
●
●
●
●●
●
●
●
●
●
●
●
●
●
●
●
●
●
●
●●
●
●●
●
●
●
●
●
●●
●
●
●
●
●
●
●
●●
●
●
●
●
●
●
●●●
●
●●
●
●●
●
●
●
●
●
●●
●
●
●
●
●
●
●
●
●
●
●
●
●
●●
●
●●●
●
●●
●
●
●
●
●
●●
●
●●
●
●
●
●
●
●
●
●
●
●
●
●
●
●
●
●
●
●
●
●
●
●
●
●
●
●
●
●
●
●
●
●
●●
●
●●
●
●
●
●
●
●
●
●
●
●●●●
●
●
●●
●●
●
●
●
●●
●●●●
●
●●
●
●
●
●
●
●
●
●
●
●
●●
●
●
●
●
●
●
●●●
●
●
●
●
●
●
●
●
●●
●
●
●●●●
●
●●
●
●
●
●
●
●
●
●
●●
●
●
●
●
●
●
●
●
●
●
●
●
●
●●
●
●●●●
●●
●
●
●
●
●
●●
●
●
●
●
●
●
●
●
●
●
●
●
●
●
●
●
●
●
●
●
●
●
●
●
●
●
●
●
●
●
●
●
●
●
●
●●
●
●
●●
●
●
●
●
●
●
●
●
●●●●
●
●
●
●
●●
●
●
●
●●
●
●
●
●
●
●●
●
●
●
●
●
●
●
●
●
●
●
●
●
●
●
●
●
●
●
●●
●
●
●
●
●
●●
●
●
●
●
●
●
●●●
●
●●
●
●●
●
●
●
●
●
●●
●
●
●
●
●
●●
●
●
●
●
●
●
●●
●
●●●●
●
●
●
●
●
●
●
●
●
●
●
●
●
●
●●●
●
●●
●
●
●
●
●
●
●
●
●
●
●
●
●
●
●
●
●
●
●
●
●
●
●
●
●
●●●
●
●
●
●
●
●
●
●
●●
●●●●
●
●
●
●
●
●
●
●
●●
●
●●
●
●
●
●
●
●
●
●
●
●
●
●
●
●
●
●●
●●
●
●
●
●
●
●
●
●
●
●
●
●
●
●
●●●
●
●
●
●●●
●
●●
●
●
●
●
●
●
●●●
●
●
●●
●
●
●
●
●
●
●
●
●
●
●●
●
●●●
●●
●●
●
●
●
●
●
●
●
●
●
●
●
●
●
●
●
●
●
●
●
●
●
●
●
●
●
●
●
●
●
●
●
●
●
●
●
●●
●
●
●
●
●
●●
●
●
●
●
●●
●
●
●
●
●
●●●●
●
●●
●
●
●
●
●
●
●●
●●●
●
●
●
●
●
●
●
●
●
●
●
●
●
●
●●
●
●
●
●
●
●
●
●
●●
●
●
●
●
●
●●
●
●
●
●
●●
●●
●
●●
●
●
●
●
●
●
●●●
●
●
●●
●
●
●
●
●
●
●
●
●
●●●
●
●●●●●
●●
●
●
●
●
●
●
●
●●
●
●
●
●
●
●
●
●
●
●
●
●
●●
●
●
●
●
●
●
●
●
●
●
●
●
●
●
●
●
●
●
●
●
●●
●
●
●
●
●
●
●
●
●●
●●●
●
●
●
●
●
●
●
●
●
●
●●●
●
●●
●
●
●
●
●
●
●
●
●
●
●
●
●
●●
●
●
●
●
●
●
●
●
●
●●
●
●
●
●
●
●●●
●
●
●
●●●
●
●●
●
●
●
●
●
●
●
●
●●
●
●
●
●
●
●
●
●
●
●
●
●
●
●●
●
●●●●●
●●
●
●
●
●
●
●●
●
●
●
●●
●●
●
●
●
●
●
●
●
●
●
●
●
●
●
●
●
●
1 2 3 4 5 6 7
0
5
10
15
20
25
3 6 9 12 15 18 21
MS runs
Lo
g2−
inte
nsitie
s
Original spike-in DIA dataAfter feature selection, informative features are selected.
MS runs
Log2
-In
ten
siti
es
Log2
-In
ten
siti
es
MS runs
Endogenous Endogenous

Reference Endogenous
●
●
●●
●
●
●
●
●
●
●
●
●
●
●
●
●
●●●
●
●
●
●
●
●
●●
●
●
●
●●●●
●
●
●
●
●
●●
●
●
●
●
●
●●●
●
●
●
●
●
●
●●
●
●
●
●●●●
●
●
●
●
●
●
●
●
●
●
●
●
●
●●
●
●
●
●
●
●
●
●
●
●
●
●
●●●
●
●
●
●
●
●
●
●
●
●
●
●●●●
●
●
●
●
●
●
●
●
●
●
●
●
●●●
●
●
●
●
●
●
●
●
●●
●
●
●
●●
●
●
●
●
●
●
●
●
●●
5
10
15
20
2 5 2 5
MS runs
Log2−i
nten
sitie
s
18
New in MSstats (beta) : automated feature
selection
Reference Endogenous
●
●
●
●
●
●
●
●
●
●●
●●●
●
●
●
●
●
●
●●●●
●
●
●
●
●
●
●
●●●
●
●
●
●
●
●
●●●●
●
●
●
●
●
●
●●
●
●
●
●
●
●
●
●
●
●●●
●
●
●
●
●
●
●●●●
●
●
●
●
●
●
●
●●●
●
●
●
●
●
●
●
●
●●
●
●
●
●
●
●
5
10
15
20
2 5 2 5
MS runs
Log2−i
nten
sitie
s
Reference Endogenous
●
●
●
●
●
●
●
●
●
●
●
●●
●
●
●
●
●●●
●
●
●
●
●
●
●
●
●
●
●
●●●●
●
●
●
●
●
●
●●
●
●
●
●
●●●
●
●
●
●
●
●
●●
●
●
●
●●●●
●
●
●
●
●
●
●
●
●
●
●
●●
●
●
●
●
●
●
●
●
●●
●
●
●
●
●●●
●
●
●
●
●
●
●
●
●
●
●
●●●●
●
●
●
●
●
●
●
●
●
●
●
●
●●●
●
●
●
●
●
●
●
●
●●
●
●
●
●●
●
●
●
●
●
●
●
●
●●
5
10
15
20
2 5 2 5
MS runs
Log2−i
nten
sitie
s
Reference Endogenous
●
●
●
●
●
●
●
●
●
●●
●
●
●
●
●
●●●
●
●
●
●
●
●
●●
●
●
●
●
●
●
●●
●
●
●
●
●
●●●
●
●
●
●
●
●
●●
●
●
●
●
●
●
●●
●
●
●
●
●
●
●●
●
●
●
●
●
●
●●
●
●
●
●
●
5
10
15
20
2 5 2 5
MS runs
Log2−i
nten
sitie
s
All features Refinement from Skyline
After automated feature selection
MS runs
Log2
-In
ten
siti
es
MS runs
Log2
-In
ten
siti
es
MS runs
Log2
-In
ten
siti
es
MS runs
Log2
-In
ten
siti
es
Reference Endogenous Reference Endogenous
Reference Endogenous Reference Endogenous

19
Outline
1. MSstats : statistical tool for quantitative MS proteomics
1. Workflow of MSstats
2. MSstats as an external tool
2. Integration of Skyline improves analysis workflow
1. User interface
2. Checking quality of features
3. Different workflows require different
1. statistical models
2. normalization
4. How to access MSstats
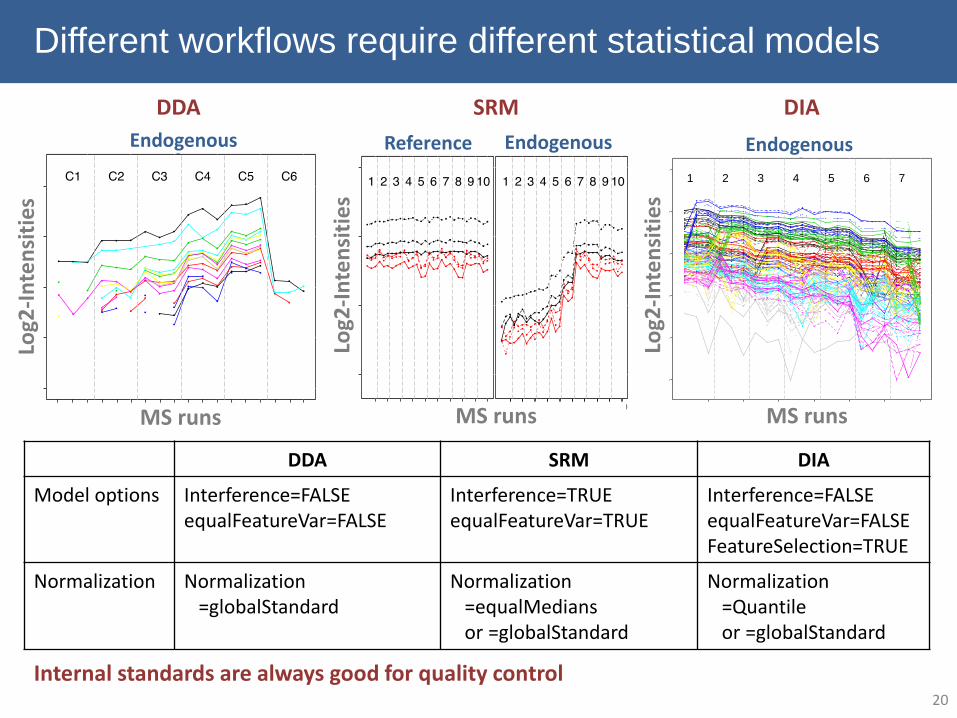
20
Different workflows require different statistical models
DDA SRM DIA
DDA SRM DIA
Model options Interference=FALSEequalFeatureVar=FALSE
Interference=TRUEequalFeatureVar=TRUE
Interference=FALSEequalFeatureVar=FALSEFeatureSelection=TRUE
Normalization Normalization=globalStandard
Normalization=equalMediansor =globalStandard
Normalization=Quantileor =globalStandard
Internal standards are always good for quality control
Endogenous
●●
●
●
●
●
●
●
●
●
●●●●
●
●
●
●
●●
●
●
●
●
●
●
●
●●
●
●
●
●
●
●
●
●●
●●
●
●
●●
●
●●
●
●
●
●
●
●
●
●
●
●
●
●
●●
●
●
●
●
●
●
●●
●
●
●
●
●●
●
●
●
●
●
●●
●
●
●
●
●●
●
●
●
●
●●
●
●
●
●
●
●
●
●
●
●
●
●
●
●●●
●●
●
●●●●●
●●
●
●
●
●
●●
●
●
●●
●●●
●
●
●●●
●●
●
●
●
●
●
●●●
●
●
●●
●
●
●
●
●
●
●
●
●●●
●
●●
●
●
●
●
●
●
●
●
●
●
●●●
●
●
●
●
●
●
●
●●
●●●
●
●●
●
●●
●
●
●
●
●
●
●
●
●
●
●●
●●
●
●
●
●
●
●
●●
●
●
●
●
●●
●
●
●
●
●
●●
●
●
●
●
●●
●
●
●
●
●●
●
●
●
●
●
●
●
●
●
●
●
●
●
●
●
●
●●
●
●
●
●●●●
●
●
●
●
●
●●
●
●
●●●●●●
●
●
●●
●●
●●
●
●
●
●●●
●
●
●●
●
●
●
●
●
●
●
●
●●●●
●
●
●
●
●●
●
●
●
●
●
●
●
●●
●
●
●
●
●
●
●
●●
●●●
●
●●
●
●●
●
●
●
●
●
●
●
●
●
●
●●
●●
●
●
●
●
●
●
●●
●
●
●
●
●
●
●
●
●
●
●
●●
●
●
●
●
●●
●
●
●
●
●●
●
●
●
●
●
●
●
●
●
●
●
●
●
●
●
●
●●
●
●●
●●●●
●
●
●
●
●●●
●
●
●●
●●●
●
●
●●
●
●●
●●
●
●
●
●●●
●
●
●●
●
●
●
●
●
●
●
●
●●●
●
●●
●
●
●
●
●
●●●
●
●●●●
●
●
●
●
●●●
●●
●
●
●
●
●
●
●
●●
●●
●
●
●
●
●
●
●
●
●
●
●
●
●
●
●
●
●
●
●
●
●
●
●
●
●●
●
●
●
●
●
●●
●
●
●
●●●
●
●
●
●
●●
●
●
●
●
●
●
●
●
●
●
●
●
●
●
●
●
●●
●
●●
●●●●
●
●
●
●
●
●●
●
●
●●
●●●●
●
●●
●
●●
●●
●
●
●
●●●
●●
●●
●
●
●
●
●
●
●
●
●●●
●
●
●
●
●
●
●
●
●●●
●
●●●●
●
●
●
●
●●●
●●
●●
●
●
●●
●
●
●
●
●
●
●
●
●
●
●
●
●
●
●
●
●
●
●
●
●
●
●
●
●
●
●
●
●
●
●
●
●
●
●
●
●
●
●
●
●
●●●
●●
●
●
●●
●
●
●
●
●
●
●
●
●
●
●
●
●
●●●
●●
●
●●
●●●●
●
●
●
●
●
●●
●
●●●
●●●●
●
●●
●●
●
●●
●
●
●
●●
●
●●
●●
●
●
●
●
●
●
●
●
●
●●
●
●
●
●
●
●
●
●
●●●
●
●●●●
●
●
●
●
●●●
●●
●
●
●
●
●●
●
●●
●●
●
●
●
●
●
●
●
●
●
●
●
●
●
●
●
●
●
●
●
●
●
●
●●
●●●
●
●
●
●
●●
●
●
●
●●●
●●
●
●
●●
●
●
●
●
●
●
●
●
●
●
●
●
●
●
●●
●●
●
●●
●●●●
●
●
●
●
●
●●
●
●●●
●●●●
●
●●
●
●
●
●●
●
●
●
●●
●
●●
●●
●
●
●
●
●
●
●
●
●
●●●
●●
●
●
●
●
●
●●●
●
●●●●
●
●
●
●
●
●
●
●
●
●
●
●
●
●●
●
●●
●
●
●
●
●
●
●
●
●
●
●
●
●
●
●
●
●
●
●
●
●●
●
●
●
●
●
●
●
●
●
●●
●
●
●●
●
●●●
●
●
●
●
●●
●
●
●
●
●●
●
●
●
●
●
●
●
●●●
●●
●
●●
●●●●
●
●
●
●
●●●
●
●
●●
●●
●●
●
●●
●
●●
●●
●
●
●
●●●
●●
●●
●
●
●
●
●
●
●
●
●
●●
●
●
●
●
●
●
●
●
●●●
●
●●●●
●
●
●
●
●
●
●
●
●
●
●
●
●
●●
●
●
●
●
●
●
●
●
●
●
●
●
●
●
●
●
●
●
●
●
●
●
●
●●
●
●
●
●
●●
●
●
●
●
●
●
●
●●
●
●●●
●●
●
●
●●
●
●
●
●
●●
●
●
●
●
●
●
●
●●●
●●
●
●●
●●●●
●
●
●
●
●
●●
●
●
●
●
●●●●
●
●●●
●●
●●
●
●
●
●●●
●●
●●
●
●
●
●
●
●
●
●
●
●●
●
●●
●
●
●
●
●
●●●
●
●●●●
●
●
●
●
●
●
●
●
●
●●
●
●
●●
●
●
●
●
●
●
●
●
●
●
●
●
●
●
●
●
●
●
●
●
●●
●●
●
●
●
●
●
●
●
●
●
●
●
●
●●
●●
●
●●●
●●
●
●
●●
●
●
●
●
●●
●
●
●
●
●
●
●
●●●
●●
●
●●
●●●●
●
●
●
●
●
●
●
●
●
●●
●●●●●
●●
●
●●
●●
●
●
●
●●●
●●
●●
●
●
●
●
●●
●
●
●
●●●
●●
●
●
●
●
●
●●●
●
●●●●
●
●
●
●
●
●
●
●
●
●
●
●
●
●●
●
●
●
●
●
●
●
●
●
●
●
●
●●●
●
●
●
●
●
●
●
●
●●
●
●
●
●
●
●
●
●
●
●
●
●
●
●●
●
●●●
●●
●
●
●●●
●
●
●
●
●
●
●
●
●
●
●
●
●●●
●●
●
●●
●●
●●●
●
●
●
●●●
●
●
●●
●●
●
●
●
●
●●●●
●●
●
●
●
●
●●
●●
●●
●
●
●
●
●●
●
●
●
●●●
●
●
●
●
●●
●
●
●●●
●●●●
●
●
●
●
●
●
●
●
●●●
●
●
●●
●
●●
●
●
●
●
●
●
●
●
●●
●●
●
●
●
●
●
●
●●
●●
●
●
●
●
●
●
●
●
●
●
●
●
●●●
●
●●●
●●
●
●
●●
●
●
●
●
●
●
●
●
●
●
●
●
●
●●●
●●
●
●●
●●
●●●
●
●
●●
●
●
●●
●
●
●
●●
●
●
●
●
●
●
●
●●
●
●
●
●●●
●●
●
●
●
●
●
●
●●
●
●
●
●●
●
●●
●
●
●
●
●
●●●●
●●●●
●
●
●
●
●
●
●
●
●
●
●
●
●
●●
●
●
●
●
●
●
●
●
●
●
●
●
●
●●●
●
●
●
●
●
●
●
●
●
●
●
●
●
●
●
●●
●
●
●
●
●
●●
●
●●●
●●
●
●
●●●
●
●
●
●
●
●
●
●
●
●
●
●
●●●
●●
●
●●
●●●●●
●
●
●●
●●
●
●●●●
●●
●
●●●●
●●
●●
●
●
●
●●●
●
●
●●
●
●
●
●
●
●
●
●
●
●
●●
●●●
●
●●
●
●
●●●
●●●●
●
●
●
●
●
●
●
●
●●
●
●
●●
●
●
●
●
●
●
●
●
●
●
●
●
●
●
●
●●
●
●
●
●
●
●
●
●
●
●
●
●
●
●●
●
●
●
●
●
●
●●●
●
●●
●
●●
●
●
●
●
●
●
●
●
●
●
●
●
●
●
●
●
●
●
●
●
●●
●
●●
●●
●●●
●
●
●
●
●●
●
●
●
●
●●●
●
●●●●
●
●
●●
●
●
●
●
●●
●
●
●●
●
●
●
●
●
●
●
●
●
●●
●
●
●
●
●
●
●
●
●
●●●
●●●●
●
●
●
●
●
●
●
●
●●
●
●●
●●
●●
●
●
●
●
●
●
●
●
●
●
●
●●●
●
●
●
●
●
●
●
●●
●
●
●
●
●●
●
●
●
●
●
●
●●●
●
●
●
●
●●
●
●
●
●●
●
●●
●
●
●
●
●●
●
●
●
●●
●
●●
●
●●
●●
●●●
●
●
●
●
●
●
●
●
●
●●
●●
●
●
●●
●
●
●
●●
●
●
●
●
●●
●
●
●●
●
●
●
●
●
●
●
●
●
●●●
●●●
●
●
●
●
●
●●●
●●●●
●
●
●
●
●
●
●
●
●●●
●●
●
●
●
●
●
●
●
●
●
●
●
●
●
●
●
●
●
●
●
●
●
●
●
●
●
●
●
●
●
●
●
●
●●
●●
●
●
●
●●●
●
●●●
●●
●
●
●
●
●
●
●
●
●
●
●
●
●
●
●
●
●
●
●
●
●●
●
●●
●●
●●●
●
●
●
●
●●
●
●●●
●●●●
●
●●
●
●
●
●●
●
●
●
●●●
●
●
●●
●
●
●
●
●
●
●
●
●
●
●
●
●●●
●
●
●
●
●
●
●
●
●●●●
●
●
●
●
●
●
●
●
●
●●
●
●
●
●
●
●
●
●
●
●
●
●
●
●
●●
●
●●
●
●
●
●
●
●●
●
●
●
●
●
●
●
●●
●
●
●
●
●
●
●●●
●
●●
●
●●
●
●
●
●
●
●●
●
●
●
●
●
●
●
●
●
●
●
●
●
●●
●
●●●
●
●●
●
●
●
●
●
●●
●
●●
●
●
●
●
●
●
●
●
●
●
●
●
●
●
●
●
●
●
●
●
●
●
●
●
●
●
●
●
●
●
●
●
●●
●
●●
●
●
●
●
●
●
●
●
●
●●●●
●
●
●●
●●
●
●
●
●●
●●●●
●
●●
●
●
●
●
●
●
●
●
●
●
●●
●
●
●
●
●
●
●●●
●
●
●
●
●
●
●
●
●●
●
●
●●●●
●
●●
●
●
●
●
●
●
●
●
●●
●
●
●
●
●
●
●
●
●
●
●
●
●
●●
●
●●●●
●●
●
●
●
●
●
●●
●
●
●
●
●
●
●
●
●
●
●
●
●
●
●
●
●
●
●
●
●
●
●
●
●
●
●
●
●
●
●
●
●
●
●
●●
●
●
●●
●
●
●
●
●
●
●
●
●●●●
●
●
●
●
●●
●
●
●
●●
●
●
●
●
●
●●
●
●
●
●
●
●
●
●
●
●
●
●
●
●
●
●
●
●
●
●●
●
●
●
●
●
●●
●
●
●
●
●
●
●●●
●
●●
●
●●
●
●
●
●
●
●●
●
●
●
●
●
●●
●
●
●
●
●
●
●●
●
●●●●
●
●
●
●
●
●
●
●
●
●
●
●
●
●
●●●
●
●●
●
●
●
●
●
●
●
●
●
●
●
●
●
●
●
●
●
●
●
●
●
●
●
●
●
●●●
●
●
●
●
●
●
●
●
●●
●●●●
●
●
●
●
●
●
●
●
●●
●
●●
●
●
●
●
●
●
●
●
●
●
●
●
●
●
●
●●
●●
●
●
●
●
●
●
●
●
●
●
●
●
●
●
●●●
●
●
●
●●●
●
●●
●
●
●
●
●
●
●●●
●
●
●●
●
●
●
●
●
●
●
●
●
●
●●
●
●●●
●●
●●
●
●
●
●
●
●
●
●
●
●
●
●
●
●
●
●
●
●
●
●
●
●
●
●
●
●
●
●
●
●
●
●
●
●
●
●●
●
●
●
●
●
●●
●
●
●
●
●●
●
●
●
●
●
●●●●
●
●●
●
●
●
●
●
●
●●
●●●
●
●
●
●
●
●
●
●
●
●
●
●
●
●
●●
●
●
●
●
●
●
●
●
●●
●
●
●
●
●
●●
●
●
●
●
●●
●●
●
●●
●
●
●
●
●
●
●●●
●
●
●●
●
●
●
●
●
●
●
●
●
●●●
●
●●●●●
●●
●
●
●
●
●
●
●
●●
●
●
●
●
●
●
●
●
●
●
●
●
●●
●
●
●
●
●
●
●
●
●
●
●
●
●
●
●
●
●
●
●
●
●●
●
●
●
●
●
●
●
●
●●
●●●
●
●
●
●
●
●
●
●
●
●
●●●
●
●●
●
●
●
●
●
●
●
●
●
●
●
●
●
●●
●
●
●
●
●
●
●
●
●
●●
●
●
●
●
●
●●●
●
●
●
●●●
●
●●
●
●
●
●
●
●
●
●
●●
●
●
●
●
●
●
●
●
●
●
●
●
●
●●
●
●●●●●
●●
●
●
●
●
●
●●
●
●
●
●●
●●
●
●
●
●
●
●
●
●
●
●
●
●
●
●
●
●
1 2 3 4 5 6 7
0
5
10
15
20
25
3 6 9 12 15 18 21
MS runs
Lo
g2−
inte
nsitie
s
MS runs
Log2
-In
ten
siti
es
MS runs
Log2
-In
ten
siti
es
MS runs
Log2
-In
ten
siti
es
Reference EndogenousEndogenous Endogenous

21
Outline
1. MSstats : statistical tool for quantitative MS proteomics
1. Workflow of MSstats
2. MSstats as an external tool
2. Integration of Skyline improves analysis workflow
1. User interface
2. Checking quality of features
3. Different workflows require different
1. statistical models
2. normalization
4. How to access MSstats

22
External tool in Skyline
- Downloads from Feb 2014 : 1543
- From MSstats external tool webpage or ‘Tool store’
- Automatic installations for all related software and packages
- One-click analysis

23
Bioconductor
- MSstats v2.3.0 under BioC 3.0
- Unique downloads from Oct 2013 : 1073
Take advantage of options and modify the data easily.
- New functionality : Quantification for sample, feature selection
- Detailed options for all plots
- More options for design sample size function

24
msstats.org and MSstats google group
- News about Msstats
- MSstats.daily is available : development version available
- Tutorials for different workflows (under ‘WORKFLOWS’)
- Example datasets with R-scripts
- Related publications
- Announce new release
or news in the mailing
list
- Question and answer
- Discussion and
suggestion

25
Biomedical investigations using MSstats
• Ruth Hüttenhain et al. "Reproducible Quantification of Cancer-Associated Proteins in Body Fluids Using Targeted Proteomics". Sci Transl Med 4, 142ra94 (2012);
• Ruth Hüttenhain et al. "N-Glycoprotein SRMAtlas: A resource of mass-spectrometric assays for N-glycosites enabling consistent and multiplexed protein quantification for clinical applications". MCP
• Surinova et al. "Automated SRM data analysis workflow for large scale proteomic studies." Nature Methods
• Sabido et al., "Targeted proteomics of the eicosanoid biosynthetic pathway completes an integrated genomics-proteomics-metabolomics picture of cellular metabolism." MCP
• Sabido et al., "Targeted proteomics analysis of the insulin-pathway and central metabolism reveals substantial, strain-specific proteome changes after sustained high-fat diet in C57B6/J and 129Sv mice." Molecular Systems Biology
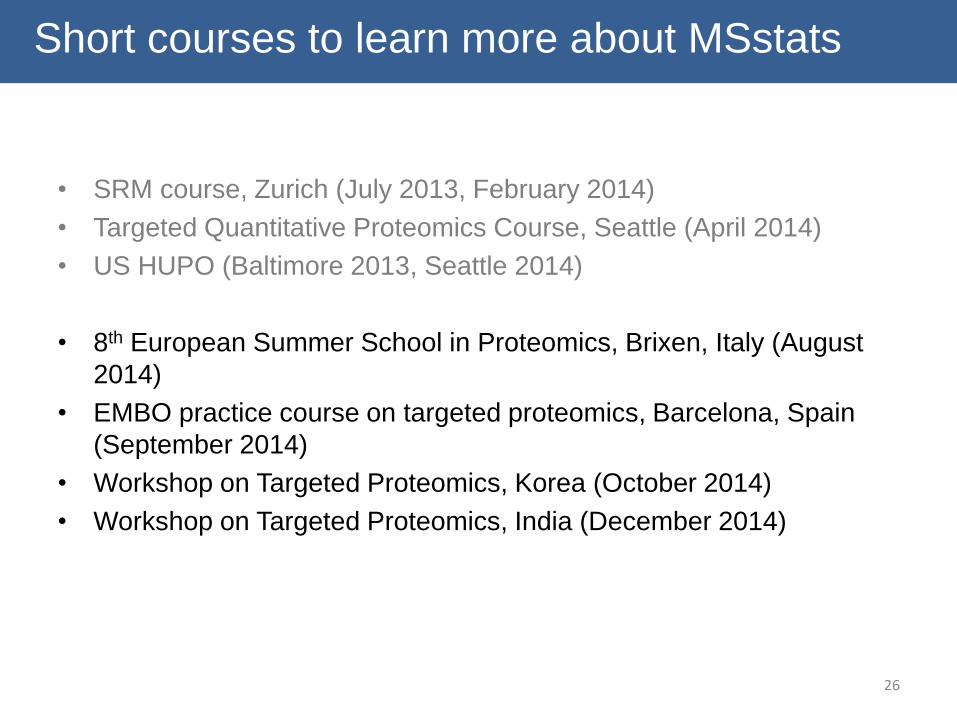
• SRM course, Zurich (July 2013, February 2014)
• Targeted Quantitative Proteomics Course, Seattle (April 2014)
• US HUPO (Baltimore 2013, Seattle 2014)
• 8th European Summer School in Proteomics, Brixen, Italy (August
2014)
• EMBO practice course on targeted proteomics, Barcelona, Spain
(September 2014)
• Workshop on Targeted Proteomics, Korea (October 2014)
• Workshop on Targeted Proteomics, India (December 2014)
26
Short courses to learn more about MSstats

Acknowledgements
Purdue University
o Prof. Olga Vitek
o Mike Cheng
o Veavi Chang
o Tim Clough
o Danni Yu
o Kyle Bemis
o April Harry
o Robert Ness
27
University of Washington
o Prof. Mike MacCoss and Lab
o Brendan MacLean
o Yuval Boss
ETH Züricho Prof. Ruedi Aebersold
o Olga Schubert
o Hannes Röst
o Ruth Hüttenhain
o Silvia Surinova
o Eduard Sabido
o Matondo Mariette
University of Zürich
o Meliana Riwanto