statistical analysis of the impact of imperfection modes
TRANSCRIPT

Proceedings of the Annual Stability Conference
Structural Stability Research Council Nashville, Tennessee, March 24-27, 2015
Statistical Analysis of the Impact of Imperfection Modes on Collapse Behavior of Cold-Formed Steel Members
Hamed Amouzegar1, Behrooz Amirzadeh2, Xi Zhao3, Benjamin W. Schafer4, Mazdak P. Tootkaboni5
Abstract Post-buckling behavior of thin-walled, cold-formed steel members is complicated. The discrepancy between the experimentally measured load-deformation curves and computational simulations stems from a fundamental lack of knowledge about the initial stage of these members, in particular geometric imperfections. Attempts to push numerical simulations closer to physical reality have traditionally focused on introducing geometric imperfections in the form of significant buckling modes (e.g. global, local and distortional) into the computational model. The uncertainty in the magnitude and shape of these imperfections, however, has largely been overlooked (or was modeled via oversimplified models) until recent years when probabilistic approaches to modeling imperfections began to emerge in the literature. This paper aims at proposing a framework for statistical analysis of the impact of global imperfection modes on collapse behavior of cold-formed steel members. Global geometric imperfections of cold-formed lipped channels are measured with reasonable accuracy. These measurements are then used within a stochastic fully nonlinear simulation framework to calculate an ensemble of load-deformation curves as well as load carrying capacities describing, in a statistical sense, the collapse behavior of cold-formed lipped channels. A robust analysis of variance (ANOVA) technique is finally used to examine the contribution of different imperfection modes in the variability present in the nonlinear response and to make quantitative conclusions on the impact of imperfection modes, both individually and in groups, on the collapse behavior. 1. Introduction Cold-formed steel members are made of high strength thin plates and exhibit very high strength-to-weight ratios. Due to their slenderness, however, the load-carrying capacity and post-buckling behavior of these members is sensitive to imperfections. Two types of imperfection are present in cold-formed members: material imperfections and geometric imperfections. Material imperfections are the residual
1Graduate student, University of Massachusetts Dartmouth, <[email protected]> 2Graduate student, University of Massachusetts Dartmouth, <[email protected]> 3Graduate student, Johns Hopkins University, <[email protected]> 4Professor and Chair, Department of Civil Engineering, Johns Hopkins University, <[email protected]> 5Assistant Professor, Department of Civil and Environmental Engineering, University of Massachusetts Dartmouth, <[email protected]>

2
stresses and strains created during the manufacturing process and the deviation of the elastic modulus and yield strength from their nominal values (Zeinoddini-Meimand 2011). Through-thickness longitudinal and transverse residual stresses and strains of a cold-formed member depend on its relative position in the coil and the plastic deformations it endures in the manufacturing process (Quach et al. 2006). Manufacturing, shipping, storage and construction processes, on the other hand, may cause geometric imperfections. Geometric imperfections could be either local (manifested in the form of cross-sectional distortions) or global, such as out-of-straightness along the length. In this study, global imperfections, in the form of bow (weak axis crookedness), camber (strong axis crookedness) and twist, are considered. Such imperfections are usually a result of manufacturing, shipping, storage and construction processes. Other types of imperfections, such as dents from straps, localized bending and rough end cuts can also be present as a result of shipping and storage (Zeinoddini-Meimand 2011) but are not considered here. Many researchers have tried to measure global imperfections of cold-formed members. (Dat & Peköz 1980), (Mulligan 1983), (Young 1997), (VieiraJr. 2011) and (Zeinoddini-Meimand 2011) have experimentally measured the cross-sectional and/or global imperfections of cold-formed members. In their experiments, they have measured either the out-of-straightness along the length or the local imperfections at different points across the cross-section and along the length. The majority of studies have assumed that the global imperfections over the length are distributed in the form of a half sine shape. (Zeinoddini-Meimand 2011) confirmed this assumption using their measurements on lipped channel members. Imperfections can affect the strength and collapse behavior of thin-walled structures.
Figure1 shows the buckling and post-buckling behavior of the Roorda’s frame for different initial imperfections. The frame can have stable or unstable post-buckling behaviors depending on the initial imperfection. In either case, increasing the magnitude of the imperfection can reduce the strength of the column. Furthermore, the sign of imperfection can be important. Imperfections can be considered as the combination of the buckling mode shapes calculated through buckling analysis of the member (Schafer & Ádány 2006). For a slender open thin-walled member (e.g. a cold-formed lipped channel), there are typically three buckling modes: local, distortional and global. Global mode shapes are categorized as flexure about the weak axis, flexure about the strong axis and torsion (Zeinoddini-Meimand 2011). Generalized beam theory and finite strip method can produce buckling mode shapes, the critical combination of which can be used in the collapse analysis of a thin-walled

3
member. However, design codes usually require simplified imperfection models to be included in the finite element model used to simulate the collapse and load carrying capacity. AISI-S100, for example, assumes that the out-of-straightness in a cold-formed steel column curve is L/960, where L is the column length. This assumption is adopted from AISC’s provisions on calculating the column curve of hot-rolled steel columns (Schafer & Zeinoddini 2008). This paper aims at proposing a framework for the analysis of the impact of geometric imperfections on collapse behavior of cold-formed steel members. Global geometric imperfections are considered. Statistics gathered from measurements on bow, camber and twist imperfections are fed into fully nonlinear FEM simulations to calculate an ensemble of load-deformation curves as well as load carrying capacities for cold-formed lipped channels. The results are then used to validate a “code prescribed” imperfection model. Analysis of variance (ANOVA) is also used to examine the contribution of different imperfection shapes in the variability present in the nonlinear response and to make quantitative conclusions on the impact of different imperfection modes.
Figure1 Load-deflection curve of Roorda’s frame (Adopted from (Salerno & Lanzo 1997))
2. Imperfection measurements and finite element modeling 2.1 Magnitude and distribution of imperfections
(Galambos 1998) introduced L/960 as the global imperfection for hot-rolled steel members on which the AISC column curve is based. The same magnitude has been adopted for cold-formed columns in
(AISI 2007). Many studies have attempted to measure global imperfections. The statistical summary of these measurements is shown in
Table 1. Statistical studies on measured global imperfections of cold-formed members show that the average measured values for bow are smaller than L/960. (Zeinoddini-Meimand 2011) showed that the distribution of bow follows a half sine shape over the length. (ZEINODDINI & SCHAFER 2011) compared the distribution of the measured bow, camber and twist to the first mode shape (half sine wave). The distribution for bow in particular fitted well to the first mode shape whereas most of the samples for twist did not exhibit a strong correlation with the first mode.
4
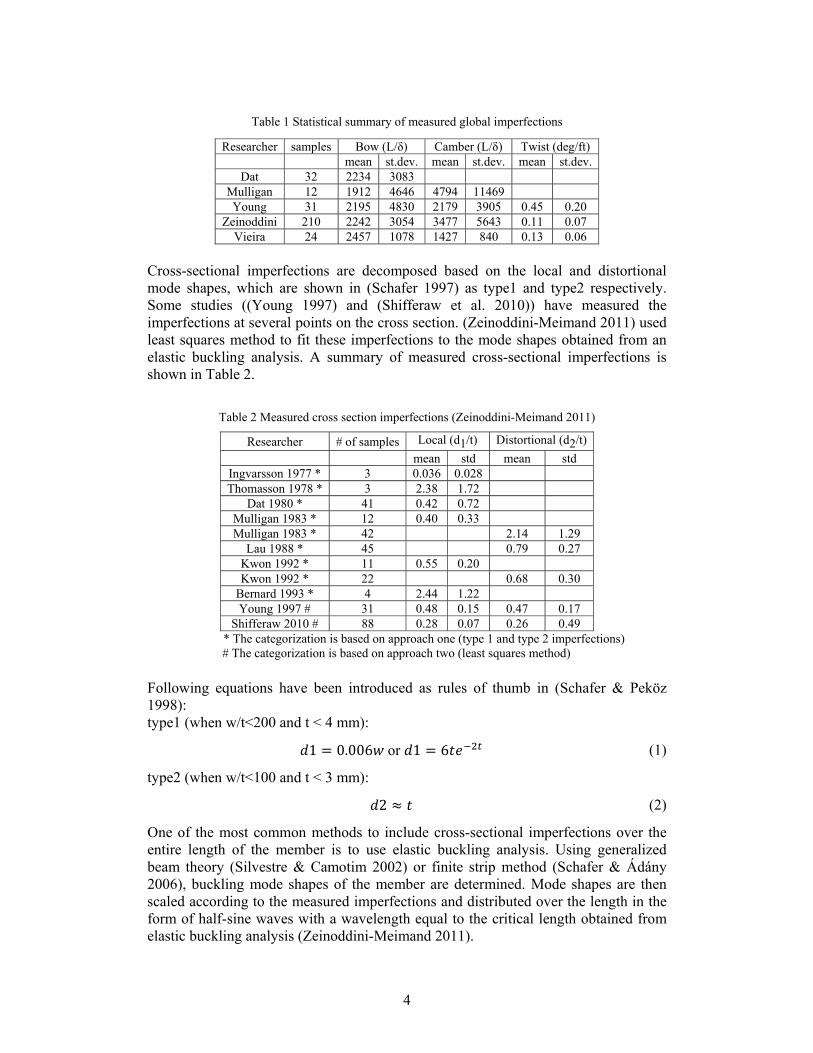
Table 1 Statistical summary of measured global imperfections
Researcher samples Bow (L/δ) Camber (L/δ) Twist (deg/ft) mean st.dev. mean st.dev. mean st.dev.
Dat 32 2234 3083 Mulligan 12 1912 4646 4794 11469 Young 31 2195 4830 2179 3905 0.45 0.20
Zeinoddini 210 2242 3054 3477 5643 0.11 0.07 Vieira 24 2457 1078 1427 840 0.13 0.06
Cross-sectional imperfections are decomposed based on the local and distortional mode shapes, which are shown in (Schafer 1997) as type1 and type2 respectively. Some studies ((Young 1997) and (Shifferaw et al. 2010)) have measured the imperfections at several points on the cross section. (Zeinoddini-Meimand 2011) used least squares method to fit these imperfections to the mode shapes obtained from an elastic buckling analysis. A summary of measured cross-sectional imperfections is shown in Table 2.
Table 2 Measured cross section imperfections (Zeinoddini-Meimand 2011)
* The categorization is based on approach one (type 1 and type 2 imperfections) # The categorization is based on approach two (least squares method)
Following equations have been introduced as rules of thumb in (Schafer & Peköz 1998): type1 (when w/t<200 and t < 4 mm): 1 = 0.006 or 1 = 6 (1)
type2 (when w/t<100 and t < 3 mm): 2 ≈ (2)
One of the most common methods to include cross-sectional imperfections over the entire length of the member is to use elastic buckling analysis. Using generalized beam theory (Silvestre & Camotim 2002) or finite strip method (Schafer & Ádány 2006), buckling mode shapes of the member are determined. Mode shapes are then scaled according to the measured imperfections and distributed over the length in the form of half-sine waves with a wavelength equal to the critical length obtained from elastic buckling analysis (Zeinoddini-Meimand 2011).
Researcher # of samples Local (d1/t) Distortional (d2/t)
mean std mean std Ingvarsson 1977 * 3 0.036 0.028 Thomasson 1978 * 3 2.38 1.72
Dat 1980 * 41 0.42 0.72 Mulligan 1983 * 12 0.40 0.33 Mulligan 1983 * 42 2.14 1.29
Lau 1988 * 45 0.79 0.27 Kwon 1992 * 11 0.55 0.20 Kwon 1992 * 22 0.68 0.30
Bernard 1993 * 4 2.44 1.22 Young 1997 # 31 0.48 0.15 0.47 0.17
Shifferaw 2010 # 88 0.28 0.07 0.26 0.49

5
Figure 2 Global and local (type 1 and type 2) imperfections
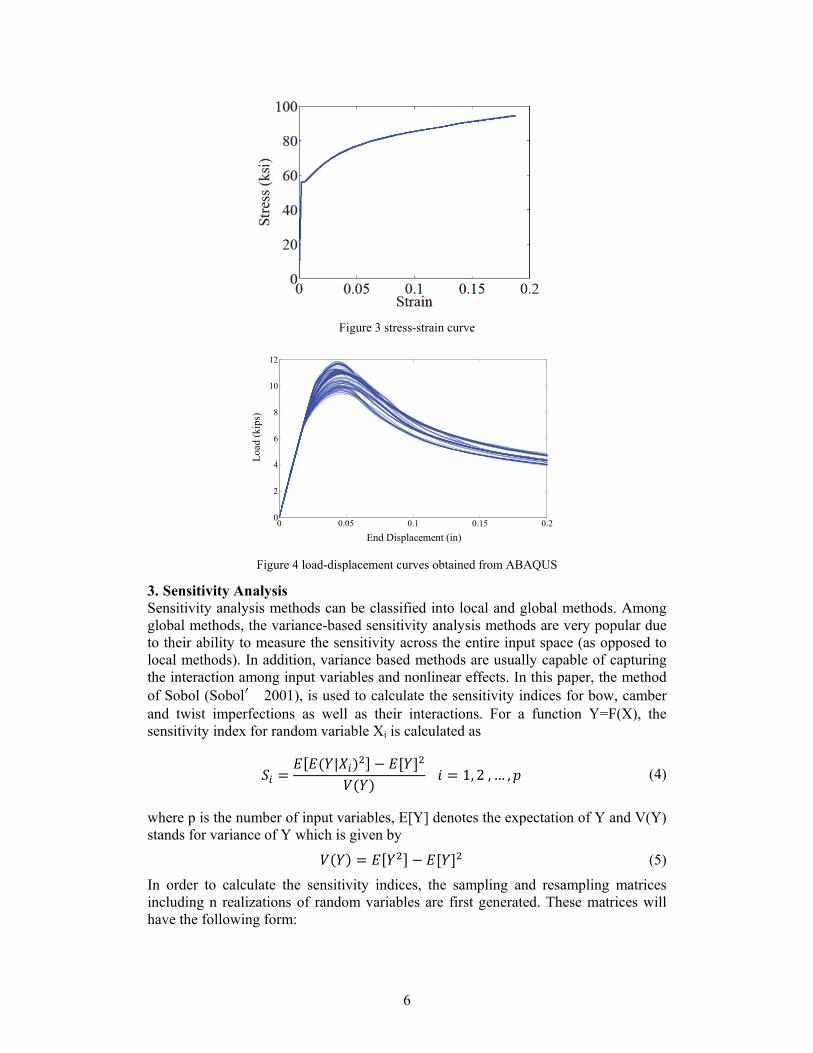
2.2 Finite element analysis The global imperfections measurements reported in (Zeinoddini-Meimand 2011) are used within a nonlinear finite element analysis framework to obtain post-buckling response of the single lipped channel columns subjected to the static compressive loading. The finite element models were made using (ABAQUS 2013). Python (ABAQUS scripting language) scripts were used to create a module for the collapse analysis and buckling analysis of general thin-walled members with arbitrary geometry, material properties, loading and boundary conditions. ABAQUS shell elements S9R5 were used to mesh the model. Care was given to keep the elements’ aspect ratio equal at 1:8 (Schafer & Moen 2008). At each end of the member, a reference point was defined on the centroid of the cross-section to which all the end nodes were tied. One reference point was fixed while the other one only had a specified longitudinal displacement towards the fixed point. Nonlinear static Riks analysis and the stress-strain curve shown in Figure 3 were used. Young’s modulus and Poisson’s ratio were assumed to be 29500 ksi and 0.3 respectively. Figure 4 shows load-displacement curves of a cold-formed lipped channel column with different global imperfection magnitudes (bow, camber and twist) obtained from nonlinear material and geometric analysis. While the curves are almost identical in the linear region, there is significant variability in the load carrying capacity and post-buckling behavior.
6
Figure 3 stress-strain curve
Figure 4 load-displacement curves obtained from ABAQUS
3. Sensitivity Analysis Sensitivity analysis methods can be classified into local and global methods. Among global methods, the variance-based sensitivity analysis methods are very popular due to their ability to measure the sensitivity across the entire input space (as opposed to local methods). In addition, variance based methods are usually capable of capturing the interaction among input variables and nonlinear effects. In this paper, the method of Sobol (Sobol′ 2001), is used to calculate the sensitivity indices for bow, camber and twist imperfections as well as their interactions. For a function Y=F(X), the sensitivity index for random variable Xi is calculated as
= [ ( | ) ] − [ ]( ) = 1, 2 , … , (4)
where p is the number of input variables, E[Y] denotes the expectation of Y and V(Y) stands for variance of Y which is given by ( ) = [ ] − [ ] (5)
In order to calculate the sensitivity indices, the sampling and resampling matrices including n realizations of random variables are first generated. These matrices will have the following form:
0 0.05 0.1 0.15 0.20
2
4
6
8
10
12
End Displacement (in)
Loa
d (k
ips)

7
= , , ⋯ ,, , … ,⋮ , ⋮ , ⋱ ⋮… , = , , ⋯ ,, , … ,⋮ , ⋮ , ⋱ ⋮… , (6)
The output Y for each row of S is then stored in the output vector below:
= ,,⋮ , (7)
In order to calculate the conditional expectation E[E(Y|Xi)2], denoted by Ui, another
sampling matrix Ci is created by replacing the ith column of R with that of S:
= , … , … ,, … , … ,⋮, ⋱… ⋮, ⋱… ⋮, (8)
The output Y for each row of Ci then reads:
= ,,⋮, (9)
Now, Ui can be estimated using the following equation: = [ oY ] (10)
where o is the element-wise multiplication operation. For the interactions, the sensitivity index with respect to Xi and Xj is given by the following expression
= − [ ]( ) − − (11)
in which Uij is obtained as = [ oY ] (12)
with the output vector obtained from evaluating Y for each row of Cij where Cij is
created by replacing the ith and jth columns of the matrix R by the ith and jth columns of matrix S. Note that, as shown in Eq. 11, the effect of low order indices must be subtracted in order to obtain the correct higher order indices. In addition, sensitivity indices have the following properties: 0 ≤ ≤ 1 (13)
, ,…, + + ⋯+ , ,…,, , ,…, = 1 (14)

8
3.1 Results of sensitivity analysis If the load carrying capacity of a cold-formed member is considered as a function of bow, camber and twist imperfections (i.e. Y=F(b,c,t)), then the sensitivity indices for these imperfection modes can be obtained from Eq. 4 and Eq. 11. Figure 5 shows three “individual” (as opposed to “group”) sensitivity indices for bow, camber and twist versus the number of simulations used to calculate these indices. It is observed that, as the number of FE analyses is increased the calculated indices show less fluctuation but a large number of FE simulations might be needed before convergence is achieved. In the section that follows, a response surface methodology is discussed that can be used to replace the expensive finite element analyses in the process of calculating sensitivity indices.
Figure 5 Sensitivity indices with respect to bow, camber and twist using ABAQUS analysis
4. Stochastic response surface method In order to accurately quantify the uncertainty in the post-buckling behavior of the cold-formed members, a large number of finite element analyses is needed. FE simulations are computationally expensive and time consuming. Therefore, a probabilistic collocation method is used instead. The probabilistic collocation method uses orthogonal polynomials in input uncertain parameters (geometric imperfections) to build a response surface (RS) for the output of interest (e.g. load carrying capacity). In this paper, Hermite polynomial chaos expansion (HPCE) is used. Two popular methods to obtain the coefficients of orthogonal polynomials comprising the RS are the Galerkin projection and the regression-based approaches (Xiong et al. 2010). In this paper, linear least squares regression is used to build the stochastic response surface (Eldred et al. 2008). 4.1 Developing the response surface model There are three steps to develop a stochastic response surface model: preparing the stochastic inputs, choosing the polynomial chaos expansion, calculating the unknown coefficients in the expansion (Li et al. 2011). The HPCE-based stochastic response surface method (SRSM) uses Hermite polynomials in standard normal variables { } . In this paper, bow, camber and twist are considered to be normal random variables { } . These variables are transformed into standard normal variables using the following equation: = + (15)
9
in which and are the mean and standard deviation of respectively. The functional form of the outputs is then written as ( ) = + Г (X ) + Г (X , X )
+ Г (X , X , X ) + ⋯
(16)
where { } is a set of n standard normal variables, , ⋯ , … are deterministic coeficients in the expansion and Г are multidimentional Hermite polynomials of order p. Eq. 16 can be rewritten in a simpler form ( ) = ( ) (17)
where and correspond to … and Г (X ,… , X ) respectively. The number of
the coefficients in the polynomial chaos expansion is given by = ( + )!! !
(18)
As mentioned before the coefficients in (17) are calculated using least squares regression (Li et al. 2011).
4.2 Comparison between the results of FEA and SRSM Error! Reference source not found. shows the comparison between statistics of load-displacement curves obtained from 1145 finite element analyses and Hermite polynomial chaos expansions of different orders. Imperfection magnitudes were generated based on the experimental data of (Zeinoddini-Meimand 2011). The curves are for a 362S162-68 SSMA stud section (with a 3.625 in web, 1.625 in flanges and 0.5 in lips, and 0.068 in thickness) with the length of 8 ft. The first order polynomial chaos perfectly matches the FEA results up to the maximum load. However, as the displacement is increased, the calculated variance decreases to values that do not represent the actual variability. Using higher order polynomials improves the agreement. As it is seen, the 5th order polynomial shows a very close agreement with the FEA results.

10
Figure 6 Comparison among load displacement curves obtained from FEA and RS
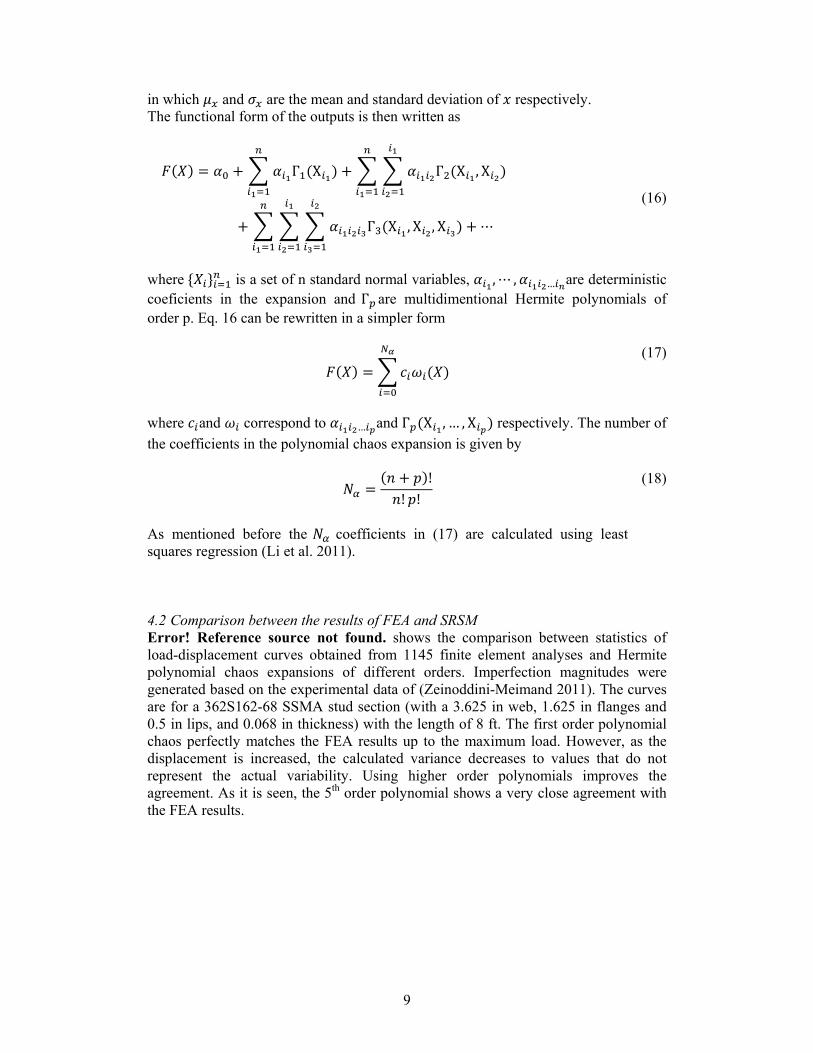
5. Results Following its good agreement with the FEA results, the 5th order Hermite polynomial chaos is used to simulate the load-carrying capacity of a set of 362S162-68 lipped channel sections with different lengths (1.64, 3.28, 4.9 and 6.56ft). A sensitivity analysis is performed to obtain the sensitivity indices for bow, camber and twist as well as their interactions. Figure 7 shows these sensitivity indices. As can be seen, bow and twist contribute the most in the load carrying capacity of the member for short lengths. However, as it is expected, by increasing the length, the effect of bow dominates to the extent that for the 1.64 ft long column, the variability in the load carrying capacity is almost entirely driven by bow imperfections.
Figure 7 Sensitivity indices with respect to bow, camber and twist using 5th order Hermite polynomial
for 362S162-68 section with different lengths
Sensitivity index for twist imperfection shows a rather different pattern. For shorter lengths, twist has a dominating influence while its effect diminishes at high lengths. It is also observed that the bow-twist interaction can be important for medium lengths. For the 3.28 ft long member, it has the same significance as bow and at 4.9 ft, it is more important than twist. These results are for the case where the distribution of twist is assumed to be in the form of a half sine wave over the length. The sensitivity indices for different lengths, for the case where twist imperfection is “linearly” distributed over the length are shown in Figure 8. It is observed that the distribution of imperfections along the length can strongly affect the contribution of different imperfection modes in the variability in load-carrying capacity of the member. Changing the distribution of twist along the length from sinusoidal to linear, for example, decreased the significance of twist to the extent that the load carrying
0 0.1 0.2 0.30
1
2
3
4
5
6
End displacement (in)
Loa
d (k
ips)
FEA (mean)FEA (mean +/− std)1th order HPCE (mean)1th order HPCE (mean +/− std)
0 0.1 0.2 0.30
1
2
3
4
5
6
End displacement (in)
Loa
d (k
ips)
FEA (mean)FEA (mean +/− std)3th order HPCE (mean)3th order HPCE (mean +/− std)
0 0.1 0.2 0.30
1
2
3
4
5
6
End displacement (in)
Loa
d (k
ips)
FEA (mean)FEA (mean +/− std)5th order HPCE mean5th order HPCE (mean +/− std)
1 2 3 4 5 6 70
0.2
0.4
0.6
0.8
1
Length (ft)
Si
BowCamberTwistBow−Twist
11
capacity is entirely affected by bow imperfection for all lengths.
Figure 8 Sensitivity indices with respect to bow, camber and twist using 5th order Hermite polynomial
for 362S162-68 section with different lengths (Using L/960 )
The developed response surfaces and measured data from (Zeinoddini-Meimand 2011) are used, to validate a “code prescribed” imperfection model (e.g. a half sine wave with the maximum magnitude of L/960) against the statistics of the load carrying capacity for four different lengths of 362S162-68 section. Figure 9 shows the load carrying capacity obtained from FEA using +/- L/960 as the imperfection magnitudes as well as the probability density functions of load carrying capacities obtained from the Hermite polynomial chaos expansions. For lengths of 3.28, 4.9 and 6.56 ft, 67.8%, 90.2% and 96% of the load carrying capacities are higher than the maximum load for +L/960 imperfection magnitude. But for the 1.64 ft long column, most of the load carrying capacities obtained using the response surfce method are less than the capacity obtained when a half sine wave with a maximum magnitude of +L/960 is used. This can perhaps be attributed to the fact that, even without considering the local imperfections, the load carrying capacity of short columns is sensitive to other types of global imperfection like twist (see Figure 7). For all cases, -L/960 covers more than 50% of maximum loads obtained from response surface method. For a better comparison, another set of normal random variables with a negtive mean was generated using the statistics of experimentally measured bow imperfections. The probability density function of the load carrying capacity corressponding to this set is shown in Figure 10. In this case, a -L/960 bow imperfection magnitude results in a capacity that concides with the mean value.
0 2 4 6 8
0
0.2
0.4
0.6
0.8
1
Si
Length (ft)
BowCamberTwist

12
Figure 9 Probability density function of load carrying capacity for 362S162-68 section a) L = 1.64 ft,
b) L = 3.28 ft, c) L = 4.9 ft and d) L = 6.56 ft
Figure 10 Probability density function of load carrying capacity for 362S162-68 with negative bow
18 20 22 240
0.1
0.2
0.3
Maximum load (kips)
Pro
babi
lity
den
sity
fun
ctio
n
MeanMean +/− std+L/960 (FEA)−L/960 (FEA)
7 7.2 7.40
1
2
3
4
Maximum load (kips)
Pro
babi
lity
den
sity
fun
ctio
n
MeanMean +/− std+L/960 (FEA)−L/960 (FEA)
24 25 26 270
0.2
0.4
0.6
0.8
1
Maximum load (kips)
Pro
babi
lity
dens
ity
func
tion
MeanMean +/− std+L/960 (FEA)−L/960 (FEA)
11.5 12 12.50
0.5
1
1.5
2
Maximum load (kips)
Pro
babi
lity
den
sity
fun
ctio
n
MeanMean +/− std+L/960 (FEA)−L/960 (FEA)
(a) (b)
(d)(c)
22 23 24 25 26 27 280
0.1
0.2
0.3
0.4
0.5
Maximum load (kips)
Den
sity
MeanMean +/− std+L/960 (FEA)−L/960 (FEA)
13
6. Conclusion Geometric imperfections play an important role in load carrying capacity of thin-walled structures. They are categorized into global and cross-sectional imperfections. Cold-formed members are inherently sensitive to both global and local imperfections. Generally, for long members, global imperfections are more important, whereas cross-sectional imperfections can affect the buckling and post-buckling behavior of short members. L/960 has been used for many years as the global flexural imperfection. AISI also presumes this imperfection magnitude for deriving column curves for cold-formed members. In this paper, a variance based sensitivity analysis was used to calculate the sensitivity of load carrying capacity to different global imperfection modes. Nonlinear finite element analysis was used to calculate the load-carrying capacity. Monte-Carlo simulation requires a large number of finite element analyses. A probabilistic collocation method using Hermite polynomial chaos expansions was therefore used to build a response surface that replaces finite element analysis for different lengths. Results of sensitivity analysis show that long members are sensitive to the weak axis flexural imperfection, whereas twist imperfection plays a more important role in load-carrying capacity of the short columns. The probability density function of the maximum load carrying capacities obtained from the response surface method was used to validate a “code prescribed” imperfection model. It was shown that for long members, a half sine wave imperfection with the maximum magnitude of L/960 is very conservative. It was also shown that the distribution of imperfections over the length of the member might affect the extent to which a particular imperfection mode contributes to the variability in the load carrying capacity. Acknowledgments Tootkaboni and Schafer acknowledge financial support from National Science Foundation under grant # CMMI-1235238.

14
Reference
ABAQUS, 2013. ABAQUS Documentation. Dassault Systèmes, Providence, RI, USA.
AISI, 2007. North american specification for the design of cold-formed steel structures, american iron and steel institute, washington, D.C.,AISI-S100.
Dat, D.T. & Peköz, T., 1980. The strength of cold-formed steel columns.
Eldred, M.S., Webster, C.G. & Constantine, P., 2008. Evaluation of Non-Intrusive Approaches for Wiener-Askey Generalized Polynomial Chaos (AIAA). In Proceedings of the 10th AIAA Non-Deterministic Approaches Conference. Schaumburg, IL, p. 189.
Galambos, T. V., 1998. Guide to Stability Design Criteria for Metal Structures, John Wiley & Sons.
Li, D. et al., 2011. Stochastic response surface method for reliability analysis of rock slopes involving correlated non-normal variables. Computers and Geotechnics, 38(1), pp.58–68.
Mulligan, G.P., 1983. The influence of local buckling on the structural behavior of singly-symmetric cold-formed steel columns. PhD thesis, Cornell University, Ithaca, New York.
Quach, W.M., Teng, J.G. & Chung, K.F., 2006. Finite element predictions of residual stresses in press-braked thin-walled steel sections. Engineering Structures, 28(11), pp.1609–1619.
Salerno, G. & Lanzo, A.D., 1997. A nonlinear beam finite element for the post-buckling analysis of plane frames by Koiter’s perturbation approach. Computer Methods in Applied Mechanics and Engineering, 146(3-4), pp.325–349.
Schafer, B. & Ádány, S., 2006. Buckling analysis of cold-formed steel members using CUFSM: conventional and constrained finite strip methods. … international specialty conference on cold-formed ….
Schafer, B. & Moen, C., 2008. Direct strength design for cold-formed steel members with perforations, American Iron and Steel Institute, Washington, DC, research report.
Schafer, B.. & Peköz, T., 1998. Computational modeling of cold-formed steel: characterizing geometric imperfections and residual stresses. Journal of Constructional Steel Research, 47(3), pp.193–210.
Schafer, B.W., 1997. Cold-formed steel behavior and design: analytical and numerical modeling of elements and members with longitudinal stiffeners, Cornell University, Ithaca, New York.

15
Schafer, B.W. & Zeinoddini, V.M., 2008. Impact of global flexural imperfections on the cold-formed steel column curve. In Conference held in St. Louis, Missouri October 14-15, 2008. Missouri S&T (formerly the University of Missouri - Rolla).
Shifferaw, Y., Viera, J.L.C.. & Schafer, B.W., 2010. Compression testing of cold-formed steel columns with different sheathing configurations. In Structural Stability Research Council, Proceedings of Annual Stability Conference. pp. 593–612.
Silvestre, N. & Camotim, D., 2002. First-order generalised beam theory for arbitrary orthotropic materials. Thin-Walled Structures, 40(9), pp.755–789.
Sobol′, I.., 2001. Global sensitivity indices for nonlinear mathematical models and their Monte Carlo estimates. Mathematics and Computers in Simulation, 55(1-3), pp.271–280.
VieiraJr., L.C.M., 2011. Behavior and Design of Sheathed Cold-Formed Steel Stud Walls under Compression. American Society of Civil Engineers.
Xiong, F. et al., 2010. A New Weighted Stochastic Response Surface Method for Uncertainty Propagation (AIAA). Journal of Structural and Multidisciplinary Optimization, 148, p.149.
Young, B., 1997. the behavior and design of cold-formed channel columns. phd thesis sydney, australia: university of sydney. PhD thesis, Sydney, Australia: University of Sydney.
ZEINODDINI, V. & SCHAFER, B.W., 2011. GLOBAL IMPERFECTIONS AND DIMENSIONAL VARIATIONS IN COLD-FORMED STEEL MEMBERS. International Journal of Structural Stability and Dynamics, 11(05), pp.829–854.
Zeinoddini-Meimand, V., 2011. Geometric imperfections incold-formed steel members. PhD thesis, Johns Hopkins University, Baltimore, Maryland, USA.