statistical analysis of tensile strength and elongation of ... · statistical analysis of tensile...
TRANSCRIPT

Balasubramanian, Cogent Engineering (2016), 3: 1239298http://dx.doi.org/10.1080/23311916.2016.1239298
PRODUCTION & MANUFACTURING | RESEARCH ARTICLE
Statistical analysis of tensile strength and elongation of pulse TIG welded titanium alloy joints using Weibull distributionM. Balasubramanian1*
Abstract: In this study, the tensile strength of a pulsed current tungsten inert gas welded Ti-6Al-4 V plate has been statistically analysed by Weibull distribution. Titanium alloy of 1.6 mm thickness was welded with pulsed current tungsten inert gas welding. Testing of mechanical properties was done to understand the influence of pulsing current on the fabricated joint. But the result obtained has to be consis-tent and repeatable. Hence, this paper investigates a method for predicting the reli-ability of values obtained for tensile strength and elongation with consistency. The tensile strength results obtained vary between 975 and 1160 MPa and percentage elongation vary between 2.4 and 5.9%. Using Weibull technique in conjunction with the experimental data, we can predict the output more accurately. Using Weibull distribution, the welded joint reliability can be obtained. The probability distribution according to which the joint will fail is estimated with the help of Weibull analysis.
Subjects: Manufacturing & Processing; Metals & Alloys; Quality Control & Reliability
Keywords: Weibull distribution; titanium alloy; pulse TIG welding
*Corresponding author: M. Balasubramanian, Department of Mechanical Engineering, R.M.K. College of Engineering and Technology, Puduvoyal, Tiruvallur, India E-mail: [email protected]
Reviewing editor:Chaoqun Wu, Wuhan University of Science and Technology, China
Additional information is available at the end of the article
ABOUT THE AUTHORM. Balasubramanian obtained his bachelor degree in Mechanical Engineering from Annamalai University, Tamil Nadu, India. His post graduation was in the area of Production Engineering from Annamalai University, Tamil Nadu, India. He obtained his doctoral degree in the area of material joining from Anna University, Tamil Nadu, India. He has 18 years of teaching experience including 8 years of research experience. He has more than 54 articles published in refereed journals. He has obtained various research projects and seminar grants from various funding agencies like BRNS, AICTE, ISTE, MNRE and CSIR across India to the tune of 40 lakhs. His area of specialization includes optimization, material joining and materials. One of his articles was ranked one among the top 50 articles in science direct. H index is the author level metric that attempts to measure both the productivity and citation impact of the publication of a scholar. His H index is 13 and I index is 14. To his credit, he has filed two patents in the area of friction welding and nozzle design in abrasive jet machining.
PUBLIC INTEREST STATEMENTExperiments are conducted by the researchers to understand the effect of various factors on the outcome. Normally, researchers conduct three experiments and average the results obtained to pin down to a single number. Reliability analysis used in this study will help the researchers in understanding the number of trials to be done on the same experimental condition to accept the results obtained. Results obtained from two or three trials do not ascertain the results obtained. This study proves that the result cannot be averaged out and the probability of the results obtained can be understood from this analysis.
Received: 10 June 2016Accepted: 18 September 2016First Published: 22 September 2016
© 2016 The Author(s). This open access article is distributed under a Creative Commons Attribution (CC-BY) 4.0 license.
Page 1 of 9
M. Balasubramanian

Page 2 of 9
Balasubramanian, Cogent Engineering (2016), 3: 1239298http://dx.doi.org/10.1080/23311916.2016.1239298
1. IntroductionTi-6Al-4 V, titanium alloy most often used to fabricate structures, such as in the applications of de-fence vehicles and space vehicles (Reddy, Gokhale, & Rao, 1997, 1998). The preferred welding pro-cess for welding titanium alloy is more often GTAW due to its comparatively easier applicability and better economy (Yunlian, Ju, Quan, & Liying, 2000). Weibull distribution has the capability to model experimental data of very different characters. This is one of the reasons for its wide utilisation nowadays. The empirical data after transformation can be plotted on the Weibull probability plotting paper to estimate the parameters of the Weibull distribution. From those estimated parameters of Weibull distribution, the parameters of the extreme value distribution can be estimated easily by using transformation techniques (Dodson, 1994). Weibull distribution is a practical method used in the de-termination of 90 and 95% reliability values used in metal joining techniques. The variation of the tensile strength of pulse TIG welded titanium alloy has been modeled using Weibull distribu-tion. Tension tests were performed and using the test data, the corresponding Weibull distribution was determined. Finally, the reliability of the welded joints in terms of its tensile strength was pre-sented in graphical form. The primary advantage of Weibull analysis is the ability to provide reason-ably accurate failure analysis and failure forecasts with extremely less number of samples. Another advantage of Weibull analysis is that it provides a simple and useful plot of the failure results. The graph developed with the failure data is extremely valuable to the users. Ti-6Al-4 V also have excel-lent specific tensile and corrosion resistance, mainly used for aircraft structural and engine parts, material for petrochemical plants and surgical implants. Titanium (Ti-6Al-4 V) alloy has gathered wide acceptance in the fabrication of light weight structures requiring a high strength-to-weight ratio, such as transportable bridge girders, military vehicles, road tankers and railway transport sys-tems (Balasubramanian, Jayabalan, & Balasubramanian, 2008a, 2008b). So far Weibull distribution has not been used in the study of pulse current titanium alloy welding. Hence an attempt was made to study the reliability of the pulsed current welding of titanium alloy.
2. Experimental procedureThe important factors which have greater influence on the tensile strength of pulsed current GTA welding process have been traced from the literature survey (Balasubramanian, Jayabalan, & Balasubramanian, 2008c, 2008; Sundaresan & Ram, 1999). They are peak current, background cur-rent, pulse frequency and pulse on time. The sheets of the Ti-6Al-4 V titanium alloy was made to square butt joint configuration as shown in Figure 1. The prepared specimen was fabricated by au-togenous pulsed current GTAW process using the setup in Figure 2. Given that the plate thickness is 1.6 mm, the single pass welding procedure has been followed to fabricate all the joints. Necessary care was taken to avoid joint any distortion and the joints were made by ensuring suitable clamping. The required number of trial runs has been carried out using 1.6 mm thick sheets of titanium
Figure 1. Welded specimens.

Page 3 of 9
Balasubramanian, Cogent Engineering (2016), 3: 1239298http://dx.doi.org/10.1080/23311916.2016.1239298
(Ti-6Al-4 V) alloy to identify the feasible working limits of pulsed current GTA welding parameters. Various combinations of pulsed current parameters have been used to carry out the test runs. The bead shape, bead look, and weld quality have been inspected to identify the working limits of the parameters. Details of observations made on trial runs and mathematical modeling are given by Balasubramanian, Jayabalan, and Balasubramanian (2006). Tensile specimens were prepared as per the ASTM E8 M-05 guidelines as shown in Figure 3. Fabricated specimens are displayed in Figure 4.
2.1. Weibull distributionWeibull distribution is being used to model extreme values such as failure times and fracture strength. Two forms of this distribution are two and three parameter Weibull distributions. The cu-mulative distribution function of the three parameter Weibull distribution is as follows (Dirikolu, Aktas, & Birgoren, 2002).
where the location, scale, and shape parameters are represented as a, b, and c respectively Abernethy (2006). When a = 0 in Equation (1) the function of the two-parameter Weibull distribution is obtained. The three-parameter Weibull distribution is appropriate for situations in which an ex-treme value cannot take values less than a. In this study, the two-parameter Weibull distribution is used to study the reliability of tensile strength results. The distribution function here can then be written as follows (Balasubramanian et al., 2006).
(1)F(x;a, b, c) = 1 − exp(
−(
x − a
b
)c)
a ≥ 0, b ≥ 0, c ≥ 0
Figure 4. Tensile specimen for testing.
Figure 3. Dimensions of tensile test specimen.
Figure 2. Automatic GTA welding machine.

Page 4 of 9
Balasubramanian, Cogent Engineering (2016), 3: 1239298http://dx.doi.org/10.1080/23311916.2016.1239298
The parameters b and c of the function F(x; b, c) are estimated from the following observations. Linear regression is a common method and will be used for estimation of parameters in this paper. In this method Equation (2) is transformed into 1−F(x; b; c) = exp[(x/b)c] and taking the logarithms of two sides. Hence, a linear regression model in the form Y = mX + r is obtained (Taljera, 1981).
2.2. MethodologyTwo step procedure is followed in predicting the reliability of the mechanical properties under con-sideration. First, the parameters must be estimated. Then the estimates are used to predict subse-quent failures.
Following are the step-by-step procedure for estimating the Weibull parameters. Although there are many techniques for analyzing the experimental data, the following requirements are common to each: an unambiguously defined time origin, a scale for measuring the passage of time, and a clear meaning for the failure. Many a time the Weibull distribution is expressed as three parameters in its most general form, it is commonly expressed as a two-parameter distribution. Since failure cannot occur until or after the value of the location parameter, the location parameter is mostly ignored.
The procedure for the estimation of the Weibull parameters is given below.
(1) Define the scope of the experimentation.
(2) Collect the data for analysis.
(3) Plot the data on a graph.
(4) Estimate the required parameters.
The first step in the estimation of Weibull parameters is to describe the scope. The next step is to obtain data on mechanical properties in the analysis.
The third step is to plot the data to verify that they conform to a Weibull distribution. Estimating the plotting positions for the failures involves approximating the true values of the Weibull cumula-tive distribution function. The plotted points are expected to fall in a relatively straight line if the data conform to a Weibull distribution. The Weibull parameters may be estimated after this condition is reached. Assemble the data in ascending order and tabulate it against the corresponding F(t) values for 31 experiments conducted, obtained from the median rank tables (Suresh Babu & Jayabalan, 2009). Now the Plot is developed using the tensile strength and percentage elongation (ti) data on the horizontal axis against the corresponding F(t) value on the vertical axis.
It was confirmed by experiment that this Weibull data treatment method is also valid for applica-tion in the dielectric failure of multilayer ceramic capacitors (MLCs) which have undergone screen-ing. The Weibull modulus is found to be a useful parameter indicating the sharpness of the distribution of breakdown voltages and mechanical strength of MLCs. By Weibull analysis, the lately developed relax or-based MLCs are found to compare favorably with traditional barium-titanate based MLCs, implying that relax or MLCs are more attractive than generally realized (Wang, Chan, Gui, Webb, & Li, 1997). Increasing demand for reliable performance of materials requires that the strength should be measured accurately within the range of intended use. As it is well-known, due to the defects that may be present in the material, the mechanical test results may vary significantly depending on the size and population of these defects. Therefore, it is important to produce materi-als with minimal defects and more reliable mechanical properties. For this purpose, in engineering applications, Weibull distributions are widely used to study the distribution and magnitude of scatter
(2)F(x; b, c) = 1 − exp(
−(
x
b
)c)
(3)ln[
ln(
1∕(
1 − F(x; b;c)))]
= c ⋅ ln(x) − c ⋅ ln(b)
Page 5 of 9
Balasubramanian, Cogent Engineering (2016), 3: 1239298http://dx.doi.org/10.1080/23311916.2016.1239298
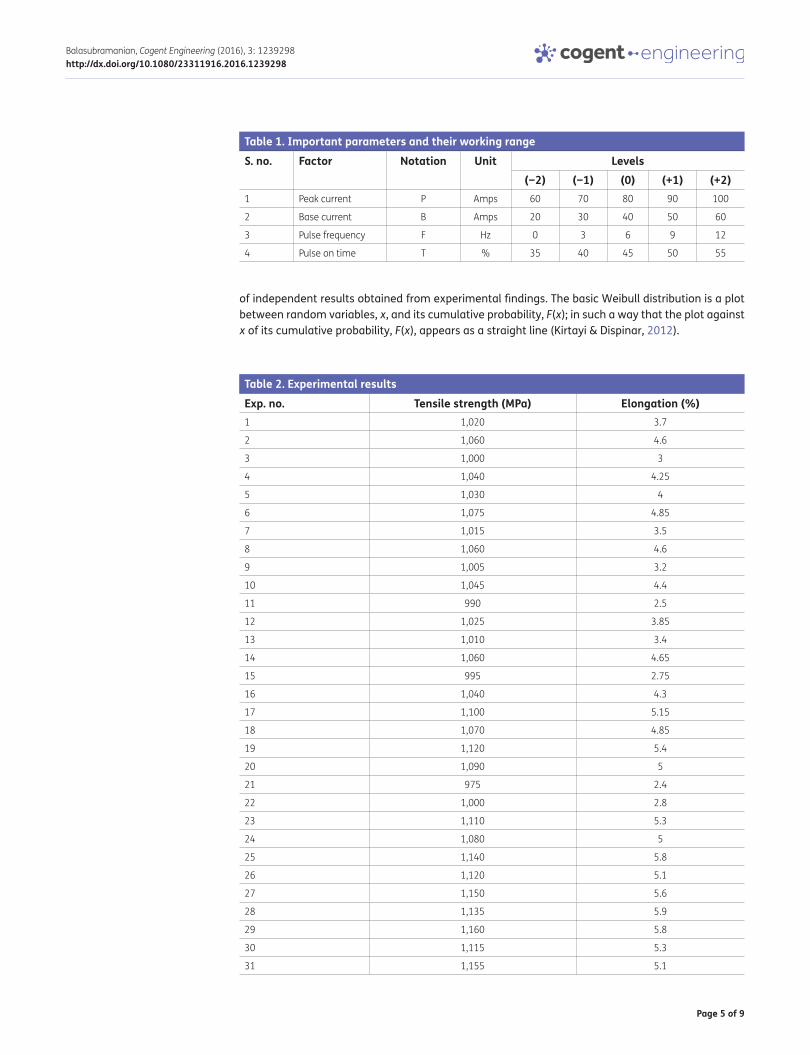
of independent results obtained from experimental findings. The basic Weibull distribution is a plot between random variables, x, and its cumulative probability, F(x); in such a way that the plot against x of its cumulative probability, F(x), appears as a straight line (Kirtayi & Dispinar, 2012).
Table 2. Experimental resultsExp. no. Tensile strength (MPa) Elongation (%)1 1,020 3.7
2 1,060 4.6
3 1,000 3
4 1,040 4.25
5 1,030 4
6 1,075 4.85
7 1,015 3.5
8 1,060 4.6
9 1,005 3.2
10 1,045 4.4
11 990 2.5
12 1,025 3.85
13 1,010 3.4
14 1,060 4.65
15 995 2.75
16 1,040 4.3
17 1,100 5.15
18 1,070 4.85
19 1,120 5.4
20 1,090 5
21 975 2.4
22 1,000 2.8
23 1,110 5.3
24 1,080 5
25 1,140 5.8
26 1,120 5.1
27 1,150 5.6
28 1,135 5.9
29 1,160 5.8
30 1,115 5.3
31 1,155 5.1
Table 1. Important parameters and their working rangeS. no. Factor Notation Unit Levels
(−2) (−1) (0) (+1) (+2)1 Peak current P Amps 60 70 80 90 100
2 Base current B Amps 20 30 40 50 60
3 Pulse frequency F Hz 0 3 6 9 12
4 Pulse on time T % 35 40 45 50 55
Page 6 of 9
Balasubramanian, Cogent Engineering (2016), 3: 1239298http://dx.doi.org/10.1080/23311916.2016.1239298
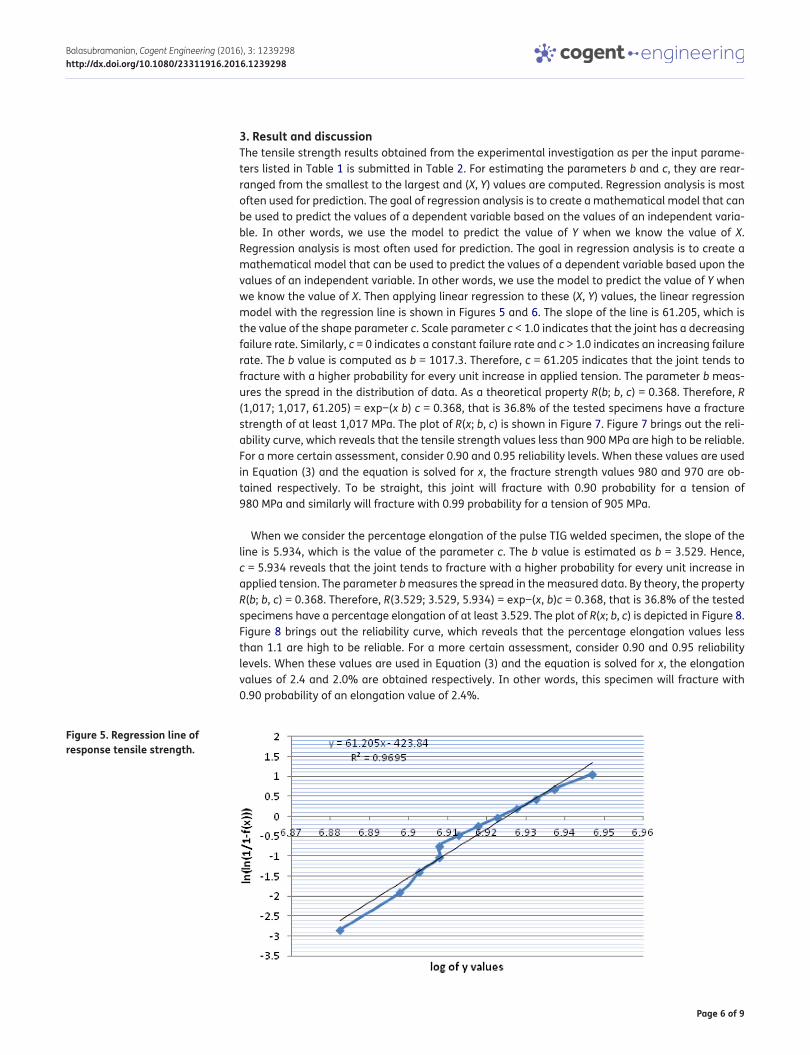
3. Result and discussionThe tensile strength results obtained from the experimental investigation as per the input parame-ters listed in Table 1 is submitted in Table 2. For estimating the parameters b and c, they are rear-ranged from the smallest to the largest and (X, Y) values are computed. Regression analysis is most often used for prediction. The goal of regression analysis is to create a mathematical model that can be used to predict the values of a dependent variable based on the values of an independent varia-ble. In other words, we use the model to predict the value of Y when we know the value of X. Regression analysis is most often used for prediction. The goal in regression analysis is to create a mathematical model that can be used to predict the values of a dependent variable based upon the values of an independent variable. In other words, we use the model to predict the value of Y when we know the value of X. Then applying linear regression to these (X, Y) values, the linear regression model with the regression line is shown in Figures 5 and 6. The slope of the line is 61.205, which is the value of the shape parameter c. Scale parameter c < 1.0 indicates that the joint has a decreasing failure rate. Similarly, c = 0 indicates a constant failure rate and c > 1.0 indicates an increasing failure rate. The b value is computed as b = 1017.3. Therefore, c = 61.205 indicates that the joint tends to fracture with a higher probability for every unit increase in applied tension. The parameter b meas-ures the spread in the distribution of data. As a theoretical property R(b; b, c) = 0.368. Therefore, R (1,017; 1,017, 61.205) = exp−(x b) c = 0.368, that is 36.8% of the tested specimens have a fracture strength of at least 1,017 MPa. The plot of R(x; b, c) is shown in Figure 7. Figure 7 brings out the reli-ability curve, which reveals that the tensile strength values less than 900 MPa are high to be reliable. For a more certain assessment, consider 0.90 and 0.95 reliability levels. When these values are used in Equation (3) and the equation is solved for x, the fracture strength values 980 and 970 are ob-tained respectively. To be straight, this joint will fracture with 0.90 probability for a tension of 980 MPa and similarly will fracture with 0.99 probability for a tension of 905 MPa.
When we consider the percentage elongation of the pulse TIG welded specimen, the slope of the line is 5.934, which is the value of the parameter c. The b value is estimated as b = 3.529. Hence, c = 5.934 reveals that the joint tends to fracture with a higher probability for every unit increase in applied tension. The parameter b measures the spread in the measured data. By theory, the property R(b; b, c) = 0.368. Therefore, R(3.529; 3.529, 5.934) = exp−(x, b)c = 0.368, that is 36.8% of the tested specimens have a percentage elongation of at least 3.529. The plot of R(x; b, c) is depicted in Figure 8. Figure 8 brings out the reliability curve, which reveals that the percentage elongation values less than 1.1 are high to be reliable. For a more certain assessment, consider 0.90 and 0.95 reliability levels. When these values are used in Equation (3) and the equation is solved for x, the elongation values of 2.4 and 2.0% are obtained respectively. In other words, this specimen will fracture with 0.90 probability of an elongation value of 2.4%.
Figure 5. Regression line of response tensile strength.

Page 7 of 9
Balasubramanian, Cogent Engineering (2016), 3: 1239298http://dx.doi.org/10.1080/23311916.2016.1239298
Figure 6. Regression line of response elongation.
Figure 7. Weibull reliability distribution for tensile strength.
Figure 8. Weibull reliability distribution of percentage elongation.

Page 8 of 9
Balasubramanian, Cogent Engineering (2016), 3: 1239298http://dx.doi.org/10.1080/23311916.2016.1239298
4. Conclusion
(1) Titanium alloy is generally required in strategically important applications, where failure due to variation in the material properties should be avoided. This study raises questions of assum-ing the tensile strength and percentage elongation as an average of the experimental results.
(2) In this respect, the Weibull distribution allows researchers to describe the experimental re-sults in terms of a reliability function. In this investigation, the fracture statistics of the pulse TIG welded specimen are examined by plotting the survival probability of the specimen against the axial stress applied to the specimen.
(3) It can be concluded that the relation between the applied stress on the specimen and the survival probability can be described by the Weibull model. It also provides the engineers or the end users with a tool that will enable them to present the necessary mechanical properties with confidences.
(4) With 0.90 reliability level, we can conclude that the tensile strength of the Pulse TIG welded specimen will be 980 MPa.
(5) With 0.90 reliability level, we can ensure 2.4% elongation for the welded specimen.
FundingThe author received no direct funding for this research.
Author detailsM. Balasubramanian1
E-mail: [email protected] ID: http://orcid.org/0000-0003-3208-26131 Department of Mechanical Engineering, R.M.K. College of
Engineering and Technology, Puduvoyal, Tiruvallur, India.
Citation informationCite this article as: Statistical analysis of tensile strength and elongation of pulse TIG welded titanium alloy joints using Weibull distribution, M. Balasubramanian, Cogent Engineering (2016), 3: 1239298.
ReferencesAbernethy, R. B. (2006). The new Weibull handbook (Fifth ed.).
North Palm Beach, FL: Author. Balasubramanian, M., Jayabalan, V., & Balasubramanian, V.
(2006). Optimizing the pulsed current gas tungsten arc welding parameter’s. Journal of Materials Science and Technology, 22, 821–825.
Balasubramanian, M., Jayabalan, V., & Balasubramanian, V. (2008a). Developing mathematical models to predict grain size and hardness of argon tungsten pulse current arc welded titanium alloy. Journal of Materials Processing Technology, 196, 222–229. http://dx.doi.org/10.1016/j.jmatprotec.2007.05.039
Balasubramanian, M., Jayabalan, V., & Balasubramanian, V. (2008b). Effect of pulsed gas tungsten arc welding on corrosion behavior of Ti-6Al-4V titanium alloy. Materials & Design, 29, 1359–1363. http://dx.doi.org/10.1016/j.matdes.2007.06.009
Balasubramanian, M., Jayabalan, V., & Balasubramanian, V. (2008c). Developing mathematical models to predict tensile properties of pulsed current gas tungsten arc welded Ti–6Al–4V alloy. Materials & Design, 29, 92–97. http://dx.doi.org/10.1016/j.matdes.2006.12.001
Balasubramanian, V., Jayabalan, V., & Balasubramanian, M. (2008). Effect of current pulsing on tensile properties of
titanium alloy. Materials & Design, 29, 1459–1466. http://dx.doi.org/10.1016/j.matdes.2007.07.007
Dirikolu, M. H., Aktas, A., & Birgoren, B. (2002). Statistical analysis of fracture strength of composite materials using Weibull distribution, Turkish Journal of Engineering and Environmental Sciences, 26, 45–48.
Dodson, B. (1994). Weibull analysis. Milwaukee, WI: ASQC Quality Press.
Kirtayi, S., & Dispinar, D. (2012). Effect of ranking selection on the Weibull modulus estimation. Gazi University Journal of Science, 25, 175–187.
Reddy, G. M., Gokhale, A. A., & Rao, K. (1997). Weld microstructure refinement in a 1441 grade aluminium-lithium alloy. Journal of Materials Science, 32, 4117–4126. http://dx.doi.org/10.1023/A:1018662126268
Reddy, G. M., Gokhale, A. A., & Rao, K. P. (1998). Optimisation of pulse frequency in pulsed current gas tungsten arc welding of aluminium–lithium alloy sheets. Materials Science and Technology, 14, 61–66. http://dx.doi.org/10.1179/mst.1998.14.1.61
Sundaresan, S., & Ram, G. D. J. (1999). Use of magnetic arc oscillation for grain refinement of gas tungsten arc welds in α–β titanium alloys. Science and Technology of Welding and Joining, 4, 151–160. http://dx.doi.org/10.1179/136217199101537699
Suresh Babu, A., & Jayabalan, V. (2009). Weibull probability model for fracture strength of aluminium (1101)-alumina particle reinforced metal matrix composite. Journal of Materials Science & Technology, 25, 341–343.
Taljera, R. (1981). Estimation of Weibull parameters for composite material strength and fatigue life data. ASTM STP, 723, 291–311.
Wang, Y., Chan, Y. C., Gui, Z. L., Webb, D. P., & Li, L. T. (1997). Application of Weibull distribution analysis to the dielectric failure of multilayer ceramic capacitors. Materials Science and Engineering B, 47, 197–203. http://dx.doi.org/10.1016/S0921-5107(97)00041-X
Yunlian, Q., Ju, D., Quan, H., & Liying, Z. (2000). Electron beam welding, laser beam welding and gas tungsten arc welding of titanium sheet. Materials Science and Engineering A, 280, 177–181.

Page 9 of 9
Balasubramanian, Cogent Engineering (2016), 3: 1239298http://dx.doi.org/10.1080/23311916.2016.1239298
© 2016 The Author(s). This open access article is distributed under a Creative Commons Attribution (CC-BY) 4.0 license.You are free to: Share — copy and redistribute the material in any medium or format Adapt — remix, transform, and build upon the material for any purpose, even commercially.The licensor cannot revoke these freedoms as long as you follow the license terms.
Under the following terms:Attribution — You must give appropriate credit, provide a link to the license, and indicate if changes were made. You may do so in any reasonable manner, but not in any way that suggests the licensor endorses you or your use. No additional restrictions You may not apply legal terms or technological measures that legally restrict others from doing anything the license permits.
Cogent Engineering (ISSN: 2331-1916) is published by Cogent OA, part of Taylor & Francis Group. Publishing with Cogent OA ensures:• Immediate, universal access to your article on publication• High visibility and discoverability via the Cogent OA website as well as Taylor & Francis Online• Download and citation statistics for your article• Rapid online publication• Input from, and dialog with, expert editors and editorial boards• Retention of full copyright of your article• Guaranteed legacy preservation of your article• Discounts and waivers for authors in developing regionsSubmit your manuscript to a Cogent OA journal at www.CogentOA.com