statistical analysis of electrostatic...
TRANSCRIPT

1
STATISTICAL ANALYSIS OF ELECTROSTATIC SPARK IGNITION OF LEAN H2-O2-AR MIXTURES
Bane, S.P.M.1, Shepherd, J.E.1, Kwon, E.2 and Day, A.C.2
1 Graduate Aerospace Laboratories, California Institute of Technology, 1200 E. California Blvd., Pasadena, CA 91106, USA, [email protected]
2 Phantom Works, The Boeing Company, 9725 E. Marginal Way S, MC 42-22, Seattle, WA, 98108, USA, [email protected]
ABSTRACT Determining the risk of accidental ignition of flammable mixtures is a topic of tremendous importance in industry and aviation safety. The concept of minimum ignition energy (MIE) has traditionally formed the basis for studying ignition hazards of fuels. In recent years, however, the viewpoint of ignition as a statistical phenomenon has formed the basis for studying ignition, as this approach appears to be more consistent with the inherent variability in engineering test data. We have developed a very low energy capacitive spark ignition system to produce short sparks with fixed lengths of 1 to 2 mm. The ignition system is used to perform spark ignition tests in lean hydrogen-oxygen-argon test mixtures over a range of spark energies. The test results are analyzed using statistical tools to obtain probability distributions for ignition versus spark energy, demonstrating the statistical nature of ignition. The results also show that small changes in the hydrogen concentration lead to large changes in the ignition energy and dramatically different flame characteristics. A second low-energy spark ignition system is also developed to generate longer sparks with varying lengths up to 10 mm. A second set of ignition tests is performed in one of the test mixtures using a large range of spark energies and lengths. The results are analyzed to obtain a probability distribution for ignition versus the spark energy per unit spark length. Preliminary results show that a single threshold MIE value does not exist, and that the energy per unit length may be a more appropriate parameter for quantifying the risk of ignition.
1.0 INTRODUCTION
Determining the risk of accidental ignition of flammable mixtures is a topic of tremendous importance in industry and in aviation safety. Extensive work has been done [1-3] to determine the flammability limits of various fuels in terms of mixture composition. These studies are all performed using a very high energy ignition source that is assumed strong enough to ignite any mixture with composition within the flammability limits. The results are ranges of compositions that are widely used to define the risk of accidental ignition. For mixtures with compositions within the flammability limits, it is known that there is a limiting strength of the ignition source. If an ignition source is not strong enough, or is below the minimum ignition energy (MIE) of the particular mixture, the mixture will not ignite. There have been extensive studies to determine the minimum ignition energies of many different flammable mixtures. While the numerical modeling of the growth of a flame from a hot gas volume created by an ignition source has been considered for simple mixtures, for example Kusharin et al. [4] for hydrogen-air and Maas and Warnatz [5] for hydrogen-oxygen, determining incendivity limits remains primarily an experimental issue.
In combustion science, the concept of minimum ignition energy (MIE) has traditionally formed the basis of studying ignition hazards of fuels. The viewpoint is that fuels have specific ignition energy thresholds corresponding to the MIE, and ignition sources with energy below this threshold value will not be able to ignite the fuel. Standard test methods for determining the MIE have been developed [3,6] which use a capacitive spark discharge for the ignition source. The MIE is determined from energy stored in a capacitor at a known voltage that is then discharged through a specified gap. The pioneering work using this ignition method to determine MIE values was done at the Bureau of Mines
2
in the 1940s by Guest, Blanc, Lewis and von Elbe [7]. They obtained MIE data for many different fuels and mixture compositions, and this data is still extensively cited in the literature and ignition handbooks. This technique is also used to study ignition hazards in the aviation industry and standardized testing is outlined to determine the MIE of aviation test fuels [8,9]. Since the work at the Bureau of Mines, many authors have proposed improvements on the technique for determining MIE using capacitive spark discharge, most recently Ono et al. [10,11] and Randeberg et al. [12].
The view of ignition where the MIE is considered to be a single threshold value is the traditional viewpoint in combustion science [7] and extensive tabulations of this kind of MIE data are available [3,6]. In recent years however, particularly in the aviation safety industry, the viewpoint is that ignition is a statistical phenomenon, an approach that is more consistent with the inherent variability in engineering test data. Simple statistical methods have been applied to Jet A ignition tests performed by Lee and Shepherd at the California Institute of Technology using a standard capacitive spark discharge system as the ignition source [13]. There were 25 ignition tests performed while varying only the spark energy, and the data points were then used to derive a mean value and standard deviation for the MIE, rather than a single threshold value. Statistical analysis of ignition data has also been applied to ignition of automotive and aviation liquid fuels as a means of assessing the risk of accidental ignition by hot surfaces [14]. However, there has been very little work done [9] on the statistical nature of spark ignition of hydrogen-based mixtures, which are often used as test mixtures in aviation safety certification. To determine the statistical nature of the data, the experimental variability must be minimized and quantified, and an ignition source is required that is well-controlled and fully characterized. This is one of the goals of this research project.
In ignition testing there are many uncontrolled sources of variability in the experiment itself separate from the ignition energy. These uncertainties can lead to inaccurate test results and the appearance of variability in the results that has no correlation with the ignition energy. One major cause of variability in the test results is uncertainty in the mixture composition. Not only do changes in composition lead to changes in combustion characteristics (flame speeds, peak pressures, etc.), as shown in previous MIE studies [3,6], even small changes in mixture composition can lead to large differences in the MIE values. Therefore it is extremely important to precisely control and accurately measure composition during ignition experiments. Another cause of variability is the degree of turbulence near the ignition source, as the process of flame initiation and propagation can be affected by pre-existing turbulence. Finally, a third important source of variability in the test data is the method used to detect ignition. If the detection method is unreliable or unsuitable for the combustion characteristics of the mixture being tested, a given ignition energy may be perceived as not igniting a mixture when in fact combustion did occur. Previous work has been done to assess these three sources of variability in tests involving lean H2-O2-Ar aviation test mixtures and to propose test methods to minimize these uncertainties [15]. Another source of variability is assuming the spark energy is equal to the stored energy in the capacitor (1/2CV2) when in fact it is only a fraction of the stored energy. To address this issue, we take spark current measurements and estimate the energy for each spark. The sources of experimental uncertainty are not limited to the four described here, but these are major contributors to variability in the data that is unrelated to the ignition source. It is therefore necessary to quantify and minimize the uncertainties from these three contributing sources before the variability of ignition with respect to ignition source energy can be examined.
The goal of the present work is to examine the statistical nature of ignition of lean hydrogen-based aviation test mixtures by performing ignition tests using very low energy sparks. First, statistical tools are adapted for use with ignition tests to provide a way of describing the test results in terms of probability distributions and confidence intervals. Second, a low-energy capacitive discharge system is developed to produce sparks with short lengths (1 to 2 mm) and very low energies on the order of 50 J to 1 mJ. The spark discharge system is used to perform ignition tests over a range of spark energies with a fixed spark gap of 1 to 2 mm, and the test results are analyzed using the statistical tools. Tests were performed in three aviation test mixtures of interest, differing in composition by only 1% hydrogen: 5% H2 – 12% O2 – 83% Ar, 6% H2 – 12% O2 – 82% Ar, and 7% H2 – 12% O2 – 81% Ar.
3
The results of the statistical analysis of the three mixtures are then compared and discussed. Finally, a second low-energy spark ignition system is developed to produce longer sparks (1 to 10 mm) of variable length. Another set of ignition tests is performed in the 6% H2 mixture using the second ignition system, varying both the spark energy and spark length. Preliminary results suggest that there does not exist a single MIE for sparks of any length, but rather the energy density (energy per unit spark length) determines whether ignition will occur.
2.0 STATISTICAL ANALYSIS OF IGNITION TEST DATA
Given a set of ignition test data points, the goal of the statistical analysis is to derive a probability distribution for the probability of a “go” result (ignition) versus stimulus level (spark energy). In this work, the logistic regression method [16,17] is used to calculated a cumulative probability distribution for the ignition data. The logistic distribution is selected because it is often used to analyze lifetime or failure data [18]; in this work, the variable of interest is spark energy and ignition of the mixture can be considered a “failure.” Also, the logistic regression method is computationally simple because likelihood-based inference methods can be used to make assumptions about the parameters. Finally, this same statistical method has also been used by others for analyzing hot surface ignition of automotive and aviation fuels [14]. Once a probability distribution is obtained, percentiles and confidence intervals can also be calculated.
A binary outcome model is used for spark ignition tests with a binary result y, where y = 1 for a “go” (ignition) and y = 0 for a “no go” (no ignition) for a given stimulus level (spark energy) x. If W is the threshold stimulus for a “go” result, then
xWy if 1 (1)
xWy if 0 (2)
Then a cumulative probability distribution for a “go” (ignition) at stimulus level x (spark energy) can be defined as
. ;1ty Probabili)( xyxP (3)
For n tests, all with new samples (flammable mixtures), the following parameters are then defined:
test for the energy)(spark level stimulus thi ix (4)
1)or 0 ( test for theresult thi iy (5)
test for the 1y that probabilit thii iyxP (6)
All the stimulus levels and the binary results for the n tests are represented collectively using the likelihood function
. 11
1
n
i
yi
yi
ii xPxPL (7)
P(x) is assumed to be represented with the parametric logistic distribution function
xxP
10exp1
1
(8)

4
where β0 and β1 are parameters that are estimated by maximizing the likelihood function. The 100qth percentile, xq, can be calculated using the logistic distribution with known parameter values
qq x
qxP10exp1
1
(9)
and solving for xq gives
. q-1
qln
10
1
qx (10)
Finally, the upper confidence limit (UCL) and lower confidence limit (LCL) for the 100(1-/2)% confidence interval for the percentile xq can be calculated using the large sample approach for a two-sided interval
2111
201002 /2// qqq xxZxLCLUCL (11)
Where σ00, σ11 are the variances and σ01 is the covariance of β0 and β1, is 1 minus the confidence level (i.e. = 1 – 0.95 = 0.05 for 95% confidence) and Z/2 is the 100(1-/2)% percentile from a standard cumulative Gaussian distribution (μ = 0, σ = 1). The result of this analysis is a cumulative probability distribution for the n spark ignition tests and a confidence envelope on the probability of ignition versus spark energy.
3.0 SHORT, FIXED SPARK IGNITION TESTING
3.1 Spark Ignition System
To perform ignition testing near the MIE with the ultimate goal of performing statistical analysis on the resulting data, a well-characterized and repeatable low-energy ignition system is required. Therefore, in this work a low-energy capacitive spark ignition system has been designed and constructed to produce short (1 to 2 mm) sparks with energies in the range of 50 J to 1 mJ. The discharge circuit is based on the ideas presented by Ono et al. [10,11]. The basis of the design is a simple capacitive discharge circuit, but many features have been implemented to improve the system performance in terms of reliability, consistency, and repeatability so that the spark energy can be reasonably predicted and measured.
The circuit consists of a 0-15 kV high voltage power supply connected to two 50 G charging/isolation resistors in series with a 3-30 pF variable vacuum capacitor. The capacitor is then connected in parallel with the spark gap, so that when the capacitor is charged by the power supply to the gap breakdown voltage it discharges the stored energy through the gap producing a spark. The output of the high voltage power supply ramps up from 0 to 11 kV with a ramp time more than 10 times longer than the maximum capacitor charging time. Therefore, the voltage on the capacitor at the time of breakdown can be measured directly at the output of the power supply. The spark current is measured by a fast current transformer, and the output is digitized by an oscilloscope with a sampling rate of 2 GS/s that is triggered by the rise in spark current.
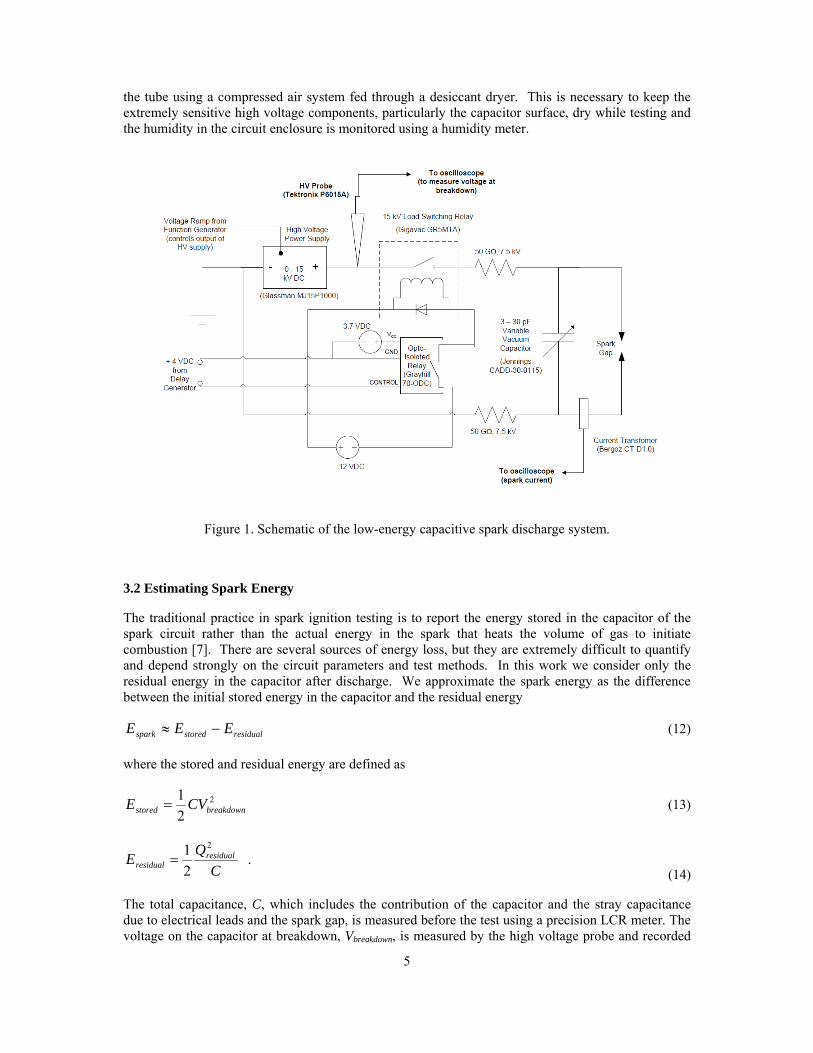
A high voltage relay is used to disconnect the capacitor from the high voltage power supply after the spark has occurred to ensure there are no multiple sparks. The high voltage relay is closed by a 12 VDC signal provided through a solid state relay triggered by the oscilloscope upon spark detection. The details of circuit are shown in Figure 1. Acrylic or Teflon is used for all mounts and standoffs to limit leakage current and all electrical connections with sharp edges are coated with high voltage putty to limit corona losses. The circuit is enclosed in a sealed acrylic tube and dry air is circulated through
5
the tube using a compressed air system fed through a desiccant dryer. This is necessary to keep the extremely sensitive high voltage components, particularly the capacitor surface, dry while testing and the humidity in the circuit enclosure is monitored using a humidity meter.
Figure 1. Schematic of the low-energy capacitive spark discharge system.
3.2 Estimating Spark Energy
The traditional practice in spark ignition testing is to report the energy stored in the capacitor of the spark circuit rather than the actual energy in the spark that heats the volume of gas to initiate combustion [7]. There are several sources of energy loss, but they are extremely difficult to quantify and depend strongly on the circuit parameters and test methods. In this work we consider only the residual energy in the capacitor after discharge. We approximate the spark energy as the difference between the initial stored energy in the capacitor and the residual energy
residualstoredspark EEE (12)
where the stored and residual energy are defined as
2
2
1breakdownstored CVE (13)
. 2
1 2
C
QE residual
residual (14)
The total capacitance, C, which includes the contribution of the capacitor and the stray capacitance due to electrical leads and the spark gap, is measured before the test using a precision LCR meter. The voltage on the capacitor at breakdown, Vbreakdown, is measured by the high voltage probe and recorded
6
on the oscilloscope. The residual charge in the capacitor, Qresidual, is calculated by subtracting the charge delivered in the spark from the original stored charge in the capacitor
. dttiCVQQQ sparkbreakdownsparkstoredresidual (15)
The integral of the spark current is calculated by numerically integrating the waveform from the current transformer.
3.3 Experimental Setup
The spark ignition tests are conducted in a closed, rectangular combustion vessel approximately 11.75 liters in volume. The ignition system fixture is mounted in a specialized flange in one of the vessel walls such that the spark gap is near the center of the vessel. Two parallel vessel walls have 1 inch thick glass windows for visualization. A remotely controlled plumbing system is used to evacuate the chamber and accurately fill it with gases using the method of partial pressures. The static pressure is measured by a Heise 901A manometer with a precise digital readout so the gases can be filled to within 0.03% of the fuel by volume, providing precise control over the mixture composition.
Three methods are used to detect whether or not ignition occurred. One method is measuring the dynamic pressure in the vessel using a piezoresistive pressure transducer. This method provides very sensitive and reliable ignition detection by measuring the transient pressure rise due to combustion, even in cases with modest pressure rise. The maximum pressure and the explosion time can also be obtained from the pressure traces. The second method used to detect ignition is sensing the temperature rise from the combustion with a thermocouple mounted inside the vessel. The third method of ignition detection is visualization of the flame through the vessel windows using a schlieren system and high speed video camera.
3.4 Results
Ignition tests were performed in the aviation test mixture recommended in the ARP testing standards [8], 5% H2 – 12% O2 – 83% Ar, and in two addition mixtures differing only by 1% hydrogen, 6% H2 – 12% O2 – 82% Ar, and 7% H2 – 12% O2 – 81% Ar. The electrodes used for the short, fixed spark ignition tests were made of tungsten and were conical in shape with a base diameter of 0.25 in., cone angle of 53o, and a tip radius of 1/32 in. The spark gap lengths were fixed at 2, 1.5, and 1 mm for the 5%, 6%, and 7% H2 mixtures, respectively. The characteristics of the flames in the three mixtures were studied using high-speed schlieren visualization, and the ignition test results were analyzed using the statistical tools described in Section 2.0 to obtain probability distributions for ignition.
3.4.1 Flame Visualization and Pressure Measurement
Images from high-speed schlieren videos of ignition in the three mixtures are shown in Figures 2 (5% H2), 3 (6% H2), and 4 (7% H2). Combustion in the 5% H2 mixture (Figure 2) produces a slow, buoyant flame that propagates upward as well as outward before being extinguished at the top of the vessel. In this case the flame speed is low enough that buoyancy is dominant over the flame front inertia and only a small fraction of the fuel is burned. When the hydrogen concentration is increased by just 1% to 6% H2 (Figure 3), buoyancy is nearly balanced by the flame inertia. Initially buoyancy dominates and the flame propagates upwards and the upper flame surface is extinguished at the top of the vessel. However, unlike the 5% H2 case, the bottom of the flame has enough inertia to continue to propagate downwards, and with assistance from convection induced by the flame, nearly all the fuel is consumed over a long burn time. When the hydrogen concentration is increased by 1% a second time to 7% H2 (Figure 4) the flame propagation again changes drastically. In this case, the flame speed is high enough to nearly counteract the buoyancy effects, and the flame propagation is nearly spherical and complete combustion of all the fuel is achieved.

7
Pressure traces recorded by the piezoresistive pressure transducer after ignition are shown in Figure 5. The effect of buoyancy is manifested in the large differences in the peak pressure; the 7% H2 mixture, where the buoyancy effect is minimal, has a much higher peak pressure of 3.97 bar than the 5% or 6% H2 mixtures with peak pressures of 1.16 and 2.61 bar, respectively. These differences are due to the fact that in buoyant combustion only a fraction of the fuel is burned, so a fraction of the full pressure rise is achieved. The 6% H2 mixture also has a highly irregular pressure trace with two local pressure peaks over a long burn time due to the competition between buoyancy and flame inertia.
Figure 2. Images from high-speed schlieren visualization of combustion in the 5% H2 – 12% O2 – 83% Ar test mixture recommended by the certification standards [8].
Figure 3. Images from high-speed schlieren visualization of combustion in a 6% H2 – 12% O2 – 82% Ar test mixture.

8
Figure 4. Images from high-speed schlieren visualization of combustion in a 7% H2 – 12% O2 – 81% Ar test mixture.
1.0
1.5
2.0
2.5
3.0
3.5
4.0
0.0 0.5 1.0 1.5 2.0 2.5 3.0 3.5 4.0
time (s)
pre
ssu
re (
bar
)
7% H2
6% H2
5% H2
1.0
1.5
2.0
2.5
3.0
3.5
4.0
0.0 0.5 1.0 1.5 2.0 2.5 3.0 3.5 4.0
time (s)
pre
ssu
re (
bar
)
7% H2
6% H2
5% H2
Figure 5. Pressure versus time measured during combustion of the three test mixtures.
3.4.2 Ignition Probability
Ignition tests were performed in each of the three mixtures using a fixed length spark gap (1, 1.5 or 2 mm) and a range of spark energies. The stored energy in the discharge circuit was varied by changing the capacitance and the spark energy was estimated using the method described in Section 3.2. If ignition did occur at a given spark energy, that data point is assigned a result of “1” (a “go”), and if ignition did not occur the result is “0” (a “no go”). These data sets were then evaluated using the statistical tools described in Section 2.0, resulting in probability distributions for ignition versus spark energy for the three test mixtures. As an example, in Figure 6 the ignition test data points are shown with the resulting probability distribution for the 5% H2 mixture. The “go” and “no go” data points overlap significantly with the highest “no go” occurring for a spark energy of 1022 J and the lowest “go” occurring for a spark energy of 790 J; this overlap is reflected in the broadness of the probability curve. The probability distributions, 95% confidence intervals, and data overlap region for all three mixtures are shown on the same scale in Figure 7. While the probability distribution for the 5% H2 mixture is broad, the curves for the 6% and 7% H2 mixtures are much narrower and closer to representing a threshold MIE value. However, ignition in all three mixtures exhibits considerable statistical variation, suggesting that a statistical approach to analyzing ignition test data is more appropriate than the traditional MIE approach. The statistical analysis also shows significant margin between the median spark energy for ignition because the probability distributions are centered at very different spark energies; the 50% probability of ignition for the 5%, 6%, and 7% H2 mixtures are 952 J, 351 J, and 143 J, respectively. Therefore these results demonstrate that for lean hydrogen mixtures near the lower flammability limit, very small changes in the amount of hydrogen lead to significant changes in the required ignition energy.
4.0 LONG SPARK IGNITION TESTING
The ignition tests described in Section 3.4 were performed using fixed sparks with lengths of 1 to 2 mm, but longer sparks are often the possible ignition source of concern in practical applications in aviation and industry. Therefore a second capacitive spark ignition system was developed to generate low energy sparks with variable lengths on the order of 1 to 10 mm. In this circuit a capacitor is

9
formed by suspending an isolated circular aluminum plate inside the vessel with the vessel itself acting as the ground plate. The capacitance can be varied from approximately 5 to 20 pF by varying the distance between the round plate and the vessel wall or by changing the diameter of the plate. The
0
0.2
0.4
0.6
0.8
1
0 300 600 900 1200 1500
Spark Energy (J)
Pro
bab
ility
of
Ign
itio
n Probability
95% Confidence
Data Points
Figure 6. Ignition test data points and resulting probability distribution and 95% confidence intervals for the 5% H2 – 12% O2 – 83% Ar test mixture.
0
0.2
0.4
0.6
0.8
1
0 200 400 600 800 1000 1200 1400
Spark Energy (J)
Pro
ba
bili
ty o
f Ig
nit
ion
7% H2 6% H2 5% H2
Data Overlap Region
0
0.2
0.4
0.6
0.8
1
0 200 400 600 800 1000 1200 1400
Spark Energy (J)
Pro
ba
bili
ty o
f Ig
nit
ion
0
0.2
0.4
0.6
0.8
1
0 200 400 600 800 1000 1200 1400
Spark Energy (J)
Pro
ba
bili
ty o
f Ig
nit
ion
7% H2 6% H2 5% H2
Data Overlap Region
Figure 7. Probability distributions of ignition versus spark energy for the three test mixtures.
isolated capacitor plate is charged to a high voltage up to 30 kV and a grounded electrode is brought near the electrode on the plate inducing breakdown of the spark gap. The spark length is varied by changing the voltage and the capacitance is varied by moving the isolated plate relative to the vessel wall or by changing the plate diameter. By adjusting these variables a range of possible spark energies and spark lengths are possible, from which we can calculate a “spark energy density”, or energy per unit spark length. The use of the parameter E/d (energy divided by distance) for characterizing
10
incendivity was proposed by von Pidoll et al [19]. This ignition system will be used to investigate whether the energy density is a more appropriate parameter than just the total spark energy for characterizing the risk of ignition, concept that appears reasonable based on the simple idea that the larger the gas volume (longer spark length) the more energy is required to sufficiently raise the temperature for ignition.
A preliminary set of ignition tests in the 6% H2 – 12% O2 – 82% Ar test mixture were performed using the long spark ignition system over a range of spark energies (100 to 2400 J) and spark lengths (1 to 11 mm). The electrodes used in the long spark tests were also made of tungsten with a 0.25 in. base diameter, but the tips are not conical but rather hemispherical with a radius of 1/8 in. so that breakdown at higher voltages can be better controlled. The energy density is obtained by dividing the spark energy by the spark gap length which is measured from schlieren images taken immediately before the gap breakdown. The results were analyzed, using the same statistical tools as employed in the short spark testing, to obtain the probability distribution for ignition versus energy density, shown in Figure 8. These new results are comparable to previous results using the short, fixed length sparks when the energy density is used as the quantity for comparison. Additionally, these initial tests suggest the validity of using the spark energy density instead of only the spark energy; as shown in Figure 9 there were many tests where no ignition occurred even though the spark energy was significantly larger than the approximate MIE value (50% probability of ignition) obtained using short sparks. Also plotted in Figure 9 is the 50% ignition probability value of 351 J obtained with the short fixed 1.5 mm spark and the median spark energy from the long spark tests of 741 J with a 3.0 mm spark. The 50th percentile energy density from the 1.5 mm spark tests is 234 J/mm (obtained by dividing the 50th percentile energy, 351 J, by the spark length of 1.5 mm), while the results of the variable long spark tests give a lower 50th percentile energy density of 154 J/mm. All the long spark tests where ignition occurred with a spark energy density less than 234 J/mm involved spark gaps of 4 mm or longer. In tests with these longer sparks, it can be seen in the schlieren videos that the spark channel is not homogeneous, and that the ignition kernel forms in only part of the channel where the channel is significantly thicker. In a number of tests, very long sparks with low energy densities still caused ignition due to either a bulging of the spark channel at the cathode where the electrons are bombarding the electrode surface or at some location along the spark channel where the channel is thicker due to an instability in the plasma. It is believed that these bulges in the spark channel have a higher energy density than the rest of the channel, leading to localized ignition kernels. A schlieren image of a long spark with localized ignition near the cathode is shown in Figure 10. The results of the ignition tests and the schlieren visualization of ignition suggest that spark energy density is a more appropriate parameter for quantifying the risk of ignition than only the spark energy, as the length of the spark channel must be considered.
5.0 DISCUSSION
In the present work a low-energy spark ignition system was developed to produce short sparks of fixed length between 1 and 2 mm. The ignition system was used to perform ignition tests in a lean 5% hydrogen test mixture used in aviation certification as well as similar mixtures with 6% and 7% H2. The test results were analyzed using statistical tools to obtain probability distributions of ignition versus spark energy for the three test mixtures. The analysis demonstrated that the spark ignition tests were statistical in nature, suggesting that this view of ignition is more appropriate than the traditional viewpoint of a single threshold MIE value. Additionally, the results showed that the spark energy required for ignition as well as the characteristics of the flame propagation in the lean hydrogen test mixtures are extremely sensitive to the composition, changing drastically as the hydrogen concentration is changed by only 1%. These results on the sensitivity to mixture composition and the influence of buoyancy have serious implications for the ARP testing standards. Many tests performed using the ARP standards may not be valid since ignitions near the top of the test vessel may go undetected for very lean mixtures, where flame buoyancy leads to extinction at top of the vessel. In addition, small uncertainties in the test mixture composition or operator adjustments during the test

11
may result in mixtures with ignition thresholds that are substantially different than anticipated. This work demonstrates that extreme caution must be exercised in order to get reliable results with the
0
0.2
0.4
0.6
0.8
1
0 100 200 300 400 500
Energy Density (J/mm)
Pro
bab
ilit
y
95% Confidence
Data Points
Probability
Fixed 1.5mm Spark
50% probability of ignition using fixed 1.5 mm spark
0
0.2
0.4
0.6
0.8
1
0 100 200 300 400 500
Energy Density (J/mm)
Pro
bab
ilit
y
95% Confidence
Data Points
Probability
Fixed 1.5mm Spark
50% probability of ignition using fixed 1.5 mm spark
Figure 8. Probability distribution of ignition versus spark energy density (energy per unit spark length) for the 6% H2 mixture.
0
1
0 500 1000 1500 2000
Spark Energy (J)
Te
st
Re
su
lt
Long Spark Data Points
MIE for Fixed 1.5mm Spark
Median Energy for Long Spark
351 J at 1.5 mm 741 J at 3.0 mm
0
1
0 500 1000 1500 2000
Spark Energy (J)
Te
st
Re
su
lt
Long Spark Data Points
MIE for Fixed 1.5mm Spark
Median Energy for Long Spark
351 J at 1.5 mm 741 J at 3.0 mm
Figure 9. Results from the long spark ignition tests in the 6% H2 mixture; the 50% probability energy found with the fixed 1.5 mm spark is indicated by the dashed line, and the median energy in the long spark tests is indicated by the solid line.

12
Figure 10. Schlieren image of localized ignition of a long spark channel. The spark length is 5.8 mm and the energy density is 124 J/mm.
mixture currently recommended by the ARP test standards (5% H2). Otherwise, a number of false positives or negatives may occur. Also, the sensitivity of the spark ignition system to humidity indicates that a significant source of variability in the current ARP testing may be due to the lack of humidity control in the commercial test environment.
A second low-energy spark ignition system was designed to generate sparks with longer, variable lengths up to 10 mm. Ignition tests were performed in the 6% H2 – 12% O2 – 82% Ar mixture over a range of spark energies and lengths and a probability distribution was calculated for ignition versus the spark energy density, or the spark energy divided by the length. The results showed that longer sparks required more energy to ignite the test mixture, and that even though some sparks had energies far exceeding those of the short, fixed sparks, they failed to cause ignition because the energy density was lower.
6.0 CONCLUSION
These preliminary results suggest that there is not a single threshold MIE value that applies to sparks of any length, but rather that the energy density is a more appropriate quantity for examining the risk of ignition. The dependence of the ignition energy threshold on the spark length implies that the entire basis of using MIE values for hazard evaluation is seriously flawed. This is particularly relevant to the problem of evaluating hazards from isolated conductors for which high charging voltages and long discharges occur due to the very low capacitance. Using an ignition threshold of 200 J causes very significant error in determining the actual hazard since much larger energies can occur without ignition for sparks that are 5-10 mm in length.
The application of spark ignition testing to the certification of aircraft components raises additional issues. In order to carry out a limited number of tests and have high confidence in the results, methods of reliability testing should be utilized to define test mixtures and conditions. At present, vaguely
13
defined “conservative” conditions are used without any statistical considerations. There are several key issues that need to be addressed. Foremost, we need to determine how to define test conditions that can reliably simulate the potential hazard of hundreds of events over an aircraft lifetime using only a modest number (<10) of tests. To do this we need to first define the actual hazard potential, which is the spark ignition of Jet A (aviation kerosene), in terms of the probability of ignition. Despite the extreme importance of this issue to aviation safety, there are no reliable statistical data available on Jet A spark ignition, and experiments are planned to remedy this. Second, we need to use a model of ignition and define an accelerated test regime that will provide a statistical basis for an acceptance test with a more “sensitive” mixture than the reference Jet A mixture. By using reliable engineering methods to define the test mixture and conditions, we can provide a statistical basis for acceptance of test results and a sound foundation for evaluating this aspect of aircraft safety. This will eliminate or greatly reduce the uncertainty of simply using a “conservative” mixture that has been selected without any statistical basis. The result is that conservatism will be used to increase the probability margin and therefore increasing the inherent assessment of safety instead of being used to balance test method variability. Finally, it is necessary to use a statistical approach to analyzing ignition test data to quantify uncertainties in ignition energy.
The ignition test results and statistical analysis given in this report represent only the first steps in placing ignition thresholds on a sound statistical basis. Further experimentation with different fuels and a range of electrical discharge parameters is needed.
ACKNOWLEDGEMENTS
This work was carried out in the Explosion Dynamics Laboratory of the California Institute of Technology and was supported by The Boeing Company through a Strategic Research and Development Relationship Agreement CT-BA-GTA-1. Thanks also to Stephanie Coronel of the University of Texas, Arlington for her work on the long spark ignition system.
REFERENCES
1. Britton, L.G., Two Hundred Years of Flammable Limits, Process Safety Progress, 21, No. 1, 2002, pp. 1-11.
2. Coward, H.F. and Jones, G.W. The Limits of Flammability of Gases and Vapors, Bureau of Mines Bulletin 503, 1952.
3. Babrauskas, V., Ignition Handbook: Principles and Applications to Fire Safety Engineering, Fire Investigation, Risk Management and Forensic Science, 2003, Fire Science Publishers, Issaquah, WA.
4. Kusharin, A.Y., Popov, O.E., Agafonov, G.L. and Gelfand, B.E, Initiation of Premixed Flames in H2-air-H2O Mixtures, Experimental Thermal and Fluid Science, 21, No. 1-3, 2000, pp. 1-3.
5. Maas, U. and Warnatz, J., Ignition Processes in Hydrogen Oxygen Mixtures, Combustion and Flame, 74, No. 1, 1988, pp. 53-69.
6. Magison, E.C., Electrical Equipment in Hazardous Locations, 3rd Edition, 1990, Instrument Society of America.
7. Lewis, B. and von Elbe, G., Combustion, Flames and Explosions of Gases, 1961, Academic Press, New York.
8. Anonymous, Aerospace Recommended Practice Aircraft Lightning Test Methods, SAE Aerospace Report ARP5416, 2005.
9. Anonymous, Aircraft Fuel System Lightning Protection Design and Qualification Test Procedures Development, U.S. Dept. of Transportation Federal Aviation Administration Report DOT/FAA/CT-94/74, 1994.
10. Ono, R., Masaharu, N., Fujiwara, S., Horiguchi, S. and Oda, T., Gas Temperature of Capacitance Spark Discharge in Air, Journal of Applied Physics, 97, No. 12, 2005, 123307.

14
11. Ono, R., Masaharu, N., Fujiwara, S., Horiguchi, S. and Oda, T., Minimum Ignition Energy of Hydrogen-Air Mixture: Effects of Humidity and Spark Duration, Journal of Electrostatics, 65, No. 2, 2007, pp. 87-93.
12. Randeberg, E., Olsen, W. and Eckhoff, R.K., A New Method for Generation of Synchronised Capacitive Sparks of Low Energy, Journal of Electrostatics, 64, No. 3-4, 2006, pp. 263-272.
13. Lee, J.J. and Shepherd, J.E., Spark Energy Measurements in Jet A Part II, Technical Report, Graduate Aeronautical Laboratories, California Institute of Technology, Explosion Dynamics Laboratory Report FM 99-7.
14. Colwell, J. and Reza, A., Hot Surface Ignition of Automotive and Aviation Fluids, Fire Technology, 41, No. 2, 2005, pp. 105-123.
15. Kwon, E., Moffett, S.P., Shepherd, J.E. and Day, A.C., International Conference on Lightning and Static Electricity, Combustion Characteristics of Hydrogen as Used in a Flammable Test Mixture, 28-31 August 2007, Paris, PPR-48.
16. Hosmer, D. and Lemeshow, S., Applied Logistic Regression, 1989, John Wiley and Sons. 17. Winson, T., Statistical Methods in Estimating Threshold Distributions for Stress Test with Single
Binary Outcome, internal report, M&CT, Phantom Works, The Boeing Company, 2004. 18. Lawless, J. F. Statistical Models and Methods for Lifetime Data, 2003, John Wiley & Sons, Inc. 19. von Pidoll, U., Brzostek, E. and Froechtenigt, H.-R., Determining the Incendivity of Electrostatic
Discharges Without Explosive Gas Mixtures, IEEE Transactions on Industry Applications, 40, No. 6, 2004, pp. 1467-1475.