statista consumer market outlook methodology
TRANSCRIPT

September 2021
Statista Technology Market Outlook Product & Methodology

2
What is the Statista Technology Market Outlook?
The Statista Technology Market Outlook is a tool that provides key market indicators, independent forecasts, and detailed market insights for the most relevant technology markets. Market data is often available in inconsistent forms, scopes, and segmentations, which makes it impossible to get reliable comparisons between two or more data sets. Our goal is to simplify your research and planning by providing all the necessary data for more than 55 technology markets in 152 countries and territories with a clearly defined market scope. The outlook will be expanded by New Technologies markets.
The Statista Technology Market Outlook is built on resources from the Statista platform as well as on in-house market research, companies and their financial statements, national statistical offices, international institutions, the trade press, and the experience of our analysts. We evaluate the status quo of the markets, monitor trends, and create an independent forecast regarding market developments of the global technology industry.
The tool provides data on financial operating figures (total revenue, spend per employee, and market shares for specific markets and segments) – on the platform and in multiple download formats.
The data for each market is updated twice a year and our analysts create Outlook Reports for all markets and segments, giving an extensive overview of the current state of the market and its latest trends.
About the Statista Technology Market Outlook (1/2)
The Statista Technology Market Outlook provides data for 8 markets in 152 countries & territories
Data Center
Software
Communication Services
IT Services
Public Cloud
55+(sub-)markets
152countries and
territories
11years (2016-2026)
25,000+interactive statistics
Sources: Statista Technology Market Outlook 2021
Cybersecurity
Internet of Things
New Technologies
Devices

3
The data of the Statista Technology Market Outlook is composed of countless pieces of information. Our analysts build on reported performance indicators from key market players, relevant market data taken from independent databases, Statista’s primary research, various market and macroeconomic indicators, historical developments, current trends, and interviews with market experts conducted by Statista. Continuous market monitoring allows us to take into consideration relevant changes along the value chain of the technology industry.
The market estimates for the world’s largest economies, such as the United States, China, and Germany, are derived using a combined top-down and bottom-up approach. Key performance indicators from the key market players on country/territory level (or regional level) are taken into account, as well as regional consumption data.
For smaller economies, we apply algorithmic data analysis, based on macroeconomic indicators and market drivers. Normalized indicators allow realistic assumptions and comparisons (per-capita spending, penetration rates, etc.), even for countries and territories with low data availability.
About the Statista Technology Market Outlook (2/2)
The key to our data is independent market modeling and various market and macroeconomic indicators
Sources: Statista Technology Market Outlook 2021

4
Europe
Southern EuropeAlbaniaBosnia and Herzeg.CroatiaCyprusGreeceItalyNorth MacedoniaMaltaMontenegroPortugalSerbiaSloveniaSpainTurkey
Eastern EuropeArmeniaAzerbaijanBelarusBulgariaGeorgiaMoldovaRomaniaRussiaUkraine
Central & Western EuropeAustriaBelgiumCzechiaFranceGermanyHungaryIrelandLuxembourgNetherlandsPolandSlovakiaSwitzerlandUnited Kingdom
Northern EuropeDenmarkEstoniaFinlandIcelandLatviaLithuaniaNorwaySweden
Americas
South AmericaArgentinaBoliviaBrazilChileColombiaEcuadorGuyanaParaguayPeruSurinameUruguay
Central AmericaBelizeCosta RicaEl SalvadorGuatemalaHondurasNicaraguaPanama
North AmericaCanadaMexicoUnited States
CaribbeanCubaDominican RepublicHaitiJamaicaPuerto Rico
Asia
South AsiaBangladeshBhutanIndiaNepalPakistanSri Lanka
West AsiaBahrainIranIraqIsraelJordanKuwaitLebanonOmanQatarSaudi ArabiaUnited Arab Emirates
Southeast AsiaBrunei DarussalamCambodiaIndonesiaLaosMalaysiaMyanmarPhilippinesSingaporeThailandTimor-LesteVietnam
East AsiaChinaHong KongJapanMongoliaSouth KoreaTaiwan
Central AsiaKazakhstanKyrgyzstanTajikistanTurkmenistanUzbekistan
Australia & OceaniaAustraliaFijiNew ZealandPapua New Guinea
Africa
North AfricaAlgeriaEgyptMoroccoSudanTunisia
Central AfricaAngolaCameroonChadEquatorial GuineaGabonRepublic of the Congo
West AfricaBeninBurkina FasoGambiaGhanaGuinea
Ivory CoastNigerNigeriaSenegalSierra LeoneTogo
Southern AfricaBotswanaLesothoMauritiusNamibiaSouth Africa
East AfricaBurundiEthiopiaKenyaMadagascarMalawiMozambiqueRwandaSeychellesTanzaniaUgandaZambiaZimbabwe
Country and territory coverage (1/2)
The Statista Technology Market Outlook covers 152 countries & territories and 24 geographical regions
Full list of countries & territories and geographical regions covered in the Statista Technology Market Outlook
Sources: Statista Technology Market Outlook 2021

5
ASEAN
Brunei DarussalamCambodiaIndonesiaJapanLaosMyanmarPhilippinesSingaporeThailandVietnam
Baltics
EstoniaLatviaLithuania
Benelux
BelgiumLuxembourgNetherlands
BRICS
BrazilChina
IndiaRussiaSouth Africa
CIS
ArmeniaAzerbaijanBelarusKazakhstanKyrgyzstanMoldovaRussiaTajikistanUzbekistan
D-A-CH
AustriaGermanySwitzerland
EAEU
ArmeniaBelarusKazakhstanKyrgyzstanRussia
EU-27
AustriaBelgiumBulgariaCroatiaCyprusCzechiaDenmarkEstoniaFinlandFranceGermanyGreeceHungaryIrelandItalyLatviaLithuaniaLuxembourgMaltaNetherlandsPolandPortugalRomaniaSlovakia
SloveniaSpainSweden
G7
CanadaFranceGermanyItalyJapanUnited KingdomUnited States
G20
ArgentinaAustraliaAustriaBelgiumBrazilBulgariaCanadaChinaCroatiaCyprusCzechiaDenmark
EstoniaFinlandFranceGermanyGreeceHungaryIndiaIndonesiaIrelandItalyJapanLatviaLithuaniaLuxembourgMaltaMexicoNetherlandsPolandPortugalRomaniaRussiaSaudi ArabiaSlovakiaSloveniaSouth Africa
South KoreaSpainSwedenTurkeyUnited KingdomUnited States
GCC
BahrainKuwaitOmanQatarUnited Arab Emirates
NAFTA
CanadaMexicoUnited States
Nordics
DenmarkFinlandIcelandNorwaySweden
Country and territory coverage (2/2)
The Statista Technology Market Outlook data can be combined to form 13 political regions
Full list of political regions covered in the Statista Technology Market Outlook
Sources: Statista Technology Market Outlook 2021

MARKETSIZING
6

Sources: Statista Technology Market Outlook 20217
Detailed analysis for selected countries
We obtain the data from the Statista Technology Market Outlook for the world’s largest economies, such as the United States, China, and Germany, through an in-depth analysis of each market segment, respectively. To evaluate the markets, we use the latest financial data from annual financial reports of the markets’ leading companies and industry associations, macroeconomic indicators from international institutions and statistical bureaus, surveys and third-party studies, as well as expert opinion. Because of the considerable amount of information that is incorporated in the Statista Technology Market Outlook and all the interpretation and analysis involved in the process, a detailed representation of the data sources for each data point is not possible.
Market sizes on country and territory level are determined using a combined top-down and bottom-up approach for each segment. To calculate the global market size of every market segment, we analyze companies’ financial reports and check various macroeconomic developments that drive the global market. In case revenues are not reported for certain countries and territories (as is true for major multinational tech players), annual reports give an indication for a first regional split of the companies’ revenue.
In addition, we use relevant key market indicators that influence the market size on regional as well as on country and territory level. These indicators are published by international organizations or national statistical bureaus and help us to estimate the market size for each country and territory individually.
Methodology (1/4)
Underlying data
Key player analysis & monitoring
▪ Company profiles and key performance indicators
▪ Quarterly earning calls and further investor information
▪ News and trends
Macroeconomic indicators
▪ Indicators from statistical offices and census data
▪ International organizations and associations
Market research
▪ Digital consumer profiling – the Statista Global Consumer Survey
▪ Exclusive representative ad-hoc surveys in selected countries and territories on specific current topics
Studies & third-party data
▪ Market analyses and analyst opinions
▪ Industry analyses
▪ Academic studies
We use top-down and bottom-up approaches for our sizing of the markets’ status quo

Sources and benchmark:
8
Market sizing (2/4)
The Network Infrastructure market as an example of the top-down approach
Global Network Infrastructure market size
Network Infrastructure hardware market
…
2nd leading company
Market-leading company
+
+
Global market sizing
Sources: Statista Technology Market Outlook 2021
Financial statements like annual reports, quarterly earning calls, further investor information, as well as expert opinions
Validation based on third-party studies
Allocation carried out based on country and territory level (regional level) data from financial statements, expert opinions, as well as bottom-up market sizing based on macroeconomic indicators and consumption data
Validation based on third-party studies
U.S.
China
Germany
…
…
Revenue distribution on country and territory level

Mobile Data
9
Market sizing (3/4)
Mobile Data as an example of the bottom-up approach
Sources: Statista Technology Market Outlook 2021
Source collection
Example U.S.:
Federal Communications Commission, AT&T, Verizon, T-Mobile, Comcast, Charter
Telecommunication regulatory authorities, telecommunication providers, industry associations, third-party sources
Infrastructural
indicators
Driver compilationGDP, population, number of mobile broadband connections, 4G and 5G coverage
Data processing/
validationRegression analysis + benchmarking
National statistics, third-party studies, industry research
Benchmark through third-party studies, analyst expertise, industry research
Sources and benchmark:

Market sizing exemplified by1 the Hungarian Laptop market in 2020
Step 1: Choose reference country/territory2
Step 2: Compare key market indicators3
PopulationConsumer spending per capitaGross domestic productMobile broadband subscriptionsICT Development Index
Step 3: Apply an algorithm to estimate market KPIs, using data from the reference country as base and the country’s key market indicators as drivers
Result:
Laptop market revenue
10
Driver-based transfer of market data to smaller economies with lack of available data
The market data for smaller economies is generated using algorithmic models to compensate for the lack of available data. To evaluate the potential of smaller countries and territories, we use the performance ratios of larger economies with a similar infrastructure and similar development conditions as benchmark values. Then we apply an algorithm-based calculation to create market KPI estimations, using the country’s or territory’s key market indicators as drivers.
Over 100 driver data sets for 152 countries and territories have been collected from a variety of sources, including the International Monetary Fund (IMF), the International Telecommunication Union (ITU), the World Bank, and many others. The data sets either include a forecast from the source or are forecast by Statista using trend analyses and prediction techniques based on historical data from 2000 onwards. The drivers are categorized and assigned to the markets so that the top three correlating drivers can then be selected for each market segment.
The chosen drivers do not only have the best mathematical fit, but they must also have an actual influence on the performance of the markets. If specific drivers are not available for one country, they can be replaced with a set of backup economic development drivers of more general nature.
Market sizing (4/4)
We estimate the potential of smaller economies with the help of macroeconomic and infrastructural drivers
(reference country)
Poland
Poland(benchmark)
37.8mUS$9,115US$642,121m45.4m6.89
US$1,233m
Hungary
Hungary(KPI estimated)
9.7mUS$8,741US$176,543m7.4m6.93
US$239m
1: Simplified illustration 2: Several countries/territories are used to get the final results 3: Further key market indicators were used in the final algorithmSources: Statista Technology Market Outlook 2021

FORECASTS
11

A market growth forecast is generated with the help of our tool, which combines historical market data with predictions regarding the development of key market drivers by creating the most suitable curve for the market. The S-curve constitutes a special case of the logistic function and is well suited to make forecasts regarding electronic and digital hardware devices due to the non-linear growth of technology adoption.
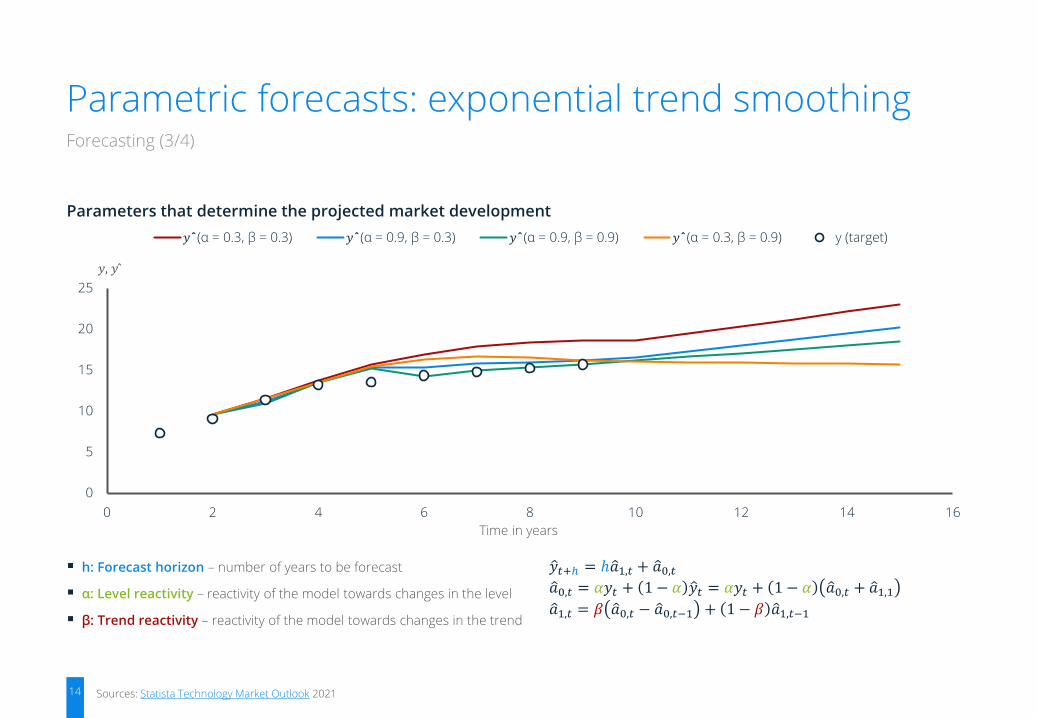
For markets with a projected steady growth, such as Enterprise Software and IT Services, we use exponential trend smoothing to illustrate the continuous market development. Parameters are adjusted individually depending on the market-country/-territory combination.
In certain industries, replacement cycles or seasonality effects are common, and such sequences are taken into consideration in our forecasts. Where applicable, we use seasonal forecast algorithms to outline this kind of market behavior.
Once the status quo has been established, we assess the recent market growth and the macroeconomic environment of the country or territory in question and its region. Then we move on to trend scouting, looking out for business-critical developments in the industries that provide the basis for the future growth of the markets.
The result is an algorithm-backed forecast based on relevant market drivers and macroeconomic indicators. We validate our data through collaboration with other Statista teams, third-party forecasts, regional comparisons, and the analysis of development cycles in different markets.
12
Forecasting (1/4)
Our market growth forecasting is based on three different techniques
To create forecasts for up to 5 years, we combine economic developments and trend scouting with statistical and mathematical forecasting techniques. Every market is modeled differently as it is tailored to the respective industry, and this also effects the forecasting method for each market.
In the Technology Market Outlook, we use three different forecasting techniques: the S-curve function, exponential trend smoothing, and seasonal forecast algorithms.
Certain technology products and services, such as the cloud, are not adopted by all economies and individuals at the same time, but in a time sequence. The market maturity can be evaluated according to the Bass diffusion model, which describes how new products penetrate the market. Countries and territories can be classified into different clusters based on how long it takes until they adopt the new product. This, in turn, depends on a country's macroeconomic factors, its technologization, culture, and attitudes. This lifecycle of technology penetration can be represented as a graph:
Innovators LaggardsLatemajority
Earlymajority
Earlyadopters
Sources: Statista Technology Market Outlook 2021

13
Parameters that determine the projected market development
▪ A: Base level – starting point of market development / known threshold
▪ G: Jumping height – remaining potential until maximum market
penetration
Forecasting (2/4)
▪ T: Symmetry – progression of market diffusion
▪ k: Steepness – development speed / intensity of growth
▪ M: Inflection point – point of transition to incipient market saturation
Parametric forecasts: the S-curve function
0
0.5
1
1.5
2
2.5
3
0 2 4 6 8 10 12 14 16
A: Base level
G: Jumping height
T: Symmetry
M: Inflection point
k: Steepness
y = A +G
1 + T ∙ e−k∙ x−M 1/T
Time in years
Ma
rke
t m
atu
rity
me
tric
1
1: Depending on the market for which the forecast is made, a market maturity metric might be user penetration, revenue, saturation, etc.Sources: Statista Technology Market Outlook 2021
14
Parameters that determine the projected market development
▪ h: Forecast horizon – number of years to be forecast
▪ α: Level reactivity – reactivity of the model towards changes in the level
▪ β: Trend reactivity – reactivity of the model towards changes in the trend
Forecasting (3/4)
Parametric forecasts: exponential trend smoothing
0
5
10
15
20
25
0 2 4 6 8 10 12 14 16
𝑦 ̂ (α = 0.3, β = 0.3) 𝑦 ̂ (α = 0.9, β = 0.3) 𝑦 ̂ (α = 0.9, β = 0.9) 𝑦 ̂ (α = 0.3, β = 0.9) y (target)
𝑦, 𝑦 ̂
ො𝑦𝑡+ℎ = ℎ ො𝑎1,𝑡 + ො𝑎0,𝑡
ො𝑎0,𝑡 = 𝛼𝑦𝑡 + 1 − 𝛼 ො𝑦𝑡 = 𝛼𝑦𝑡 + 1 − 𝛼 ො𝑎0,𝑡 + ො𝑎1,1
ො𝑎1,𝑡 = 𝛽 ො𝑎0,𝑡 − ො𝑎0,𝑡−1 + 1 − 𝛽 ො𝑎1,𝑡−1
Time in years
Sources: Statista Technology Market Outlook 2021

15
Forecasting (4/4)
Where applicable, we use seasonal forecast algorithms
Seasonal inputIdentify
base functionEstimate typeof seasonality
Calculateseason length
Deseasonalize data
𝑦 = 𝑎 ∙ 𝑥 + 𝑏𝑦 = 𝑏 ∙ 𝑎𝑥
𝑦 = 𝑎 ∙ log 𝑥 + 𝑏
𝛾 =
𝑛=0
𝑁−1
𝑦𝑛 ∙ 𝑒− Τ𝑖2𝜋𝑘𝑛 𝑁𝑦𝑠 = 𝑆 ∙ 𝑆𝑢
𝑦𝑠 = 𝑆 + 𝑆𝑢
Calculateseasonalimpact
Calculate seasonless
forecast
Normalize seasonality
Fit parameters
𝛼 = ?𝛽 = ?𝜑 = ?
𝑆𝑖,𝑛,+ = 𝑆𝑖,+ − 𝜇𝑠
𝑆𝑖,𝑛,∗ = 𝑆𝑖,∗/𝜇𝑠
Combine
Finalization /assembly
Pre-processing /
model identification
Parameter estimation /
parallelforecasting
Sources: Statista Technology Market Outlook 2021

16
▪ Statista Outlook data is presented in current, or nominal, prices, which means it is not adjusted for inflation (unless explicitly stated otherwise).
▪ Correspondingly, the underlying exchange rates used to convert market data from local currencies into the reported currencies refer to the
current value in the relevant year.
▪ The usage of current exchange rates marks a change compared to previous releases of the Market Outlooks (prior to Q4 2021), where the average
exchange rates of the year 2017 were applied to all years. This artificial stabilization provided a clear view of the relevant market‘s underlying growth
rates in local currencies but hid currency risks associated with certain regions. Since the Outlooks are mostly used to compare regions, we decided to
no longer use constant exchange rates in order to enable a more realistic assessment of market potential from the perspective of international
investors, who have to factor in currency risks. In short, current exchange rates make forecasts more comparable across regions.
▪ When looking at markets in a currency other than the local one, the growth rates of new market data will be different and can appear more
volatile than before because currency effects are now visible. The underlying growth rate of the market can still be seen when looking at the data in
the respective local currency.
▪ Statista‘s exchange rate data is sourced from international institutions, such as the International Monetary Fund, the World Bank, or the United
Nations, and reflects official rates set or reported by a country‘s, territory’s, or region‘s foreign exchange administration (usually the central bank).
▪ To take account of potential regional currency risks, we also make forecasts of exchange rates. These forecasts are based on the outlook of the
relevant region‘s overall economy as well as on its projected inflation differential relative to other regions. They are updated twice a year and do not
take into account sudden and drastic changes that might result from crises such as wars, natural disasters, or similar events.
Exchange rates in the Outlooks (1/2)
All forecasts take projected currency effects into account

17
Made-up market value (constant exchange rate)
Exchange rates in the Outlooks (2/2)
Made-up market value (current exchange rate)
1: CAGR: Compound Annual Growth Rate / average growth rate per yearAll values represent made-up numbers for exemplary purposes and are not based on any existing country, market, or currency.
Current exchange rates enable a more realistic assessment of actual market potential and dynamics
Compared to constant exchange rates (on the left), current exchange rates put the seemingly high nominal growth rates in country C into perspective: Due to the country‘s unstable currency, international investors must expect diminishing returns from that country. In contrast, country B shows some fluctuations in the value of its currency, but, overall, it remains fairly stable, leading to only minor currency effects.
Currency value 2018 2019 2020 2021 2022
Country A 1 1 1 1 1
Country B 0.81 0.72 0.78 0.79 0.81
Country C 0.8 0.72 0.65 0.59 0.53
150 163 177 192 208
250 255 260 265 271
255 263 271 279 287
20222018 2019 2020 2021
736
655 680 707766
+4%1
Country A Country B Country C
150 146 143 141 138
250 227 250 259 271
255 263 271 279 287
2019
664655
20212018 2020 2022
636679 695
+2%1
Country A Country CCountry B

COVID-19IMPACT
18

19
Macro-economic outlook
▪ Updated general economic outlook (GDP, exchange rates, inflation, consumer spending, investments, etc.)
▪ Gathering of short-term indicators from national statistical offices and international institutions (e.g., IMF, World Bank)
Pandemic outlook
▪ Monitoring of current and projected case load, government restrictions, and vaccination campaigns
COVID-19 impact (1/4)
Directly affected markets
▪ Driven primarily by pandemic outlook (e.g., travel & tourism)
▪ Recession impact & recovery assessment based on short-term indicators and pandemic outlook
Indirectly affected markets
▪ Driven primarily by overall macro-economic performance or pandemic-induced shifts in spending (e.g., semiconductors)
▪ Recession impact and recovery assessment based on short-term indicators, company filings, and analyst assessments
Rebound and recovery
▪ Markets expected to asymptotically approach long-term trend
▪ Pace and completeness of recovery dependent on local macro-economic expectations and outlook related to the pandemic
We routinely monitor the economic situation as it unfolds and update our forecasts accordingly
Market environment Market shock Shock dissipation

An uneven recovery leads to quick initial gains while some scarring is expected to remain
20
1: “Global” refers to the 152 countries and territories covered in the Statista Market Outlooks (representative of c. 99% of worldwide GDP)2: Gross domestic product in constant 2017 prices, converted from local currencies using the annual average exchange rates of 2017Sources: Chart data based on IMF, World Economic Outlook, April 2021, own calculations and estimates
A swift but uneven recovery is underway
▪ COVID is here to stay, but a combination of vaccination initiatives and quarantine measures will push against the pure pandemic-induced impact in most countries
▪ Economies have adapted to the situation better than originally feared, e.g., by shifting spending from services to goods and/or by transitioning to remote work options. But other sectors such as in-person services are likely to be subdued for a while
▪ Recovery in reopening societies will be quick at first but likely not be sufficient to compensate for all lost potential
▪ Uncertainties remain about herd immunity and if/when it can be achieved and about inflationary pressure that stems from a combination of stimulus measures, reduced spending for services, and supply chain issues
We do not anticipate a reversal of long-term trends but a gradual dissipation of the pandemic-induced shock
We will likely see an intensification of some existing long-term trends (e.g., digitization)
COVID-19 impact (2/4)
Global1 constant GDP2 forecast in trillion US$
70
75
80
85
90
95
100
105
2019 2020 2021 2022 2023 2024 2025 2026
Original forecast Adjusted forecast

APPENDIX
21
This appendix contains answers to frequently
asked questions about the general methodology
of the Technology Market Outlook

22
How is the Technology Market defined?
In general, all segments entail both B2B and B2C spend. Laptops, for instance, are bought by consumers and enterprises, while IT services are only used in business environments. Revenues are allocated based on where the end user resides and do not entail wholesale or retail markups.
What kind of prices are shown?
Revenue is allocated to the economy where the money is spent at manufacturer / service provider price levels, excluding VAT.
Does the market data reflect the impact of COVID-19?
The forecasts were updated due to the COVID-19 impact. If new information is coming to light, we will make ad-hoc changes to the affected markets.
Does the Technology Market Outlook include market shares?
Currently, we do not show market shares for all segments but plan to extend these continuously.
Frequently asked questions (1/2)
How often do you update the information?
We update data in our Market Outlooks twice a year. The updates are scattered throughout the year. Thus, one market might be updated in January and July, while others are updated later. If something major happens that influences our estimations or if we find inconsistencies, we will update the information immediately.
Is this data comparable from year to year?
Yes, that is the main feature of our Market Outlooks: comparability across markets, countries, and years. If we change market definitions to adapt to the ever-changing business models, we adapt the whole market estimate and forecasts so that all revenue data corresponds again to the new definition and is comparable from year to year.
The figures now differ significantly from those of the previous year. Why has the data changed?
Approaches, assumptions, input data, and scope are improved from update to update. Therefore, data from previous updates might not necessarily be comparable with current data. In addition to that, our own primary research is expanding, and we are replacing third-party data sources with the data from the Statista Global Consumer Survey, which can lead to a one-time significant change in data.
FAQ: The Statista Technology Market Outlook
Sources: Statista Technology Market Outlook 2021

23
The data in the download files or in the report differs from the data shown in the tool. Which is correct?
The data in the tool is always updated first. In the reports and in full-page downloads, the new data might be available a little later due to limited IT capacity and time lags.
Can we download the information into Excel/PPT?
The data in our Market Outlooks can be downloaded as an Excel or PDF file. Our reports are available for download as a PDF file only.
How can I ascertain how reliable the data is? Do you have an indicator on how precise these forecasts are?
There is little data we can compare our forecasts to as no statistical office monitors the exact same markets and most sources differ in methodology. But we certainly compare our estimates with those from other companies, and, in some cases, trade associations, company reports, and press releases serve as a good indicator.
Can I get the raw data or the original file where you modeled the market?
We do not offer our working files for download.
Frequently asked questions (2/2)
Is the information on smaller economies without in-depth analysis less valuable than the information on economies with in-depth analysis?
To compensate for the lack of available data, we use the performance ratios of economies with a similar infrastructure and similar development conditions as benchmark values. Then we apply an algorithm-based calculation to create market estimations, using the economy’s key market indicators as drivers.
When will you provide a more detailed analysis of certain categories?
Updates and planned releases can be found in the release calendar.
FAQ: The Statista Technology Market Outlook
Sources: Statista Technology Market Outlook 2021

UNITED STATES +1 212 419-8286
Hadley Ward [email protected]
LATIN AMERICA +1 212 419-8277
Catalina Rodriguez [email protected]
EUROPE +44 208 189 7000
Lodovica Biagi [email protected]
GERMANY +49 40 28 48 41 0
Jens Weitemeyer [email protected]
ASIA +91 804 901 6428
Ziyan Zhang [email protected]
24
Get in touch with us - We are happy to help