state street global advisors spdr etfs chart pack street global advisors ... • investor confidence...
TRANSCRIPT
IBG-25994
2018 Outlook Edition
State Street Global Advisors
SPDR® ETFs Chart Pack
For Public Use Please see Appendix C for more information on investment terms used in this Chart Pack.
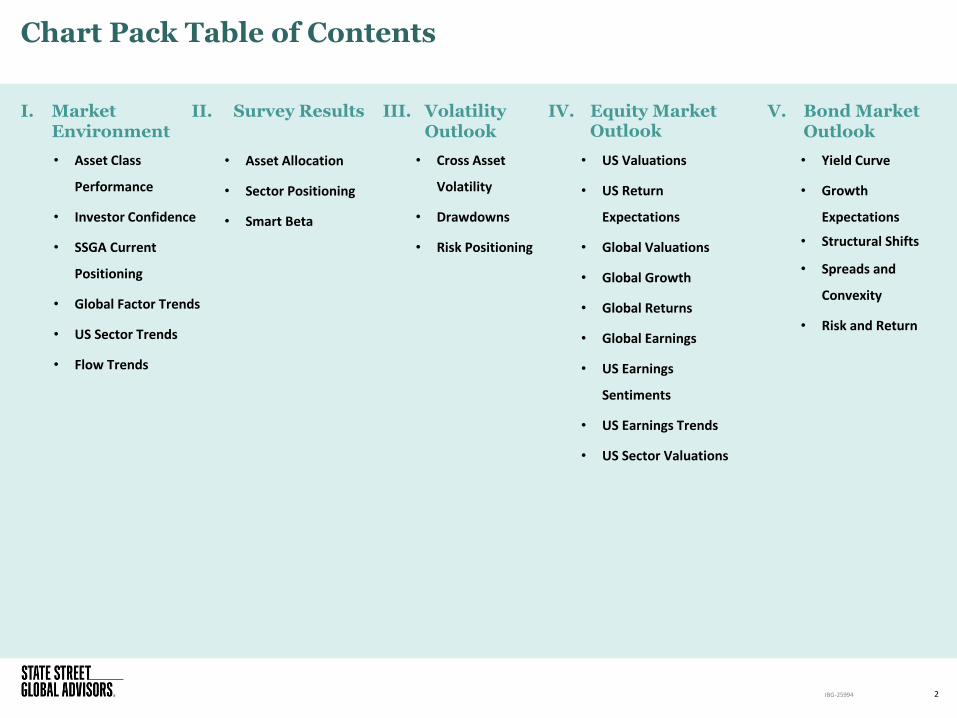
Chart Pack Table of Contents
2 IBG-25994
I. Market Environment
• Asset Class
Performance
• Investor Confidence
• SSGA Current
Positioning
• Global Factor Trends
• US Sector Trends
• Flow Trends
II. Survey Results
• Asset Allocation
• Sector Positioning
• Smart Beta
III. Volatility Outlook
• Cross Asset
Volatility
• Drawdowns
• Risk Positioning
IV. Equity Market Outlook
• US Valuations
• US Return
Expectations
• Global Valuations
• Global Growth
• Global Returns
• Global Earnings
• US Earnings
Sentiments
• US Earnings Trends
• US Sector Valuations
V. Bond Market Outlook
• Yield Curve
• Growth
Expectations
• Structural Shifts
• Spreads and
Convexity
• Risk and Return

Market Environment
3 IBG-25994
22.9
18.3
27.3
32.8
9.6
3.2 1.9
8.7
-0.3
20.5
15.1
23.1
32.5
7.6
3.1 2.0
11.1
-2.1
3.1 2.9
1.0 0.2 -0.3 -0.1 -0.1 0.3 -0.6
US LARGE CAP US SMALL CAP DEVELOPED EMERGING HIGH YIELD AGG TREASURIES GOLD BROADCOMMODITIES
S&P 500 Index Russell 2000 Index MSCI EAFE Index MSCI EmergingMarkets Index
Bloomberg US HighYield Index
Bloomberg BarclaysUS Aggregate Index
Bloomberg USTreasury Index
Gold Spot BloombergCommodity Index
Trailing 12 Month YTD Prior Month
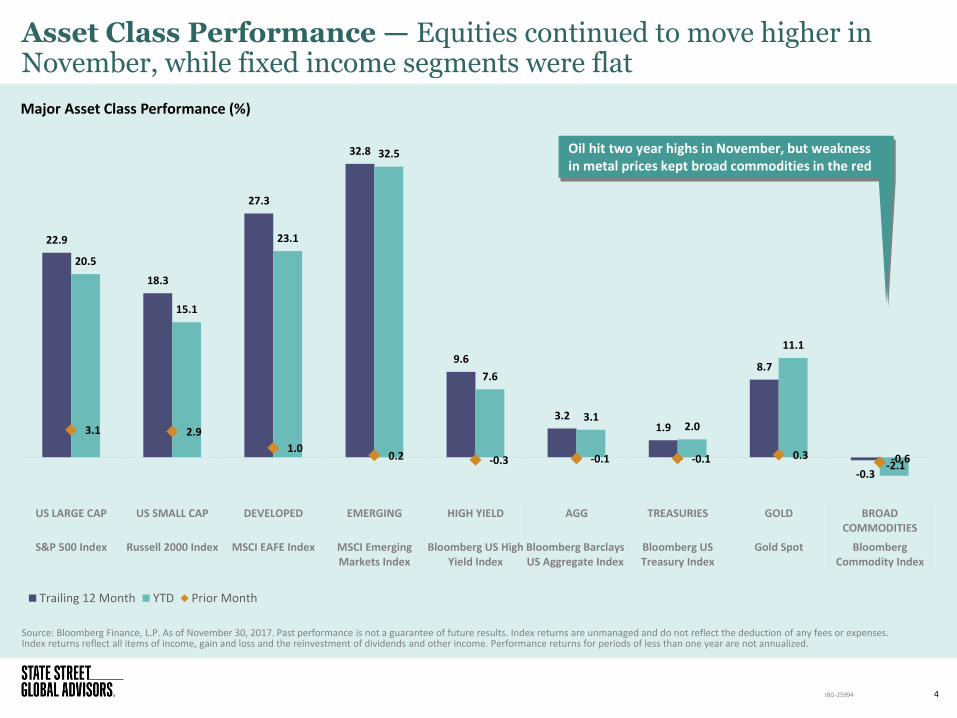
Asset Class Performance — Equities continued to move higher in November, while fixed income segments were flat
Source: Bloomberg Finance, L.P. As of November 30, 2017. Past performance is not a guarantee of future results. Index returns are unmanaged and do not reflect the deduction of any fees or expenses. Index returns reflect all items of income, gain and loss and the reinvestment of dividends and other income. Performance returns for periods of less than one year are not annualized.
Major Asset Class Performance (%)
4 IBG-25994
Oil hit two year highs in November, but weakness in metal prices kept broad commodities in the red
70
80
90
100
110
120
130
140
Mar 02 Dec 02 Sep 03 Jun 04 Mar 05 Dec 05 Sep 06 Jun 07 Mar 08 Dec 08 Sep 09 Jun 10 Mar 11 Dec 11 Sep 12 Jun 13 Mar 14 Dec 14 Sep 15 Jun 16 Mar 17
State Street Investor Confidence Index 1 Year Moving Average
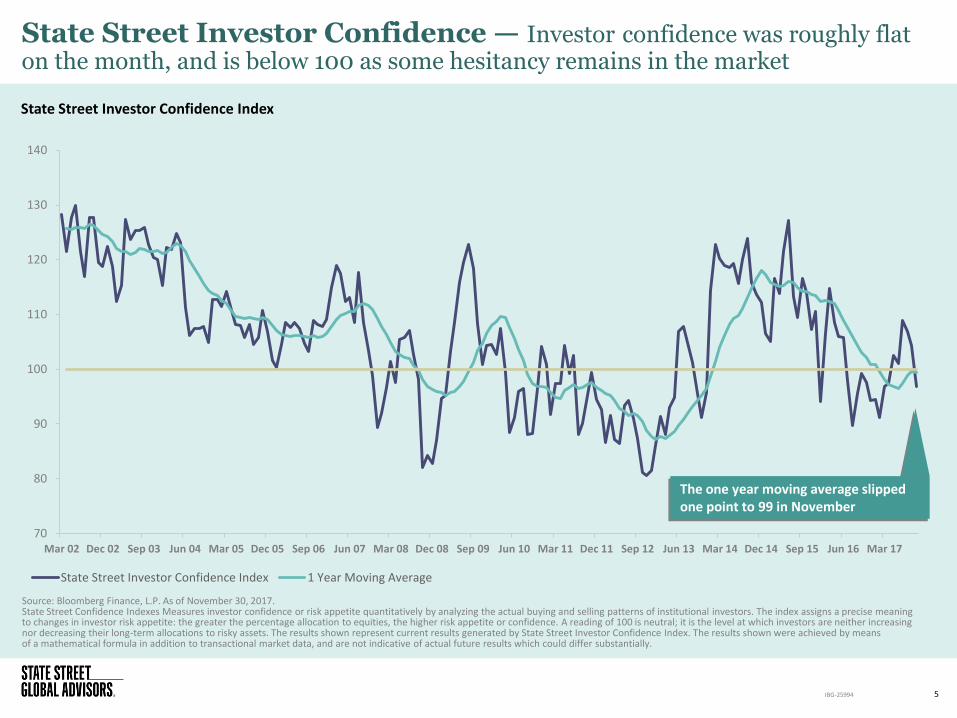
The one year moving average slipped one point to 99 in November
State Street Investor Confidence — Investor confidence was roughly flat on the month, and is below 100 as some hesitancy remains in the market
Source: Bloomberg Finance, L.P. As of November 30, 2017. State Street Confidence Indexes Measures investor confidence or risk appetite quantitatively by analyzing the actual buying and selling patterns of institutional investors. The index assigns a precise meaning to changes in investor risk appetite: the greater the percentage allocation to equities, the higher risk appetite or confidence. A reading of 100 is neutral; it is the level at which investors are neither increasing nor decreasing their long-term allocations to risky assets. The results shown represent current results generated by State Street Investor Confidence Index. The results shown were achieved by means of a mathematical formula in addition to transactional market data, and are not indicative of actual future results which could differ substantially.
State Street Investor Confidence Index
5 IBG-25994
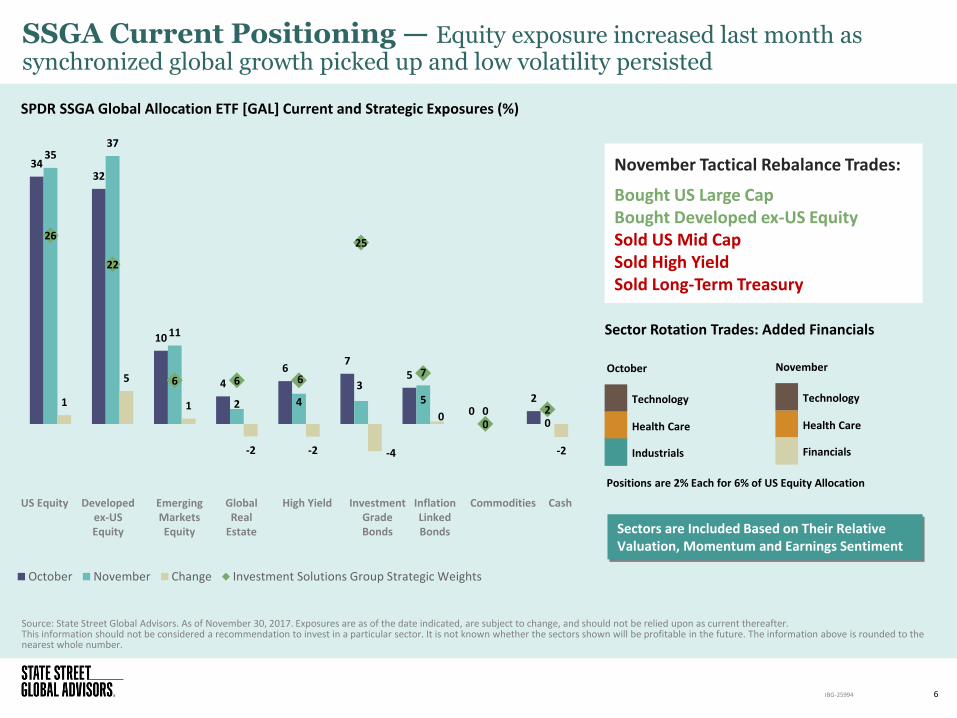
Source: State Street Global Advisors. As of November 30, 2017. Exposures are as of the date indicated, are subject to change, and should not be relied upon as current thereafter. This information should not be considered a recommendation to invest in a particular sector. It is not known whether the sectors shown will be profitable in the future. The information above is rounded to the nearest whole number.
SSGA Current Positioning — Equity exposure increased last month as synchronized global growth picked up and low volatility persisted
6
November
Sector Rotation Trades: Added Financials
November Tactical Rebalance Trades:
Bought US Large Cap Bought Developed ex-US Equity Sold US Mid Cap Sold High Yield Sold Long-Term Treasury
IBG-25994
Positions are 2% Each for 6% of US Equity Allocation
SPDR SSGA Global Allocation ETF [GAL] Current and Strategic Exposures (%)
Technology
Health Care
Financials
October
Technology
Health Care
Industrials
US Equity Developed ex-US Equity
Emerging Markets Equity
Global Real
Estate
High Yield Investment Grade Bonds
Inflation Linked Bonds
Commodities Cash
Sectors are Included Based on Their Relative Valuation, Momentum and Earnings Sentiment
34 32
10
4
6 7
5
0 2
35 37
11
2 4
3 5
0 0
1
5
1
-2 -2 -4
0
-2
26
22
6 6
25
7
0 2
October November Change Investment Solutions Group Strategic Weights
90
95
100
105
110
115
120
125
130
Dec-13 Apr-14 Aug-14 Dec-14 Apr-15 Aug-15 Dec-15 Apr-16 Aug-16 Dec-16 Apr-17 Aug-17
No
rmal
ize
d In
de
x Le
vel
Min. Vol Quality Size Yield Momentum Value
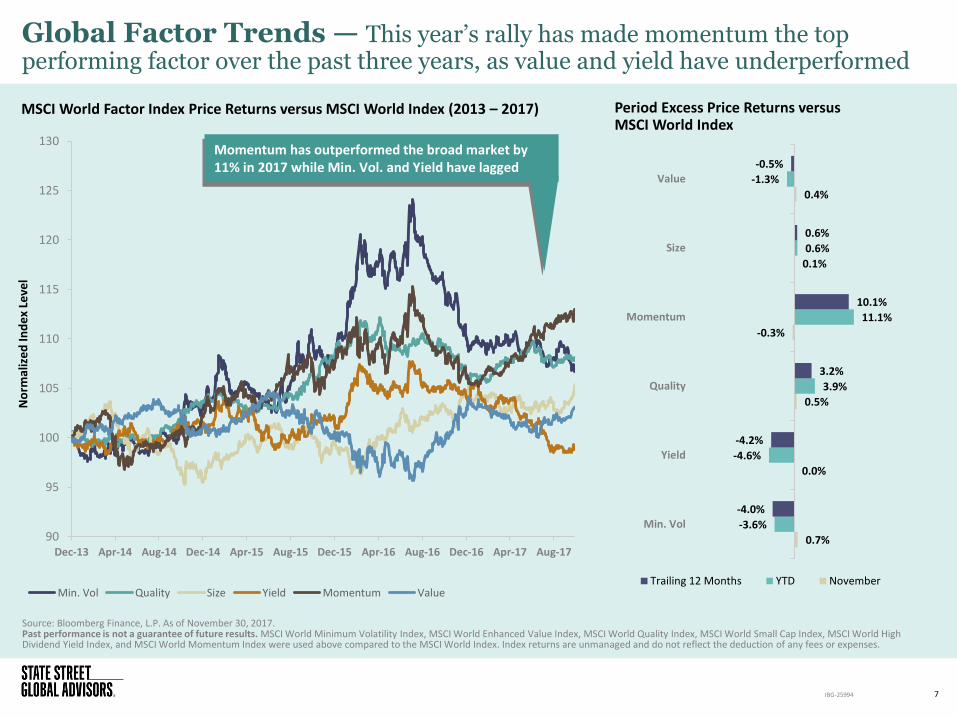
Global Factor Trends — This year’s rally has made momentum the top performing factor over the past three years, as value and yield have underperformed
7
Source: Bloomberg Finance, L.P. As of November 30, 2017. Past performance is not a guarantee of future results. MSCI World Minimum Volatility Index, MSCI World Enhanced Value Index, MSCI World Quality Index, MSCI World Small Cap Index, MSCI World High Dividend Yield Index, and MSCI World Momentum Index were used above compared to the MSCI World Index. Index returns are unmanaged and do not reflect the deduction of any fees or expenses.
MSCI World Factor Index Price Returns versus MSCI World Index (2013 – 2017) Period Excess Price Returns versus MSCI World Index
IBG-25994
0.7%
0.0%
0.5%
-0.3%
0.1%
0.4%
-3.6%
-4.6%
3.9%
11.1%
0.6%
-1.3%
-4.0%
-4.2%
3.2%
10.1%
0.6%
-0.5%
Min. Vol
Yield
Quality
Momentum
Size
Value
Trailing 12 Months YTD November
Momentum has outperformed the broad market by 11% in 2017 while Min. Vol. and Yield have lagged
8
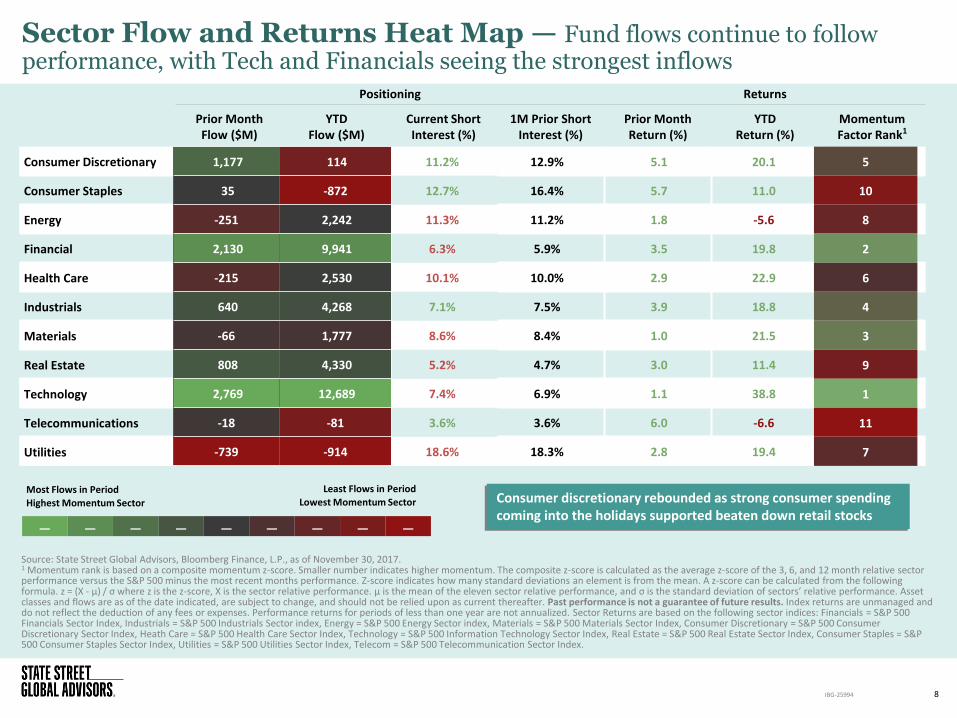
Sector Flow and Returns Heat Map — Fund flows continue to follow performance, with Tech and Financials seeing the strongest inflows
IBG-25994
Source: State Street Global Advisors, Bloomberg Finance, L.P., as of November 30, 2017. 1 Momentum rank is based on a composite momentum z-score. Smaller number indicates higher momentum. The composite z-score is calculated as the average z-score of the 3, 6, and 12 month relative sector performance versus the S&P 500 minus the most recent months performance. Z-score indicates how many standard deviations an element is from the mean. A z-score can be calculated from the following formula. z = (X - μ) / σ where z is the z-score, X is the sector relative performance. μ is the mean of the eleven sector relative performance, and σ is the standard deviation of sectors’ relative performance. Asset classes and flows are as of the date indicated, are subject to change, and should not be relied upon as current thereafter. Past performance is not a guarantee of future results. Index returns are unmanaged and do not reflect the deduction of any fees or expenses. Performance returns for periods of less than one year are not annualized. Sector Returns are based on the following sector indices: Financials = S&P 500 Financials Sector Index, Industrials = S&P 500 Industrials Sector index, Energy = S&P 500 Energy Sector index, Materials = S&P 500 Materials Sector Index, Consumer Discretionary = S&P 500 Consumer Discretionary Sector Index, Heath Care = S&P 500 Health Care Sector Index, Technology = S&P 500 Information Technology Sector Index, Real Estate = S&P 500 Real Estate Sector Index, Consumer Staples = S&P 500 Consumer Staples Sector Index, Utilities = S&P 500 Utilities Sector Index, Telecom = S&P 500 Telecommunication Sector Index.
Consumer discretionary rebounded as strong consumer spending coming into the holidays supported beaten down retail stocks
Positioning Returns
Prior Month Flow ($M)
YTD Flow ($M)
Current Short Interest (%)
1M Prior Short Interest (%)
Prior Month Return (%)
YTD Return (%)
Momentum Factor Rank1
Least Flows in Period
Lowest Momentum Sector Most Flows in Period
Highest Momentum Sector
— — — — — — — — —
Consumer Discretionary
Consumer Staples
Energy
Financial
Health Care
Industrials
Materials
Real Estate
Technology
Telecommunications
Utilities
1,177 114
35 -872
-251 2,242
2,130 9,941
-215 2,530
640 4,268
-66 1,777
808 4,330
2,769 12,689
-18 -81
-739 -914
11.2% 12.9%
12.7% 16.4%
11.3% 11.2%
6.3% 5.9%
10.1% 10.0%
7.1% 7.5%
8.6% 8.4%
5.2% 4.7%
7.4% 6.9%
3.6% 3.6%
18.6% 18.3%
5.1 20.1
5.7 11.0
1.8 -5.6
3.5 19.8
2.9 22.9
3.9 18.8
1.0 21.5
3.0 11.4
1.1 38.8
6.0 -6.6
2.8 19.4
5
10
8
2
6
4
3
9
1
11
7
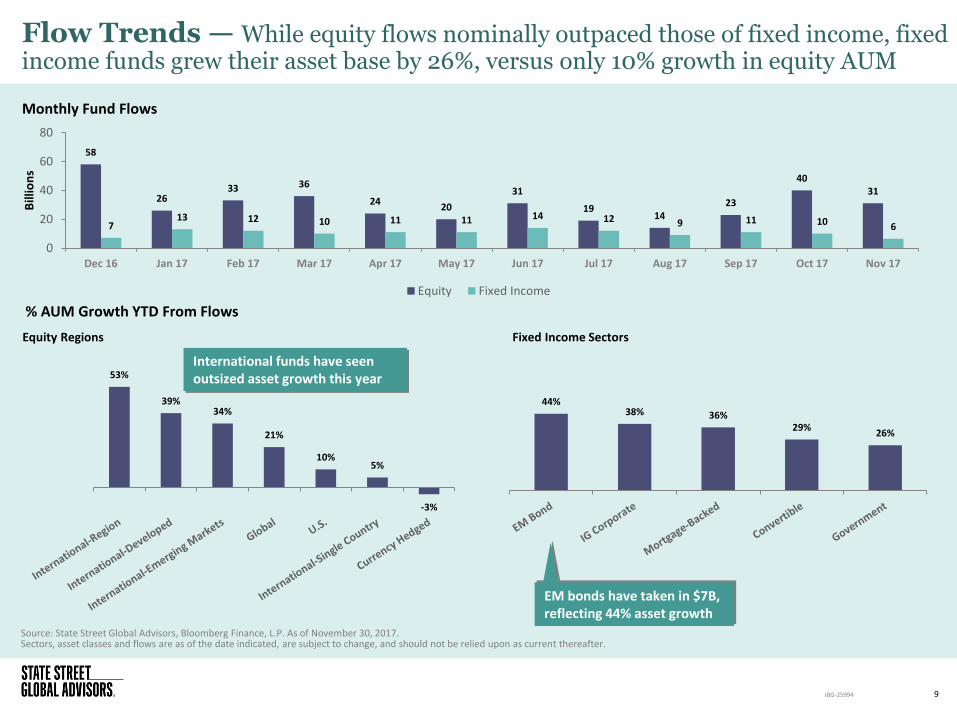
Flow Trends — While equity flows nominally outpaced those of fixed income, fixed income funds grew their asset base by 26%, versus only 10% growth in equity AUM
Source: State Street Global Advisors, Bloomberg Finance, L.P. As of November 30, 2017. Sectors, asset classes and flows are as of the date indicated, are subject to change, and should not be relied upon as current thereafter.
9 IBG-25994
Monthly Fund Flows
% AUM Growth YTD From Flows
58
26 33 36
24 20
31
19 14
23
40 31
7 13 12 10 11 11 14 12 9 11 10 6
0
20
40
60
80
Dec 16 Jan 17 Feb 17 Mar 17 Apr 17 May 17 Jun 17 Jul 17 Aug 17 Sep 17 Oct 17 Nov 17
Bill
ion
s
Equity Fixed Income
53%
39% 34%
21%
10% 5%
-3%
44% 38% 36%
29% 26%
Equity Regions Fixed Income Sectors
International funds have seen outsized asset growth this year
EM bonds have taken in $7B, reflecting 44% asset growth
Survey Results Based on the responses of more than 750 investment professionals
10 IBG-25994
A total of 772 investment professionals completed State Street Global Advisors’ online midyear survey, the goal of which was to determine the investment concerns and client portfolio considerations that were top of mind for investment professionals. The survey was fielded in October 2017. Respondents represented a variety of investment professional segments holding a wide range of assets under management.
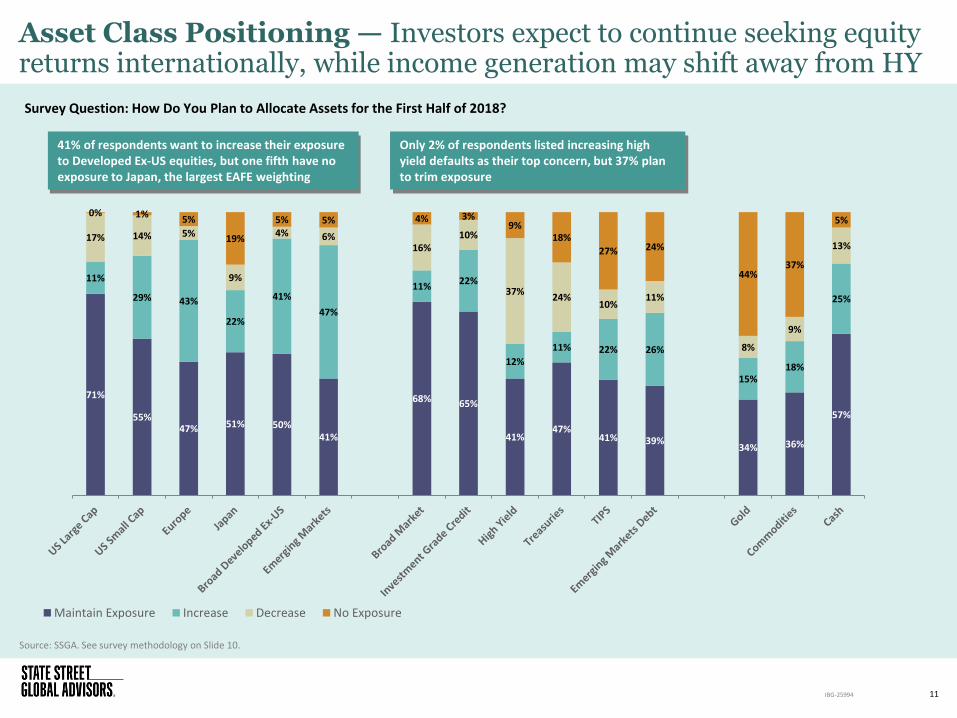
Asset Class Positioning — Investors expect to continue seeking equity returns internationally, while income generation may shift away from HY
Source: SSGA. See survey methodology on Slide 10.
11 IBG-25994
71%
55% 47% 51% 50%
41%
68% 65%
41% 47%
41% 39% 34% 36%
57%
11%
29% 43%
22%
41%
47%
11% 22%
12%
11% 22% 26%
15% 18%
25%
17% 14% 5%
9%
4% 6% 16%
10%
37% 24%
10% 11%
8%
9%
13%
0% 1% 5%
19%
5% 5% 4% 3% 9%
18%
27% 24%
44% 37%
5%
Maintain Exposure Increase Decrease No Exposure
41% of respondents want to increase their exposure to Developed Ex-US equities, but one fifth have no exposure to Japan, the largest EAFE weighting
Only 2% of respondents listed increasing high yield defaults as their top concern, but 37% plan to trim exposure
Survey Question: How Do You Plan to Allocate Assets for the First Half of 2018?
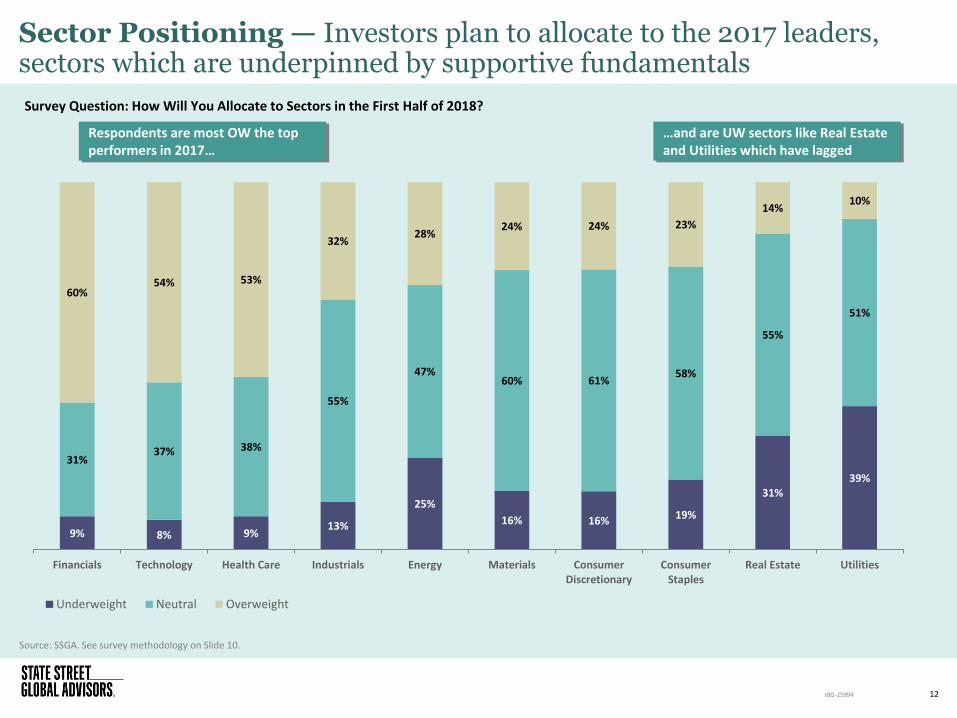
Sector Positioning — Investors plan to allocate to the 2017 leaders, sectors which are underpinned by supportive fundamentals
Source: SSGA. See survey methodology on Slide 10.
12 IBG-25994
9% 8% 9% 13%
25%
16% 16% 19%
31% 39%
31% 37% 38%
55%
47% 60% 61%
58%
55%
51%
60% 54% 53%
32% 28%
24% 24% 23%
14% 10%
Financials Technology Health Care Industrials Energy Materials ConsumerDiscretionary
ConsumerStaples
Real Estate Utilities
Underweight Neutral Overweight
Respondents are most OW the top performers in 2017…
…and are UW sectors like Real Estate and Utilities which have lagged
Survey Question: How Will You Allocate to Sectors in the First Half of 2018?
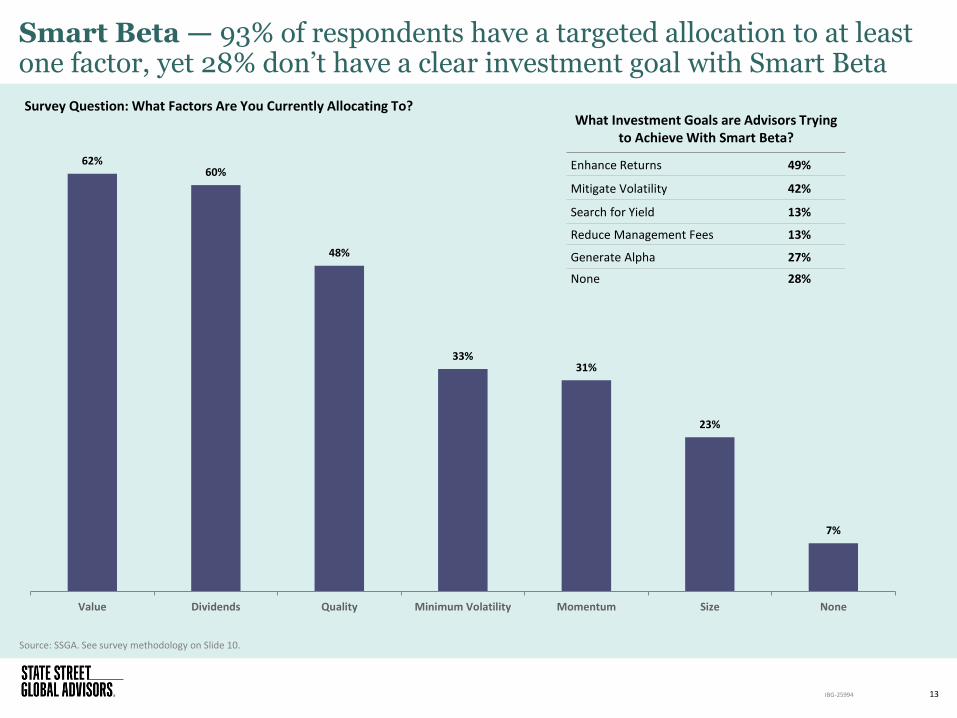
Smart Beta — 93% of respondents have a targeted allocation to at least one factor, yet 28% don’t have a clear investment goal with Smart Beta
Source: SSGA. See survey methodology on Slide 10.
13 IBG-25994
62% 60%
48%
33% 31%
23%
7%
Value Dividends Quality Minimum Volatility Momentum Size None
What Investment Goals are Advisors Trying to Achieve With Smart Beta?
Enhance Returns 49%
Mitigate Volatility 42%
Search for Yield 13%
Reduce Management Fees 13%
Generate Alpha 27%
None 28%
Survey Question: What Factors Are You Currently Allocating To?

Volatility Outlook
14 IBG-25994
29.6% 28.8%
28.1%
24.4%
6.6%
9.5%
5.6%
8.7% 10.1%
14.1%
9.5%
12.6% 13.5%
15.5% 15.9% 15.7%
9.1%
9.4%
8.7%
9.0%
S&P 500 Index MSCI Emerging MarketIndex
MSCI EAFE Index BloombergCommodity Index
90th Percentile Current As of 01/01/2017 10-Year Median 10th Percentile
7.6%
5.1%
6.4%
1.8% 2.3%
2.6%
3.2% 3.2% 3.5% 3.3% 3.3%
3.9%
1.6%
2.4% 2.6%
Bloomberg Barclays USCorporate High Yield Index
Bloomberg Barclays USAggregate Index
Bloomberg Barclays USTreasury Index
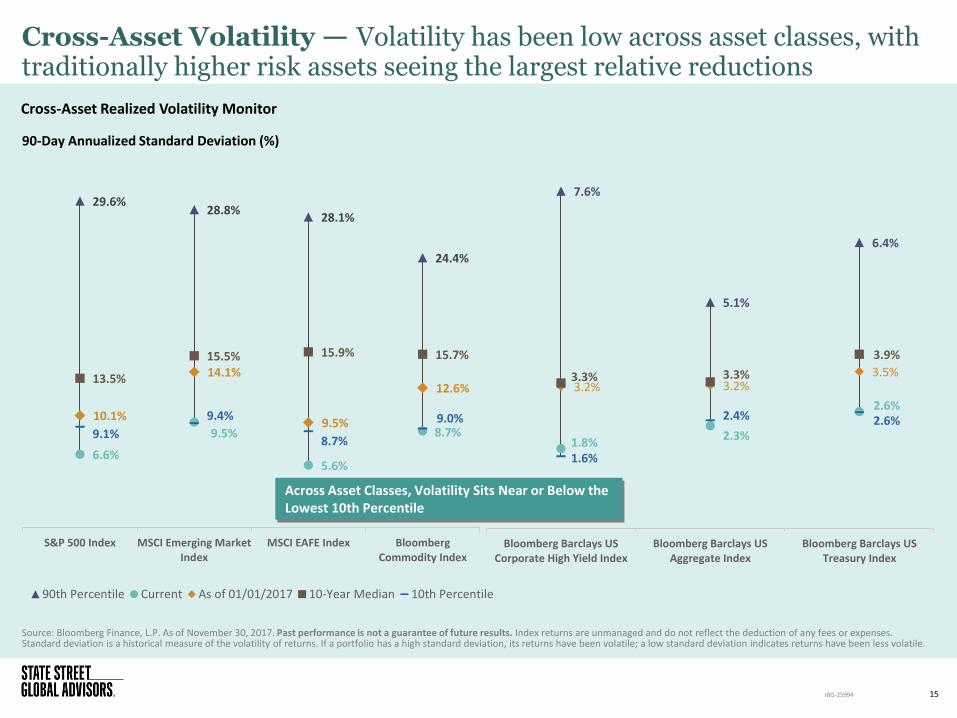
Cross-Asset Volatility — Volatility has been low across asset classes, with traditionally higher risk assets seeing the largest relative reductions
Source: Bloomberg Finance, L.P. As of November 30, 2017. Past performance is not a guarantee of future results. Index returns are unmanaged and do not reflect the deduction of any fees or expenses. Standard deviation is a historical measure of the volatility of returns. If a portfolio has a high standard deviation, its returns have been volatile; a low standard deviation indicates returns have been less volatile.
15 IBG-25994
Cross-Asset Realized Volatility Monitor
90-Day Annualized Standard Deviation (%)
Across Asset Classes, Volatility Sits Near or Below the Lowest 10th Percentile
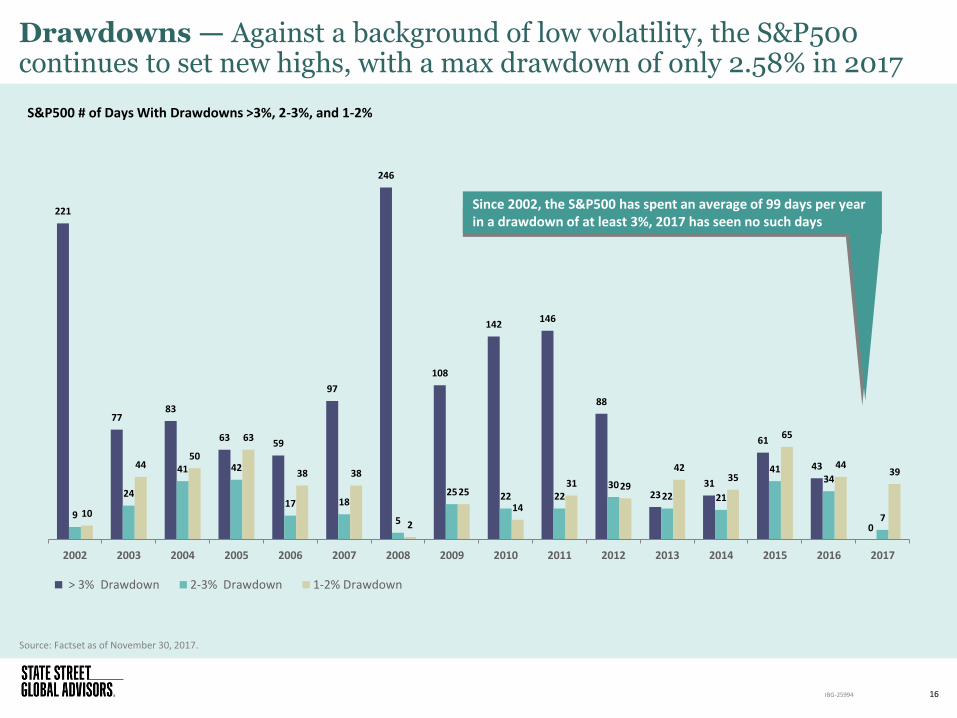
Drawdowns — Against a background of low volatility, the S&P500 continues to set new highs, with a max drawdown of only 2.58% in 2017
Source: Factset as of November 30, 2017.
16 IBG-25994
221
77 83
63 59
97
246
108
142 146
88
23 31
61
43
0 9
24
41 42
17 18
5
25 22 22 30
22 21
41 34
7 10
44 50
63
38 38
2
25
14
31 29
42 35
65
44 39
2002 2003 2004 2005 2006 2007 2008 2009 2010 2011 2012 2013 2014 2015 2016 2017
> 3% Drawdown 2-3% Drawdown 1-2% Drawdown
Since 2002, the S&P500 has spent an average of 99 days per year in a drawdown of at least 3%, 2017 has seen no such days
S&P500 # of Days With Drawdowns >3%, 2-3%, and 1-2%
0.9
1.1
1.3
1.5
1.7
1.9
2.1
2.3
Jan 05 Jan 06 Jan 07 Jan 08 Jan 09 Jan 10 Jan 11 Jan 12 Jan 13 Jan 14 Jan 15 Jan 16 Jan 17
Rat
io o
f 9
5/1
05
Im
plie
d V
ola
tilit
y
2-Month Implied Volatility Ratio (95%/105%)
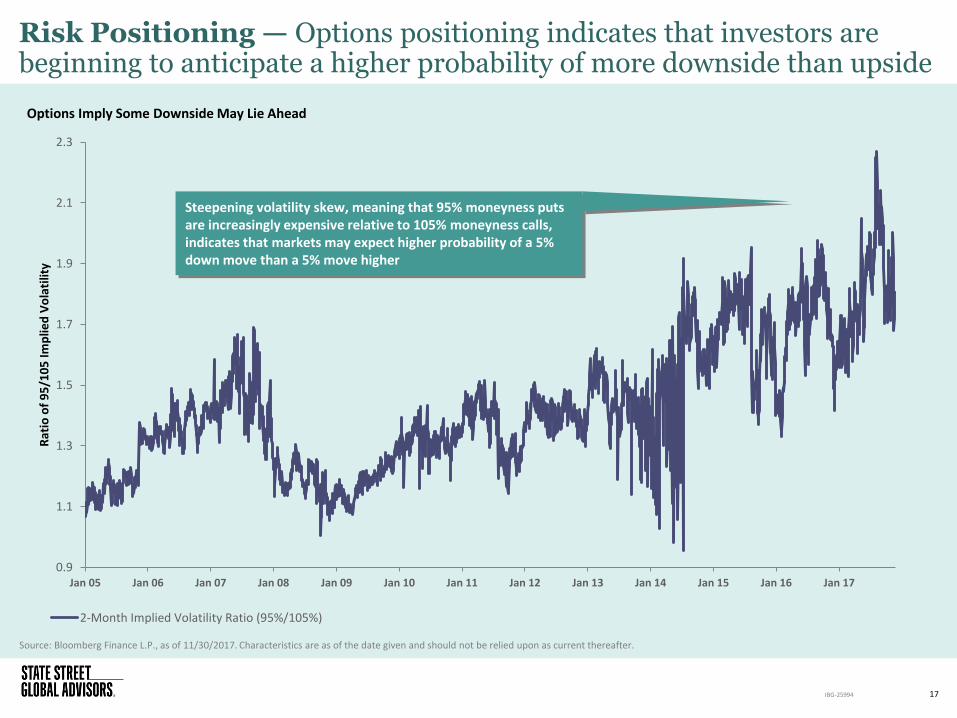
Risk Positioning — Options positioning indicates that investors are beginning to anticipate a higher probability of more downside than upside
Source: Bloomberg Finance L.P., as of 11/30/2017. Characteristics are as of the date given and should not be relied upon as current thereafter.
17 IBG-25994
Steepening volatility skew, meaning that 95% moneyness puts are increasingly expensive relative to 105% moneyness calls, indicates that markets may expect higher probability of a 5% down move than a 5% move higher
Options Imply Some Downside May Lie Ahead

Equity Market Outlook
18 IBG-25994

US Valuations — By most metrics, equities appear stretched but appear fairly valued on a relative basis to bonds, a segment also in a bull market
Source: Bloomberg Finance LP as of November 16, 2017.
19 IBG-25994
-600
-400
-200
0
200
400
600
800
Dec-92 Nov-94 Oct-96 Sep-98 Aug-00 Jul-02 Jun-04 May-06 Apr-08 Mar-10 Feb-12 Jan-14 Dec-15 Nov-17
Bas
is P
oin
ts
Earnings Yield Spread to US 10 Yr Earnings Yield Spread to IG Corporate Bond Yields Median Spread to 10 Yr Median Spread to IG Corp
Price-to-Book (P/B) Price to Earnings (P/E) 1 Year Forward Consensus
P/E Enterprise Value/EBITDA
(EV/EBITDA) Price to Sales (P/S)
Price/Cash Flow (P/CF)
Current 3.19 21.82 19.42 13.08 2.18 14.05
25 Year Median 2.77 18.57 16.51 10.79 1.51 10.83
Current Percentile 79% 74% 80% 93% 96% 80%
15% 18% 18% 21%
44% 30%
% Above/Below 25 Year Median
The Fed Model shows the relationship between forward earnings yield and 10Y treasury yields, in general the wider the spread, the cheaper stocks are relative to bonds
S&P 500 Valuation Metrics
Fed Model
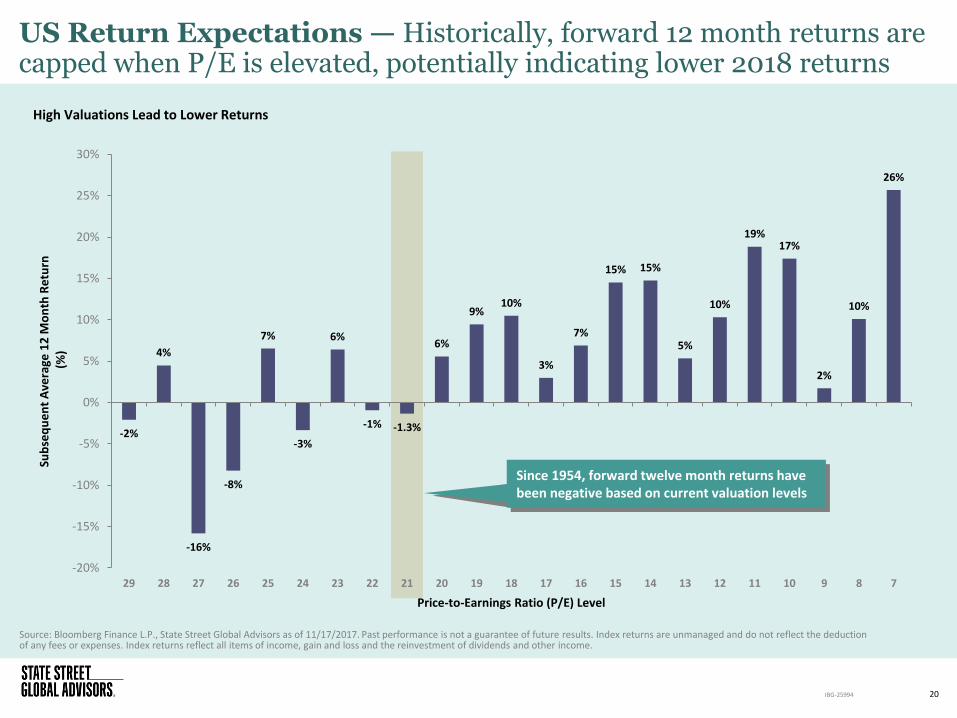
US Return Expectations — Historically, forward 12 month returns are capped when P/E is elevated, potentially indicating lower 2018 returns
Source: Bloomberg Finance L.P., State Street Global Advisors as of 11/17/2017. Past performance is not a guarantee of future results. Index returns are unmanaged and do not reflect the deduction of any fees or expenses. Index returns reflect all items of income, gain and loss and the reinvestment of dividends and other income.
20 IBG-25994
-2%
4%
-16%
-8%
7%
-3%
6%
-1% -1.3%
6%
9% 10%
3%
7%
15% 15%
5%
10%
19% 17%
2%
10%
26%
-20%
-15%
-10%
-5%
0%
5%
10%
15%
20%
25%
30%
29 28 27 26 25 24 23 22 21 20 19 18 17 16 15 14 13 12 11 10 9 8 7
Sub
seq
ue
nt
Ave
rage
12
Mo
nth
Re
turn
(
%)
Price-to-Earnings Ratio (P/E) Level
Since 1954, forward twelve month returns have been negative based on current valuation levels
High Valuations Lead to Lower Returns
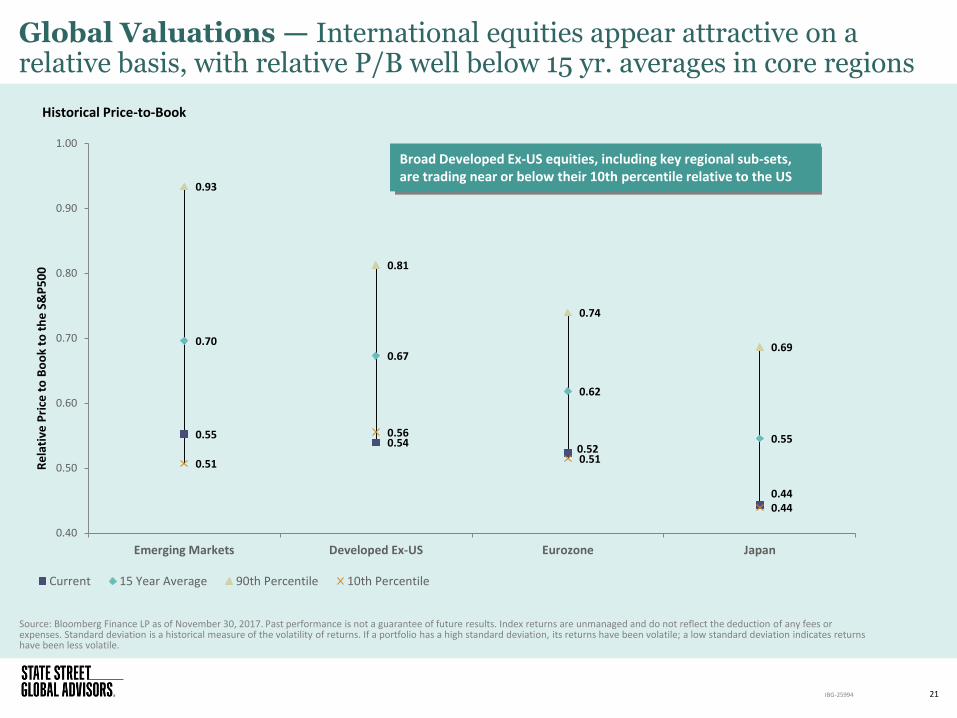
Global Valuations — International equities appear attractive on a relative basis, with relative P/B well below 15 yr. averages in core regions
Source: Bloomberg Finance LP as of November 30, 2017. Past performance is not a guarantee of future results. Index returns are unmanaged and do not reflect the deduction of any fees or expenses. Standard deviation is a historical measure of the volatility of returns. If a portfolio has a high standard deviation, its returns have been volatile; a low standard deviation indicates returns have been less volatile.
21 IBG-25994
0.55 0.54
0.52
0.44
0.70 0.67
0.62
0.55
0.93
0.81
0.74
0.69
0.51
0.56
0.51
0.44
0.40
0.50
0.60
0.70
0.80
0.90
1.00
Emerging Markets Developed Ex-US Eurozone Japan
Re
lati
ve P
rice
to
Bo
ok
to t
he
S&
P5
00
Current 15 Year Average 90th Percentile 10th Percentile
Broad Developed Ex-US equities, including key regional sub-sets, are trading near or below their 10th percentile relative to the US
Historical Price-to-Book
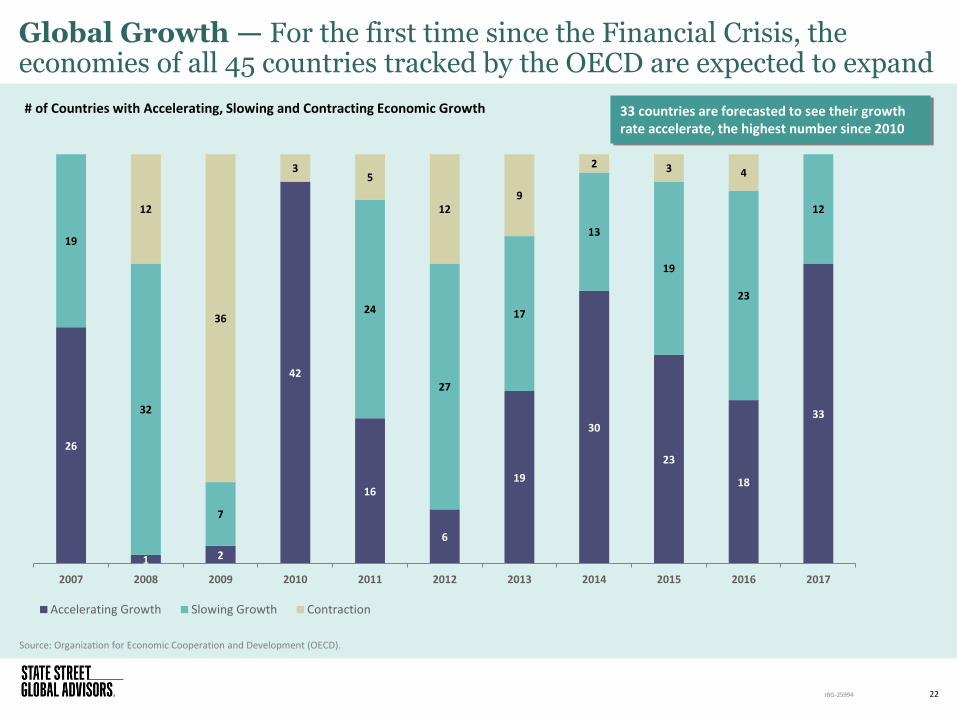
Global Growth — For the first time since the Financial Crisis, the economies of all 45 countries tracked by the OECD are expected to expand
Source: Organization for Economic Cooperation and Development (OECD).
22 IBG-25994
26
1 2
42
16
6
19
30
23
18
33
19
32
7
24
27
17
13
19
23
12 12
36
3 5
12 9
2 3 4
2007 2008 2009 2010 2011 2012 2013 2014 2015 2016 2017
Accelerating Growth Slowing Growth Contraction
33 countries are forecasted to see their growth rate accelerate, the highest number since 2010
# of Countries with Accelerating, Slowing and Contracting Economic Growth
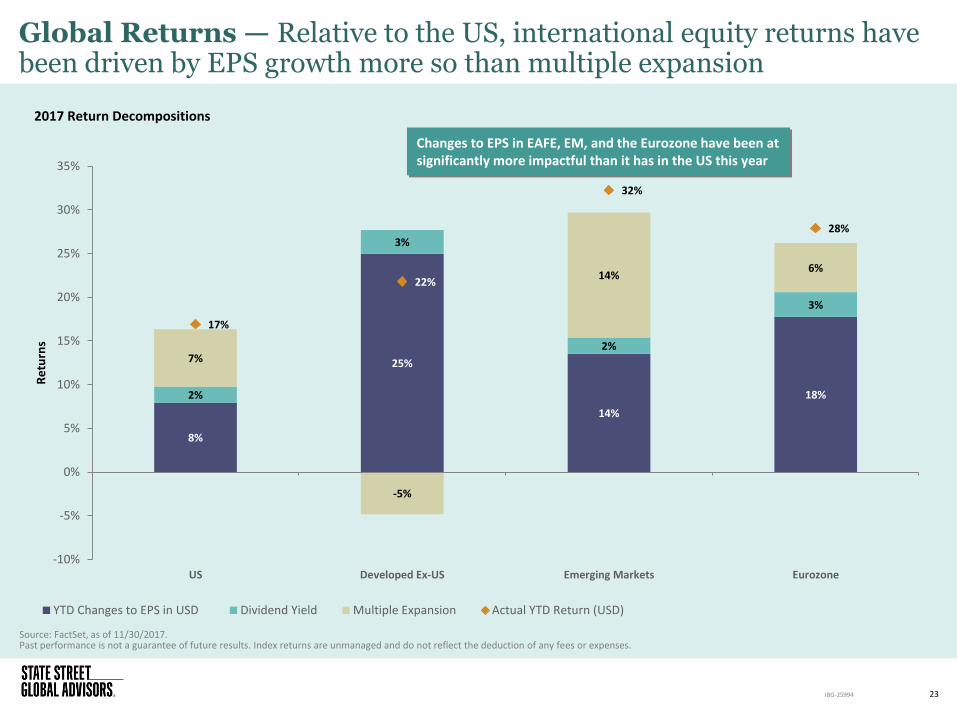
Global Returns — Relative to the US, international equity returns have been driven by EPS growth more so than multiple expansion
Source: FactSet, as of 11/30/2017. Past performance is not a guarantee of future results. Index returns are unmanaged and do not reflect the deduction of any fees or expenses.
23 IBG-25994
Changes to EPS in EAFE, EM, and the Eurozone have been at significantly more impactful than it has in the US this year
8%
25%
14%
18% 2%
3%
2%
3%
7%
-5%
14% 6%
17%
22%
32%
28%
-10%
-5%
0%
5%
10%
15%
20%
25%
30%
35%
US Developed Ex-US Emerging Markets Eurozone
Re
turn
s
YTD Changes to EPS in USD Dividend Yield Multiple Expansion Actual YTD Return (USD)
2017 Return Decompositions
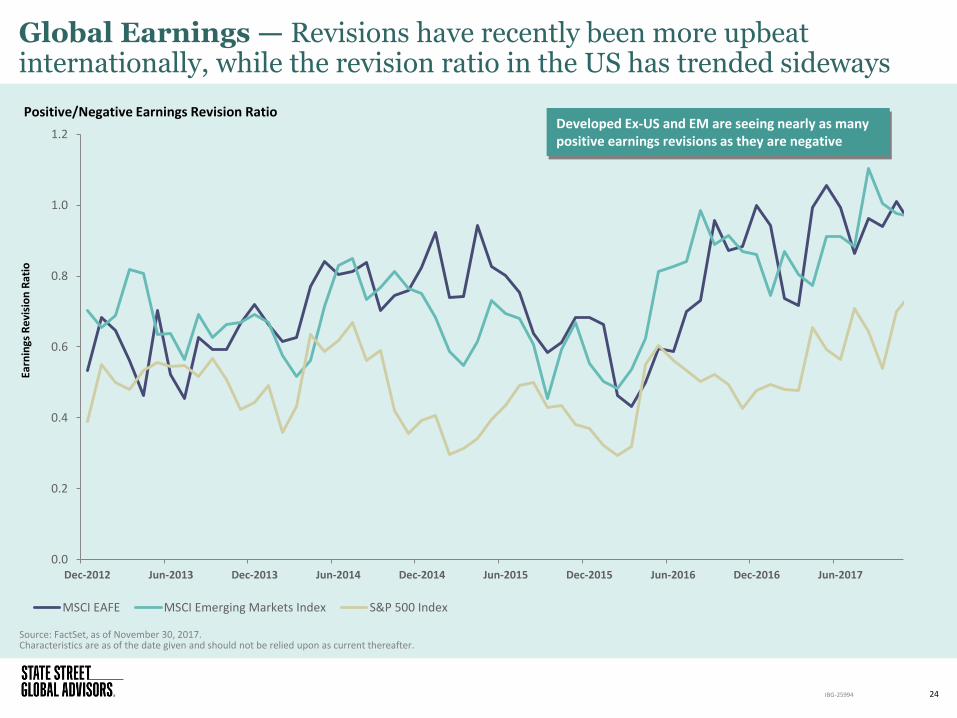
Global Earnings — Revisions have recently been more upbeat internationally, while the revision ratio in the US has trended sideways
Source: FactSet, as of November 30, 2017. Characteristics are as of the date given and should not be relied upon as current thereafter.
24 IBG-25994
0.0
0.2
0.4
0.6
0.8
1.0
1.2
Dec-2012 Jun-2013 Dec-2013 Jun-2014 Dec-2014 Jun-2015 Dec-2015 Jun-2016 Dec-2016 Jun-2017
Earn
ings
Re
visi
on
Rat
io
MSCI EAFE MSCI Emerging Markets Index S&P 500 Index
Developed Ex-US and EM are seeing nearly as many positive earnings revisions as they are negative
Positive/Negative Earnings Revision Ratio
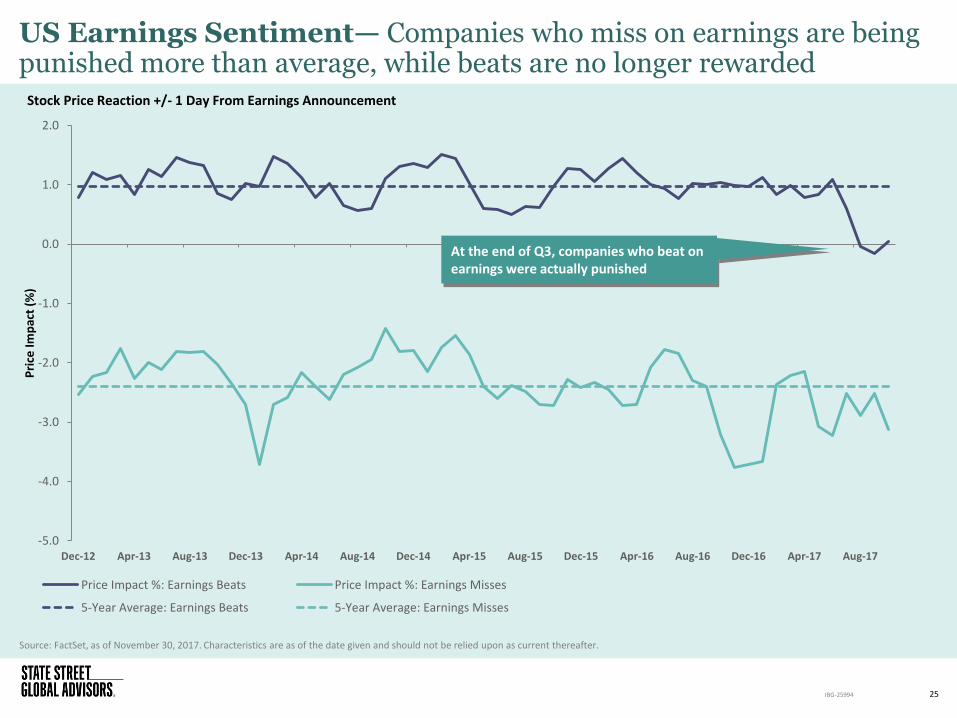
US Earnings Sentiment— Companies who miss on earnings are being punished more than average, while beats are no longer rewarded
Source: FactSet, as of November 30, 2017. Characteristics are as of the date given and should not be relied upon as current thereafter.
25 IBG-25994
-5.0
-4.0
-3.0
-2.0
-1.0
0.0
1.0
2.0
Dec-12 Apr-13 Aug-13 Dec-13 Apr-14 Aug-14 Dec-14 Apr-15 Aug-15 Dec-15 Apr-16 Aug-16 Dec-16 Apr-17 Aug-17
Pri
ce Im
pac
t (%
)
Price Impact %: Earnings Beats Price Impact %: Earnings Misses
5-Year Average: Earnings Beats 5-Year Average: Earnings Misses
At the end of Q3, companies who beat on earnings were actually punished
Stock Price Reaction +/- 1 Day From Earnings Announcement
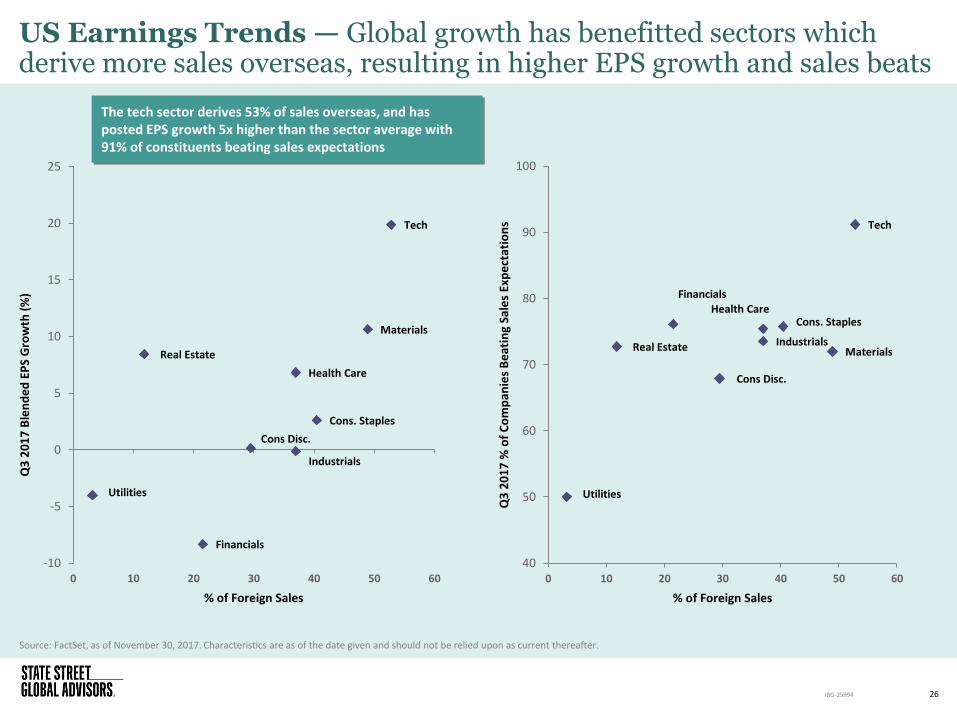
US Earnings Trends — Global growth has benefitted sectors which derive more sales overseas, resulting in higher EPS growth and sales beats
Source: FactSet, as of November 30, 2017. Characteristics are as of the date given and should not be relied upon as current thereafter.
26 IBG-25994
Tech
Financials
Materials
Real Estate
Industrials
Health Care
Cons. Staples
Utilities
Cons Disc.
-10
-5
0
5
10
15
20
25
0 10 20 30 40 50 60
Q3
20
17
Ble
nd
ed
EP
S G
row
th (
%)
% of Foreign Sales
Tech
Financials
Materials Real Estate Industrials
Health Care Cons. Staples
Utilities
Cons Disc.
40
50
60
70
80
90
100
0 10 20 30 40 50 60
Q3
20
17
% o
f C
om
pan
ies
Be
atin
g Sa
les
Exp
ect
atio
ns
% of Foreign Sales
The tech sector derives 53% of sales overseas, and has posted EPS growth 5x higher than the sector average with 91% of constituents beating sales expectations
3.3
5.4 5.4 5.5
4.7
2.9
4.0
2.5
2.0 2.1
1.5
2.6
4.4
3.3
3.9
3.1 3.5
2.3 2.2 1.7
3.3
5.8 5.4 5.5
4.7
4.0
5.4
3.6 3.1
2.5 2.4
1.6
2.8
1.8
2.5
1.6 1.5
2.2
1.4 1.5 1.2
0.6
0.0
1.0
2.0
3.0
4.0
5.0
6.0
7.0
S&P 500 Index ConsumerStaples
ConsumerDiscretionary
InformationTechnology
Industrials Materials Health Care Telecom Energy Utilities Financials
Pri
ce t
o B
oo
k R
atio
(P
/B)
Current 15 Year Avg. 15 Year High 15 Year Low
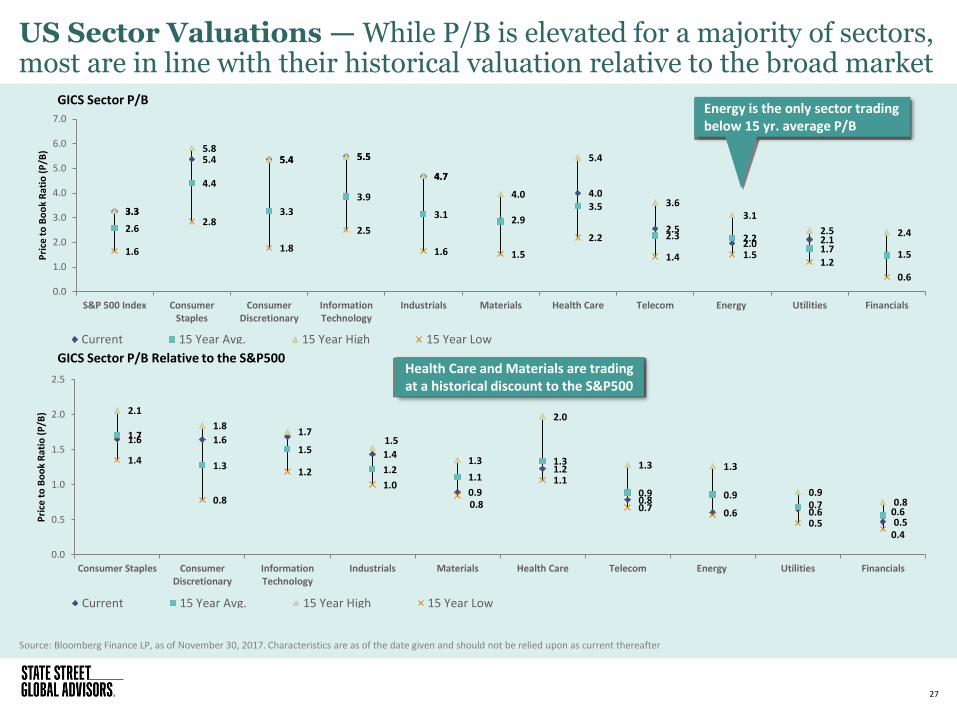
US Sector Valuations — While P/B is elevated for a majority of sectors, most are in line with their historical valuation relative to the broad market
Source: Bloomberg Finance LP, as of November 30, 2017. Characteristics are as of the date given and should not be relied upon as current thereafter
27
1.6 1.6 1.7
1.4
0.9
1.2
0.8 0.6 0.6
0.5
1.7
1.3
1.5
1.2 1.1
1.3
0.9 0.9 0.7
0.6
2.1
1.8
1.5
1.3
2.0
1.3 1.3
0.9 0.8
1.4
0.8
1.2 1.0
0.8
1.1
0.7
0.5 0.4
0.0
0.5
1.0
1.5
2.0
2.5
Consumer Staples ConsumerDiscretionary
InformationTechnology
Industrials Materials Health Care Telecom Energy Utilities Financials
Pri
ce t
o B
oo
k R
atio
(P
/B)
Current 15 Year Avg. 15 Year High 15 Year Low
GICS Sector P/B
GICS Sector P/B Relative to the S&P500 Health Care and Materials are trading at a historical discount to the S&P500
Energy is the only sector trading below 15 yr. average P/B

Bond Market Outlook
28 IBG-25994
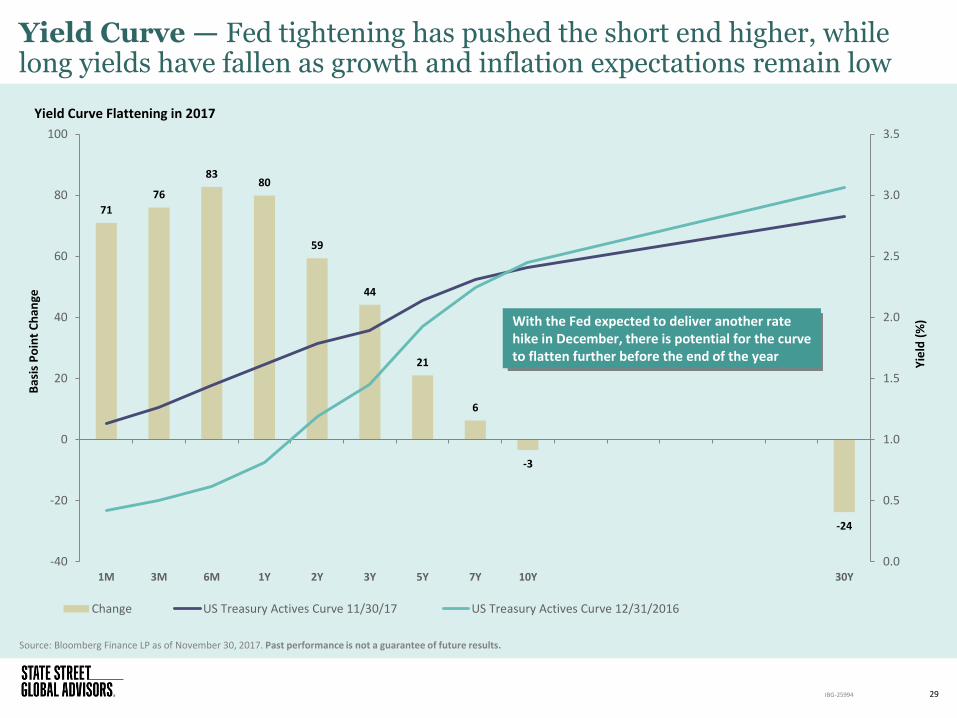
Yield Curve — Fed tightening has pushed the short end higher, while long yields have fallen as growth and inflation expectations remain low
Source: Bloomberg Finance LP as of November 30, 2017. Past performance is not a guarantee of future results.
29 IBG-25994
71
76
83 80
59
44
21
6
-3
-24
0.0
0.5
1.0
1.5
2.0
2.5
3.0
3.5
-40
-20
0
20
40
60
80
100
1M 3M 6M 1Y 2Y 3Y 5Y 7Y 10Y 30Y
Yie
ld (
%)
Bas
is P
oin
t C
han
ge
Change US Treasury Actives Curve 11/30/17 US Treasury Actives Curve 12/31/2016
With the Fed expected to deliver another rate hike in December, there is potential for the curve to flatten further before the end of the year
Yield Curve Flattening in 2017
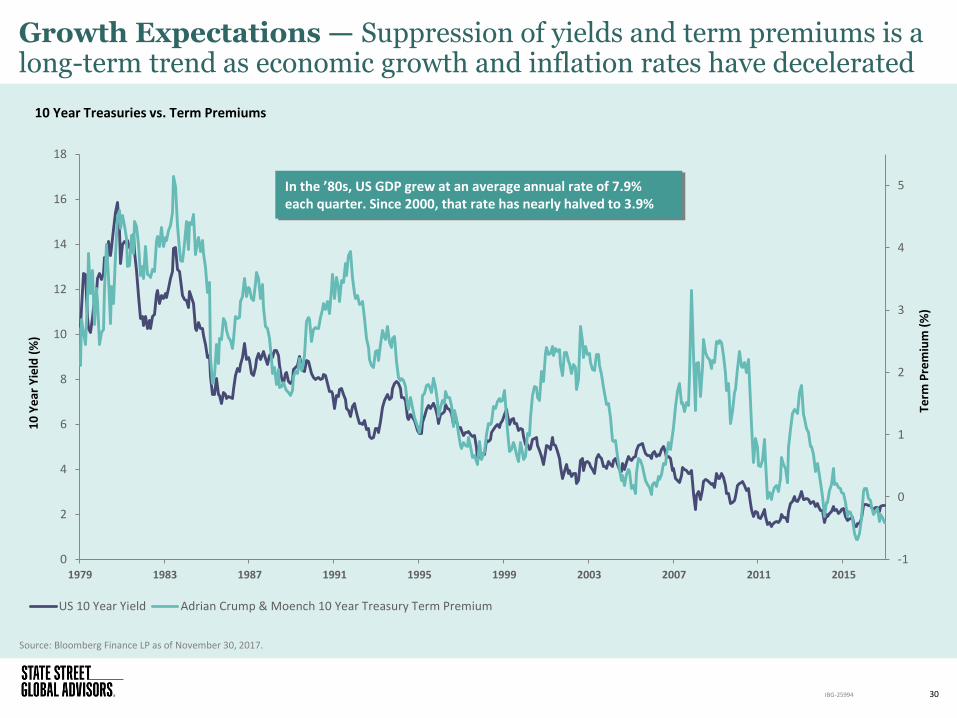
Growth Expectations — Suppression of yields and term premiums is a long-term trend as economic growth and inflation rates have decelerated
Source: Bloomberg Finance LP as of November 30, 2017.
30 IBG-25994
-1
0
1
2
3
4
5
0
2
4
6
8
10
12
14
16
18
1979 1983 1987 1991 1995 1999 2003 2007 2011 2015
Term
Pre
miu
m (
%)
10
Ye
ar Y
ield
(%
)
US 10 Year Yield Adrian Crump & Moench 10 Year Treasury Term Premium
In the ’80s, US GDP grew at an average annual rate of 7.9% each quarter. Since 2000, that rate has nearly halved to 3.9%
10 Year Treasuries vs. Term Premiums
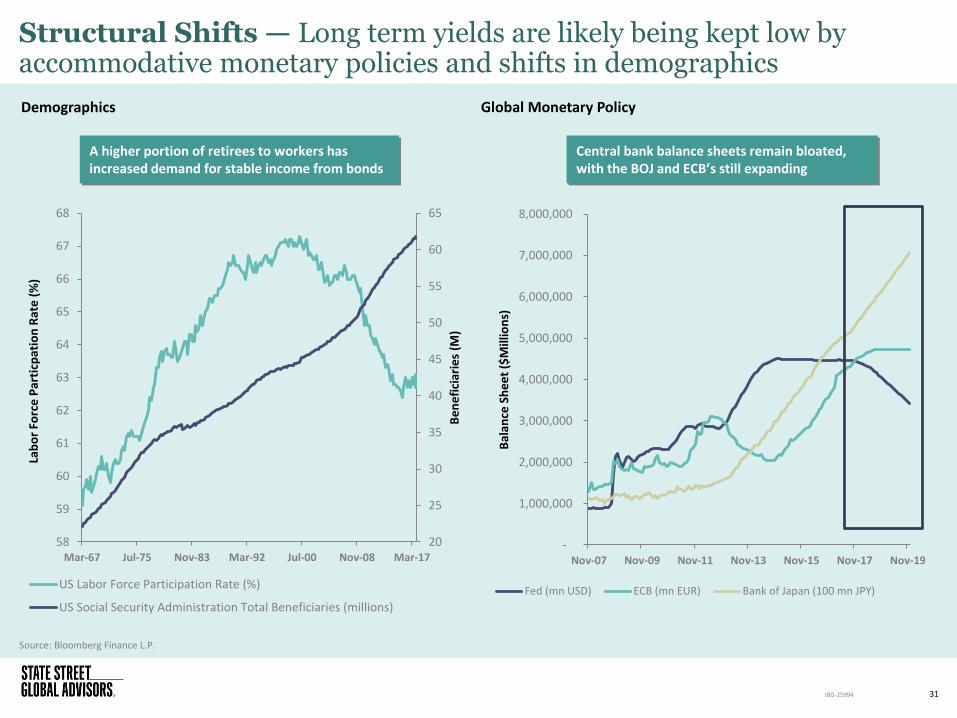
Structural Shifts — Long term yields are likely being kept low by accommodative monetary policies and shifts in demographics
Demographics
Source: Bloomberg Finance L.P.
31 IBG-25994
20
25
30
35
40
45
50
55
60
65
58
59
60
61
62
63
64
65
66
67
68
Mar-67 Jul-75 Nov-83 Mar-92 Jul-00 Nov-08 Mar-17
Be
ne
fici
arie
s (M
)
Lab
or
Forc
e P
arti
cpat
ion
Rat
e (
%)
US Labor Force Participation Rate (%)
US Social Security Administration Total Beneficiaries (millions)
-
1,000,000
2,000,000
3,000,000
4,000,000
5,000,000
6,000,000
7,000,000
8,000,000
Nov-07 Nov-09 Nov-11 Nov-13 Nov-15 Nov-17 Nov-19
Bal
ance
Sh
ee
t ($
Mill
ion
s)
Fed (mn USD) ECB (mn EUR) Bank of Japan (100 mn JPY)
Global Monetary Policy
Central bank balance sheets remain bloated, with the BOJ and ECB’s still expanding
A higher portion of retirees to workers has increased demand for stable income from bonds
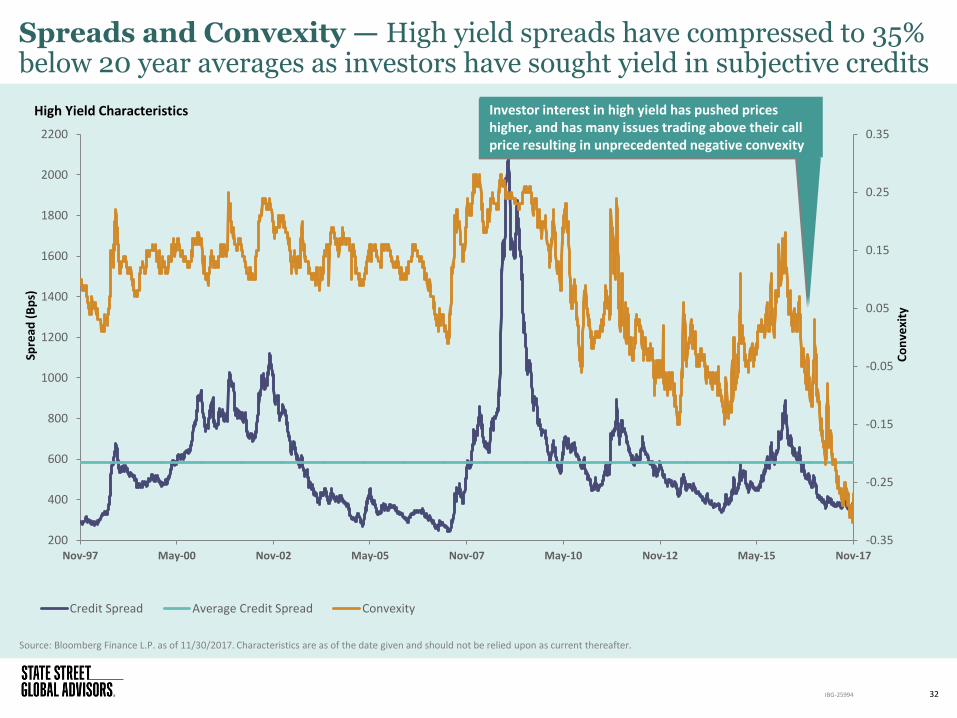
Spreads and Convexity — High yield spreads have compressed to 35% below 20 year averages as investors have sought yield in subjective credits
Source: Bloomberg Finance L.P. as of 11/30/2017. Characteristics are as of the date given and should not be relied upon as current thereafter.
32 IBG-25994
-0.35
-0.25
-0.15
-0.05
0.05
0.15
0.25
0.35
200
400
600
800
1000
1200
1400
1600
1800
2000
2200
Nov-97 May-00 Nov-02 May-05 Nov-07 May-10 Nov-12 May-15 Nov-17
Co
nve
xity
Spre
ad (
Bp
s)
Credit Spread Average Credit Spread Convexity
Investor interest in high yield has pushed prices higher, and has many issues trading above their call price resulting in unprecedented negative convexity
High Yield Characteristics
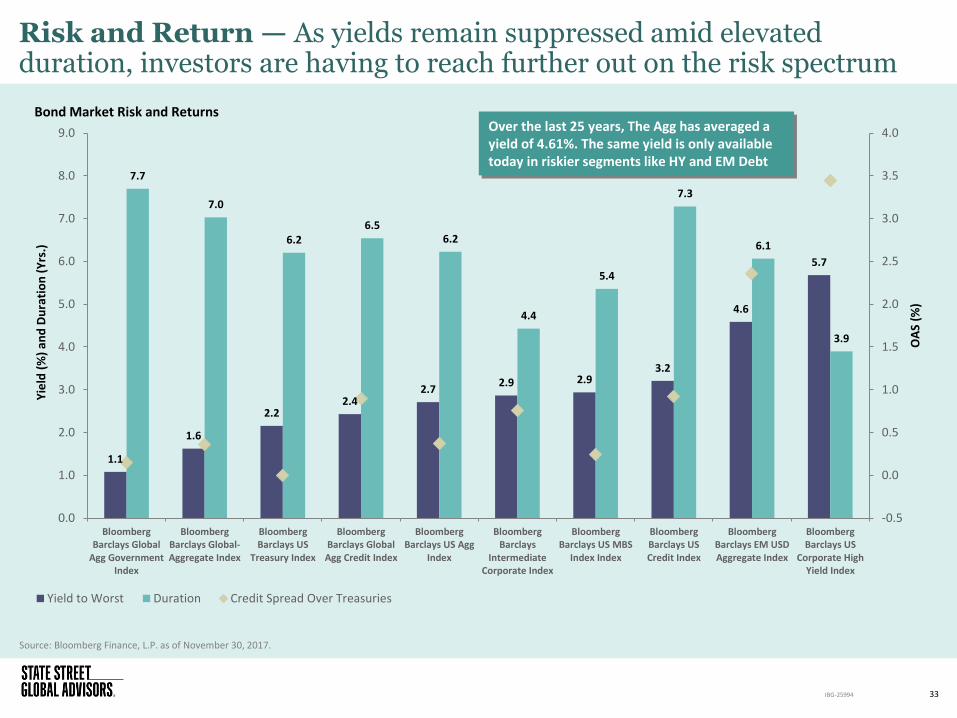
Risk and Return — As yields remain suppressed amid elevated duration, investors are having to reach further out on the risk spectrum
Source: Bloomberg Finance, L.P. as of November 30, 2017.
33 IBG-25994
1.1
1.6
2.2 2.4
2.7 2.9 2.9
3.2
4.6
5.7
7.7
7.0
6.2 6.5
6.2
4.4
5.4
7.3
6.1
3.9
-0.5
0.0
0.5
1.0
1.5
2.0
2.5
3.0
3.5
4.0
0.0
1.0
2.0
3.0
4.0
5.0
6.0
7.0
8.0
9.0
BloombergBarclays Global
Agg GovernmentIndex
BloombergBarclays Global-Aggregate Index
BloombergBarclays US
Treasury Index
BloombergBarclays GlobalAgg Credit Index
BloombergBarclays US Agg
Index
BloombergBarclays
IntermediateCorporate Index
BloombergBarclays US MBS
Index Index
BloombergBarclays USCredit Index
BloombergBarclays EM USDAggregate Index
BloombergBarclays US
Corporate HighYield Index
OA
S (%
)
Yie
ld (
%)
and
Du
rati
on
(Y
rs.)
Yield to Worst Duration Credit Spread Over Treasuries
Over the last 25 years, The Agg has averaged a yield of 4.61%. The same yield is only available today in riskier segments like HY and EM Debt
Bond Market Risk and Returns

Appendix A: Asset Class Forecasts
34 IBG-25994
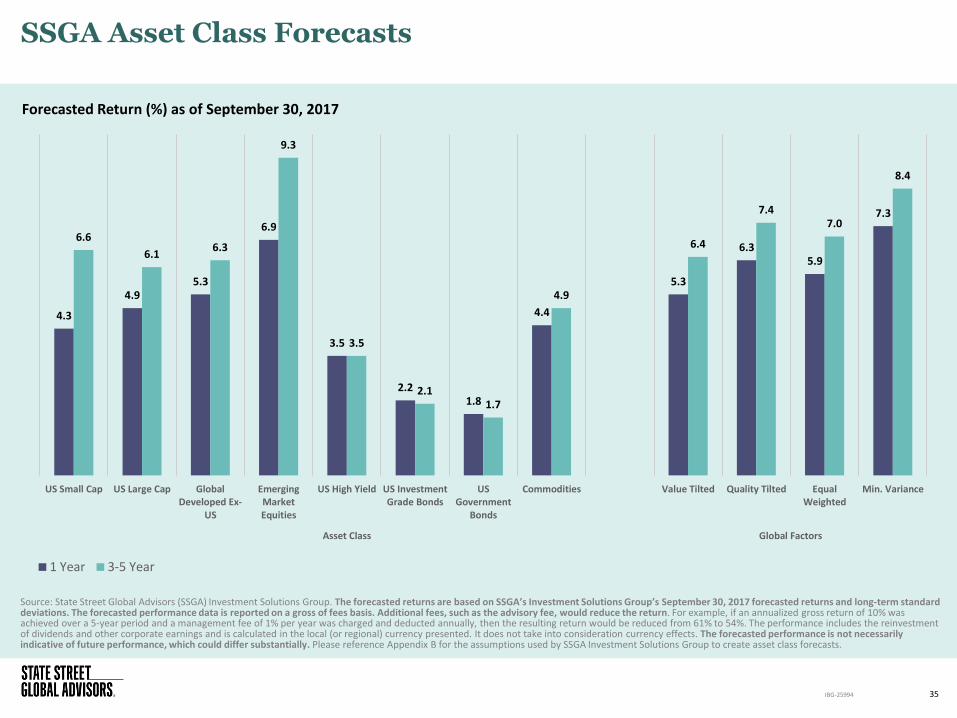
SSGA Asset Class Forecasts
Source: State Street Global Advisors (SSGA) Investment Solutions Group. The forecasted returns are based on SSGA’s Investment Solutions Group’s September 30, 2017 forecasted returns and long-term standard deviations. The forecasted performance data is reported on a gross of fees basis. Additional fees, such as the advisory fee, would reduce the return. For example, if an annualized gross return of 10% was achieved over a 5-year period and a management fee of 1% per year was charged and deducted annually, then the resulting return would be reduced from 61% to 54%. The performance includes the reinvestment of dividends and other corporate earnings and is calculated in the local (or regional) currency presented. It does not take into consideration currency effects. The forecasted performance is not necessarily indicative of future performance, which could differ substantially. Please reference Appendix B for the assumptions used by SSGA Investment Solutions Group to create asset class forecasts.
35
Forecasted Return (%) as of September 30, 2017
IBG-25994
4.3
4.9 5.3
6.9
3.5
2.2 1.8
4.4
5.3
6.3 5.9
7.3
6.6
6.1 6.3
9.3
3.5
2.1 1.7
4.9
6.4
7.4 7.0
8.4
US Small Cap US Large Cap GlobalDeveloped Ex-
US
EmergingMarketEquities
US High Yield US InvestmentGrade Bonds
USGovernment
Bonds
Commodities Value Tilted Quality Tilted EqualWeighted
Min. Variance
Asset Class Global Factors
1 Year 3-5 Year
Asset Class Forecast Assumptions
36 IBG-25994
Forecast Assumptions
For Fixed Income: Our return forecasts for fixed income derive from current yield conditions together with expectations as to how real and nominal yield curves could evolve relative to historical averages. For corporate bonds, we also analyze credit spreads and their term structures, with separate assessments of investment-grade and high-yield bonds.
For Equities: Our long-term equity forecasts begin with expectations for developed market large capitalization stocks. The foundation for these forecasts are estimates of real return potential, derived from current dividend yields, forecast real earnings growth rates, and potential for expansion or contraction of valuation multiples. Our forecasting method incorporates long run estimates of potential economic growth based on forecast labor and capital inputs to estimate real earning growth.
For Factor Returns: Over a one to three-year forecast horizon, we look to see how cheap each factor is relative to its own history. Specifically, we focus on book/price spreads for each factor and relate that to their subsequent returns. We find that valuation ratios are useful for forecasting market returns.
For Commodities: Our long-term commodity forecast is based on the level of world GDP, as a proxy for consumption demand, as well as on our inflation outlook. Additional factors affecting the returns to a commodities investor include how commodities are held (e.g., physically, synthetically, or via futures) and the various construction methodologies of different commodity benchmarks.

Appendix B: Definitions
37 IBG-25994
Definitions
S&P500 Index: A popular benchmark for US large-cap equities that includes 500 companies from leading industries and captures approximately 80% coverage of available market capitalization.
CBOE VIX Index: The Chicago Board Options Exchange (CBOE) Volatility Index shows the market’s expectation of 30-day volatility. It is constructed using the implied volatilities of a wide range of S&P 500 index options.
CBOE 3-Month Volatility Index: The Index is designed to be a constant measure of 3-month implied volatility of the S&P 500® (SPX) Index options
Implied Volatility: A way of estimating volatility of a security’s price based on a number of predictive variables. Implied volatility rises when the market is falling when investors believe that the asset’s price will decline over time, and it falls when the market is rising when investors believe that the security’s price will rise over time. This is due to the common belief that bearish markets are riskier than bullish markets.
MSCI Emerging Market Index: The MSCI Emerging Markets Index captures large and mid-cap representation across 23 emerging markets countries. With 834 constituents, the index covers approximately 85% of the free float-adjusted market capitalization in each country.
Russell 2000 Index: A benchmark that measures the performance of the small-cap segment of the US equity universe.
MSCI EAFE Index: An equities benchmark that captures large- and mid-cap representation across developed market countries around the world, excluding the US and Canada.
Bloomberg US High Yield Index: The Bloomberg USD High Yield Corporate Bond Index is a rules-based, market-value weighted index engineered to measure publicly issued non-investment grade USD fixed-rate, taxable, corporate bonds. To be included in the index a security must have a minimum par amount of 250MM.
Bloomberg Barclays US Aggregate Index: A benchmark that provides a measure of the performance of the US dollar denominated investment grade bond market, which includes investment grade government bonds, investment grade corporate bonds, mortgage pass through securities, commercial mortgage backed securities and asset backed securities that are publicly for sale in the US.
Bloomberg US Treasury Index: The Bloomberg US Treasury Bond Index is a rules-based, market-value weighted index engineered to measure the performance and characteristics of fixed rate coupon US Treasuries which have a maturity greater than 12 months. To be included in the index a security must have a minimum par amount of 1,000MM.
Bloomberg Commodity Index: Bloomberg Commodity Index (BCOM) is calculated on an excess return basis and reflects commodity futures price movements. The index rebalances annually weighted 2/3 by trading volume and 1/3 by world production and weight-caps are applied at the commodity, sector and group level for diversification.
MSCI Europe Index: The MSCI Europe Index is a free-float weighted equity index designed to measure the equity market performance of the developed markets in Europe.
Euro STOXX 50 Index: Europe’s leading blue-chip index for the Eurozone, provides a blue-chip representation of super-sector leaders in the Eurozone. The index covers 50 stocks from 12 Eurozone countries.
MSCI Japan Index The MSCI Europe Index is a free-float weighted equity index designed to measure the equity market performance of the developed markets in Japan.
Bloomberg Dollar Spot Index: The Bloomberg Dollar Spot Index tracks the performance of a basket of ten leading global currencies versus the U.S. Dollar. Each currency in the basket and their weight is determined annually based on their share of international trade and FX liquidity.
Bloomberg Barclays Global Aggregate Bond Index: A benchmark that provides a broad-based measure of the global investment-grade fixed income markets. The three major components of this index are the U.S. Aggregate, the Pan-European Aggregate, and the Asian-Pacific Aggregate Indices. The index also includes Eurodollar and Euro-Yen corporate bonds, Canadian government, agency and corporate securities, and USD investment-grade 144A securities.
State Street Confidence Indexes: Measures investor confidence or risk appetite quantitatively by analyzing the actual buying and selling patterns of institutional investors. The index assigns a precise meaning to changes in investor risk appetite: the greater the percentage allocation to equities, the higher risk appetite or confidence. A reading of 100 is neutral; it is the level at which investors are neither increasing nor decreasing their long-term allocations to risky assets. The results shown represent current results generated by State Street Investor Confidence Index. The results shown were achieved by means of a mathematical formula in addition to transactional market data, and are not indicative of actual future results which could differ substantially.
BofA Merrill Lynch US High Yield Master II Index: The BofA Merrill Lynch US High Yield Index tracks the performance of US dollar denominated below investment grade corporate debt publicly issued in the US domestic market. Qualifying securities must have a below investment grade rating (based on an average of Moody’s, S&P and Fitch).
Yield to worst: Yield to worst is an estimate of the lowest yield that you can expect to earn from a bond when holding to maturity, absent a default. It is a measure that is used in place of yield to maturity with callable bonds.
Cross-Sectional Dispersion: The Cross-Sectional Dispersion is defined as the standard deviation of returns of securities over a period.
S&P 500 Equal Weighted Index: The S&P 500® Equal Weight Index (EWI) is the equal-weight version of the widely-used S&P 500. The index includes the same constituents as the capitalization weighted S&P 500, but each company in the S&P 500 EWI is allocated a fixed weight - or 0.2% of the index total at each quarterly rebalance.
38 IBG-25994

Definitions
MSCI World Index: The MSCI World Index, which is part of The Modern Index Strategy, is a broad global equity benchmark that represents large and mid-cap equity performance across 23 developed markets countries. It covers approximately 85% of the free float-adjusted market capitalization in each country and MSCI World benchmark does not offer exposure to emerging markets.
Earnings Surprise: An earnings surprise occurs when a company's reported results are above or below analysts' expectations.
Minimum Volatility Factor: A category of stocks that are characterized by relatively less movement in share price than many other equities.
MSCI World Minimum Volatility Index: The MSCI World Minimum Volatility (USD) Index aims to reflect the performance characteristics of a minimum variance strategy applied to the MSCI large and mid cap equity universe across 23 Developed Markets countries*. The index is calculated by optimizing the MSCI World Index, its parent index, for the lowest absolute risk (within a given set of constraints). Historically, the index has shown lower beta and volatility characteristics relative to the MSCI World Index.
MSCI World Enhanced Value Index: The MSCI World Enhanced Value Index is based on the MSCI World Index, which includes large and mid cap stocks across 23 Developed Markets (DM) countries*. The index is designed to represent the performance of securities that exhibit higher value characteristics relative to their peers within the corresponding GICS® sector.
MSCI World Quality Index: The MSCI World Quality Index is based on MSCI World, its parent index, which includes large and mid cap stocks across 23 Developed Market (DM) countries*. The index aims to capture the performance of quality growth stocks by identifying stocks with high quality scores based on three main fundamental variables: high return on equity (ROE), stable year-over-year earnings growth and low financial leverage. The MSCI Quality Indexes complement existing MSCI Factor Indexes and can provide an effective diversification role in a portfolio of factor strategies.
MSCI World Small Cap Index: The MSCI World Small Cap Index is designed to capture small cap representation across 23 Developed Markets (DM) countries
MSCI World High Dividend Yield Index: The MSCI World High Dividend Yield Index is based on the MSCI World Index, its parent index, and includes large and mid cap stocks across 23 Developed Markets (DM) countries*. The index is designed to reflect the performance of equities in the parent index (excluding REITs) with higher dividend income and quality characteristics than average dividend yields that are both sustainable and persistent. The index also applies quality screens and reviews 12-month past performance to omit stocks with potentially deteriorating fundamentals that could force them to cut or reduce dividends.
MSCI USA Minimum Volatility Index: The MSCI USA Minimum Volatility (USD) Index aims to reflect the performance characteristics of a minimum variance strategy applied to the MSCI large and mid cap equity universe. The index is calculated by optimizing the MSCI USA Index, its parent index, for the lowest absolute risk (within a given set of constraints). Historically, the index has shown lower beta and volatility characteristics relative to the MSCI World Index.
MSCI USA Enhanced Value Weighted Index: The MSCI USA Enhanced Value Weighted Index captures large and mid-cap representation across the US equity markets exhibiting overall value style characteristics. The index is designed to represent the performance of securities that exhibit higher value characteristics relative to their peers within the corresponding GICS® sector.
MSCI USA Quality Index: The MSCI USA Quality Index is based on MSCI USA, its parent index. The index aims to capture the performance of quality growth stocks by identifying stocks with high quality scores based on three main fundamental variables: high return on equity (ROE), stable year-over-year earnings growth and low financial leverage.
MSCI USA Small Cap Index: The MSCI USA Small Cap Index is designed to measure the performance of the small cap segment of the US equity market.
MSCI USA High Dividend Yield Index: The MSCI World High Dividend Yield Index is based on the MSCI USA Index, its parent index, and includes large and mid cap stocks. The index is designed to reflect the performance of equities in the parent index (excluding REITs) with higher dividend income and quality characteristics than average dividend yields that are both sustainable and persistent. The index also applies quality screens and reviews 12-month past performance to omit stocks with potentially deteriorating fundamentals that could force them to cut or reduce dividends.
MSCI ACWI ex US Index: The index is a free float-adjusted market capitalization weighted index that is designed to measure the equity market performance outside the U.S., including the global developed and emerging markets.
Price-to-book ratio (P/B Ratio): The price-to-book ratio (P/B Ratio) is a ratio used to compare a stock's market value to its book value. It is calculated by dividing the current closing price of the stock by the latest quarter's book value per share. Also known as the "price-equity ratio
Price-earnings ratio (P/E Ratio): The price-earnings ratio (P/E Ratio) is the ratio for valuing a company that measures its current share price relative to its per-share earnings. The price-earnings ratio can be calculated as: Market Value per Share/Earnings per Share.
S&P 500 Pure Growth Index: The S&P 500® Pure Growth index is a style-concentrated index designed to track the performance of stocks that exhibit the strongest growth characteristics by using a style-attractiveness-weighting scheme.
S&P 500 Pure Value Index: The S&P 500® Pure Value index is a style-concentrated index designed to track the performance of stocks that exhibit the strongest value characteristics by using a style-attractiveness-weighting scheme.
39 IBG-25994
Definitions
MSCI World Momentum Index: The MSCI World Momentum Index is based on MSCI World, its parent index, which includes large and mid cap stocks across 23 Developed Markets (DM) countries*. It is designed to reflect the performance of an equity momentum strategy by emphasizing stocks with high price momentum, while maintaining reasonably high trading liquidity, investment capacity and moderate index turnover.
Quality Factor: One of the six widely recognized, research-based smart beta factors that refers to “quality” equities. Companies whose stocks qualify exhibit consistent profitability, stability of earnings, low financial leverage and other characteristics consistent with long-term reliability such as ethical corporate governance.
Z-score: It indicates how many standard deviations an element is from the mean. A z-score can be calculated from the following formula. z = (X - μ) / σ where z is the z-score, X is the sector relative performance. μ is the mean of the eleven sector relative performance, and σ is the standard deviation of sectors’ relative performance.
Implied Volatility: The estimated volatility of a security's price. In general, implied volatility increases when the market is bearish and decreases when the market is bullish. This is due to the common belief that bearish markets are more risky than bullish markets.
Size factor: A smart beta factor based on the tendency of small-cap stocks to outperform their large-cap peers over long time periods.
Yield Factor: A factor which screens for companies with a higher than average dividend yield relative to the broad market, and which have demonstrated dividend sustainability and persistence.
Momentum Factor: The tendency for a security to maintain a certain direction of price trajectory. This tendency is well documented in academic research, which has made “momentum” one of the six smart beta factors that are systematically being isolated in new-generation strategic indexes.
Standard Deviation: Measures the historical dispersion of a security, fund or index around an average. Investors use standard deviation to measure expected risk or volatility, and a higher standard deviation means the security has tended to show higher volatility or price swings in the past.
Excess Returns: A security’s return minus the return from another security in the same time period.
Value Factor: One of the basic elements of “style”-focused investing that focuses on companies that may be priced below intrinsic value. The most commonly used methodology to assess value is by examining price-to-book (P/B) ratios, which compare a company’s total market value with its assessed book value.
Current Short Interest (%): The percentage of tradable outstanding shares which have been shorted. Used as a measure of investor sentiment.
Fed Funds Futures Implied Rates: Fed Funds Futures Implied Rates are derived from subtracting the price of Fed Fund Future contracts from 100. Fed funds futures are financial contracts that represent market opinion of where the daily official fed funds rate will be at the time of the contract expiry.
Term Premium: The term premium is the compensation that investor require for bearing the risk that short-term treasury yields do not evolve as they expected
Yield: The income produced by an investment, typically calculated as the interest received annually divided by the investment’s price.
Basis Point: One hundredth of one percent, or 0.01%.
Yield Curve: A graph or line that plots the interest rates or yields of bonds with similar credit quality but different durations, typically from shortest to longest duration. When the yield curve is said to be flat, it means the difference in yields between bonds with shorter and longer durations is relatively narrow. When the yield curve is said to be steepened, it means the difference in yields between short term and long term bonds increases.
Spread Changes: Changes in the spread between Treasury securities and non-Treasury securities that are identical in all respects except for quality rating.
Bloomberg Barclays Global Aggregate Bond Index: The Bloomberg Barclays Global Aggregate Index is a flagship measure of global investment grade debt from twenty-four local currency markets. This multi-currency benchmark includes treasury, government-related, corporate and securitized fixed-rate bonds from both developed and emerging markets issuers.
Bloomberg Barclays US Corporate High Yield Index: The index consists of fixed rate, high yield, USD-denominated, taxable securities issued by US corporate issuers.
Bloomberg Barclays USD Liquid Investment Grade Corporate Index: The Bloomberg Barclays USD Liquid Investment Grade Corporate Index consists of fixed rate, investment grade, taxable, USD-denominated securities issued by US corporate issuers, with time since issuance of less than two years, that meet certain liquidity requirements.
Bloomberg Barclays EM Hard Currency Aggregate Index: The index is a hard currency emerging markets debt benchmark that includes US dollar-denominated debt from sovereign, quasi-sovereign, and corporate issuers in the developing markets.
BofA Merrill Lynch US High Yield CCC or Below Index: The BofA Merrill Lynch US High Yield CCC or Below Index tracks the performance of US dollar denominated, CCC or below rating corporate debt publicly issued in the US domestic market. Qualifying securities must have a CCC or Below rating (based on an average of Moody’s, S&P and Fitch).
40 IBG-25994
Definitions
Bloomberg Barclays US Corporate Bond Index: The Bloomberg Barclays US Corporate Bond Index measures the investment grade, US dollar-denominated, fixed-rate, taxable corporate and government related bond markets. It is composed of the US Corporate Index and a non-corporate component that includes foreign agencies, sovereigns, supranationals and local authorities.
The Global Industry Classification Standard (GICS): An industry taxonomy developed in 1999 by MSCI and Standard & Poor’s (S&P) for use by the global financial community. The GICS structure consists of 10 sectors, 24 industry groups, 67 industries and 156 sub-industries [1]into which S&P has categorized all major public companies.
Credit Spread: A credit spread is the difference in yield between a US Treasury bond and a debt security with the same maturity but of lesser quality.
S&P 500 Health Care Sector Index: The Index comprises of those companies included in the S&P 500 that are classified as members of the GICS® health care sector.
S&P 500 Consumer Discretionary Index: The Index comprises of those companies included in the S&P 500 that are classified as members of the GICS® consumer discretionary sector.
S&P 500 Consumer Staples Index: The Index comprises of those companies included in the S&P 500 that are classified as members of the GICS® consumer staples sector.
S&P 500 Financial Sector Index: The Index comprises of those companies included in the S&P 500 that are classified as members of the GICS® financial sector.
S&P 500 Utilities Index: The Index comprises of those companies included in the S&P 500 that are classified as members of the GICS® utilities sector.
S&P500 Information Technology Sector Index: The Index comprises of those companies included in the S&P 500 that are classified as members of the GICS® information technology sector.
S&P 500 Industrial Sector Index: The Index comprises of those companies included in the S&P 500 that are classified as members of the GICS® industrial sector.
S&P 500 Materials Sector Index: The Index comprises of those companies included in the S&P 500 that are classified as members of the GICS® materials sector.
S&P 500 Real Estate Sector Index: The Index comprises of those companies included in the S&P 500 that are classified as members of the GICS® real estate sector.
S&P 500 Telecommunication Sector Index: The Index comprises of those companies included in the S&P 500 that are classified as members of the GICS® telecommunication services sector.
Breakeven Inflation Rate: It is a market based measure of expected inflation. It is the difference between the yield of a nominal bond and an inflation linked bond of the same maturity.
S&P Small Cap 600 Equal Weighted Index: The S&P SmallCap 600® Equal Weight Index (EWI) is the equal-weight version of the S&P SmallCap 600. The index has the same constituents as the capitalization weighted S&P SmallCap 600, but each company in the S&P SmallCap 600 EWI is allocated a fixed weight.
41 IBG-25994

Appendix C: Important Disclosures
42 IBG-25994

Important Disclosures
The views expressed in this material are the views of SPDR Americas Research Team and are subject to change based on market and other conditions. This document contains certain statements that may be deemed forward-looking statements. Please note that any such statements are not guarantees of any future performance and actual results or developments may differ materially from those projected.
The information provided does not constitute investment advice and it should not be relied on as such. It should not be considered a solicitation to buy or an offer to sell a security. It does not take into account any investor’s particular investment objectives, strategies, tax status or investment horizon. You should consult your tax and financial advisor.
All material has been obtained from sources believed to be reliable. There is no representation or warranty as to the accuracy of the information and State Street shall have no liability for decisions based on such information.
All the index performance results referred to are provided exclusively for comparison purposes only. It should not be assumed that they represent the performance of any particular investment.
Bonds generally present less short-term risk and volatility than stocks, but contain interest rate risk (as interest rates rise, bond prices usually fall); issuer default risk; issuer credit risk; liquidity risk; and inflation risk. These effects are usually pronounced for longer-term securities. Any fixed income security sold or redeemed prior to maturity may be subject to a substantial gain or loss.
The values of debt securities may decrease as a result of many factors, including, by way of example, general market fluctuations; increases in interest rates; actual or perceived inability or unwillingness of issuers, guarantors or liquidity providers to make scheduled principal or interest payments; illiquidity in debt securities markets; and prepayments of principal, which often must be reinvested in obligations paying interest at lower rates.
Equity securities may fluctuate in value in response to the activities of individual companies and general market and economic conditions.
Investments in small-sized companies may involve greater risks than in those of larger, better known companies.
Investments in mid-sized companies may involve greater risks than in those of larger, better known companies, but may be less volatile than investments in smaller companies.
Companies with large market capitalizations go in and out of favor based on market and economic conditions. Larger companies tend to be less volatile than companies with smaller market capitalizations. In exchange for this potentially lower risk, the value of the security may not rise as much as companies with smaller market capitalizations.
Value stocks can perform differently from the market as a whole. They can remain undervalued by the market for long periods of time.
Foreign investments involve greater risks than US investments, including political and economic risks and the risk of currency fluctuations, all of which may be magnified in emerging markets.
Because of their narrow focus, sector funds tend to be more volatile.
Commodities investing entail significant risk as commodity prices can be extremely volatile due to wide range of factors Bond funds contain interest rate risk (as interest rates rise bond prices usually fall); the risk of issuer default; issuer credit risk; liquidity risk; and inflation risk.
Asset Allocation is a method of diversification which positions assets among major investment categories. Asset Allocation may be used in an effort to manage risk and enhance returns. It does not, however, guarantee a profit or protect against loss.
Actively managed ETFs do not seek to replicate the performance of a specified index. Because the SPDR SSGA Active Asset Allocation ETFs are actively managed, they are therefore subject to the risk that the investments selected by SSGA may cause the ETFs to underperform relative to their benchmarks or other funds with similar investment objectives.
43 IBG-25994
Important Disclosures (continued)
The trademarks and service marks referenced herein are the property of their respective owners. Third party data providers make no warranties or representations of any kind relating to the accuracy, completeness or timeliness of the data and have no liability for damages of any kind relating to the use of such data.
Standard & Poor’s, S&P and SPDR are registered trademarks of Standard & Poor/s Financial Services LLC (S&P); Dow Jones is a registered trademark of Dow Jones Trademark Holdings LLC (Dow Jones); and these trademarks have been licensed for use by S&P Dow Jones Indices LLC (SPDJI) and sublicensed for certain purposes by State Street Corporation. State Street Corporation’s financial products are not sponsored, endorsed, sold or promoted by SPDJI, Dow Jones, S&P, their respective affiliates and third party licensors and none of such parties make any representation regarding the advisability of investing in such product(s) nor do they have any liability in relation thereto, including for any errors, omissions, or interruptions of any index.
Distributor: State Street Global Advisors Funds Distributors LLC, member FINRA, SIPC, an indirect wholly owned subsidiary of State Street Corporation. References to State Street may include State Street Corporation and its affiliates. Certain State Street affiliates provide services and receive fees from the SPDR ETFs.
Before investing, consider the funds’ investment objectives, risks, charges and expenses. To obtain a prospectus or summary prospectus which contains this and other information, call 1-866-787-2257 or visit www.spdrs.com. Read it carefully.
State Street Global Advisors, One Lincoln Street, Boston, MA 02111-2900.
© 2017 State Street Corporation — All Rights Reserved.
Tracking Code: IBG-25994
Expiration Date: December 31, 2018
Not FDIC Insured — No Bank Guarantee — May Lose Value.
44 IBG-25994