state street global advisors spdr etfs chart...
TRANSCRIPT

IBG-24534
August 2017 Edition
State Street Global
Advisors SPDR® ETFs
Chart Pack
For Public Use Please see Appendix C for more information on investment terms used in this Chart Pack.

Chart Pack Table of Contents
Table of Contents
2 IBG-24534
I. Market Environment
• Performance
• SSGA Current Positioning
• Investor Confidence
• Environment for Active
• Volatility
• Complacency
II. Factors, Valuations & Flows
• Global Factor Trends
• Global Valuations
• US Valuations
• Asset Class Flows
III. Sectors
• Flows & Returns
• Valuations
• Earnings Trends
IV. Fixed Income
• Bond Market
• Yield Curve
• Inflation
• Rates Trends
• Credit Trends

Market Environment
3 IBG-24534

16.0
18.5 17.8
24.8
10.9
-0.5
-2.5
-6.1
0.1
11.6
5.8
17.1
25.5
6.3
2.7 2.0
10.6
-3.6
2.1 0.7
2.9
6.0
1.2 0.4 0.2
2.2 2.2
US LARGE CAP US SMALL CAP DEVELOPED EMERGING HIGH YIELD AGG TREASURIES GOLD BROADCOMMODITIES
S&P 500 Index Russell 2000 Index MSCI EAFE Index MSCI EmergingMarkets Index
Bloomberg US HighYield Index
Bloomberg BarclaysUS Aggregate Index
Bloomberg USTreasury Index
Gold Spot BloombergCommodity Index
Trailing 12 Month YTD Prior Month
Asset Class Performance — As the Dollar Weakened, Commodities Rebounded, and EM Equities Continued their 2017 Rally in July. Bond Returns Remained Low.
Source: Bloomberg Finance L.P. As of July 31, 2017. Past performance is not a guarantee of future results. Index returns are unmanaged and do not reflect the deduction of any fees or expenses. Index returns reflect all items of income, gain and loss and the reinvestment of dividends and other income. Performance returns for periods of less than one year are not annualized.
Major Asset Class Performance (%)
4 IBG-24534
Commodities are the Only Major Asset Class with Negative Returns in 2017
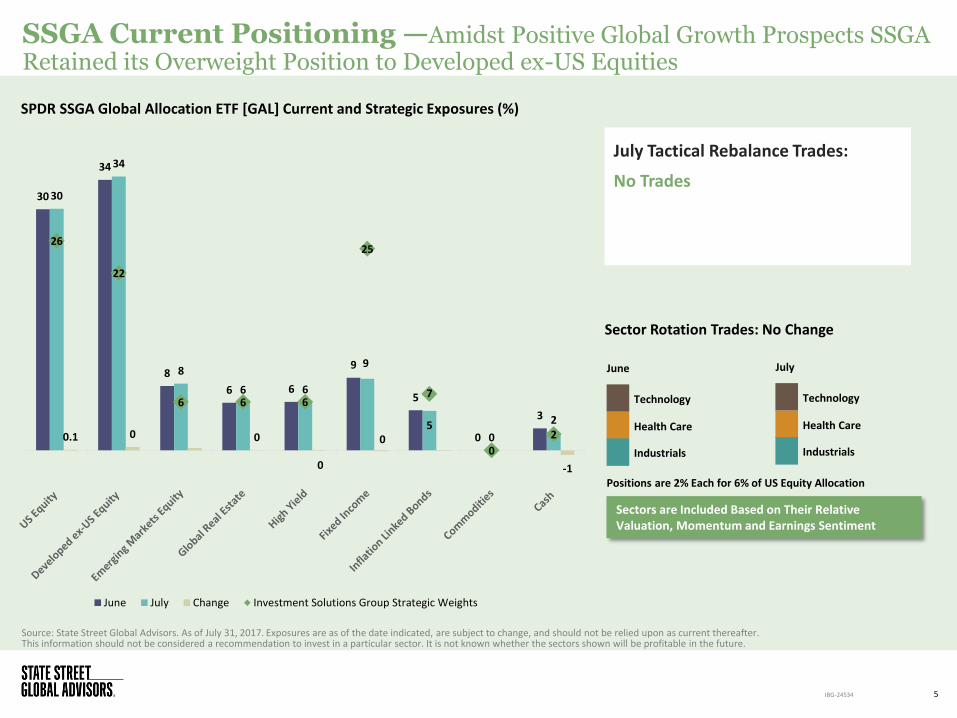
Source: State Street Global Advisors. As of July 31, 2017. Exposures are as of the date indicated, are subject to change, and should not be relied upon as current thereafter. This information should not be considered a recommendation to invest in a particular sector. It is not known whether the sectors shown will be profitable in the future.
SSGA Current Positioning —Amidst Positive Global Growth Prospects SSGA Retained its Overweight Position to Developed ex-US Equities
5
July
Sector Rotation Trades: No Change
Sectors are Included Based on Their Relative Valuation, Momentum and Earnings Sentiment
July Tactical Rebalance Trades:
No Trades
IBG-24534
Positions are 2% Each for 6% of US Equity Allocation
SPDR SSGA Global Allocation ETF [GAL] Current and Strategic Exposures (%)
Technology
Health Care
Industrials
30
34
8
6 6
9
5
0
3
30
34
8
6 6
9
5 0
2
0.1 0 0
0
0
-1
26
22
6 6
25
7
0
2
June July Change Investment Solutions Group Strategic Weights
June
Technology
Health Care
Industrials
109
97
70
80
90
100
110
120
130
140
Apr-02 Oct-03 Apr-05 Oct-06 Apr-08 Oct-09 Apr-11 Oct-12 Apr-14 Oct-15 Apr-17
State Street Investor Confidence Index 1 Year Moving Average
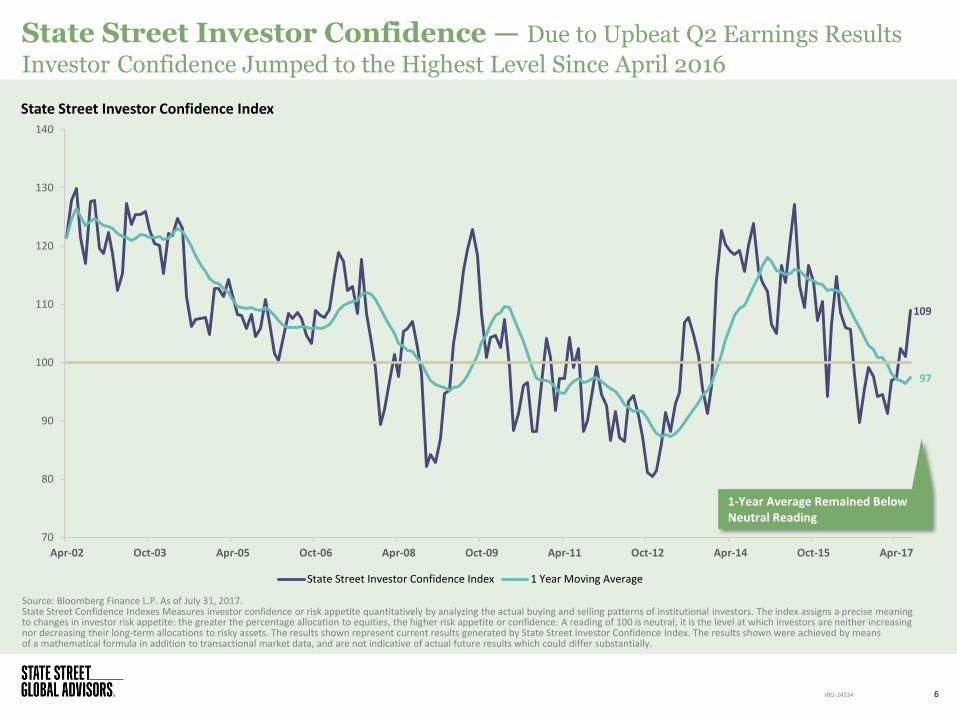
State Street Investor Confidence — Due to Upbeat Q2 Earnings Results
Investor Confidence Jumped to the Highest Level Since April 2016
Source: Bloomberg Finance L.P. As of July 31, 2017. State Street Confidence Indexes Measures investor confidence or risk appetite quantitatively by analyzing the actual buying and selling patterns of institutional investors. The index assigns a precise meaning to changes in investor risk appetite: the greater the percentage allocation to equities, the higher risk appetite or confidence. A reading of 100 is neutral; it is the level at which investors are neither increasing nor decreasing their long-term allocations to risky assets. The results shown represent current results generated by State Street Investor Confidence Index. The results shown were achieved by means of a mathematical formula in addition to transactional market data, and are not indicative of actual future results which could differ substantially.
State Street Investor Confidence Index
6 IBG-24534
1-Year Average Remained Below Neutral Reading

0.16 0.15
0.34
0.25
0.22 0.20
0.48
0.38
S&P 500 Index Correlation Russell 2000 Index Correlation
3-Month Moving Average Stock Correlation
Current 15-yr median 10th Percentile 90th Percentile
6.1
11.8
6.9
11.9
5.8
10.4
11.6
16.6
S&P 500 index Dispersion Russell 2000 Index Dispersion
3-Month Moving Average Cross-Sectional Dispersion (%)
Current 15-yr median 10th Percentile 90th Percentile
Active Environment Barometer —Declining Dispersion and Correlation Indicate a Mixed Market Environment for US Equity Active Managers
Source:.FactSet, as of July 31, 2017. The Cross-Sectional Dispersion is calculated as the standard deviation of daily returns of index constituents for one month. Average stock correlation is calculated as the average correlation of each pair of constituents in the index over one month. Characteristics are as of the date indicated and should not be relied upon as current thereafter.
7 IBG-24534
S&P 500 Index and Russell 2000 Index Correlation and Dispersion
Dispersions Among Small Cap Stocks Retreated Back to their Historical Average in July
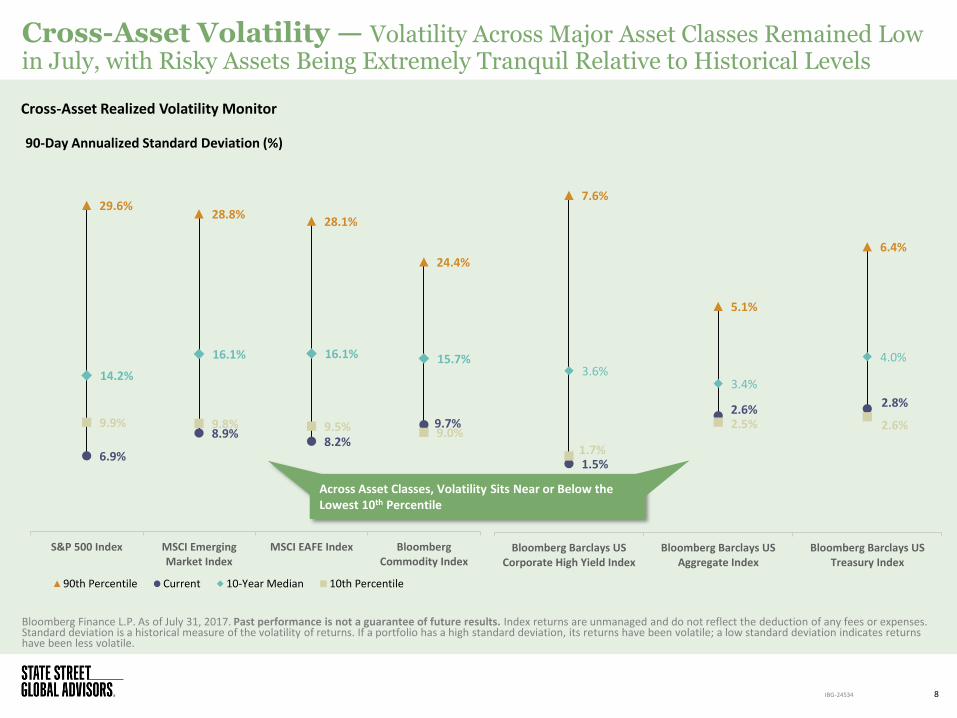
Cross-Asset Volatility — Volatility Across Major Asset Classes Remained Low in July, with Risky Assets Being Extremely Tranquil Relative to Historical Levels
Bloomberg Finance L.P. As of July 31, 2017. Past performance is not a guarantee of future results. Index returns are unmanaged and do not reflect the deduction of any fees or expenses. Standard deviation is a historical measure of the volatility of returns. If a portfolio has a high standard deviation, its returns have been volatile; a low standard deviation indicates returns have been less volatile.
8 IBG-24534
Cross-Asset Realized Volatility Monitor
29.6% 28.8%
28.1%
24.4%
6.9%
8.9% 8.2%
9.7%
14.2%
16.1% 16.1% 15.7%
9.9% 9.8% 9.5% 9.0%
S&P 500 Index MSCI EmergingMarket Index
MSCI EAFE Index BloombergCommodity Index
90-Day Annualized Standard Deviation (%)
90th Percentile Current 10-Year Median 10th Percentile
7.6%
5.1%
6.4%
1.5%
2.6% 2.8%
3.6% 3.4%
4.0%
1.7%
2.5% 2.6%
Bloomberg Barclays USCorporate High Yield Index
Bloomberg Barclays USAggregate Index
Bloomberg Barclays USTreasury Index
Across Asset Classes, Volatility Sits Near or Below the Lowest 10th Percentile

Complacency — Elevated Valuations Against a Backdrop of Low Volatility Depict a Complacent Market, as Investors are Paying High Multiples with Little Worry
Bloomberg Finance L.P. As of July 31, 2017. Past performance is not a guarantee of future results. Index returns are unmanaged and do not reflect the deduction of any fees or expenses.
9 IBG-24534
S&P 500 Price-to-Earnings (P/E) to VIX Index Ratio Ratio Highest Since 1993
0.0
0.5
1.0
1.5
2.0
2.5
1990 1993 1996 1999 2002 2005 2008 2011 2014 2017
S&P 500 P/E versus VIX Index Ratio

Volatility Seasonality — The Current Complacency May be Tested Later in the Year, as the VIX Tends to Increase in the Fall, Based on Historical Seasonality Trends
*10-Year Average is the average of each date from 2007 to 2016. Bloomberg Finance L.P. As of July 31, 2017. Past performance is not a guarantee of future results.
10 IBG-24534
CBOE VIX Index Level in 2017 vs. 10-Year Average
5
10
15
20
25
30
Jan Feb Mar Apr May Jun Jul Aug Sep Oct Nov Dec
10-Year Average* VIX Index in 2017
Volatility Has Historically Moved Higher in Fall
Debt Ceiling Debate and Fed Balance Sheet Talk May Exacerbate the Seasonality
?

Factors, Valuations and Flows
11 IBG-24534

85
90
95
100
105
110
Aug-16 Oct-16 Dec-16 Feb-17 Apr-17 Jun-17
No
rmal
ize
d I
nd
ex
Leve
l
Min. Vol Quality Size Yield Momentum Value
Global Factor Trends —Defensive Factors, Like Min. Vol. and Quality Underperformed in July, as Investors Chased High Momentum Stocks
12
Source: Bloomberg Finance L.P. As of July 31, 2017. Past performance is not a guarantee of future results. MSCI World Minimum Volatility Index, MSCI World Value Weighted Index, MSCI World Quality Index, MSCI World Equal Weighted Index, MSCI World High Dividend Yield Index, and MSCI World Momentum Index were used above compared to the MSCI World Index. Index returns are unmanaged and do not reflect the deduction of any fees or expenses.
MSCI World Factor Index Price Returns versus MSCI World Index Period Excess Price Returns versus MSCI World Index
IBG-24534
Yield and Min. Vol. are Among the Worst Performers on Year-to-Date and Trailing 12 Months Basis
-10.9%
-6.1%
-3.0%
-1.1%
0.7%
3.9%
-2.1%
-2.9%
1.0%
5.6%
1.2%
-1.6%
-0.5%
-0.8%
-0.9%
0.7%
0.0%
0.2%
Min. Vol
Yield
Quality
Momentum
Size
Value
July YTD Trailing 12 Months

3.15
2.28
1.69
1.75
1.36
1.61
2.56
2.04
1.73 1.75
1.41
1.61
3.19
2.59
2.42
2.96
2.14 2.20
1.64
1.16 1.05
1.16
0.90 0.96
S&P 500 Index Russell 2000 Index MSCI EAFE Index MSCI Japan Index MSCI Emerging Markets Index Euro Stoxx 50 Index
Current 15 Year Avg. 15 Year High 15 Year Low
Global Valuations — Based On Price to Book, Valuations Outside the US are Near or Below Their 15-Year Average, While US Large Caps are at 15-Year Highs
Source: Bloomberg Finance L.P., State Street Global Advisors. As of July 31, 2017.Characteristics are as of the date indicated and should not be relied upon as current thereafter.
13
Global Equity Market Price to Book Ratios (P/B)
IBG-24534
Despite This Year’s Rally in EM and the Eurozone, Valuations are Not Stretched

14 IBG-24534
US Valuations — Value has Become Scarce, as US Equities are Trading Above
Their 25-year Median Across Multiple Valuation Metrics
S&P 500 Valuations Over the Past 25 Years
Source: Bloomberg Finance L.P., State Street Global Advisors. As of July 31, 2017.Characteristics are as of the date indicated and should not be relied upon as current thereafter.
Price to Book (P/B)
Price to Earnings (P/E)
CAPE Shiller PE
1 Year Forward Consensus P/E
Enterprise Value/EBITDA (EV/EBITDA)
Price to Sales (P/S)
Price to Cash Flow (P/CF)
Current 3.2 21.3 30.1 18.9 12.9 2.1 12.9
Median 2.8 18.6 25.5 16.2 10.7 1.5 10.8
% Above Median 13% 15% 18% 17% 21% 40% 20%
77% 71%
81% 81% 91% 94%
70%
Price to Book (P/B) Price Earnings (P/E) CAPE Shiller PE 1 Year ForwardConsesus P/E
EnterpriseValue/EBITDA(EV/EBITDA)
Price to Sales (P/S) Price/Cash Flow(P/CF)
Current Percentile
The Majority of the Valuation Metrics are Trading in the Top Quartile

Flow Trends — Fixed Income Funds Continued to Post Eleven-Digit Inflows, While Equity Funds Took in Only Two Thirds of What They Did in June
Source: State Street Global Advisors, Bloomberg Finance L.P. As of July 31, 2017 Sectors, asset classes and flows are as of the date indicated, are subject to change, and should not be relied upon as current thereafter.
15 IBG-24534
Monthly Fund Flows
Equity Monthly Fund Flows
7
3 7
1 10
12
10 16
13
21
21 10
-10
0
10
20
30
40
50
60
70
Aug-16 Sep-16 Oct-16 Nov-16 Dec-16 Jan-17 Feb-17 Mar-17 Apr-17 May-17 Jun-17 Jul-17
Bill
ion
s
US Sector US Equity International Currency Hedged
19
9 14
49
58
26 33
36
24 20
31
19
9 8 4 3
7 13 12 10 11 11
14 12
0
0
0 -3 -4 -1
2
-1
1
-1
1
-3 -15
-5
5
15
25
35
45
55
65
Aug-16 Sep-16 Oct-16 Nov-16 Dec-16 Jan-17 Feb-17 Mar-17 Apr-17 May-17 Jun-17 Jul-17
Bill
ion
s
Equity Fixed Income Commodity
International Funds Have Had Monthly Inflows of at Least $10 Billion for 8 Consecutive Months

Sectors
16 IBG-24534

17
Sector Flow and Returns Heat Map—Flows into Financials Surpassed Tech for the Second Month in a Row, Even as Tech Rebounded from a June Swoon
Source: State Street Global Advisors, Bloomberg Finance L.P. As of July 31, 2017. Sectors, asset classes and flows are as of the date indicated, are subject to change, and should not be relied upon as current thereafter. Past performance is not a guarantee of future results. Index returns are unmanaged and do not reflect the deduction of any fees or expenses. Performance returns for periods of less than one year are not annualized. Sector Returns are based on the following sector indices: Financials = S&P 500 Financials Sector Index, Industrials = S&P 500 Industrials Sector index, Energy = S&P 500 Energy Sector index, Materials = S&P 500 Materials Sector Index, Consumer Discretionary = S&P 500 Consumer Discretionary Sector Index, Heath Care = S&P 500 Health Care Sector Index, Technology = S&P 500 Information Technology Sector Index, Real Estate = S&P 500 Real Estate Sector Index, Consumer Staples = S&P 500 Consumer Staples Sector Index, Utilities = S&P 500 Utilities Sector Index, Telecom = S&P 500 Telecommunication Sector Index
IBG-24534
All Sectors Posted Positive Returns in July With Reduced Short Interest, Except for Consumer Staples
Positioning Returns
Prior Month Flow ($M)
YTD Flow ($M)
Current Short Interest (%)
1M Prior Short Interest (%)
Prior Month Return (%)
YTD Return (%)
Telecommunications 15 -88 4 5 6.4 -5.1
Consumer Discretionary -7 217 11 13 1.9 13.1
Consumer Staples -158 895 15 15 0.6 8.6
Energy -437 1,952 12 13 2.5 -10.4
Financial 1,635 5,422 7 7 1.7 8.7
Health Care 609 3,659 10 12 0.8 17.0
Industrials 170 958 10 13 0.1 9.6
Materials -1,050 -1,694 10 11 1.5 10.9
Technology 655 5,904 6 7 4.3 22.3
Real Estate 232 3,346 5 5 1.2 7.7
Utilities 189 -12 22 26 2.4 11.4

3.2
5.4 5.1 5.2
4.6
3.8 4.0
2.7
1.9 2.0
1.4
2.6
4.4
3.2
3.8
3.1
2.8
3.5
2.2 2.2
1.7 1.5
3.2
6.4
5.1 5.2
4.7
4.0
6.0
3.6
3.1
2.5 2.4
1.6
2.8
1.8
2.5
1.6 1.5
2.2
1.3 1.5
1.2
0.6
S&P 500 Index ConsumerStaples
ConsumerDiscretionary
InformationTechnology
Industrials Materials Health Care Telecom Energy Utilities Financials
Current 15 Year Avg. 15 Year High 15 Year Low
Sector Valuations — With Broad Market Valuations Elevated, the Majority of Sectors are Also Trading Above Historical Averages. Some are Near 15-Year Highs
Source: Bloomberg Finance L.P., State Street Global Advisors. As of July 31, 2017 Characteristics are as of the date indicated and should not be relied upon as current thereafter.
18
US Equity Market Price to Book Ratios
IBG-24534
Energy and Financials are the Only Sectors Trading Below their 15-Year Average
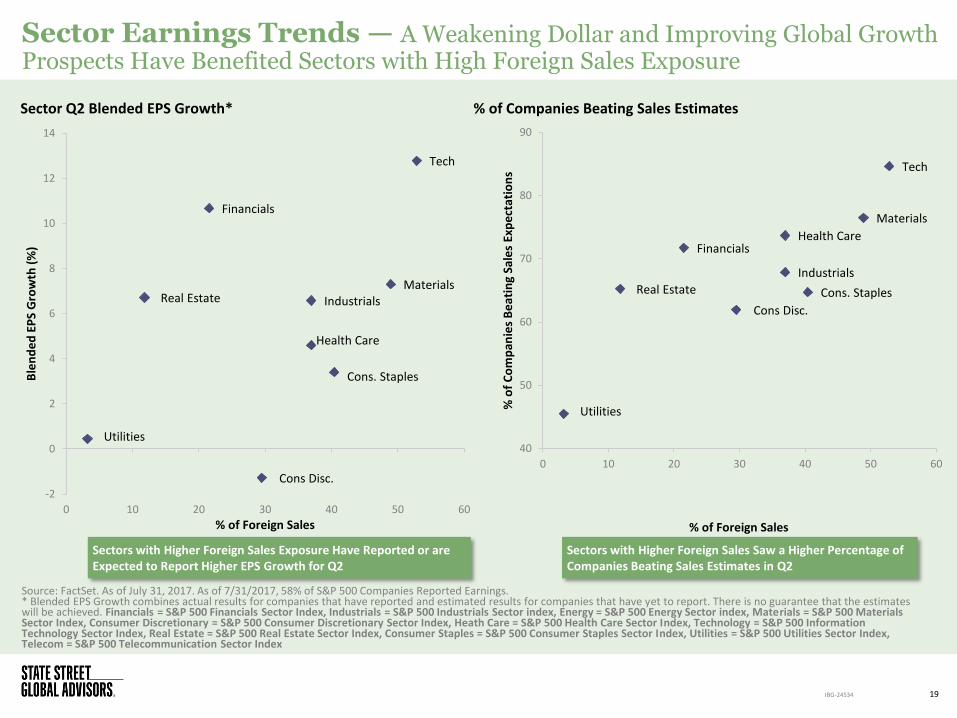
Sector Earnings Trends — A Weakening Dollar and Improving Global Growth Prospects Have Benefited Sectors with High Foreign Sales Exposure
19
Source: FactSet. As of July 31, 2017. As of 7/31/2017, 58% of S&P 500 Companies Reported Earnings. * Blended EPS Growth combines actual results for companies that have reported and estimated results for companies that have yet to report. There is no guarantee that the estimates will be achieved. Financials = S&P 500 Financials Sector Index, Industrials = S&P 500 Industrials Sector index, Energy = S&P 500 Energy Sector index, Materials = S&P 500 Materials Sector Index, Consumer Discretionary = S&P 500 Consumer Discretionary Sector Index, Heath Care = S&P 500 Health Care Sector Index, Technology = S&P 500 Information Technology Sector Index, Real Estate = S&P 500 Real Estate Sector Index, Consumer Staples = S&P 500 Consumer Staples Sector Index, Utilities = S&P 500 Utilities Sector Index, Telecom = S&P 500 Telecommunication Sector Index
IBG-24534
Tech
Financials
Materials Real Estate Industrials
Health Care
Cons. Staples
Utilities
Cons Disc. -2
0
2
4
6
8
10
12
14
0 10 20 30 40 50 60
Ble
nd
ed
EP
S G
row
th (
%)
% of Foreign Sales
Tech
Financials
Materials
Real Estate
Industrials
Health Care
Cons. Staples
Utilities
Cons Disc.
40
50
60
70
80
90
0 10 20 30 40 50 60
% o
f C
om
pan
ies
Be
atin
g Sa
les
Exp
ect
atio
ns
% of Foreign Sales
Sector Q2 Blended EPS Growth* % of Companies Beating Sales Estimates
Sectors with Higher Foreign Sales Exposure Have Reported or are Expected to Report Higher EPS Growth for Q2
Sectors with Higher Foreign Sales Saw a Higher Percentage of Companies Beating Sales Estimates in Q2

Fixed Income
20 IBG-24534

Bond Market — The Opportunities for Income Generation Remain Scarce, and Require Investors to Balance Duration and Credit Risks Uniquely
Source: Bloomberg Finance L.P. As of July 31, 2017. Past performance is not a guarantee of future results. Index returns are unmanaged and do not reflect the deduction of any fees or expenses.
21 IBG-24534
Global Yield to Worst (%)
1.0
1.6 1.9
2.3 2.5
2.8 3.0
4.6
5.4
7.7
7.0
6.2 6.6
6.2
5.3
7.3
5.9
3.8
0.16
0.39
0.00
0.95
0.40 0.28
0.98
2.62
3.49
-0.5
0.0
0.5
1.0
1.5
2.0
2.5
3.0
3.5
4.0
0.0
1.0
2.0
3.0
4.0
5.0
6.0
7.0
8.0
9.0
BloombergBarclays Global
Agg GovernmentIndex
BloombergBarclays Global-Aggregate Index
BloombergBarclays US
Treasury Index
BloombergBarclays Global
Agg Credit Index
BloombergBarclays US Agg
Index
BloombergBarclays US MBS
Index Index
BloombergBarclays US Credit
Index
BloombergBarclays EM USDAggregate Index
BloombergBarclays US
Corporate HighYield Index
Cre
dit
Sp
read
(%
)
Yie
ld t
o W
ors
t (%
) o
r D
ura
tio
n (
Ye
ars)
Yield to Worst Duration Credit Spread Over Treasuries Bloomberg Barclays US Aggregate Bond Index (the Agg) 20-Year Average Yield
The Majority of Fixed Income Assets are Generating a Yield Less than the Historical Average of the Agg, Except for Sectors with High Credit Risks
4.2

14 6
0
-2 -3 -4 -5 -3 -1
7
56 58 52
40
16 6
-9 -13 -15 -17
80 82 77 72 69
76 81 83 84 72
-40
-20
0
20
40
60
80
100
Ch
ange
in B
ps
Jul-17 YTD Change 1 Year
0.4
0.5 0.6
0.8 1.2 1.5
1.9
2.2 2.4
3.1
0.2 0.3 0.4 0.5 0.7 0.7 1.0
1.3 1.5
2.2
1.0 1.1 1.1 1.2 1.4
1.5 1.8
2.1 2.3
2.9
0.0
0.5
1.0
1.5
2.0
2.5
3.0
3.5
1M 3M 6M 1Y 2Y 3Y 5Y 7Y 10Y 30Y
Yie
ld (
%)
US Treasury Active Curve 12/31/2016 US Treasury Active Curve 7/31/2016 US Treasury Active Curve 7/31/2017
Yield Curve — After a Short-Lived Yield Backup in June, the Yield Curve Continued to Flatten Amid Tepid Inflation and Mediocre GDP Growth
Source: Bloomberg Finance L.P. As of July 31, 2017. Past performance is not a guarantee of future results.
22
US Treasury Curve
IBG-24534
The Yield Curve Has Flattened in 2017, with the Fed Pushing on the Short End and Slow Growth and Inflation Pulling on the Long End

Inflation— Softer Inflation Since the Beginning of 2017 May Complicate the Fed’s Plan to Normalize Monetary Policy if the Trends Persist
Source: Bloomberg Finance L.P. As of June 30, 2017.
23 IBG-24534
US Inflation
-0.5
0
0.5
1
1.5
2
2.5
3
%
Personal Consumption Expenditure Core index YoY Headline CPI YoY Core Sticky CPI YoY Core CPI YoY US 5-Year Breakeven Inflation Rate
Key Inflation Readings Have All Pointed to a Downward Trend in Inflation This Year and are Still Below the Fed’s Target 2%
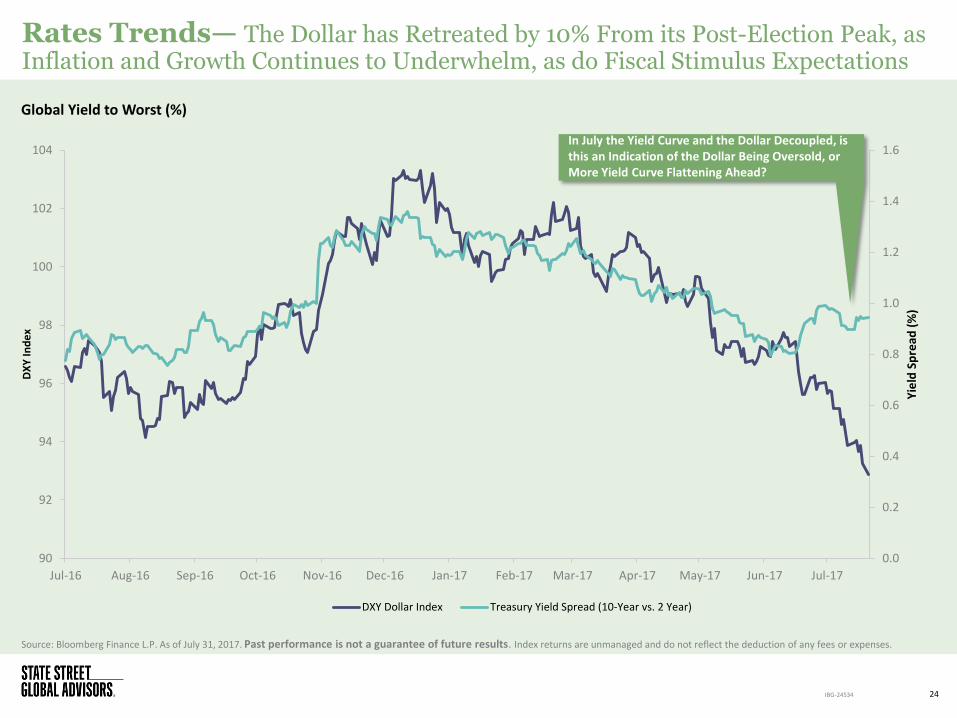
Rates Trends— The Dollar has Retreated by 10% From its Post-Election Peak, as Inflation and Growth Continues to Underwhelm, as do Fiscal Stimulus Expectations
Source: Bloomberg Finance L.P. As of July 31, 2017. Past performance is not a guarantee of future results. Index returns are unmanaged and do not reflect the deduction of any fees or expenses.
24 IBG-24534
Global Yield to Worst (%)
0.0
0.2
0.4
0.6
0.8
1.0
1.2
1.4
1.6
90
92
94
96
98
100
102
104
Jul-16 Aug-16 Sep-16 Oct-16 Nov-16 Dec-16 Jan-17 Feb-17 Mar-17 Apr-17 May-17 Jun-17 Jul-17
Yie
ld S
pre
ad (
%)
DX
Y In
de
x
DXY Dollar Index Treasury Yield Spread (10-Year vs. 2 Year)
In July the Yield Curve and the Dollar Decoupled, is this an Indication of the Dollar Being Oversold, or More Yield Curve Flattening Ahead?

361
609
0
500
1000
1500
2000
2500
3000
3500
4000
OA
S B
ps
Difference BofA Merrill Lynch CCC & Lower US High Yield Index BofA Merrill Lynch US High Yield Index 20-Year Average Difference
Credit Trends — The Difference Between CCC Rated and Broad High Yield Credit Spreads has Widened in the Last Two Months, But Remains Below Historical Average
Source: St. Louis Federal Reserve. As of July 31, 2017. Characteristics are as of the date given and should not be relied upon as current thereafter.
25
High Yield Spread Tightening
IBG-24534
The Spread Difference is 20% Below its Historical Average

5.17% 3.76%
6.68% 7.29% 7.39%
14.60% 16.63%
50.78%
300 400 500 600 700 800 900 >1000
26
Source: State Street Global Advisors, Bloomberg Finance L.P. As of June 27, 2017. Past performance is not a guarantee of future results. Represented by the Monthly OAS of the Bloomberg Barclays US Corporate High Yield Index since 2001. Characteristics are as of the date indicated and should not be relied upon as current thereafter.
IBG-24534
With spreads currently at 361, You are here.
Spread Level (Bps)
Credit Trends — Given the Current Spread Level, the Return Potential For High Yield Bonds is Limited
Historical Average Forward 12 Month Return Based on Starting Spread Level

Appendix A: Flow Summary
27 IBG-24534

Fund Flow Summary
28 IBG-24534
Source: State Street Global Advisors, Bloomberg Finance L.P. As of July 31, 2017. Sectors, asset classes and flows are as of the date indicated, are subject to change, and should not be relied upon as current thereafter.
Asset Category
Equity Region
Fixed Income Sector
High Yield Corporates versus Investment Grade
How to Read Heatmap
Most Flows in Period
Least Flows in Period
US Government Maturity Band
Asset Category Prior Month ($M) Year to Date ($M) Trailing 12 Month ($M)
Equity 18,883 190,647 342,711 Fixed Income 12,026 82,864 114,696
—
—
—
—
—
—
—
—
—
Equity Region Prior Month ($M) Year to Date ($M) Trailing 12 Month ($M)
U.S. 9,986 86,682 217,231
Global 257 5,668 11,935
Currency Hedged (1,479) 354 (6,822)
International - Broad 9,042 77,721 100,959
International - Region 1,629 16,858 13,909
International - Single Country (552) 3,365 5,500
Fixed Income Sector Heatmap Prior Month ($M) Year to Date ($M) Trailing 12 Month ($M) Government 1,174 16,138 14,062
Inflation Protected 292 4,250 9,160
Municipals 327 2,444 5,009
Aggregate 2,308 20,602 31,108
Preferred 863 3,718 5,447 Convertible 283 951 1,771
Mortgage-Backed 426 2,646 4,093
Asset Backed 0 20 (73)
Bank Loans 91 2,563 6,322
Corporate Prior Month ($M) Year to Date ($M) Trailing 12 Month ($M)
Investment Grade 3,452 26,497 30,218
High Yield 2,812 2,994 7,534
Other (2) 32 37
Government ETF Maturity Focus Prior Month ($M) Year to Date ($M) Trailing 12 Month ($M)
Ultra Short 1,192 2,429 2,830
Short Term 3,469 24,638 40,748
Intermediate 5,109 38,890 50,418
Long Term (>10 yr) 599 6,008 3,433

Appendix B: Asset Class Forecast
29 IBG-24534

SSGA Asset Class Forecasts
Source: State Street Global Advisors (SSGA) Investment Solutions Group. The forecasted returns are based on SSGA’s Investment Solutions Group’s March 31, 2017 forecasted returns and long-term standard deviations. The forecasted performance data is reported on a gross of fees basis. Additional fees, such as the advisory fee, would reduce the return. For example, if an annualized gross return of 10% was achieved over a 5-year period and a management fee of 1% per year was charged and deducted annually, then the resulting return would be reduced from 61% to 54%. The performance includes the reinvestment of dividends and other corporate earnings and is calculated in the local (or regional) currency presented. It does not take into consideration currency effects. The forecasted performance is not necessarily indicative of future performance, which could differ substantially. Please reference Appendix B for the assumptions used by SSGA Investment Solutions Group to create asset class forecasts.
30
Forecasted Return (%) as of March 31, 2017
IBG-24534
3.1 3.3
3.6
4.8
4.1
2.5 2.1
1.3
3.8
4.6
3.7
5.3
6.7
6.2 6.1
9.5
3.8
2.3
1.8
5.9
6.6
7.4
6.5
8.1
US Small Cap US Large Cap GlobalDeveloped
Ex-US
EmergingMarketEquities
US High Yield USInvestment
Grade Bonds
USGovernment
Bonds
Commodities Value Tilted Quality Tilted EqualWeighted
Min.Variance
Asset Class Global Factors
1 Year 3–5 Year

Asset Class Forecast Assumptions
31 IBG-24534
Forecast Assumptions
For Fixed Income: Our return forecasts for fixed income derive from current yield conditions together with expectations as to how real and nominal yield curves could evolve relative to historical averages. For corporate bonds, we also analyze credit spreads and their term structures, with separate assessments of investment-grade and high-yield bonds.
For Equities: Our long-term equity forecasts begin with expectations for developed market large capitalization stocks. The foundation for these forecasts are estimates of real return potential, derived from current dividend yields, forecast real earnings growth rates, and potential for expansion or contraction of valuation multiples. Our forecasting method incorporates long run estimates of potential economic growth based on forecast labor and capital inputs to estimate real earning growth.
For Factor Returns: Over a one to three-year forecast horizon, we look to see how cheap each factor is relative to its own history. Specifically, we focus on book/price spreads for each factor and relate that to their subsequent returns. We find that valuation ratios are useful for forecasting market returns.
For Commodities: Our long-term commodity forecast is based on the level of world GDP, as a proxy for consumption demand, as well as on our inflation outlook. Additional factors affecting the returns to a commodities investor include how commodities are held (e.g., physically, synthetically, or via futures) and the various construction methodologies of different commodity benchmarks.

Appendix C: Definitions
32 IBG-24534

Definitions
S&P500 Index: A popular benchmark for US large-cap equities that includes 500 companies from leading industries and captures approximately 80% coverage of available market capitalization.
CBOE VIX Index: The Chicago Board Options Exchange (CBOE) Volatility Index shows the market’s expectation of 30-day volatility. It is constructed using the implied volatilities of a wide range of S&P 500 index options.
SKEW Index, or CBOE SKEW Index: A tail-risk focused market index derived from the price of S&P 500 tail risk. Similar to VIX®, the price of S&P 500 tail risk is calculated from the prices of out-of-the-money options on the S&P 500. SKEW typically ranges from 100 to 150. A SKEW value of 100 means that the perceived distribution of S&P 500 log-returns is normal, and the probability of outlier returns is therefore negligible.
Implied Volatility: A way of estimating volatility of a security’s price based on a number of predictive variables. Implied volatility rises when the market is falling when investors believe that the asset’s price will decline over time, and it falls when the market is rising when investors believe that the security’s price will rise over time. This is due to the common belief that bearish markets are riskier than bullish markets.
MSCI Emerging Market Index: The MSCI Emerging Markets Index captures large and mid-cap representation across 23 emerging markets countries. With 834 constituents, the index covers approximately 85% of the free float-adjusted market capitalization in each country.
Russell 2000 Index: A benchmark that measures the performance of the small-cap segment of the US equity universe.
MSCI EAFE Index: An equities benchmark that captures large- and mid-cap representation across developed market countries around the world, excluding the US and Canada.
Bloomberg US High Yield Index: The Bloomberg USD High Yield Corporate Bond Index is a rules-based, market-value weighted index engineered to measure publicly issued non-investment grade USD fixed-rate, taxable, corporate bonds. To be included in the index a security must have a minimum par amount of 250MM.
Bloomberg Barclays US Aggregate Index: A benchmark that provides a measure of the performance of the US dollar denominated investment grade bond market, which includes investment grade government bonds, investment grade corporate bonds, mortgage pass through securities, commercial mortgage backed securities and asset backed securities that are publicly for sale in the US.
Bloomberg US Treasury Index: The Bloomberg US Treasury Bond Index is a rules-based, market-value weighted index engineered to measure the performance and characteristics of fixed rate coupon US Treasuries which have a maturity greater than 12 months. To be included in the index a security must have a minimum par amount of 1,000MM.
Bloomberg Commodity Index: Bloomberg Commodity Index (BCOM) is calculated on an excess return basis and reflects commodity futures price movements. The index rebalances annually weighted 2/3 by trading volume and 1/3 by world production and weight-caps are applied at the commodity, sector and group level for diversification.
MSCI Europe Index: The MSCI Europe Index is a free-float weighted equity index designed to measure the equity market performance of the developed markets in Europe.
Euro STOXX 50 Index: Europe’s leading blue-chip index for the Eurozone, provides a blue-chip representation of super-sector leaders in the Eurozone. The index covers 50 stocks from 12 Eurozone countries.
MSCI Japan Index The MSCI Europe Index is a free-float weighted equity index designed to measure the equity market performance of the developed markets in Japan.
State Street Confidence Indexes Measures investor confidence or risk appetite quantitatively by analyzing the actual buying and selling patterns of institutional investors. The index assigns a precise meaning to changes in investor risk appetite: the greater the percentage allocation to equities, the higher risk appetite or confidence. A reading of 100 is neutral; it is the level at which investors are neither increasing nor decreasing their long-term allocations to risky assets. The results shown represent current results generated by State Street Investor Confidence Index. The results shown were achieved by means of a mathematical formula in addition to transactional market data, and are not indicative of actual future results which could differ substantially.
BofA Merrill Lynch US High Yield Master II Index: The BofA Merrill Lynch US High Yield Index tracks the performance of US dollar denominated below investment grade corporate debt publicly issued in the US domestic market. Qualifying securities must have a below investment grade rating (based on an average of Moody’s, S&P and Fitch).
Yield to worst: Yield to worst is an estimate of the lowest yield that you can expect to earn from a bond when holding to maturity, absent a default. It is a measure that is used in place of yield to maturity with callable bonds.
BofA Merrill Lynch US High Yield CCC or Below Index: The BofA Merrill Lynch US High Yield CCC or Below Index tracks the performance of US dollar denominated, CCC or below rating corporate debt publicly issued in the US domestic market. Qualifying securities must have a CCC or Below rating (based on an average of Moody’s, S&P and Fitch).
Bloomberg Barclays US Corporate High Yield Index : The index consists of fixed rate, high yield, USD-denominated, taxable securities issued by US corporate issuers.
Bloomberg Barclays USD Liquid Investment Grade Corporate Index: The Bloomberg Barclays USD Liquid Investment Grade Corporate Index consists of fixed rate, investment grade, taxable, USD-denominated securities issued by US corporate issuers, with time since issuance of less than two years, that meet certain liquidity requirements.
Bloomberg Barclays EM Hard Currency Aggregate Index: The index is a hard currency emerging markets debt benchmark that includes US dollar-denominated debt from sovereign, quasi-sovereign, and corporate issuers in the developing markets.
33 IBG-24534

Definitions
MSCI World Minimum Volatility Index The MSCI World Minimum Volatility (USD) Index aims to reflect the performance characteristics of a minimum variance strategy applied to the MSCI large and mid cap equity universe across 23 Developed Markets countries*. The index is calculated by optimizing the MSCI World Index, its parent index, for the lowest absolute risk (within a given set of constraints). Historically, the index has shown lower beta and volatility characteristics relative to the MSCI World Index.
MSCI World Value Weighted Index The MSCI World Value Weighted Index is based on a traditional market cap weighted parent index, the MSCI World Index, which includes large and mid cap stocks across 23 Developed Markets (DM) countries*. The MSCI World Value Weighted Index reweights each security of the parent index to emphasize stocks with lower valuations. Index weights are determined using fundamental accounting data—sales, book value, earnings and cash earnings—rather than market prices.
MSCI World Quality Index The MSCI World Quality Index is based on MSCI World, its parent index, which includes large and mid cap stocks across 23 Developed Market (DM) countries*. The index aims to capture the performance of quality growth stocks by identifying stocks with high quality scores based on three main fundamental variables: high return on equity (ROE), stable year-over-year earnings growth and low financial leverage. The MSCI Quality Indexes complement existing MSCI Factor Indexes and can provide an effective diversification role in a portfolio of factor strategies.
MSCI World Equal Weighted Index The MSCI World Equal Weighted Index represents an alternative weighting scheme to its market cap weighted parent index, the MSCI World Index. The index includes the same constituents as its parent (large and mid cap securities from 23 Developed Markets countries*).However, at each quarterly rebalance date, all index constituents are weighted equally, effectively removing the influence of each constituent’s current price (high or low). Between rebalances, index constituent weightings will fluctuate due to price performance.
MSCI World High Dividend Yield Index The MSCI World High Dividend Yield Index is based on the MSCI World Index, its parent index, and includes large and mid cap stocks across 23 Developed Markets (DM) countries*. The index is designed to reflect the performance of equities in the parent index (excluding REITs) with higher dividend income and quality characteristics than average dividend yields that are both sustainable and persistent. The index also applies quality screens and reviews 12-month past performance to omit stocks with potentially deteriorating fundamentals that could force them to cut or reduce dividends.
MSCI ACW ex US Index: The index is a free float-adjusted market capitalization weighted index that is designed to measure the equity market performance outside the U.S., including the global developed and emerging markets.
Price-to-book ratio (P/B Ratio) The price-to-book ratio (P/B Ratio) is a ratio used to compare a stock's market value to its book value. It is calculated by dividing the current closing price of the stock by the latest quarter's book value per share. Also known as the "price-equity ratio
Price-earnings ratio (P/E Ratio) The price-earnings ratio (P/E Ratio) is the ratio for valuing a company that measures its current share price relative to its per-share earnings. The price-earnings ratio can be calculated as: Market Value per Share/Earnings per Share.
CAPE Shiller PE: The cyclically adjusted price-to-earnings ratio is a valuation measure usually applied to the S&P 500 equity market. Defined as price divided by the average of ten years of earnings (moving average), adjusted for inflation.
Enterprise Value/EBIDA (EV/EBTDA): A popular valuation multiple used to measure the value of a company relative to its earnings before interest, taxes, depreciation and amortization. It’s often used in conjunction with the P/E ratio.
Price/cash flow ratio: The price/cash flow ratio (also called price-to-cash flow ratio or P/CF), is a ratio used to compare a company's market value to its cash flow
Price to Sales: The price to sales ratio is is a ratio used to compare a company's market value to its sales
MSCI World Momentum Index The MSCI World Momentum Index is based on MSCI World, its parent index, which includes large and mid cap stocks across 23 Developed Markets (DM) countries*. It is designed to reflect the performance of an equity momentum strategy by emphasizing stocks with high price momentum, while maintaining reasonably high trading liquidity, investment capacity and moderate index turnover.
MSCI World Index The MSCI World Index, which is part of The Modern Index Strategy, is a broad global equity benchmark that represents large and mid-cap equity performance across 23 developed markets countries. It covers approximately 85% of the free float-adjusted market capitalization in each country and MSCI World benchmark does not offer exposure to emerging markets.
Earnings Surprise: An earnings surprise occurs when a company's reported results are above or below analysts' expectations.
Minimum Volatility Factor: A category of stocks that are characterized by relatively less movement in share price than many other equities.
34 IBG-24534
* Per MSCI Developed Markets countries include: Australia, Austria, Belgium, Canada, Denmark, Finland, France, Germany, Hong Kong, Ireland, Israel, Italy, Japan, Netherlands, New Zealand, Norway, Portugal, Singapore, Spain, Sweden, Switzerland, the UK and the US.

Definitions
Quality Factor: One of the six widely recognized, research-based smart beta factors that refers to “quality” equities. Companies whose stocks qualify exhibit consistent profitability, stability of earnings, low financial leverage and other characteristics consistent with long-term reliability such as ethical corporate governance.
Cross-Sectional Dispersion: The Cross-Sectional Dispersion is defined as the standard deviation of returns of securities over a period.
Implied Volatility: The estimated volatility of a security's price. In general, implied volatility increases when the market is bearish and decreases when the market is bullish. This is due to the common belief that bearish markets are more risky than bullish markets.
Call Provisions: A call provision is a right for the issuer in the event they wish to buy back a portion of an issuer before maturity.
Size factor: A smart beta factor based on the tendency of small-cap stocks to outperform their large-cap peers over long time periods.
Yield Factor: A factor which screens for companies with a higher than average dividend yield relative to the broad market, and which have demonstrated dividend sustainability and persistence.
Momentum Factor: The tendency for a security to maintain a certain direction of price trajectory. This tendency is well documented in academic research, which has made “momentum” one of the six smart beta factors that are systematically being isolated in new-generation strategic indexes.
Standard Deviation: Measures the historical dispersion of a security, fund or index around an average. Investors use standard deviation to measure expected risk or volatility, and a higher standard deviation means the security has tended to show higher volatility or price swings in the past.
Excess Returns: A security’s return minus the return from another security in the same time period.
Value Factor: One of the basic elements of “style”-focused investing that focuses on companies that may be priced below intrinsic value. The most commonly used methodology to assess value is by examining price-to-book (P/B) ratios, which compare a company’s total market value with its assessed book value.
Current Short Interest (%): The percentage of tradable outstanding shares which have been shorted. Used as a measure of investor sentiment.
Compounded Annual Growth Rate (CAGR): The mean annual growth rate over a specific period longer than one year.
Earnings Per Share (EPS): A profitability measure that is calculated by dividing a company’s net income by the number of shares outstanding.
EPS Growth: The Compounded Annual Growth Rate (CAGR) of the operating Earnings per Share (EPS) over the specified time period.
Yield: The income produced by an investment, typically calculated as the interest received annually divided by the investment’s price.
Basis Point: One hundredth of one percent, or 0.01%.
Yield Curve: A graph or line that plots the interest rates or yields of bonds with similar credit quality but different durations, typically from shortest to longest duration. When the yield curve is said to be flat, it means the difference in yields between bonds with shorter and longer durations is relatively narrow. When the yield curve is said to be steepened, it means the difference in yields between short term and long term bonds increases.
Spread Changes: Changes in the spread between Treasury securities and non-Treasury securities that are identical in all respects except for quality rating.
Bloomberg Barclays Global Aggregate Bond Index
The Bloomberg Barclays Global Aggregate Index is a flagship measure of global investment grade debt from twenty-four local currency markets. This multi-currency benchmark includes treasury, government-related, corporate and securitized fixed-rate bonds from both developed and emerging markets issuers.
Bloomberg Barclays US Credit Index
The Bloomberg Barclays US Credit Index measures the investment grade, US dollar-denominated, fixed-rate, taxable corporate and government related bond markets. It is composed of the US Corporate Index and a non-corporate component that includes foreign agencies, sovereigns, supranationals and local authorities.
35 IBG-24534

Definitions
Bloomberg Barclays US Corporate Bond Index
The Bloomberg Barclays US Corporate Bond Index measures the investment grade, US dollar-denominated, fixed-rate, taxable corporate and government related bond markets. It is composed of the US Corporate Index and a non-corporate component that includes foreign agencies, sovereigns, supranationals and local authorities.
S&P 500 Pure Growth Index: The S&P 500® Pure Growth index is a style-concentrated index designed to track the performance of stocks that exhibit the strongest growth characteristics by using a style-attractiveness-weighting scheme.
S&P 500 Pure Value Index: The S&P 500® Pure Value index is a style-concentrated index designed to track the performance of stocks that exhibit the strongest value characteristics by using a style-attractiveness-weighting scheme.
S&P 500 Equal Weighted Index: The S&P 500® Equal Weight Index (EWI) is the equal-weight version of the widely-used S&P 500. The index includes the same constituents as the capitalization weighted S&P 500, but each company in the S&P 500 EWI is allocated a fixed weight - or 0.2% of the index total at each quarterly rebalance.
EURO STOXX 50 Equal Weight Index: The EURO STOXX® 50 Equal Weight Index measures the performance of the the same stocks as the standard free-float market cap weighted indices but use a different weighting scheme by attributing to each component the same weight.
The Global Industry Classification Standard (GICS) An industry taxonomy developed in 1999 by MSCI and Standard & Poor’s (S&P) for use by the global financial community. The GICS structure consists of 10 sectors, 24 industry groups, 67 industries and 156 sub-industries [1]into which S&P has categorized all major public companies.
Credit Spread A credit spread is the difference in yield between a US Treasury bond and a debt security with the same maturity but of lesser quality.
S&P 500 Health Care Sector Index:The Index comprises of those companies included in the S&P 500 that are classified as members of the GICS® health care sector.
S&P 500 Consumer Discretionary Index : The Index comprises of those companies included in the S&P 500 that are classified as members of the GICS® consumer discretionary sector..
S&P 500 Consumer Staples Index:. The Index comprises of those companies included in the S&P 500 that are classified as members of the GICS® consumer staples sector.
S&P 500 Financial Sector Index: The Index comprises of those companies included in the S&P 500 that are classified as members of the GICS® financial sector.
S&P 500 Utilities Index: The Index comprises of those companies included in the S&P 500 that are classified as members of the GICS® utilities sector.
S&P500 Information Technology Sector Index: The Index comprises of those companies included in the S&P 500 that are classified as members of the GICS® information technology sector.
S&P 500 Industrial Sector Index: The Index comprises of those companies included in the S&P 500 that are classified as members of the GICS® industrial sector.
S&P 500 Materials Sector Index: The Index comprises of those companies included in the S&P 500 that are classified as members of the GICS® materials sector.
S&P 500 Real Estate Sector Index: The Index comprises of those companies included in the S&P 500 that are classified as members of the GICS® real estate sector.
S&P 500 Telecommunication Sector Index: The Index comprises of those companies included in the S&P 500 that are classified as members of the GICS® telecommunication services sector.
Headline CPI: A widely used measure of inflation, including all components of the consumer prices. It helps evaluate changes in cost of living.
Core CPI: A widely used measure of inflation, excluding food & energy prices. It helps evaluate changes in cost of living.
Core Sticky CPI: A consumer price index that includes the sticky categories based on the frequency of their price adjustment.
Breakeven Inflation Rate : It is a market based measure of expected inflation. It is the difference between the yield of a nominal bond and an inflation linked bond of the same maturity.
36 IBG-24534

Appendix D: Important Disclosures
37 IBG-24534

Important Disclosures
The views expressed in this material are the views of SPDR Americas Research Team and are subject to change based on market and other conditions. This document contains certain statements that may be deemed forward-looking statements. Please note that any such statements are not guarantees of any future performance and actual results or developments may differ materially from those projected.
The information provided does not constitute investment advice and it should not be relied on as such. It should not be considered a solicitation to buy or an offer to sell a security. It does not take into account any investor’s particular investment objectives, strategies, tax status or investment horizon. You should consult your tax and financial advisor.
All material has been obtained from sources believed to be reliable. There is no representation or warranty as to the accuracy of the information and State Street shall have no liability for decisions based on such information.
All the index performance results referred to are provided exclusively for comparison purposes only. It should not be assumed that they represent the performance of any particular investment.
Bonds generally present less short-term risk and volatility than stocks, but contain interest rate risk (as interest rates rise, bond prices usually fall); issuer default risk; issuer credit risk; liquidity risk; and inflation risk. These effects are usually pronounced for longer-term securities. Any fixed income security sold or redeemed prior to maturity may be subject to a substantial gain or loss.
The values of debt securities may decrease as a result of many factors, including, by way of example, general market fluctuations; increases in interest rates; actual or perceived inability or unwillingness of issuers, guarantors or liquidity providers to make scheduled principal or interest payments; illiquidity in debt securities markets; and prepayments of principal, which often must be reinvested in obligations paying interest at lower rates.
Equity securities may fluctuate in value in response to the activities of individual companies and general market and economic conditions.
Investments in small-sized companies may involve greater risks than in those of larger, better known companies.
Investments in mid-sized companies may involve greater risks than in those of larger, better known companies, but may be less volatile than investments in smaller companies.
Companies with large market capitalizations go in and out of favor based on market and economic conditions. Larger companies tend to be less volatile than companies with smaller market capitalizations. In exchange for this potentially lower risk, the value of the security may not rise as much as companies with smaller market capitalizations.
Value stocks can perform differently from the market as a whole. They can remain undervalued by the market for long periods of time.
Foreign investments involve greater risks than US investments, including political and economic risks and the risk of currency fluctuations, all of which may be magnified in emerging markets.
Because of their narrow focus, sector funds tend to be more volatile.
Commodities investing entail significant risk as commodity prices can be extremely volatile due to wide range of factors Bond funds contain interest rate risk (as interest rates rise bond prices usually fall); the risk of issuer default; issuer credit risk; liquidity risk; and inflation risk.
Asset Allocation is a method of diversification which positions assets among major investment categories. Asset Allocation may be used in an effort to manage risk and enhance returns. It does not, however, guarantee a profit or protect against loss.
Actively managed ETFs do not seek to replicate the performance of a specified index. Because the SPDR SSGA Active Asset Allocation ETFs are actively managed, they are therefore subject to the risk that the investments selected by SSGA may cause the ETFs to underperform relative to their benchmarks or other funds with similar investment objectives.
38 IBG-24534

Important Disclosures (continued)
The trademarks and service marks referenced herein are the property of their respective owners. Third party data providers make no warranties or representations of any kind relating to the accuracy, completeness or timeliness of the data and have no liability for damages of any kind relating to the use of such data.
Standard & Poor’s, S&P and SPDR are registered trademarks of Standard & Poor/s Financial Services LLC (S&P); Dow Jones is a registered trademark of Dow Jones Trademark Holdings LLC (Dow Jones); and these trademarks have been licensed for use by S&P Dow Jones Indices LLC (SPDJI) and sublicensed for certain purposes by State Street Corporation. State Street Corporation’s financial products are not sponsored, endorsed, sold or promoted by SPDJI, Dow Jones, S&P, their respective affiliates and third party licensors and none of such parties make any representation regarding the advisability of investing in such product(s) nor do they have any liability in relation thereto, including for any errors, omissions, or interruptions of any index.
Distributor: State Street Global Advisors Funds Distributors LLC, member FINRA, SIPC, an indirect wholly owned subsidiary of State Street Corporation. References to State Street may include State Street Corporation and its affiliates. Certain State Street affiliates provide services and receive fees from the SPDR ETFs.
Before investing, consider the funds’ investment objectives, risks, charges and expenses. To obtain a prospectus or summary prospectus which contains this and other information, call 1-866-787-2257 or visit www.spdrs.com. Read it carefully.
State Street Global Advisors, One Lincoln Street, Boston, MA 02111-2900.
© 2017 State Street Corporation — All Rights Reserved.
Tracking Code: IBG-24534
Expiration Date: August 31, 2018
Not FDIC Insured — No Bank Guarantee — May Lose Value.
39 IBG-24534