state street global advisors spdr etfs chart...
TRANSCRIPT

IBG-25020
September 2017 Edition
State Street Global
Advisors SPDR® ETFs
Chart Pack
For Public Use Please see Appendix C for more information on investment terms used in this Chart Pack.

Chart Pack Table of Contents
2 IBG-25020
I. Market Environment
• Performance
• SSGA Current Positioning
• Investor Confidence
• Volatility
II. Factors, Valuations & Flows
• Global Factor Trends
• US Factor Trends
• Global Valuations
• Asset Class Flows
III. Sectors
• Flows & Returns
• Valuations
• Earnings Trends
IV. Fixed Income
• Bond Market
• Yield Curve
• Treasury Market
• Rates Trends
• Credit Trends

Market Environment
3 IBG-25020

16.2 14.9
17.6
24.5
8.8
0.5
-0.9
1.0 2.3
11.9
4.4
17.0
28.3
6.5
3.6 3.2
15.2
-3.3
0.3
-1.3 0.0
2.2
0.2 0.9 1.1
4.1
0.3
US LARGE CAP US SMALL CAP DEVELOPED EMERGING HIGH YIELD AGG TREASURIES GOLD BROADCOMMODITIES
S&P 500 Index Russell 2000 Index MSCI EAFE Index MSCI EmergingMarkets Index
Bloomberg US HighYield Index
Barclays USAggregate Index
Bloomberg USTreasury Index
Gold Spot BloombergCommodity Index
Trailing 12 Month YTD Prior Month
Asset Class Performance — Looming Geopolitical Uncertainties and the Debt Ceiling Debate Kept Equity Performance Muted, but Lifted Gold to 11-Month Highs
Source: Bloomberg Finance, L.P. As of August 31, 2017. Past performance is not a guarantee of future results. Index returns are unmanaged and do not reflect the deduction of any fees or expenses. Index returns reflect all items of income, gain and loss and the reinvestment of dividends and other income. Performance returns for periods of less than one year are not annualized.
Major Asset Class Performance (%)
4 IBG-25020
Emerging Market Equities Navigated Geopolitical Risks and Showed Resiliency

Asset Class Performance — A Weaker Dollar Contributed Significantly to the Outperformance of Assets Abroad in 2017, Specifically in Developed Markets
Source: Bloomberg Finance, L.P. As of August 30, 2017. Past performance is not a guarantee of future results. Index returns are unmanaged and do not reflect the deduction of any fees or expenses. Index returns reflect all items of income, gain and loss and the reinvestment of dividends and other income. Performance returns for periods of less than one year are not annualized.
Year to Date Returns in Local Currency vs. in USD
5 IBG-25020
22.9
11.3 10.7 10.4 7.5 6.3 5.1
3.5 2.6 1.8
-8.8
5.3
4.1 7.9
9.2 13.1
6.1
4.6 8.4
28.2
11.3
14.8
18.3 16.7
19.4
11.2
3.5
7.2
10.2
-8.8
MSCI EmeringMarkets Index
S&P 500 Index MSCI ACWI Index MSCI ACWI Ex-USIndex
MSCI EAFE Index Euro Stoxx 50Index
MSCI Japan Index BloombergBarclays US
Aggregate BondIndex
BloombergBarclays GlobalAggregate Bond
Index
BloombergBarclays GlobalAggregate Bond
ex-US Index
Bloomberg DollarSpot Index
Ye
ar-t
o-D
ate
Re
turn
(%
)
Currency Return from Weaker Dollar Local Return
Local Currency Returns in Eurozone May Have More Room to Run Given the Strengthening Economic Activities in the Region
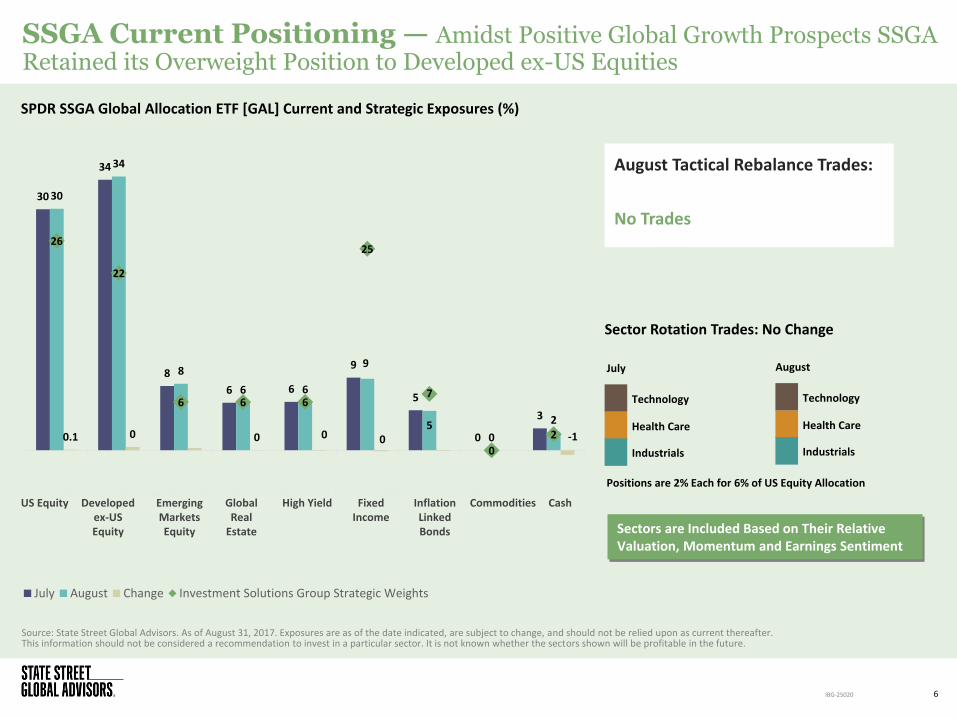
Source: State Street Global Advisors. As of August 31, 2017. Exposures are as of the date indicated, are subject to change, and should not be relied upon as current thereafter. This information should not be considered a recommendation to invest in a particular sector. It is not known whether the sectors shown will be profitable in the future.
SSGA Current Positioning — Amidst Positive Global Growth Prospects SSGA Retained its Overweight Position to Developed ex-US Equities
6
August
Sector Rotation Trades: No Change
August Tactical Rebalance Trades:
No Trades
IBG-25020
Positions are 2% Each for 6% of US Equity Allocation
SPDR SSGA Global Allocation ETF [GAL] Current and Strategic Exposures (%)
Technology
Health Care
Industrials
30
34
8
6 6
9
5
0
3
30
34
8
6 6
9
5 0
2
0.1 0 0 0 0 -1
26
22
6 6
25
7
0
2
US EquityDeveloped ex-US EquityEmerging Markets EquityGlobal Real EstateHigh Yield Fixed IncomeInflation Linked BondsCommodities Cash
July August Change Investment Solutions Group Strategic Weights
July
Technology
Health Care
Industrials
US Equity Developed ex-US Equity
Emerging Markets Equity
Global Real
Estate
High Yield Fixed Income
Inflation Linked Bonds
Commodities Cash
Sectors are Included Based on Their Relative Valuation, Momentum and Earnings Sentiment

107
99
70
80
90
100
110
120
130
140
Apr-02 May-03 Jun-04 Jul-05 Aug-06 Sep-07 Oct-08 Nov-09 Jan-11 Feb-12 Mar-13 Apr-14 May-15 Jun-16 Jul-17
State Street Investor Confidence Index 1 Year Moving Average
State Street Investor Confidence — Investor Confidence Dipped in August Amid Geopolitical Uncertainties, But Remained Near the Highest Level in 12 Months
Source: Bloomberg Finance, L.P. As of August 31, 2017. State Street Confidence Indexes Measures investor confidence or risk appetite quantitatively by analyzing the actual buying and selling patterns of institutional investors. The index assigns a precise meaning to changes in investor risk appetite: the greater the percentage allocation to equities, the higher risk appetite or confidence. A reading of 100 is neutral; it is the level at which investors are neither increasing nor decreasing their long-term allocations to risky assets. The results shown represent current results generated by State Street Investor Confidence Index. The results shown were achieved by means of a mathematical formula in addition to transactional market data, and are not indicative of actual future results which could differ substantially.
State Street Investor Confidence Index
7 IBG-25020
1-Year Average Started Turning Around

Cross-Asset Volatility — Volatility Across Major Asset Classes Remained Low in August, with All Assets Being Extremely Tranquil Relative to Historical Levels
Source: Bloomberg Finance, L.P. As of August 30, 2017. Past performance is not a guarantee of future results. Index returns are unmanaged and do not reflect the deduction of any fees or expenses. Standard deviation is a historical measure of the volatility of returns. If a portfolio has a high standard deviation, its returns have been volatile; a low standard deviation indicates returns have been less volatile.
8 IBG-25020
Cross-Asset Realized Volatility Monitor
29.3% 28.7% 28.0%
24.4%
7.4%
9.2%
7.1%
9.8% 10.1%
14.1%
9.5%
12.6% 14.1%
16.0% 16.1% 15.6%
9.7% 9.7%
9.4% 9.0%
S&P 500 Index MSCI Emerging MarketIndex
MSCI EAFE Index BloombergCommodity Index
90th Percentile Current As of 01/01/2017 10-Year Median 10th Percentile
7.6%
5.1%
6.4%
1.6%
2.4%
2.6%
3.2% 3.2% 3.5%
3.6% 3.3%
4.0%
1.7%
2.5% 2.6%
Bloomberg Barclays USCorporate High Yield Index
Bloomberg Barclays USAggregate Index
Bloomberg Barclays USTreasury Index
90-Day Annualized Standard Deviation (%)
Across Asset Classes, Volatility Sits Near or Below the Lowest 10th Percentile

Volatility Seasonality — The VIX Index Jumped Above 15 in Mid-August Triggered by Intensified Geopolitical Tensions, but is Still Below its 10-Year Average
*10-Year Average is the daily average from 2007 to 2016. Bloomberg Finance, L.P. As of August 31, 2017. Past performance is not a guarantee of future results.
9 IBG-25020
CBOE VIX Index Level in 2017 vs. 10-Year Average
5
10
15
20
25
30
Jan Feb Mar Apr May Jun Jul Aug Sep Oct Nov Dec
VIX
Ind
ex
10-Year Average* VIX Index in 2017
If the VIX to Revert to Its 10-Year Average That Would Imply an Increase of More Than 100% from its Current Level
This Month Debt Ceiling Debate and Fed Balance Sheet Talk May Put the Current Low Volatility Market to a Test.

Factors, Valuations and Flows
10 IBG-25020

90
92
94
96
98
100
102
104
106
Sep-16 Oct-16 Dec-16 Jan-17 Mar-17 May-17 Jun-17 Aug-17
No
rmal
ize
d In
de
x Le
vel
Min. Vol Quality Size Yield Momentum Value
Global Factor Trends — Min. Vol. and Quality Rebounded Amid Concerns About Geopolitical Tensions, While Momentum Continued to Lead
11
Source: Bloomberg Finance, L.P. As of August 30, 2017. Past performance is not a guarantee of future results. MSCI World Minimum Volatility Index, MSCI World Enhanced Value Index, MSCI World Quality Index, MSCI World Equal Weighted Index, MSCI World High Dividend Yield Index, and MSCI World Momentum Index were used above compared to the MSCI World Index. Index returns are unmanaged and do not reflect the deduction of any fees or expenses.
MSCI World Factor Index Price Returns versus MSCI World Index Period Excess Price Returns versus MSCI World Index
IBG-25020
1.1%
0.0%
0.8%
1.3%
-0.4%
-0.2%
-1.2%
-2.9%
2.0%
7.1%
0.8%
-3.3%
-6.7%
-5.4%
-1.4%
3.7%
0.4%
0.3%
Min. Vol
Yield
Quality
Momentum
Size
Value
Trailing 12 Months YTD August
Yield and Min. Vol. are Among the Worst Performers on Year-to-Date and Trailing 12 Months Basis

US Factor Trends — Momentum Has Been the Top Performer in Six Out of Eight Months This Year, While Other Factors Rotated at the Bottom
12
Source: FactSet. As of August 30, 2017 Past performance is not a guarantee of future results. Index returns are unmanaged and do not reflect the deduction of any fees or expenses.
Returns of MSCI USA Factor Indices and the MSCI USA Index
IBG-25020
MSCI USA Quality Index
MSCI USA Enhanced Value Index
MSCI USA Minimum Volatility Index
MSCI USA High Dividend Yield Index
MSCI USA Equal Weighted Index
MSCI USA Momentum Index
MSCI USA Index
Jan-17 Feb-17 Mar-17 Apr-17 May-17 Jun-17 Jul-17 Aug-17
3.24 4.49 2.00 2.45 4.65 1.05 3.35 0.80
2.38 4.36 0.60 1.70 1.84 1.04 1.92 0.16
1.96 4.32 -0.02 1.31 1.68 0.48 1.89 0.12
1.70 4.12 -0.12 0.96 1.32 0.29 1.81 -0.51
1.22 3.69 -0.13 0.78 1.11 0.05 1.52 -0.59
1.20 3.53 -0.33 0.07 0.50 -0.62 1.48 -0.67
0.70 3.05 -1.34 -0.07 -0.42 -1.06 1.41 -1.64
Min. Vol. Outperformed in August Amidst Geopolitical Uncertainties
Min. Vol. Outperformed in August Amidst Geopolitical Uncertainties

US Factor Trends — Tech. and Financials Have Been the Key Drivers of the Momentum and Value Performance, Respectively
13
Source: Bloomberg Finance, L.P. As of August 30, 2017. Index returns are unmanaged and do not reflect the deduction of any fees or expenses.
Momentum vs. Tech
IBG-25020
Value vs. Financials
310
328
346
364
382
400
418
436
6600
6800
7000
7200
7400
7600
7800
8000
Aug-16 Dec-16 Apr-17 Aug-17
S&P
50
0 F
inan
cial
s In
de
x
MSC
I USA
Val
ue
Ind
ex
Leve
l
MSCI USA Value Index S&P 500 Financials Index
750
800
850
900
950
1000
1050
1700
1750
1800
1850
1900
1950
2000
2050
2100
2150
2200
Aug-16 Dec-16 Apr-17 Aug-17
S&P
50
0 T
ech
no
logy
Ind
ex
MSC
I USA
Mo
me
ntu
m In
de
x Le
vel
MSCI USA Momentum Index S&P 500 Technology Index
Momentum Continues to Rally, as Investors Still Like the Secular Growth Provided by the Tech Sector

3.13
2.22
1.70 1.75
1.34
1.60
2.56
2.04
1.73 1.75
1.41
1.61
3.19
2.59
2.42
2.96
2.14 2.20
1.64
1.16 1.05
1.16
0.90 0.96
2.93
2.29
1.59 1.48
1.34
1.54
S&P 500 Index Russell 2000 Index MSCI EAFE Index MSCI EM Index MSCI Japan Index Euro Stoxx 50 Index
Current 15 Year Avg. 15 Year High 15 Year Low As of Jan-1-2017
Global Valuations — Valuations Outside the US Have Risen Since the Beginning of the Year, But Are Near or Below Their 15-Year Averages
Source: Bloomberg Finance, L.P., State Street Global Advisors. As of August 31, 2017. Characteristics are as of the date indicated and should not be relied upon as current thereafter.
14
Global Equity Market Price to Book Ratios (P/B)
IBG-25020
Small Caps are the Only Segment Whose P/B Ratio Has Fallen This Year

Flow Trends — Ahead of the September Debt Ceiling Debate and Potential Fed’s Balance Sheet Reduction, the Pace of Both Equity and Fixed Income Inflows Slowed
Source: State Street Global Advisors, Bloomberg Finance, L.P. As of August 30, 2017 Sectors, asset classes and flows are as of the date indicated, are subject to change, and should not be relied upon as current thereafter.
15 IBG-25020
Monthly Fund Flows
Equity Monthly Fund Flows
-10
0
10
20
30
40
50
60
70
Sep-16 Oct-16 Nov-16 Dec-16 Jan-17 Feb-17 Mar-17 Apr-17 May-17 Jun-17 Jul-17 Aug-17
Bill
ion
s
US Sector US Equity International Currency Hedged
9 14
49
58
26 33
36
24 20
31
19 14
8 4 3
7 13 12 10 11 11
14 12 9
0
0 -3 -4 -1
2
-1
1
-1
1
-3
1
-15
-5
5
15
25
35
45
55
65
Sep-16 Oct-16 Nov-16 Dec-16 Jan-17 Feb-17 Mar-17 Apr-17 May-17 Jun-17 Jul-17 Aug-17
Bill
ion
s
Equity Fixed Income Commodity
The Gap Between Equity and Fixed Income Flows Shrank to the Smallest Since The Election
International Equity Flows Beat US Flows For the Fourth Consecutive Month and Lead on a Year to Date Basis

Sectors
16 IBG-25020

17
Sector Flow and Returns Heat Map — Sector Return Dispersion Widened, as Investors Favored Industrials and Shied Away from Consumers and Health Care
IBG-25020
Positioning Returns
Prior Month Flow ($M)
YTD Flow ($M)
Current Short Interest (%)
1M Prior Short Interest (%)
Prior Month Return (%)
YTD Return (%)
Momentum Factor Rank1
Source: State Street Global Advisors, Bloomberg Finance, L.P., as of August 31, 2017. 1 Momentum rank is based on a composite momentum z-score. Smaller number indicates higher momentum. The composite z-score is calculated as the average z-score of the 3, 6, and 12 month relative sector performance versus the S&P 500 minus the most recent months performance. Z-score indicates how many standard deviations an element is from the mean. A z-score can be calculated from the following formula. z = (X - μ) / σ where z is the z-score, X is the sector relative performance. μ is the mean of the eleven sector relative performance, and σ is the standard deviation of sectors’ relative performance. Asset classes and flows are as of the date indicated, are subject to change, and should not be relied upon as current thereafter. Past performance is not a guarantee of future results. Index returns are unmanaged and do not reflect the deduction of any fees or expenses. Performance returns for periods of less than one year are not annualized. Sector Returns are based on the following sector indices: Financials = S&P 500 Financials Sector Index, Industrials = S&P 500 Industrials Sector index, Energy = S&P 500 Energy Sector index, Materials = S&P 500 Materials Sector Index, Consumer Discretionary = S&P 500 Consumer Discretionary Sector Index, Heath Care = S&P 500 Health Care Sector Index, Technology = S&P 500 Information Technology Sector Index, Real Estate = S&P 500 Real Estate Sector Index, Consumer Staples = S&P 500 Consumer Staples Sector Index, Utilities = S&P 500 Utilities Sector Index, Telecom = S&P 500 Telecommunication Sector Index
Telecommunications 14 -73 4 4 -3.0 -7.9 10
Consumer Discretionary -1,501 -1,284 12 10 -1.8 11.0 8
Consumer Staples -1,426 -530 15 15 -1.1 7.5 9
Energy 198 2,150 11 11 -5.2 -15.1 11
Financial -510 4,913 6 6 -1.6 7.0 3
Health Care -948 2,711 11 11 1.8 19.1 2
Industrials 1,358 2,316 9 10 0.2 9.7 6
Materials 506 -1,188 12 10 0.9 11.9 4
Technology 841 6,744 7 7 3.5 26.6 1
Real Estate 347 3,693 5 5 1.1 8.9 7
Utilities 374 362 20 23 3.3 15.0 5
40% of the Flows into Industrials Were Targeted Positions In the Aerospace and Defense Industry 40% of the Flows into Industrials Were Targeted Positions In the Aerospace and Defense Industry

3.1
5.3 5.0
5.3
4.6
3.8 4.0
2.6
1.8
2.1
1.4
2.6
4.4
3.2
3.8
3.1 2.8
3.5
2.3 2.2
1.7 1.5
3.2
5.8
5.1 5.3
4.7
4.0
5.6
3.6
3.1
2.5 2.4
1.6
2.8
1.8
2.5
1.6 1.5
2.2
1.3 1.5
1.2
0.6
2.9
5.1
4.7
4.4 4.5
3.8 3.5
3.0
2.1 1.9
1.4
S&P 500 Index ConsumerStaples
ConsumerDiscretionary
InformationTechnology
Industrials Materials Health Care Telecom Energy Utilities Financials
Current 15 Year Avg. 15 Year High 15 Year Low As of 1-Jan-2017
Sector Valuations — With Broad Market Valuations Elevated, the Majority of Sectors are Also Trading Above Historical Averages. Some are at Their 15-Year Highs
Source: Bloomberg Finance, L.P., State Street Global Advisors. As of August 31, 2017 Characteristics are as of the date indicated and should not be relied upon as current thereafter.
18
US Equity Market Price to Book Ratios
IBG-25020
Energy and Financials are the Only Sectors Trading Below their 15-Year Average
Energy and Financials are the Only Sectors Trading Below their 15-Year Average

Sector Earnings Trends — Large Cap Earnings Outpaced Small Caps Across Most Sectors In Q2 With a Greater Number of Companies With Upside Surprises
19
Source: FactSet. As of August 30, 2017. As of 8/30/2017, 99% of S&P 500 Companies and 94% of S&P 600 Small Cap Companies reported earnings. Sectors classifications are based on GICS sector classification. Energy sector is excluded because small cap energy sector do not have a reported Q2 EPS growth
IBG-25020
Large and Small Cap Q2 Reported EPS Growth and % Companies with Positive Earnings Surprise
10.5
0.0 3.7
10.3 6.6 6.4
16.1 8.0 7.5 4.8
10.8
-6.8 -1.6
-15.8
6.2
-79.0
-3.6
15.0
0.9 0.4 3.0
28.2
0
10
20
30
40
50
60
70
80
90
100
-100.0
-80.0
-60.0
-40.0
-20.0
0.0
20.0
40.0
60.0
80.0
100.0
Overall Index Cons. Disc. Cons. Staples Financials Health Care Industrials Tech. Materials Real Estate Telecom Utilities
% C
om
pan
ies
of
Po
siti
ve S
urp
rise
Q2
EP
S G
row
th (
%)
S&P 500 Index EPS Growth S&P 600 Small Cap Index EPS Growth
S&P 500 Index % Companies of Positive Surprise S&P 600 Small Cap Index % Companies of Positive Surprise
Utilities is the Only Sector Where Small Cap Earnings Growth Outpaced that of Small Caps
Utilities is the Only Sector Where Small Cap Earnings Growth Outpaced that of Small Caps

Fixed Income
20 IBG-25020

Bond Market — The Opportunities for Income Generation Remain Scarce, and Require Investors to Balance Duration and Credit Risks Uniquely
Source: Bloomberg Finance, L.P. As of August 31, 2017. Past performance is not a guarantee of future results. Index returns are unmanaged and do not reflect the deduction of any fees or expenses.
21 IBG-25020
Global Yield to Worst (%)
1.0
1.5 1.8
2.3 2.4 2.7
3.0
4.5
5.7
7.7
7.0
6.2 6.5
6.1
5.0
7.3
5.9
3.9
0.2
0.4
0.0
1.0
0.4 0.3
1.0
2.6
3.8
-0.5
0.0
0.5
1.0
1.5
2.0
2.5
3.0
3.5
4.0
4.5
0.0
1.0
2.0
3.0
4.0
5.0
6.0
7.0
8.0
9.0
BloombergBarclays Global
Agg GovernmentIndex
BloombergBarclays Global-Aggregate Index
BloombergBarclays US
Treasury Index
BloombergBarclays Global
Agg Credit Index
BloombergBarclays US Agg
Index
BloombergBarclays US MBS
Index Index
BloombergBarclays USCredit Index
BloombergBarclays EM USDAggregate Index
BloombergBarclays US
Corporate HighYield Index
Cre
dit
Sp
read
(%
)
Yie
ld t
o W
ors
t (%
) o
r D
ura
tio
n (
Ye
ars)
Yield to Worst Duration Credit Spread Over Treasuries Bloomberg Barclays US Aggregate Bond Index (the Agg) 20-Year Average Yield
4.2
The Majority of Fixed Income Assets are Generating a Yield Less than the Historical Average of the Agg, Except for Sectors with High Credit Risks
The Majority of Fixed Income Assets are Generating a Yield Less than the Historical Average of the Agg, Except for Sectors with High Credit Risks

14 6
0
-2 -3 -4 -5 -3 -1
7
56 58 52
40
16 6
-9 -13 -15
-17
80 82 77 72 69
76 81 83 84 72
-40
-20
0
20
40
60
80
100
Ch
ange
in B
ps
Aug-17 YTD Change 1 Year
0.4
0.5 0.6
0.8 1.2 1.5
1.9
2.2 2.4
3.1
0.3 0.3 0.5 0.6 0.8 0.9
1.2
1.5 1.6
2.2
0.9 1.0 1.1 1.2
1.3 1.4
1.7 1.9
2.1
2.7
0.0
0.5
1.0
1.5
2.0
2.5
3.0
3.5
1M 3M 6M 1Y 2Y 3Y 5Y 7Y 10Y 30Y
Yie
ld (
%)
US Treasury Active Curve 12/31/2016 US Treasury Active Curve 8/31/2016 US Treasury Active Curve 8/31/2017
Yield Curve — The Yield Curve Shifted Downward and Continued to Flatten in August, as Expectations of Another Rate Hike Receded Amid Tepid Inflation
Source: Bloomberg Finance, L.P. As of August 31, 2017. Past performance is not a guarantee of future results.
22
US Treasury Curve
IBG-25020
The Yield Curve Has Flattened in 2017, with the Fed Pushing on the Short End and Slow Growth and Inflation Pulling on the Long End
The Yield Curve Has Flattened in 2017, with the Fed Pushing on the Short End and Slow Growth and Inflation Pulling on the Long End

Treasury Market — Yields on T-bills Due at the Beginning of October Climbed Up as Traders Priced in the Risk of a Technical Default By The Federal Government
Source: Bloomberg Finance, L.P. As of August 31, 2017. Past performance is not a guarantee of future results.
23 IBG-25020
Treasury Bill Yield to Maturity (%)
0.80
0.85
0.90
0.95
1.00
1.05
1.10
1.15
1.20
Yie
ld t
o M
atu
rity
(%
)
6-Month T-Bill 10/05/17 1-Year T-Bill 09/14/17 6-Month T-Bill 09/28/17 1-Year T-Bill 10/12/17
Yields of October T-Bills are More Than 20% Higher Than September Ones With the Same Tenor
Yields of October T-Bills are More Than 20% Higher Than September Ones With the Same Tenor

Rates Trends — The Copper-to-Gold Ratio Rose on Synchronized Global Economic Growth, While Treasury Yields Pointed to Tepid Growth Prospects in the US
Source: Bloomberg Finance, L.P. As of August 31, 2017 Past performance is not a guarantee of future results. Index returns are unmanaged and do not reflect the deduction of any fees or expenses .
24 IBG-25020
Copper-to-Gold Price Ratio vs. US 10-Year Treasury Yield
0.15
0.18
0.21
0.24
1.5
1.8
2.1
2.4
2.7
Co
pp
er-
to-G
old
Pri
ce R
atio
10
-Ye
ar T
reas
ury
Yie
ld (
%)
10-Year Treasury Yield Copper/Gold Price Ratio
The Copper-to-Gold Ratio and US 10-Year Treasury Yields Have Been Diverging Since July
The Copper-to-Gold Ratio and US 10-Year Treasury Yields Have Been Diverging Since July

385
583
0
500
1000
1500
2000
2500
OA
S B
ps
BofA Merrill Lynch US High Yield Index OAS 20-Year Average OAS
Credit Trends — High Yield Spreads Widened Last Month to a Degree not Seen Since February 2016, but Remain Well Below Historical Averages
Source: St. Louis Federal Reserve. As of August 31, 2017. Characteristics are as of the date given and should not be relied upon as current thereafter.
25
High Yield Spread Tightening
IBG-25020
High Yield Spreads Are 34% Below their Historical Average
High Yield Spreads Are 34% Below their Historical Average

Credit Trends — Higher Credit Bonds are Playing Catch-Up as the Credit Spread Tightening of Lower Rated Bonds has Stalled Since the Summer Began
Source: Bloomberg Finance, L.P. As of August 31, 2017. Characteristics are as of the date given and should not be relied upon as current thereafter. AAA-rated corporate bonds are represented by the BofA Merrill Lynch AAA US Corporate Index. AA-rated corporate bonds are represented by the BofA Merrill Lynch AA US Corporate Index. A-rated corporate bonds are represented by the BofA Merrill Lynch A US Corporate Index. BBB-rated corporate bonds are represented by the BofA Merrill Lynch BBB US Corporate Index. BB-rated corporate bonds are represented by the BofA Merrill Lynch BB US High Yield Index. B-rated corporate bonds are represented by the BofA Merrill Lynch B US Corporate Index. CCC & Lower-rated bonds are represented by the BofA Merrill Lynch CCC& Lower US High Yield Index.
26
Corporate Bond Returns and Spreads by Credit Quality
IBG-25020
1.3 0.9 0.9 0.7
0.3
-0.1
-0.8
6.0
4.4
5.1
6.2 6.0 5.5
8.1 5.0 4.0 4.0 8.0 8.0
21.0
46.0
-4 -10 -13
-17
-35 -32
-100
-120.0
-100.0
-80.0
-60.0
-40.0
-20.0
0.0
20.0
40.0
60.0
-1.0
1.0
3.0
5.0
7.0
9.0
11.0
13.0
AAA AA A BBB BB B CCC & Lower
Investment Grade High Yield
Re
turn
(%
)
August Return YTD Return August OAS Change (bps) YTD OAS Change (bps)
Spre
ad W
ide
ne
d
Spre
ad T
igh
ten
ed
CCC & Lower Rated Bonds Still Lead on Performance on an Year to Date Basis
CCC & Lower Rated Bonds Still Lead on Performance on an Year to Date Basis
Appendix A: Flow Summary
27 IBG-25020

Fund Flow Summary
28 IBG-25020
Source: State Street Global Advisors, Bloomberg Finance, L.P. As of August 31, 2017. Sectors, asset classes and flows are as of the date indicated, are subject to change, and should not be relied upon as current thereafter.
Asset Category Prior Month ($M) Year to Date ($M) Trailing 12 Month ($M)
Equity 10,471 201,118 332,526 Fixed Income 9,812 92,653 114,782
Equity Region U.S. 2,182 88,868 203,371 Global 1,614 7,281 12,128 Currency Hedged -1,091 -738 -4,914 International — Broad 8,063 85,783 102,473 International — Region 792 17,650 15,273 International — Single Country -1,088 2,275 4,195
Fixed Income Sector Government 1,404 17,542 15,132 Inflation Protected 543 4,792 9,443 Municipals 619 3,063 4,919 Aggregate 3,492 24,074 32,247 Preferred 272 3,990 4,405 Convertible -61 890 1,272 Mortgage-Backed 354 2,999 4,075 Asset Backed 0 20 -81 Bank Loans -188 2,375 5,733
High Yield Corporates versus Investment Grade Corporate Investment Grade 2,949 29,444 29,714 High Yield 419 3,412 7,870 Other 7 39 43
US Government Maturity Band Ultra Short 447 2,876 3,487 Short Term 3,352 27,488 41,068 Intermediate 4,872 44,280 50,448 Long Term (>10 yr) -257 5,753 3,368
How to Read Heatmap
Most Flows in Period
Least Flows in Period
—
—
—
—
—
—
—
—
—

Appendix B: Asset Class Forecast
29 IBG-25020

SSGA Asset Class Forecasts
Source: State Street Global Advisors (SSGA) Investment Solutions Group. The forecasted returns are based on SSGA’s Investment Solutions Group’s June 30, 2017 forecasted returns and long-term standard deviations. The forecasted performance data is reported on a gross of fees basis. Additional fees, such as the advisory fee, would reduce the return. For example, if an annualized gross return of 10% was achieved over a 5-year period and a management fee of 1% per year was charged and deducted annually, then the resulting return would be reduced from 61% to 54%. The performance includes the reinvestment of dividends and other corporate earnings and is calculated in the local (or regional) currency presented. It does not take into consideration currency effects. The forecasted performance is not necessarily indicative of future performance, which could differ substantially. Please reference Appendix B for the assumptions used by SSGA Investment Solutions Group to create asset class forecasts.
30
Forecasted Return (%) as of June 30, 2017
IBG-25020
3.1 3.3
3.6
4.8
4.1
2.5 2.1
1.3
3.8
4.6
3.7
5.3
6.7
6.2 6.1
9.5
3.8
2.3
1.8
5.9
6.6
7.4
6.5
8.1
US Small Cap US Large Cap GlobalDeveloped
Ex-US
EmergingMarketEquities
US High Yield USInvestment
Grade Bonds
USGovernment
Bonds
Commodities Value Tilted Quality Tilted EqualWeighted
Min.Variance
Asset Class Global Factors
1 Year 3–5 Year

Asset Class Forecast Assumptions
31 IBG-25020
Forecast Assumptions
For Fixed Income: Our return forecasts for fixed income derive from current yield conditions together with expectations as to how real and nominal yield curves could evolve relative to historical averages. For corporate bonds, we also analyze credit spreads and their term structures, with separate assessments of investment-grade and high-yield bonds.
For Equities: Our long-term equity forecasts begin with expectations for developed market large capitalization stocks. The foundation for these forecasts are estimates of real return potential, derived from current dividend yields, forecast real earnings growth rates, and potential for expansion or contraction of valuation multiples. Our forecasting method incorporates long run estimates of potential economic growth based on forecast labor and capital inputs to estimate real earning growth.
For Factor Returns: Over a one to three-year forecast horizon, we look to see how cheap each factor is relative to its own history. Specifically, we focus on book/price spreads for each factor and relate that to their subsequent returns. We find that valuation ratios are useful for forecasting market returns.
For Commodities: Our long-term commodity forecast is based on the level of world GDP, as a proxy for consumption demand, as well as on our inflation outlook. Additional factors affecting the returns to a commodities investor include how commodities are held (e.g., physically, synthetically, or via futures) and the various construction methodologies of different commodity benchmarks.

Appendix C: Definitions
32 IBG-25020

Definitions
S&P500 Index: A popular benchmark for US large-cap equities that includes 500 companies from leading industries and captures approximately 80% coverage of available market capitalization.
CBOE VIX Index: The Chicago Board Options Exchange (CBOE) Volatility Index shows the market’s expectation of 30-day volatility. It is constructed using the implied volatilities of a wide range of S&P 500 index options.
Implied Volatility: A way of estimating volatility of a security’s price based on a number of predictive variables. Implied volatility rises when the market is falling when investors believe that the asset’s price will decline over time, and it falls when the market is rising when investors believe that the security’s price will rise over time. This is due to the common belief that bearish markets are riskier than bullish markets.
MSCI Emerging Market Index: The MSCI Emerging Markets Index captures large and mid-cap representation across 23 emerging markets countries. With 834 constituents, the index covers approximately 85% of the free float-adjusted market capitalization in each country.
Russell 2000 Index: A benchmark that measures the performance of the small-cap segment of the US equity universe.
MSCI EAFE Index: An equities benchmark that captures large- and mid-cap representation across developed market countries around the world, excluding the US and Canada.
Bloomberg US High Yield Index: The Bloomberg USD High Yield Corporate Bond Index is a rules-based, market-value weighted index engineered to measure publicly issued non-investment grade USD fixed-rate, taxable, corporate bonds. To be included in the index a security must have a minimum par amount of 250MM.
Bloomberg Barclays US Aggregate Index: A benchmark that provides a measure of the performance of the US dollar denominated investment grade bond market, which includes investment grade government bonds, investment grade corporate bonds, mortgage pass through securities, commercial mortgage backed securities and asset backed securities that are publicly for sale in the US.
Bloomberg US Treasury Index: The Bloomberg US Treasury Bond Index is a rules-based, market-value weighted index engineered to measure the performance and characteristics of fixed rate coupon US Treasuries which have a maturity greater than 12 months. To be included in the index a security must have a minimum par amount of 1,000MM.
Bloomberg Commodity Index: Bloomberg Commodity Index (BCOM) is calculated on an excess return basis and reflects commodity futures price movements. The index rebalances annually weighted 2/3 by trading volume and 1/3 by world production and weight-caps are applied at the commodity, sector and group level for diversification.
MSCI Europe Index: The MSCI Europe Index is a free-float weighted equity index designed to measure the equity market performance of the developed markets in Europe.
Euro STOXX 50 Index: Europe’s leading blue-chip index for the Eurozone, provides a blue-chip representation of super-sector leaders in the Eurozone. The index covers 50 stocks from 12 Eurozone countries.
MSCI Japan Index The MSCI Europe Index is a free-float weighted equity index designed to measure the equity market performance of the developed markets in Japan.
Bloomberg Dollar Spot Index: The Bloomberg Dollar Spot Index tracks the performance of a basket of ten leading global currencies versus the U.S. Dollar. Each currency in the basket and their weight is determined annually based on their share of international trade and FX liquidity.
Bloomberg Barclays Global Aggregate Bond Index: A benchmark that provides a broad-based measure of the global investment-grade fixed income markets. The three major components of this index are the U.S. Aggregate, the Pan-European Aggregate, and the Asian-Pacific Aggregate Indices. The index also includes Eurodollar and Euro-Yen corporate bonds, Canadian government, agency and corporate securities, and USD investment-grade 144A securities.
Bloomberg Barclays Global Aggregate ex-USD Index :A benchmark that provides a broad-based measure of the global investment-grade fixed income markets , excluding the USD denominated bonds. A benchmark designed to be a broad-based measure of the global investment-grade, fixed-rate, fixed-income corporate bond markets outside the US.
MSCI ACWI Index: A free-float weighted global equity index that includes companies in 24 emerging market countries and 23 developed market countries and is designed to be a proxy for most of the investable equities universe around the world.
State Street Confidence Indexes Measures investor confidence or risk appetite quantitatively by analyzing the actual buying and selling patterns of institutional investors. The index assigns a precise meaning to changes in investor risk appetite: the greater the percentage allocation to equities, the higher risk appetite or confidence. A reading of 100 is neutral; it is the level at which investors are neither increasing nor decreasing their long-term allocations to risky assets. The results shown represent current results generated by State Street Investor Confidence Index. The results shown were achieved by means of a mathematical formula in addition to transactional market data, and are not indicative of actual future results which could differ substantially.
BofA Merrill Lynch US High Yield Master II Index: The BofA Merrill Lynch US High Yield Index tracks the performance of US dollar denominated below investment grade corporate debt publicly issued in the US domestic market. Qualifying securities must have a below investment grade rating (based on an average of Moody’s, S&P and Fitch).
Yield to worst: Yield to worst is an estimate of the lowest yield that you can expect to earn from a bond when holding to maturity, absent a default. It is a measure that is used in place of yield to maturity with callable bonds.
33 IBG-25020

Definitions
MSCI World Index The MSCI World Index, which is part of The Modern Index Strategy, is a broad global equity benchmark that represents large and mid-cap equity performance across 23 developed markets countries. It covers approximately 85% of the free float-adjusted market capitalization in each country and MSCI World benchmark does not offer exposure to emerging markets.
Earnings Surprise: An earnings surprise occurs when a company's reported results are above or below analysts' expectations.
Minimum Volatility Factor: A category of stocks that are characterized by relatively less movement in share price than many other equities.
MSCI World Minimum Volatility Index The MSCI World Minimum Volatility (USD) Index aims to reflect the performance characteristics of a minimum variance strategy applied to the MSCI large and mid cap equity universe across 23 Developed Markets countries*. The index is calculated by optimizing the MSCI World Index, its parent index, for the lowest absolute risk (within a given set of constraints). Historically, the index has shown lower beta and volatility characteristics relative to the MSCI World Index.
MSCI World Enhanced Value Index The MSCI World Enhanced Value Index is based on the MSCI World Index, which includes large and mid cap stocks across 23 Developed Markets (DM) countries*. The index is designed to represent the performance of securities that exhibit higher value characteristics relative to their peers within the corresponding GICS® sector.
MSCI World Quality Index The MSCI World Quality Index is based on MSCI World, its parent index, which includes large and mid cap stocks across 23 Developed Market (DM) countries*. The index aims to capture the performance of quality growth stocks by identifying stocks with high quality scores based on three main fundamental variables: high return on equity (ROE), stable year-over-year earnings growth and low financial leverage. The MSCI Quality Indexes complement existing MSCI Factor Indexes and can provide an effective diversification role in a portfolio of factor strategies.
MSCI World Equal Weighted Index The MSCI World Equal Weighted Index represents an alternative weighting scheme to its market cap weighted parent index, the MSCI World Index. The index includes the same constituents as its parent (large and mid cap securities from 23 Developed Markets countries*).However, at each quarterly rebalance date, all index constituents are weighted equally, effectively removing the influence of each constituent’s current price (high or low). Between rebalances, index constituent weightings will fluctuate due to price performance.
MSCI World High Dividend Yield Index The MSCI World High Dividend Yield Index is based on the MSCI World Index, its parent index, and includes large and mid cap stocks across 23 Developed Markets (DM) countries*. The index is designed to reflect the performance of equities in the parent index (excluding REITs) with higher dividend income and quality characteristics than average dividend yields that are both sustainable and persistent. The index also applies quality screens and reviews 12-month past performance to omit stocks with potentially deteriorating fundamentals that could force them to cut or reduce dividends.
MSCI USA Minimum Volatility Index The MSCI USA Minimum Volatility (USD) Index aims to reflect the performance characteristics of a minimum variance strategy applied to the MSCI large and mid cap equity universe. The index is calculated by optimizing the MSCI USA Index, its parent index, for the lowest absolute risk (within a given set of constraints). Historically, the index has shown lower beta and volatility characteristics relative to the MSCI World Index.
MSCI USA Enhanced Value Weighted Index The MSCI USA Enhanced Value Weighted Index captures large and mid-cap representation across the US equity markets exhibiting overall value style characteristics. The index is designed to represent the performance of securities that exhibit higher value characteristics relative to their peers within the corresponding GICS® sector.
MSCI USA Quality Index The MSCI USA Quality Index is based on MSCI USA, its parent index. The index aims to capture the performance of quality growth stocks by identifying stocks with high quality scores based on three main fundamental variables: high return on equity (ROE), stable year-over-year earnings growth and low financial leverage.
MSCI USA Equal Weighted Index The MSCI USA Equal Weighted Index represents an alternative weighting scheme to its market cap weighted parent index, the MSCI USA Index. The index includes the same constituents as its parent. However, at each quarterly rebalance date, all index constituents are weighted equally, effectively removing the influence of each constituent’s current price (high or low). Between rebalances, index constituent weightings will fluctuate due to price performance.
MSCI USA High Dividend Yield Index The MSCI World High Dividend Yield Index is based on the MSCI USA Index, its parent index, and includes large and mid cap stocks. The index is designed to reflect the performance of equities in the parent index (excluding REITs) with higher dividend income and quality characteristics than average dividend yields that are both sustainable and persistent. The index also applies quality screens and reviews 12-month past performance to omit stocks with potentially deteriorating fundamentals that could force them to cut or reduce dividends.
MSCI ACWI ex US Index: The index is a free float-adjusted market capitalization weighted index that is designed to measure the equity market performance outside the U.S., including the global developed and emerging markets.
Price-to-book ratio (P/B Ratio) The price-to-book ratio (P/B Ratio) is a ratio used to compare a stock's market value to its book value. It is calculated by dividing the current closing price of the stock by the latest quarter's book value per share. Also known as the "price-equity ratio
Price-earnings ratio (P/E Ratio) The price-earnings ratio (P/E Ratio) is the ratio for valuing a company that measures its current share price relative to its per-share earnings. The price-earnings ratio can be calculated as: Market Value per Share/Earnings per Share.
34 IBG-25020

Definitions
MSCI World Momentum Index The MSCI World Momentum Index is based on MSCI World, its parent index, which includes large and mid cap stocks across 23 Developed Markets (DM) countries*. It is designed to reflect the performance of an equity momentum strategy by emphasizing stocks with high price momentum, while maintaining reasonably high trading liquidity, investment capacity and moderate index turnover.
Quality Factor: One of the six widely recognized, research-based smart beta factors that refers to “quality” equities. Companies whose stocks qualify exhibit consistent profitability, stability of earnings, low financial leverage and other characteristics consistent with long-term reliability such as ethical corporate governance.
Z-score: It indicates how many standard deviations an element is from the mean. A z-score can be calculated from the following formula. z = (X - μ) / σ where z is the z-score, X is the sector relative performance. μ is the mean of the eleven sector relative performance, and σ is the standard deviation of sectors’ relative performance.
Implied Volatility: The estimated volatility of a security's price. In general, implied volatility increases when the market is bearish and decreases when the market is bullish. This is due to the common belief that bearish markets are more risky than bullish markets.
Size factor: A smart beta factor based on the tendency of small-cap stocks to outperform their large-cap peers over long time periods.
Yield Factor: A factor which screens for companies with a higher than average dividend yield relative to the broad market, and which have demonstrated dividend sustainability and persistence.
Momentum Factor: The tendency for a security to maintain a certain direction of price trajectory. This tendency is well documented in academic research, which has made “momentum” one of the six smart beta factors that are systematically being isolated in new-generation strategic indexes.
Standard Deviation: Measures the historical dispersion of a security, fund or index around an average. Investors use standard deviation to measure expected risk or volatility, and a higher standard deviation means the security has tended to show higher volatility or price swings in the past.
Excess Returns: A security’s return minus the return from another security in the same time period.
Value Factor: One of the basic elements of “style”-focused investing that focuses on companies that may be priced below intrinsic value. The most commonly used methodology to assess value is by examining price-to-book (P/B) ratios, which compare a company’s total market value with its assessed book value.
Current Short Interest (%): The percentage of tradable outstanding shares which have been shorted. Used as a measure of investor sentiment.
Earnings Per Share (EPS): A profitability measure that is calculated by dividing a company’s net income by the number of shares outstanding.
EPS Growth: The Compounded Annual Growth Rate (CAGR) of the operating Earnings per Share (EPS) over the specified time period.
Yield: The income produced by an investment, typically calculated as the interest received annually divided by the investment’s price.
Basis Point: One hundredth of one percent, or 0.01%.
Yield Curve: A graph or line that plots the interest rates or yields of bonds with similar credit quality but different durations, typically from shortest to longest duration. When the yield curve is said to be flat, it means the difference in yields between bonds with shorter and longer durations is relatively narrow. When the yield curve is said to be steepened, it means the difference in yields between short term and long term bonds increases.
Spread Changes: Changes in the spread between Treasury securities and non-Treasury securities that are identical in all respects except for quality rating.
Bloomberg Barclays Global Aggregate Bond Index: The Bloomberg Barclays Global Aggregate Index is a flagship measure of global investment grade debt from twenty-four local currency markets. This multi-currency benchmark includes treasury, government-related, corporate and securitized fixed-rate bonds from both developed and emerging markets issuers.
Bloomberg Barclays US Corporate High Yield Index : The index consists of fixed rate, high yield, USD-denominated, taxable securities issued by US corporate issuers.
Bloomberg Barclays USD Liquid Investment Grade Corporate Index: The Bloomberg Barclays USD Liquid Investment Grade Corporate Index consists of fixed rate, investment grade, taxable, USD-denominated securities issued by US corporate issuers, with time since issuance of less than two years, that meet certain liquidity requirements.
Bloomberg Barclays EM Hard Currency Aggregate Index: The index is a hard currency emerging markets debt benchmark that includes US dollar-denominated debt from sovereign, quasi-sovereign, and corporate issuers in the developing markets.
BofA Merrill Lynch US High Yield CCC or Below Index: The BofA Merrill Lynch US High Yield CCC or Below Index tracks the performance of US dollar denominated, CCC or below rating corporate debt publicly issued in the US domestic market. Qualifying securities must have a CCC or Below rating (based on an average of Moody’s, S&P and Fitch).
35 IBG-25020

Definitions
Bloomberg Barclays US Corporate Bond Index
The Bloomberg Barclays US Corporate Bond Index measures the investment grade, US dollar-denominated, fixed-rate, taxable corporate and government related bond markets. It is composed of the US Corporate Index and a non-corporate component that includes foreign agencies, sovereigns, supranationals and local authorities.
The Global Industry Classification Standard (GICS) An industry taxonomy developed in 1999 by MSCI and Standard & Poor’s (S&P) for use by the global financial community. The GICS structure consists of 10 sectors, 24 industry groups, 67 industries and 156 sub-industries [1]into which S&P has categorized all major public companies.
Credit Spread A credit spread is the difference in yield between a US Treasury bond and a debt security with the same maturity but of lesser quality.
S&P 500 Health Care Sector Index:The Index comprises of those companies included in the S&P 500 that are classified as members of the GICS® health care sector.
S&P 500 Consumer Discretionary Index: The Index comprises of those companies included in the S&P 500 that are classified as members of the GICS® consumer discretionary sector.
S&P 500 Consumer Staples Index: The Index comprises of those companies included in the S&P 500 that are classified as members of the GICS® consumer staples sector.
S&P 500 Financial Sector Index: The Index comprises of those companies included in the S&P 500 that are classified as members of the GICS® financial sector.
S&P 500 Utilities Index: The Index comprises of those companies included in the S&P 500 that are classified as members of the GICS® utilities sector.
S&P500 Information Technology Sector Index: The Index comprises of those companies included in the S&P 500 that are classified as members of the GICS® information technology sector.
S&P 500 Industrial Sector Index: The Index comprises of those companies included in the S&P 500 that are classified as members of the GICS® industrial sector.
S&P 500 Materials Sector Index: The Index comprises of those companies included in the S&P 500 that are classified as members of the GICS® materials sector.
S&P 500 Real Estate Sector Index: The Index comprises of those companies included in the S&P 500 that are classified as members of the GICS® real estate sector.
S&P 500 Telecommunication Sector Index: The Index comprises of those companies included in the S&P 500 that are classified as members of the GICS® telecommunication services sector.
Breakeven Inflation Rate: It is a market based measure of expected inflation. It is the difference between the yield of a nominal bond and an inflation linked bond of the same maturity.
36 IBG-25020

Appendix D: Important Disclosures
37 IBG-25020

Important Disclosures
The views expressed in this material are the views of SPDR Americas Research Team and are subject to change based on market and other conditions. This document contains certain statements that may be deemed forward-looking statements. Please note that any such statements are not guarantees of any future performance and actual results or developments may differ materially from those projected.
The information provided does not constitute investment advice and it should not be relied on as such. It should not be considered a solicitation to buy or an offer to sell a security. It does not take into account any investor’s particular investment objectives, strategies, tax status or investment horizon. You should consult your tax and financial advisor.
All material has been obtained from sources believed to be reliable. There is no representation or warranty as to the accuracy of the information and State Street shall have no liability for decisions based on such information.
All the index performance results referred to are provided exclusively for comparison purposes only. It should not be assumed that they represent the performance of any particular investment.
Bonds generally present less short-term risk and volatility than stocks, but contain interest rate risk (as interest rates rise, bond prices usually fall); issuer default risk; issuer credit risk; liquidity risk; and inflation risk. These effects are usually pronounced for longer-term securities. Any fixed income security sold or redeemed prior to maturity may be subject to a substantial gain or loss.
The values of debt securities may decrease as a result of many factors, including, by way of example, general market fluctuations; increases in interest rates; actual or perceived inability or unwillingness of issuers, guarantors or liquidity providers to make scheduled principal or interest payments; illiquidity in debt securities markets; and prepayments of principal, which often must be reinvested in obligations paying interest at lower rates.
Equity securities may fluctuate in value in response to the activities of individual companies and general market and economic conditions.
Investments in small-sized companies may involve greater risks than in those of larger, better known companies.
Investments in mid-sized companies may involve greater risks than in those of larger, better known companies, but may be less volatile than investments in smaller companies.
Companies with large market capitalizations go in and out of favor based on market and economic conditions. Larger companies tend to be less volatile than companies with smaller market capitalizations. In exchange for this potentially lower risk, the value of the security may not rise as much as companies with smaller market capitalizations.
Value stocks can perform differently from the market as a whole. They can remain undervalued by the market for long periods of time.
Foreign investments involve greater risks than US investments, including political and economic risks and the risk of currency fluctuations, all of which may be magnified in emerging markets.
Because of their narrow focus, sector funds tend to be more volatile.
Commodities investing entail significant risk as commodity prices can be extremely volatile due to wide range of factors Bond funds contain interest rate risk (as interest rates rise bond prices usually fall); the risk of issuer default; issuer credit risk; liquidity risk; and inflation risk.
Asset Allocation is a method of diversification which positions assets among major investment categories. Asset Allocation may be used in an effort to manage risk and enhance returns. It does not, however, guarantee a profit or protect against loss.
Actively managed ETFs do not seek to replicate the performance of a specified index. Because the SPDR SSGA Active Asset Allocation ETFs are actively managed, they are therefore subject to the risk that the investments selected by SSGA may cause the ETFs to underperform relative to their benchmarks or other funds with similar investment objectives.
38 IBG-25020

Important Disclosures (continued)
The trademarks and service marks referenced herein are the property of their respective owners. Third party data providers make no warranties or representations of any kind relating to the accuracy, completeness or timeliness of the data and have no liability for damages of any kind relating to the use of such data.
Standard & Poor’s, S&P and SPDR are registered trademarks of Standard & Poor/s Financial Services LLC (S&P); Dow Jones is a registered trademark of Dow Jones Trademark Holdings LLC (Dow Jones); and these trademarks have been licensed for use by S&P Dow Jones Indices LLC (SPDJI) and sublicensed for certain purposes by State Street Corporation. State Street Corporation’s financial products are not sponsored, endorsed, sold or promoted by SPDJI, Dow Jones, S&P, their respective affiliates and third party licensors and none of such parties make any representation regarding the advisability of investing in such product(s) nor do they have any liability in relation thereto, including for any errors, omissions, or interruptions of any index.
Distributor: State Street Global Advisors Funds Distributors LLC, member FINRA, SIPC, an indirect wholly owned subsidiary of State Street Corporation. References to State Street may include State Street Corporation and its affiliates. Certain State Street affiliates provide services and receive fees from the SPDR ETFs.
Before investing, consider the funds’ investment objectives, risks, charges and expenses. To obtain a prospectus or summary prospectus which contains this and other information, call 1-866-787-2257 or visit www.spdrs.com. Read it carefully.
State Street Global Advisors, One Lincoln Street, Boston, MA 02111-2900.
© 2017 State Street Corporation — All Rights Reserved.
Tracking Code: IBG-25020
Expiration Date: September 30, 2018
Not FDIC Insured — No Bank Guarantee — May Lose Value.
39 IBG-25020