state of vermont annual workforce report
TRANSCRIPT

State of Vermont
Annual Workforce
Report
Fiscal Year 2004
State of Vermont Annual Workforce Report
Fiscal Year 2004
Presented to Governor James H. Douglas
and The Vermont General Assembly
Prepared by:
Vermont Department of Human Resources
Cynthia D. LaWare, Commissioner
110 State Street, Drawer 20 Montpelier, VT 05620-3001
(802) 828-3491
Web site: www.vermontpersonnel.org www.vtstatejobs.info

THIS PAGE IS INTENTIONALLY LEFT BLANK

Department of Human Resources Greetings: It is with great pleasure that I present the State of Vermont Annual Workforce Report for fiscal year 2004 to Governor James H. Douglas and the members of the Vermont General Assembly. Strengthening organizations and building human capital in a turbulent economy demands innovation and an inter-disciplinary approach to managing the State of Vermont’s most valuable asset, our human resources. This approach requires that our human resource professionals be held accountable for many knowledge areas. To be a true business partner, Human Resources must be administrative experts, employee relations experts, strategic planners, and change agents. Some of these roles however, are simply more important and more strategic than others in that they provide the most effective levers for change. The Department of Human Resources has undergone enormous change over the past year. We have continued to implement our new organization enabling us to focus on providing the highest level of service to our customers: the Legislature, government leaders, and our state employees who, in turn, deliver valued services within our Vermont communities. We have successfully completed the Human Resource Management System’s technical upgrade which has positioned us to begin to offer a variety of self-serve functionality thereby improving administrative efficiencies. As we manage an integrated human resource and financial database, we will provide information to the leadership of our state that is timely and meaningful and supports them as they make sound business decisions that will enable Vermont to prepare for the future. These major initiatives have positioned our Human Resources Department and our Human Resources Partners to achieve a more fundamental change as we become true business partners with agency and department leadership. Never has the challenge been so great as we compete for, develop and retain the talent state government will need to service the residents of Vermont. As we endeavor to attract talent to state government, we must understand the value proposition of working in state government and we must sell that value proposition to the government leaders of tomorrow. We must also align our policies and practices to be consistent with this value proposition as we create, manage and market our reputation as an employer of choice. Development today means providing people opportunities to learn from their work rather than taking people out of their work to learn. Our policies must enable us to strategically use job assignments for leadership development. And finally, we must understand what truly motivates our workforce and have the flexibility and creativity to design new policies and total compensation systems which will meet their needs. As human resource professionals, we are committed to continuing the transition from a focus on processes and transactions to a focus on workforce development and change management; from a focus on day-to-day operations to a focus on measurable business results.
OFFICE OF THE COMMISSIONER 110 STATE STREET DRAWER 20 MONTPELIER, VT 05620-3001
STATE OF VERMONT AGENCY OF ADMINISTRATION
(802) 828- 3491 (802) 828- 3409

We also recognize that as the economy continues to improve there will be an increased demand for talent. This will coincide with a significant decline in the labor force and an exponential increase in the elderly resident population who will pressure the system for ever increasing services. Throughout this transformation, however, we must not lose sight of the fact that when the administrative areas of accountability are done well they generally go unnoticed but if not done well can cause great disruption. In contrast, the talent management and strategic consultant accountabilities tend to be the ones that, if done well, will give the organization an enormous strategic advantage. If, however, they are not done they may go largely unnoticed as some organizational leaders and some within our own profession have yet to fully embrace the strategic value of Human Resources Management. As we look toward managing human resources in the future, we are challenged to keep the following in mind:
• We must complete the transition from transactional to a business strategy environment. • We must keep our focus on the three main challenges in HR.
o Attract, develop and retain talent o Align, engage and reward performance o Control or reduce HR program and people expenses
• As HR professionals we must first think of ourselves as business people as we consider the economy, technology and the changing requirements of tomorrow’s workforce.
If we are truly strategic thinkers we must keep these changes in mind and incorporate them in our analysis of the human resource data and trends to effect positive change and improve business results within state government. We must also remember that our actions will speak louder than our words. And, treating everyone with respect and integrity will reinforce a workplace culture that will ensure that we deliver exceptional services to the residents of and visitors to the State of Vermont. I hope this year’s State of Vermont Annual Workforce Report will be an effective management tool as together we strive to meet the challenges of managing in state government. On behalf of my professional colleagues within the Department of Human Resources, we look forward to the work that lies ahead. Sincerely,
Cynthia D. LaWare Commissioner

State of Vermont Workforce Report – FY 2004 1
TABLE OF CONTENTS
TABLE OF CONTENTS.................................................................................................................. 1
DEPARTMENT OF HUMAN RESOURCES ANNUAL REPORT - 2004 ................................................. 3
2004 Key Accomplishments ....................................................................................................... 5
2004 Key Strategies ................................................................................................................. 15
WORKFORCE CHARACTERISTICS – FISCAL YEAR 2004............................................................. 19 Table 1 Number of Executive Branch Employees and FTEs by Department .................................... 20 Table 2 Executive Branch Employees by County of Work ............................................................ 21 Table 3 Executive Branch Employees by Age Group ................................................................... 22 Table 4 Executive Branch Employees by Annual Salary .............................................................. 23 Table 5 Executive Branch Employees by Years of Service ........................................................... 24 Table 6 Executive Branch Employees by Ethnic and Gender Representation .................................. 25 Table 7 Executive Branch Employees by Management Level and Job Type..................................... 26 Table 8 Executive Branch Employees by Bargaining Unit ............................................................ 27 Table 9 Executive Branch Employees by Occupational Group....................................................... 28 Table 10 Most Populous Classified Job Titles............................................................................... 29
WORKFORCE TRENDS – FISCAL YEARS 2000 - 2004................................................................. 31
Employment ............................................................................................................................. 33 Table 11 Number of Classified Employees and FTEs by Fiscal Year ................................................. 34 Table 12 Number of Classified Employees and FTEs by Department by FY....................................... 35 Table 13 Number of Classified Employees by Occupational Group by Fiscal Year .............................. 36 Table 14 Characteristics of Applicants for Classified Jobs by Fiscal Year .......................................... 37 Table 15 New Hires by Department by Fiscal Year ....................................................................... 38 Table 16 New Hire Survey Results – Fiscal Year 2004 .................................................................. 39
Turnover .................................................................................................................................. 41 Table 17 Turnover Rate by Fiscal Year....................................................................................... 42 Table 18 Turnover by Department by Fiscal Year ........................................................................ 43 Table 19 Turnover by Occupational Group by Fiscal Year.............................................................. 44 Table 20 Turnover Rates for Classified Job Titles - Fiscal Year 2004 ............................................... 45 Table 21 Turnover by Reason by Fiscal Year............................................................................... 46 Table 22 Voluntary Turnover by Years of Service (5 Year Average)................................................ 47 Table 23 Exit Survey Results – Fiscal Year 2004 ......................................................................... 48
Age and Length of Service........................................................................................................ 49 Table 24 Average Age of Classified Employees by Fiscal Year........................................................ 50 Table 25 Employee Age Groups by Department - Fiscal Year 2004................................................. 51 Table 26 Length of Service Categories by Department - Fiscal Year 2004 ....................................... 52 Table 27 Projected Retirement Eligibility by Occupational Group.................................................... 53 Table 28 Projected Retirement Eligible by Department................................................................. 54
Compensation .......................................................................................................................... 55 Table 29 Average Salary for Classified Employees by Fiscal Year ................................................... 56 Table 30 Average Salary for Classified Employees by Occupational Group – Fiscal Year 2004............. 57 Table 31 Overtime Costs by Department and Fiscal Year .............................................................. 58 Table 32 Compensatory Time Costs by Department and Fiscal Year ............................................... 59
2 State of Vermont Workforce Report – FY 2004
Diversity................................................................................................................................... 61 Table 33 Ethnic and Gender Representation by Fiscal Year and Comparison to Vermont Civilian Labor Force .............................................................................................................................. 62 Table 34 Ethnic Representation by Department by Fiscal Year....................................................... 63 Table 35 Gender Representation by Department by Fiscal Year ..................................................... 64 Table 36 Minority & Gender Representation by Occupational Group by Fiscal Year............................ 65 Table 37 Percentage of Employees with Disabilities ..................................................................... 66
Leave Usage............................................................................................................................. 67 Table 38 Average Annual Leave Use and Average Costs per Classified Employee by Department by Fiscal Year ............................................................................................................................. 68 Table 39 Average Sick Leave Use and Average Costs per Classified Employee by Department by Fiscal Year .............................................................................................................................. 69
REPORTS REQUIRED BY THE GENERAL ASSEMBLY ................................................................... 71 Table 40 Executive Branch Permanent Positions Newly Authorized for Fiscal Year 2004 .................... 72 Table 41 Limited Service Positions Created in Fiscal Year 2004 ..................................................... 73 Table 42 Use of Temporary Employees in Fiscal Year 2004 ........................................................... 74 Table 43 Personal Services Contracts Created in Fiscal Year 2004 ................................................. 76 Table 44 Contractors on Payroll as of 6/24/04 Pay Date............................................................... 77 Table 45 Classification Reviews: Number of Positions Reviewed and Increased Annual Cost by Department by Fiscal Year........................................................................................................ 79 APPENDIX A - EEO – 4 Categories ............................................................................................. 81 APPENDIX B – Department Listing ............................................................................................. 83
NOTE: The data presented in this Annual Workforce Report – Fiscal Year 2004 is based on an end of fiscal year date of 6/12/04, rather than 6/30/04. This was necessary because the reorganization of the Agency of Human Services, authorized by Act 45 passed by the Legislature in 2003, was implemented beginning in Fiscal Year 2005 (7/1/04). NOTE: Effective July 1, 2004 (the beginning of FY 05) Act 156 of the 2004 Legislative session changed the name of the Department of Personnel to the Department of Human Resources. However, within this Annual Workforce Report the name Personnel is used when reporting FY 04 data.

State of Vermont Workforce Report – FY 2004 3
Department of Human Resources Annual Report - 2004
Section One of this report is the Department of Human Resources’ calendar year 2004 Annual Report. 2004 Key Accomplishments 2005 Key Strategies
Section One

4 State of Vermont Workforce Report – FY 2004
THIS PAGE IS INTENTIONALLY LEFT BLANK

State of Vermont Workforce Report – FY 2004 5
2004 Key Accomplishments
Human Capital Management System Upgrade Over the years the Department of Human Resources’ (DHR) mission and objectives have been supported by a commitment to an integrated Human Resources Management System. As the Department redefines its role and responsibilities in support of the Human Resource needs throughout State government this commitment requires leadership and financial support to ensure a successful transition from “the Department of Personnel’s payroll system” to an enterprise-wide “Human Capital Management System.” During the past year we have received the support that has enabled us to make significant progress as we upgraded our system to a new web-based, customer-focused infrastructure that positioned the Department to better serve our customers, both internal and external. The following outlines this year’s accomplishments in this critically important area: Labor Relations
► Grievance Tracking: The Labor Relations division has begun to fully utilize the grievance tracking capabilities of our newly upgraded Human Capital Management System (HCM). Step III grievances are tracked by the Labor Relations Division. A pilot project is also underway with the Agency of Transportation and the Department of Buildings and General Services to test the system tracking capabilities for Step I & II grievances filed at the agency/department level. When fully implemented, we will have the capability to provide management with meaningful information relative to the location, types, and level of grievance filings. We will use this information to target training and implement new programs to improve supervision and employee relations thereby reducing the number of grievances filed throughout state government.
Classification/Compensation
► Position Management: As part of the HCM 8.8 upgrade, Classification staff performed an audit of data resident in our human resource management system to ensure that all retained position information is current, accurate, and meaningful.
► Added System Functionality: By eliminating system customizations, we were able
to improve job and position data and overall system functionality. These changes resulted in the expanded use of position data functionality such as standard hours, full/part time status, and shift assignment and the implementation of an improved process for managing job specifications.
► System Efficiency: The elimination of custom code allowed us to implement
previously unimplemented system functionality such as retroactive pay processing, standard hours, full and part-time status, and shift assignments. These automated system features have had a very positive impact on production and overall systems efficiency.
Payroll
► Documentation: Payroll staff made significant progress in documenting payroll processes.

6 State of Vermont Workforce Report – FY 2004
► Training: Payroll staff assumed significant responsibility for user training in HCM 8.8.
► Gained Efficiency: Payroll processing efficiencies were significantly enhanced.
Information Systems - Completed the upgrade of the integrated Human Resource Management System (HRMS) to the new web-based Human Capital Management (HCM) System. This work began in 2003.
► Business Process Review: Through the first half of 2004, the Information
Systems Division (ISD) worked with department staff and an upgrade partner to understand the capabilities of the system, retool business process and eliminate custom code. By involving more of the functional managers in the department and HR partners throughout the State, we opened the system and its capabilities for greater access and use in managing the HR functions.
► Enhanced Infrastructure: In addition to the technological upgrade, we shifted
from a client-server to a web-based application. With a web-enabled application we have the infrastructure necessary to expand our current use of the system to include implementation of self-service features for State employees. This involved an extensive infrastructure change, not only in hardware but in skills, monitoring and troubleshooting techniques.
► Integrated Recruitment: We implemented the e-Recruit application which is
seamlessly integrated with the HCM System to improve efficiency and eliminate manual and redundant tasks. A separate on-line application and highly customized recruitment module were replaced by an integrated e-Recruit and recruitment module eliminating the need for extensive paper processing and double entry of information into dual systems. The eRecruit manager portion will allow HR partners and hiring managers throughout the State to access applicant information on-line and further reduce the paper processing previously associated with generating requisitions for filling positions, reviewing applications, interviewing and selecting new employees.
► Meet HIPAA security provisions: As part of the infrastructure upgrade, a
complete security review was conducted and a hardware/software strategy designed to secure the HCM application and address outstanding security requirements associated with HIPAA compliance.
Workforce Planning and Development Group
► Utilizing Technology to Serve Our Customers: Increasing opportunities through technology for employee and manager self-service is a department-wide goal. This year we implemented eRecruit, which allows applicants to apply and check their application status online and enables managers to track the hiring process, view applications, and schedule interviews – all online. In addition we implemented training administration software that allows all departments to track their training programs and record the training history of employees.

State of Vermont Workforce Report – FY 2004 7
HR Policy & Resource Management Group
Represents the Commissioner’s Office, Labor Relations, Resource Management & Development, Workforce Equity and Diversity,
and the department’s Legal Division. Labor Relations - The Labor Relations Division negotiates State employee labor contracts with the Vermont State Employees’ Association, Inc. (VSEA), monitors and coordinates the implementation of any new provisions, administers the agreements for the State, and is responsible for bargaining and implementing any mid-term revisions to the contracts. The Division also administers the State’s Personnel Policies and Procedures. Technical human resources and labor relations advice and support services are provided to other Department of Human Resources divisions, and all other agency/department human resources staff, managers, supervisors and employees. The Division also offers and conducts supervisory/managerial training on labor relations and human resources issues.
► Labor Agreements for FY 06 and FY 07: The State and VSEA are in the process of negotiating successor labor contracts for the Non-Management, Supervisory, Corrections, and State Police Bargaining Units which will become effective in July 2005. In preparation for these negotiations, the Department of Human Resources developed comprehensive historical and current data concerning the total compensation of State employees and state and national economic data for the corresponding ten-year historical period.
► Mid-Term Agreements: In addition, during 2004, the following mutually
advantageous mid-term revisions to existing labor contracts were negotiated with the VSEA:
• An extension and improvement to the military pay differential benefit for
employee members of the National Guard and Reserves activated for federal service;
• An Agency of Transportation night patrol schedule for winter maintenance operations;
• A work schedule revision for Social Workers at the Vermont Veterans’ Home; • A revision to the State Police Unit’s residency provisions; and • The clarification of several State Police salary issues.
► Complaint and Grievance Activity: In calendar year 2004, 31 grievances were
filed with the Department of Human Resources at the Step III level of the contractual grievance procedure. Of the twenty-three Step III grievances decided during the year, fourteen were denied and nine were settled. In addition, one grievance was withdrawn and seven are pending resolution. Six Classification grievances were filed and decided during 2004.
► Alternative Dispute Resolution: The State and VSEA are exploring the possibility
of implementing an alternative dispute resolution process that we believe may encourage the mediation of grievances in lieu of the traditional, sometimes adversarial grievance process.
► Professional Development of the State’s Human Resources Staff: In
conjunction with the Workforce Planning and Development Group, Labor Relations staff assisted in the development and implementation of a comprehensive

8 State of Vermont Workforce Report – FY 2004
professional training curriculum for Human Resources staff throughout State government.
► Legislative Initiatives: The Labor Relations Division provided guidance and
consultation in regard to several reorganization initiatives throughout State government including:
• The integration of fire safety services within the Department of Public Safety; • The redesignation of correctional facility superintendents as exempt
employees; and • The integration of the Environmental and Water Resources Boards.
Workforce Equity & Diversity - The State of Vermont is committed to providing employees, at all levels, a work environment free of harassment and illegal discrimination while fostering a skilled and diverse workforce. This means more than simply meeting our legal obligation. We believe that a diverse workforce, reflective of all Vermont’s residents, enables agencies and departments to better understand and respond to the needs of their client communities. Continuing our commitment to Workforce Equity & Diversity, members of our Labor Relations Division provide advice and technical assistance to managers and supervisors regarding the Americans with Disabilities Act reasonable accommodation process, the Family and Medical Leave Act, employment issues related to Workers’ Compensation, Medical Reduction-in-Force and unpaid medical leaves of absence processes. Information and training are available for all these topics. Professionals in this area also guide, direct, assist, and monitor the administration of the State of Vermont’s Affirmative Action Program, including ensuring fair and equal treatment of all executive branch employees and working with agencies/departments to ensure that affirmative action and diversity are integrated into their workforce planning, recruitment, promotion, transfer, and training efforts. During 2004, we focused on developing these efforts in the following areas:
► Governor’s Workforce Equity and Diversity Council (GWEDC): The Governor’s Workforce Equity and Diversity Council, created by Executive Order #09-02, acts as consultant and advisor to the Commissioner of Human Resources and the Secretary of Administration on matters of affirmative action and workforce diversity. The Commissioner of Human Resources has worked closely with the Council throughout 2004 on many important initiatives.
► Community Partnerships: We continue to partner with leading organizations in
the Vermont community to further demonstrate our commitment to workforce equity and diversity issues throughout the state and to position the State as a leader in this area.
► Governor’s Summit on Employment of People with Disabilities: The
Department of Human Resources continues to be a key stakeholder in the annual Governor’s Summit on Employment of People with Disabilities.
► New Freedom Initiative: In fulfillment of our partnership with the Equal
Employment Opportunity Commission in support of President Bush’s New Freedom Initiative, the Department of Human Resources completed the State of Vermont Report on Best Employment Practices for the Employment of People with Disabilities. The purpose of this initiative was to highlight current resources and best practices which have positioned the State of Vermont as a leading proponent for and example of the importance of removing barriers to employment for people with disabilities.
State of Vermont Workforce Report – FY 2004 9
Copies of the EEOC’s Interim Report on Best Practices for the Employment of People with Disabilities in State Government are available by contacting the Department of Human Resources.
► Diversity Training: To further support Vermont’s commitment to an inclusive State workforce truly representative of Vermont’s diverse population, a comprehensive diversity training was offered first to the Governor’s Extended Cabinet and then throughout the leadership team within State government. The program, designed to address issues of diversity in the context of our daily work, reinforces the value of an engaged, diverse workforce and sets the standards of accountability for all.
► Outreach Initiative: This study, completed during 2004, examines the issue of
workplace diversity in State government by identifying areas of progress; outlining strategies for expanding our employment outreach efforts and improving the hiring process; and generally creating an environment conducive to attracting and retaining a diversified workforce. The study, which organizes fifty recommendations into high, intermediate and longer-range priorities, is available on-line at http://vermontpersonnel.org/employee/pdf/diversity%20outreach.pdf.
► Diversity and Disability Employment Awareness Month: At a press conference in October 2004, Governor Douglas signed a proclamation declaring October Vermont Diversity and Disability Employment Awareness Month encouraging all Vermont employers to follow State Government’s lead and demonstrate their commitment to equal employment opportunity for all.
HR Compensation & Benefits Group
Represents Classification & Compensation Administration and our Employee Benefits & Wellness Division, which combine to provide comprehensive insight into how the State of
Vermont rewards employee contribution. Classification/Compensation - The Classification and Compensation Division is responsible for job analysis and classification; position management; and compensation administration which includes exempt salary oversight, hire-into-range review, and merit program oversight and assistance.
► Classification Committees: We have worked closely with existing department classification committees to expand the number of reviews they conduct; we have conducted training for committees; and we have worked with the Agency of Human Services to explore ways to develop classification committees.
► Job Series/Ladders: We continued our ongoing work in the area of reducing the
number of unique job titles by expanding the use of job series.
► Developed Regular Review Schedule: Beginning in Fiscal Year 2005 we will begin scheduling reviews of occupational groups. The regular review schedule will involve annual reviews of jobs by occupational grouping. By looking at jobs within an occupational grouping (e.g., Fiscal and Administrative, Information Technology and Statistics, Maintenance, Protective Services, Engineering) we will maintain consistency for comparable jobs throughout state government.

10 State of Vermont Workforce Report – FY 2004
Employee Benefits and Wellness - The Employee Benefits and Wellness Division manages benefit plans for all State employees and retirees. This includes four medical plans, dental, disability, employee assistance, life insurance, and the Flexible Spending account program. Wellness services, including health assessment and education, are also provided through this division of the department. Calendar year 2004 continued to see positive health-related and financial outcomes as a result of converting to CIGNA Healthcare, effective January 2002. In addition to administrative savings gained by self-funding all health plans, the new plans were designed to help control the escalating cost of health care. Our approach included plan redesign, significantly enhanced disease management and wellness efforts, and aggressive pursuit of purchasing options to maximize prescription drug plan savings.
► Single Digit Premium Rate Increases: Calendar year 2005 will be the second year in a row that the State employees’ health plan premium increases have been held to single digits. In 2005 premium rates will increase only 8% for each of the self-funded CIGNA health care plans. Although premium rate increases are never welcome, our health plans are doing well by both local and national standards. Nationally, health care trends for 2005 are about 14%, and Vermont insurers have implemented rate increases in the 12%-14% range. As we move into a new year we fully recognize that there is still much work to be done, and are committed to continuing our effort to ensure health care remains affordable for all employees, retirees, and dependents covered under the State of Vermont employee health plans.
► Long Term Disability (LTD) Contract: During 2004 we conducted an open
bidding process for this important benefit contract, valued at $550,000 on a three year basis. We negotiated a new three year contract with no increase over the current premium rates. Holding these contract costs stable is an important component of our overall strategy of controlling employee benefit costs.
► Prescription Drug Program: During calendar year 2004 our health plans have
benefited from re-negotiated financial improvements to our prescription drug contract. These August 2003 improvements included increases in the discounts the State obtains for both brand and generic drugs, improved rebates on mail order prescriptions, and a reduction in claim processing fees. The renegotiated terms were designed to save the health plan and its members $1.5 million over three years. We are well on the way to achieving these projected savings. From the inception of the renegotiated terms in August 2003, through October 2004, plan costs under the new contract arrangement were reduced by $637,000.
► Employee Wellness Program Enhancements: The lower medical claims and
prescription drug utilization experienced by the health plans in 2004 are attributable, at least in part, to the expansion of our Employees’ Wellness Program services. This program exists to improve the health of our employees as we offer extensive wellness clinics focused on aggressive prevention strategies, encouraging healthy behavior choices, and early detection of disease. Through the continued use of our health assessment tool, we are able to report some significant health behavior changes among employees enrolled in the program.
• During 2004, using 2003 as a base year, we began a program of more
frequent individual clinic visits and small-group nutrition workshops for a subset of 600 employees who demonstrated the highest health risks and who were furthest from “heart-healthy” goals. For employees in this group who had more than one visit, improvements have occurred in six important areas:

State of Vermont Workforce Report – FY 2004 11
cholesterol levels, tobacco use, stress, depression, nutrition and physical activity. The largest improvements occurred in the two key areas that were the targets of our 2004 interventions: nutrition and physical activity. In the area of nutrition, 15% more employees were at goal and 32% more employees met their physical activity targets. In addition to the progress made with this high risk group, other participants in the wellness program demonstrated the following health improvements: 19% more employees met the physical activity goal; 14% more adopted better nutritional practices; and 11% more reduced their reported stress level.
• In April 2004 the State Employees Wellness Program successfully launched its
first statewide walking program, “Stepping Up for Wellness 2004: Walk around Vermont”. Nearly 4,000 State employees participated in this pedometer-based program designed to increase physical activity and cardiovascular health. Over 50% of the participants finished the 8 week program, logging over 1.3 billion steps or 656,000 miles, and walking the equivalent of 1,200 times around the perimeter of the State of Vermont. Follow-up evaluations from 1,000 program participants reported the following: 71% increased walking;31% higher energy levels; 25% improved fitness; 22% weight loss; and 18% stress reduction.
• The Cigna disease management programs are designed to provide medical
cost savings to the State by helping to improve the health status of individuals with certain chronic diseases such as asthma, coronary heart disease, diabetes and low back pain. The interventions by the four programs in calendar year 2003 resulted in medical cost reductions of 33.8% over the prior year, with health plan savings totaling approximately $2M. Of particular note was the 44.4% reduction in the cost of cardiac care for individuals participating in this program. We fully expect to see ongoing savings from these important programs.
HR Systems & Fiscal/Information Management Group
Represents Payroll Administration,
Fiscal/Information Management and Information Systems. Payroll - 32 VSA §2283(b) states: “The department of human resources shall maintain a central payroll office which shall be the successor to and continuation of the payroll division of the department of finance and management.” The law requires that the department be responsible for fulfilling the payroll functions and for the centralized human resources management services for State government. We have secured the payroll function and maximized efficiencies through the following strategies:
► Business Process Changes
• In partnership with the Information Services Division time sheets, expense and standard departmental reports were created and distributed electronically over the Intranet.
• The department continues to leverage HCM delivered functionality to process various payroll transactions such as retro-pay - once a very labor intensive manual process.

12 State of Vermont Workforce Report – FY 2004
Fiscal/Information Management - The Fiscal and Information Management (FIM) Division provides a variety of data management/analysis functions for DHR, as well as providing information to other internal and external customers. In addition to performing the fiscal functions of the DHR, including accounting and budgeting, and related activities this unit also performs the Department’s human resource function.
► Information Management/Analysis
• This year the FIM Division significantly expanded its role in support of the labor negotiation process to include very complex compensation and benefit related analysis and participation in negotiation sessions as required.
• FIM staff created, implemented, and documented the July ‘04 COLA processing for both classified service and exempt positions and performed market factor analyses for five different job series throughout the year.
• To assist with the development of quarterly financial reports, premium projections and rate setting, the FIM Division maintains reporting databases on the benefit plans. In 2004, we assisted in developing premium rate analyses for the following employee benefit plans: Medical, Dental, Life, Long Term Disability, and Employee Assistance Program.
• In addition to responding to a number of surveys from various private and public organizations this division managed the department’s response to the national Government Performance Project survey, an extremely detailed and comprehensive survey requiring responses to approximately 200 items.
► Fiscal/Accounting/Budget: The accounting processes have undergone
significantly greater scrutiny by both the Department of Finance and the State Auditor during the past year.
• The FIM Division was responsible for preparing the new financial reports for
internal services funds. • The FY 03 Accrual Accounting Audit by State Auditor (CAFR) was much more
extensive than in previous years. • The bi-weekly reconciliation of agency funds (holding accounts) was initiated
in 2004 along with a review of cash disposition from prior years. • To more efficiently manage the department’s limited resources, FIM staff has
been developing a budget/expense tracking system.
► Labor Contract Required Functions: The FIM Division administers a tuition reimbursement program processing over 360 applications and dispersed over $240,000 to participants in this program. We also administer the dependent/elder care fund providing 166 employees with over $100,000 in assistance in 2004.
Information Systems – In addition to completing the upgrade of our Human Capital Management System, the Information Systems Division (ISD) worked on many other projects.
► Support the Reorganization of AHS: In the midst of the upgrade, ISD staff
completed all of the system set-up of new coding structures and the transfer of employees from old departments to the new entities for a July 1, 2004 cutover. This represented the recoding of nearly half of the workforce within HCM, and the correct assignment for payroll reporting and processing functions including all end of year reporting.

State of Vermont Workforce Report – FY 2004 13
► Memorandum of Understanding: We continued to build on successes realized between the Department of Human Resources and the Department of Finance and Management. The departments collaborated in the purchase of a new computing storage device. By sharing the costs of purchase, operation and maintenance, the State was able to realize significant cost savings over individual purchases.
► Intranet Capabilities: We are using Intranet capabilities to enhance
communication between DHR employees and HR Partners. Working with the Workforce Development staff and HR Partners, ISD created an Intranet with information and tools for all employees working in HR.
HR Workforce Planning and Development Group
Represents the Cyprian Learning Center, the Workforce Planning Division, and the Employment Services Division.
The HR Workforce Planning and Development Group supports organizational effectiveness through attracting, developing, and retaining high performing staff. Our core customer groups include State managers, HR staff, and applicants for positions with the State of Vermont. We also serve the general State employee population as we offer training programs, career advising services, and, RIF management and placement services.
► Workforce Planning: For the first time the State has implemented centralized statewide surveys for new hires and for exiting employees. By June 2004 we had gathered a full year of data. This information, along with workforce report data, is being used to help us allocate our staff resources to high priority projects based on the survey findings, develop appropriate training materials and provide meaningful feedback to the State leadership team. We have used survey results to help craft our new Working for the State of Vermont outreach workshop, modify curriculum for supervisors, and determine which open enrollment training programs to offer. We are developing an online New Employee Orientation based in part on survey findings and have targeted our outreach efforts based on these surveys and workforce report data.
► Workforce Development: Recognizing the critical role of HR professionals to
organizational effectiveness, the Workforce Planning Group developed an HR Competency Model to serve as a guide for HR professional development across the State. To further support HR professional development we launched the HR Individualized Professional Development Program, which combines core training with an individualized development program for State HR staff.
► Supporting Diversity: The publication of the Diversity Outreach Study in the
Winter marked the start of a new wave of initiatives for 2004 in this area including:
• Expanded outreach to include regional urban areas to attract a more diverse applicant pool;
• Diversity training for the Governor’s Cabinet with follow up training/discussions with agency leadership groups;
• Integration of diversity concepts throughout virtually all courses run in our Learning Center; and.

14 State of Vermont Workforce Report – FY 2004
• Development of a Working for the State of Vermont program designed to be taken out to the community through multi-cultural centers and community organizations.
► Gaining Consistency: Giving a consistent message to supervisors about strategies
and responsibilities related to their job is essential. Our workforce development unit has focused on this issue by establishing standardized curriculum including course objectives for topic areas core to supervisory development such as performance management and preventing sexual harassment. In addition, further supervisory development courses have been added to our offerings focusing especially on an Orientation to Supervision in State Government, which has now run for a year and is targeted at getting to new supervisors early.

State of Vermont Workforce Report – FY 2004 15
2004 Key Strategies
Human Capital Management System Upgrade
Many features of the system are only now beginning to be explored and implemented. Our overall department goals relative to the Human Capital Management System include:
► Implementing all appropriate delivered system functionality; ► Aggressively marketing direct deposit and eventually implementing the ePay module
that will enable employees to securely review their earning statements online; ► Continuing our business process review to ensure appropriate use of new
technologies; ► Restructuring the methods and processes used to report time and expenses. This
will reduce the excessive time spent in handling paper time and expense form through multiple layers of processing; and
► Conducting the business process review and fit gap analysis in preparation for the
implementation of Time and Labor.
HR Policy & Resource Management Group Labor Relations
► Manage a complete review of our personnel policies and procedures to ensure
compliance with existing business practices, statutes, and labor contract provisions.
► Continue to work with State agencies and departments to develop and implement strategies to further formalize the working relationship between the Department of Human Resources and field HR staff.
► Fully utilize HCM to track and manage the grievance process throughout State
government.
► Continue to implement the alternative dispute resolution option as a means to constructively address employee grievance issues.
► Act as internal consultants within State government by providing expertise and
guidance to agencies/departments as they rethink their organizational structure to ensure they are positioned to provide services to our residents in the most efficient and cost effective manner. Continue current organizational integration initiatives such as the Department of Public Safety/Fire Safety merger, the Natural Resources Board, and the proposed merger of the Department of Labor and Industry with the Department of Employment and Training.

16 State of Vermont Workforce Report – FY 2004
Workforce Equity and Diversity - In partnership with the Governor’s Workforce Equity and Diversity Council, we will continue to promote equity and diversity within the State workforce through the following strategies:
► Build upon the strong foundation laid by our recent outreach efforts, by continuing to implement the recommendations outlined in the Department of Human Resources’ 2004 Diversity Study.
► Continue to pursue opportunities and identify strategies to promote working
partnerships between State government and organizations advocating for underrepresented groups in our Vermont communities.
► Continue our commitment to fostering acceptance and understanding of diversity
within the State workforce by offering diversity training and upholding standards of accountability throughout all levels of State government.
► Collaborate with the Department of Employment and Training to identify areas of
shared accountability to efficiently and effectively utilize available resources to support individuals in their efforts to gain employment in State government.
► Identify and promote the use of alternative strategies to positively and
enthusiastically communicate the State’s commitment to equal employment opportunities for all Vermont residents.
HR Compensation & Benefits Group Classification and Compensation
► Improve our position management process, taking full advantage of the functionality within HCM. In partnership with the Department of Finance and Management, we will work to improve the budgeting process by eliminating the need to budget vacancy savings thereby fully implementing the position pool concept.
► Plan and implement a regular schedule for job classification reviews in an effort to
ensure that positions are properly classified and that as changes are required, the fiscal impact is minimized.
► Provide comprehensive consulting and technical assistance to agencies and
departments as they plan classification reviews, administer compensation, and manage positions.
► Conduct a comprehensive review of job specifications and minimum qualifications to
ensure that all jobs are defined appropriately and in a manner that supports agencies and departments as they initiate the recruitment process.
Employee Benefits and Wellness
► Aggressively pursue all necessary steps to position the health plan to receive Federal subsidies for retiree prescription drug expenditures beginning in 2006. The new Medicare law implements a voluntary prescription drug benefit (Part D) for over-65 persons. Employers providing actuarially equivalent prescription drug coverage to

State of Vermont Workforce Report – FY 2004 17
over-65 retirees and dependents will be eligible to receive subsidy payments from Medicare to offset the employer’s costs beginning in January 2006.
► Expand wellness programming by implementing a second statewide employee
physical activity program and initiating clinical follow-up with individual employees who demonstrate key high risk factors, while continuing the clinical interventions with high-risk worksite groups.
► Identify and maximize prescription drug savings over the longer term by re-bidding
the State employees’ prescription drug program prior to the contract’s expiration. Obtain the most competitive administrative pricing and the most advantageous financial arrangement for the purchase of prescription drugs for this program.
► Implement business process improvements including but not limited to: (a)
determine feasibility of data comparison of wellness and disease management data with health and prescription drug claims data; (b) install FootPrints software for the consistent and efficient tracking of benefit plan customer service; (c) transfer all benefit plan enrollment and benefit table update functions from Payroll to the division.
HR Systems & Fiscal/Information Management Group Payroll
► Conduct a departmental process assessment to evaluate existing business processes and further leverage the States’ HCM investment and the talent among our payroll staff.
► Implement business process improvements for expense processing.
► Fully document all payroll department functions and processes.
► Participate in the design and implementation of a new Time & Labor system to
electronically collect time and expense data from agencies and departments and eliminate the current heavily paper driven process flow. This process will have a major impact on every State agency and will require Payroll staff to play a major role in the implementation process.
Fiscal/Information Management
► Focus on HCM integrity and develop and implement proper quality control mechanisms and system edits.
► In conjunction with Information Systems, expand reporting capabilities of the HCM
system, developing a full range of standard reports available to agency/department HR partners for improved HR financial and strategic planning.
► Effectively and timely manage the market factor analysis process.

18 State of Vermont Workforce Report – FY 2004
Information Systems ► Provide infrastructure to support expanding the reporting capabilities for improved
HR financial and strategic planning ► Complete work on HIPAA security provisions. ► Continue building on the successes realized from the Memorandum of Understanding
between the Department of Human Resources and the Department of Finance and Management
► Continue to expand the use of Intranet capabilities to enhance communication
between Department employees and HR Partners.
Workforce Planning and Development Group
► Strengthen the collaboration between Department of Human Resources and agencies/departments related to workforce planning, developing a management tool to guide departments in this critically important function.
► Continue efforts to ensure high-quality, cost-effective and consistent training is
available across State government.
► Conduct a needs analysis and assess all management and supervisory training and the associated costs throughout State government. The goal is to ensure that a consistent curriculum of the highest quality and most cost effective delivery system is being implemented.
► Fully implement HCM, maximizing the effectiveness of the system delivered
functionality and provide training in the eRecruit and eRecruit Manager Desktop modules.
► Effectively manage the entire recruitment process as we establish ourselves as “An
Employer of Choice” and continue the expansion of our recruitment outreach programs in order to increase the flow of high quality candidates for State employment with emphasis on diversity and the hard to fill positions.

State of Vermont Workforce Report – FY 2004 19
Workforce Characteristics – Fiscal Year 2004
Section Two of this report provides general descriptive statistics for the Executive branch workforce for Fiscal Year 2004. The data presented include all Executive branch employees (exempt and classified), but does not include temporary employees, or Legislative or Judicial branch employees. Highlights:
• At the end of Fiscal Year 2004 there were 8,069 Executive branch employees or 7,935.3 Full-Time Equivalents (FTEs).
• The average Executive branch employee works in a
professional job category, is 45.7 years old and has 12.3 years of service.
• At the end of Fiscal Year 2004 the average base
salary paid for Executive branch employees (classified and exempt) was $42,018.
• Nearly 50% of Executive branch employees work in
Washington County.
• The Executive branch workforce is composed of 52% males and 48% females. Minorities make up 1.8% of the employee population.
• 87% of Executive branch employees are represented
by a bargaining unit.
• There was a 1 to 5.5 ratio of supervisors and managers to non-supervisory employees.
• The single most populous job title was Correctional
Officer I.
Section Two

20 State of Vermont Workforce Report – FY 2004
Table 1 Number of Executive Branch Employees and FTEs by Department
Department Number of Employees FTEs Department
Number of Employees FTEs
Administration 3 3.0 Libraries 35 34.0
Aging & Disabilities 225 215.6 Lieutenant Governor 2 2.0
Agriculture 88 87.3 Liquor Control 55 55.0
Attorney General 70 66.9 Military 111 110.5
Auditor of Accounts 12 12.0 Natural Resources 48 47.5
BISHCA 95 93.4 PATH 417 414.1
Buildings & General Services 402 399.3 Personnel 57 56.2
Child Support Services 124 123.8 Public Safety 514 511.3
Commerce & Community Dev. 97 94.8 Public Service 51 51.0
Corrections 1,106 1,101.3 Public Service Board 25 24.8
Criminal Justice Training Council 8 8.0 Secretary of State 50 50.0
Defender General 65 59.8 Social & Rehabilitation Services 408 399.9
Developmental & MH Services 97 95.5 State Treasurer 33 33.0
Economic Opportunity 6 6.0 State's Attorneys & Sheriffs 159 154.0
Education 184 180.8 Taxes 185 183.1
Employment & Training 291 290.4 Transportation 1,293 1,286.8
Environmental Board 31 30.6 Vermont Commission on Women 3 2.6
Environmental Conservation 268 264.1 Vermont Human Rights Commission 5 4.8
Finance & Management 38 38.0 Vermont Labor Relations Board 2 1.6
Fish & Wildlife 118 118.0 Vermont Lottery Commission 19 19.0
Forest, Parks & Recreation 121 119.0 Vermont State Hospital 181 178.0
Governor's Office 17 16.7 Vermont Veterans' Home 203 194.9
Health 544 496.3 VOSHA Review Board 1 0.5
Human Services 54 53.5 VT Fire Service Training Council 7 7.0
Information and Innovation 51 51.0 Water Resources Board 4 4.0
Labor & Industry 86 85.0
Grand Total 8,069 7,935.3 Source: The state’s Human Resource Management System. Data include all Executive branch employees (classified and exempt) for Fiscal Year 2004. This table represents filled positions only. FTEs are “Full-Time Equivalents”. Comments: At the end of Fiscal Year 2004 there were 8,069 Executive branch employees. A more accurate picture of staffing level is provided by the 7,935.3 FTE figure. FTEs are “Full-Time Equivalents”. For purposes of this table, one FTE is based on a full-time employee’s work year of 2,080 hours. To calculate FTEs for a part-time employee, total authorized hours are divided by 2,080. Thus, a part-time employee (20 hours per week/1040 hours per year) would equal .5 FTEs. (In this case, the prorate factor is equal to .5). FTEs shown in this table, and throughout this report, are based on a pro-rate factor calculated to the nearest tenth.

State of Vermont Workforce Report – FY 2004 21
Table 2 Executive Branch Employees by County of Work
County Number of Employees Percent
Addison 135 1.7% Bennington 389 4.8% Caledonia 319 4.0% Chittenden 1,197 14.8% Essex 24 0.3% Franklin 344 4.3% Grand Isle 20 0.2% Lamoille 100 1.2% Orange 85 1.1% Orleans 308 3.8% Rutland 523 6.5% Washington 3,865 47.9% Windham 240 3.0% Windsor 520 6.4% Grand Total 8,069 100.0%
Source: The state’s Human Resource Management System. Data include all Executive branch employees (classified and exempt) for Fiscal Year 2004. A small percentage of employees are “home-based” and their work location of record is their home county, although they may travel to other areas in the state to perform their job duties. Comments: Executive branch employees work in every county in the state. Nearly 50% (3,865) work in Washington County (Montpelier and Waterbury complexes).

22 State of Vermont Workforce Report – FY 2004
Table 3 Executive Branch Employees by Age Group
1.14%
6.46%
14.76%
17.86%
16.17%
14.46%
12.43%
9.28%
5.68%
1.74%
0.02%
0
200
400
600
800
1000
1200
1400
1600
<20 20-24 25-29 30-34 35-39 40-44 45-49 50-54 55-59 60-65 >65
Age Group
Nu
mb
er
of
Em
plo
yees
Source: The state’s Human Resource Management System. Data include all Executive branch employees (classified and exempt) for Fiscal Year 2004. Comments: The largest group of Executive branch employees (17.86%) was age 50-54, closely followed by the 45-49 age group (16.17%). The average employee age at the end of Fiscal Year 2004 was 45.7 years.
Benchmarking New England State Governments – Average Age
Connecticut 46.6 Massachusetts 45.2 Maine 46.6 New Hampshire 45.0 Vermont 45.7 Source: Connecticut Department of Administrative Services (FY ’04); Commonwealth of Massachusetts, Human Resources Division (FY ’04); New Hampshire, Division of Personnel 2003 Annual Report (FY ’03); Maine, Bureau of Human Resources (FY ’04).
State of Vermont Workforce Report – FY 2004 23
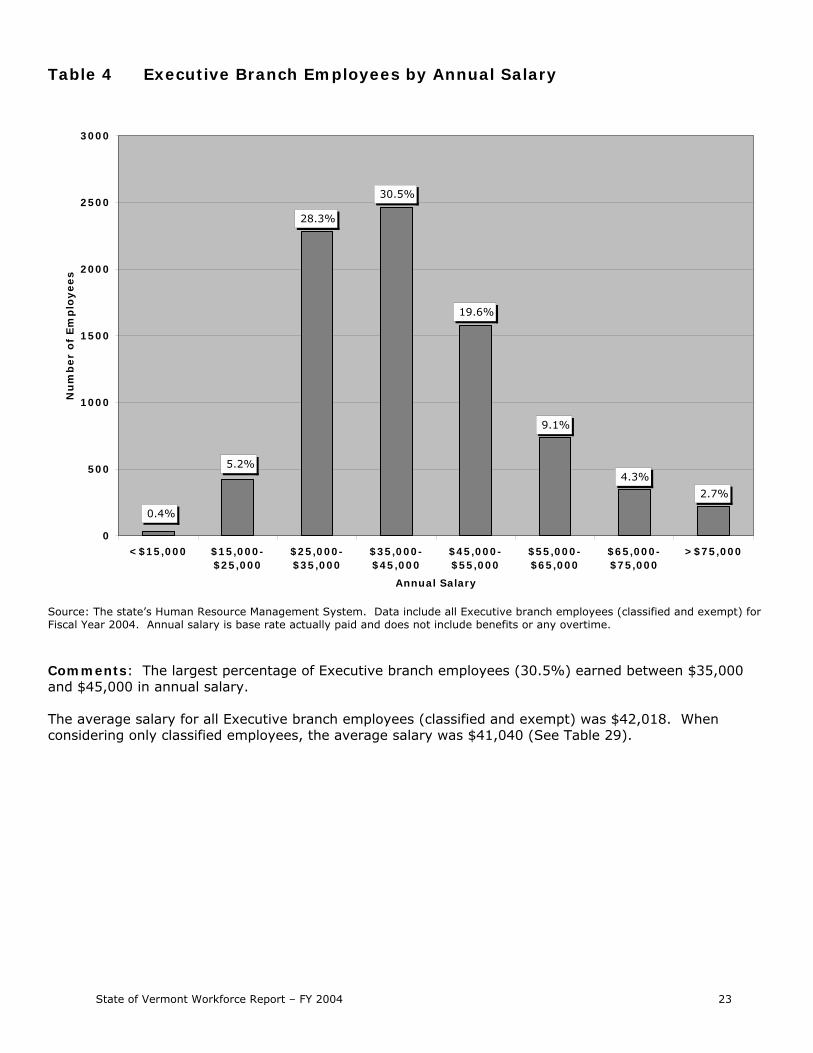
Table 4 Executive Branch Employees by Annual Salary
2.7%
4.3%
9.1%
19.6%
30.5%
28.3%
5.2%
0.4%
0
500
1000
1500
2000
2500
3000
<$15,000 $15,000-$25,000
$25,000-$35,000
$35,000-$45,000
$45,000-$55,000
$55,000-$65,000
$65,000-$75,000
>$75,000
Annual Salary
Nu
mb
er
of
Em
plo
yees
Source: The state’s Human Resource Management System. Data include all Executive branch employees (classified and exempt) for Fiscal Year 2004. Annual salary is base rate actually paid and does not include benefits or any overtime. Comments: The largest percentage of Executive branch employees (30.5%) earned between $35,000 and $45,000 in annual salary. The average salary for all Executive branch employees (classified and exempt) was $42,018. When considering only classified employees, the average salary was $41,040 (See Table 29).

24 State of Vermont Workforce Report – FY 2004
Table 5 Executive Branch Employees by Years of Service
0.3% 1.6%
4.7%
8.6% 9.1%
14.7%
12.2%
18.2%
30.6%
0
500
1000
1500
2000
2500
3000
<5 5-9 10-14 15-19 20-24 25-29 30-34 35-40 >40
Years of Service
Nu
mb
er
of
Em
plo
yees
Source: The state’s Human Resource Management System. Data include all Executive branch employees (classified and exempt) for Fiscal Year 2004. Comments: The largest percentage of employees (30.6%) had less than five year’s service. The average length of service of Executive branch employees was 12.3 years
Benchmarking New England State Governments – Average Years of Service
Connecticut 13.2 Massachusetts 13.9 Maine 16.9 New Hampshire 09.3 Vermont 12.3 Source: Connecticut Department of Administrative Services (FY ’04); Commonwealth of Massachusetts, Human Resources Division (FY ’04); New Hampshire, Division of Personnel 2003 Annual Report (FY ’03); Maine, Bureau of Human Resources (FY ’04).

State of Vermont Workforce Report – FY 2004 25
Table 6 Executive Branch Employees by Ethnic and Gender Representation Source: The state’s Human Resource Management System. Data include all Executive branch employees (classified and exempt) for Fiscal Year 2004. Comments: Of the population of Executive branch employees, 4,178 or 51.8% were male and 3,891 or 48.2% were female. Minority employees made up 1.8% of the workforce. Of the State of Vermont’s 145 minority employees, 34% identified themselves as American Indian/Alaskan Native, 29% Hispanic, 21% Black, and 16% Asian/Pacific Islander.
Female48.2%
Male51.8%
White98.2%
Minority1.8%
American Indian/Alaskan Native (34%)Hispanic (29%)Black (21%)Asian/Pacific Islander (16%)
Benchmarking New England State Governments – Gender and Ethnic Representation
% Male/% Female % Minority Connecticut 52.3%/47.7% 27.2% Massachusetts 48.2%/51.8% 21.5% Maine 50.2%/49.8% 23.1% New Hampshire 49.7%/50.3% 02.6% Vermont 51.8%/48.2% 01.8 % Source: Connecticut Department of Administrative Services (FY ’04); Commonwealth of Massachusetts, Human Resources Division (FY ’04); New Hampshire, Division of Personnel 2003 Annual Report (FY ’03); Maine, Bureau of Human Resources (FY ’04).

26 State of Vermont Workforce Report – FY 2004
Table 7 Executive Branch Employees by Management Level and Job Type Source: The state’s Human Resource Management System. Data include all Executive branch employees (classified and exempt) for Fiscal Year 2004. Comments: Nearly sixteen percent (1,239) of Executive branch employees have a supervisory or management designation. This amounts to approximately a 1 to 5.5 ratio of supervisors and managers to non-supervisory employees. Exempt employees made up 7% (564) of the workforce.
Management5.4%
Non-Management
84.6%
Supervisory10.0%
Exempt7.0%
Classified93.0%

State of Vermont Workforce Report – FY 2004 27
Non-Management63%
State Police4%
Supervisory9%
Corrections11% Excluded from BU
13%
Table 8 Executive Branch Employees by Bargaining Unit Source: The state’s Human Resource Management System. Data include all Executive branch employees (classified and exempt) for Fiscal Year 2004. Excluded from BU are employees who are excluded from participation in a bargaining unit and include exempt employees, and classified confidential and managerial employees. Comments: A total of 7,016 or 87%, of Executive branch employees are covered by one of the four bargaining units – State Police (298), Supervisory (758), Corrections (878), and the largest, Non-Management (5,082).
28 State of Vermont Workforce Report – FY 2004
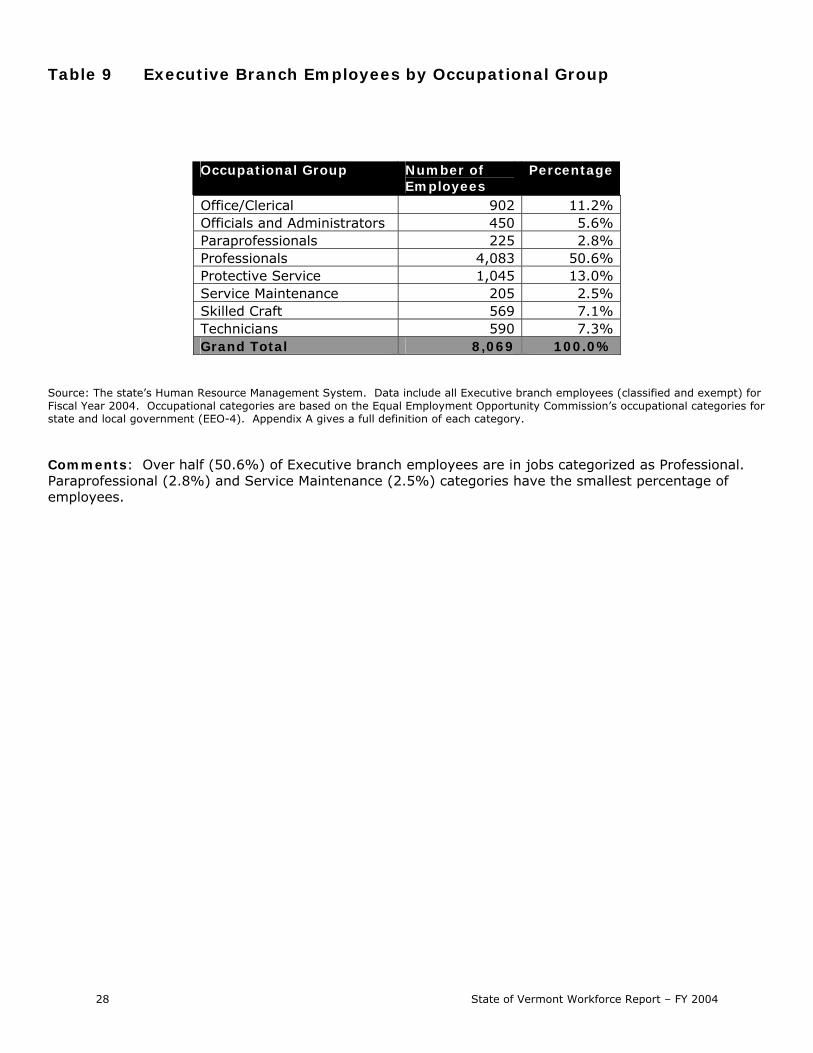
Table 9 Executive Branch Employees by Occupational Group
Occupational Group Number of Employees
Percentage
Office/Clerical 902 11.2% Officials and Administrators 450 5.6% Paraprofessionals 225 2.8% Professionals 4,083 50.6% Protective Service 1,045 13.0% Service Maintenance 205 2.5% Skilled Craft 569 7.1% Technicians 590 7.3% Grand Total 8,069 100.0%
Source: The state’s Human Resource Management System. Data include all Executive branch employees (classified and exempt) for Fiscal Year 2004. Occupational categories are based on the Equal Employment Opportunity Commission’s occupational categories for state and local government (EEO-4). Appendix A gives a full definition of each category. Comments: Over half (50.6%) of Executive branch employees are in jobs categorized as Professional. Paraprofessional (2.8%) and Service Maintenance (2.5%) categories have the smallest percentage of employees.

State of Vermont Workforce Report – FY 2004 29
Table 10 Most Populous Classified Job Titles
Job Title Number of Employees
Correctional Officer I 330 AOT Maintenance Worker IV 198 Program Services Clerk 156 Administrative Assistant A 148 Social Worker B 143 Corrections Services Specialist II 141 Administrative Assistant B 130 Correctional Officer II 126 Benefits Programs Specialist 119 Senior Trooper - Station 118 Systems Developer II 95 Licensed Nursing Assistant 78 Custodian I 77 Sergeant 75 Public Health Nurse III 70 Reach Up Case Manager 69 AOT Senior Maintenance Worker 64 Motor Vehicle Customer Service Specialist 62 Emergency Communication Dispatcher 61 Community Correctional Officer 59 Administrative Secretary 56 AOT Technician IV 53 Information Technology Specialist II 51 Correctional Facility Shift Supervisor 49 AOT Area Maintenance Supervisor 48 AOT Technician VI 46 Environmental Analyst IV: General 44 Information Center Representative II 43 Psychiatric Technician I 41 Systems Developer III 41
Source: The state’s Human Resource Management System. Data only include classified employees of the Executive branch for Fiscal Year 2004. Comments: Of the 1,475 classified job titles that were on record at the end of Fiscal Year 2004, the most populous was Correctional Officer I (330 employees). More than 21% of the classified workforce was employed in one of the top ten most populous job titles. However, of the 1,475 classified job titles the majority, 863 (58.5%), had a single incumbent.

30 State of Vermont Workforce Report – FY 2004
THIS PAGE IS INTENTIONALLY LEFT BLANK

State of Vermont Workforce Report – FY 2004 31
Workforce Trends – Fiscal Years 2000 - 2004
Section Three of this report provides graphs and tables showing the workforce trends for Fiscal Years 2000 to 2004. The data presented represent only classified employees of the Executive branch of the State of Vermont. Trends are examined in the following areas: Employment Turnover Age and Length of Service Compensation Diversity Leave Usage
Section Three

32 State of Vermont Workforce Report – FY 2004
THIS PAGE IS INTENTIONALLY LEFT BLANK

State of Vermont Workforce Report – FY 2004 33
Employment
Highlights:
• Both the number of classified employees (7,505) and FTEs (7,389.5) increased (+2.4% and +2.5% respectively) from Fiscal Year 2003.
• Departments that have shown the greatest growth from
FY 2000 to FY 2004 include Education, Aging & Disabilities, Military, Vermont State Hospital, and Corrections.
• Employees categorized as professional have shown
consistent growth over the five year period now making up 50% of the workforce.
• In Fiscal Year 2004 8,996 applicants submitted 22,491
applications for classified jobs. This represents a 41% increase in applicants and 39% increase in applications submitted over Fiscal Year 2003.
• Most applicants (55%) were female. The average age of
applicants was 38.5. 4.8% identified themselves as ethnic minorities.
• During Fiscal Year 2004 there were 596 hires for a hire
rate of 7.9% of the workforce. 53.2% of hires were male and 1.8% were ethnic minorities.
• New hire surveys showed that most (52.1%) new hires
first learned about the job they accepted from the Department of Personnel’s web site. Most applicants were already employed and only casually looking for new employment. The most important reason cited for accepting employment with the State of Vermont was “seeking better benefits” (29.3%)
Workforce Trends
34 State of Vermont Workforce Report – FY 2004
Table 11 Number of Classified Employees and FTEs by Fiscal Year
6937
7505(2.4%)
7326(1.0%)7250
(2.2%)
7096(2.3%)
6807.4
7389.5(2.5%)
7206.5(1.2%)7122.0
(2.3%)
6962.9(2.3%)
6200
6400
6600
6800
7000
7200
7400
7600
7800
2000 2001 2002 2003 2004
Fiscal Year
Number FTEs
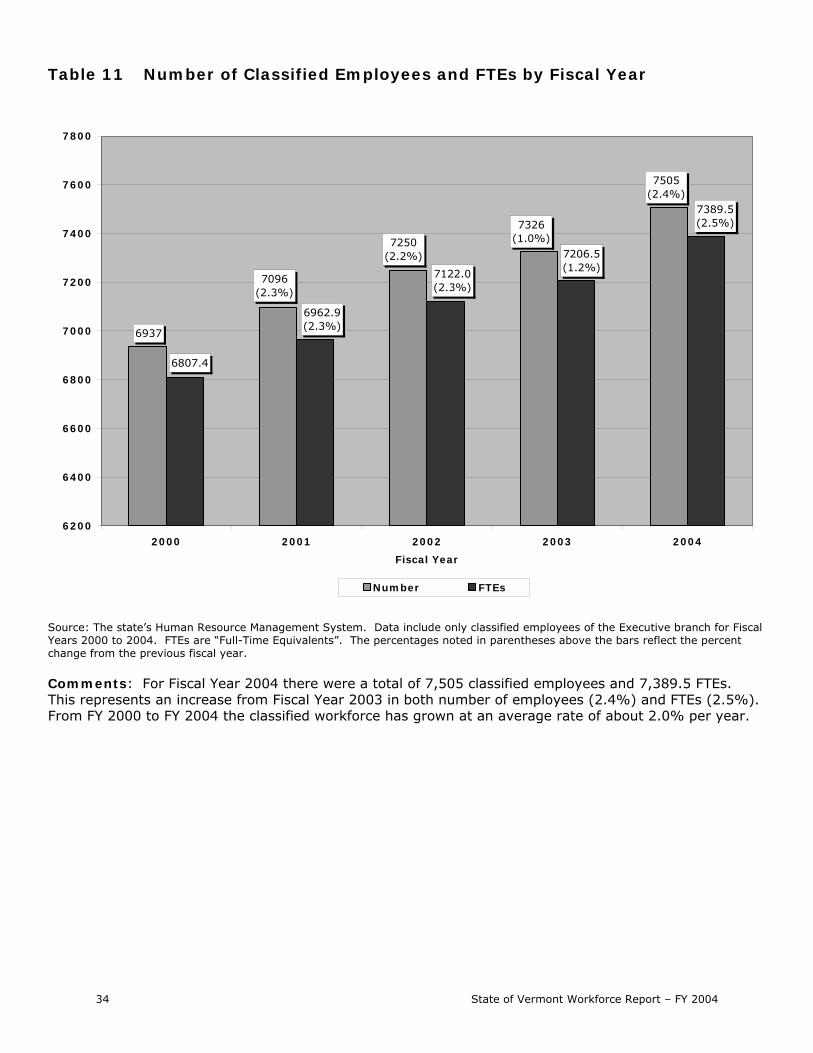
Source: The state’s Human Resource Management System. Data include only classified employees of the Executive branch for Fiscal Years 2000 to 2004. FTEs are “Full-Time Equivalents”. The percentages noted in parentheses above the bars reflect the percent change from the previous fiscal year. Comments: For Fiscal Year 2004 there were a total of 7,505 classified employees and 7,389.5 FTEs. This represents an increase from Fiscal Year 2003 in both number of employees (2.4%) and FTEs (2.5%). From FY 2000 to FY 2004 the classified workforce has grown at an average rate of about 2.0% per year.

State of Vermont Workforce Report – FY 2004 35
Table 12 Number of Classified Employees and FTEs by Department by FY
Department FY 2000 FY 2001 FY 2002 FY 2003 FY 2004 % Change
FY 00 to FY 04
Nu
m.
FTEs
Nu
m.
FTEs
Nu
m.
FTEs
Nu
m.
FTEs
Nu
m.
FTEs
Num. FTEs
Aging & Disabilities 181 174.1 193 183.8 201 192.8 207 198.0 221 211.6 22.1% 21.5%
Agriculture 81 79.9 80 78.9 81 79.8 80 78.9 83 82.3 2.5% 3.0%
Attorney General 27 26.0 23 22.0 29 27.3 29 28.3 28 27.8 3.7% 6.9%
BISHCA 71 70.8 70 68.4 72 70.1 76 74.9 78 76.4 9.9% 7.9%
Buildings & General Services 367 366.8 386 385.3 416 415.2 420 419.9 396 394.3 7.9% 7.5%
Child Support Services 111 110.6 111 110.0 111 111.0 111 110.8 115 114.8 3.6% 3.8%
Commerce & Community Dev. 79 76.9 85 82.2 83 79.8 80 78.3 79 76.8 0.0% -0.1%
Corrections 927 920.2 936 931.8 966 960.0 973 967.1 1098 1093.3 18.4% 18.8%
Developmental & MH Services 93 92.8 97 96.8 98 97.8 96 95.1 89 88.8 -4.3% -4.3%
Education 143 136.3 163 158.4 179 174.8 174 171.1 177 173.8 23.8% 27.6%
Employment & Training 351 347.5 324 322.1 320 318.5 318 315.9 285 284.6 -18.8% -18.1%
Environmental Board 27 25.3 28 27.2 27 26.5 26 25.6 26 25.6 -3.7% 1.2%
Environmental Conservation 257 253.1 264 258.9 257 251.2 257 252.7 261 257.8 1.6% 1.9%
Finance & Management 30 30.0 25 25.0 33 33.0 31 31.0 35 35.0 16.7% 16.7%
Fish & Wildlife 118 117.8 115 114.8 114 114.0 118 118.0 114 114.0 -3.4% -3.2%
Forest, Parks & Recreation 117 116.4 120 119.0 117 116.0 115 114.0 119 117.0 1.7% 0.5%
Health 477 435.6 514 462.5 517 466.7 537 488.6 539 491.3 13.0% 12.8%
Human Services 61 57.2 53 48.3 55 52.5 45 44.3 47 46.5 -23.0% -18.6%
Information and Innovation 49 49.0 n/a n/a
Labor & Industry 75 74.0 72 71.0 76 75.5 78 77.0 79 78.0 5.3% 5.4%
Libraries 36 34.5 33 32.0 31 30.5 33 32.0 33 32.0 -8.3% -7.2%
Liquor Control 51 51.0 53 53.0 54 54.0 52 52.0 53 53.0 3.9% 3.9%
Military 88 86.8 99 97.8 108 107.0 106 105.3 107 106.5 21.6% 22.7%
Natural Resources 34 33.1 30 29.1 29 28.0 40 39.5 39 38.5 14.7% 16.2%
PATH 397 390.8 415 409.2 421 415.1 410 406.3 410 407.1 3.3% 4.2%
Personnel 48 45.8 48 47.0 53 50.8 51 49.4 52 51.2 8.3% 11.8%
Public Safety 459 456.6 489 486.6 489 486.6 480 477.6 508 505.3 10.7% 10.7%
Public Service 38 37.9 37 36.9 37 37.0 38 38.0 37 37.0 -2.6% -2.5%
Secretary of State 41 41.0 40 40.0 38 38.0 38 38.0 41 41.0 0.0% 0.0%
Small Departments 44 43.6 44 43.6 43 42.0 43 42.5 35 34.4 -20.5% -21.0%
Social & Rehabilitation Services 379 367.8 378 369.3 393 385.1 385 376.5 394 386.2 4.0% 5.0%
State Treasurer 26 26.0 26 26.0 26 25.8 26 26.0 29 29.0 11.5% 11.5%
Taxes 174 171.6 176 173.1 180 177.6 175 172.1 174 172.1 0.0% 0.3%
Transportation 1178 1173.3 1221 1215.9 1228 1221.9 1271 1266.0 1276 1269.8 8.3% 8.2%
Vermont Lottery Commission 18 18.0 19 19.0 18 18.0 18 18.0 18 18.0 0.0% 0.0%
Vermont State Hospital 152 150.2 158 155.9 155 152.4 180 176.7 181 178.0 19.1% 18.5%
Vermont Veterans' Home 181 168.4 171 162.2 195 189.7 209 201.4 200 191.9 10.5% 13.9%
Grand Total 6937 6807.4 7096 6962.9 7250 7122.0 7326 7206.5 7505 7389.5 8.2% 8.6%
% Increase from Previous FY 2.3% 2.3% 2.2% 2.3% 1.0% 1.2% 2.4% 2.5% Source: The state’s Human Resource Management System. Data include only classified employees of the Executive branch for Fiscal Years 2000 to 2004. “Small Departments” have 10 or fewer employees (See Appendix B). FTEs are “Full-Time Equivalents”. Comments: Departments that have experienced the highest percentage growth in numbers of employees from FY 2000 to FY 2004 include Education (+23.8%), Aging & Disabilities (+22.1%), Military (+21.6%), Vermont State Hospital (+19.1%), and Corrections (+18.4%). Departments with the largest percentage declines include Human Services (-23.0%) and Employment & Training (-18.8%).

36 State of Vermont Workforce Report – FY 2004
Table 13 Number of Classified Employees by Occupational Group by Fiscal Year
%
Occupational Group Fiscal Year Change
2000 2001 2002 2003 2004 FY 00 to
Num. % Num. % Num. % Num. % Num. % FY 04
Office/Clerical 1,110 16% 1,052 15% 960 13% 898 12% 831 11% -25.1%
Officials and Administrators 297 4% 304 4% 319 4% 332 5% 326 4% 9.8%
Paraprofessionals 166 2% 163 2% 174 2% 192 3% 224 3% 34.9%
Professionals 3,053 44% 3,232 46% 3,544 49% 3,658 50% 3,768 50% 23.4%
Protective Service 822 12% 900 13% 907 13% 891 12% 997 13% 21.3%
Service Maintenance 384 6% 391 6% 210 3% 211 3% 205 3% -46.6%
Skilled Craft 319 5% 339 5% 556 8% 562 8% 569 8% 78.4%
Technicians 786 11% 715 10% 580 8% 582 8% 585 8% -25.6%
Grand Total 6,937 100% 7,096 100% 7,250 100% 7,326 100% 7,505 100% 8.2%
Source: The state’s Human Resource Management System. Data include only classified employees of the Executive branch for Fiscal Years 2000 to 2004. Occupational categories are based on the Equal Opportunity Commission’s occupational categories for state and local government (EEO-4). Appendix A gives a full definition of each category. Comments: There has been a steady decline in the number of employees categorized as Service Maintenance (-46.6%), Technicians (-25.6%) and Office/Clerical (-25.1) from FY 2000 to FY 2004. During the same time period there as been steady growth in the Professional occupational category not only in terms of numbers of employees (+23.4%) but also as a percent of the workforce (from 44% to 50%).

State of Vermont Workforce Report – FY 2004 37
Table 14 Characteristics of Applicants for Classified Jobs by Fiscal Year
8,996(41.0%)
Minority 4.8%Female 55.0%Male 45.0%
Average Age 38.5
6,381
Minority 4.6%Female 56.1%Male 43.9%
Average Age 38.2
22,491(38.9%)
16,191
0
5000
10000
15000
20000
25000
2003 2004Fiscal Year
Nu
mb
er
Applicants Applications Submitted
Source: The state’s Human Resource Management System. Data include both internal and external applicants for classified jobs who applied through the centralized Department of Personnel for Fiscal Years 2003 and 2004. This analysis does not include departments with decentralized recruitment authority or agency only recruitments. This information was voluntarily submitted by applicants as part of the application process. Not included in the analysis of applicant characteristics were 1,013 applicants who did not report their ethnic status; 396 who did not report their gender; and 502 who did not report their age. Comments: In Fiscal Year 2004, 8,996 applicants submitted 22,491 applications for classified jobs with the State of Vermont (average of 2.5 applications per applicant). This represents an increase of 38.9% in applications submitted and 41.0% in applicants over Fiscal Year 2003. This increase is largely attributable to the introduction of an online job application system in February of 2003, as well as increased marketing and outreach efforts. For Fiscal Year 2004 the average age of applicants was 38.5. Most applicants (55.0%) were female. Of the 7,983 applicants who provided valid ethnic status information, 95.2% were white, while 4.8% were ethnic minorities.

38 State of Vermont Workforce Report – FY 2004
Table 15 New Hires by Department by Fiscal Year
Fiscal Year 2003 Fiscal Year 2004
Hir
es
Wor
kfor
ce
Rat
e
Per
cen
t M
inor
ity
Per
cen
t Fe
mal
e
Per
cen
t M
ale
Hir
es
Wor
kfor
ce
Rat
e
Per
cen
t M
inor
ity
Per
cen
t Fe
mal
e
Per
cen
t M
ale
Aging & Disabilities 15 207 7.2% 0.0% 73.3% 26.7% 16 221 7.2% 0.0% 68.8% 31.3%
Agriculture 5 80 6.3% 0.0% 20.0% 80.0% 7 83 8.4% 0.0% 57.1% 42.9%
Attorney General 1 29 3.4% 0.0% 100.0% 0.0% 2 28 7.1% 0.0% 100.0% 0.0%
BISHCA 5 76 6.6% 0.0% 80.0% 20.0% 4 78 5.1% 0.0% 50.0% 50.0%
Buildings & General Services 25 420 6.0% 4.0% 24.0% 76.0% 34 396 8.6% 2.9% 23.5% 76.5%
Child Support Services 1 111 0.9% 0.0% 100.0% 0.0% 1 115 0.9% 0.0% 100.0% 0.0%
Commerce & Community Dev. 3 80 3.8% 0.0% 0.0% 100.0% 2 79 2.5% 0.0% 0.0% 100.0%
Corrections 54 973 5.5% 1.9% 33.3% 66.7% 171 1098 15.6% 3.5% 31.0% 69.0%
Developmental & MH Services 1 96 1.0% 0.0% 0.0% 100.0% 0 89 0.0% n/a n/a n/a
Education 11 174 6.3% 0.0% 45.5% 54.5% 15 177 8.5% 0.0% 46.7% 53.3%
Employment & Training 12 318 3.8% 0.0% 66.7% 33.3% 12 285 4.2% 8.3% 50.0% 50.0%
Environmental Board 0 26 0.0% n/a n/a n/a 0 26 0.0% n/a n/a n/a
Environmental Conservation 15 257 5.8% 0.0% 53.3% 46.7% 13 261 5.0% 0.0% 46.2% 53.8%
Finance & Management 1 31 3.2% 0.0% 0.0% 100.0% 5 35 14.3% 0.0% 40.0% 60.0%
Fish & Wildlife 6 118 5.1% 0.0% 33.3% 66.7% 4 114 3.5% 0.0% 25.0% 75.0%
Forest, Parks & Recreation 1 115 0.9% 0.0% 100.0% 0.0% 1 119 0.8% 0.0% 100.0% 0.0%
Health 41 537 7.6% 0.0% 70.7% 29.3% 30 539 5.6% 0.0% 80.0% 20.0%
Human Services 2 45 4.4% 0.0% 100.0% 0.0% 1 47 2.1% 0.0% 100.0% 0.0%
Information and Innovation 3 49 6.1% 0.0% 0.0% 100.0%
Labor & Industry 5 78 6.4% 0.0% 20.0% 80.0% 4 79 5.1% 0.0% 50.0% 50.0%
Libraries 4 33 12.1% 0.0% 75.0% 25.0% 1 33 3.0% 0.0% 100.0% 0.0%
Liquor Control 1 52 1.9% 0.0% 100.0% 0.0% 0 53 0.0% n/a n/a n/a
Military 6 106 5.7% 16.7% 33.3% 66.7% 7 107 6.5% 0.0% 14.3% 85.7%
Natural Resources 2 40 5.0% 0.0% 0.0% 100.0% 1 39 2.6% 0.0% 0.0% 100.0%
PATH 14 410 3.4% 7.1% 78.6% 21.4% 26 410 6.3% 0.0% 73.1% 26.9%
Personnel 1 51 2.0% 0.0% 100.0% 0.0% 7 52 13.5% 0.0% 85.7% 14.3%
Public Safety 28 480 5.8% 0.0% 32.1% 67.9% 65 508 12.8% 1.5% 27.7% 72.3%
Public Service 6 38 15.8% 0.0% 66.7% 33.3% 2 37 5.4% 0.0% 100.0% 0.0%
Secretary of State 5 38 13.2% 0.0% 80.0% 20.0% 3 41 7.3% 0.0% 66.7% 33.3%
Small Departments 2 43 4.7% 0.0% 50.0% 50.0% 2 35 5.7% 0.0% 100.0% 0.0%
Social & Rehabilitation Services 23 385 6.0% 8.7% 69.6% 30.4% 30 394 7.6% 0.0% 70.0% 30.0%
State Treasurer 2 26 7.7% 0.0% 50.0% 50.0% 5 29 17.2% 0.0% 100.0% 0.0%
Taxes 2 175 1.1% 0.0% 100.0% 0.0% 8 174 4.6% 0.0% 62.5% 37.5%
Transportation 91 1271 7.2% 3.3% 33.0% 67.0% 73 1276 5.7% 1.4% 42.5% 57.5%
Vermont Lottery Commission 2 18 11.1% 0.0% 100.0% 0.0% 2 18 11.1% 0.0% 50.0% 50.0%
Vermont State Hospital 12 180 6.7% 0.0% 66.7% 33.3% 11 181 6.1% 9.1% 81.8% 18.2%
Vermont Veterans' Home 43 209 20.6% 0.0% 95.3% 4.7% 28 200 14.0% 0.0% 89.3% 10.7%
Grand Total 448 7326 6.1% 2.0% 52.2% 47.8% 596 7505 7.9% 1.8% 46.8% 53.2% Source: The state’s Human Resource Management System. Data include new hires and rehires for classified positions in the Executive branch. “Small Departments” have 10 or fewer employees (See Appendix B). Comments: For FY 2004 there were 596 new hires for a hire rate of 7.9% of the workforce. This represents a 33.0% increase over FY 2003. Ethnic minorities made up 1.8% of new hires and gender representation was 46.8% female and 53% male.

State of Vermont Workforce Report – FY 2004 39
Table 16 New Hire Survey Results – Fiscal Year 2004
New Hires' View of the State of Vermont as an Employer
Strongest Weakest
Attribute Percent Attribute Percent
Greater Job Security 95.8% Competitive Salaries 64.6%
Work that Makes a Difference 94.5% Open to Change 76.3%
Career Opportunities 92.8% Good Morale 79.8%
Excellent Benefits 92.8% Encourages Independent Decision Making 83.1%
Diversity 91.9% Good Working Environment 83.9%
Note: Percent of respondents who agreed or strongly agreed to the attributes when they thought of the State of Vermont as an employer.
Source: New Hire Survey Results and Analysis – Fiscal Year 2004. Surveys were sent to 474 new hires into classified jobs during FY 2004. A total of 211 responded for a response rate of 44.5%. The sample was 55.5% female and 44.1% male; 3.7% indicated they were an ethnic minority. Comments: The vast majority (52.1%) of new hires first learned of the job opportunity that they eventually accepted from the Department of Personnel web site. Other significant sources included referrals from current employees (14.2%) and a friend or relative (11.8%), as well as a newspaper ad (13.3% - this percentage is must be interpreted carefully because only a small fraction of vacancies are advertised in the newspaper). Most applicants were employed in the private sector and were only casually looking for a new job opportunity. The average age was 40 and most (58%) had a Bachelor’s degree of higher. The most important reason cited for accepting employment with the State of Vermont was “seeking better benefits” (29.3%), followed closely by “desire to make better use of my knowledge & skills” (25.5%) and “looking for greater job security” (23.4%). The employment “brand” – the perception applicants have of the State of Vermont as an employer - was overall very positive. Over 90% agreed or strongly agreed that attributes such as “greater job security”, “work that makes a difference”, “career opportunities”, “excellent benefits”, and “diversity” came to mind when they thought of the State of Vermont as an employer.
Source first learned of job opportunity
Percent
Department of Personnel web site 52.1%
Referral from current employee 14.2%
Newspaper ad 13.3%
Referral from friend or relative 11.8%
Other Internet 3.3%
DET Career Resource Center 2.8%
Other 1.4%
Other State office 0.5%
Job fair 0.5%
Of New Hire Survey Respondents…
● 73% were currently employed when they applied
● 47% came from the private sector
● 57% indicated they were "casually" looking for work
● The average age was 40.
● 58% had a Bachelor's degree or higher
Most Important Reasons for Accepting Employment Percent
Seeking better benefits 29.3%
Desire to make better use of my knowledge & skills 25.5%
Looking for greater job security 23.4%
Opportunity to do work that was interesting to me 21.8%
To increase opportunities for advancement/new skills 19.7%
Note: Respondents were asked to choose up to three "most important" reasons. The percent represents the number of respondents who indicated that statement as one of their reasons.

40 State of Vermont Workforce Report – FY 2004
THIS PAGE IS INTENTIONALLY LEFT BLANK
State of Vermont Workforce Report – FY 2004 41
Turnover
Highlights:
• Turnover in Fiscal Year 2004 rose to 8.2%. The five year average turnover for the classified workforce was 8.4%
• For Fiscal Year 2004 the highest rate of turnover was
found at the Vermont Veterans’ Home (22.3%).
• Turnover is highest in the paraprofessional occupational group (five year average 21.7%).
• Correctional Officer I was the most populous job title
and also showed a high rate of turnover (35.0%).
• Of the turnover in Fiscal Year 2004, 60% were voluntary terminations, 27% were retirements, and 14% involuntary terminations.
• Most voluntary turnover occurs in the first five years
of employment (five year average 70.8%), with the largest percentage occurring in the first year (five year average 32.0%).
• Exit survey results showed that the most important
reason influencing employees’ decision to voluntarily leave employment was “workplace conflicts/ tension/poor morale” (38.8%). However, terminating employees left with an overall relatively positive perception of the State of Vermont as an employer. Over 75% agreed or strongly agreed that they thought of attributes such as “excellent benefits”, “work that makes a difference”, “career opportunities” when considering the State of Vermont as an employer.
Workforce Trends
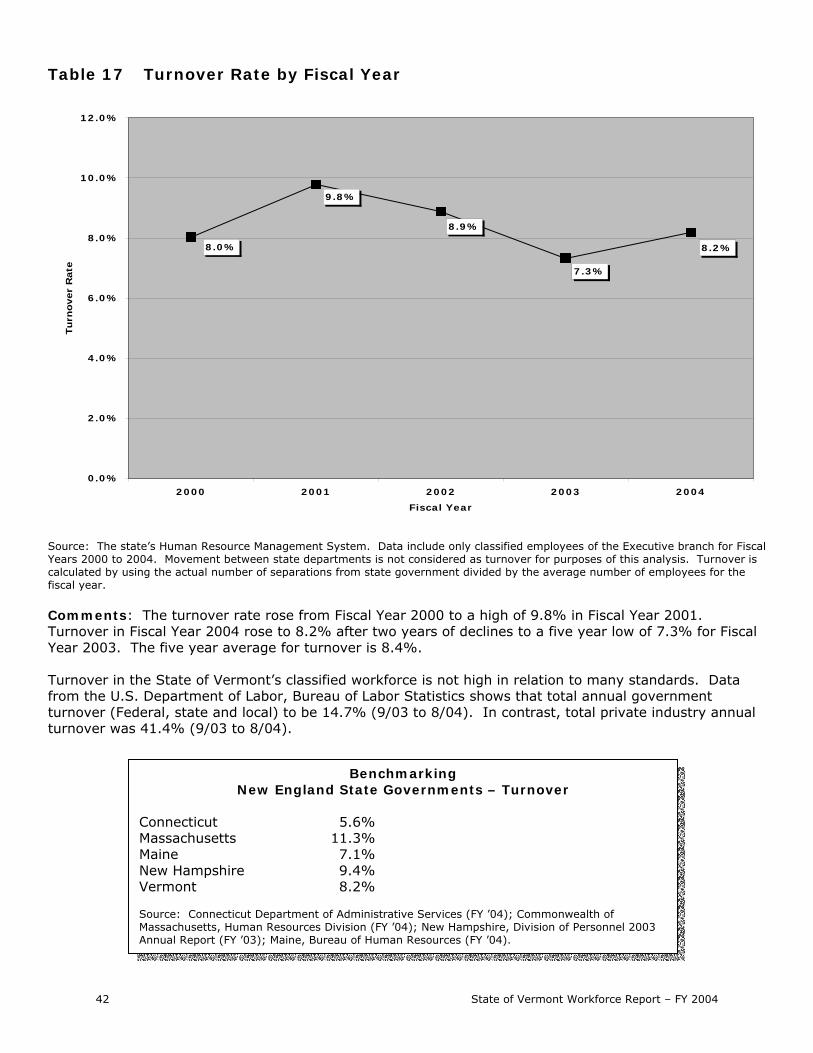
42 State of Vermont Workforce Report – FY 2004
Table 17 Turnover Rate by Fiscal Year
8.2%
7.3%
8.9%
9.8%
8.0%
0.0%
2.0%
4.0%
6.0%
8.0%
10.0%
12.0%
2000 2001 2002 2003 2004
Fiscal Year
Turn
over
Rate
Source: The state’s Human Resource Management System. Data include only classified employees of the Executive branch for Fiscal Years 2000 to 2004. Movement between state departments is not considered as turnover for purposes of this analysis. Turnover is calculated by using the actual number of separations from state government divided by the average number of employees for the fiscal year. Comments: The turnover rate rose from Fiscal Year 2000 to a high of 9.8% in Fiscal Year 2001. Turnover in Fiscal Year 2004 rose to 8.2% after two years of declines to a five year low of 7.3% for Fiscal Year 2003. The five year average for turnover is 8.4%. Turnover in the State of Vermont’s classified workforce is not high in relation to many standards. Data from the U.S. Department of Labor, Bureau of Labor Statistics shows that total annual government turnover (Federal, state and local) to be 14.7% (9/03 to 8/04). In contrast, total private industry annual turnover was 41.4% (9/03 to 8/04).
Benchmarking New England State Governments – Turnover
Connecticut 05.6% Massachusetts 11.3% Maine 07.1% New Hampshire 09.4% Vermont 08.2% Source: Connecticut Department of Administrative Services (FY ’04); Commonwealth of Massachusetts, Human Resources Division (FY ’04); New Hampshire, Division of Personnel 2003 Annual Report (FY ’03); Maine, Bureau of Human Resources (FY ’04).

State of Vermont Workforce Report – FY 2004 43
Table 18 Turnover by Department by Fiscal Year
Department FY2000 FY2001 FY2002 FY2003 FY2004 Five Year Average
Aging & Disabilities 6.1% 7.7% 10.4% 9.5% 4.3% 7.6%
Agriculture 3.9% 5.2% 7.9% 7.8% 8.1% 6.5%
Attorney General 9.5% 36.4% 8.9% 3.7% 15.4% 14.3%
BISHCA 12.1% 14.8% 13.3% 4.3% 6.7% 10.1%
Buildings & General Services 10.1% 13.6% 11.5% 8.8% 9.6% 10.7%
Child Support Services 8.2% 8.2% 6.4% 0.9% 1.8% 5.0%
Commerce & Community Development 10.9% 5.3% 5.2% 6.7% 6.7% 6.9%
Corrections 9.6% 12.6% 9.3% 8.8% 14.4% 11.0%
Education 10.8% 13.2% 5.7% 5.3% 7.7% 8.2%
Employment & Training 5.8% 8.8% 10.0% 4.5% 10.9% 8.0%
Environmental Board 5.0% 9.5% 0.0% 4.3% 4.3% 4.5%
Environmental Conservation 2.1% 4.1% 4.9% 3.4% 2.9% 3.5%
Finance & Management 3.9% 32.1% 4.1% 6.2% 3.0% 9.7%
Fish & Wildlife 2.6% 4.3% 8.0% 6.2% 4.3% 5.0%
Forest, Parks & Recreation 2.7% 4.5% 5.3% 8.3% 2.7% 4.7%
Health 8.3% 12.9% 7.5% 7.4% 5.6% 8.2%
Human Services 3.8% 5.5% 2.1% 10.3% 7.1% 5.7%
Information & Innovation 4.0% n/a
Labor & Industry 5.6% 11.3% 7.3% 3.9% 5.2% 6.6%
Libraries 0.0% 6.0% 3.2% 6.5% 3.2% 3.8%
Liquor Control 6.1% 9.8% 13.2% 3.7% 1.9% 7.0%
Mental Health 3.5% 8.8% 1.0% 7.4% 5.5% 5.2%
Military 8.3% 14.8% 5.1% 7.6% 7.7% 8.6%
Natural Resources 0.0% 3.1% 3.6% 3.6% 2.6% 2.6%
PATH 3.2% 5.5% 5.0% 5.5% 6.5% 5.2%
Personnel 4.4% 7.0% 8.6% 12.9% 10.2% 8.7%
Public Safety 11.3% 10.1% 10.2% 10.2% 8.6% 10.1%
Public Service 2.8% 14.1% 8.5% 13.3% 2.6% 8.2%
Secretary of State 8.0% 9.8% 20.3% 7.7% 2.6% 9.7%
Small Departments 10.4% 9.4% 11.6% 4.9% 8.7% 9.0%
Social & Rehabilitation Services 11.1% 7.0% 11.9% 7.0% 8.7% 9.1%
State Treasurer 8.0% 3.7% 3.7% 16.7% 7.3% 7.7%
Tax 5.6% 4.8% 2.4% 3.5% 4.8% 4.2%
Transportation 8.4% 8.4% 7.7% 5.9% 6.5% 7.4%
Vermont Lottery Commission 11.8% 0.0% 5.4% 11.1% 0.0% 5.4%
Vermont State Hospital 10.3% 11.3% 15.5% 12.2% 10.0% 11.8%
Vermont Veterans' Home 19.6% 24.1% 31.2% 16.7% 20.4% 22.3%
Grand Total 8.0% 9.8% 8.9% 7.3% 8.2% 8.4% Source: The state’s Human Resource Management System. Data include only classified employees of the Executive branch for Fiscal Years 2000 to 2004. “Small Departments” have 10 or fewer employees (See Appendix B). Movement between state departments is not considered as turnover for purposes of this analysis. Turnover is calculated by using the actual number of separations from state government divided by the average number of employees for the fiscal year. Comments: Over this five fiscal year timeframe the highest turnover has been at the Vermont Veteran’s Home with average yearly turnover of 22.3%.

44 State of Vermont Workforce Report – FY 2004
Table 19 Turnover by Occupational Group by Fiscal Year
Occupational Group FY 2000 FY 2001 FY 2002 FY 2003 FY 2004 Five Year Average
Office/Clerical 8.9% 10.4% 7.7% 7.3% 7.8% 8.5% Officials and Administrators 5.9% 5.1% 5.6% 7.2% 8.5% 6.5% Paraprofessionals 23.0% 19.8% 27.3% 20.3% 18.4% 21.7% Professionals 6.6% 9.2% 7.5% 5.8% 5.9% 6.9% Protective Service 10.8% 13.0% 11.6% 10.1% 16.7% 12.5% Service Maintenance 12.0% 14.6% 9.8% 15.2% 17.6% 13.2% Skilled Craft 6.9% 7.5% 13.2% 4.9% 5.0% 6.9% Technicians 5.3% 6.0% 7.5% 8.0% 5.3% 6.4% Grand Total 8.0% 9.8% 8.9% 7.3% 8.2% 8.4%
Source: The state’s Human Resource Management System. Data include only classified employees of the Executive branch for Fiscal Years 2000 to 2004. Occupational categories are based on the Equal Employment Opportunity Commission’s occupational categories for state and local government (EEO-4). Appendix A gives a full definition of each category. Movement between state departments is not considered as turnover for purposes of this analysis. Turnover is calculated by using the actual number of separations from state government divided by the average number of employees for the fiscal year. Comments: Over the five fiscal year period the highest turnover has consistently been in the Paraprofessional occupational group with average yearly turnover of 21.7%. This group includes such job titles as Psychiatric Technician and Licensed Nursing Assistant.

State of Vermont Workforce Report – FY 2004 45
Table 20 Turnover Rates for Classified Job Titles - Fiscal Year 2004
Turnover of Most Populous Job Titles FY '04
Job Titles with the Highest Turnover Rate FY '04
Job Title Nu
mb
er
of
Em
plo
yees
Tu
rno
ver
Job Title Nu
mb
er
of
Em
plo
yees
Tu
rno
ver
Correctional Officer I 291 35.0% Trooper 2/C - Recruit 20 69.6%
AOT Maintenance Worker IV 199 7.4% Correctional Officer I 291 35.0%
Administrative Assistant A 159 5.6% Licensed Nursing Assistant 68 32.9%
Program Services Clerk 143 9.2% BGS Security Worker 12 30.0%
Social Worker B 131 9.1% Psychiatric Technician II 10 26.1%
Corrections Services Specialist II 128 3.1% Veterans Home LPN Charge Nurse 16 22.9%
Benefits Programs Specialist 114 7.8% Employer Resource Consultant 12 22.2%
Administrative Assistant B 110 9.9% Education Programs Coordinator I 14 21.4%
Correctional Officer II 105 10.0% Social Worker C 10 20.0%
Systems Developer II 93 3.3% Emergency Communications Dispatcher 61 19.7%
Senior Trooper - Station 92 4.3% Systems Developer III 31 19.0%
Custodian I 72 18.8% Custodian I 72 18.8%
Sergeant 69 9.7% Custodian II 15 18.8%
Licensed Nursing Assistant 68 32.9% AOT Maintenance Worker III 10 18.2%
AOT Senior Maintenance Worker 67 2.9% E&T District Manager 10 18.2%
Reach Up Case Manager 66 1.5% Public Health Specialist 13 15.4%
Environmental Analyst III - General 65 3.1% Data Clerk - Typist 14 14.3%
Emergency Communications Dispatcher 61 19.7% Civil Engineer II 13 14.3%
Administrative Secretary 60 4.9% Education Consultant I 28 13.6%
Motor Vehicle Customer Services Specialist 58 7.0% Secretary C 38 13.2%
Trooper 1/C - Station 56 5.7% Account Clerk B 17 12.9%
Community Correctional Officer 54 1.9% UC Customer Service Representative 16 12.9%
Public Health Nurse III 52 7.5% Information Center Representative II 33 11.6%
AOT Technician IV 51 5.8% Motor Vehicle Document Clerk I 10 11.1%
Information Technology Specialist II 47 0.0% Corrections Services Specialist I 41 10.8%
Source: The state’s Human Resource Management System. Data include only classified employees of the Executive branch for Fiscal Year 2004. Movement between state departments is not considered as turnover for purposes of this analysis. Turnover is calculated by using the actual number of separations from state government divided by the average number of employees for the fiscal year. Comments: For Fiscal Year 2004 this table shows the turnover rates of the 25 most populous job titles, as well as the 25 classified job titles (with greater than 10 employees) with the highest turnover. Correctional Officer I was the most populous job title and also showed a high rate of turnover (35.0%). This rate is over twice that of Fiscal Year 2003 turnover for Correctional Officer (15.6%). Most populous job titles that showed low rates of turnover included Administrative Assistant B (5.6%), Corrections Services Specialist II (3.1%), Systems Developer II (3.3%), and Senior Trooper – Station (4.3%). The job title with the highest rate of turnover was Trooper 2/C – Recruit at 69.6%. This is the entry level training job class for the Vermont State Police and a high rate of turnover is not unusual. Other job titles with high rates of turnover include Licensed Nursing Assistants (Vermont Veteran’s Home) at 32.9%, BGS Security Worker at 30.0%, and Psychiatric Technician II at 26.1%

46 State of Vermont Workforce Report – FY 2004
Table 21 Turnover by Reason by Fiscal Year
154131
155150138
344322
369
439
318
53 5978
56
79
0
50
100
150
200
250
300
350
400
450
500
2000 2001 2002 2003 2004
Fiscal Year
Num
ber
of
Em
plo
yees
Retire Voluntary Termination Involuntary Termination
Source: The state’s Human Resource Management System. Data include only classified employees of the Executive branch for Fiscal Years 2000 to 2004. Movement between state departments is not considered as turnover for purposes of this analysis. Turnover is calculated by using the actual number of separations from state government divided by the average number of employees for the fiscal year. Comments: The largest number of separations were voluntary terminations, which at 344 was up by 6.8% over FY 2003. After a one year decline in FY 2003, the number of retirements rose to 154 in FY 2004 (+17.6% over FY 2003).). The largest percent increase was in involuntary terminations which rose 41.1% from FY 2003. Two job classes accounted for almost half of the involuntary terminations – Correctional Officer I (32%) and Licensed Nursing Assistant (13%). Of the turnover in Fiscal Year 2004, 60% were voluntary terminations, 27% were retirements, and 14% involuntary terminations.
Turnover Definitions Retire – Includes early, normal, disability and mandatory retirement. Voluntary Termination – Includes voluntary resignations and end of limited term or interim appointments. Involuntary Termination – Includes Reduction in Force layoffs and dismissals related to misconduct or unsatisfactory work performance.

State of Vermont Workforce Report – FY 2004 47
Table 22 Voluntary Turnover by Years of Service (5 Year Average)
First Year(32.0%)
Second Year(16.6%)
Third Year(10.8%)
Fourth Year(7.3%)
Fifth Year (4.2%)
>20 Years(2.5%)
16-20 Years(3.6%)
0-5 Years(70.9%)
11-15 Years(8.9%)
6-10 Years(14.1%)
Source: The state’s Human Resource Management System. Data include only classified employees of the Executive branch for Fiscal Years 2000 to 2004. Movement between state departments is not considered as turnover for purposes of this analysis. Voluntary turnover includes voluntary resignations and end of limited term or interim appointments. Comments: From Fiscal Year 2000 to Fiscal Year 2004 the vast majority of voluntary terminations (five year average 70.9%) occurred among employees with five or fewer years of service. When considering those employees who voluntarily terminated in the first five years the largest percentage occurred in the first year of employment (five year average 32.0%).

48 State of Vermont Workforce Report – FY 2004
Table 23 Exit Survey Results – Fiscal Year 2004
Level of Satisfaction
Source: Exit Hire Survey Results and Analysis – Fiscal Year 2004. Surveys were sent to 191 classified employees who voluntarily terminated during FY 2004. A total of 67 responded for a response rate of 35.1%. The sample was 52.2% female and 44.8% male; 6.0% indicated they were an ethnic minority. Comments: Exit survey results – employees who voluntarily terminated during Fiscal Year 2004 – show that the most important reason influencing employees’ decision to voluntarily leave employment was “workplace conflicts/tension/poor morale” (38.8%), followed by “problems with immediate supervisor” (23.9) and “family circumstances” (22.4%). Terminating employees left either satisfied or very satisfied with their “employment experience” (60.8%), “your coworkers” (68.1%) and “your job” (58.2%). Satisfaction with “the leadership of department” was the lowest at 33.3%. Even among terminating employees the perception of the State of Vermont as an employer was overall relatively positive. Over 60% agreed or strongly agreed that they thought of attributes such as “excellent benefits”, “work that makes a difference”, “career opportunities”, “greater job security” and “work/family flexibility” when considering the State of Vermont as an employer.
Of Exit Survey Respondents… ● 58% voluntarily terminated with two years or less of
service ● While 68.8% had accepted another job, 31.3% had not
been re-employed at the time they responded to the survey
● The average age was 39.
Most Important Reasons Influencing Decision to Leave Employment
Percent
Workplace conflicts/tension/poor morale 38.8%
Problems with immediate supervisor 23.9%
Family circumstances 22.4%
Seeking higher pay 19.4%
Problems with higher management 19.4%
New job/career advancement opportunity 16.4%
Note: Respondents were asked to choose up to three "most important" reasons. The percent represents the number of respondents who indicated that statement as one of their reasons.
View of the State of Vermont as an Employer - Employees who Voluntarily Terminated
Strongest Weakest
Attribute Percent Attribute Percent
Excellent Benefits 89.6% Good Morale 21.6%
Work that Makes a Difference 77.6% Open to Change 26.9%
Career Opportunities 76.1% Encourages Independent Decision Making 32.9%
Greater Job Security 69.7% Opportunities for Advancement 40.9%
Work/Family Flexibility 62.7% Values Employees 44.8%
Note: Percent of respondents who agreed or strongly agreed to the attributes when they thought of the State of Vermont as an employer.
25.4%
25.4%
33.3%
32.8%
25.4%
34.8%
49.3%
10.6%
11.5%
22.7%
0.0% 20.0% 40.0% 60.0% 80.0%
Your Job?
YourSupervisor?
YourCoworkers?
The Leadershipof Dept?
Employmentexperience?
Very Satisfied Somewhat Satisfied

State of Vermont Workforce Report – FY 2004 49
Age and Length of Service
Highlights:
• At the end of Fiscal Year 2004 the average classified employee was 45.6 years old and had an average length of service of 12.5 years.
• 9.7% of the classified workforce were retirement eligible
at the end of Fiscal Year 2004. Within five years over a quarter of the current workforce will be eligible to retire.
• Over 25% of the classified employees in the Official and
Administrators occupational group are currently eligible for retirement.
Workforce Trends

50 State of Vermont Workforce Report – FY 2004
Table 24 Average Age of Classified Employees by Fiscal Year
45.6
45.5
45.1
44.8
44.5
44
44.2
44.4
44.6
44.8
45
45.2
45.4
45.6
45.8
2000 2001 2002 2003 2004
Fiscal Year
Avera
ge A
ge
Source: The state’s Human Resource Management System. Data include only classified employees of the Executive branch for Fiscal Years 2000 to 2004. Comments: The average age of classified employees has been steadily rising over the five-year time period from an average of 44.5 years in Fiscal Year 2000 to an average of 45.6 years in Fiscal Year 2004.
Benchmarking New England State Governments – Average Age
Connecticut 46.6 Massachusetts 45.2 Maine 46.6 New Hampshire 45.0 Vermont 45.6 Source: Connecticut Department of Administrative Services (FY ’04); Commonwealth of Massachusetts, Human Resources Division (FY ’04); New Hampshire, Division of Personnel 2003 Annual Report (FY ’03); Maine, Bureau of Human Resources (FY ’04).

State of Vermont Workforce Report – FY 2004 51
Table 25 Employee Age Groups by Department - Fiscal Year 2004 Department Age Groups Average
<25 25-34 35-44 45-54 55-65 >65 Age
Aging & Disabilities 13 49 87 71 1 49.1
Agriculture 1 10 22 39 11 45.4
Attorney General 8 8 7 5 43.8
BISHCA 14 22 31 10 1 44.9
Buildings & General Services 11 33 102 155 85 10 47.2
Child Support Services 1 15 31 34 33 1 46.6
Commerce & Community Development 2 7 19 29 21 1 47.8
Corrections 44 252 338 306 153 5 42.1
Developmental & Mental Health Services 8 22 42 17 47.3
Education 1 22 42 55 54 3 47.9
Employment & Training 3 31 52 102 93 4 48.9
Environmental Board 1 2 18 4 1 50.0
Environmental Conservation 1 31 74 106 47 2 46.3
Finance & Management 6 7 8 14 47.8
Fish & Wildlife 4 18 38 43 11 42.9
Forest, Parks & Recreation 16 20 53 30 48.2
Health 2 80 113 204 133 7 47.0
Human Services 5 8 24 10 48.4
Information and Innovation 2 7 13 17 10 45.5
Labor & Industry 1 6 21 28 18 5 49.1
Libraries 5 11 15 2 53.9
Liquor Control 9 20 15 8 1 44.3
Military 1 14 37 39 15 1 44.7
Natural Resources 5 13 10 10 1 47.1
PATH 1 47 84 172 100 6 48.1
Personnel 8 17 17 9 1 45.3
Public Safety 7 142 184 124 46 5 40.8
Public Service 7 10 9 10 1 46.6
Secretary of State 6 8 14 12 1 47.8
Small Departments 2 12 13 7 1 47.5
Social & Rehabilitation Services 2 77 100 128 85 2 45.2
State Treasurer 5 9 11 4 44.0
Taxes 2 18 34 50 65 5 49.3
Transportation 30 151 382 406 295 12 45.9
Vermont Lottery Commission 2 8 4 4 46.3
Vermont State Hospital 13 38 34 57 38 1 43.4
Vermont Veterans' Home 6 30 58 62 43 1 45.2
Grand Total 135 1144 2018 2530 1596 82 45.6
Percent 1.8% 15.2% 26.9% 33.7% 21.3% 1.1% Source: The state’s Human Resource Management System. Data include only classified employees of the Executive branch for Fiscal Year 2004. “Small Departments” have 10 or fewer employees (See Appendix B). Comments: Departments with the highest average age include Libraries (53.9) and Taxes (49.3).

52 State of Vermont Workforce Report – FY 2004
Table 26 Length of Service Categories by Department - Fiscal Year 2004 Department Length of Service (in years) Average
<5 5-9 10-14 15-19 20-24 25-30 >30 LOS
Aging & Disabilities 69 49 27 35 17 15 9 11.2
Agriculture 23 6 13 19 9 9 4 13.3
Attorney General 13 7 1 2 1 3 1 9.0
BISHCA 26 16 18 9 4 3 2 9.8
Buildings & General Services 152 63 39 52 37 31 22 11.1
Child Support Services 17 25 16 21 11 18 7 14.7
Commerce & Community Development 18 14 10 19 6 8 4 13.6
Corrections 429 204 168 107 93 82 15 9.7
Developmental & Mental Health Services 16 18 9 15 14 16 1 14.7
Education 68 40 17 24 8 13 7 10.2
Employment & Training 50 46 32 37 38 62 20 16.4
Environmental Board 1 4 5 5 6 5 16.7
Environmental Conservation 59 39 40 49 22 37 15 14.1
Finance & Management 9 4 7 3 4 3 5 14.3
Fish & Wildlife 22 18 19 22 17 8 8 14.3
Forest, Parks & Recreation 17 16 8 17 15 23 23 19.2
Health 180 120 55 82 33 51 18 10.9
Human Services 10 7 7 10 3 8 2 14.7
Information and Innovation 12 13 4 5 3 7 5 13.7
Labor & Industry 19 15 9 19 9 4 4 12.7
Libraries 7 3 2 8 3 9 1 16.7
Liquor Control 16 10 7 3 5 8 4 13.4
Military 28 16 9 24 11 9 10 13.9
Natural Resources 5 10 9 3 2 4 6 15.3
PATH 72 70 55 66 60 61 26 15.3
Personnel 14 6 9 10 6 6 1 12.9
Public Safety 162 108 62 84 51 29 12 10.8
Public Service 12 9 6 4 1 3 2 10.8
Secretary of State 11 9 4 10 5 2 11.2
Small Departments 16 5 3 2 3 4 2 11.3
Social & Rehabilitation Services 113 83 50 62 33 35 18 12.0
State Treasurer 12 4 4 5 1 2 1 10.2
Taxes 33 41 10 30 17 22 21 15.1
Transportation 363 177 148 191 122 141 134 14.3
Vermont Lottery Commission 5 1 1 5 4 1 1 15.3
Vermont State Hospital 76 34 15 12 10 24 10 10.9
Vermont Veterans' Home 75 27 35 41 12 9 1 9.8
Grand Total 2230 1337 933 1112 696 775 422 12.5
Percent 29.7% 17.8% 12.4% 14.8% 9.3% 10.3% 5.6%
Source: The state’s Human Resource Management System. Data include only classified employees of the Executive branch for Fiscal Year 2004. . “Small Departments” have 10 or fewer employees (See Appendix B). Comments: The average length of service for classified employees was 12.5 years. Departments with high average length of service include Forest, Parks & Recreation (19.2), Libraries (16.7) and Employment & Training (16.4).

State of Vermont Workforce Report – FY 2004 53
Table 27 Projected Retirement Eligibility by Occupational Group Projected Eligible
Occupational Group Eligible FY 04 FY 05 FY 06 FY 07 FY 08 FY 09
Five Year Cumulative Projected Eligible
Ten Year Cumulative Projected Eligible
Office/Clerical 10.1% 1.9% 3.7% 3.9% 3.1% 5.3% 28.0% 44.9%
Officials and Administrators 25.8% 4.9% 7.7% 2.8% 6.1% 6.1% 53.4% 74.2%
Paraprofessionals 3.6% 0.9% 1.8% 1.3% 1.3% 2.2% 11.2% 29.0%
Professionals 10.0% 3.1% 3.3% 2.9% 4.4% 4.7% 28.4% 46.5%
Protective Service 3.2% 0.8% 0.7% 0.5% 1.8% 1.5% 7.4% 18.8%
Service Maintenance 9.3% 2.9% 1.5% 4.4% 5.4% 2.4% 25.9% 37.1%
Skilled Craft 9.3% 2.6% 2.6% 3.5% 3.0% 4.4% 25.5% 46.4%
Technicians 9.9% 2.4% 2.4% 3.1% 2.9% 4.6% 25.3% 42.6%
Total 9.7% 2.7% 3.1% 2.7% 3.7% 4.2% 25.6% 42.7% Source: The state’s Human Resource Management System. Data include only classified employees of the Executive branch for Fiscal Year 2004. Retirement eligibility was determined if at the end of Fiscal Year 2004 the employee met one of the following conditions: (1) Five or more years of service (vested) and age 62; or (2) 30 years of service. These are the criteria for “Group F” retirement members, which include almost all classified employees. Some law enforcement employees have different eligibility criteria (“Group C”) and for these employees eligibility was based on five or more years of service (vested) and age 55. Finally, according to the Report on the Actuarial Valuation of the Vermont State Employees’ Retirement System Prepared as of June 30, 2004, there are a small number (33) of employees who remain in “Category A”, which has slightly different criteria for eligibility. For purposes of this analysis these employees could not be identified so have been included under the “Group F” eligibility criteria. Numbers for each year do not carry over to the next year. Projections are based on employee’s age and length of service at Fiscal 2004 year-end. Comments: At the end of Fiscal Year 2004, 9.7% of the classified workforce met eligibility criteria for normal retirement. Over a quarter of employees in the Officials and Administrators occupational group are currently eligible for retirement. The five-year projection shows that overall an additional 2.7% of employees becoming eligible in Fiscal Year 2005. The projections show the percentage generally rising each year to 4.2% in Fiscal Year 2009. By Fiscal Year 2009, 25.6% of the current workforce is projected to be retirement eligible. Perhaps most striking is that over one-half of the classified managers and administrators in state government (Officials and Administrators) will be eligible for retirement in five years. The ten year projection to Fiscal Year 2014 shows that nearly one-half (43%) of the Fiscal Year 2004 workforce will be retirement eligible.

54 State of Vermont Workforce Report – FY 2004
Table 28 Projected Retirement Eligible by Department Projected Eligible
Department Eligible FY 04 FY 05 FY 06 FY 07 FY 08 FY 09
Five Year Cumulative Projected Eligible
Ten Year Cumulative Projected Eligible
Aging & Disabilities 8.1% 1.4% 3.6% 5.4% 4.1% 5.0% 27.6% 49.3%
Agriculture 6.0% 4.8% 3.6% 2.4% 2.4% 2.4% 21.7% 36.1%
Attorney General 3.6% 3.6% 3.6% 0.0% 0.0% 10.7% 21.4% 39.3%
BISHCA 6.4% 1.3% 2.6% 1.3% 0.0% 3.8% 15.4% 37.2%
Buildings & General Services 10.6% 3.5% 3.0% 2.0% 2.8% 4.5% 26.5% 43.2%
Child Support Services 9.6% 0.9% 6.1% 2.6% 7.0% 9.6% 35.7% 47.0%
Commerce & Community Dev. 10.1% 3.8% 1.3% 2.5% 5.1% 6.3% 29.1% 48.1%
Corrections 4.2% 2.2% 1.7% 1.8% 2.7% 3.3% 15.9% 30.1%
Developmental & MH Services 3.4% 3.4% 5.6% 5.6% 5.6% 4.5% 28.1% 52.8%
Education 9.0% 2.8% 4.5% 2.8% 5.1% 4.5% 28.8% 46.9%
Employment & Training 15.4% 6.3% 4.9% 4.2% 5.6% 7.0% 43.5% 58.9%
Environmental Board 3.8% 3.8% 0.0% 3.8% 3.8% 15.4% 30.8% 61.5%
Environmental Conservation 9.2% 2.3% 3.4% 2.3% 3.4% 4.6% 25.3% 39.8%
Finance & Management 17.1% 2.9% 0.0% 5.7% 8.6% 8.6% 42.9% 54.3%
Fish & Wildlife 7.5% 0.0% 0.9% 0.0% 0.9% 5.7% 15.1% 34.2%
Forest, Parks & Recreation 22.7% 3.4% 2.5% 0.0% 10.1% 4.2% 42.9% 56.3%
Health 6.9% 4.3% 3.0% 2.0% 5.4% 3.5% 25.0% 44.3%
Human Services 8.5% 8.5% 2.1% 2.1% 4.3% 4.3% 29.8% 51.1%
Information and Innovation 10.2% 2.0% 6.1% 6.1% 4.1% 2.0% 30.6% 51.0%
Labor & Industry 13.9% 2.5% 1.3% 2.5% 3.8% 1.3% 25.3% 49.4%
Libraries 15.2% 6.1% 9.1% 9.1% 3.0% 3.0% 45.5% 72.7%
Liquor Control 13.2% 3.8% 3.8% 3.8% 1.9% 3.8% 30.2% 37.7%
Military 10.3% 1.9% 0.9% 0.9% 4.7% 6.5% 25.2% 36.4%
Natural Resources 17.9% 0.0% 7.7% 5.1% 2.6% 0.0% 33.3% 46.2%
PATH 11.7% 4.4% 4.9% 3.7% 4.9% 3.2% 32.7% 54.4%
Personnel 3.8% 0.0% 1.9% 3.8% 3.8% 7.7% 21.2% 40.4%
Public Safety 9.3% 1.2% 1.9% 4.3% 4.3% 2.3% 23.3% 29.3%
Public Service 8.1% 0.0% 5.4% 5.4% 2.7% 5.4% 27.0% 40.5%
Secretary of State 4.9% 0.0% 7.3% 2.4% 4.9% 7.3% 26.8% 48.8%
Small Departments 5.7% 2.9% 2.9% 5.7% 0.0% 5.7% 22.9% 48.6%
Social & Rehabilitation Services 7.1% 2.5% 3.0% 2.5% 4.1% 4.8% 24.1% 41.1%
State Treasurer 3.4% 3.4% 6.9% 0.0% 0.0% 0.0% 13.8% 24.1%
Taxes 21.3% 2.9% 2.9% 3.4% 5.2% 5.2% 40.8% 58.6%
Transportation 13.9% 1.8% 3.0% 3.3% 2.9% 4.4% 29.4% 46.2%
Vermont Lottery Commission 11.1% 0.0% 5.6% 0.0% 0.0% 0.0% 16.7% 44.4%
Vermont State Hospital 9.4% 1.7% 2.2% 3.9% 2.8% 5.5% 25.4% 39.2%
Vermont Veterans' Home 5.5% 2.0% 2.5% 2.5% 2.5% 4.0% 19.0% 39.5%
Grand Total 9.7% 2.7% 3.1% 2.8% 3.8% 4.4% 26.5% 42.7% Source: The state’s Human Resource Management System. Data include only classified employees of the Executive branch for Fiscal Year 2004. “Small Departments” have 10 or fewer employees (See Appendix B). Please see Table 25 for a description of the method used to produce the retirement projections. Comments: Departments that currently have 20% or more of their classified workforce retirement eligible include Forest, Parks & Recreation and Taxes. Departments that are projected to have significant levels of retirement eligible employees in five years include Libraries (45.5%), Employment & Training (43.5%), Forest, Parks & Recreation (42.9%), and Finance & Management (42.9%).

State of Vermont Workforce Report – FY 2004 55
Compensation
Highlights:
• For Fiscal Year 2004 the average salary for classified employees was $41,040, a 2.2% increase over the Fiscal Year 2003 average.
• Employees categorized as Officials and Administrators
had the highest average salary ($67,463), while those in the Service Maintenance occupational group had the lowest average salary ($24,263).
• Overtime costs were $12,662,245 for Fiscal Year 2004,
a 10.2% increase from Fiscal Year 2003.
• Compensatory time costs were $3,015,243 for Fiscal Year 2004, a 4.1% increase over Fiscal Year 2003.
Workforce Trends

56 State of Vermont Workforce Report – FY 2004
Table 29 Average Salary for Classified Employees by Fiscal Year
$34,014
$41,040(2.4%)
$40,073(5.1%)
$38,123(6.7%)
$35,719(5.0%)
$32,000
$33,000
$34,000
$35,000
$36,000
$37,000
$38,000
$39,000
$40,000
$41,000
$42,000
2000 2001 2002 2003 2004
Fiscal Year
Avera
ge S
ala
ry
Source: The state’s Human Resource Management System. Data include only classified employees of the Executive branch for Fiscal Years 2000 to 2004. Annual salary is base rate actually paid and does not include benefits or any overtime. Comments: For Fiscal Year 2004 the average salary for classified employees was $41,040, a 2.4% increase over the Fiscal Year 2003 average. Several factors contribute to change in average annual salary. Many employees are eligible for step movement within the pay plan each year. Cost of Living Adjustments (COLAs) are based on collective bargaining agreements (See box below). In addition, classification actions and promotions, higher paid employees retiring and newly hired employees coming in lower on the pay scale all affect average salary. The percentages noted in parentheses reflect the percent change from the previous year.
State of Vermont and VSEA Negotiated Salary Increases Fiscal Year Total Average Salary Adjustments 2000
4.8% (includes 1.8% for steps)
2001
4.8% (includes 1.8% for steps)
2002
6.48% (includes 1.98% for steps; 3% value of $.50/hour in July ’01; 1.5% value of $.25/hour in January ’02)
2003
4.98% (includes 1.98% for steps)
2004
3.48% (includes 1.98% for steps)

State of Vermont Workforce Report – FY 2004 57
Table 30 Average Salary for Classified Employees by Occupational Group – Fiscal Year 2004
$30,310
$67,463
$30,105
$45,420
$37,877
$24,263
$33,157
$36,465
$0 $10,000 $20,000 $30,000 $40,000 $50,000 $60,000 $70,000 $80,000
Office/Clerical
Officials and Administrators
Paraprofessionals
Professionals
Protective Service
Service Maintenance
Skilled Craft
Technicians
Average Annual Salary
Source: The state’s Human Resource Management System. Data include only classified employees of the Executive branch for Fiscal Year 2004. Occupational categories are based on the Equal Employment Opportunity Commission’s occupational categories for state and local government (EEO-4). Appendix A gives a full definition of each category. Comments: Of the eight occupational categories those employees in the Service Maintenance category had the lowest average salary at $24,263 while those employees categorized as Official & Administrators had the highest average at $67,463.

58 State of Vermont Workforce Report – FY 2004
Table 31 Overtime Costs by Department and Fiscal Year
Department FY 2000 FY 2001 FY 2002 FY 2003 FY 2004 % Change
FY03 to FY04
Aging & Disabilities $15,361 $16,099 $16,600 $22,756 $29,875 31.3%
Agriculture $24,512 $5,961 $17,216 $4,073 $9,043 122.0%
Attorney General $2,826 $3,475 $3,019 $4,711 $3,838 -18.5%
Banking, Insurance & Securities $25,299 $31,749 $19,873 $26,929 $30,284 12.5%
Buildings & General Services $456,963 $547,671 $582,894 $519,507 $488,305 -6.0%
Child Support Services $20,176 $39,005 $24,698 $18,411 $15,969 -13.3%
Commerce & Community Dev. $64,625 $71,185 $44,463 $28,556 $35,407 24.0%
Corrections $3,172,492 $2,544,935 $2,895,018 $2,488,394 $3,005,293 20.8%
Defender General $149 $374 n/a
Developmental & MH Services $1,454 $2,620 $752 $857 $1,360 58.8%
Education $135,512 $164,784 $121,885 $60,665 $43,075 -29.0%
Employment & Training $163,669 $121,196 $145,182 $94,753 $44,206 -53.3%
Environmental Board $241 $424 $759 $619 $157 -74.7%
Environmental Conservation $85,042 $67,155 $65,708 $66,540 $75,411 13.3%
Finance & Management $7,428 $9,358 $13,170 $4,916 $8,414 71.2%
Fish & Wildlife $241,709 $264,108 $270,166 $308,441 $309,916 0.5%
Forest, Parks & Recreation $194,907 $205,074 $189,150 $227,911 $212,863 -6.6%
Governor's Office $68 $81 n/a
Health $123,821 $185,133 $215,220 $232,204 $225,036 -3.1%
Human Services $7,444 $15,860 $14,861 $7,753 $8,809 13.6%
Information & Innovation $42,161 n/a
Labor & Industry $61,478 $61,073 $49,968 $55,546 $76,903 38.4%
Libraries $0 $0 $120 $0 $0 n/a
Liquor Control $188,940 $179,854 $114,941 $112,606 $118,268 5.0%
Military $105,680 $130,926 $103,227 $101,429 $90,863 -10.4%
Natural Resources $75,623 $73,019 $75,693 $83,106 $69,467 -16.4%
PATH $73,876 $107,756 $118,114 $119,863 $174,967 46.0%
Personnel $19,997 $42,479 $47,909 $1,010 $4,438 339.5%
Public Safety $2,418,878 $2,591,484 $2,731,136 $2,557,697 $3,260,288 27.5%
Public Service $88,295 $58,752 $51,506 $27,275 $21,376 -21.6%
Secretary of State $5,031 $22,010 $8,962 $11,994 $3,824 -68.1%
Small Departments $64,982 $64,360 $57,143 $71,108 $68,490 -3.7%
Social & Rehabilitation Services $346,012 $365,268 $484,453 $381,505 $405,210 6.2%
State Treasurer $2,572 $4,096 $8,947 $7,713 $4,952 -35.8%
State's Attorneys & Sheriffs $4,423 $17,346 $45,533 $63,022 $66,116 4.9%
Tax $146,478 $169,493 $195,492 $14,128 $18,910 33.9%
Transportation $2,986,675 $3,278,753 $2,731,134 $2,608,777 $2,436,913 -6.6%
Vermont Lottery Commission $19,449 $24,904 $11,276 $12,574 $26,775 112.9%
Vermont State Hospital $419,274 $540,818 $584,077 $550,726 $615,278 11.7%
Vermont Veterans' Home $382,646 $515,000 $582,899 $588,517 $609,410 3.6%
Grand Total $12,153,938 $12,543,252 $12,643,243 $11,486,593 $12,662,245 10.2%
% Change from Previous FY 3.2% 0.8% -9.1% 10.2% Source: The state’s Human Resource Management System. Data include all Executive branch employees (classified, exempt and temporary) for Fiscal Years 2000 to 2004. “Small Departments” have 10 or fewer employees (See Appendix B). Comments: Overtime costs increased 10.2% from Fiscal Year 2003 to Fiscal Year 2004.
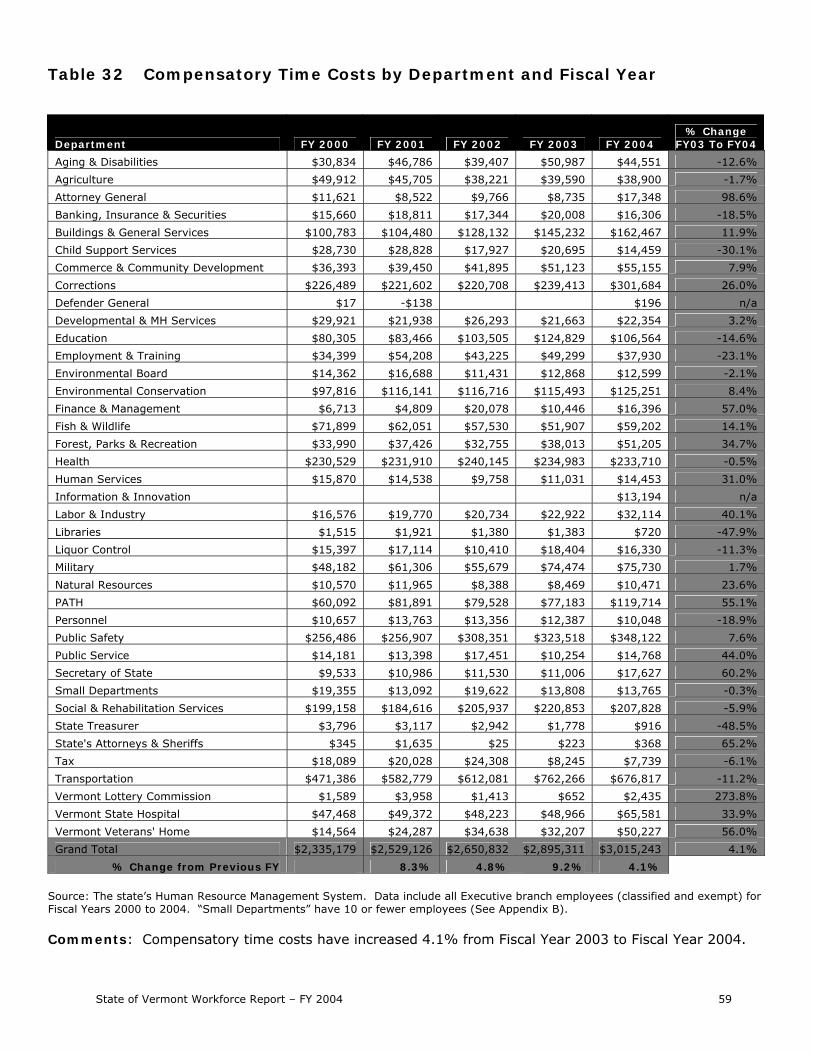
State of Vermont Workforce Report – FY 2004 59
Table 32 Compensatory Time Costs by Department and Fiscal Year
Department FY 2000 FY 2001 FY 2002 FY 2003 FY 2004 % Change
FY03 To FY04
Aging & Disabilities $30,834 $46,786 $39,407 $50,987 $44,551 -12.6%
Agriculture $49,912 $45,705 $38,221 $39,590 $38,900 -1.7%
Attorney General $11,621 $8,522 $9,766 $8,735 $17,348 98.6%
Banking, Insurance & Securities $15,660 $18,811 $17,344 $20,008 $16,306 -18.5%
Buildings & General Services $100,783 $104,480 $128,132 $145,232 $162,467 11.9%
Child Support Services $28,730 $28,828 $17,927 $20,695 $14,459 -30.1%
Commerce & Community Development $36,393 $39,450 $41,895 $51,123 $55,155 7.9%
Corrections $226,489 $221,602 $220,708 $239,413 $301,684 26.0%
Defender General $17 -$138 $196 n/a
Developmental & MH Services $29,921 $21,938 $26,293 $21,663 $22,354 3.2%
Education $80,305 $83,466 $103,505 $124,829 $106,564 -14.6%
Employment & Training $34,399 $54,208 $43,225 $49,299 $37,930 -23.1%
Environmental Board $14,362 $16,688 $11,431 $12,868 $12,599 -2.1%
Environmental Conservation $97,816 $116,141 $116,716 $115,493 $125,251 8.4%
Finance & Management $6,713 $4,809 $20,078 $10,446 $16,396 57.0%
Fish & Wildlife $71,899 $62,051 $57,530 $51,907 $59,202 14.1%
Forest, Parks & Recreation $33,990 $37,426 $32,755 $38,013 $51,205 34.7%
Health $230,529 $231,910 $240,145 $234,983 $233,710 -0.5%
Human Services $15,870 $14,538 $9,758 $11,031 $14,453 31.0%
Information & Innovation $13,194 n/a
Labor & Industry $16,576 $19,770 $20,734 $22,922 $32,114 40.1%
Libraries $1,515 $1,921 $1,380 $1,383 $720 -47.9%
Liquor Control $15,397 $17,114 $10,410 $18,404 $16,330 -11.3%
Military $48,182 $61,306 $55,679 $74,474 $75,730 1.7%
Natural Resources $10,570 $11,965 $8,388 $8,469 $10,471 23.6%
PATH $60,092 $81,891 $79,528 $77,183 $119,714 55.1%
Personnel $10,657 $13,763 $13,356 $12,387 $10,048 -18.9%
Public Safety $256,486 $256,907 $308,351 $323,518 $348,122 7.6%
Public Service $14,181 $13,398 $17,451 $10,254 $14,768 44.0%
Secretary of State $9,533 $10,986 $11,530 $11,006 $17,627 60.2%
Small Departments $19,355 $13,092 $19,622 $13,808 $13,765 -0.3%
Social & Rehabilitation Services $199,158 $184,616 $205,937 $220,853 $207,828 -5.9%
State Treasurer $3,796 $3,117 $2,942 $1,778 $916 -48.5%
State's Attorneys & Sheriffs $345 $1,635 $25 $223 $368 65.2%
Tax $18,089 $20,028 $24,308 $8,245 $7,739 -6.1%
Transportation $471,386 $582,779 $612,081 $762,266 $676,817 -11.2%
Vermont Lottery Commission $1,589 $3,958 $1,413 $652 $2,435 273.8%
Vermont State Hospital $47,468 $49,372 $48,223 $48,966 $65,581 33.9%
Vermont Veterans' Home $14,564 $24,287 $34,638 $32,207 $50,227 56.0%
Grand Total $2,335,179 $2,529,126 $2,650,832 $2,895,311 $3,015,243 4.1%
% Change from Previous FY 8.3% 4.8% 9.2% 4.1% Source: The state’s Human Resource Management System. Data include all Executive branch employees (classified and exempt) for Fiscal Years 2000 to 2004. “Small Departments” have 10 or fewer employees (See Appendix B). Comments: Compensatory time costs have increased 4.1% from Fiscal Year 2003 to Fiscal Year 2004.

60 State of Vermont Workforce Report – FY 2004
THIS PAGE IS INTENTIONALLY LEFT BLANK

State of Vermont Workforce Report – FY 2004 61
Diversity
Highlights:
• The State of Vermont’s classified workforce closely mirrors Vermont’s civilian labor force in terms of gender.
• An over 1% increase in minority representation in the
civilian labor force (2003 population survey) to 2.8% now compares to the 1.8% percentage found in the State of Vermont’s classified workforce in Fiscal Year 2004.
• In Fiscal Year 2004 the classified workforce was
composed of 48.2% females and 51.8% males. Minorities make up 1.8% of the employee population.
• Two departments – Transportation and Corrections –
account for over 45% of the minority representation among classified State of Vermont employees.
• Based on recent survey results it is projected that 16.8%
of classified employees have a disability, as defined by the Americans with Disabilities Act criteria.
Workforce Trends

62 State of Vermont Workforce Report – FY 2004
Table 33 Ethnic and Gender Representation by Fiscal Year and Comparison to Vermont Civilian Labor Force
State of Vermont Classified Workforce
Gender Ethnic Status
Female Male White Minority
Fiscal Year Number Percent Number Percent Number Percent Number Percent Total
2000 3316 47.8% 3621 52.2% 6819 98.3% 118 1.7% 6937
2001 3412 48.1% 3684 51.9% 6975 98.3% 121 1.7% 7096
2002 3512 48.4% 3738 51.6% 7122 98.2% 128 1.8% 7250
2003 3548 48.4% 3778 51.6% 7196 98.2% 130 1.8% 7326
2004 3616 48.2% 3889 51.8% 7370 98.2% 135 1.8% 7505
Vermont Civilian Labor Force
Gender Ethnic Status
Female Male White Minority
Year Number Percent Number Percent Number Percent Number Percent Total
2000 161,000 48.5% 170,000 51.2% 326,000 98.2% 6,000 1.8% 332,000
2001 162,000 48.4% 173,000 51.6% 329,000 98.2% 6,000 1.8% 335,000
2002 170,000 48.7% 179,000 51.3% 343,000 98.3% 6,000 1.7% 349,000
2003 167,000 47.6% 184,000 52.4% 341,000 97.2% 10,000 2.8% 351,000 Source: The state’s Human Resource Management System. Data include only classified employees of the Executive branch for Fiscal Years 2000 to 2004. Civilian Labor Force data from 2000, 2001, 2002, and 2003 population surveys, U.S. Department of Labor, Bureau of Labor Statistics (http://www.bls.gov/lau/). Note: Labor force numbers are rounded to the nearest thousand. Comments: The latest population figures available (2003) show Vermont’s civilian labor force to be comprised of 52.4% male and 47.6% female, which closely mirrors the State of Vermont’s classified workforce. However, the Vermont civilian workforce population estimates for minority representation show an over 1% increase to 2.8% in 2003, compared to the 1.8% percentage representation found in the State of Vermont’s classified workforce in Fiscal Years 2003 and 2004.
Benchmarking New England State Governments – Gender and Ethnic Representation
% Male/% Female % Minority Connecticut 52.3%/47.7% 27.2% Massachusetts 48.2%/51.8% 21.5% Maine 50.2%/49.8% 23.1% New Hampshire 49.7%/50.3% 02.6% Vermont 51.8%/48.2% 01.8 % Source: Connecticut Department of Administrative Services (FY ’04); Commonwealth of Massachusetts, Human Resources Division (FY ’04); New Hampshire, Division of Personnel 2003 Annual Report (FY ’03); Maine, Bureau of Human Resources (FY ’04).

State of Vermont Workforce Report – FY 2004 63
Table 34 Ethnic Representation by Department by Fiscal Year
Department FY 2000 FY 2001 FY 2002 FY 2003 FY 2004 Five Year
Average
Min
orit
y
Wh
ite
Min
orit
y
Wh
ite
Min
orit
y
Wh
ite
Min
orit
y
Wh
ite
Min
orit
y
Wh
ite
Min
orit
y
Wh
ite
Aging & Disabilities 0.0% 100.0% 0.0% 100.0% 0.0% 100.0% 0.0% 100.0% 0.0% 100.0% 0.0% 100.0%
Agriculture 1.2% 98.8% 1.3% 98.8% 1.2% 98.8% 1.3% 98.8% 0.0% 100.0% 1.2% 99.0%
Attorney General 3.7% 96.3% 4.3% 95.7% 3.4% 96.6% 3.4% 96.6% 3.6% 96.4% 3.7% 96.3%
BISHCA 0.0% 100.0% 0.0% 100.0% 0.0% 100.0% 0.0% 100.0% 0.0% 100.0% 0.0% 100.0%
Buildings & General Services 2.7% 97.3% 2.3% 97.7% 1.7% 98.3% 2.1% 97.9% 2.3% 97.7% 2.3% 97.8%
Child Support Services 3.6% 96.4% 3.6% 96.4% 2.7% 97.3% 2.7% 97.3% 2.6% 97.4% 3.1% 97.0%
Commerce & Community Dev. 1.3% 98.7% 2.4% 97.6% 2.4% 97.6% 2.5% 97.5% 2.5% 97.5% 2.3% 97.8%
Corrections 2.7% 97.3% 2.4% 97.6% 2.5% 97.5% 2.8% 97.2% 2.8% 97.2% 2.6% 97.4%
Developmental & MH Services 0.0% 100.0% 0.0% 100.0% 0.0% 100.0% 0.0% 100.0% 0.0% 100.0% 0.0% 100.0%
Education 1.4% 98.6% 1.2% 98.8% 1.7% 98.3% 0.6% 99.4% 0.6% 99.4% 1.3% 98.9%
Employment & Training 0.9% 99.1% 0.9% 99.1% 0.9% 99.1% 0.9% 99.1% 1.1% 98.9% 0.9% 99.1%
Environmental Board 3.7% 96.3% 3.6% 96.4% 3.7% 96.3% 3.8% 96.2% 3.8% 96.2% 3.7% 96.3%
Environmental Conservation 1.6% 98.4% 1.5% 98.5% 1.9% 98.1% 2.3% 97.7% 2.3% 97.7% 2.0% 98.1%
Finance & Management 3.3% 96.7% 4.0% 96.0% 3.0% 97.0% 3.2% 96.8% 2.9% 97.1% 3.3% 96.8%
Fish & Wildlife 1.7% 98.3% 1.7% 98.3% 1.8% 98.2% 0.8% 99.2% 0.9% 99.1% 1.5% 98.6%
Forest, Parks & Recreation 1.7% 98.3% 0.8% 99.2% 0.9% 99.1% 0.0% 100.0% 0.0% 100.0% 1.3% 99.3%
Health 1.5% 98.5% 1.9% 98.1% 1.7% 98.3% 1.5% 98.5% 1.5% 98.5% 1.6% 98.4%
Human Services 1.6% 98.4% 1.9% 98.1% 1.8% 98.2% 2.2% 97.8% 2.1% 97.9% 1.9% 98.1%
Information and Innovation 0.0% 100.0% n/a n/a
Labor & Industry 1.3% 98.7% 0.0% 100.0% 0.0% 100.0% 0.0% 100.0% 0.0% 100.0% 1.3% 99.7%
Libraries 0.0% 100.0% 0.0% 100.0% 0.0% 100.0% 3.0% 97.0% 3.0% 97.0% 3.0% 98.8%
Liquor Control 0.0% 100.0% 0.0% 100.0% 0.0% 100.0% 0.0% 100.0% 0.0% 100.0% 0.0% 100.0%
Military 2.3% 97.7% 4.0% 96.0% 4.6% 95.4% 4.7% 95.3% 4.7% 95.3% 4.3% 95.9%
Natural Resources 0.0% 100.0% 0.0% 100.0% 0.0% 100.0% 0.0% 100.0% 0.0% 100.0% 0.0% 100.0%
PATH 0.3% 99.7% 0.2% 99.8% 0.7% 99.3% 1.0% 99.0% 1.0% 99.0% 0.8% 99.4%
Personnel 0.0% 100.0% 0.0% 100.0% 0.0% 100.0% 0.0% 100.0% 0.0% 100.0% 0.0% 100.0%
Public Safety 1.1% 98.9% 1.4% 98.6% 1.4% 98.6% 1.5% 98.5% 1.4% 98.6% 1.4% 98.6%
Public Service 0.0% 100.0% 0.0% 100.0% 0.0% 100.0% 0.0% 100.0% 0.0% 100.0% 0.0% 100.0%
Secretary of State 0.0% 100.0% 0.0% 100.0% 0.0% 100.0% 0.0% 100.0% 0.0% 100.0% 0.0% 100.0%
Small Departments 0.0% 100.0% 0.0% 100.0% 0.0% 100.0% 0.0% 100.0% 0.0% 100.0% 0.0% 100.0%
Social & Rehabilitation Services 1.8% 98.2% 1.6% 98.4% 1.5% 98.5% 1.8% 98.2% 1.8% 98.2% 1.7% 98.3%
State Treasurer 0.0% 100.0% 0.0% 100.0% 3.8% 96.2% 3.8% 96.2% 3.4% 96.6% 3.7% 97.8%
Taxes 1.7% 98.3% 1.7% 98.3% 2.2% 97.8% 1.7% 98.3% 1.1% 98.9% 1.8% 98.3%
Transportation 2.1% 97.9% 2.2% 97.8% 2.4% 97.6% 2.4% 97.6% 2.4% 97.6% 2.3% 97.7%
Vermont Lottery Commission 0.0% 100.0% 0.0% 100.0% 0.0% 100.0% 0.0% 100.0% 0.0% 100.0% 0.0% 100.0%
Vermont State Hospital 3.9% 96.1% 3.2% 96.8% 3.9% 96.1% 2.8% 97.2% 3.9% 96.1% 3.5% 96.5%
Vermont Veterans' Home 1.7% 98.3% 2.3% 97.7% 1.5% 98.5% 1.4% 98.6% 1.5% 98.5% 1.7% 98.3%
Grand Total 1.7% 98.3% 1.7% 98.3% 1.8% 98.2% 1.8% 98.2% 1.8% 98.2% 1.8% 98.3% Source: The state’s Human Resource Management System. Data include only classified employees of the Executive branch for Fiscal Years 2000 to 2004. “Small Departments” have 10 or fewer employees (See Appendix B). Comments: In terms of actual numbers for Fiscal Year 2004, two departments - and Corrections (31 minority employees) and Transportation (30 minority employees) - account for over 45% of the minority representation among classified State of Vermont employees.

64 State of Vermont Workforce Report – FY 2004
Table 35 Gender Representation by Department by Fiscal Year
Department FY 2000 FY 2001 FY 2002 FY 2003 FY 2004 Five Year Average
Fem
ale
Mal
e
Fem
ale
Mal
e
Fem
ale
Mal
e
Fem
ale
Mal
e
Fem
ale
Mal
e
Fem
ale
Mal
e
Aging & Disabilities 70.2% 29.8% 69.4% 30.6% 70.6% 29.4% 71.0% 29.0% 71.0% 29.0% 70.5% 29.5%
Agriculture 33.3% 66.7% 33.8% 66.3% 33.3% 66.7% 32.5% 67.5% 33.7% 66.3% 33.3% 66.7%
Attorney General 55.6% 44.4% 60.9% 39.1% 65.5% 34.5% 65.5% 34.5% 71.4% 28.6% 64.4% 36.8%
BISHCA 50.7% 49.3% 51.4% 48.6% 48.6% 51.4% 51.3% 48.7% 55.1% 44.9% 51.6% 48.6%
Buildings & General Services 27.5% 72.5% 28.2% 71.8% 29.8% 70.2% 28.8% 71.2% 30.3% 69.7% 29.0% 71.0%
Child Support Services 70.3% 29.7% 71.2% 28.8% 70.3% 29.7% 72.1% 27.9% 70.4% 29.6% 70.8% 29.2%
Commerce & Community Dev. 63.3% 36.7% 62.4% 37.6% 62.7% 37.3% 63.8% 36.3% 60.8% 39.2% 62.6% 37.5%
Corrections 30.3% 69.7% 31.0% 69.0% 31.5% 68.5% 31.3% 68.7% 31.9% 68.1% 31.2% 68.8%
Developmental & MH Services 69.9% 30.1% 70.1% 29.9% 71.4% 28.6% 69.8% 30.2% 68.5% 31.5% 70.0% 30.0%
Education 72.0% 28.0% 74.8% 25.2% 76.0% 24.0% 74.1% 25.9% 71.2% 28.8% 73.6% 26.4%
Employment & Training 63.2% 36.8% 63.6% 36.4% 63.8% 36.3% 63.2% 36.8% 62.1% 37.9% 63.2% 36.8%
Environmental Board 66.7% 33.3% 67.9% 32.1% 66.7% 33.3% 69.2% 30.8% 69.2% 30.8% 67.9% 32.1%
Environmental Conservation 35.8% 64.2% 36.7% 63.3% 36.6% 63.4% 37.0% 63.0% 36.8% 63.2% 36.6% 63.4%
Finance & Management 56.7% 43.3% 56.0% 44.0% 60.6% 39.4% 61.3% 38.7% 57.1% 42.9% 58.4% 41.7%
Fish & Wildlife 16.1% 83.9% 17.4% 82.6% 18.4% 81.6% 20.3% 79.7% 20.2% 79.8% 18.6% 81.6%
Forest, Parks & Recreation 22.2% 77.8% 22.5% 77.5% 22.2% 77.8% 27.0% 73.0% 27.7% 72.3% 24.6% 75.8%
Health 80.3% 19.7% 80.7% 19.3% 80.7% 19.3% 80.1% 19.9% 80.7% 19.3% 80.5% 19.5%
Human Services 63.9% 36.1% 66.0% 34.0% 61.8% 38.2% 64.4% 35.6% 72.3% 27.7% 65.6% 34.8%
Information & Innovation 32.7% 67.3% n/a n/a
Labor & Industry 33.3% 66.7% 31.9% 68.1% 31.6% 68.4% 33.3% 66.7% 32.9% 67.1% 32.6% 67.4%
Libraries 66.7% 33.3% 69.7% 30.3% 67.7% 32.3% 69.7% 30.3% 69.7% 30.3% 68.7% 31.4%
Liquor Control 39.2% 60.8% 37.7% 62.3% 33.3% 66.7% 28.8% 71.2% 32.1% 67.9% 34.6% 66.0%
Military 13.6% 86.4% 11.1% 88.9% 13.9% 86.1% 15.1% 84.9% 14.0% 86.0% 13.7% 86.4%
Natural Resources 50.0% 50.0% 50.0% 50.0% 55.2% 44.8% 47.5% 52.5% 46.2% 53.8% 49.7% 50.8%
PATH 77.1% 22.9% 78.1% 21.9% 77.7% 22.3% 77.3% 22.7% 78.5% 21.5% 77.7% 22.3%
Personnel 77.1% 22.9% 79.2% 20.8% 79.2% 20.8% 78.4% 21.6% 80.8% 19.2% 79.0% 21.1%
Public Safety 28.5% 71.5% 29.4% 70.6% 30.1% 69.9% 30.0% 70.0% 28.9% 71.1% 29.4% 70.6%
Public Service 47.4% 52.6% 48.6% 51.4% 51.4% 48.6% 55.3% 44.7% 59.5% 40.5% 52.8% 48.0%
Secretary of State 75.6% 24.4% 75.0% 25.0% 76.3% 23.7% 76.3% 23.7% 73.2% 26.8% 75.3% 24.8%
Small Departments 56.8% 43.2% 52.3% 47.7% 44.2% 55.8% 47.2% 52.8% 48.6% 51.4% 50.1% 50.4%
Social & Rehabilitation Services 71.5% 28.5% 72.0% 28.0% 72.0% 28.0% 71.2% 28.8% 71.1% 28.9% 71.5% 28.5%
State Treasurer 73.1% 26.9% 61.5% 38.5% 57.7% 42.3% 57.7% 42.3% 65.5% 34.5% 63.4% 37.7%
Taxes 63.8% 36.2% 63.6% 36.4% 64.4% 35.6% 64.0% 36.0% 64.9% 35.1% 64.2% 35.8%
Transportation 28.4% 71.6% 28.3% 71.7% 28.7% 71.3% 28.6% 71.4% 29.2% 70.8% 28.6% 71.4%
Vermont Lottery Commission 61.1% 38.9% 63.2% 36.8% 66.7% 33.3% 72.2% 27.8% 66.7% 33.3% 66.1% 34.5%
Vermont State Hospital 54.6% 45.4% 56.3% 43.7% 53.5% 46.5% 55.6% 44.4% 53.6% 46.4% 54.7% 45.3%
Vermont Veterans' Home 77.9% 22.1% 77.2% 22.8% 78.5% 21.5% 80.4% 19.6% 79.0% 21.0% 78.7% 21.4%
Grand Total 47.8% 52.2% 48.1% 51.9% 48.4% 51.6% 48.4% 51.6% 48.2% 51.8% 48.2% 51.8% Source: The state’s Human Resource Management System. Data include only classified employees of the Executive branch for Fiscal Years 2000 to 2004. “Small Departments” have 10 or fewer employees (See Appendix B). Comments: While the overall five fiscal year average was 48.2% female and 51.8% male, there are clear department differences in gender representation.

State of Vermont Workforce Report – FY 2004 65
Table 36 Minority & Gender Representation by Occupational Group by Fiscal Year
Occupational Group FY 2000 FY 2001 FY 2002 FY 2003 FY 2004 % Change FY 00 to FY 04
Fem
ale
Mal
e
Fem
ale
Mal
e
Fem
ale
Mal
e
Fem
ale
Mal
e
Fem
ale
Mal
e
Fem
ale
Mal
e
Office/Clerical 85.6% 14.4% 84.7% 15.3% 85.6% 14.4% 85.3% 14.7% 85.7% 14.3% 0.1% -0.7%
Officials and Administrators 32.3% 67.7% 31.6% 68.4% 35.1% 64.9% 36.7% 63.3% 37.4% 62.6% 15.8% -7.5%
Paraprofessionals 63.9% 36.1% 60.7% 39.3% 64.9% 35.1% 69.3% 30.7% 68.8% 31.3% 7.7% -13.5%
Professionals 50.2% 49.8% 51.9% 48.1% 53.8% 46.2% 53.6% 46.4% 54.1% 45.9% 7.8% -7.8%
Protective Service 15.0% 85.0% 18.3% 81.7% 18.7% 81.3% 18.9% 81.1% 19.3% 80.7% 28.7% -5.0%
Service Maintenance 16.4% 83.6% 15.3% 84.7% 33.3% 66.7% 31.8% 68.2% 32.7% 67.3% 99.2% -19.5%
Skilled Craft 2.8% 97.2% 2.7% 97.3% 3.8% 96.2% 3.9% 96.1% 3.9% 96.1% 37.0% -1.1%
Technicians 55.6% 44.4% 57.9% 42.1% 51.4% 48.6% 52.9% 47.1% 52.6% 47.4% -5.3% 6.6%
Grand Total 47.8% 52.2% 48.1% 51.9% 48.4% 51.6% 48.4% 51.6% 48.2% 51.8% 0.8% -0.7%
Occupational Group FY 2000 FY 2001 FY 2002 FY 2003 FY 2004 Five Year Average
Min
orit
y
Wh
ite
Min
orit
y
Wh
ite
Min
orit
y
Wh
ite
Min
orit
y
Wh
ite
Min
orit
y
Wh
ite
Min
orit
y
Wh
ite
Office/Clerical 2.1% 97.9% 2.3% 97.7% 2.8% 97.2% 2.9% 97.1% 3.0% 97.0% 2.6% 97.4%
Officials and Administrators 0.7% 99.3% 0.7% 99.3% 0.6% 99.4% 1.2% 98.8% 1.5% 98.5% 1.1% 99.1%
Paraprofessionals 4.2% 95.8% 4.9% 95.1% 3.4% 96.6% 3.1% 96.9% 3.6% 96.4% 3.9% 96.2%
Professionals 1.2% 98.8% 1.3% 98.7% 1.4% 98.6% 1.5% 98.5% 1.3% 98.7% 1.3% 98.7%
Protective Service 2.2% 97.8% 2.2% 97.8% 2.0% 98.0% 1.8% 98.2% 2.1% 97.9% 2.1% 97.9%
Service Maintenance 2.6% 97.4% 1.8% 98.2% 1.9% 98.1% 1.9% 98.1% 2.9% 97.1% 2.3% 97.8%
Skilled Craft 1.6% 98.4% 2.1% 97.9% 1.6% 98.4% 1.6% 98.4% 1.8% 98.2% 1.7% 98.3%
Technicians 1.9% 98.1% 1.7% 98.3% 2.1% 97.9% 1.9% 98.1% 2.1% 97.9% 1.9% 98.1%
Grand Total 1.7% 98.3% 1.7% 98.3% 1.8% 98.2% 1.8% 98.2% 1.8% 98.2% 1.8% 98.3% Source: The state’s Human Resource Management System. Data include only classified employees of the Executive branch for Fiscal Years 2000 to 2004. Occupational categories are based on the Equal Employment Opportunity Commission’s occupational categories for state and local government (EEO-4). Appendix A gives a full definition of each category. Comments: For gender representation by occupational group the percent change from Fiscal Year 2000 to Fiscal Year 2004 is shown. During this period there was nearly a 100% increase in female representation in the Service Maintenance category. Female representation in Skilled Craft (37.0%) and Protective Service (28.7%) categories also showed significant gains. Because there was little percentage change from FY 2000 to FY 2004 in minority representation by occupational category, the summary data show the five-year average minority percentages. The highest average minority representation is found in the paraprofessional job category (3.9%) and the lowest was in the Officials and Administrators category (1.1%).

66 State of Vermont Workforce Report – FY 2004
Table 37 Percentage of Employees with Disabilities
With a Disability16.8%
No Disability83.2%
Source: Vermont State Employee Disability and Diversity Survey Analysis October 2003, University of Vermont, Center for Rural Studies. Data is based on a random sample of 1,438 State of Vermont employees surveyed during May, 2003 and has a margin of error of +/- 1.9%. Comments: Based on a scientific survey of employees compiled by the University of Vermont, Center for Rural Studies we can project that the percentage of employees with disabilities in the State of Vermont workforce is 16.8%. This figure compares favorably with 2000 U.S. Census data that indicated 16.2% of the Vermont civilian non-institutionalized population aged 21 to 64 years old has a disability1. 1 U.S. Census 2000, Table DP-2 Profile of Selected Social Characteristics: 2000

State of Vermont Workforce Report – FY 2004 67
Leave Usage
Highlights:
• Average annual leave usage was 14.9 days per employee in Fiscal Year 2004, at an average annual cost of $2,441 per classified employee.
• Average sick leave usage was 11 days per classified
employee for an average cost of $1,752 per employee.
Workforce Trends

68 State of Vermont Workforce Report – FY 2004
Table 38 Average Annual Leave Use and Average Costs per Classified Employee by Department by Fiscal Year
Average Annual Leave Days Average Annual Leave Costs
Fiscal Year Fiscal Year
Department 2000 2001 2002 2003 2004 2000 2001 2002 2003 2004
Aging & Disabilities 13.1 13.5 13.2 13.8 13.9 $1,855 $1,995 $2,022 $2,230 $2,356
Agriculture 14.9 15.2 15.7 15.2 15.2 $2,088 $2,222 $2,388 $2,424 $2,503
Attorney General 11.7 17.4 10.3 13.2 14.3 $1,739 $2,747 $1,613 $2,120 $2,466
Banking, Insurance & Securities 13.9 14.3 14.4 13.7 13.5 $2,435 $2,445 $2,674 $2,607 $2,605
Buildings & General Services 15.0 14.2 14.4 15.3 14.2 $1,699 $1,707 $1,822 $2,021 $1,875
Child Support Services 13.3 15.2 15.0 15.8 16.4 $1,709 $2,023 $2,176 $2,434 $2,673
Commerce & Community Dev. 14.5 12.8 14.7 15.9 15.4 $2,143 $1,964 $2,361 $2,783 $2,728
Corrections 13.5 14.3 13.6 14.3 13.0 $1,795 $1,964 $1,952 $2,135 $2,003
Developmental & MH Services 15.5 15.4 14.7 15.7 16.5 $2,434 $2,489 $2,575 $2,837 $3,073
Education 11.3 11.1 11.8 14.0 13.5 $1,760 $1,704 $1,937 $2,452 $2,449
Employment & Training 17.0 17.9 16.3 16.9 18.9 $2,325 $2,525 $2,421 $2,629 $3,012
Environmental Board 16.2 15.3 18.1 19.6 15.4 $2,439 $2,376 $2,827 $3,339 $2,730
Environmental Conservation 15.7 15.2 16.0 16.6 15.1 $2,535 $2,555 $2,824 $3,071 $2,878
Finance & Management 11.1 16.3 12.3 16.6 15.9 $1,684 $2,679 $2,369 $3,303 $3,269
Fish & Wildlife 15.3 16.6 16.6 15.2 18.0 $2,154 $2,462 $2,610 $2,493 $3,187
Forest, Parks & Recreation 18.3 16.8 18.0 19.5 17.2 $2,759 $2,640 $3,056 $3,445 $3,116
Health 12.4 12.2 12.9 12.7 13.4 $1,872 $1,933 $2,107 $2,173 $2,363
Human Services 15.9 17.9 13.4 17.6 15.0 $2,450 $2,878 $2,283 $3,065 $2,805
Information & Innovation n/a n/a n/a n/a 17.0 n/a n/a n/a n/a $3,147
Labor & Industry 14.8 15.6 15.1 14.4 15.4 $2,038 $2,261 $2,298 $2,353 $2,576
Libraries 16.6 15.9 16.9 16.2 17.0 $1,964 $2,030 $2,350 $2,373 $2,519
Liquor Control 14.2 16.2 14.9 14.9 16.5 $1,918 $2,160 $2,085 $2,189 $2,469
Military 19.6 16.8 15.1 16.4 15.9 $2,235 $2,026 $1,968 $2,256 $2,232
Natural Resources 14.3 17.4 18.2 10.9 16.9 $2,147 $2,739 $3,122 $1,954 $3,268
PATH 17.5 16.2 16.5 17.1 16.2 $2,461 $2,370 $2,585 $2,828 $2,754
Personnel 16.3 12.9 13.5 15.6 15.1 $2,469 $2,015 $2,313 $2,772 $2,743
Public Safety 15.7 14.3 15.1 15.8 14.0 $2,232 $2,198 $2,488 $2,728 $2,513
Public Service 15.8 15.6 14.3 14.0 13.8 $2,389 $2,547 $2,372 $2,366 $2,403
Secretary of State 13.5 15.0 14.5 15.1 14.1 $1,612 $1,849 $1,930 $2,071 $2,129
Small Departments 13.9 16.1 14.3 13.7 13.6 $2,093 $2,491 $2,301 $2,442 $2,368
Social & Rehabilitation Services 13.7 14.5 13.3 14.6 13.9 $2,038 $2,239 $2,150 $2,445 $2,401
State Treasurer 10.9 13.0 13.0 13.6 14.4 $1,412 $1,737 $1,816 $2,023 $2,236
Tax 15.6 15.8 15.7 18.1 17.2 $2,064 $2,154 $2,287 $2,769 $2,778
Transportation 16.5 15.7 15.8 15.8 15.8 $2,138 $2,145 $2,333 $2,463 $2,511
Vermont Lottery Commission 16.7 13.9 16.5 20.1 16.3 $2,081 $1,824 $2,337 $2,934 $2,431
Vermont State Hospital 16.3 15.4 15.3 12.7 14.9 $2,040 $2,013 $2,059 $1,867 $2,241
Vermont Veterans' Home 13.5 14.6 11.7 12.8 12.7 $1,347 $1,530 $1,357 $1,564 $1,602
Overall Average 15.0 14.9 14.7 15.2 14.9 $2,060 $2,134 $2,233 $2,422 $2,441 Source: The state’s Human Resource Management System. Data include only classified employees of the Executive branch for Fiscal Years 2000 to 2004. “Small Departments” have 10 or fewer employees (See Appendix B). Comments: From Fiscal Year 2000 to Fiscal Year 2004, annual leave costs have risen by 18.5%. This is the result of higher average salaries.
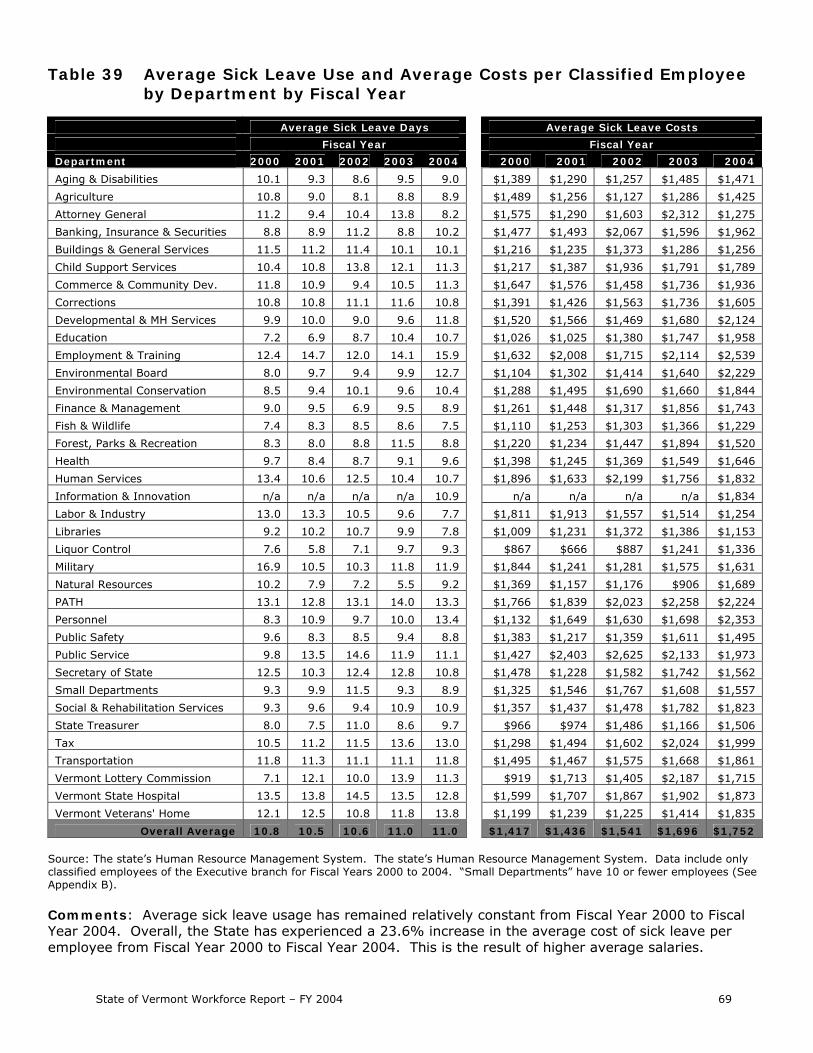
State of Vermont Workforce Report – FY 2004 69
Table 39 Average Sick Leave Use and Average Costs per Classified Employee by Department by Fiscal Year
Average Sick Leave Days Average Sick Leave Costs
Fiscal Year Fiscal Year
Department 2000 2001 2002 2003 2004 2000 2001 2002 2003 2004
Aging & Disabilities 10.1 9.3 8.6 9.5 9.0 $1,389 $1,290 $1,257 $1,485 $1,471
Agriculture 10.8 9.0 8.1 8.8 8.9 $1,489 $1,256 $1,127 $1,286 $1,425
Attorney General 11.2 9.4 10.4 13.8 8.2 $1,575 $1,290 $1,603 $2,312 $1,275
Banking, Insurance & Securities 8.8 8.9 11.2 8.8 10.2 $1,477 $1,493 $2,067 $1,596 $1,962
Buildings & General Services 11.5 11.2 11.4 10.1 10.1 $1,216 $1,235 $1,373 $1,286 $1,256
Child Support Services 10.4 10.8 13.8 12.1 11.3 $1,217 $1,387 $1,936 $1,791 $1,789
Commerce & Community Dev. 11.8 10.9 9.4 10.5 11.3 $1,647 $1,576 $1,458 $1,736 $1,936
Corrections 10.8 10.8 11.1 11.6 10.8 $1,391 $1,426 $1,563 $1,736 $1,605
Developmental & MH Services 9.9 10.0 9.0 9.6 11.8 $1,520 $1,566 $1,469 $1,680 $2,124
Education 7.2 6.9 8.7 10.4 10.7 $1,026 $1,025 $1,380 $1,747 $1,958
Employment & Training 12.4 14.7 12.0 14.1 15.9 $1,632 $2,008 $1,715 $2,114 $2,539
Environmental Board 8.0 9.7 9.4 9.9 12.7 $1,104 $1,302 $1,414 $1,640 $2,229
Environmental Conservation 8.5 9.4 10.1 9.6 10.4 $1,288 $1,495 $1,690 $1,660 $1,844
Finance & Management 9.0 9.5 6.9 9.5 8.9 $1,261 $1,448 $1,317 $1,856 $1,743
Fish & Wildlife 7.4 8.3 8.5 8.6 7.5 $1,110 $1,253 $1,303 $1,366 $1,229
Forest, Parks & Recreation 8.3 8.0 8.8 11.5 8.8 $1,220 $1,234 $1,447 $1,894 $1,520
Health 9.7 8.4 8.7 9.1 9.6 $1,398 $1,245 $1,369 $1,549 $1,646
Human Services 13.4 10.6 12.5 10.4 10.7 $1,896 $1,633 $2,199 $1,756 $1,832
Information & Innovation n/a n/a n/a n/a 10.9 n/a n/a n/a n/a $1,834
Labor & Industry 13.0 13.3 10.5 9.6 7.7 $1,811 $1,913 $1,557 $1,514 $1,254
Libraries 9.2 10.2 10.7 9.9 7.8 $1,009 $1,231 $1,372 $1,386 $1,153
Liquor Control 7.6 5.8 7.1 9.7 9.3 $867 $666 $887 $1,241 $1,336
Military 16.9 10.5 10.3 11.8 11.9 $1,844 $1,241 $1,281 $1,575 $1,631
Natural Resources 10.2 7.9 7.2 5.5 9.2 $1,369 $1,157 $1,176 $906 $1,689
PATH 13.1 12.8 13.1 14.0 13.3 $1,766 $1,839 $2,023 $2,258 $2,224
Personnel 8.3 10.9 9.7 10.0 13.4 $1,132 $1,649 $1,630 $1,698 $2,353
Public Safety 9.6 8.3 8.5 9.4 8.8 $1,383 $1,217 $1,359 $1,611 $1,495
Public Service 9.8 13.5 14.6 11.9 11.1 $1,427 $2,403 $2,625 $2,133 $1,973
Secretary of State 12.5 10.3 12.4 12.8 10.8 $1,478 $1,228 $1,582 $1,742 $1,562
Small Departments 9.3 9.9 11.5 9.3 8.9 $1,325 $1,546 $1,767 $1,608 $1,557
Social & Rehabilitation Services 9.3 9.6 9.4 10.9 10.9 $1,357 $1,437 $1,478 $1,782 $1,823
State Treasurer 8.0 7.5 11.0 8.6 9.7 $966 $974 $1,486 $1,166 $1,506
Tax 10.5 11.2 11.5 13.6 13.0 $1,298 $1,494 $1,602 $2,024 $1,999
Transportation 11.8 11.3 11.1 11.1 11.8 $1,495 $1,467 $1,575 $1,668 $1,861
Vermont Lottery Commission 7.1 12.1 10.0 13.9 11.3 $919 $1,713 $1,405 $2,187 $1,715
Vermont State Hospital 13.5 13.8 14.5 13.5 12.8 $1,599 $1,707 $1,867 $1,902 $1,873
Vermont Veterans' Home 12.1 12.5 10.8 11.8 13.8 $1,199 $1,239 $1,225 $1,414 $1,835
Overall Average 10.8 10.5 10.6 11.0 11.0 $1,417 $1,436 $1,541 $1,696 $1,752 Source: The state’s Human Resource Management System. The state’s Human Resource Management System. Data include only classified employees of the Executive branch for Fiscal Years 2000 to 2004. “Small Departments” have 10 or fewer employees (See Appendix B). Comments: Average sick leave usage has remained relatively constant from Fiscal Year 2000 to Fiscal Year 2004. Overall, the State has experienced a 23.6% increase in the average cost of sick leave per employee from Fiscal Year 2000 to Fiscal Year 2004. This is the result of higher average salaries.

70 State of Vermont Workforce Report – FY 2004
THIS PAGE IS INTENTIONALLY LEFT BLANK

State of Vermont Workforce Report – FY 2004 71
Reports Required by the General Assembly
Section Four of this report provides information required by statute in the following areas: Executive Branch Permanent Positions Authorized Limited Service Positions Created Use of Temporary Employees Personal Services Contracts Created Contractors on Payroll Classification Reviews
Section Four

72 State of Vermont Workforce Report – FY 2004
Table 40 Executive Branch Permanent Positions Newly Authorized for Fiscal Year 2004
Citation Agency/Department Job Class Requested New 2003 Act 66, Sec. 217d.(a) Fish and Wildlife Fish & Wildlife Scientist III 1 2003 Act 55, Sec 10(a) BISHCA
Deputy Commissioner of Captive Insurance 1
TOTAL NEW POSITIONS FY '04 2
Source: Department of Human Resources Comments: A total of two new Executive branch permanent positions were authorized by the Legislature for Fiscal Year 2004.

State of Vermont Workforce Report – FY 2004 73
Table 41 Limited Service Positions Created in Fiscal Year 2004
Joint Fiscal Committee New Limited Service Positions Created
Fiscal Year 2004 Department Number Aging & Disabilities 2 Corrections 4 Attorney General 1 Environmental Conservation 4 Health 6 PATH 2 State's Attorneys 2 TOTAL 21
Source: Department of Human Resources. Comments: A limited service position is a non-tenured position in the classified service which, when initially established, is reasonably expected to exist for a limited duration, frequently more than one year, but less than three years. Such positions usually have a definite termination date and may be associated with a specially funded project or program. The Legislature or the Joint Fiscal Committee approves the creation of limited service positions. Positions created for the purposes of implementing grant-funded initiatives are described in 32 VSA § 5.

74 State of Vermont Workforce Report – FY 2004
Table 42 Use of Temporary Employees in Fiscal Year 2004
Temporary Categories
Department
Bo
na F
ide
Em
erg
en
cy
Fill
Ins
Inte
rmit
ten
t
Part
-Tim
e O
n-
Go
ing
Seaso
nal
Sp
ora
dic
Oth
er
To
tal
Total Hours
Total Gross Wages
Aging & Disabilities 3 7 10 4,901 $68,148
Agriculture 2 1 2 13 18 3,283 $40,142
Attorney General 1 2 2 3 8 2,583 $50,241
BISHCA 1 3 4 3,166 $33,789
Buildings & General Services 42 1 31 32 3 109 68,274 $682,198
Child Support Services 1 1 686 $8,870
Commerce & Community Dev. 4 4 67 1 7 83 28,822 $287,144
Corrections 193 3 1 1 3 9 210 77,154 $978,599
Criminal Justice Training Council 1 2 3 1,421 $18,156
Defender General 1 1 2 832 $14,012
Developmental & MH Services 4 1 5 2,555 $35,206
Education 1 1 1 3 178 184 15,740 $217,195
Employment & Training 4 2 2 4 12 4,443 $59,810
Environmental Board 1 1 1,368 $17,688
Environmental Conservation 1 48 7 3 59 28,218 $340,173
Fish & Wildlife 1 76 1 78 38,804 $463,515
Forest, Parks & Recreation 1 1 439 2 443 167,151 $1,605,517
Governor's Office 1 1 2 119 $1,337
Health 9 8 1 25 8 1 52 25,363 $318,699
Human Services 2 4 1 7 2,706 $28,275
Information and Innovation 1 2 3 2,007 $21,263
Judicial 8 8 2,401 $27,743
Labor & Industry 5 1 3 9 4,043 $52,630
Libraries 1 1 69 $621
Liquor Control 1 1 177 $1,975
Military 1 2 3 4 10 2,652 $34,206
Natural Resources 4 4 4,682 $77,361
PATH 3 1 1 5 3,668 $48,456
Personnel 4 1 1 6 3,230 $37,646
Public Safety 78 8 3 32 4 23 148 67,222 $944,614
Public Service 1 1 472 $8,949
Secretary of State 2 7 3 12 3,893 $48,709
Secretary of the Senate 1 1 984 $18,611
Social & Rehabilitation Services 33 1 28 62 37,526 $477,685
State Treasurer 2 1 1 4 1,685 $21,040
State's Attorneys & Sheriffs 1 1 2 4 965 $15,652
Taxes 70 6 4 80 28,963 $312,706
Transportation 13 9 1 228 11 23 285 125,943 $1,534,706

State of Vermont Workforce Report – FY 2004 75
Table 42 Use of Temporary Employees in Fiscal Year 2004 (Continued)
Temporary Categories
Department
Bo
na F
ide
Em
erg
en
cy
Fill
Ins
Inte
rmit
ten
t
Part
-Tim
e
On
-Go
ing
Seaso
nal
Sp
ora
dic
Oth
er
To
tal
Total Hours
Total Gross Wages
Vermont Lottery Commission 1 1 838 $11,942
Vermont State Hospital 17 38 5 60 49,133 $671,867
Vermont Veterans' Home 11 7 13 12 6 49 23,853 $235,035
Vt Fire Service Training Council 71 1 72 11,984 $192,686
Grand Total 431 151 13 1046 125 352 2118 854,066 $10,066,150 Source: Department of Human Resources. “Other” was used when the code category was not available. Comments: Temporary positions are created when there is a short-term need for additional employees. There are six categories of temporary employees: (1) BONA FIDE EMERGENCY. This category is usually limited to an unforeseen situation that requires a short-term staffing increase to avoid a serious threat to critical services that would otherwise jeopardize public safety. Employment may be full time during the emergency; (2) FILL-INS. A fill-in is a one-for-one replacement of an existing employee who may be on a leave of absence for illness, military, educational, or family reasons. This category may also be used to fill-in for a vacant position that is actively under recruitment. Employment may be full time during the fill-in period; (3) INTERMITTENT. This category is reserved for situations where there are fluctuations in the workload that are not seasonal. Occasionally the employee may work 40 hours, but not on a regular basis; (4) PART-TIME ON-GOING. This category covers regular, on-going part-time employment; (5) SEASONAL. Seasonal employment is defined within each department and may vary by program. Each season has a defined beginning and end, and the season repeats on a yearly basis; and (6) SPORADIC. These situations have no pattern or order. They may include projects, special caseloads, and other situations where an employee is needed for a short period of time or on an occasional basis over a period of time; and In Fiscal Year 2004, 2,118 temporary employees worked a total of 854,066 hours and were paid a total of $10,066,150 in gross wages. Below is a table comparing the use of temporary employees for Fiscal Years 2000 to 2004. Fiscal Year 2004 saw an increase over Fiscal Year 2003 in both the number of temporary employees (16.4%), as well as total hours (+16.2%). Total gross wages rose 20.9%.
Summary of Temporary Usage FY 2000 to FY 2004
State Totals
FY 2000 FY 2001 FY 2002 FY 2003 FY 2004
Number 2,051 1,995 1,958 1,820 2,118 Hours 839,026 818,609 812,364 735,105 854,066 Wages $7,860,776 $7,966,720 $8,652,136 $8,324,193 $10,066,150

76 State of Vermont Workforce Report – FY 2004
Table 43 Personal Services Contracts Created in Fiscal Year 2004
Agency/Department
Number of
Contracts Total Value Aging & Disabilities 54 $2,213,829 Agriculture 39 $292,180 Auditor of Accounts 2 $16,000 BISHCA 57 $10,213,310 Buildings & General Services 129 $22,225,553 Child Support Services 5 $1,945,955 Commerce & Community Development 61 $964,505 Corrections 138 $87,921,910 Criminal Justice Training Council 7 $115,000 Defender General 92 $3,333,807 Developmental & Mental Health Services 77 $10,337,753 Education 52 $5,730,096 Employment & Training 65 $537,483 Environmental Conservation 22 $2,072,358 Finance & Management 3 $86,132 Fish & Wildlife 14 $966,350 Forest, Parks and Recreation 9 $353,112 Governor's Office 1 $7,500 Health 85 $2,421,942 Human Services 19 $977,896 Information & Innovation 1 $9,800 Labor & Industry 10 $155,164 Libraries 1 $25,000 Liquor Control 2 $82,500 Military 34 $2,894,364 Natural Resources 3 $66,680 PATH 36 $8,945,384 Personnel 6 $2,859,815 Public Safety 62 $849,340 Public Service 26 $1,325,590 Social & Rehabilitation Services 24 $1,463,649 State Treasurer 20 $13,274,150 Taxes 13 $460,594 Transportation 90 $14,304,638 Vermont Veteran's Home 11 $471,551 VT Fire Service Training Council 3 $146,202 Grand Total 1,273 $200,067,092
Source: VISION/Finance and Agency/Department self reporting. Act 66 (2003 session) Section 5. Definitions: “Personal Services” means wages and salaries, consulting services, personnel benefits, personal injury benefits under 21 VSA § 636 and similar items. Comments: Given the large number of contracts, only summary data is included in this report.

State of Vermont Workforce Report – FY 2004 77
Table 44 Contractors on Payroll as of 6/24/04 Pay Date
Pos. Num. Department Title
Average Hourly Rate
438191 Aging & Disabilities Vocational Rehabilitation Tutor/Trainer $12.50
438194 Aging & Disabilities Vocational Rehabilitation Tutor/Trainer $12.00
438210 Aging & Disabilities Vocational Rehabilitation Tutor/Trainer $12.00
438216 Aging & Disabilities Vocational Rehabilitation Tutor/Trainer $13.00
438241 Aging & Disabilities Vocational Rehabilitation Tutor/Trainer $10.50
438244 Aging & Disabilities Vocational Rehabilitation Tutor/Trainer $12.50
438257 Aging & Disabilities Vocational Rehabilitation Tutor/Trainer $12.00
438345 Aging & Disabilities Vocational Rehabilitation Tutor/Trainer $11.00
438393 Aging & Disabilities Contractual $12.00
438400 Aging & Disabilities Contractual $12.00
438410 Aging & Disabilities Vocational Rehabilitation Tutor/Trainer $12.00
438411 Aging & Disabilities Vocational Rehabilitation Tutor/Trainer $12.00
438412 Aging & Disabilities Vocational Rehabilitation Tutor/Trainer $12.00
438413 Aging & Disabilities Vocational Rehabilitation Tutor/Trainer $12.50
438414 Aging & Disabilities Vocational Rehabilitation Tutor/Trainer $12.00
438415 Aging & Disabilities Contractual $9.00
438428 Aging & Disabilities Vocational Rehabilitation Tutor/Trainer $12.00
Aging & Disabilities 17
068001 Buildings & General Services Contractual $26.00
068003 Buildings & General Services Contractual $25.00
068004 Buildings & General Services Contractual $23.00
068005 Buildings & General Services Contractual $23.00
068006 Buildings & General Services Contractual $24.00
068007 Buildings & General Services Contractual $24.00
068011 Buildings & General Services Contractual $22.00
Buildings & General Services 7
468010 Corrections Contractual $25.00
468011 Corrections Contractual $25.00
468022 Corrections Contractual $24.00
468071 Corrections Contractual $25.00
468091 Corrections Contractual $25.70
468151 Corrections Contractual $25.70
Corrections 6
648001 Fish & Wildlife Deputy Game Warden $10.00
648002 Fish & Wildlife Deputy Game Warden $12.06
648011 Fish & Wildlife Deputy Game Warden $10.00
648012 Fish & Wildlife Deputy Game Warden $10.00
648015 Fish & Wildlife Deputy Game Warden $10.00
648016 Fish & Wildlife Deputy Game Warden $10.00
648019 Fish & Wildlife Deputy Game Warden $10.00
648022 Fish & Wildlife Deputy Game Warden $10.00
648024 Fish & Wildlife Deputy Game Warden $14.00
Fish & Wildlife 9

78 State of Vermont Workforce Report – FY 2004
Table 44 Contractors on Payroll as of 6/24/04 Pay Date (Continued) 568202 Health Contractual $50.00
Health 1
608027 Social & Rehab Services Disability Determination Medical Conslt $50.00
608029 Social & Rehab Services Disability Determination Medical Conslt $60.00
608031 Social & Rehab Services Disability Determination Medical Conslt $55.00
608032 Social & Rehab Services Disability Determination Medical Conslt $50.00
608033 Social & Rehab Services Disability Determination Medical Conslt $55.00
608034 Social & Rehab Services Disability Determination Medical Conslt $55.00
608036 Social & Rehab Services Disability Determination Medical Conslt $50.00
608037 Social & Rehab Services Disability Determination Medical Conslt $45.00
608044 Social & Rehab Services Disability Determination Medical Conslt $50.00
608046 Social & Rehab Services Disability Determination Medical Conslt $45.00
608049 Social & Rehab Services Contractual $55.00
608052 Social & Rehab Services Contractual $50.00
608057 Social & Rehab Services Disability Determination Medical Conslt $50.00
608061 Social & Rehab Services Disability Determination Medical Conslt $45.00
608221 Social & Rehab Services Disability Determination Medical Conslt $45.00
Social & Rehab Services 15
588001 State Hospital Psychiatrist $35.00
588002 State Hospital Psychiatrist $35.00
588004 State Hospital Psychiatrist $35.00
588005 State Hospital Psychiatrist $35.00
588006 State Hospital Psychiatrist $35.00
588007 State Hospital Psychiatrist $35.00
588008 State Hospital Psychiatrist $35.00
588009 State Hospital Psychiatrist $35.00
588010 State Hospital Psychiatrist $35.00
588011 State Hospital Psychiatrist $35.00
588012 State Hospital Psychiatrist $35.00
588013 State Hospital Psychiatrist $35.00
588014 State Hospital Psychiatrist $35.00
588015 State Hospital Psychiatrist $35.00
State Hospital 14
628002 Veteran's Home Contractual $11.25
Veteran's Home 1
Grand Total 70 Source: Department of Human Resources Comments: These are contractors from whom income taxes should be withheld, but whose working relationships with the State of Vermont are properly outside of the classified service.

State of Vermont Workforce Report – FY 2004 79
Table 45 Classification Reviews: Number of Positions Reviewed and Increased Annual Cost by Department by Fiscal Year
Fiscal Year
2000 Fiscal Year
2001 Fiscal Year
2002 Fiscal Year
2003 Fiscal Year
2004
Department P
osit
ion
s R
evie
wed
An
nu
aliz
ed B
ase
Sala
ry I
ncr
ease
Pos
itio
ns
Rev
iew
ed
An
nu
aliz
ed B
ase
Sala
ry I
ncr
ease
Pos
itio
ns
Rev
iew
ed
An
nu
aliz
ed B
ase
Sala
ry I
ncr
ease
Pos
itio
ns
Rev
iew
ed
An
nu
aliz
ed B
ase
Sala
ry I
ncr
ease
Pos
itio
ns
Rev
iew
ed
An
nu
aliz
ed B
ase
Sala
ry I
ncr
ease
Administration 0 $0 1 $6,240 0 $0 0 $0 0 $0
Aging & Disabilities 10 $16,494 30 $60,549 70 $133,557 49 $132,434 31 $77,771
Agriculture 7 $13,770 5 $13,749 11 $30,285 2 $5,304 23 $52,458
Attorney General 0 $0 1 $0 2 $4,035 2 $9,672 1 $1,934
Auditor Of Accounts 2 $17,826 2 $5,574 4 $13,250 0 $0 0 $0
BISHCA 3 $7,509 2 $5,845 6 $25,334 2 $9,256 26 $58,677
Buildings & General Services 36 $59,134 164 $283,899 98 $212,805 51 $138,861 44 $102,149
Child Support Services 8 $15,642 63 $174,325 36 $75,421 21 $55,702 9 $23,213
Commerce & Community Dev. 13 $30,867 4 $8,944 49 $134,846 8 $38,293 5 $19,718
Corrections 117 $238,326 78 $179,462 91 $170,019 61 $138,445 82 $188,053
Criminal Justice Training Council 2 $4,035 0 $0 0 $0 0 $0 4 $9,485
Developmental & MH Services 8 $24,398 28 $73,133 17 $51,896 0 $0 5 $13,770
Education 12 $27,102 11 $29,328 133 $378,206 23 $76,170 21 $61,048
Employment & Training 34 $62,670 40 $61,152 47 $82,992 26 $65,083 160 $372,507
Environmental Board 1 $1,810 1 $1,830 1 $5,325 7 $19,427 0 $0
Environmental Conservation 207 $446,930 8 $13,250 27 $74,006 25 $63,398 91 $231,795
Finance & Management 8 $20,218 7 $17,950 13 $41,933 1 $1,664 1 $3,390
Fish & Wildlife 8 $17,326 48 $112,154 8 $14,581 108 $323,066 12 $45,656
Forest, Parks & Recreation 6 $10,234 7 $16,349 103 $247,811 3 $15,309 9 $16,952
Health 57 $158,082 57 $152,006 89 $195,998 58 $205,421 72 $205,234
Human Services 8 $22,277 4 $9,402 7 $15,600 3 $18,262 11 $33,176
Information & Innovation 0 $0 5 $16,078
Labor & Industry 3 $10,774 12 $27,373 23 $53,893 31 $84,614 4 $10,088
Libraries 9 $12,293 2 $2,933 0 $0 0 $0 1 $1,206
Liquor Control 11 $13,083 17 $40,768 10 $16,099 5 $15,870 2 $749
Office of Economic Opportunity 1 $2,725 0 $0 0 $0 2 $4,784 1 $1,934
PATH 10 $22,402 26 $58,157 280 $685,526 49 $149,282 36 $91,624
Personnel 12 $23,525 8 $14,976 14 $37,877 23 $55,786 15 $45,968
Public Safety - Civilian 33 $94,474 81 $250,245 47 $112,486 27 $73,757 26 $65,770
Public Safety - State Police 78 $226,824 303 $865,904 42 $120,037 39 $102,773 32 $87,942
Public Service 2 $3,952 14 $35,984 1 $2,662 10 $23,670 4 $10,795
Public Service Board 0 $0 1 $1,955 1 $5,346 0 $0 1 $1,768
Secretary of State 2 $5,054 14 $41,080 17 $38,688 0 $0 9 $19,011
Social & Rehab. Services 53 $101,566 33 $70,762 30 $75,712 45 $159,598 79 $237,536
State Treasurer 1 $2,184 1 $1,685 3 $2,080 3 $13,666 20 $60,840

80 State of Vermont Workforce Report – FY 2004
Table 45 Classification Reviews: Number of Positions Reviewed and Increased Annual Cost by Department by Fiscal Year (Continued)
Fiscal Year
2000 Fiscal Year 2001 Fiscal Year 2002 Fiscal Year 2003 Fiscal Year 2004
Department P
osit
ion
s R
evie
wed
An
nu
aliz
ed B
ase
Sala
ry I
ncr
ease
Pos
itio
ns
Rev
iew
ed
An
nu
aliz
ed B
ase
Sala
ry I
ncr
ease
Pos
itio
ns
Rev
iew
ed
An
nu
aliz
ed B
ase
Sala
ry I
ncr
ease
Pos
itio
ns
Rev
iew
ed
An
nu
aliz
ed B
ase
Sala
ry I
ncr
ease
Pos
itio
ns
Rev
iew
ed
An
nu
aliz
ed B
ase
Sala
ry I
ncr
ease
Taxes 34 $55,494 10 $15,267 52 $133,328 30 $65,894 16 $36,608
Transportation 147 $195,645 433 $873,517 612 $1,126,070 203 $396,365 185 $454,667
VT Commission on Women 1 $2,850 0 $0 0 $0 0 $0 0 $0
Vermont Lottery Commission 12 $26,770 2 $11,003 5 $8,923 1 $2,642 0 $0
Vermont State Hospital 5 $11,232 27 $53,269 58 $154,482 69 $294,278 11 $45,635
Vermont Veteran's Home 9 $15,454 3 $6,677 31 $47,154 3 $19,302 5 $30,493
VT Fire Service Training Council 0 $0 0 $0 1 $2,600 0 $0 0 $0
Water Resources Board 0 $0 1 $3,099 0 $0 0 $0 0 $0
Total 997 $2,090,236 1600 $3,717,501 2056 $4,565,704 1009 $2,826,554 1089 $2,789,197 Source: Department of Human Resources. Data represents filled positions reallocated to a higher or lower pay grade – it does not include vacant positions or positions found to be properly classified (no change in pay grade or salary) Comments: In Fiscal Year 2004 there were a total of 1,089 classification reviews that resulted in reallocation to a higher or lower pay grade. The annualized base salary increase of these reallocations was $2,789,197. This is the future additional cost due to reallocation, in the subsequent and future years. This provides a measure of the impact of the reallocation on future year costs and is not exact. It does not include costs that are difficult to measure, such as additional partial year cost to the department in the year of the reallocation, retroactive adjustments, overtime, and benefit cost adjustments.

State of Vermont Workforce Report – FY 2004 81
APPENDIX A - EEO – 4 Categories The Equal Employment Opportunity Commission (EEOC) has established eight standardized occupational groupings. Administrators and Officials: Occupations in which employees set broad policies, exercise overall responsibility for execution of these policies, or direct individual departments or special phases of the agency’s operations, or provide specialized consultation on a regional, district or area basis. Includes department heads, bureau chiefs, division chiefs, directors, deputy directors, controllers, wardens, superintendents, sheriffs, police and fire chiefs and inspectors, examiners (bank, hearing, motor vehicle, warehouse), inspectors (construction, building, safety, rent-and-housing, fire, license, dairy, livestock, transportation), assessors, tax appraisers and investigators, coroners, farm managers, and kindred workers. Administrative Support (Including Clerical and Sales): Occupations in which workers are responsible for internal and external communication, recording and retrieval of data and/or information and other paperwork required in an office. Includes bookkeepers, messengers, clerk-typists, stenographers, court transcribers, hearing reporters, statistical clerks, dispatchers, license distributors, payroll clerks, office machine and computer operators, telephone operators, legal assistants, sales workers, cashiers, toll collectors, and kindred workers. Paraprofessionals: Occupations in which workers perform some of the duties of a professional or technician in a supportive role, which usually require less formal training and/or experience normally required for professional or technical status. Includes research assistants, medical aids, child support workers, policy auxiliary welfare service aids, recreation assistants, homemaker’s aides, home health aides, library assistants and clerks, ambulance drivers and attendants, and kindred workers. Professionals: Occupations that require specialized and theoretical knowledge that is usually acquired through college training or through work experience and other training that provides comparable knowledge. Includes personnel and labor relations workers, social workers, doctors, psychologists, registered nurses, economists, dieticians, lawyers, systems analysts, accountants, engineers, employment and vocational rehabilitation counselors, teachers or instructors, police and fire captains and lieutenants, librarians, management analysts, airplane pilots and navigators, surveyors and mapping scientists, and kindred workers. Protective Service Workers: Occupations in which workers are entrusted with public safety, security and protection from destructive forces. Includes police patrol officers, fire fighters, guards, deputy sheriffs, bailiffs, correctional officers, detectives, marshals, harbor patrol officers, game and fish wardens, park rangers (except maintenance), and kindred workers. Service Maintenance: Occupations in which workers perform duties which result in or contribute to the comfort, convenience, hygiene or safety of the general public or which contribute to the upkeep and care of buildings, facilities or grounds of public property. Workers in this group may operate machinery. Includes chauffeurs, laundry and dry cleaning operatives, truck drivers, bus drivers, garage laborers, custodial employees, gardeners and groundskeepers, refuse collectors, construction laborers, park rangers (maintenance), farm workers (except managers), craft apprentices/trainees/helpers, and kindred workers. Skilled Craft Workers: Occupations in which workers perform jobs which require special manual skill and a thorough and comprehensive knowledge of the processes involved in the work which is acquired through on-the-job training and experience or through apprenticeship or other formal training programs. Includes mechanics and repairers, electricians, heavy equipment operators, stationary engineers, skilled machining occupations, carpenters, compositors and typesetters, power plant operators, water and sewage treatment plant operators, and kindred workers.

82 State of Vermont Workforce Report – FY 2004
Technicians: Occupations that require a combination of basic scientific or technical knowledge and manual skill that can be obtained through specialized post-secondary school education or through equivalent on-the-job training. Includes computer programmers, drafters, survey and mapping technicians, licensed practical nurses, photographers, radio operators, technical illustrators, highway technicians, technicians (medical, dental, electronic, physical sciences), police and fire sergeants, inspectors (production or processing inspectors, testers and weighers) and kindred workers.

State of Vermont Workforce Report – FY 2004 83
APPENDIX B – Department Listing
Department, Full Name Department, Used in Report Small Department ?
Adjutant General, Office of Military Agency of Administration Administration Yes Aging & Disabilities, Department of Aging & Disabilities Agriculture, Food & Markets, Agency of Agriculture Attorney General, Office of Attorney General Auditor of Accounts Auditor of Accounts Yes Banking, Insurance, Securities & Health Care Administration, Department of BISHCA Buildings & General Services, Department of Buildings & General Services Child Support Services, Office of Child Support Services Commerce & Community Development, Agency
Commerce & Community Development
Corrections, Department of Corrections Defender General, Office of Defender General Developmental & Mental Health Services, Department of Developmental & MH Services Economic Opportunity, Office of Economic Opportunity Yes Education, Department of Education Employment & Training, Department of Employment & Training Environmental Board & Waste Facility Panel Environmental Board Environmental Conservation, Department of Environmental Conservation Finance & Management, Department of Finance & Management Fish & Wildlife, Department of Fish & Wildlife Forest, Parks & Recreation, Department of Forest, Parks & Recreation Governor's, Office of the Governor's Office Health, Department Health Human Services, Agency of Human Services Labor & Industry, Department of Labor & Industry Information & Innovation, Department of Information & Innovation Libraries, Department of Libraries Lieutenant Governor Lieutenant Governor Liquor Control, Department of Liquor Control Lottery Commission, Vermont Vermont Lottery Commission Natural Resources, Agency of Natural Resources Personnel, Department of Personnel Prevention, Access, Transition and Health Access, Department of PATH Public Safety, Department of Public Safety Public Service Board Public Service Board Yes Public Service, Department of Public Service Secretary of State Secretary of State Social & Rehabilitation Services Social & Rehabilitation Services State's Attorneys & Sheriffs, Department of State's Attorneys & Sheriffs Taxes, Department of Taxes Transportation, Agency of Transportation Treasurer, Office of State State Treasurer Vermont Commission on Women Vermont Commission on Women Yes

84 State of Vermont Workforce Report – FY 2004
APPENDIX B – Department Listing (Continued)
Department, Full Name Department, Used in Report Small Department ?
Vermont Criminal Justice Training Council Criminal Justice Training Council Yes Vermont Fire Service Training Council Vt Fire Service Training Council Yes Vermont Human Rights Commission Vermont Human Rights Commission Yes Vermont Labor Relations Board Vermont Labor Relations Board Yes Vermont State Hospital Vermont State Hospital Vermont Veterans' Home Vermont Veterans' Home VOSHA Review Board VOSHA Review Board Yes Water Resources Board Water Resources Board Yes
Note: “Small Departments” have 10 or fewer classified employees.