2020 physician workforce annual report
TRANSCRIPT
2020 Physician Workforce Annual Report ____________________________________________________________________________
November 2020
Ron DeSantis Governor
Scott A. Rivkees, MD State Surgeon General

Table of Contents Executive Summary ..................................................................................................................... i Introduction ................................................................................................................................ 1 Key Definitions ........................................................................................................................... 2 Physician Workforce Advisory Council ....................................................................................... 3 Physician Workforce Demographics ........................................................................................... 5
Gender ................................................................................................................................... 5 Ethnicity ................................................................................................................................. 7 Age ........................................................................................................................................ 9
Physician Workforce Practice Characteristics ...........................................................................11 Primary Specialty ..................................................................................................................11 Practice Setting .....................................................................................................................14 Practice Hours ......................................................................................................................15 Practice Ownership ...............................................................................................................17 Practice Wait Times ..............................................................................................................18 Practice New Recruitment .....................................................................................................19 Medicare Patients .................................................................................................................20 Medicaid Patients ..................................................................................................................23 Physicians Planning to Retire ................................................................................................26 Physicians Planning to Relocate ...........................................................................................27 Telemedicine .........................................................................................................................29 Critical Care Medicine Specialty Question .............................................................................31 Emergency Medicine Specialty Question ..............................................................................32 Obstetrics and Gynecology Specialty Questions ...................................................................33 Radiology Specialty Questions ..............................................................................................36
Physicians Not Providing Direct Patient Care in Florida ............................................................39 Department Programs to Support Physician Workforce Development .......................................40
The State Primary Care Office ..............................................................................................40 The Office of Rural Health .....................................................................................................40 The Volunteer Health Care Provider Program .......................................................................41
Physician Workforce Advisory Council 2019 Recommendations ...............................................42 Ongoing Recommendations ..................................................................................................42 New Recommendations ........................................................................................................44
Conclusion ................................................................................................................................45 Appendix A: Physician Workforce per Capita by County, 2019–20............................................46 Appendix B: Change in Practicing Physicians by County ..........................................................47 Appendix C: Primary Care Physicians by County, 2019–20 ......................................................51 Appendix D: Specialty Group Counts by County, 2019–20 .......................................................52 Appendix E: Physicians Planning to Retire in the Next Five Years ............................................59

2020 Physician Workforce Annual Report November 2020
-i-
Executive Summary The 2020 Physician Workforce Annual Report presents a summary and analysis of the 2019 and
2020 Physician Workforce Surveys.1 Physicians are required to complete the survey every two
years when they renew their license to practice; two years of survey responses represent the
majority of physicians in Florida.2 This report helps policymakers make informed decisions and
policies about Florida’s current and future physician workforce and access to care.
During the 2019–20 survey cycle, there were 93,235 physicians licensed in the state of Florida.
Of those licensed physicians, 83,535 (89.6%) possess a license that allows them to practice in
Florida. Of these physicians, 75,625 renewed their medical license during 2019 and 2020, and
responded to the workforce survey. Of the physicians renewing their medical license, 54,677
(72.3%) indicated they are providing direct patient care in Florida. Unless otherwise specified,
survey results presented in this report are based on these physicians.3
Key findings based on the 2019–20 survey cycle include:
• Over one-third (34.3%) of Florida’s 67 counties have a per capita rate of less than 10 physicians per 10,000 population (Appendix A).
• Only 2% (1,080) of physicians have a direct patient care practice in Florida’s rural counties (Appendix B).
• The percentage of minority physicians has been steadily increasing since 2010 from 38.1% to 44.3% (page 8).
• Almost 60% (32,645) of physicians are age 50 and older (page 9).
• Both the number and percentage of female physicians is increasing. For physicians under age 40, the percentage of female physicians is almost half (46.7%) (page 10).
• The top three specialty groups for physicians providing direct patient care in Florida are internal medicine (28.0% or 14,755), family medicine (14.7% or 7,769), and pediatrics (8.1% or 4,265) (page 11).
• Primary care physicians account for 33.7% of physicians providing direct patient care (page 12 and Appendix C).
• Almost three-quarters (70.8% or 35,069) of the physicians practice in an office setting, and 18.2% (9,041) practice in a hospital (page 14).
• Over 80% of physicians report they accept patients with Medicare (page 20), and 69% of physicians report they accept patients with Medicaid (page 23).
• A total of 8.7% (4,757) of physicians plan to retire in the next five years (page 26).
1 The 2019–20 biennial survey cycle is from June 1, 2018 through May 31, 2020. 2 Newly licensed physicians do not complete a survey. 3 See page 2 for a key to physician definitions.

-ii-
During the last ten-year period, the total number of physicians licensed in Florida has increased
34.2%, and the number of physicians providing direct patient care in Florida has increased
26.6%, as shown in the following chart.4 The increase in these numbers occurred while the total
population of Florida increased just 15.2%.5
Active Physicians in Florida from 2010-11 to 2019-20
Of the 54,677 physicians providing direct patient care who renewed their medical license during
2019 and 2020 and responded to the workforce survey, 89.2% were allopathic physicians and
10.8% were osteopathic physicians.
Active Physicians in Florida by Physician Type for 2019–20
4 In contrast, two counties—Glades and Madison—have experienced at least a 30% decrease in the number of practicing physicians since the 2018–19 cohort. See Appendix B for information on changes in the number and percentages of practicing physicians by county.
5 https://worldpopulationreview.com/states/florida-population
2010-11 2011-12 2012-13 2013-14 2014-15 2015-16 2016-17 2017-18 2018-19 2019-20
43,188 44,804 43,406 43,957 44,685 45,746 45,99551,582 52,936 54,677
2019-202010-11 2011-12 2012-13 2013-14 2014-15 2015-16 2016-17 2017-18 2018-19
Allopathic48,613
Osteopathic5,873
89.2%
10.8%

2020 Physician Workforce Annual Report November 2020
-1-
2020 Florida Physician Workforce Annual Report
Introduction The 2020 Physician Workforce Annual Report is based on responses to the Florida Physician
Workforce Survey. The survey is part of the licensure renewal process for physicians and is
administered by the Florida Department of Health’s Division of Medical Quality Assurance.
Physicians must renew their license every other year. Newly licensed physicians are not
included in the analysis because the survey is only administered upon licensure renewal.
A total of 83,535 physicians possess a license that allows them to practice in Florida. Of these
physicians, 75,625 renewed their medical license during 2019 and 2020 and responded to the
workforce survey. Of those surveyed, 54,677 are actively practicing and/or providing direct
patient care.
From the 2010–11 survey cohort to the 2019–20 survey cohort, the number of actively
practicing physicians increased 26.6%, from 43,188 to 54,677. During this same time, the
population of Florida increased 14.8%, from 18.8 million to 21.6 million.6
Unless noted, this report presents survey results and analyzes physicians providing direct
patient care. These physicians are those who answered that they spent at least 1% of their time
in direct patient care in Florida in the last 12 months, as shown in the pie chart below.
Physicians Providing Direct Patient Care as a Percentage of Their Time
6 The 2020 Florida provisional population number is published on the Florida Health CHARTS webpage
(www.flhealthcharts.com/FLQUERY/Population/PopulationRpt.aspx).
1% – 25%26% – 50%
51% – 75%
76% – 100% 80.2%
8.5% 4.2%7.1%

-2-
Key Definitions These definitions explain terms used in this report.
Physicians Providing Direct Patient Care in Florida: Physicians holding a Florida medical
license who took the survey and reported that they provided direct patient care in the last twelve
months, possess a valid license in active status, and are not classified as a current medical
resident, intern, or fellow.
Physicians Not Providing Direct Patient Care in Florida: Physicians holding a Florida
medical license who took the survey and reported they did not provide direct patient care in the
last twelve months, physicians with inactive licenses, physicians who did not answer enough
survey questions to determine if they were practicing, physicians whose practice location is
officially listed as “not practicing,” physicians whose practice location is officially listed as
“confidential” unless the survey response gives a county location, and physicians whose license
status as of May 31, 2020, does not authorize them to practice (administrative suspension,
delinquent, emergency suspension, inactive, military active, retired, suspended, temporary
military active, and voluntary withdrawal).7
Physician Workforce Survey: The survey completed by all medical doctors (allopathic and
osteopathic) biennially during the Florida medical license renewal process.
Primary Care Physicians: Physicians indicating they practice general internal medicine
(0500-0501), family medicine (0400-0406), or general pediatrics (1400-1401) as a primary
practice specialty, as defined by the American Academy of Family Physicians.
Primary Specialty: The primary practice specialty reported by the physician.
7 There are 67 physicians whose practice location is listed as “confidential”.

-3-
Physician Workforce Advisory Council The Physician Workforce Advisory Council (Council) is established in section 381.4018, Florida
Statutes, and is charged with advising the State Surgeon General and the Florida Department of
Health (Department) about the current and future physician workforce needs in the state. As
shown in the table below, the Council comprises medical and academic stakeholders, and serves
as a coordinating and strategic planning body to assess the state's physician workforce needs.
Physician Workforce Advisory Council Membership
Council Member Name State Surgeon General – Council Chair Scott A. Rivkees, MD A designee from the Department who is a physician licensed under chapter 458 or chapter 459 and recommended by the State Surgeon General. Ulyee Choe, DO
An individual who is affiliated with the Science Students Together Reaching Instructional Diversity and Excellence program and recommended by the area health education center network.
Anthony Speights, MD
An individual recommended by the Council of Florida Medical School Deans representing a college of allopathic medicine. Cuc Mai, MD
An individual recommended by the Council of Florida Medical School Deans representing a college of osteopathic medicine. Mark Sandhouse, DO
One individual recommended by the Florida Hospital Association, representing a hospital that is licensed under chapter 395, has an accredited graduate medical education program, and is not a statutory teaching hospital.
Saima Chaudhry, MD
One individual representing a statutory teaching hospital as defined in s. 408.07 and recommended by the Safety Net Hospital Alliance. Steven Sonenreich, MBA
An individual recommended by the Florida Medical Association representing a primary care specialty. Corey Howard, MD
An individual recommended by the Florida Medical Association representing a nonprimary care specialty. Michael Patete, MD
An individual recommended by the Florida Osteopathic Medical Association representing a primary care specialty. Linda Delo, DO
An individual recommended by the Florida Osteopathic Medical Association representing a nonprimary care specialty. Brett Scotch, DO
An individual who is a program director of an accredited graduate medical education program representing a program accredited by the Accreditation Council for Graduate Medical Education.
Joan St. Onge, MD
An individual who is a program director of an accredited graduate medical education program representing a program that is accredited by the American Osteopathic Association.
Peter Cohen, DO
An individual recommended by the Florida Association of Community Health Centers representing a federally qualified health center located in a rural area as defined in s. 381.0406(2)(a).
Debra Andree, MD
An individual recommended by the Florida Academy of Family Physicians. Dennis Saver, MD
An individual recommended by the Florida Alliance for Health Professions Diversity. Joedrecka Brown Speights, MD
The Chancellor of the State University System or his or her designee. Emily Sikes
A layperson member as determined by the State Surgeon General. Michael Curtis, MBA

-4-
The Council continues to monitor the status of Graduate Medical Education (GME) programs in
Florida. GME and residency programs are an important component of Florida’s physician
workforce. In 2013, the Florida Legislature created the Statewide Medicaid Residency Program,
and appropriated $80 million in recurring state and matching federal funds to the program. In
2015, the Legislature also created the GME Startup Bonus Program to provide resources for
educating and training physicians in specialties that are in a statewide supply-and-demand
deficit, and appropriated $100 million to the program. The 2020 Legislature appropriated a total
of $280.3 million to these programs.

-5-
Physician Workforce Demographics Gender As shown in Figure 1, based on the 2019–20 survey cohort, 30.6% of Florida’s actively
practicing physicians are female. This is a 56.8% increase from 2010–11.
The gender ratio of actively practicing physicians in Florida is approaching the state population
average. In April 2010, the U.S. Census Bureau reported Florida’s population was 51.1%
female, which is the same percentage for its 2019 estimated population.8 The male-to-female
ratio of physicians in the 2010–11 survey cohort was 3.1:1. The ratio for the 2019–20 cohort
changed to 2.3:1. The Association of American Medical Colleges’ 2019 State Physician
Workforce Data Report states 30.7% of Florida’s active physicians are female, which ranks
Florida 39th in the country. The nationwide average percentage of female physicians is
35%.9, 10, 11
8 The 2019 Florida gender percentages are published on the United States Census Bureau’s QuickFacts webpage
(www.census.gov/quickfacts/fact/table/fl/PST045217). 9 This figure is on pages 21 and 22 of the 2019 State Physician Workforce Data Book (https://www.aamc.org/data-
reports/workforce/report/state-physician-workforce-data-report). 10 The percentage is slightly higher than the numbers in this report because it includes all physicians, not just those
renewing their licenses. 11 The Association of American Medical Colleges’ State Physician Workforce Data Report is published biennially.
Female16,644
Male37,766
Figure 1: 2019-20 Physician Gendern = 54,410
30.6%
69.4%

-6-
As shown in Figure 2, the percentage of female physicians has steadily increased from 24.6% in
2010–11 to 30.6% in 2019–20.
0%
10%
20%
30%
40%
50%
60%
70%
80%
90%
100%
2010-11 2011-12 2012-13 2013-14 2014-15 2015-16 2016-17 2017-18 2018-19 2019-20
24.6% 25.4% 25.8% 26.7% 27.2% 28.2% 28.9% 29.6% 30.0% 30.6%
75.4% 74.6% 74.2% 73.3% 72.8% 71.8% 71.1% 70.4% 70.0% 69.4%
Figure 2: Ten-Year Trend of Physicians by Gender2010–11 to 2019–20
Male Female

-7-
Ethnicity As shown in Figure 3, just over half of Florida’s physician workforce is White, 17.6% is Hispanic,
13.2% is Asian, and 5.5% is African American.
White30,446
Hispanic9,634
Asian7,202
African American3,009
Other2,846
Not Provided1,482 Native American
58
Figure 3: 2019-20 Physicians by Ethnicityn = 54,677
55.7%
2.7%5.2%
5.5%
13.2%
17.6%
0.1%

-8-
The percentage of minority physicians in Florida has been increasing since 2010–11 (see
Figure 4). In the 2010–11 cohort, minority physicians comprised 38.1% of all physicians. In the
2019–2020 cohort, minority physicians increased to 44.3%.
1 The category “All Others” includes those who selected Native American, Other or did not provide an ethnicity.
Since the 2010–11 cohort:
• The number of African American physicians has increased 50.8% (from 1,995 to 3,009).
• The number of Hispanic physicians has increased 49.2% (from 6,458 to 9,634).
• The number of Asian physicians has increased 46.8% (from 4,905 to 7,202).
• The number of Native American physicians has increased 45% (from 40 to 58).
• The number of White physicians has increased 14% (from 26,713 to 30,466).
0.0% 10.0% 20.0% 30.0% 40.0% 50.0% 60.0% 70.0% 80.0% 90.0% 100.0%
2019-20
2018-19
2017-18
2016-17
2015-16
2014-15
2013-14
2012-13
2011-12
2010-11
55.7%
56.6%
57.5%
58.4%
59.1%
59.9%
60.3%
60.8%
61.3%
61.9%
17.6%
17.4%
17.2%
16.9%
16.6%
16.3%
16.0%
15.8%
15.3%
15.0%
13.2%
13.0%
12.9%
12.6%
12.5%
12.2%
11.7%
11.9%
11.9%
11.4%
5.5%
5.5%
5.4%
5.3%
5.1%
5.0%
5.0%
4.9%
4.7%
4.6%
8.0%
7.5%
7.0%
6.8%
6.7%
6.6%
7.0%
6.6%
6.8%
7.1%
Figure 4: Ten-Year Trend of Physicians by Ethnicity as a Percentage of Practicing 2010-11 to 2019-20
White Hispanic Asian African American All Others1

-9-
Age The average age of practicing physicians is 54. The two youngest physicians renewing a license
were 27 years old. The oldest was 99 years old.12 The percentage of physicians working past
typical retirement age (65 or older) is 20.7%. In addition, 33.7% (18,407) of practicing
physicians are age 60 and older, and 26% (14,238) are between age 50 and 59. Of the 54,410
physicians, 69.4% (37,766) are male, and 30.6% (16,644) are female. Figure 5 shows gender
distribution by age group.
12 There were 47 physicians age 90 and older who renewed their license.
0%
5%
10%
15%
20%
< 40 40-49 50-59 60-69 70-79 ≥ 80
4,263
8,346
9,951 9,996
4,284
926
3,741
5,454
4,270
2,536
57271
Figure 5: 2019-20 Physicians by Gender and Age Groupn = 54,410
Male Female

-10-
For age groups by gender, Figure 6 shows that approximately 75% of male physicians are
between the ages of 40 and 69, while approximately 80% of female physicians are under age
60.
The percentage of physicians under age 40 are almost equal with females at 46.7% and males
at 53.3%. This distribution is similar to the total population of Florida. The percentages of
physicians under age 40 for both genders have fluctuated slightly since 2012-13, increasing just
over 1% for females and decreasing just over 1% for males.
0%
5%
10%
15%
20%
25%
30%
35%
Male (n = 37,766) Female (n = 16,644)
4,263
3,7418,346
5,454
9,951 4,2709,996
2,5364,284
572926 71
Figure 6: 2019-2020 Physicians by Gender in Each Age Group
< 40 40-49 50-59 60-69 70-79 ≥ 80

-11-
Physician Workforce Practice Characteristics Primary Specialty Figure 7 shows the distribution of physicians by 21 specialties at the physician’s primary office
location. The top three specialty groups—internal medicine, family medicine, and pediatrics—
comprise just over 50% of the total physician workforce. (See Appendix D for information
regarding physician specialty by county.)
Figure 7: 2019–20 Physicians by Primary Specialty
Primary Specialty Number Percentage
Percentage Increase from
2018–19 Internal Medicine 14,755 28.0% 4.3% Family Medicine 7,769 14.7% 6.2% Pediatrics 4,265 8.1% 4.5% Surgery 3,818 7.2% 12.0% Anesthesiology 3,366 6.4% -0.5% Emergency Medicine 3,188 6.11% 1.5% Radiology 2,847 5.4% 10.2% Obstetrics & Gynecology 2,396 4.5% 5.1% Psychiatry 2,248 4.3% 2.6% Orthopedic Medicine 1,275 2.5% -13.0% Ophthalmology 1,310 2.5% 2.0% Neurology 1,295 2.4% 3.1% Dermatology 1,065 2.0% -0.4% Pathology 862 1.6% -1.8% Otolaryngology 676 1.3% 2.9% Physical Medicine & Rehabilitation 647 1.2% 13.9% Urology 521 1.0% -10.5% Preventive Medicine 273 0.5% -9.3% Medical Genetics 55 0.1% -10.9% Nuclear Medicine 49 0.1% 25.0% Proctology 4 0.0% 0.0% TOTAL 50,7021 100% 3.9%
1 This table does not include the 1,993 physicians who did not answer this question.

-12-
Primary care physicians are defined as those practicing in the areas of general internal
medicine, family medicine, and general pediatrics.13 Primary care physicians make up just over
one-third of the active physician workforce (33.7% or 17,747). Approximately 83% of primary
care physicians specialize in general internal medicine or family medicine. Approximately 17%
specialize in general pediatrics (see Figure 8). (See Appendix C for a map of primary care
physicians by county.)
13 Results for general internal medicine are based on respondents who selected 2 of the 22 internal medicine
subspecialty codes (0500-0501). Family medicine includes all subspecialty codes (0400–0406). Pediatrics includes subspecialty codes (1400-1401).
Internal Medicine6,998
Family Medicine7,769
Pediatrics2,980
Figure 8: 2019-20 Primary Care Physiciansn = 17,747
43.8%
16.8%
39.4%

-13-
When specialties are analyzed by gender and compared to the total composition (27.6% female,
72.4% male), the percentage of practicing female physicians meets or exceeds 27.6% for
eleven specialties (see Figure 9). More females than males practice pediatrics (55.9%) and
medical genetics (54.2%). Males comprise the greatest percentage of proctologists (100%),
urologists (95.4%), and orthopedic specialists (95.0%).
0% 20% 40% 60% 80% 100%
Urology
Surgery
Radiology
Psychiatry
Proctology
Preventive Medicine
Physical Medicine & Rehabilitation
Pediatrics
Pathology
Otolaryngology
Orthopedic Medicine
Ophthalmology
Obstetrics & Gynecology
Nuclear Medicine
Neurology
Medical Genetics
Internal Medicine
Family Medicine
Emergency Medicine
Dermatology
Anesthesiology
4.0%13.1%20.6%38.9%
0.0%31.7%27.6%55.9%38.4%14.8%5.1%20.6%47.9%20.0%27.8%54.2%
27.5%38.0%28.6%40.4%24.7%
95.4%86.9%79.4%61.1%
100.0%
68.3%72.4%44.1%61.6%85.2%95.0%79.4%52.1%80.0%72.2%45.8%72.5%62.0%71.4%59.6%75.3%
Figure 9: 2019-20 Physicians by Specialty and Gender
Male 72.4%Female 27.6%
Statewide Average

-14-
Practice Setting The four most common practice settings for physicians are single specialty group practice,
multi-specialty group practice, hospital, and solo practice (see Figure 10).
The survey asks physicians what year they started practicing at their current location. The
answers ranged from 1945 to 2020, with almost 10% (4,448) responding they started practicing
at their current location in 2018.
0% 200000%400000%600000%800000%1000000%1200000%1400000%1600000%
Urgent care facility
Solo practice
Single specialty group practice
Other
Multi-specialty group practice
Medical school
Hospital
HMO/managed care organization
Faculty practice plan
Ambulatory surgery center
1.6%797
19.8%9,809
29.7%14,701
2.4%1,184
21.3%10,559
3.1%1,553
18.2%9,041
1.5%740
1.7%846
0.6%312
Figure 10: 2019-20 Physicians by Practice Settingn = 49,542

-15-
Practice Hours The workforce survey asked physicians to report the average number of patients they see per
week.14 As shown in Figure 11, just under two-thirds of physicians reported seeing between 1
and 99 patients per week, and almost 30% reported seeing between 100 and 199 patients. For
physicians who reported seeing an average number of patients between 1 and 299, the average
was 74.
14 Physicians who did not respond are not included. Additionally, responses provided in percentages, text or with a
number of patients per week that could not be quantified are not included.
Zero Patients1,040
1 to 99 Patients32,614
100 to 199 Patients14,161
200 to 299 Patients
1,414
>300 Patients950
Figure 11: 2019-20 Average Number of Patients per Week at Primary Practice Location
n = 50,179
65.0%
28.2%
2.8%1.9%
2.1%

-16-
As shown in Figure 12, most physicians spend 60 hours or less per week on direct patient care
(85.1% or 41,878). Physicians who reported spending between one and 100 hours per week on
patient care provide an average of 43 hours of direct patient care per week.
Almost 93% of physicians providing direct patient care reported spending between one and 20
hours on administrative matters, and 5.9% reported spending between 21 to 40 hours on
administrative matters. Just under 94% of physicians providing direct patient care reported
spending between 1 to 20 hours on research and teaching, while 4.9% reported spending
between 21 to 40 hours on research and teaching.
1 to 20 Hours
21 to 40 Hours
41 to 60 Hours
61 to 80 Hours
81 to 100 Hours
Figure 12: 2019-20 Practicing Physicians Weekly Hours Spent Providing Patient Care
n = 49,209
14.6%
47.5%
23.0%
7.9%7.0%

-17-
Practice Ownership Physicians were asked about the ownership of the practice where they worked. Over half of the
physicians reported they are employees, as shown in Figure 13.
Physicians who reported being employed by a hospital were asked if they were employed
directly by the hospital or if the practice was owned by a hospital. Of the 6,869 physicians who
responded, over half (57.0%) of them reported they were employed directly by a hospital, 21.8%
responded their practice is owned by a hospital, and 21.2% did not know. Of the 1,600
physicians who reported they were independent contractors who worked in a hospital, 41.5%
contract directly with the hospital, 16.3% contract with a practice owned by the hospital, and the
remaining 42.3% did not know. Over 80% of the physicians whose practice is owned by a
hospital reported they work in a group planꟷ50.5% in a multi-specialty group practice, and
37.9% in a single specialty group practice.
Of physicians who reported working for a faculty practice plan, almost three-quarters (71.2%)
work in a multi-specialty group, with the remaining 28.8% working in a single specialty practice.
There were 12,252 physicians who reported they did not work for a hospital, faculty practice
plan, or as a sole practitioner. Of these, 71.1% reported their practice is wholly owned by one or
more physicians in the practice.
Full or Part Owner18,556
Independent Contractor
6,282
Employee 28,890
Figure 13: 2019-20 Physician Employment Ownershipn = 53,728
34.5%
11.7%
53.8%
-18-
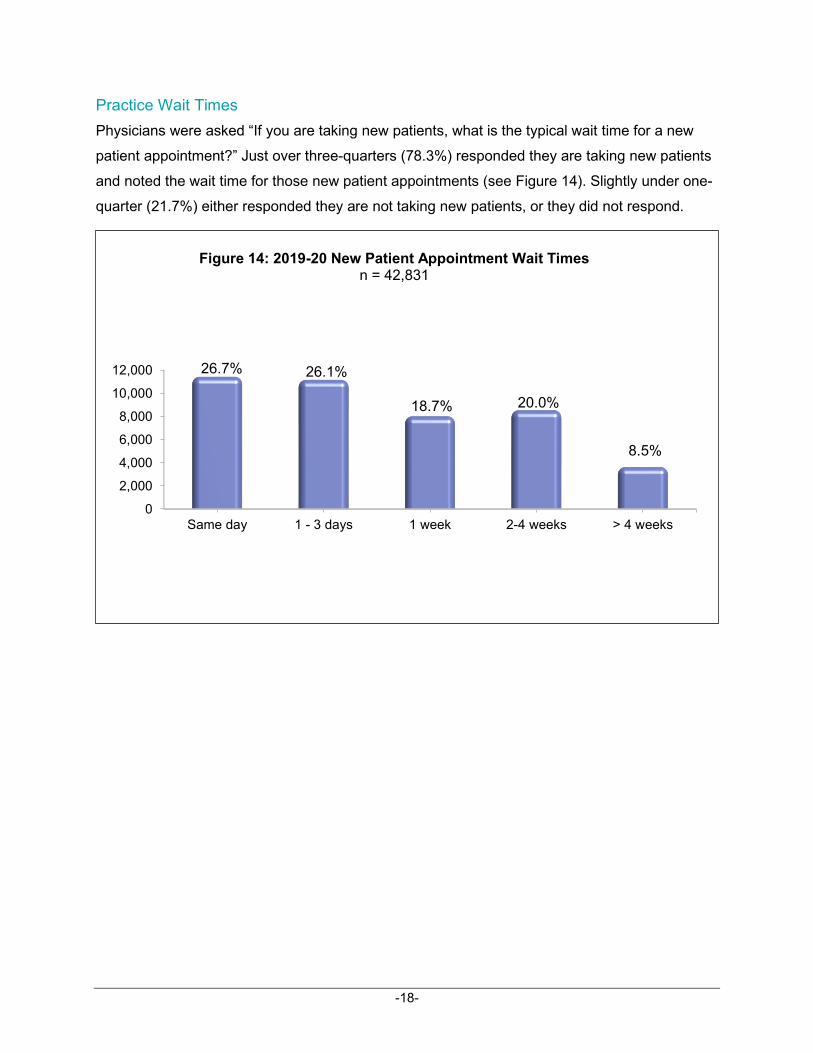
Practice Wait Times Physicians were asked “If you are taking new patients, what is the typical wait time for a new
patient appointment?” Just over three-quarters (78.3%) responded they are taking new patients
and noted the wait time for those new patient appointments (see Figure 14). Slightly under one-
quarter (21.7%) either responded they are not taking new patients, or they did not respond.
0
2,000
4,000
6,000
8,000
10,000
12,000
Same day 1 - 3 days 1 week 2-4 weeks > 4 weeks
Figure 14: 2019-20 New Patient Appointment Wait Timesn = 42,831
26.7%
8.5%
20.0%18.7%
26.1%

-19-
Practice New Recruitment Almost one-third (32.1%) of the physicians reported actively recruiting for a new physician in the
responding physician’s specialty. As shown in Figure 15, of those recruiting, almost 40%
reported they have been recruiting for over a year. The top three factors limiting their
recruitment efforts are finding adequately qualified candidates in their specialty (34.4%),
meeting salary/financial requirements for new hires (28.2%), and recruiting to their locations
(18.1%).
0 - 3 Months3,411
3 - 6 Months3,044
6 - 12 Months2,835
> 12 Months6,118
Figure 15: 2019-20 New Physician Recruitment Timen = 15,408
39.7%
19.8%
22.1%
18.4%
-20-
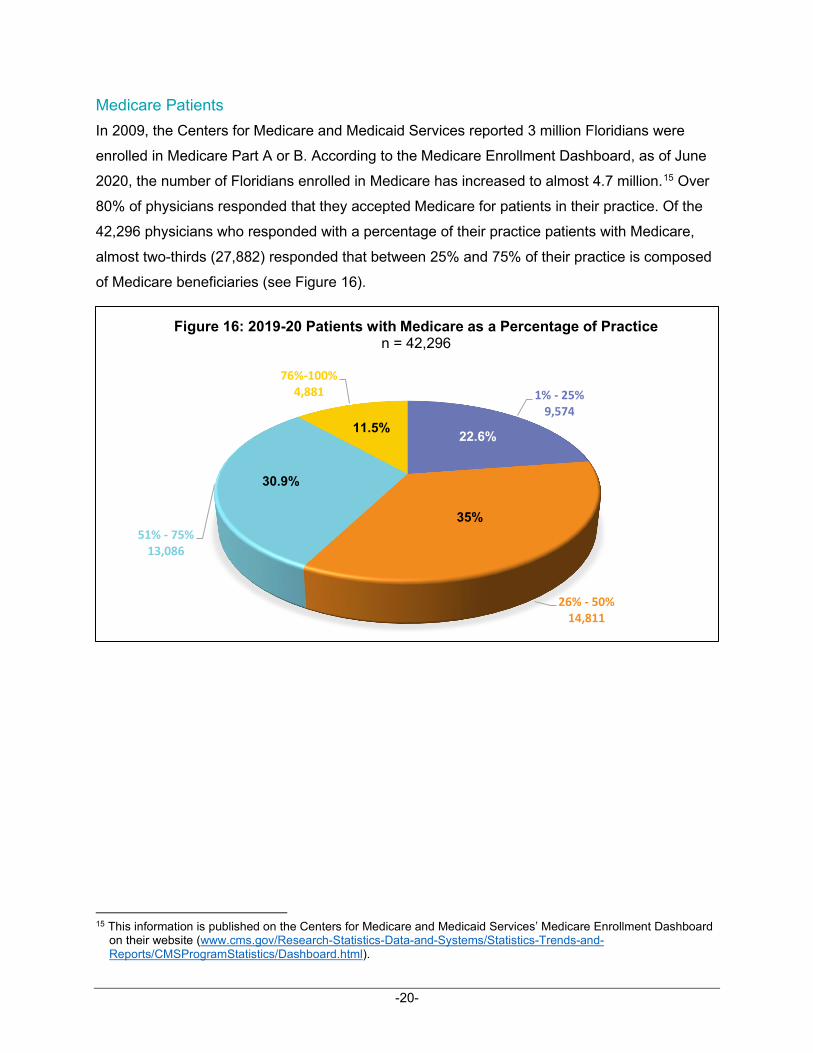
Medicare Patients In 2009, the Centers for Medicare and Medicaid Services reported 3 million Floridians were
enrolled in Medicare Part A or B. According to the Medicare Enrollment Dashboard, as of June
2020, the number of Floridians enrolled in Medicare has increased to almost 4.7 million.15 Over
80% of physicians responded that they accepted Medicare for patients in their practice. Of the
42,296 physicians who responded with a percentage of their practice patients with Medicare,
almost two-thirds (27,882) responded that between 25% and 75% of their practice is composed
of Medicare beneficiaries (see Figure 16).
15 This information is published on the Centers for Medicare and Medicaid Services’ Medicare Enrollment Dashboard
on their website (www.cms.gov/Research-Statistics-Data-and-Systems/Statistics-Trends-and-Reports/CMSProgramStatistics/Dashboard.html).
1% - 25%9,574
26% - 50%14,811
51% - 75%13,086
76%-100%4,881
Figure 16: 2019-20 Patients with Medicare as a Percentage of Practicen = 42,296
30.9%
11.5% 22.6%
35%

-21-
Figure 17 shows the reasons why 20% of physicians do not see patients with Medicare. The
most common reason being either their patients or the services they provide are not eligible for
Medicare reimbursement. Some services not covered by Medicare include cosmetic surgery,
eye exams for glasses/contacts, and alternative medicine.
0% 5% 10% 15% 20% 25% 30% 35%
Works for Federal Government
Too Much Paperwork
Practice at Full Capacity
Patient/Services Not Eligible
Miscellaneous Other Reasons/None Given
Medically Underserved (No Insurance)
Low Compensation
Concerned About Fraud Issues
Cash Only
Billing Requirements
860
600
681
3,283
2,537
281
703
75
194
441
Figure 17: 2019-20 Reasons Why Physicians Do Not Accept Medicaren = 9,655

-22-
Almost 95% (41,706) of physicians report they accept new patients who have Medicare. Of the
2,398 physicians who selected a reason that they do not accept new patients who have
Medicare, the most frequently selected was that their practice is at full capacity (see Figure 18).
Of physicians who see patients with Medicare, when asked if they limit their practice in any way
for these patients, the majority (96.9%) stated they do not. For the small percentage who
reported limiting their practice, the two main reasons were: “Limit Number of New Medicare
Patients” (46.0%) and “Other” (51.5%). The four most common reasons physicians chose
“Other” were:
• “Limited to certain Medicare Advantage/HMO plans”
• “Limited to specific services”
• “Limited to patients transitioning to Medicare from private plans”
• “Limited to fee-for-service Medicare”
Billing Requirements
90
Cash Only29
Concerned About Fraud Issues
13
Low Compensation
214
Medically Underserved
68
Miscellaneous Other
Reasons/None Given
566
Patient/Services Not Eligible
349
Practice At Full Capacity
649Too Much Paperwork
167Works for Federal
Government253
Figure 18: 2019-20 Why Physicians Are Not Accepting New Patients with Medicare
n = 2,398
2.8%
14.6%
7.0%27.1%
91.4%
23.7%8.9%
0.5%
7.0%
10.5%
1.2%
3.8%

-23-
Medicaid Patients Of the physicians who responded to the question asking what percentage of their practice
includes patients with Medicaid, over 68% (35,320) responded they see patients who have
Medicaid (see Figure 19). Of the physicians who have patients with Medicaid, just over half
(53.9%) reported that these patients comprise less than 25% of their patient panel.
Figure 20 shows the reasons physicians do not take patients with Medicaid. The most common
reason selected was “Low Compensation” (49.4%).
0
5,000
10,000
15,000
20,000
1% - 25% 26% - 50% 51% - 75% 76%-100% Other,pleasespecify
I do not takepatients onMedicaid
Num
ber o
f Phy
sici
ans
Figure 19: 2019-20 Patients with Medicaid as a Percentage of Practicen = 22,845
18.0%
36.7%
9.2% 6.2%4.2%
25.7%
0% 10% 20% 30% 40% 50%
Works for Federal Government
Too Much Paperwork
Practice at Full Capacity
Patient/Services Not Eligible
Not My Decision/Company Policy
Miscellaneous Other Reasons/None Given
Medically Underserved (No Insurance)
Low Compensation
Concerned About Fraud Issues
Cash Only
Billing Requirements
4521,250
1,082471
7301,105
1516,165
112167
798
Figure 20: 2019-20 Reasons Why Physicians Do Not Accept Medicaidn = 12,483

-24-
The percentage of Florida physicians who reported accepting new patients with Medicaid was
87.8% (see Figure 21). Compared to the 2017–18 cohort, approximately 25% more physicians
are accepting new patients with Medicaid (62.5% vs. 87.8%).
The most common reason given for not accepting new patients with Medicaid was “Low
“Compensation” (36.1%) (see Figure 22).
Yes33,089
No4,588
Figure 21: 2019-20 Physicians Accepting New Patients with Medicaid n = 37,677
87.8%12.2%
Works for Federal Government
Too Much Paperwork
Practice at Full Capacity
Patient/Services Not Eligible
Not My Decision/Company Policy
Miscellaneous Other Reasons/None Given
Medically Underserved (No Insurance)
Low Compensation
Concerned About Fraud Issues
Cash Only
Billing Requirements
0% 5% 10% 15% 20% 25% 30% 35% 40%
310
234
710
163
218
795
73
1,559
33
34
184
Figure 22: 2019-20 Reasons Why Physicians Who Have Medicaid Patients Do Not Accept New Patients with Medicaid
n = 46,559

-25-
Of the physicians who see patients on Medicaid, when asked if they limit their practice in any
way for patients on Medicaid, the majority (90.6%) stated they do not. For the small percentage
who reported they limit their practice, the two main reasons were “Limit number of new Medicaid
patients” (52.3%) and “Other” (45.1%). The five most common reasons physicians chose
“Other” were:
• “Limited to Medicaid as secondary insurance”
• “Limited to certain Medicaid HMO plans”
• “Limited to specific services”
• “Limited to fee-for-service Medicaid”
• “Limited to referrals from ER or other physicians”

-26-
Physicians Planning to Retire The 2019–20 survey responses showed 8.7% (4,757) of practicing physicians reported they are
planning to retire within the next five years; which is 3.8% fewer physicians than in the last
report cohort (12.5% and 6,633).16 The average age of physicians planning to retire is 68. The
five specialties with the highest number of physicians indicating their intention to retire in the
next five years are:
• Internal Medicine (1,130)
• Family Medicine (660)
• Anesthesiology (411)
• Surgery (361)
• Pediatrics (348)
Figure 23 shows the percentage of physicians, by specialty, who are planning to retire in the
next five years. Proctology has the highest percentage at 25%, and physical medicine and
rehabilitation has the lowest at 7.2%.
16 Appendix E shows the counties in which these physicians are currently located.
0% 10% 20% 30%
UrologySurgery
RadiologyPsychiatryProctology
Preventive MedicinePhysical Medicine & Rehabilitation
PediatricsPathology
OtolaryngologyOrthopedic Medicine
OphthalmologyObstetrics & Gynecology
Nuclear MedicineNeurology
Medical GeneticsInternal MedicineFamily Medicine
Emergency MedicineDermatology
Anesthesiology
4 16.3%361 11.9%
243 13.3%228 15.7%
1 25.0%33 23.3%
33 7.2%348 10.8%
92 16.4%39 11.1%117 12.3%110 12.1%
226 10.3%7 18.2%
103 11.0%4 7.3%
1,130 11.0%660 14.2%
281 11.6%81 12.8%
411 15.2%
Figure 23: 2019-20 Percentage of Physicians in Each Specialty Planning to Retire in the Next Five Years

-27-
Physicians Planning to Relocate In the 2019–20 survey cohort, approximately 5.0% (2,526) of physicians responded that they
plan to relocate out of Florida in the next five years. As shown in Figure 24, the top three
reasons for relocating are:
• “Family” (31.8%)
• “Financial” (22.4%)
• “Looking for a Change” (17.9%)
Of the 2,526 physicians indicating their intention to relocate out of state in the next five years,
2,445 also specified their specialty. The four specialties with the highest reported percentages
of those planning to move are:
• Internal Medicine (23.2%)
• Family Medicine (13.1%)
• Emergency Medicine (11.5%)
• Anesthesiology (8.7%)
Family804
Financial566
Looking for a Change453
Other391
Liability Exposure198
Did Not Answer69
Education/Training in Another State45
Figure 24: 2019-20 Physician Relocation Reasonsn = 2,526
31.8%
22.4%
17.9%
15.5%
7.8%
1.8%
2.7%

-28-
Physicians were asked a question about whether or not they had relocated to Florida in the last
five years; 18.1% reported they had. Of these, just over half stated it was for employment
opportunities or employment after finishing their education, as shown in Figure 25.
Employment/Education6,268
Family 4,185
Compensation 799
Weather243
Quality of Life/Lifestyle…
Other83
Figure 25: 2019-20 Reasons Physicians Relocated to Floridan = 11,766
53.2%
35.6%
6.8%
0.7%
1.6%
2.1%

-29-
Telemedicine Of the physicians who took the survey, 22.2% reported using telemedicine in their practice.
Figure 26 shows the different types of telemedicine delivery systems used, with direct telephone
contact with patients as the most common method.
0 500 1,000 1,500 2,000 2,500 3,000 3,500
Store and forward
Remote patient monitoring
Other
Live, interactive video conferencing: receiving site
Live, interactive video conferencing: presenting site
Direct to patient: videoconferencing
Direct to patient: telephonic only
4.8%
6.5%
9.6%
12.2%
17.0%
24.5%
25.4%
Figure 26: 2019-20 Telemedicine Delivery Systemsn = 12,130
-30-
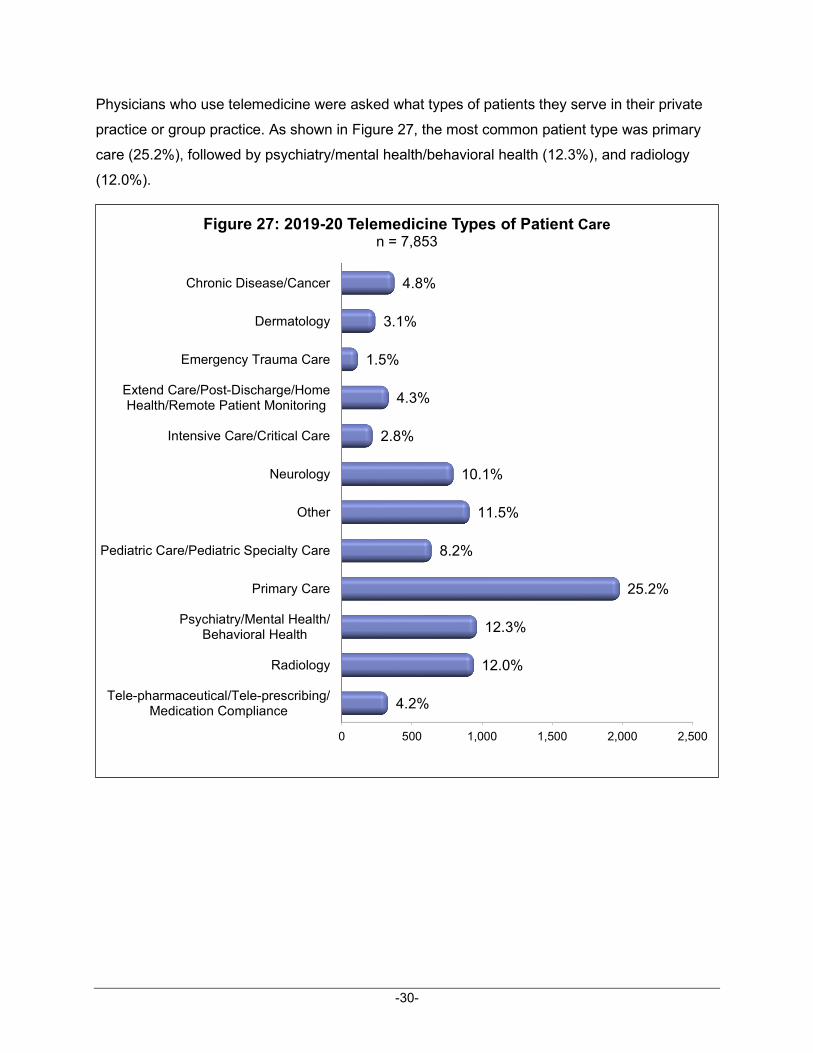
Physicians who use telemedicine were asked what types of patients they serve in their private
practice or group practice. As shown in Figure 27, the most common patient type was primary
care (25.2%), followed by psychiatry/mental health/behavioral health (12.3%), and radiology
(12.0%).
0 500 1,000 1,500 2,000 2,500
Tele-pharmaceutical/Tele-prescribing/Medication Compliance
Radiology
Psychiatry/Mental Health/Behavioral Health
Primary Care
Pediatric Care/Pediatric Specialty Care
Other
Neurology
Intensive Care/Critical Care
Extend Care/Post-Discharge/HomeHealth/Remote Patient Monitoring
Emergency Trauma Care
Dermatology
Chronic Disease/Cancer
4.2%
12.0%
12.3%
25.2%
8.2%
11.5%
10.1%
2.8%
4.3%
1.5%
3.1%
4.8%
Figure 27: 2019-20 Telemedicine Types of Patient Caren = 7,853

-31-
Critical Care Medicine Specialty Question There were 597 physicians who reported their primary specialty was critical care medicine; 430
(or 72%) responded to the specialty question. Physicians were asked to indicate the setting
where they cared for patients—intensive care, trauma, or burn units (they could select more
than one). Just over 80% see patients in the ICU, as shown in Figure 28.
Since physicians could select more than one type of critical care medicine setting, the location
information provided by each physician was analyzed to see where each specific physician sees
patients. Of the 423 physicians who responded, 422 (99.8%) see patients in an ICU. This is
either the only location where they see patients or in combination with other locations, as shown
in Figure 29.
Figure 29: Category of Patients by Location Selections
Patient Location Number of Physicians Percentage of Physicians
ICU Only 354 83.7% ICU & Trauma Unit 43 10.2% Burn Unit, ICU, and Trauma Unit 18 4.3% Burn Unit & ICU 7 1.7% Trauma Unit Only 1 0.2% TOTAL 423 100.0%
Burn Unit25
ICU422
Trauma Unit62
Figure 28: 2019-20 Critical Care Physicians by Critical Care Medicine Settingn = 509
82.9%
12.2% 4.9%

-32-
Emergency Medicine Specialty Question There were 3,115 physicians who reported their primary specialty was emergency medicine;
3,108 (99.8%) responded to the specialty question. Physicians were asked to indicate all
categories of patients they see (they could select more than one patient category). The
responses were equally distributed across six specialties (see Figure 30).
The patient types were analyzed by physicians to determine the distribution across the six
types, and almost three-quarters (72.3% or 2,208) of the physicians saw all six types of patients.
The remaining quarter of the responses were separated into 42 different configurations based
on physician responses. Most of these configurations represent less than 1% of the total.
0
500
1,000
1,500
2,000
2,500
3,000
Adult GeneralOrthopedics
OB/GYN Pediatrics PsychiatricCare
Trauma
18.2%16.3% 16.2% 16.5% 16.3% 16.5%
Figure 30: 2019-20 Emergency Medicine Physicians by All Patient Types
n = 16,049

-33-
Obstetrics and Gynecology Specialty Questions There were 2,396 physicians who reported their primary specialty was obstetrics & gynecology
(OB/GYN); 370 (15.4%) responded to the specialty questions.
The first specialty question is “Do you deliver babies?” As shown in Figure 31, 47% of those
who responded reported delivering babies as part of their practice in the 2019–20 cohort.
Figure 32 shows the number of obstetricians in Florida who report performing cesarean sections
(C-sections) within each specified range. Of the 174 obstetricians who reported they deliver
babies, 171 (98.3%) report performing C-sections. Of those 171 obstetricians 91.8% (157)
responded they perform an average of between 1 and 10 C-sections per month.
No196
Yes174
Figure 31: 2019-20 OB/GYNs Who Deliver Babiesn = 370
53%47%
1 - 10 per month157
11 - 20 per month9
21 - 30 per month4
31 or more per month
1
Figure 32: 2019-20 Physician Average Number of C-Sections Performed
n = 171
91.8%5.3%
.6%
2.3%

-34-
The next specialty question is “Are you planning to discontinue obstetric care in the next two
years?” As shown in Figure 33, almost one-quarter of the physicians plan to discontinue
obstetric care in the next two years.
No254
Yes80
Figure 33: 2019-20 OB/GYNs Planning to DiscontinueObstetric Care
n = 334
38.6%
76%
24%

-35-
Figure 34 shows the reasons given by the physicians who reported they were discontinuing
obstetric care. The most frequently selected reason was “Retired,” followed by “Liability
Exposure”, and “Medical Malpractice Litigation.”
23.8%
4.8%
4.8%
19.0%
20.6%
6.3%
6.3%
14.3%
0 5 10 15 20
Retiring/Retired
Private HealthPlan Reimbursement Rates
Planning To Move Out Of State
Medical Malpractice Litigation
Liability Exposure
Government Reimbursement Rates
Do Not Maintain AFull-Time Residence In Florida
Cost of Professional Insurance
Figure 34: 2019-20 Reasons Why Physicians are Discontinuing Obstetric Care
n = 63
-36-
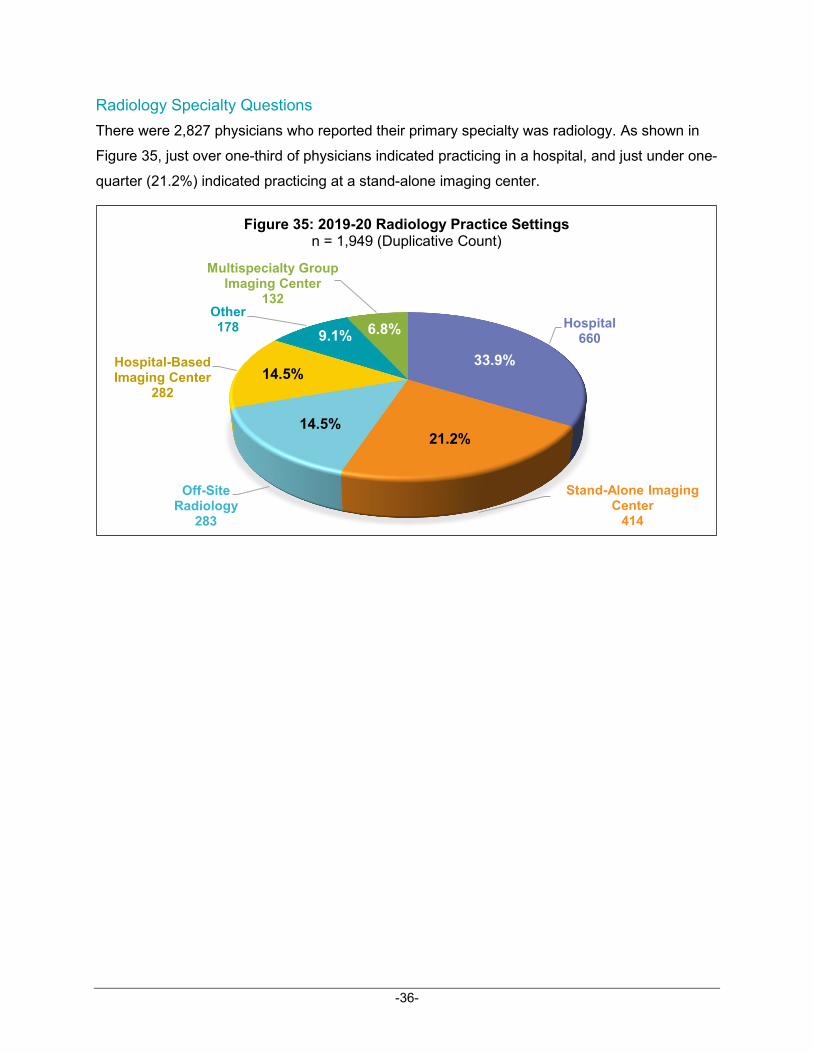
Radiology Specialty Questions There were 2,827 physicians who reported their primary specialty was radiology. As shown in
Figure 35, just over one-third of physicians indicated practicing in a hospital, and just under one-
quarter (21.2%) indicated practicing at a stand-alone imaging center.
Hospital660
Stand-Alone Imaging Center
414
Off-Site Radiology
283
Hospital-Based Imaging Center
282
Other178
Multispecialty Group Imaging Center
132
Figure 35: 2019-20 Radiology Practice Settingsn = 1,949 (Duplicative Count)
33.9%9.1% 6.8%
21.2%14.5%
14.5%

-37-
Radiologists selected all the different types of patients they see. Figure 36 shows the patient
types and percentages based on the physicians who responded. Of these physicians, 39.5%
reported they saw general radiology patients, 28.4% neuroradiology patients, and 27.2% GI
radiology patients.
0 200 400 600 800 1,000
Pediatric Radiology
Nuclear Medicine
Neuroradiology
Musculoskeletal Radiology
Mammography
Interventional Radiology
GU Radiology
GI Radiology
General Radiology
Cardiothoracic Radiology
21.2%
21.1%
28.4%
24.8%
21.7%
15.7%
27.0%
27.2%
39.5%
20.5%
Figure 36: 2019-20 Radiology Patient Typesn = 5,224 (Duplicative Count)

-38-
As shown in Figure 37, in four of the five questions, over half of the physicians who indicated
mammography as part of their practice reported they perform the specified procedure.
0% 10% 20% 30% 40% 50% 60% 70% 80% 90% 100%
Perform ultrasound & stereotacticguided core biopsies?
Read MRI guided core biopsies?
Read breast MRIs?
Read diagnostic mammogramsand sonograms?
Read screening mammograms?
167
287
210
59
79
288
163
246
399
377
Figure 37: 2019-20 Mammography and Related Radiological Procedures
Does Not Perform This Procedure Performs This Procedure
If you indicated that mammography is part of your practice (n=458), do you:
n = 456
n = 455
n = 450
n = 456
n = 458

-39-
Physicians Not Providing Direct Patient Care in Florida A total of 19,643 physicians are licensed and responded to the survey, but they are not
providing direct patient care in Florida. This represents 26% of the physicians who renewed
their licenses in the 2019–20 cohort.17 Understanding the reasons physicians did not provide
direct patient care in Florida in the last 12 months is useful when considering physician
attraction and retention initiatives. As shown in Figure 38, 31.6% of physicians responded with “I
am licensed and actively practicing in another state” as the main reason they have a Florida
license, but do not practice medicine in Florida.
17 See physician definitions on page 2.
0 1,000 2,000 3,000 4,000 5,000 6,000
I am licensed and actively practicing in anotherstate
I don’t currently reside in Floridabut I’m planning to move to Florida
I don’t reside in Florida
Liability Exposure
Malpractice Insurance Rates
Medicare/Medicaid Reimbursement Rates
My primary role is in administration,academic, or another non-patient care activity
Never practiced medicine in Florida
Private Health Plan Reimbursement Rates
Retired
31.6%
10.1%
23.9%
0.6%
0.5%
0.1%
8.7%
13.8%
0.1%
10.6%
Figure 38: 2019-20 Why Licensed Physicians Are Not Providing Direct Patient Care
n = 18,023

-40-
Department Programs to Support Physician Workforce Development The Department administers three programs that support the physician workforce in Florida: the
State Primary Care Office, the Office of Rural Health, and the Volunteer Health Care Provider
Program.
The State Primary Care Office The goal of the State Primary Care Office is to attract and retain physicians to work in Health
Professional Shortage Areas (HPSAs). Florida has 397 HPSAs: 134 are primary care, 57 are
mental health, 109 are dental, and 97 are at 38 of the state correctional institutions. (Of the
HPSAs in state correctional institutions, 33 are primary care, 31 are mental health, and 33 are
dental.) As of July 20, 2020, there are 672 approved National Health Service Corps (NHSC)
sites, with 256 of those sites having program participants. There are 501 participants in NHSC
programs: 83 physicians (16.5%) who participate in the NHSC loan repayment program in
medically underserved areas in Florida, and 20 physicians who are NHSC Scholars. Since
2012, only six physician participants in the NHSC have provided their service in Florida and
subsequently moved out of state. There have been 29 physicians who have provided their
service out of state and have subsequently moved into Florida. Of the 211 physician participants
since 2012, only 5.7% (12) are currently working in a rural county.18 Of these 12 physicians
practicing in a rural county:
• There are 75% who are allopathic and 25% are osteopathic.
• There are 84% who are at the same site as when they were participating, 8% are in the same census tract and 8% have moved to a different county.
• There are 42% who are in a Federally Qualified Health Center (FQHC), 25% are in a Certified Rural Health Clinic (RHC), 17% are in a Health Department, 8% are in a correctional facility, and 8% are in a private practice.
Since the inception of the State Conrad 30 Waiver Program in 1994, more than 80%, or nearly
500 physicians, continue to practice in Florida. In addition, approximately 131 National Interest
Waiver foreign physicians practice in Florida; these physicians are required to practice in
underserved areas for five years.
The Office of Rural Health The Department’s Office of Rural Health provides statewide assistance on rural health issues
and assists in developing and sustaining systems of care in rural communities. The Office
operates the National Rural Recruitment and Retention Network (3RNet) for the state of Florida.
18 These counties are Bradford, Columbia (2), DeSoto, Franklin, Gadsden, Gilchrist, Hardee, Levy (2), Suwannee
and Washington.

-41-
3RNet is a national, federally supported web-based program that assists states in matching
health professionals with available practice, or job opportunities, in both urban and rural Health
Professional Shortage Areas (HPSAs). Facilities utilizing 3RNet include county health
departments, Federally Qualified Health Centers, rural hospitals, behavioral health centers, and
rural health clinics. From January 1, 2020 through June 30, 2020, there were 3,069 location
views and 3,705 opportunity views. During the same time period, 3RNet had 732 active
candidates and 55 jobs added or updated in Florida.
The Office of Rural Health also supports Project ECHO in Florida. Project ECHO (Extension for
Community Health Care Outcomes) is a guided practice model that increases workforce
capacity to provide best-practice specialty care and reduce health disparities. Project ECHO is
designed around case-based learning and mentorship. Sessions are led by expert teams using
interactive videoconferencing to conduct virtual clinics with community providers. With Project
ECHO, primary care doctors, nurses, and other clinicians learn to provide specialty care to
patients in their own communities. Florida’s Project ECHO hub hosted its first session, focused
on palliative care, during the fall of 2019. In 2020, the Office supported six Project ECHO
sessions on developing a rural EMS community paramedicine program. Visit
https://www.floridaruralhealth.org/rural-ems-project-echo for more information.
The Volunteer Health Care Provider Program The Volunteer Health Care Provider Program improves access to medical care for uninsured
and underserved low-income residents by allowing licensed health care professionals to
become agents of the state. In exchange for the professional services they donate to financially
eligible clients referred by the Department’s agents and employees, participating medical
professionals are protected by state sovereign immunity. There are currently 12,994 health care
professionals serving in the Volunteer Health Care Provider Program.

-42-
Physician Workforce Advisory Council 2019 Recommendations Ongoing Recommendations
1. Develop student diversity pipeline best practices, based on successful measures in practice throughout the state and nation, for use as a resource by Florida medical schools when implementing, improving, or measuring the impact of their pipeline programs. In addition, expand and collaborate with university pre-med and
medical sciences programs as well as high school medical magnet programs throughout
the state. Florida’s nine medical schools have provided feedback about their pipeline
programs to the Department and the Physician Workforce Advisory Council. The 2017
Medical School Pipeline report is located on the Physician Workforce Web page at
www.FloridaHealth.gov.
2. Collaborate with the Council of Florida Medical School Deans to develop and maintain a comprehensive database of current Graduate Medical Education (GME) residency positions in Florida with the goal of describing the current and projected areas of need that can be addressed by creating or expanding GME programs. The Council of Florida Medical School Deans formed the GME Working
Group in 2016 to collaborate on GME-related issues across the state, including
workforce issues, physician wellness, research, and faculty development. The plan is to
continue with this effort, and to add the data from the National Resident Matching
Program (NRMP) regarding categorical positions in the residency match process each
year. The Working Group determined that in 2019-20 there were 6,713 residency slots in
the state, which is 879 more than in 2016-17.
3. Enhance collaboration with the Health Resources and Services Administration (HRSA) through continued promotion of the National Health Service Corps (NHSC) Loan Repayment Program via partnerships with the Florida Association of Community Health Centers, rural hospital outpatient practices, federally qualified health centers, community health centers, and the colleges of medicine. The Department continually provides ongoing technical assistance to clinicians and
practice sites interested in the program. The Primary Care Office works collaboratively
with the Florida Association of Community Health Centers, the Office of Rural Health,
and the Volunteer Health Care Provider Program to promote the National Health Service
Corps to eligible clinics and clinicians. The Primary Care Office monitors the quarterly
field strength report provided by the Health Resources and Services Administration to

-43-
determine the current status of the NHSC in Florida; and to identify participants in their
final year of service and send email reminders to them about recertification processes.
The Primary Care Office also sends email reminders to NHSC sites about upcoming
recertification application time frames. These email reminders support certification
sustainability to both clinician participants and clinic sites. The Primary Care Office
partners with the Office of Rural Health to inform and encourage rural health clinics and
rural hospitals with primary care outpatient services about the recruitment and retention
benefits of the National Health Service Corps program. The Primary Care Office
provides technical assistance during each NHSC loan repayment and site designation
application cycle. The Primary Care Office works collaboratively with the federal regional
coordinators during application periods and provides guidance and support to individual
applicants to achieve successful site designation and loan repayment awards. There are
over 670 National Health Service Corps sites in Florida. Currently there are 103 primary
care physicians serving through the loan repayment program.
4. Evaluate models which forecast physician and subspecialty needs in Florida. Seek assistance with finding, evaluating, and testing simulation models which will help
predict Florida physician workforce needs in the future, and thus guide policy
recommendations to the Legislature. This effort should focus on how to retain family
medicine and internal medicine residency graduates in the state of Florida once they
have completed residency. The Department could implement this recommendation by
simply contracting for Second Edition of the IHS Florida Physicians Workforce Supply &
Demand.
5. Periodically update the Council’s Strategic Plan. Remove accomplished objectives,
update objectives in process, and evaluate need for new objectives based upon the
Council’s charter and the needs of the citizens of Florida.
6. Determine how to best review the impact of the new GME programs. Develop
metrics to assess the impact of the new GME programs on the physician workforce.
7. Develop steps the Department can take to help with the recruitment and retention of the best residents and fellows for Florida’s training programs and impact metrics should be created. Develop common messaging to let allopathic and
osteopathic medical students know about training opportunities in Florida and why they
should have their training in Florida.

-44-
8. The Council recommends the Florida Board of Medicine and Board of Osteopathic Medicine accept the revised questions regarding substance abuse and mental health into the original licensure process. The revised questions will address the
issues regarding mental health among physicians while also allowing more physicians to
practice medicine in Florida.
9. The Council recommends the Florida Legislature fund a state-level student loan reimbursement program at $10 million per year to assist physicians who can fill
specific gaps in location and subspecialty in Florida. In addition, seek funding partners from the private sector, such as HMOs, pharmaceutical companies, and hospitals. Benefits in the form of tax savings or similar benefits as extended to military
members would be attractive. Physicians often leave the state once loans are paid off.
Tax benefits extended to physicians in HPSAs would promote longevity and retention.
New Recommendations
10. Florida should seek resident physician specialty board pass-rate by hospital or sponsoring institution. These data will allow for comparisons between GME programs
and exchange of best practices with the goal of having the best GME residency
programs in the U.S.
11. Physicians in practice and health care providers (including graduate and undergraduate medical educators) in Florida should complete implicit bias training to 1) assist with culturally responsive workforce development, 2) create a more sustainable work environment, and 3) foster a high-quality health care provision environment for our diverse populations to address inequalities and disparities.
12. Advocate for an increase in J-1 visa waivers.

-45-
Conclusion The Florida Department of Health renews its commitment to review and assess current and
future physician workforce needs in Florida. Physician workforce assessment and planning in
this state has resulted in new information for policymakers on clinical practice, geographic
location and scope of practice for Florida physicians. The continuing refinement, evaluation, and
reporting of this information will assist in the state’s efforts to meet current and future physician
workforce needs.
Key information from this report for policy consideration includes:
• During the last ten-year period, the number of practicing physicians increased just over
26%, from 43,188 as reported in 2010–11 to 54,677 in 2019–20. During this same time,
the population of Florida increased over 15%, from 18.8 million to 21.9 million.
• Physicians are generally concentrated in populous counties and within large, urban
population centers. Physicians working in rural areas are more likely to be primary care
providers. Survey results indicated that 98% of physicians work in urban counties while
2% work in Florida’s 30 rural counties. (See Appendix A and Appendix B for details.)
• Gender and ethnic diversity of Florida’s physician workforce has increased since
2010–11. The percentage of female physicians has increased from 24.6% in 2010–11 to
30.6% in 2019–20, and the percentage of Hispanic, Asian, African American and Native
American physicians has increased 6.2%.
• Physicians continue to specialize, with more physicians practicing in specialties than in
primary care. However, the percentage of primary care physicians in 2019–20 (33.7%)
has increased slightly from what it was in 2012–13 (33.4%).
• Each year physicians report if they are planning to retire. The percentage of physicians
who reported that they are planning to retire within the next five years was growing with
13.2% planning to retire in 2012–13 increasing to 16.6% in 2017–18. However, in 2018–
19 the number of those planning to retire decreased to 12.5% and decreased even more
in 2019-20 to 8.7%.

2020 Physician Workforce Annual Report November 2020
-46-
Appendix A: Physician Workforce per Capita by County, 2019–20 This map illustrates a per capita distribution of practicing physicians at the county level. Miami-
Dade, Broward, and Palm Beach Counties combined have almost one-third (31.7%) of all
practicing physicians in Florida. Miami-Dade County alone has 14.3% of all practicing
physicians. Even though these are the three most populous counties, when looking at the per
capita distribution of physicians shown on the map below, the counties of Alachua (64),
Seminole (46), Sarasota (43.6), Duval (34.4), and Escambia (31.9) have the highest per capita
rate. There are 23 counties (34.3%) whose per capita rate is less than 10.
Physicians Per 10,000 Population
1 – 10 10.1 – 25 25.1 – 50 >50

2020 Physician Workforce Annual Report November 2020
-47-
Appendix B: Change in Practicing Physicians by County Figures B-1 and B-2 show a history of practicing physicians by county for the last seven report
cohorts.
Figure B-1: Number of Practicing Physicians by County by Year
County 2013–14 2014–15 2015–16 2016–17 2017–18 2018–19 2019–20 Alachua 1,370 1,426 1,443 1,429 1,615 1,666 1,707 Baker* 42 38 37 39 46 40 37 Bay 380 380 395 400 424 418 420 Bradford* 23 21 24 25 21 20 26 Brevard 1,240 1,231 1,260 1,254 1,333 1,377 1,371 Broward 4,209 4,269 4,346 4,342 4,767 4,878 5,008 Calhoun* 9 9 8 8 11 10 10 Charlotte 348 338 348 332 361 376 399 Citrus 238 249 245 225 258 259 259 Clay 283 285 315 322 349 368 340 Collier 823 819 829 835 954 998 1,069 Columbia* 136 139 144 137 142 143 142 Desoto* 31 31 27 25 25 26 28 Dixie* 10 12 11 15 13 5 8 Duval 2,707 2,762 2,828 2,851 3,093 3,199 3,343 Escambia 841 878 885 881 952 981 1,030 Flagler 121 129 139 139 150 144 142 Franklin 15 14 10 8 12 13 15 Gadsden 40 40 39 35 34 29 35 Gilchrist 8 8 5 7 6 5 4 Glades* 8 7 7 8 6 5 3 Gulf 16 18 15 13 19 21 23 Hamilton* 7 7 5 4 3 6 9 Hardee* 13 13 14 12 9 10 10 Hendry* 23 24 25 25 33 30 29 Hernando 300 300 313 324 334 325 349 Highlands* 190 197 195 189 195 194 192 Hillsborough 3,356 3,470 3,611 3,696 4,041 4,167 4,362 Holmes* 16 16 13 11 16 16 15 Indian River 369 371 379 370 425 430 447 Jackson* 60 57 52 47 52 49 55 Jefferson* 6 8 8 6 7 5 7 Lafayette* 4 4 2 2 3 1 1 Lake 618 642 684 671 704 705 734 Lee 1,254 1,275 1,336 1,332 1,483 1,506 1,571 Leon 661 632 656 667 750 764 782

2020 Physician Workforce Annual Report November 2020
-48-
County 2013–14 2014–15 2015–16 2016–17 2017–18 2018–19 2019–20 Levy* 15 15 15 15 14 13 15 Liberty* 0 1 2 1 2 2 2 Madison* 10 8 9 8 9 10 7 Manatee 592 591 611 631 689 693 717 Marion 593 618 601 598 680 684 689 Martin 358 367 388 398 443 443 469 Miami-Dade 6,535 6,648 6,697 6,726 7,313 7,407 7,583 Monroe* 171 180 180 181 187 186 183 Nassau 85 83 80 76 76 87 81 Okaloosa 412 414 419 430 460 454 463 Okeechobee* 57 56 49 58 61 55 61 Orange 2,808 2,844 2,977 3,079 3,473 3,660 3,924 Osceola 454 477 515 530 650 625 655 Palm Beach 3,710 3,804 3,919 3,901 4,262 4,241 4,227 Pasco 820 824 828 835 923 922 958 Pinellas 2,555 2,568 2,620 2,613 2,874 2,878 2,970 Polk 941 945 975 1,001 1,121 1,090 1,092 Putnam 107 97 84 88 98 97 91 Santa Rosa 174 165 172 171 193 195 201 Sarasota 1,074 1,092 1,119 1,126 1,267 1,284 1,347 Seminole 666 660 687 712 774 793 827 St. Johns 327 339 347 338 385 400 424 St. Lucie 414 426 428 410 447 474 507 Sumter 123 126 148 161 188 187 183 Suwannee* 22 17 22 28 25 25 21 Taylor* 16 17 20 22 18 16 20 Union* 14 13 22 25 26 26 23 Volusia 1,015 1,051 1,049 1,040 1,140 1,122 1,158 Wakulla* 9 10 9 8 9 7 11 Walton* 87 91 89 89 94 92 99 Washington* 18 19 12 10 14 13 12
State Totals 43,957 44,685 45,746 45,995 50,561 51,370 53,00219
* Rural Counties per 381.0406, Florida Statutes
19 This total does not include the 1,314 physicians who did not report their county, the 35 physicians whose county
was listed as “unknown” and the 326 physicians who reported their county as “out of state”.

2020 Physician Workforce Annual Report November 2020
-49-
Figure B-2: Percentage Increase or Decrease by County
County 2013-14 to 2014-15
2014-15 to 2015-16
2015-16 to 2016-17
2016-17 to 2017-18
2017-18 to 2018-19
2018-19 to 2019-20
2013-14 to 2019-20
Alachua 4.1% 1.2% -1.0% 13.0% 3.2% 2.5% 24.6% Baker -9.5% -2.6% 5.4% 17.9% -13.0% -7.5% -11.9% Bay 0.0% 3.9% 1.3% 6.0% -1.4% 0.5% 10.5% Bradford -8.7% 14.3% 4.2% -16.0% -4.8% 30.0% 13.0% Brevard -0.7% 2.4% -0.5% 6.3% 3.3% -0.4% 10.6% Broward 1.4% 1.8% -0.1% 9.8% 2.3% 2.7% 19.0% Calhoun 0.0% -11.1% 0.0% 37.5% -9.1% 0.0% 11.1% Charlotte -2.9% 3.0% -4.6% 8.7% 4.2% 6.1% 14.7% Citrus 4.6% -1.6% -8.2% 14.7% 0.4% 0.0% 8.8% Clay 0.7% 10.5% 2.2% 8.4% 5.4% -7.6% 20.1% Collier -0.5% 1.2% 0.7% 14.3% 4.6% 7.1% 29.9% Columbia 2.2% 3.6% -4.9% 3.6% 0.7% -0.7% 4.4% Desoto 0.0% -12.9% -7.4% 0.0% 4.0% 7.7% -9.7% Dixie 20.0% -8.3% 36.4% -13.3% -61.5% 60.0% -20.0% Duval 2.0% 2.4% 0.8% 8.5% 3.4% 4.5% 23.5% Escambia 4.4% 0.8% -0.5% 8.1% 3.0% 5.0% 22.5% Flagler 6.6% 7.8% 0.0% 7.9% -4.0% -1.4% 17.4% Franklin -6.7% -28.6% -20.0% 50.0% 8.3% 15.4% 0.0% Gadsden 0.0% -2.5% -10.3% -2.9% -14.7% 20.7% -12.5% Gilchrist 0.0% -37.5% 40.0% -14.3% -16.7% -20.0% -50.0% Glades -12.5% 0.0% 14.3% -25.0% -16.7% -40.0% -62.5% Gulf 12.5% -16.7% -13.3% 46.2% 10.5% 9.5% 43.8% Hamilton 0.0% -28.6% -20.0% -25.0% 100.0% 50.0% 28.6% Hardee 0.0% 7.7% -14.3% -25.0% 11.1% 0.0% -23.1% Hendry 4.3% 4.2% 0.0% 32.0% -9.1% -3.3% 26.1% Hernando 0.0% 4.3% 3.5% 3.1% -2.7% 7.4% 16.3% Highlands 3.7% -1.0% -3.1% 3.2% -0.5% -1.0% 1.1% Hillsborough 3.4% 4.1% 2.4% 9.3% 3.1% 4.7% 30.0% Holmes 0.0% -18.8% -15.4% 45.5% 0.0% -6.3% -6.3% Indian River 0.5% 2.2% -2.4% 14.9% 1.2% 4.0% 21.1% Jackson -5.0% -8.8% -9.6% 10.6% -5.8% 12.2% -8.3% Jefferson 33.3% 0.0% -25.0% 16.7% -28.6% 40.0% 16.7% Lafayette 0.0% -50.0% 0.0% 50.0% -66.7% 0.0% -75.0% Lake 3.9% 6.5% -1.9% 4.9% 0.1% 4.1% 18.8% Lee 1.7% 4.8% -0.3% 11.3% 1.6% 4.3% 25.3% Leon -4.4% 3.8% 1.7% 12.4% 1.9% 2.4% 18.3% Levy 0.0% 0.0% 0.0% -6.7% -7.1% 15.4% 0.0% Liberty 100.0% 100.0% -50.0% 100.0% 0.0% 0.0% 200.0% Madison -20.0% 12.5% -11.1% 12.5% 11.1% -30.0% -30.0% Manatee -0.2% 3.4% 3.3% 9.2% 0.6% 3.5% 21.1%

2020 Physician Workforce Annual Report November 2020
-50-
County 2013-14 to 2014-15
2014-15 to 2015-16
2015-16 to 2016-17
2016-17 to 2017-18
2017-18 to 2018-19
2018-19 to 2019-20
2013-14 to 2019-20
Marion 4.2% -2.8% -0.5% 13.7% 0.6% 0.7% 16.2% Martin 2.5% 5.7% 2.6% 11.3% 0.0% 5.9% 31.0% Miami-Dade 1.7% 0.7% 0.4% 8.7% 1.3% 2.4% 16.0% Monroe 5.3% 0.0% 0.6% 3.3% -0.5% -1.6% 7.0% Nassau -2.4% -3.6% -5.0% 0.0% 14.5% -6.9% -4.7% Okaloosa 0.5% 1.2% 2.6% 7.0% -1.3% 2.0% 12.4% Okeechobee -1.8% -12.5% 18.4% 5.2% -9.8% 10.9% 7.0% Orange 1.3% 4.7% 3.4% 12.8% 5.4% 7.2% 39.7% Osceola 5.1% 8.0% 2.9% 22.6% -3.8% 4.8% 44.3% Palm Beach 2.5% 3.0% -0.5% 9.3% -0.5% -0.3% 13.9% Pasco 0.5% 0.5% 0.8% 10.5% -0.1% 3.9% 16.8% Pinellas 0.5% 2.0% -0.3% 10.0% 0.1% 3.2% 16.2% Polk 0.4% 3.2% 2.7% 12.0% -2.8% 0.2% 16.0% Putnam -9.3% -13.4% 4.8% 11.4% -1.0% -6.2% -15.0% Santa Rosa -5.2% 4.2% -0.6% 12.9% 1.0% 3.1% 15.5% Sarasota 1.7% 2.5% 0.6% 12.5% 1.3% 4.9% 25.4% Seminole -0.9% 4.1% 3.6% 8.7% 2.5% 4.3% 24.2% St. Johns 3.7% 2.4% -2.6% 13.9% 3.9% 6.0% 29.7% St. Lucie 2.9% 0.5% -4.2% 9.0% 6.0% 7.0% 22.5% Sumter 2.4% 17.5% 8.8% 16.8% -0.5% -2.1% 48.8% Suwannee -22.7% 29.4% 27.3% -10.7% 0.0% -16.0% -4.5% Taylor 6.3% 17.6% 10.0% -18.2% -11.1% 25.0% 25.0% Union -7.1% 69.2% 13.6% 4.0% 0.0% -11.5% 64.3% Volusia 3.5% -0.2% -0.9% 9.6% -1.6% 3.2% 14.1% Wakulla 11.1% -10.0% -11.1% 12.5% -22.2% 57.1% 22.2% Walton 4.6% -2.2% 0.0% 5.6% -2.1% 7.6% 13.8% Washington 5.6% -36.8% -16.7% 40.0% -7.1% -7.7% -33.3%
Statewide 1.7% 2.4% 0.5% 9.9% 1.6% 3.2% 20.6%

2020 Physician Workforce Annual Report November 2020
-51-
Appendix C: Primary Care Physicians by County, 2019–20 This map illustrates a per capita distribution of practicing primary care physicians at the county
level. The counties with the largest number of physicians per 10,000 population are Seminole
(19.7), Alachua (16.4), Sarasota (12.7), Pinellas (10.1), and Union (10.0).

2020 Physician Workforce Annual Report November 2020
-52-
Appendix D: Specialty Group Counts by County, 2019–20 This table represents a count of physicians by county and specialty.
Specialty Alachua Baker Bay Bradford Brevard Broward Calhoun Charlotte Citrus Clay Anesthesiology 150 0 21 1 92 364 0 21 20 20 Dermatology 23 1 5 0 30 111 0 11 8 6 Emergency Medicine 80 6 36 2 82 298 1 23 10 16 Family Medicine 173 10 53 10 198 617 6 63 55 68 Internal Medicine 442 7 106 5 390 1,350 2 119 76 96 Medical Genetics 7 0 0 0 0 5 0 0 0 0 Neurology 66 0 14 1 38 110 0 8 5 9 Nuclear Medicine 1 0 1 0 2 5 0 1 0 0 Obstetrics & Gynecology 51 1 21 2 57 279 0 9 8 15 Ophthalmology 34 0 4 0 37 125 0 12 8 4 Orthopedic Medicine 24 0 15 0 33 134 0 14 4 6 Otolaryngology 23 0 7 0 18 60 1 3 3 4 Pathology 51 0 5 0 16 78 0 7 4 1 Pediatrics 169 0 27 3 86 398 0 14 6 29 Physical Medicine & Rehabilitation
20 0 2 0 20 74 0 3 2 3
Preventive Medicine 2 0 2 0 16 18 0 0 0 3 Proctology 0 0 0 0 0 1 0 0 0 0 Psychiatry 91 10 19 1 56 188 0 18 9 7 Radiology 107 0 23 1 73 228 0 22 13 6 Surgery 121 1 38 2 81 372 0 38 17 30 Urology 13 1 6 0 13 45 0 4 4 4 TOTAL 1,648 37 405 28 1,338 4,860 10 390 252 327

2020 Physician Workforce Annual Report November 2020
-53-
Specialty Collier Columbia DeSoto Dixie Duval Escambia Flagler Franklin Gadsden Gilchrist Anesthesiology 46 8 3 0 244 78 12 1 1 0 Dermatology 29 1 0 0 38 15 1 0 0 0 Emergency Medicine 72 9 2 0 254 74 8 1 1 0 Family Medicine 132 34 3 5 440 127 35 7 12 2 Internal Medicine 326 39 7 1 886 245 44 1 8 0 Medical Genetics 0 0 0 0 6 0 0 0 0 0 Neurology 21 2 0 1 104 20 4 0 0 0 Nuclear Medicine 3 0 0 0 4 0 0 0 0 0 Obstetrics & Gynecology 40 5 0 0 166 57 9 3 0 0 Ophthalmology 34 4 0 0 69 23 4 0 1 0 Orthopedic Medicine 23 2 0 0 72 25 7 0 0 0 Otolaryngology 23 1 0 0 42 19 2 0 0 0 Pathology 16 1 0 0 57 15 0 0 0 0 Pediatrics 58 9 5 0 272 102 2 0 0 1 Physical Medicine & Rehabilitation
18 3 0 0 42 8 2 0 0 0
Preventive Medicine 7 1 0 1 16 10 0 0 1 0 Proctology 0 0 0 0 1 1 0 0 0 0 Psychiatry 42 8 2 0 106 38 1 1 10 0 Radiology 58 6 1 0 191 46 4 0 0 0 Surgery 71 6 2 0 217 86 5 1 1 0 Urology 14 1 0 0 24 14 2 0 0 0 TOTAL 1,033 140 25 8 3,251 1,003 142 15 35 3

2020 Physician Workforce Annual Report November 2020
-54-
Specialty Glades Gulf Hamilton Hardee Hendry Hernando Highlands Hillsborough Holmes Indian River Anesthesiology 0 1 2 0 1 16 10 284 0 29 Dermatology 0 0 0 0 0 7 5 76 0 11 Emergency Medicine 0 4 0 3 2 22 15 231 0 25 Family Medicine 2 8 2 3 9 52 26 475 8 59 Internal Medicine 0 4 1 3 3 130 59 1190 3 136 Medical Genetics 0 0 0 0 0 0 0 6 0 0 Neurology 0 0 0 0 1 6 2 99 0 10 Nuclear Medicine 0 1 0 0 0 0 0 9 0 0 Obstetrics & Gynecology 1 0 0 0 1 17 6 204 0 15 Ophthalmology 0 0 0 0 0 9 4 79 0 17 Orthopedic Medicine 0 0 0 0 0 8 6 82 0 14 Otolaryngology 0 0 0 0 0 3 1 57 0 5 Pathology 0 0 0 0 0 5 4 116 0 9 Pediatrics 0 1 0 1 6 17 9 348 0 26 Physical Medicine & Rehabilitation
0 0 0 0 0 7 1 63 0 7
Preventive Medicine 0 1 1 0 0 2 1 27 0 2 Proctology 0 0 0 0 0 0 0 0 0 0 Psychiatry 0 0 1 0 0 11 4 205 1 15 Radiology 0 0 1 0 2 11 12 251 1 22 Surgery 0 3 1 0 2 18 14 366 2 24 Urology 0 0 0 0 0 4 4 28 0 5 TOTAL 3 23 9 10 27 345 183 4,196 15 431

2020 Physician Workforce Annual Report November 2020
-55-
Specialty Jackson Jefferson Lafayette Lake Lee Leon Levy Liberty Madison Manatee Anesthesiology 0 0 0 40 87 46 0 0 0 35 Dermatology 0 0 0 11 34 17 0 0 0 14 Emergency Medicine 3 0 0 38 83 41 1 0 0 48 Family Medicine 14 3 0 122 237 147 7 2 5 137 Internal Medicine 15 1 1 240 429 177 4 0 1 201 Medical Genetics 0 0 0 0 0 1 0 0 0 0 Neurology 0 0 0 12 57 13 0 0 0 15 Nuclear Medicine 0 0 0 0 1 0 0 0 0 0 Obstetrics & Gynecology 1 0 0 23 68 33 0 0 0 33 Ophthalmology 3 0 0 23 57 19 0 0 0 24 Orthopedic Medicine 0 0 0 23 40 16 0 0 0 18 Otolaryngology 1 0 0 8 19 11 0 0 0 10 Pathology 0 0 0 21 26 12 1 0 0 7 Pediatrics 4 0 0 39 122 47 2 0 0 40 Physical Medicine & Rehabilitation 0 0 0 9 22 3 0 0 0 10 Preventive Medicine 1 0 0 4 1 3 0 0 0 1 Proctology 0 0 0 0 0 0 0 0 0 0 Psychiatry 3 1 0 21 59 46 1 0 1 29 Radiology 6 1 0 33 68 52 0 0 0 21 Surgery 3 1 0 29 107 57 0 0 0 48 Urology 1 0 0 9 13 14 0 0 0 7 TOTAL 55 7 1 705 1,530 755 16 2 7 698

2020 Physician Workforce Annual Report November 2020
-56-
Specialty Marion Martin Miami-Dade Monroe Nassau Okaloosa Okeechobee Orange Osceola Palm Beach Anesthesiology 45 32 457 11 4 44 3 223 26 269 Dermatology 16 13 133 4 1 6 2 40 6 147 Emergency Medicine 38 29 335 26 9 45 3 238 64 192 Family Medicine 123 52 1010 29 19 74 11 569 146 401 Internal Medicine 218 145 2058 47 24 99 16 947 165 1,233 Medical Genetics 0 0 12 0 0 0 0 6 0 1 Neurology 9 17 196 5 2 7 1 66 9 99 Nuclear Medicine 0 0 12 0 0 0 0 4 0 2 Obstetrics & Gynecology 14 12 340 7 2 21 2 225 38 201 Ophthalmology 20 11 182 1 1 14 1 59 4 139 Orthopedic Medicine 10 12 151 9 2 19 1 92 10 139 Otolaryngology 5 5 86 2 3 7 0 41 6 72 Pathology 5 6 105 2 0 2 2 53 4 58 Pediatrics 34 14 777 9 4 24 8 493 47 305 Physical Medicine & Rehabilitation
11 5 66 2 1 2 0 46 6 46
Preventive Medicine 6 2 34 0 1 6 1 22 10 29 Proctology 0 0 1 0 0 0 0 0 0 0 Psychiatry 20 19 389 7 3 18 1 146 22 180 Radiology 29 33 360 2 2 14 2 214 12 203 Surgery 52 34 556 9 1 48 3 274 52 297 Urology 8 8 70 5 1 3 1 32 5 44 TOTAL 663 449 7,330 177 80 453 58 3,790 632 4,057

2020 Physician Workforce Annual Report November 2020
-57-
Specialty Pasco Pinellas Polk Putnam St. Johns St. Lucie Santa Rosa Sarasota Seminole Sumter Anesthesiology 51 170 64 1 19 26 11 69 36 2 Dermatology 14 57 19 0 12 7 2 43 19 8 Emergency Medicine 73 170 82 7 25 42 12 81 58 5 Family Medicine 154 451 189 22 109 84 66 172 176 44 Internal Medicine 327 856 308 27 104 121 38 408 205 65 Medical Genetics 0 2 1 0 1 0 0 0 0 0 Neurology 16 62 22 0 7 16 5 33 16 5 Nuclear Medicine 0 6 1 0 0 0 0 0 0 0 Obstetrics & Gynecology 29 106 46 3 12 22 7 56 44 6 Ophthalmology 25 89 33 1 11 8 1 44 20 2 Orthopedic Medicine 22 71 23 2 10 17 13 46 7 4 Otolaryngology 9 39 13 1 6 8 1 21 6 2 Pathology 7 45 13 1 5 8 0 11 3 1 Pediatrics 52 236 66 9 29 41 18 48 75 1 Physical Medicine & Rehabilitation
11 40 6 1 5 7 6 26 13 1
Preventive Medicine 0 13 3 0 0 0 1 5 7 1 Proctology 0 0 0 0 0 0 0 0 0 0 Psychiatry 35 110 45 1 16 20 3 57 27 3 Radiology 31 130 54 6 20 24 5 65 28 18 Surgery 66 185 67 4 27 38 10 105 53 5 Urology 11 33 11 0 2 6 0 19 10 3 TOTAL 933 2,871 1,066 86 420 495 199 1,309 803 176

2020 Physician Workforce Annual Report November 2020
-58-
Specialty Suwannee Taylor Union Volusia Wakulla Walton Washington Unknown Out of State TOTAL Anesthesiology 0 1 0 69 0 6 1 5 30 3,308 Dermatology 0 0 0 18 0 3 0 0 15 1,039 Emergency Medicine 1 0 1 74 0 13 0 2 49 3,165 Family Medicine 9 12 12 276 8 20 8 4 102 7,720 Internal Medicine 5 2 4 299 0 21 1 12 114 14,617 Medical Genetics 0 0 0 0 0 0 0 0 1 49 Neurology 0 0 0 22 0 1 0 2 40 1,276 Nuclear Medicine 1 0 0 0 0 0 0 0 1 55 Obstetrics & Gynecology 0 0 0 40 0 7 0 0 13 2,378 Ophthalmology 0 0 0 34 0 0 0 0 11 1,305 Orthopedic Medicine 0 0 0 24 0 5 0 0 13 1,268 Otolaryngology 0 0 0 10 0 2 0 0 7 673 Pathology 0 0 0 17 0 0 0 0 56 856 Pediatrics 3 4 0 47 0 9 0 2 36 4,234 Physical Medicine & Rehabilitation 0 0 0 13 0 0 0 1 8 642
Preventive Medicine 0 0 1 0 0 1 0 0 8 272 Proctology 0 0 0 0 0 0 0 0 0 4 Psychiatry 1 0 5 40 3 3 1 0 32 2,212 Radiology 0 0 0 60 0 3 0 5 179 2,759 Surgery 1 1 0 73 0 3 1 1 45 3,775 Urology 0 0 0 13 0 0 0 0 5 520 TOTAL 21 20 23 1,129 11 97 12 34 765 52,127

2020 Physician Workforce Annual Report November 2020
-59-
Appendix E: Physicians Planning to Retire in the Next Five Years Of the 54,667 physicians providing direct patient care, 8.7% (4,757) said that they were
planning to retire in the next five years. This map illustrates the percentage of practicing
physicians in each county who reported that they are planning to retire.
In the 2018 and 2019 reports, more than 50% of physicians located in Gulf County reported that
they were planning to retire in the next five years. As shown above, Gulf County now has less
than 50% (30.4%), and no counties reported more than 50% of their physicians are planning to
retire in the next five years. In the 2018 and 2019 reports, Liberty County reported no physicians
planning on retiring, but this year exactly 50% reported that they are planning to retire in the
next five years.