state of the service report 2007-08 web viewsection 44 of the public service act 1999 (the act)...
TRANSCRIPT

State of the Service Report 2007-08

Letter of transmittal
The Honourable Kevin Rudd MP Prime Minister Parliament House Canberra ACT 2600
Dear Prime Minister
In accordance with the provisions of section 44 of the Public Service Act 1999 and clause 3.5(2) of the Public Service Commissioner’s Directions, I present to you the component of my annual report reporting on the state of the Australian Public Service for the year 2007–08.
The Australian Public Service Commission will separately publish supporting documents, the State of the Service 2007–08 At a Glance, the State of the Service Employee Survey Results 2007–08 and the Australian Public Service Statistical Bulletin 2007–08.
The Joint Committee of Public Accounts and Audit agreed in 2003 to extend the tabling deadline of the State of the Service component of my annual report to one calendar month after the tabling date for agencies’ annual reports.
Section 34C of the Acts Interpretation Act 1901 requires that you lay a copy of the report before each House of Parliament within 15 sitting days after the day on which you receive the report.
Yours sincerely
Lynelle Briggs
27 November 2008

Preface
Section 44 of the Public Service Act 1999 (the Act) provides that the Australian Public Service Commissioner must provide a report each year to the Agency Minister for presentation to the Parliament. The report must include a report on the state of the Australian Public Service (APS) during the year.
The State of the Service Report 2007–08 details the activities and human resource management practices of APS agencies during the 2007–08 financial year. The report outlines some of the key achievements and contributions agencies have made in assisting the Government during this period to meet its policy objectives and achieve its stated outcomes.
This year’s State of the Service report is the eleventh annual report on the state of the APS that Australian Public Service Commissioners have presented to Parliament. The report has been significantly enhanced since it was commenced in 1998, including by the addition of an annual online agency survey and a representative employee survey with up to six years of data available on key issues. This year’s agency survey included a focus on the impact of the increased efficiency dividend on APS agencies, and these particular findings have been made available to the Joint Committee on Public Accounts and Audit for the purposes of informing their inquiry into the impacts of the dividend on small APS agencies.
The State of the Service report draws on a range of information sources but its main data sources are two State of the Service surveys—one of agencies and the other of employees. The agency survey includes all APS agencies employing at least 20 staff under the Act. All 90 APS agencies, or semi-autonomous parts of agencies, which were invited to participate in the online agency survey in June 2008 completed the survey. These agencies are listed at Appendix 1.
To assist with analysis of the agency survey data, and for comparability with previous years’ data, agencies have again been grouped according to size. Of the 90 responding agencies, 24 were classified as large (>1,000 APS employees), 28 as medium (251–1,000 APS employees) and 38 as small (20–250 APS employees). These size categories are generally consistent with those used by the Australian National Audit Office (ANAO).1 Appendix 1 provides information on agencies’ APS employee numbers.
The second State of the Service survey involved a stratified random sample of 9,078 APS employees from APS agencies with at least 100 APS employees. A total of 5,910 valid responses were received, representing a response rate of 65%—the highest response rate ever achieved. The sample size and number of valid responses allows a range of cross-tabulations to be used with a degree of confidence. Consistent with last year’s report, this year’s draws on factor analysis to interpret employee survey data. Agencies with at least 400 employees, and all members of the Management Advisory Committee are provided with their own individual agency-specific results for internal management purposes.
While the size groupings for large and medium agencies are the same for the agency and employee surveys, it should be noted that for the purposes of the employee survey ‘small’

refers to agencies with between 100 and 250 APS employees. Appendix 2 provides information on the employee and agency survey methodologies.
The Commission engaged the services of ORIMA Research to assist with the design, delivery and statistical outputs of both surveys. When designing the first employee survey the Commission also engaged the services of the Australian Bureau of Statistics to advise on aspects of survey methodology; this advice continues to be used. Assistance in the development and pilot testing of the agency survey was provided by our agency contact officers in a number of agencies, including the Australian Pesticides and Veterinary Medicines Authority, Centrelink, the Department of Climate Change and the Department of Immigration and Citizenship. Assistance with pilot testing of the employee survey was provided by a range of individual APS employees from across a variety of agencies. The Commission is very grateful for this input.
The report has also relied heavily on published reports from parliamentary committees and ANAO. Input has been sought from key coordinating agencies, particularly the Department of Education, Employment and Workplace Relations, the Department of Finance and Deregulation, the Department of the Prime Minister and Cabinet and ANAO—their assistance is gratefully acknowledged. The contributions of the Australian Government Actuary, Australian Government Information Management Office, the Department of Families, Housing, Community Services and Indigenous Affairs, the Department of the House of Representatives and the Department of the Senate were also much appreciated.
Two publications have been produced in association with the State of the Service Report 2007–08—the Australian Public Service Statistical Bulletin 2007–08 and the State of the Service Employee Survey Results 2007–08. A summary pamphlet, the State of the Service 2007–08 At a Glance, has also been prepared. These publications are available on the Commission’s website at: <http://www.apsc.gov.au>.
1 ANAO 1999, Staff Reductions in the Australian Public Service, Performance Audit Report No. 49, 1998–99, Commonwealth of Australia, Canberra, <http://www.anao.gov.au>

Chapter 1: Commissioner’s overviewOver the past few decades the Australian Public Service (APS) has changed and so has the world around us. The recent events on world stock exchange markets are another example of how quickly our circumstances alter, and how we must be able to respond instantly to global developments.
Notwithstanding, Australia is a wealthier nation than in the past. Government attention has moved from providing minimum standards of health care, education and welfare to how those services can be improved and better meet the needs of citizens; how to bolster national infrastructure to support a sound economy; and how to respond to difficult problems, like climate change and entrenched social disadvantage.
The APS has also undergone significant change. It has moved from a heavily centralised and rigid structure to one in which most responsibilities have been devolved to agency heads. We have seen a change in the nature of work performed—most of it is knowledge-based and there are much fewer low-skilled jobs. The public service is much more highly qualified, there are more staff at higher classification levels, they are older, and women comprise well over half of the APS workforce.
A number of factors have driven the changing make-up of the APS workforce, including: increasing requirements for more value added work—complex policy advice and intensive personal engagement with users of government services, service providers and other stakeholders; greater accountability requirements; and the ICT revolution, which has facilitated the automation of routine or lower-level jobs as well as an explosion in the pace and extent of communication.
This, the eleventh State of the Service report, finds the APS in the midst of a sea change in direction and context. The Australian public has much higher expectations than ever before about what the Government and the public service can deliver. There is a new government, with an ambitious and far-reaching reform agenda that it is seeking to implement in tandem with other levels of government, and we are linked much more closely into the global economy. Technology is continuing to accelerate the pace and the way in which we work. The APS must adapt and reform to keep in step with these developments.
It is timely for us to consider the key directions in which the APS must move to meet the challenges that lie ahead. It is important that we think about the design and shape of the APS so that it is the best possible public service for this new environment. That necessarily means we will need to transform ourselves so that we continue to provide good quality policy and delivery strategies for the Government and so that we are firmly focused on the outcomes that the Government wishes to achieve. We will need to raise our sights so that we recognise ‘a good deal’ for the Government and identify important new strategic policy directions. Indeed, one of the big ideas in the governance stream of the Australia 2020 Summit, was around a review of the APS, with a focus on ensuring it is fit to meet future challenges.
Before we embark on what is required for the future, it is important to understand the shape and key characteristics of the APS right now. This year’s State of the Service report looks at: who we are; how we have increased productive capacity; measures to reinvigorate

Westminster; and the progress we are making towards working with stakeholders and moving to more inclusive government.
The APS in 2007–08The State of the Service report examines employees and agencies covered by the Public Service Act 1999 (the Act) who account for over two-thirds of the Commonwealth public sector.1 It provides a comprehensive overview of the current state of play in the APS.
Key statistics for 2007–08 The APS grew in size over the year, and now has just over 160,000 employees. The rate of growth has slowed and was lower than in previous years, with the rate of
new engagements in the second half of the year dropping considerably compared to previous years.
The increased efficiency dividend took effect for the last four months of 2007–08, with a reduction in staff numbers in some agencies. The full year impact of the increased dividend is expected to have a greater impact on the overall size of the APS in 2008–09. For small agencies in particular, the imposition of the increased dividend has placed even further pressure on their budgets and capacity to maintain and provide core services.
The proportion of women in the APS continued to increase and they accounted for over 60% of the entrants to the APS. At senior levels, female representation continued to increase, with the gap between the number of male to female EL1s having fallen to less than 1,000—it should disappear within two years. Women account for 37% of SES employees.
SES numbers grew further during the year (now accounting for 1.8% of the APS workforce).
The trend towards a higher classification profile has continued, along with the trend towards a higher proportion of mature-aged employees.
The proportion of Indigenous employment in the APS was 2.1% and there was a slight decrease in the number of ongoing Indigenous employees (down by 49 to 3059).
There was a further decline in the number (4636) and proportion (3.1%) of people with disabilities employed in the APS.
A new Government
The smooth transition to the new Rudd Government in November 2007 was a landmark achievement for the APS, reflecting its professionalism. Only 32% of current public servants were employed in the APS at the change of government in 1996—hence the majority of public servants had never worked under any other government. The commitment of the new government to work with the APS and to quickly progress its large-scale reform initiatives has provided an exciting and challenging time for the APS.
The Prime Minister outlined in April 2008 what the Government sees as the key directions for the APS, including:
1. reinvigorating the Westminster tradition of an independent public service with merit- based selection processes and continuity of employment when governments change

2. building a professionalised public service committed to excellence 3. developing evidence-based policy making processes as part of a robust culture of
policy contestability 4. enhancing the strategic policy capability of the public service 5. strengthening the integrity and accountability of government 6. broadening participation in government through inclusive policy processes 7. a contemporary view of government service delivery that emphasises both efficiency
and effectiveness in outcomes.
The Prime Minister’s message is clear. The APS needs to improve its policy capability; raise its overall professional standards; and modernise its community engagement and service delivery arrangements. The Deputy Prime Minister has also indicated that greater APS staff mobility (both within and across agencies and outside the public service) is necessary. These changes are just some of the directions in which the APS must move to make itself ready for the future.
The unfolding global financial turmoil, coupled with the Government’s commitment to reducing inflation and ensuring Australia’s economy can withstand these external shocks, has significantly changed the Budget outlook for the APS. New fiscal measures have already been applied, through the application of the increased efficiency dividend and reviews of key programme expenditures. The Government plans to introduce more coordinated APS-wide purchasing arrangements to help provide scope for greater efficiencies and may seek additional ICT savings in the wake of the Gershon Review. At the same time, the APS has continued to achieve significant improvements in productivity which compare favourably with those in the private sector. Many agencies are now at financial crossroads—the impact of continued across the board efficiency measures is making it extremely difficult to properly maintain their core functions.
New directions for the APSThe APS of the future must be agile and responsive to the new operating environment emerging for public services here and around the world. The directions in which the APS will need to make significant improvements to meet these future challenges include:
further embedding ethics and integrity improving the performance of all agencies building a unified highly professional APS making smarter policy and regulation moving citizens to the centre and encouraging innovation getting workforce issues right.
1. Embedding ethics and integrity
There is a fundamental difference between the public sector and the private sector, with the public sector committed to the public interest. That difference must always be recognised and Australians’ expectations that public servants should provide good stewardship of government resources must also be met.

The APS Values (the Values) and the Code of Conduct (the Code) provide the framework for public servants’ standards of behaviour and professional conduct. For some time now, there have been generally high levels of confidence among APS staff that their leaders and colleagues behave with integrity, and there have been low levels of actual misconduct, at least in terms of the level of reported breaches of the Code. These results are excellent by any objective standard, and they are backed up by international comparisons.
Nevertheless, there continue to be high-profile administrative failures, such as the outbreak of equine influenza during 2007. While these incidents have been more the result of mismanagement and organisational complacency than failures of integrity, they still damage the APS’s reputation in the public mind and call into question our standards. There have also been stakeholder perceptions of ethical or governance weaknesses in some areas— which include adherence to the non-partisan Westminster system and public interest disclosure arrangements.
The Values need to continue to be embedded as the part of the foundations for a strong and effective APS in Australia. The Government has implemented a range of initiatives to support the ‘restoration of Westminster’ with a view to increasing the transparency, openness and accountability of government and to clarify relations between the Government and the APS. These reforms include the introduction of open, merit-based selection processes for most agency head and statutory office holder positions; a code of conduct and register for third party lobbyists; a code of conduct for ministerial staff; removal of performance pay for departmental Secretaries; and the introduction of guidelines for government advertising. Further measures are still being finalised, including revised freedom of information legislation to improve access to government records as well as new public interest disclosure legislation to cover all Commonwealth officials.
There are fresh professional ethical challenges facing the APS, brought on by having to manage in a more fluid environment, with changes in the breadth and speed of communication systems and a need to meet greater government and stakeholder expectations about cross-jurisdiction and cross-sector collaboration. Furthermore, there are significant numbers of APS employees, including leaders being recruited from other sectors who are used to different ways of doing things and who need to learn quickly the higher ethical standards of the APS.
The key challenges will be to maintain and improve the quality and consistency of ethical decision-making across the APS in the face of these pressures and to better anticipate and manage emerging ethical issues. The Commission is examining options to enhance and improve training in ethical decision-making, including at SES level, but it is also essential that senior managers provide ongoing ethical leadership in the workplace. This involves not only modelling the Values and the Code but maintaining an ongoing conversation with employees about current and emerging ethical issues. This will encourage thinking and reflection and also help to ensure that when ethical problems arise, employees know what to do or where to get help and advice so that they can act ethically.
2. Improving APS performance
Sound internal governance and an agency culture that upholds the Values help to ensure healthy agencies and underpin high performance. This year’s employee survey findings show that, while overall the APS is performing well, there are still areas of concern around

performance. It is particularly disheartening that for some agencies, key employee measures of perceptions about integrity and ethics deteriorated during the year, particularly measures of bullying and harassment and perceptions around the application of the merit principle.
The Equine Influenza Inquiry report highlighted once again the need for all agencies to have in place an institutionalised practice for continuous improvement in their corporate health and agency culture. Agencies can access a range of guidance on issues around governance and agency health through the Commission’s own publications on Building Better Governance and Agency Health, as well as through guidance provided by ANAO.
Agencies also need to make sure their governance frameworks do not become overly burdensome. This year’s employee survey findings found that over half of all SES and EL 2 employees in the APS consider that ‘more streamlined administrative processes within my agency’ is the single most important action that would assist their agency to achieve greater efficiency and effectiveness. They rate it as more important than recruiting high-quality staff (47%) and improved ICT (29%). Agencies appear to have scope to achieve considerable gains through governance reforms designed to streamline their internal rules, guidelines and processes.
There is also a need to consider service-wide approaches to improve performance. The Government has signalled its intention to establish coordinated procurement for the APS in a number of specific areas. There are likely to be other areas where more coordination of activities across the APS will bring benefits to the service as a whole. It is highly desirable, for example, that there should be: greater coordination of leadership development; a service-wide commitment to ongoing learning and discussion around ethical issues; and the adoption of further coordinated approaches in administration, including employee security checks.
A service-wide look at how agencies are faring and whether they are performing well in all their functions would also be timely. This approach needs to take into account the financial circumstances of agencies, and should also consider how agencies are performing in a range of business areas, including their leadership and strategic capabilities as well as their continued ability to deliver on key Government objectives. The APS needs to think seriously about independently benchmarking its performance between agencies and internationally. Several new tools to assist in this process have emerged overseas; we could learn a lot from them and build upon their success.
It may be that some agencies are experiencing difficulties as a result of the continued application of the efficiency dividend on their budgets, combined with underlying rigidities in their funding arrangements. This may start to impact on their capacity over time to attract and retain high-quality staff. Another potential risk is that they may be less able to ensure strong governance arrangements, or in the worst case scenario, be forced to reduce their core services to clients. It could also be the case that other agencies are experiencing management problems or are performing badly in certain key programmes. It would be better to expose these risks and manage them before major problems arise, and to set in train measures to avoid further agency failures.
This year’s report reveals that there is a need for individual agencies to improve their performance in particular areas (such as bullying and harassment) or across the board (the application of merit). It is important that agencies use their employee survey results, benchmarked against APS average results, to improve APS performance overall. A strong

approach to agency governance, and a robust and transparent approach to measuring agency health and benchmarking overall capability are essential requisites for the future directions of the APS.
3. Building a unified highly professional APS
The professional reputation of the APS will be enhanced through both a stronger focus on ethics and integrity, and sound governance structures. Embedding a more cohesive APS, which is readily identified as one entity that is delivering on the Government’s agenda, will be another key element in rebuilding the public service’s professional standing.
The SES will have a key role to play, as strong ethical leadership will be required. The leadership strategy involved will need to encompass:
a cohesive senior leadership cadre that supports work across the whole of government and collaboration with a range of stakeholders, particularly citizens and communities and the states and territories
investment in APS-wide leadership development for the SES and SES Executive Level feeder group
systematic and integrated succession management planning, including the identification and development of talented employees at all levels.
Action in each of these areas will need reinforcement through agencies’ performance management systems and a strong cross-service focus on them if we are to achieve the Management Advisory Committee’s goal of ‘One APS—One SES’.
It is particularly disappointing that this year there was a significant reduction in the proportion of the SES (now 40%) who identified as part of a broader leadership cadre. This decline and relatively poor outcome does not reflect well on APS leaders, given that there is an increasing emphasis on building strong and effective collaborative relationships within the APS and with a broader range of stakeholders.
New leadership models may emerge to underpin more coordinated arrangements across the APS. It is necessary to tackle the structural impediments against adopting cross-agency and cross-jurisdictional approaches which include cultural barriers, procedural constraints and budgetary arrangements.
For the APS more broadly, there is a need to rebuild the concept of ‘one APS’ and to broaden the concept once again so that we see ourselves as a career service where employees can enjoy many and varied government careers. Over time, a key strength of the APS has been that its staff have been encouraged to pursue their careers across portfolios, gaining experience and depth of knowledge about government processes and policy. This must be rejuvenated.
It is necessary to address impediments that may be limiting employee mobility across agencies, including consideration of whether remuneration may be impacting adversely on employee mobility. Agency remuneration is one of the factors that employees consider when joining the APS and when moving between agencies. There is no doubt that agency-based arrangements for agreement-making have delivered significant productivity gains. An

increase in salary dispersion under a devolved system is a natural consequence, but it may be impacting on the concept of the APS as one career service.
There are some indications that mobility may be influenced by pay differentials between agencies to the detriment of medium-to-lower paying agencies. Overall mobility rates among agencies fell in 2007–08. Mobility, underpinned by a sound classification system, is vital to building a professional and collaborative APS that shares a common identity, and is well- positioned to deliver on future challenges.
The combined effect of the efficiency dividend and the partial funding arrangements for remuneration increases have placed pressure on some agencies whose size, or the nature of their activities, affect their potential for cost saving productivity gains to be generated year after year. For some agencies this has impacted on the remuneration levels they are able to offer. A key issue is how to ensure the APS operates in a sustainable way so that agencies of all types and sizes can attract and retain staff with the capability to deliver on their core functions. It may be timely to consider putting a safety valve mechanism in place to ensure the ongoing ability of lower paying agencies to attract and retain a skilled workforce in what will no doubt continue to be a tight fiscal environment.
4. Smarter policy and regulation
The nature of the issues that face government policy makers have always been tough, but many would agree that they are becoming increasingly complex. Tackling complex problems such as climate change, lifestyle health issues and social and economic disadvantage require smarter policy making and regulation.
Devising policy options and interventions for government is now well and truly a contestable market in which APS agencies need to demonstrate to their Ministers and the Government that they are competitive. The Prime Minister has outlined the priority he places on the APS being able to develop evidence-based policy making processes as part of a robust culture of policy contestability.
There is a growing need for APS agencies to be able to demonstrate that they are capable of working across organisational boundaries and in partnership with a range of organisations in order to devise and implement policies that tackle complex policy issues effectively. As these issues cross organisational boundaries and go beyond the capacity of any one agency to understand and respond to, they require an APS response that is more innovative and flexible than the traditional linear approaches to policy making that have operated in the past. Business as usual will not be effective in the coming decades.
Some say that APS agencies do not compete on a level playing field with the political advisers and consultants with whom they vie for policy advice. This is because APS agencies have roles and responsibilities, professional standards and legislative employment arrangements that they are required to work within. In my view, these arrangements are crucial to the Westminster tradition and should actually provide the basis for the APS’s competitive advantage.
The APS can have a clear advantage if a broad view is taken of what evidence-based policy means. A broader view involves gathering evidence to scope the nature of the policy problem and the risks of not addressing it, but also to test and gather information on what is likely to

work in practice. There needs to be adequate research into how people and organisations are likely to respond to policy and regulatory interventions using field research, pilots and trials, rather than relying only on insights from economic and behavioural theory. These can add valuable information about what works in practice as opposed to what is predicted to work.
Policy development and evaluation needs to be informed with on-the-ground intelligence about operational issues and the views of those implementing the policies and regulations. In this sense policy design and implementation should be iterative rather than a one-off task. It is best understood not as a linear process—leading from policy ideas through implementation to changes on the ground—but rather as a more circular and interactive process involving continuous learning, adaptation and improvement, with policy changing in response to implementation as well as vice versa. In this broader view of evidence-based policy making, the APS has a clear advantage to the one-off or value-laden advice that can be provided by consultants, advisers or stakeholders but it does require a change to the more traditional view of what policy making entails by both agencies and the Government. It also requires agencies to invest equally and promote strong integration in all phases of activity—policy and programme design, implementation and then evaluation and/or learning and adaptation.
APS agencies need to also highlight their ability to provide the Government with a longer-term perspective to decision-making and policy making, including a balanced view of the impact of policy options on the Australian community as a whole, and on the most vulnerable parts of the community, in particular. The APS’s recordkeeping requirements, corporate memory, long-term experience, and the skills of senior staff should be engaged to this end.
As part of this, there is also a need to ensure that central agencies provide a good framework across the APS to underpin and build up shared expertise—this should include investment in ensuring that lessons learned across agencies are pooled and made available so that capabilities around evidence-based policy making and relationship management in the APS are strengthened.
This highlights the challenge that APS agencies face in the development and retention of employees with the skills and experience necessary to develop evidence-based policy and to bring a longer-term, strategic perspective to policy development. Smarter policy and regulation still requires the high-level analytical and technical skills of the traditional approach but in addition will need employees capable of high-level connecting, communication and facilitation to effectively work across levels of government and organisational boundaries and to engage stakeholders in cooperatively tackling policy issues.
It also requires an organisational culture that supports an adaptive and innovative approach to policy interventions and a tolerance for exploring what works in practice. It is clear that investment at all levels is necessary if we are to address the shortcomings frequently identified in the skills base of APS leaders, around ‘strategic thinking’ and ‘achieves results’.
5. Moving citizens to the centre and encouraging innovation
A key driver for building a more cohesive and coordinated APS is the need to interact better with citizens, ensuring they are able to deal with the Government as a single entity and not a range of different entities. It is widely recognised that services must better meet the needs of citizens, and that improved coordination across government is often required to help make this happen. Many agencies have already begun reforms to assist in moving citizens to the

centre of service delivery, but there is a need to ensure citizen views are reflected both in relation to how current services are working, and to ensure they are engaged and able to have some input into the policy and design of new programmes and services. Differing levels of engagement will be required to tackle different issues and, in some cases, citizens will be part of the policy response when a change in their behaviour can be effective, such as where increased use of public transport options contributes to a reduction in carbon gas emissions.
The direction this is taking across the world is that: governments would be regarded as approachable, with services that are easy to locate and understand; citizens would be able to choose a range of service models based on their needs without having to understand which agencies deliver which services; authentication and personal information would only need to be provided once in order to access services; and diverse transactions could be grouped and completed together. Such an approach in Australia would require a significant change to the way the APS manages and delivers services, and would take many years to implement and bed down culturally.
New forms of engagement with citizens have already been commenced by the Government, including through the Australia 2020 Summit and Community Cabinets. Better use of technology and Web 2.0 platforms will provide the APS with further opportunities to engage more with citizens. As new opportunities for engagement emerge, APS employees’ capabilities to think broadly, to communicate and to manage relationships will need to be strengthened.
Innovation and flexibility will help build APS capability to design responses to citizens that better meet their needs and minimise the impact of government on them. The current disparity between employees’ views about their capacity to be innovative, and the support provided to them by agencies and senior managers for adopting new approaches, needs to be addressed. As already mentioned, better alignment and recognition of the need to develop evidence-based policy, trialling new approaches, and the opportunity to learn from both failures and successes, needs to be achieved.
Collaboration and partnership, across all levels of government and with third party providers, will ensure citizens can access and work with the Government in the most effective way possible. Citizens want to deal with the Government, not a specific agency, and our challenge is to make sure the back-end arrangements amongst government agencies and other providers are well-integrated, and meet citizens’ needs, rather than our own as the primary service providers.
6. Getting workforce issues right
Fundamental to building a better APS is ensuring we have a workforce that can respond effectively to future challenges. In an environment of limited resources, people will always be the primary key to delivering on our commitments. We already compete in a tight labour market for employees with specialist skills, including ICT and accounting expertise. To meet government, community and stakeholder expectations of a professional, responsive, intellectual and flexible APS—which achieves quality results in short time frames with limited resources—APS agencies need to attract nimble, innovative, creative and entrepreneurial employees, including those with strong policy and relationship management skills. Up until now, many of these skills have not typically been associated with government employees, but the future demands our employees have many talents and are versatile.

In addition, the APS workforce should reflect the broader diversity of the Australian community. There continues to be several groups of employees in the APS where agencies need to improve their recruitment and retention performance, and develop more effective strategies to increase their representation and improve their employment experience—in particular, people with disability, Indigenous Australians and younger people.
The long-term decline in employment of people with disability continued this year. The fall represents a decrease of 3.8% in the number of employees with disability, compared with an increase in overall ongoing employees of 2.7% during the year. Although some factors may help to explain this decrease (such as the reduction in number of jobs at lower classification levels and increased efficiency pressures), the overall trend is very disappointing, particularly in light of the commitment that agencies made to boosting the employment of this group as part of implementing the recommendations of the Management Advisory Committee (MAC) report, Employment of People with Disability in the APS (2006). I will write to MAC agencies shortly to ask them to provide me with information on how they intend to improve their performance. It will be an area of more detailed investigation in next year’s State of the Service report.
Despite some previous success with recruiting Indigenous employees, this was not sustained in 2007–08. There was a small reduction in the number of Indigenous employees during the year, from 3,108 at June 2007 to 3,059 at June 2008. Although representation of Indigenous employees is much higher in the APS than elsewhere in the labour market, this result is disappointing. It is of particular concern that APS Indigenous employees are more likely to leave the APS. The separation rate for Indigenous employees has been higher than their engagement rate for all but two of the past 10 years, and has been higher than their overall representation every year. There has been strong support for the APS Indigenous Employment Strategy, and specific recruitment and retention measures for Indigenous Australians are widespread in the APS, but more effort is still required, including a look at the use of more targeted approaches and positions for Indigenous employees.
The representation of young people (aged under 25 years) continues to be much lower in the APS than in the broader Australian workforce. The proportion of young people in the APS fell this year. At June 2008, 4.9% of ongoing employees were aged under 25 years, with 0.2% aged under 20 years and 4.7% aged 20–24 years. It is important for the ongoing vitality and sustainability of the APS that it is an attractive employment option for both young women and young men.
It is a time of change for the APS—we need to take action in the six key areas identified above to make sure that our agencies and the overall service are agile; that we are well- placed to respond to future challenges; and that our working arrangements ensure a highly ethical, professional, cohesive and productive public service that continues to be internationally renowned.
1 Excludes permanent members of the Australian Defence Force.

Chapter 2: Workforce profile There have been a lot of changes in the size and structure of the APS over the past 15 years. The earlier years were characterised by a period of restructure and reduction in size and functions. Since 2000 there has been considerable growth in the size of the APS, while structural changes have continued—a shift towards a higher classification profile, greater numbers of female employees and an ageing workforce.
This chapter explores time series demographic and structural patterns for people employed under the Public Service Act 1999 (the Act)—the current picture as well as changes over the past 15 years. The main source of data for the chapter is the APS Employment Database (APSED) which is maintained by the Commission.1 APSED contains information about recruitment, mobility and separations for all ongoing and non-ongoing employees. Further information on the size and composition of the APS can be found in the Australian Public Service Statistical Bulletin 2007–08.2
APS staffing Initiatives from the 2006–07 Budget continue to drive APS growth, but this growth has started to slow. During 2007–08, employee numbers grew by 3.0%, which compares to growth in the previous two years of 9.5% (2005–06) and 6.3% (2006–07).
The additional efficiency dividend introduced from 1 March 2008 affected some agencies’ staffing numbers by June 2008, with further impacts likely as a result of the decreases in average staffing levels for some APS agencies announced in the 2008–09 Budget (and effective from July 2008).
Engagements to the APS slowed in the second half of the year and separations from the APS (11,946) were the highest number recorded since 1998–99.
A number of agencies were affected by machinery of government changes following the November 2007 federal election. Due to the significant change in structure of some of these agencies, they are generally not included in year-on-year comparisons in this chapter.
There were 160,011 APS employees at June 2008 compared with 155,419 at June 2007. Adjusted for coverage changes, the increase in APS employment during 2007–08 was 2.6%.
Figure 2.1 shows the change in total staff numbers from 1989 to 2008. The adjusted line takes account of coverage changes in the APS over the period, by adjusting the total for the number of employees performing those functions at the time that the function moved into or out of coverage of the Act.

Figure 2.1: APS employees, 1989 to 2008
Source: APSED
Excluding agencies affected by machinery of government changes during 2007–08, those with the largest growth in total employees were ATO (an increase of 1,362 or 5.9% due to the planned expansion of compliance activities and to manage workloads in the Operations area), Defence (435 or 2.1%), Customs (381 or 6.5%) and DIAC (325 or 4.8%). Smaller agencies with large proportional increases included the Australian Transaction Reports and Analysis Centre (AUSTRAC) (82 or 31.8%), the Great Barrier Reef Marine Park Authority (GBRMPA) (65 or 38.0%), CrimTrac (64 or 80.0%), the Federal Magistrates Court of Australia (FMC) (58 or 35.4%), the Australian Research Council (ARC) (28 or 37.8%) and the Future Fund Management Agency (FFMA) (27 or 225.0%). The largest decreases were in Centrelink (a drop of 1,141 or 4.2%), ABS (144 or 4.6%), the Australian Electoral Commission (AEC) (103 or 11.6%) and the National Capital Authority (NCA) (47 or 44.3%).
Twelve per cent of the increase in total APS numbers during 2007–08 (549 employees) was due to machinery of government changes involving existing Australian Government agencies moving into coverage of the Act. APVMA (141 ongoing and non-ongoing employees), the Export Wheat Commission (EWC) (16 employees) and the Private Health Insurance Ombudsman (PHIO) (11 employees) were all non-APS Commonwealth bodies which moved into coverage. Also, 380 employees of the Mersey Campus of the North West Regional Hospital in Tasmania became non-ongoing employees of DoHA. One employee moved into the Australian Competition and Consumer Commission (ACCC) from the ACT Government.
The Office of the Workplace Ombudsman (WO) took over the functions of the Office of Workplace Services (OWS), which was abolished. The Workplace Authority was established and took over functions and staff from the Office of the Employment Advocate which was formerly part of DEWR.
A range of other machinery of government changes resulted in the movement of staff between agencies covered by the Act. Following the November 2007 federal election, four

departments—DCITA, DEST, DEWR and DITR—were abolished and their functions moved to a number of new departments, including DBCDE, DEEWR, DIISR and RET. DOTARS was renamed Infrastructure, which also gained a number of functions, and DEW was renamed DEWHA. Also, FaCSIA was renamed FaHCSIA, and Finance and Administration was renamed Finance and Deregulation. DCC was established, gaining functions from DEW and PM&C. Over 12,000 ongoing and non-ongoing employees were moved between agencies as a result of machinery of government changes during 2007–08. A full list of changes to administrative arrangements during the year can be found in the Australian Public Service Statistical Bulletin 2007–08.
Ongoing and non-ongoing employees The increase in overall employment during 2007–08 reflected growth in both the ongoing and non-ongoing employment categories. Ongoing employees grew more in actual numbers, but the proportional growth was higher for non-ongoing employment.
Ongoing employees
During 2007–08, ongoing employment grew by 3,856 or 2.7%, from 143,742 at June 2007 to 147,598 at June 2008. This was a deceleration in the rate of growth compared to the increases of 9.2% in 2005–06 and 6.6% in 2006–07.
Excluding agencies affected by machinery of government changes, the largest increases in ongoing employee numbers were in ATO (1,160 or 5.4%), Defence (671 or 3.3%) and Customs (369 or 6.4%). Smaller agencies with large proportional increases were AUSTRAC (83 or 33.3%), CrimTrac (58 or 72.5%), the National Health and Medical Research Council (NHMRC) (58 or 38.4%) and the Australian Institute of Health and Welfare (AIHW) (48 or 26.7%). The largest decreases in ongoing employee numbers occurred in Centrelink (1,203 or 4.5%) and ABS (132 or 4.4%).
Non-ongoing employees
Non-ongoing employee numbers grew this year by 736 or 6.3%, from 11,677 at June 2007 to 12,413 at June 2008. This compared with an increase of 3.1% in 2006–07. Non-ongoing employees accounted for 7.8% of all employees at June 2008, a slight rise from 7.5% the previous year. Excluding the non-ongoing employees of the Mersey Hospital, the proportion of non-ongoing employees would not have changed.3
Over time, there have been large shifts in the use of non-ongoing employment in individual agencies. This variation suggests that non-ongoing employment is being used flexibly by agencies to deal with peaks and troughs in work demands. This year, the largest increases in non-ongoing employee numbers—excluding agencies affected by machinery of government changes—were in DIAC (266 or 73.5%, associated with implementation of the Citizenship Test and visa administration) and ATO (202 or 11.6%). The number of non-ongoing employees fell in Defence (down by 236 or 22.6%).
The long-term trend has been a reduction in the representation of non-ongoing employees as a proportion of all employees, although this appears to have stabilised in the past few years at around 8%. Figure 2.2 shows how non-ongoing employment as a proportion of total
employment has changed over time. While the proportion has risen slightly this year, it is still considerably lower than it was 15 years ago. As a proportion of the total APS, non-ongoing employment has fallen from 11.6% in 1994 to 7.8% in 2008. The representation rate for women has consistently been higher than that for men over this period.
Figure 2.2: Non-ongoing employees as a proportion of total employees, 1994 to 2008
Source: APSED
As Figure 2.2 shows, women are more likely to be employed on a non-ongoing basis. At June 2008, 62.8% of non-ongoing employees were women compared with 57.1% of ongoing employees.
Agencies with the largest number of non-ongoing employees at June 2008 were ATO (1,937 or 7.9% of total employees), DoHA (1,025 or 18.7%) and Defence (810 or 3.7%). Centrelink has substantially reduced its use of non-ongoing employees in recent years. At June 2008, 741 or 2.8% of Centrelink’s employees were non-ongoing.
Non-ongoing employees can be engaged in three different categories: specified term, specified task or for duties that are irregular or intermittent. At June 2008, the majority (73.2%) were engaged for a specified term, 8.1% for a specified task and 18.7% for irregular or intermittent duties. Agencies’ use of the different non-ongoing categories varies considerably.
Non-ongoing employees have historically been concentrated at lower classification levels—at June 2008, 67.2% were at the APS 1–4 levels compared with 37.8% of ongoing employees.
Overall representation of non-ongoing employees is much lower at higher classifications—only 3.7% of EL employees are non-ongoing compared with the APS average of 7.8%. The exception is in the SES bands where the proportion employed on a non-ongoing basis is

higher for Band 3s (10.3%) than for Band 1s (3.7%) or Band 2s (7.4%). While still strong, the general concentration of non-ongoing employees at lower classifications has fallen over time.
Male and female employmentGrowth in female employment, evident for some years now, has continued this year, with increased female employment across a range of agencies, including in traditionally less feminised agencies. The total number of women rose from 88,577 to 92,142, an increase of 4.0%. The number of men rose from 66,842 to 67,869, an increase of 1.5%. Trends for total employment by sex are shown in Figure 2.3. Women now comprise 57.6% of total APS employment, continuing a long-term rise in representation.
Figure 2.3: Total employees by sex, 1994 to 2008
Source: APSED
Women have outnumbered men in the APS since 1999. During 2007–08, the number of ongoing women employees increased by 3.7% to 84,346 at June 2008, compared with an increase of 1.4% for men, to 63,252 at June 2008. The increase in non-ongoing employment was also greater for women than for men during 2007–08—7.7% compared with 4.1%.
Despite growing levels of female employment across the APS, there is still considerable variation between agencies in the proportional representation of men and women. Of agencies with more than 1,000 ongoing employees, Medicare (80.9%) had the highest proportion of women, followed by DHS (75.5%).4 Large agencies with the highest proportion of men were the Bureau of Meteorology (BoM) (78.7%) and Defence (60.8%). During 2007–08, the comparatively high representation of women fell slightly in Medicare and DHS (down from 81.2% and 75.8% respectively at June 2007), while the proportion of men also dropped slightly in both BoM and Defence (down from 79.3% and 62.0% respectively at June 2007).
Part-time employees

At June 2008, 12.2% of ongoing employees were working part-time, up from 11.7% last year. Women are still much more likely to work part-time, with 18.8% working part-time at June 2008 compared with 3.4% of men. These trends are shown in Figure 2.4.
Figure 2.4: Proportion of ongoing employees working part-time by sex, 1994 to 2008
Source: APSED
Centrelink is the largest employer of part-time employees in the APS with 5,395 or 30.0% of all ongoing part-time APS employees at June 2008. This group accounted for 21.2% of Centrelink’s ongoing workforce—almost twice the APS average. Other agencies with large numbers of part-time employees were ATO (2,261), DHS (1,259), Medicare (1,144), DAFF (868) and Defence (863).
Non-ongoing employees are much more likely to work part-time—30.1% of non-ongoing employees were working part-time at June 2008.
Part-time work by age
Part-time work for women is highest in the 30–44 age group, with 26.4% of ongoing women in this age group working part-time at June 2008. For men, the proportion working part-time in this age group was 3.9%—much lower than for women but still somewhat higher than the proportion for men (3.4%). The proportion working part-time is lower for employees in the 45–54 age group, before rising again for older workers (i.e. those aged 55 years and over) who are more likely to work part-time as they age (see Figure 2.5).
The trend towards part-time working arrangements for older workers continued this year with 7.3% of those aged 55–59 and 9.5% of those aged 60 and over working part-time (up from 7.0% and 9.0% respectively last year).

Figure 2.5: Proportion of ongoing employees working part-time by age group and sex,
Source: APSED
Classification structures Table 2.1 compares ongoing employee numbers by classification, at June 1994, 2007 and 2008. In the past year, numbers rose at all classification levels above APS 3. The number of ongoing employees at the APS 1 level fell by 452 or 29.9%. This was due mainly to a large decline in the number of APS 1s employed by Medicare Australia which still has the largest number of APS 1s in the APS. Nevertheless, excluding Medicare, the number of APS 1s still dropped by 14.2% during 2007–08.
Table 2.1: Ongoing employees by classification, 1994, 2007 and 20085
1994 2007 2008 % change 2007 to
2008
% change 1994 to 2008Classificatio
n No. % No. % No. %
Source: APSED
APS 1 20804 14.7 1511 1.1 1059 0.7 -29.9 -94.9
APS 2 17893 12.6 5563 3.9 5177 3.5 -6.9 -71.1
APS 3 24905 17.6 21470 14.9 20474 13.9 -4.6 -17.8
APS 4 17052 12.0 28362 19.7 29014 19.7 2.3 70.2
APS 5 17038 12.0 19844 13.8 20409 13.8 2.8 19.8
APS 6 20064 14.2 28641 19.9 30090 20.4 5.1 50.0
EL 1 12769 9.0 22501 15.7 24638 16.7 9.5 93.0

Table 2.1: Ongoing employees by classification, 1994, 2007 and 20085
1994 2007 2008 % change 2007 to
2008
% change 1994 to 2008Classificatio
n No. % No. % No. %
EL 2 7884 5.6 11660 8.1 12361 8.4 6.0 56.8
SES Band 1 1361 1.0 1898 1.3 2015 1.4 6.2 48.1
SES Band 2 396 0.3 518 0.4 538 0.4 3.9 35.9
SES Band 3 100 0.1 119 0.1 139 0.1 16.8 39.0
Trainee 265 0.2 399 0.3 401 0.3 0.5 51.3
Graduate APS 708 0.5 1256 0.9 1283 0.9 2.1 81.2
Total 141776 100.0 143742 100.0 14759
8 100.0 2.7 4.1
Consistent with last year’s result, the largest increase in classification size this year was for the EL 1 cohort (up by 2,137 or 9.5%). The APS 6 cohort remains the largest size category of employment in the APS. The SES grew by 157 or 6.2%.
The number of ongoing employees in the trainee classification at June 2008 was 401, almost unchanged from the previous year. Some agencies engage trainees at the APS 1–2 levels rather than in the actual trainee classifications, so variations over time may not necessarily reflect agencies’ use of trainees more broadly.
During the past 15 years, there has been a consistent and strong shift in the classification profile of the APS, with a decline in the proportion of employees at the APS 1–2 levels (down 23.1 percentage points) and increases at higher levels with APS 5–6 up by 6.0 percentage points and ELs by 10.5 percentage points. As a proportion of all ongoing employees, the SES has risen from 1.3% at June 1994 to 1.8% at June 2008. Put another way, the APS 1–6 levels have dropped from 83.1% of all ongoing staff at June 1994 to 72.0% at June 2008. Over the same period, EL and SES employees have risen from 15.9% to 26.9%. The graduate and trainee cohorts have grown slightly over the same period—from 0.7% in 1994 to 1.1% in 2008. Part of the decline at lower classification levels may be attributed to changes in coverage of the Act, with a relatively high proportion of employees at lower levels moving out of coverage over the past 15 years. The trend in engagements, however, parallels the shift to a higher classification profile, and has had a much larger impact on overall numbers than net coverage changes have.
This trend towards a higher classification profile reflects the changing nature of APS employment, with a more skilled workforce undertaking increasingly complex and difficult roles, as well as the outsourcing of a number of low skill functions. Other factors that might explain this shift are discussed in Chapter 4.
Women by classification
Despite the continued growth in women’s representation in the APS, there is still a substantial difference between the classification profiles of men and women, particularly at higher classifications. Figure 2.6 shows the proportion of men and women at selected classifications

at June 2008. Women outnumber men at all classifications up to and including APS 6, with the proportion of women falling sharply at higher levels. Fifteen years ago, the ‘cross-over’ point was APS 4. Based on current trends, women are likely to reach equal representation at the EL 1 classification within two years.
Figure 2.6: Ongoing employees by classification and sex, June 2008
Source: APSED
Despite the long-term inequity at higher classifications, there have been significant gains for women over time, particularly at these higher classifications, as shown in Figure 2.7. In this graph, each number is weighted using the total number of ongoing employees at June 1994 as a base.6 The growth in the representation of women at the EL and SES classifications has been substantially higher than their growth at lower classifications. Women’s representation at the APS 1–2 levels has declined, as has the number of APS 1–2 employees overall.
At June 2008, women comprised 37.0% of the SES (up from 36.1% in 2007) and 45.0% of EL employees (up from 43.5% in 2007).

Figure 2.7: Change in the number of women at selected classifications, weighted and indexed, 1994 to 2008
Source: APSED
Figure 2.8 shows that women’s representation among promotions to the EL and SES classifications was higher than their representation at these levels. This trend has been evident for some years, and suggests that women’s representation at higher classifications will continue to increase. Engagement rates for women were slightly lower than their representation in the EL and SES classification groups. The number of promotions in these classification groups is significantly higher than the number of engagements, so the effect of women’s higher promotion rate on the overall representation rate for women will have more impact in the long-term.
The trend towards greater representation for women in the EL and SES classifications is reinforced by looking at their representation in different age groups. Representation of women in both the EL and SES classification groups is higher for younger age groups. In particular, women account for more than half (54.7%) of all ELs aged under 40 and 42.9% of SES aged under 40.
The large agencies with the highest representation of women at higher classifications are DoHA (56.4% of SES and 63.5% of ELs are women), DEEWR (55.4% and 55.8%), the Australian Securities and Investments Commission (ASIC) (51.7% and 46.0%), Customs (49.1% and 36.1%) and FaHCSIA (48.1% and 63.1%). The large agencies with the lowest representation of women at higher classifications are BoM (21.4% of SES and 16.1% of ELs are women), Finance (22.9% and 47.0%), Defence (24.5% and 25.4%), DAFF (26.1% and 41.1%) and Infrastructure (26.8% and 33.1%).

Figure 2.8: Ongoing employees—engagement and promotion rates for women, 2007–08
Source: APSED
Mobility within the APS Figure 2.9 shows how mobility between agencies has varied over the past 10 years with periods of decline, stability and growth. During 2007–08, total mobility fell slightly with a promotion rate of 0.9% and a transfer rate of 1.9%. Over the 10 years, the transfer rate has been higher than the promotion rate, with variation in the transfer rate accounting for most of the variation in total mobility over the period.

Figure 2.9: Ongoing employees—promotion and transfer rates between agencies, 1998–99 to 2007–08
Source: APSED
Mobility between agencies is higher for women than for men. During 2007–08, the overall mobility rate (including both promotions and transfers) was 3.0% for women and 2.6% for men. Mobility is generally higher at higher classification levels, and particularly high for women in the SES. The proportion of women in the SES who have worked in three or more agencies is 35.3% compared with 29.6% for men.
During 2007–08, mobility fell slightly for APS 1–6 employees and ELs but rose for SES employees—from 4.9% to 6.1%. Over the past 10 years, mobility rates have been highest for SES employees, followed by the EL and APS classification groups.
Initiatives to improve mobility between agencies include Branching Out, a feature of the APSjobs website that facilitates employees wishing to transfer between agencies. The Career Transition and Support Centre, which was established within the Commission in May 2008 to help APS staff declared potentially excess by their agency to find jobs in other agencies, has assisted a number of employees to do so.
Educational qualifications Data for APSED, while incomplete, shows 52.5% of ongoing employees have graduate qualifications, up slightly from 52.1% last year.7 The proportion with graduate qualifications is higher for men than for women (55.7% compared with 49.8%). Twenty years ago the proportion of ongoing employees with graduate qualifications was only 30.4%.
The long-term trend is for an increase in the engagement of people who have graduate qualifications. During 2007–08, 60.6% of those engaged had graduate qualifications. This contrasts with around one-third 20 years ago, although there was a slight reduction in the

proportion of engagements with graduate qualifications during 2007–08 (down from 61.0% the previous year). This may reflect the increased proportion of engagements this year of trainees—a group who are less likely to have qualifications. The quality of data on educational qualifications provided by agencies continues to be very disappointing. Agencies provided data for only one-third of those engaged during 2007–08.
Type of work Many different types of work are performed in the APS. The largest proportion of respondents to the employee survey this year (24%) reported being involved in service delivery to the general public. One-fifth of employees are engaged in corporate services. Other common categories include exercising regulatory control (13%), and administrative support and policy (both 10%).
Table 2.2 shows how the type of work performed across the APS varies by classification. APS 1–6 employees are most likely to be working in roles where they deliver services to the public; EL employees are most likely to be working in corporate services or policy roles; and SES employees are in policy or programme design and/or management roles.
Table 2.2: Employee identified type of work by classification, 2007–08
Classification
Source: Employee survey
APS 1–6 %
EL 1–2 %
SES %
Total %
Policy (e.g. development, review and/or evaluation) 6 20 34 10
Research 4 9 3 6
Programme design and/or management 6 18 24 9
Service delivery to the general public (e.g. call centres, shopfront/ counter service) 30 5 10 24
Exercising regulatory authority 14 10 6 13
Legal (including developing and/or reviewing legislation) 2 5 8 3
Corporate services 18 28 15 20
Administrative support/clerical (e.g. executive/personal assistant) 13 2 0 10
Other 7 4 1 6
Age profile At June 2008, the median age of ongoing employees was 42 years (44 years for men and 40 years for women). This was unchanged from the previous three years. The largest age group is the 45–49 years age group. Over one-quarter of all ongoing employees (25.9%) are now aged 50 years or over and 11.9% are aged 55 years or over, up from 25.1% and 11.2% respectively last year.

Representation of young people (i.e. those aged under 25 years) fell this year. At June 2008, 4.9% of ongoing employees were aged under 25 years—0.2% aged under 20 years and 4.7% in the 20 to 24 years age group. This was a slight fall in proportional terms from last year, after two years of relatively strong proportional growth for this cohort. Despite the reduction in the proportions, the actual number of ongoing employees aged under 25 years rose slightly, from 7,158 at June 2007 to 7,198 at June 2008.
Older age groups had the largest proportional growth in ongoing employment this year with the 60 years and over age group increasing by 14.8% and the 55 to 59 years age group increasing by 6.3%, compared with the increase for the APS overall of 2.7%. Altogether, employees aged 55 years or over now comprise 11.9% of the ongoing APS workforce, and this proportion has more than doubled since 1996 (5.6%). This strong growth in the number of older workers reflects the impact of policies to encourage older, skilled workers to either remain in the APS or to return after taking early retirement.
The 45 to 54 years age group is the largest group of ongoing employees, having increased from 25.0% to 29.9% since 1996. At the same time, the median age has risen, on average, one year for every three years, although it has remained steady for the past three years at 42 years. In 1996, the median age was 39 years.
Older workers are more likely to be working at higher classification levels and, in general, have longer lengths of service, compared to the average.
The ageing of the cohort at more senior classifications over the past 15 years is particularly evident: for example, at June 2008, 18.2% of SES and 12.2% of ELs were aged 55 years and over compared with 10.4% and 6.2% in 1994. Table 2.3 shows the proportion of ongoing employees in 10-year age groups, at June 1996, 1999, 2002, 2005 and 2008.
Table 2.3: Ongoing employees—proportion by age, 1996 to 2008
1996 1999 2002 2005 2008
Source: APSED
Under 25 6.3 4.1 4.6 4.0 4.9
25-34 29.4 26.6 25.8 25.1 24.5
35-44 33.7 33.9 32.3 30.5 28.8
45-54 25.0 29.1 29.7 30.3 29.9
55 and over 5.6 6.3 7.6 10.1 11.9
Median age 39 40 41 42 42
The ageing of the APS workforce raises significant workforce planning and succession management challenges. Employees in the 45 years and over age group, who will be eligible for retirement in the next 10 years, account for 41.8% of ongoing employees, up from 41.0% last year and 27.7% in 1994. Succession management is discussed in Chapter 5 of this report, and is identified as a key pillar in terms of the APS putting in place an effective leadership strategy for the future.

As outlined above, growth was especially strong this year in the 60 years and over age group. This cohort has more than doubled in size over the past five years, from 2,564 at June 2003 to 5,022 at June 2007 and 5,763 at June 2008. As a proportion of all ongoing employees, employees aged 60 years and over have increased from 1.5% in 1994 to 2.1% in 2003 and 3.9% in 2008. Over 40% of this cohort has at least 20 years of service and 17.8% have 30 or more years of service.
During 2008, the Australian Government Actuary was commissioned to prepare an age projection for the APS up to 2022. The results of this projection, based on a combination of exit rates for the two main superannuation schemes, are shown in Figure 2.10. These projections show that as time elapses, the trend of an increasingly older workforce in the APS will continue. The projections are based on all staff (both ongoing and non-ongoing) and estimate that the median age for the APS will increase from 41 in 2007 to 43 by 2017 and 44 by 2022.
Figure 2.10: Actual and projected age profile for the APS, 2007, 2017 and 2022
Source: APSED and AGA projections
There is substantial variation in agencies’ age profiles. Those agencies with a relatively high proportion of employees aged 45 years and over may face more critical and different workforce planning and knowledge management issues than those with a younger age profile. Of the agencies with more than 1,000 ongoing employees, DVA and BoM (58.6% and 57.2% aged 45 years and over respectively) have the oldest age profiles. In contrast, AGD (30.9%) and Finance (31.3%) have the lowest proportion of staff aged 45 years and over.
The APS has an older age profile than the Australian labour force, with a much lower proportion of young people and more in the 35–54 years age group—at June 2008, 58.7% of ongoing employees were in this age group compared with only 44.7% of the Australian labour force.8 Despite the continuing growth in older workers in the APS, they are still under-represented compared with the broader labour force.

Length of service The median length of service in the APS at June 2008 was eight years for ongoing employees. This is an increase from the previous year, reflecting a drop in ongoing engagements over the past two years. Figure 2.11 shows the profile of length of service over the past 15 years. The number of employees with fewer than five years of service plateaued this year, after rising for several years. As a proportion of all ongoing employees, this cohort has risen from 24.4% of all ongoing employees 10 years ago to 35.4% at June 2008.
The proportion of employees with 30 or more years of service has risen from 2.4% to 4.4% over the past 15 years.
Figure 2.11: Ongoing employees—length of service, 1994 to 2008
Source: APSED
Location Over one-third (36.6%) of ongoing employees are located in Canberra. There has been a steady rise in this proportion for several years—in 1994, the proportion was 33.2%.
Although most agencies have their main office in Canberra, there is considerable variation in the level of Canberra and outside ACT employment. At June 2008, one-quarter of agencies had all their ongoing employees in the ACT, while over 10% had none based in Canberra. Twenty-six agencies had fewer than one-third of their ongoing employees in Canberra. Large agencies in this group included DVA (30.8%), Customs (26.4%), Medicare Australia (20.5%), ATO (14.8%), Centrelink (11.5%), BoM (1.0%) and ASIC (0.8%).
The proportion of employees located in Canberra increases at higher classification levels—at June 2008, over three-quarters of ongoing SES (75.1%) and 61.3% of ELs were employed in Canberra compared with only 15.1% of APS 3–4s and 12.2% of APS 1–2s (see Figure 2.12).

The increase in Canberra-based employment over time is likely to reflect, in part, proportional increases in employment at these higher levels.
Figure 2.12: Ongoing employees by classification and location, June 2008
Source: APSED
Engagements and separationsThere were 15,790 engagements and 11,946 separations of ongoing employees during 2007–08. The number of engagements was lower than that for the previous year, and included a number of agencies moving into coverage of the Act, although these engagements had only a small impact on total engagements, involving just 148 ongoing employees. Separations were higher than in 2006–07 and the largest since 1998–99.
Figure 2.13 shows ongoing engagements and separations as a proportion of all ongoing employees for the past 15 years.

Figure 2.13: Ongoing engagement and separation rates, 1993–94 to 2007–08
Source: APSED
EngagementsThis was the second year in a row that the number of ongoing engagements to the APS fell, although the long-term trend in the APS over the past 20 years has been upward.
The decline in engagements this year was particularly evident in the second half of the year. From July to December there were 9,103 engagements, falling to 6,687 in the period from January to June. This is a reversal of the result for the previous five-year periods when, on average, engagements were more concentrated in the second half of the year (47.5% in the first half and 52.5% in the second). This may reflect the impact on agencies of the additional efficiency dividend which took effect from March 2008.
Trainees were the only group in which engagements rose in actual numbers—from 393 in 2006–07 to 505 in 2007–08—an increase of 28.5%. The agencies which increased their recruitment of trainees included Customs (114 more than the previous year) and ATO (75). The number of graduate trainees engaged fell slightly (from 1,253 in 2006–07 to 1,221 in 2007–08), although the proportional decrease was not as great as for the APS overall.
Figure 2.14 shows the proportion of engagements by classification for the past 15 years. It confirms the long-term decline in engagements at the APS 1–2 levels. This decline has slowed in recent years, and APS 1–2 engagements have stabilised at around 10% of all ongoing engagements. Engagements at the APS 1 level fell from 764 to 502 this year, due mainly to less recruitment at this level by Medicare Australia (down from 453 to 286). Engagements fell proportionately at the APS 3–4 levels for the second year, although this group still accounts for close to half of all ongoing engagements to the APS.

Figure 2.14: Ongoing engagements by classification, 1993–94 to 2007–08
Source: APSED
Women accounted for 61.0% of all ongoing engagements during 2007–08—much the same level as in the previous year. Over time, though, female engagement has been increasing and in 1993–94 the proportion was 53.5%.
For the second consecutive year, the largest proportional growth in ongoing engagements during 2007–08 was in the under 25 years age group. This age group outnumbered the 35–44 age group again this year. The 55 years and over age group also rose proportionally, after falling slightly in 2006–07. Over the past 15 years, this age group has increased its share of engagements from 2.1% in 1993–94 to 4.4% in 2006–07 and 4.8% in 2007–08. The increase has been relatively steady since the removal of compulsory age 65 retirement in 1999.
Figure 2.15 shows changes in the age profile of ongoing engagements for the past 15 years.

Figure 2.15: Ongoing engagements by age group, 1993–94 to 2007–08
Source: APSED
The median age of engagements during 2007–08 was 32 years (33 years for men and 31 years for women). This has remained steady for the past five years, except for 2005–06 when the move of Medicare Australia into the APS skewed the engagement data. ATO (13.8%), Defence (13.1%) and Centrelink (9.5%) accounted for over one-third of all engagements during 2007–08.
Mobility between the APS and the wider labour market can be gauged by the proportion of employment opportunities filled by engagement (i.e. from outside the APS) as a proportion of opportunities filled by engagements and promotions. During 2007–08, 44.1% of employment opportunities were filled by engagement. This is a substantial decrease from 52.1% during 2006–07. Excluding ‘base-grade’ recruitment—the APS 1 to APS 3, Graduate APS and trainee classifications—the proportion of opportunities filled by engagement during 2007–08 was 29.2%, down from 36.0% the previous year. While the number of engagements fell by 18.7% during the year, the number of promotions rose by 12.0%. Promotions within an agency accounted for 93.5% of all promotions during 2007–08, up slightly from 92.6% the previous year.
Re-engagement and prior service
Of the 15,790 ongoing engagements during 2007–08, 1,849 (11.7%) had worked previously in the APS as ongoing employees. Of these, over one-quarter (491) were re-engaged by the same agency in which they had previously worked. The median length of service prior to re-engagement was 6.1 years.
A total of 5,643 (35.7%) of ongoing engagements during 2007–08 had previously worked as non-ongoing employees in the APS. Of these, 4,779 were engaged by the same agency in which they had been employed previously on a non-ongoing basis. This demonstrates that non-ongoing employment continues to be a major entry point into the APS. The median

length of service as a non-ongoing employee prior to ongoing engagement was 0.8 years. A total of 6,615 (41.9% of all ongoing engagements) had some prior experience in the APS.
Of the 12,413 non-ongoing employees at June 2008, 1,949 (15.7%) had worked previously in the APS as ongoing employees. In general, the proportion with this prior experience increased with level up to EL 2 where 44.0% of non-ongoing employees had previously worked as ongoing employees. For non-ongoing SES, the proportion was 36.5%. Previous ongoing experience was also high among older non-ongoing employees, with 48.5% of non-ongoing employees in the 55–59 years age group and 44.0% in the 60 years and over age group having previously worked as ongoing employees.
Separations
There were 11,946 separations of ongoing staff during 2007–08, an increase of 13.8% on the 10,498 the previous year. The overall separation rate for the APS during 2007–08 was 8.2%. The number of resignations rose from 7,719 in 2006–07 to 8,628 in 2007–08, a rise of 11.8%. The largest proportional increases during the year were in age retirements (up by 29.4%) and retrenchments (up by 20.0%). Invalidity retirements also rose—by 15.2%.
The number of age retirements (1,888) was the largest since 1988–89 reflecting, in part, the growing proportion of employees eligible for retirement. The number of retrenchments, while higher than last year’s (793, up from 661), was still considerably lower than the average for the past five years. This is likely to indicate agencies’ compliance with the Commission’s redeployment principles for downsizing which encouraged agencies to use redundancies as a last resort.
Figure 2.16 shows how the main separation types have varied over the past 15 years. Age retirements, while relatively low, have increased steadily over the period.
Women accounted for 55.5% of ongoing separations during 2007–08, up from 54.7% the previous year, but lower than their overall ongoing representation in the APS (57.1%). They were slightly over-represented in resignations (57.6%) but under-represented in all other separation types.
The agencies with the largest number of ongoing separations during the year were Centrelink (2,382), Defence (1,392) and ATO (1,133). These three agencies accounted for 41.1% of all ongoing separations, slightly lower than their combined 46.6% of ongoing APS employment.

Figure 2.16: Ongoing separations, 1993–94 to 2007–08
Source: APSED
Separations by age group for 2006–07 and 2007–08 are shown in Table 2.4. The proportion of ongoing employees in each group at June 2008 is included for comparison. The number of separations rose in all age groups. The under 20 years and over 60 years age groups had the largest proportional increases (up by 75.7% and 51.7% respectively). Comparing separations to the age profile of the APS, those aged under 35 years and those aged over 55 years separated at a higher rate than their APS representation.
Table 2.4: Separations of ongoing employees by age group, 2006–07 and 2007–08
2006–07 2007–08 % change2006–07 to 2007–
08
Ongoing employees at June 2008 %No. % No. %
Source: APSED
Under 20 37 0.4 65 0.5 75.7 0.2
20–24 732 7.0 828 6.9 13.1 4.7
25–29 1591 15.2 1867 15.6 17.3 11.4
30–34 1499 14.3 1599 13.4 6.7 13.1
35–39 1263 12.0 1512 12.7 19.7 14.4
40–44 1098 10.5 1109 9.3 1.0 14.4
45–49 937 8.9 1028 8.6 9.7 15.9
50–54 1522 14.5 1659 13.9 9.0 14.0
55–59 1034 9.8 1088 9.1 5.2 8.0
60 & over 785 7.5 1191 10.0 51.7 3.9

Table 2.4: Separations of ongoing employees by age group, 2006–07 and 2007–08
2006–07 2007–08 % change2006–07 to 2007–
08
Ongoing employees at June 2008 %No. % No. %
Total 10498 100.0 11946 100.0 13.8 100.0
The number of employees resigning at age 54 years has increased steadily over the past decade, with only a slight drop in 2002–03, and is most likely related to the financial incentives for some members of the CSS to resign just before their 55th birthday (the 54/11 effect). The resignation rate for 54-year-olds rose slightly during 2007–08 (23.4%, up from 21.6% the previous year).
Demography of the SES leadership group The SES constitutes the senior management and leadership cadre of the APS. At June 2008, the SES comprised 1.82% of all ongoing employees—up from 1.76% the previous year. The size of the SES has fluctuated over the past 15 years, but has grown steadily in both number and proportion since 2001, growing from 1,677 to 2,692 today. During 2007–08, the SES grew by 6.2%, compared with the growth for the APS overall of 2.7%.
Band 1 SES employees account for the largest proportion (74.9%) of all ongoing SES. Band 2 employees comprise 20.0% and Band 3s 5.2%. Proportionally, most of the growth during 2007–08 was in the Band 3 cohort, which grew by 16.8%. In actual numbers the biggest growth was in Band 1, which grew by 117 or 6.2%. Excluding those agencies affected by machinery of government changes during the year, the largest net increases in SES employees during 2007–08 were in ATO (22 or 9.3%), Defence (20 or 16.3%) and Finance (14 or 17.1%). Centrelink (24 fewer SES) and DHS (12 fewer) were the only agencies with substantial decreases in the size of their SES.
The representation of SES varies widely between agencies, reflecting the nature of their functions. At June 2008, it ranged from 30.0% in the Office of Parliamentary Counsel (OPC) to 0.3% in Centrelink.
Representation of women in the SES continued to rise this year, up to 37.0% from 36.1% last year. In 1994, women’s SES representation was only 16.9%. Women’s representation increased at all SES levels this year. During 2007–08, growth in the number of women was particularly strong at the SES Band 3 and SES Band 2 levels which rose by 15.6% and 13.1% respectively.
As is the case for the APS overall, women in the SES are concentrated at lower levels in the SES, although this is changing. At June 2008, 77.2% of women in the SES were Band 1s, compared with 73.5% of men. In 1994, the proportions were 82.2% and 71.5% respectively.
Table 2.5 shows that a substantial proportion of the SES are aged 50 years or over, with 38.8% of Band 1s, 56.3% of Band 2s and 67.6% of Band 3s in that age group. The age profile for women in the SES is somewhat younger than that for men—for example, at June 2008, 32.9% of female Band 1s were aged 50 years or over compared with 42.5% of male Band 1s.

At June 2008, 130 SES (or 4.8% of the total cohort) were aged 60 years or over. The number of SES in this age group has increased considerably over time, more than doubling in the past five years. Similarly, those in the 55–59 years age group account for 13.3% of the SES. The number in this age group has also risen steadily over time.
Table 2.5: Ongoing SES employees by age group, sex and level, June 2008
SES Band 1 SES Band 2 SES Band 3 Total% female
M F Total M F Total M F Total No. %
Source: APSED
25–29 1 2 3 0 0 0 0 0 0 3 0.1 66.7
30–34 18 25 43 1 0 1 0 0 0 44 1.6 56.8
35–39 139 96 235 12 7 19 2 0 2 256 9.5 40.2
40–44 218 158 376 37 34 71 7 6 13 460 17.1 43.0
45–49 341 235 576 83 61 144 19 11 30 750 27.9 40.9
50–54 325 158 483 107 54 161 34 12 46 690 25.6 32.5
55–59 145 75 220 77 31 108 26 5 31 359 13.3 30.9
60 & over 59 20 79 31 3 34 14 3 17 130 4.8 20.0
Total 1246 769 2015 348 190 538 102 37 139 269
2 100.0 37.0
Over the past 10 years, the median age of the SES has remained unchanged at 48 years. The proportion of SES aged 45 years and over, who will be eligible for retirement in the next 10 years, accounts for a substantial proportion of the SES—71.7% at June 2008. This remains a challenge for agencies in terms of succession planning and knowledge management; however, the growing number of SES aged 55 years and over suggests that many in the SES who may benefit financially from early (54/11) retirement are choosing not to do so.
Key chapter findings This year saw consolidation of a number of long-term trends in APS employment towards a more highly-skilled workforce—continuation of the growth at higher classifications and continuing high levels of recruitment of people with graduate qualifications.
The ‘typical’ new starter in the APS this year is a 32-year-old female, with graduate qualifications, and engaged at the APS 3 level. The ‘typical’ APS employee is a 42-year-old female, with graduate qualifications, working at the APS 6 level.
A positive outcome this year has been the rise in engagement at trainee classifications, against a trend of fewer engagements overall. It indicates that agencies recognise the importance of ‘growing their own’ skills within their organisations.
It is pleasing to see the continuation of the trend towards higher representation for women at higher classifications. Nevertheless, it is important that the APS remains an attractive employment option for both men and women, at all classification levels.

The increased internal labour market in some agencies this year was reflected in the strong growth in promotions—especially within agencies—relative to engagements. The decrease in mobility between the APS and the labour market, and within the APS, may be a short-term response to a tighter budgetary environment as agencies manage the additional efficiency dividend, and will be monitored in future reports.
The past two years’ improvement in employment of young people was not sustained this year. It is important that agencies continue to market themselves as an employer of choice for young people, particularly in a tightening labour market.
The long-term trend towards more employees aged 55 years and over has continued this year. This group has substantial skills and knowledge and they have an important role to play in the APS.
1 Every effort is made to ensure the integrity of APSED data, but the Commission cannot be held responsible for inaccuracies in the data provided by agencies. The Commission undertakes extensive audits of the data and, as a result of these audits, some errors in historical data have been corrected. For this reason, caution should be exercised when comparing data presented in this report with that from earlier years. Most significantly, previously published data on employee numbers may have been revised and therefore may not be directly comparable. Due to different data sources and definitions, there may be variations between the data published here and that published by individual agencies.
2 Conceptual definitions used in workforce analysis are set out in the Introduction and Explanatory Notes to the Australian Public Service Statistical Bulletin 2007–08.
3 In November 2007, 380 employees of the Mersey Campus of the North West Regional Hospital in Tasmania became non-ongoing employees of DoHA.
4 APSED data for DHS includes the Child Support Agency (CSA) and CRS Australia, which are both part of DHS. All three organisations submitted separate responses for the State of the Service agency survey and are considered separate agencies for that purpose. Separate employee survey results for DHS, CSA and CRS Australia are provided where they differ significantly from the APS average on important variables in later chapters.
5 In 1994, 537 ongoing employees were employed in other classifications and are included in the total for that year.
6 Weighting eliminates the effects that the change in the overall size of the APS has on representation. The index is given a value of 100 at June 1994, and rises and falls proportionally with the particular group’s change in the weighted number over time.
7 The method used to calculate the proportion of employees with graduate or tertiary qualifications includes those with qualifications at bachelor’s degree and above. It excludes from the denominator those for whom no data was provided by agencies, and those who chose not to provide details for their highest educational qualification. Last year’s proportion (52.1%) has been revised down from 53.0% reported last year. This is due to improved quality of data on educational qualifications as more employees have provided data this year.

These employees are in agencies that have a lower proportion of employees with graduate qualifications, so the average has dropped slightly.
8 ABS, Australian Labour Market Statistics, Cat. No. 6105.0, July 2008, ABS, Canberra, <http://www.abs.gov.au>

Chapter 3: DiversityThe Australian Public Service (APS) is strongly committed to and has a proud record in encouraging workplace diversity. There is a need to continue to focus our efforts on ensuring a highly diverse workforce across the APS, where employees have a range of gender, age, cultural background, disability status and Indigenous status. This will ensure that a broad mix of perspectives and ideas are considered when developing and implementing public policy, and also support stronger citizen engagement.
Under section 18 of the Public Service Act 1999 (the Act), agency heads must establish workplace diversity programmes to help give effect to the APS Values (the Values). According to the Public Service Commissioner’s Directions 1999 (the Commissioner’s Directions), and under the Commission’s Guidelines on Workplace Diversity (2001), agency heads are required to adhere to a series of measures to ensure workplace diversity. These include:
Develop performance indicators for their workplace diversity program so that they can evaluate the effectiveness and outcomes of the programme.1
Review their workplace diversity program at least once every four years to ensure that the program continues to give effect to the APS Values and achieves its outcomes.2
This chapter examines agencies’ commitment to workplace diversity through their internal policies and practices. It looks at the success or otherwise of the APS in improving employment outcomes for particular groups of employees, including Aboriginal and Torres Strait Islander employees, employees with disability, employees from non-English speaking backgrounds, and employees of different ages. It also looks at what agency attributes attracted employees from the various diversity groups to their current job. A broader analysis of attraction factors for the whole of the APS can be found in Chapter 4. The chapter draws on data from the Australian Public Service Employment Database (APSED) and on responses to the agency and employee surveys to make an assessment of how well the APS is using diversity within its workplaces.
The APS continues to make good progress in addressing employment-related disadvantage for women which is reflected in their improved representation, especially at higher classifications. Specific trends in women’s employment are discussed in Chapter 2 and variations in men’s and women’s views are highlighted in other chapters where they are significant.
APSED and the quality of EEO dataInformation on the diversity status of APS employees comes from individual agencies and is stored on APSED. The provision of equal employment opportunity (EEO) data by APS employees to their agency is voluntary, with the exception of sex. Therefore, as with any voluntary data collection, APSED tends to under-represent the actual number of employees in these groups.

Employees for whom no data is available are included in the population for calculating percentages. Therefore, the percentages provided on representation of EEO groups in the APS are likely to under-estimate the actual proportions in agency and APS populations.
All APSED data in this chapter covers only ongoing employees. This is due to the quality of diversity data provided by agencies for non-ongoing employees, which is generally lower than that for ongoing employees.
Of the data provided by agencies to APSED at the end of June 2008, around 43.0% had comprehensive EEO data. Indigenous status, for example, was provided for 59.3% of employees and data on disability for 54.7%. Once an employee’s data is provided to APSED, it is stored there permanently unless the employee subsequently chooses not to provide it. If the person moves to another agency that doesn’t provide this information to APSED, then the previous data is retained.
Using this approach, Indigenous status is available for 74.3% of ongoing employees in the database, and disability status is available for 68.4%. These proportions are higher than those reported last year, indicating improved data quality in some agencies. The quality of employee-provided data overall, however, is still of concern and many agencies are still unable to provide data for nearly half of their employees.
Trends in representation of EEO groupsTable 3.1 shows proportional representation in the APS for Indigenous Australians, people with disability and people from a non-English speaking background for the past 10 years.
Table 3.1: Representation of EEO groups among ongoing employees, 1999 to 20083
1999 %
2000 %
2001 %
2002 %
2003 %
2004 %
2005 %
2006 %
2007 %
2008 %
Source: APSED
Indigenous Australians 2.7 2.5 2.6 2.6 2.5 2.5 2.3 2.2 2.2 2.1
People with disability 4.9 4.6 4.3 4.1 4.2 4.1 4.0 3.6 3.4 3.1
People from NESB1 5.6 5.6 5.6 5.6 5.5 5.5 5.7 5.9 6.0 6.0
The representation of Indigenous Australians fell slightly during 2007–08, from 3,108 (2.2%) to 3,059 (2.1%).
For employees with disability, representation declined again this year to 4,636 (3.1%) from 4,820 (3.4%) at June 2007.
During 2007–08, the actual number of people from a non-English speaking background4 grew from 8,612 to 8,804 but remained steady at 6.0% as a proportion of all ongoing employees.
The improvement in data quality for the past two years is pleasing, and suggests that agencies are having some success at establishing environments where employees feel more

comfortable in identifying their EEO status, as well as developing systems to collect the data. For all groups, last year’s proportions have been revised upwards as a result of improved data quality, for example, the Indigenous figure in last year’s report was 2.1% in 2006–07, but has been adjusted to 2.2%.
Agency commitment to workplace diversityWorkplace diversity can only become embedded in the APS if agencies are committed to the concept. One way for agencies to do this is to ensure they have a workplace diversity programme in place which is reviewed regularly.
In this year’s survey, agencies were asked whether they have a workplace diversity programme in place. While more than three-quarters (77%) of agencies said they had a workplace diversity programme in place, nearly one-fifth of agencies (19%) said their programme was still being developed and 4% of agencies did not have one at all.
Of those agencies that did have a programme, 36% said it was currently being reviewed and 34% said their programme was reviewed in the past two years. Ten per cent of agencies said their programme had never been reviewed.
This indicates that, despite workplace diversity being on the APS agenda for more than a decade, a minority of agencies have not yet fully embraced the concept by having a programme in place.
From an employee’s perspective, when asked whether their organisation was committed to creating a diverse workforce, 69% of APS employees agreed. This was the same as last year’s figure.
In terms of how well workplace diversity was managed, 65% of employees said their agency managed diversity in their workplace well, with young employees (those aged under 25 years) most likely to think that their agency managed workplace diversity well (82%). However, employees with disability were much less likely to agree (49%). This indicates a significant disparity between groups in their perceptions of how well agencies manage diversity in the workplace.
Aboriginal and Torres Strait Islander employeesThe two years of growth in the number of Indigenous employees, recorded in last year’s report, was not sustained this year, and the long-term trend decline in the proportion of Indigenous employment in the APS continued (now 2.1%). The actual number of Indigenous employees fell from 3,108 at June 2007 to 3,059 at June 2008 (a reduction of 1.6%).
Data on APSED is similar to that reported for Indigenous representation in the employee survey (2%). The survey results have been consistent for the past four years and suggest that, despite some concerns about data quality, APSED is not substantially under-representing the proportion of Indigenous Australians in the APS.
Indigenous representation in the APS is lower than that in the Australian community (2.1% compared with 2.3%).5 However, it compares favourably with that of the broader Australian
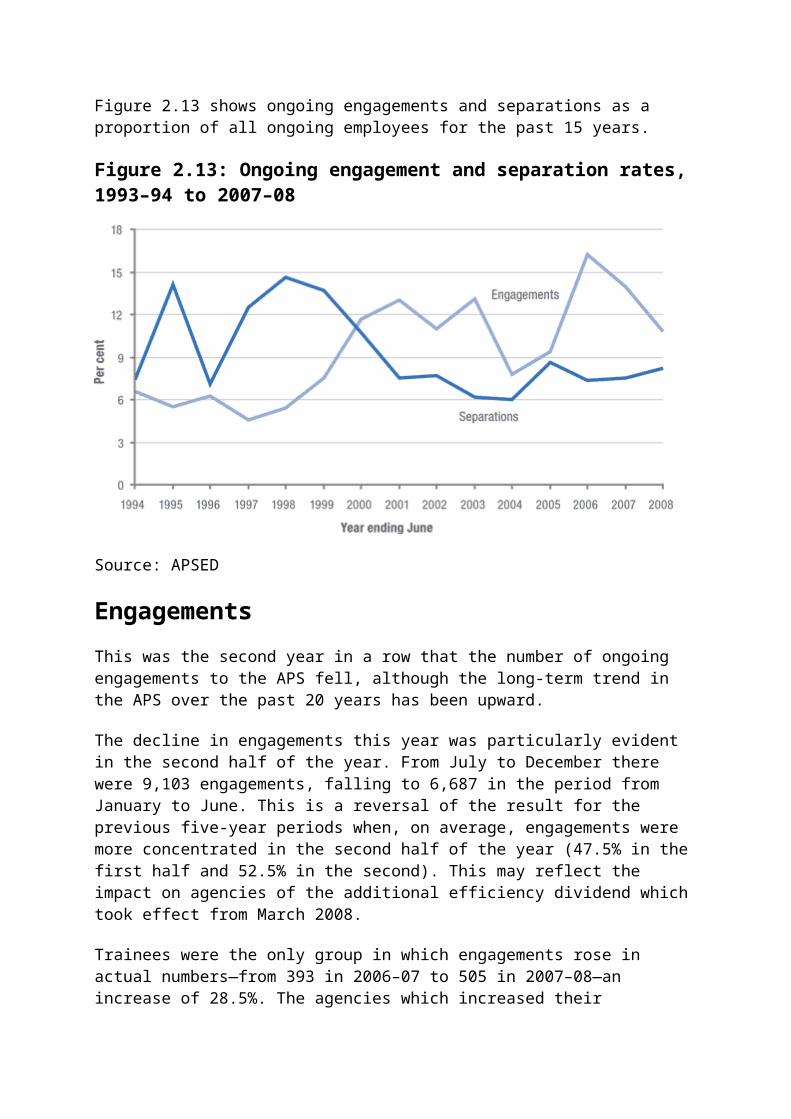
workforce, in which 1.3%6 of Australian workers identified as Indigenous Australians, and even more favourably when analysis is restricted to people employed in APS equivalent occupations in the broader Australian workforce (0.9%).7
Representation of Indigenous employees varies widely among agencies. It is highest in those agencies that deliver services predominantly to, or work with, Indigenous communities, suggesting a concentration of Indigenous employees in Indigenous-specific roles. As Table 3.2 shows, the agencies with over 10.0% Indigenous representation are those with significant Indigenous functions. FaHCSIA is the only large agency in this group.
Table 3.2: Agencies with the highest proportion of ongoing Indigenous employees, June 2008
Indigenous ongoing employees
Total ongoing employees
Indigenous employees (%)
Source: APSED
AHL 301 362 83.1
TSRA 25 36 69.4
AIATSIS 9 48 18.8
NNTT 23 217 10.6
FaHCSIA 282 2810 10.0
Figure 3.1 shows representation of Indigenous employees in those agencies with more than 1,000 ongoing employees at June 2008. Large agencies with above average representation of Indigenous employees include FaHCSIA (10.0%), DEEWR (5.8%), DEWHA (4.2%), Centrelink (3.6%) and DoHA (2.7%).

Figure 3.1: Representation of Indigenous employees in agencies with more than 1000 ongoing employees, June 2008
Source: APSED
Indigenous employees are still concentrated in a small number of agencies. At June 2008, four agencies employed over half of all ongoing Indigenous employees (59.3%). These agencies were Centrelink (905 or 29.6%), DEEWR (325 or 10.6%), AHL (301 or 9.8%) and FaHCSIA (282 or 9.2%).
Thirty agencies reported that none of their ongoing employees had identified as Indigenous. These agencies were all small except for the Australian Transaction Reports and Analysis Centre (AUSTRAC) and the Australian National Audit Office ANAO.
The quality of data on the Indigenous status of employees varied widely among agencies—at June 2008, seven agencies had ‘no data’ recorded on APSED for more than half of their

ongoing employees. Most of these agencies were small, except for the Office of the Workplace Ombudsman (WO) (no data for 68.8% of ongoing employees), the Workplace Authority (66.9%) and Defence (58.9%).
Excluding agencies affected by machinery of government changes, the largest increases in Indigenous employment during 2007–08 were in ATO (15 employees) and AHL (10 employees). The largest decrease was in Centrelink (81 employees).
Table 3.3 shows that the number of Indigenous employees rose at the APS 5–6 and EL classifications during 2007–08, remained steady in the SES and fell at all other classifications. The proportion of Indigenous employees at the APS 5–6 and EL classifications rose during the year, from 40.3% to 43.0%. This result is particularly pleasing, and continues a long-term trend—in 1999, the proportion was only 27% of all Indigenous employees.
Indigenous representation at the Graduate APS and Trainee classifications fell during 2007–08, both in actual numbers and as a proportion of the classification. As noted in Chapter 2, some agencies engage trainees at the APS 1–2 levels rather than in the actual trainee classifications, so variations over time may not necessarily reflect agencies’ use of trainees more broadly.
Despite the fall in Indigenous Graduate APS employees during 2007–08, this group’s representation has grown proportionally over the past 10 years.
The number of Indigenous SES has not changed between 1999 and 2008, but the group has decreased in proportional terms as the size of the overall SES has increased substantially over that period.
As noted in Chapter 2, the APS is increasingly becoming a graduate workforce. The proportion of Indigenous employees with graduate qualifications is much lower than the APS average—26.9% at June 2008 compared with an APS average of 52.5%.8 It is likely that this disparity impacts on the ability of some potential Indigenous employees to enter the APS and progress to higher classifications. Agencies may wish to make greater use of traineeships as an entry point for Indigenous Australians to ameliorate this difference in qualification.
Table 3.3: Representation of ongoing Indigenous employees by classification, 1999, 2007 and 2008
1999 2007 2008
No.
% of class’n
who are Indigeno
us
% of Indigeno
us employee
s
No.
% of class’n
who are Indigeno
us
% of Indigeno
us employee
s
No.
% of class’n
who are Indigeno
us
% of Indigeno
us employee
s
Source: APSED
APS 1-2 564 4.5 20.6 364 5.1 11.7 355 5.7 11.6
APS 3-4
1340 3.6 49.0 138
2 2.8 44.5 1294 2.6 42.3

Table 3.3: Representation of ongoing Indigenous employees by classification, 1999, 2007 and 2008
1999 2007 2008
No.
% of class’n
who are Indigeno
us
% of Indigeno
us employee
s
No.
% of class’n
who are Indigeno
us
% of Indigeno
us employee
s
No.
% of class’n
who are Indigeno
us
% of Indigeno
us employee
s
APS 5-6 603 2.0 22.1 910 1.9 29.3 948 1.9 31.0
EL 135 0.7 4.9 343 1.0 11.0 367 1.0 12.0
SES 18 1.1 0.7 18 0.7 0.6 18 0.7 0.6
Trainee 64 39.3 2.3 55 13.8 1.8 46 11.5 1.5
Grad APS 9 1.3 0.3 36 2.9 1.2 31 2.4 1.0
Total 2733 2.7 100.0 310
8 2.2 100.0 3059 2.1 100.0
Indigenous employee numbers are affected by the number of Indigenous engagements to the APS and the number of Indigenous employees separating from the APS.
Indigenous engagements have varied over the past 10 years, but have generally fallen as a proportion of all engagements. During 2007–08, Indigenous employees accounted for 2.5% of ongoing engagements, down from 2.8% the previous year. The proportion was the second lowest for the past 10 years. The number of Indigenous engagements also fell—from 552 in 2006–07 to 388 in 2007–08. The Indigenous engagement rate has been equal to or higher than overall Indigenous representation within the APS for each of the past 10 years. These trends are shown in Table 3.4.
During 2007–08, Indigenous employees accounted for 3.6% of all engagements to the main APS entry levels—APS 1 to APS 3 and graduate and other trainee classifications—a decrease from 4.2% the previous year.
Indigenous separations can be looked at in two ways—either as a proportion of Indigenous employees, or as a proportion of total separations. Using the first method, 14.2% of all ongoing Indigenous employees separated during 2007–08, an increase from 13.8% in 2005–06 and 12.3% in 2006–07. The comparable separation rate for the APS overall during 2007–08 was significantly lower (8.2%).
Table 3.4 looks at Indigenous separations using the second method described above. As a proportion of all ongoing separations, Indigenous separations rose this year, from 3.5% in 2006–07 to 3.7% in 2007–08, substantially higher than overall Indigenous representation of 2.1%. The separation rate for Indigenous employees has been higher than their engagement rate for all but two of the past 10 years, and has been higher than their overall representation every year.

Table 3.4: Indigenous representation in engagements and separations of ongoing employees, 1998–99 to 2007–08
Year ending June
1999 2000 2001 2002 2003 2004 2005 2006 2007 2008
Source: APSED
Engagements 270 308 426 425 466 318 323 458 552 388
% of engagements 3.4 2.6 3.1 3.5 3.1 3.4 2.8 2.2 2.8 2.5
Separations 477 422 270 286 309 392 444 401 371 439
% of separations 3.3 3.8 3.4 3.4 4.3 5.4 4.2 4.2 3.5 3.7
% of ongoing staff 2.7 2.5 2.6 2.6 2.5 2.5 2.3 2.2 2.2 2.1
Indigenous employees continue to have a much shorter length of service before leaving the APS. During 2007–08, 50.8% of Indigenous employees who separated from the APS had fewer than five years of service, compared with 43.1% of non-Indigenous employees.
The continuing trends of relatively high separation rates and shorter periods of service for Indigenous employees appear to be entrenched. If agencies want to reverse these trends, they may need to look closely at the reasons why Indigenous employees choose to leave the APS.
APS Employment and Capability Strategy for Aboriginal and Torres Strait Islander employees
To help raise the number of Indigenous employees in the APS, the Commission released the APS Employment and Capability Strategy for Aboriginal and Torres Strait Islander Employees9 (the Strategy) in August 2005. Since then, the number of Indigenous employees in the ongoing APS workforce increased for two years, before falling slightly during 2007–08. An independent evaluation of the Strategy was conducted earlier this year.
Evaluation of the Indigenous Employment StrategyThe Australian Public Service Commission implemented the APS Employment and Capability Strategy for Aboriginal and Torres Strait Islander Employees10 (the Strategy) in August 2005 in response to declining recruitment and retention levels of Indigenous APS employees identified in the State of the Service Report 2003–04.11
The Strategy contributes to the Government’s commitment to improving social equity and economic development by increasing Indigenous employees’ skills and access to wider employment opportunities. It is also a factor in building the capacity of the APS to deliver effective services to Indigenous people and in increasing the level to which agencies are able to use the existing and potential skills of Indigenous employees to meet their business needs.
An independent evaluation of the Strategy was conducted in early 2008. The findings of the evaluation were positive. They confirmed that the Strategy has been successful in stabilising the employment levels of Indigenous APS employees since 2006, and in raising the profile of the APS as an employer of choice for Indigenous Australians.

The evaluation identified Pathways to Employment as a particularly successful element of the Strategy, which added about 260 Indigenous employees to the APS. Other employment initiatives include the National Indigenous Cadet Project, the Indigenous Graduate Programme, and the Indigenous Entry Level Recruitment Programme.
The Commission’s Indigenous development programmes for existing Indigenous APS employees were also found to be successful. These include Career Trek, a career development programme that was delivered to some 330 staff members in 14 locations, and Horizons, a secondment and coaching programme for high-performing Indigenous employees aimed at providing them with career progression opportunities.
In a bid to strengthen support for Indigenous employees, the Indigenous APS Employee Networks were expanded and are now in operation in almost all state and territory capital cities, as well as in some regional centres.
A major recommendation of the evaluation was that it is critical for the Strategy to be extended to enable the APS to build on and strengthen its focus on the retention of Indigenous employees. The report said not taking this approach could mean the gains made towards retaining Indigenous employees are likely to be lost.
The evaluation of the Strategy also identified a number of key areas for improvement. One recommendation was for the Commission to work more closely with agencies to develop and implement their own Indigenous employment strategies to meet their specific business needs. In response to this, the Commission developed Building An Indigenous Employment Strategy—A Starter Kit for APS Agencies.12
Other recommendations included:
increasing centrally coordinated recruitment activities to boost trainee numbers and attract more Indigenous Australians to APS 5 and 6 and EL positions
improving retention rates through a range of initiatives such as a capability framework detailing the skills and organisational environment required to retain Indigenous employees, improving training and development opportunities (particularly in regional and remote locations), and engaging with Indigenous Coordination Centres (ICCs) more effectively
greater support for Indigenous employees.
The Commission is developing proposals to refine and extend the Strategy beyond June 2009.
In August this year, the Commission released a starter kit for APS agencies (Building An Indigenous Employment Strategy—A Starter Kit for APS Agencies) 13 that helps agencies to identify their specific business needs and objectives. It contains a range of initiatives to assist agencies wishing to formulate an Indigenous Employment Strategy (IES) based on the agency workplace, recruitment and retention, and recommended actions.
According to this year’s agency survey, 29% of agencies said they had a formal IES in place, a drop from last year (32%). Forty-eight per cent of agencies reported they did not have a formal IES in place, and 22% of agencies said they were developing one.

A higher proportion of agencies reported having a Reconciliation Action Plan (RAP) in place to help them build positive relationships between Indigenous and non-Indigenous Australians, and align agencies’ strategic, corporate and divisional business plans. A RAP also identifies specific actions to help improve the lives of Indigenous Australians, both in APS agencies and the wider community.14 This year’s survey showed that 40% of agencies have a RAP and 19% of agencies were developing a plan. Many agencies developed RAPs to recognise the 40th anniversary of the 1967 Aboriginal referendum.
Recruitment and retention measures used in agencies
While the use of formal IESs among agencies decreased slightly this year, the use of specific recruitment and retention measures for Indigenous Australians continues to be widespread, with many agencies participating in elements of the Commission’s strategy.
During 2007–08, the Commission collaborated with 35 APS agencies to deliver Pathways to Employment recruitment programmes for Indigenous graduate, cadet and entry-level positions. Support programmes and services to these recruits were increased to enhance short-to medium-term retention prospects.
Through the Indigenous Graduate Recruitment programme, the Commission recruited and placed 26 Indigenous graduates in 17 APS agencies. The Commission expects a similar number will be engaged through the 2009 intake, with 28 APS agencies involved. The Commission also recruited and placed 35 Indigenous tertiary students in cadet positions in 15 agencies through its bulk recruitment initiative under the National Indigenous Cadetship Project.
The Indigenous Entry Level programme provides a pathway to employment for Indigenous Australians who do not have tertiary qualifications. This year, the Commission recruited and placed 23 trainees across eight APS agencies through this programme and coordinated the delivery of formal training towards a Certificate III or IV in Government for Indigenous participants engaged as entry-level recruits.
Pathways support programmesTo enhance short- and medium-term retention of new recruits and to promote a whole of government view in career planning and development, the Commission— in partnership with several APS agencies—increased support programmes delivered to Pathways recruits. New initiatives developed and implemented included:
a transition programme for incoming 2008 graduates to familiarise them with the APS environment, introduce them to Indigenous APS networks and orient them to Canberra and their home agencies
a whole of government induction programme for 2008 graduates which provided a strategic overview of the structure and role of the APS and its relationship to government, with keynote speakers such as central agency heads, key ministerial advisers and senior Indigenous employees
additional skills development in APS leadership, career management and communication
training in mentoring for Indigenous APS employees who will mentor new recruits
establishment of an Indigenous Pathways alumni in Canberra and Sydney.
This year, most agencies (73%) reported using one or more measures to recruit and retain Indigenous Australians (see Table 3.5), although a quarter of agencies (27%) did not use any measures. Of those agencies that used measures, the average number of measures was five, similar to last year’s result.
The most common measures used by agencies continue to be providing Indigenous employees with study options, with more than half offering options such as financial assistance for study and study leave, and a range of training programmes and tertiary courses, including scholarship schemes. The proportion of agencies using study options has increased substantially over the past two years—from 45% in 2005–06 to 53% in 2007–08.
There was also an increase in the proportion of agencies using a range of other recruitment and retention strategies for Indigenous employees (39% in 2007–08, compared to 35% in 2006–07). These included ATO’s School to Work sponsorship programme in Queensland and a range of Indigenous cadet and graduate programmes across agencies.
The next most useful strategies for agencies were providing mentoring (40%) and advertising employment opportunities in Indigenous media (37%).
Table 3.5: Agency measures used to recruit and/or retain Indigenous Australians, 2007–08
Measures to recruit/retain Indigenous employees
Yes (%)
Being developed
(%)
No (%)
Not applicable (no Indigenous
employees) (%)
Note: Percentages may not add to 100 as agencies that did not provide a response are not shown in the table. Small differences may also be due to rounding.
Source: Agency survey
Special employment measures 30 1 68 –
Identified positions 28 – 71 –
Providing other opportunities for Indigenous employees to gain skills and experience under an agency-based Indigenous employment scheme
23 4 71 –
Advertising employment opportunities in Indigenous media 37 6 57 –
Operate an internal agency-based Indigenous employees’ network 26 3 47 24
Provide study options 53 18 – 26
Provide culturally specific training programmes for Indigenous employees 26 2 46 26
Provide Indigenous cultural awareness training for all employees 23 18 40 19
Provide targeted leadership development 26 4 46 24

Table 3.5: Agency measures used to recruit and/or retain Indigenous Australians, 2007–08
Measures to recruit/retain Indigenous employees
Yes (%)
Being developed
(%)
No (%)
Not applicable (no Indigenous
employees) (%)
opportunities
Provide mentoring and/or coaching to Indigenous employees 40 7 28 26
Provide mobility and/or secondment opportunities into mainstream positions 31 3 34 30
Other recruitment and/or retention strategies 39 8 30 18
Agencies were asked whether they conducted exit interviews or exit surveys with Indigenous employees leaving their agency. Forty-one per cent of agencies said it was not applicable to them but of those to whom it was applicable, 81% said they did conduct exit interviews and/ or exit surveys.
Forty-six per cent of relevant agencies collected data on the number of Aboriginal and Torres Strait Islander people who applied for positions in their agency, an improvement on last year’s result (38%).
Employee perception of agency support
Of the employees who identified themselves as an Aboriginal or Torres Strait Islander person, 62% said their agency valued and managed diversity in the workplace well. This is consistent with the 65% of all APS employees who said that diversity is managed well in their agency.
When asked whether their organisation was committed to creating a diverse workforce, 60% of Indigenous employees agreed, although their response was lower than the proportion of non-Indigenous employees (69%) who agreed with this question. Agencies would still appear to have work to do to help improve the perception that they provide a supportive environment for employees from diverse backgrounds.
Attraction and selection
In order to find out what attracts an employee to their job and how well their expectations have been met, this year’s employee survey asked employees to rate selected agency attributes on how important they were in attracting them to their current job and whether or not the job met their expectations.
Table 3.6 shows how Indigenous employees ranked those attributes in terms of attracting them to their current job. For employees who ranked the attributes as important, the table also indicates how well expectations were met for each attribute.

Table 3.6: Agency attraction attributes—importance and how well expectations were met by Indigenous status, 2007–08
Agency attributes
Rated important in attracting employee to job Expectations met well(a)
Indigenous employees (%)
Non-Indigenous employees (%)
Indigenous employees (%)
Non-Indigenous employees (%)
(a) Expectations relate only to employees who rated the agency attribute as important.
Note: The top five attributes selected by both Indigenous and other employees are highlighted.
Source: Employee survey
Job security 94 83 75 80
Location 84 68 67 81
Interests match job 76 71 56 65
Making a difference 71 63 68 61
Important work 71 62 67 75
Gaining experience 69 50 63 66
Development opportunities 68 57 49 51
Remuneration 67 66 58 60
Good work practices 65 61 61 62
Career opportunities 63 63 51 44
Work on leading edge projects 46 43 48 54
For Indigenous employees, the top five attributes that attracted them to their job were job security (94%), location (84%), whether their interests or experience matched the job (76%), and making a difference and important work (both 71%). The importance of job security was significantly higher for Indigenous employees than for other employees (83%).
Getting an understanding of how well an employee’s expectations have been met is an important part of how agencies satisfy and retain staff—this is particularly important for Indigenous employees where retention is relatively poor. In this year’s survey, employees were asked how well their expectations were met by their agency against each of the workplace attributes. Overall, the expectations of Indigenous employees were much less likely to be met than the expectations of other employees.

In particular, expectations for developmental opportunities within agencies were not met well according to Indigenous employees. Of the 68% who said it was an important attribute, only 49% said their expectations were met well. Agencies identified offering access to study as a key strategy for attracting Indigenous employees, so these results suggest that agencies may need to examine whether the support they offer is meeting or can better meet Indigenous employees’ expectations.
In this year’s employee survey, factor analysis identified a set of 12 factors which provide an overall summary of employee perceptions of issues such as governance and integrity, agency culture (and innovation culture), leadership and management, merit and career progression, work-life balance, and personal innovation and flexibility.15
Indigenous employees were more likely than non-Indigenous employees to be satisfied with Senior Leaders and Agency Culture (see Figure 3.2). However, compared to non-Indigenous employees, Indigenous employees reported lower levels of satisfaction with current Job and Work-Life Balance.
Figure 3.2: Employee satisfaction with factors identified through factor analysis—Indigenous employees and non-Indigenous employees, 2007–08
Source: Employee survey
Employees with disabilityThe long-term decline in employment of people with disability in the APS has continued this year, with the proportion now down to 3.1%. In absolute terms, the number of employees

with disability fell for the fourth year in a row, after increasing in 2002–03 and 2003–04. The fall represented a decrease of 3.8% in the number of employees with disability, compared with an increase in overall ongoing employees of 2.7% during the year. The decrease in absolute terms (184) is the largest since 2000–01.
Results from the employee survey suggest that there is some under-reporting of disability on APSED and in agencies. The proportion of employees who reported in this year’s survey that they had an ongoing disability was 6%. Although reporting through the employee survey has been consistently higher than results on APSED, the declining representation in APSED has been consistent over a long period, and is likely to reflect a real trend. Agencies need to consider how they can overcome the under-reporting of disability, by providing a more accepting and supportive environment where employees feel comfortable in identifying themselves as having a disability.
The long-term decline in employment of people with disability can be explained partly by a reduction in the number of positions at the APS 1–2 levels, where employees with disability have historically been over-represented. The long-term proportional decline, however, has been evident at all classification levels. Figure 3.3 shows employees with disability as a proportion of all ongoing employees, by classification level, for the past 10 years. The proportional representation for employees with disability at the APS 1–2 levels rose slightly during 2007–08, from 5.1% to 5.2%, although the actual number of employees with disability in these classifications fell—from 360 to 325. Representation in the SES rose from 71 to 75 during 2007–08, but in percentage terms remained steady at 2.8%. The number of ELs who identified as having a disability also increased (up from 1,059 at June 2007 to 1,086 at June 2008) but proportional representation continued to fall due to higher overall growth in that classification group.
Figure 3.3: Representation of ongoing employees with disability, by classification, 1999 to 2008

Source: APSED
Employees with disability are somewhat less likely to have graduate qualifications than other employees—at June 2008, 42.7% of ongoing employees with disability had a bachelor’s degree or higher, compared with the APS average of 52.5%.16 In the APS workforce where having graduate qualifications is becoming the norm, the relatively less qualified employees with disability may be less able to compete for promotion.
Agencies with relatively high proportions of employees with disability are the Office of the Renewable Energy Regulator (ORER) (10%), the Commission (9%), Questacon (8.5%), AIATSIS (8.3%), and CrimTrac (8%). These are all small agencies, so the actual number of employees with disability is relatively low. Fourteen agencies, all of which were small, reported that they had no ongoing employees with disability.
The quality of data on the disability status of employees varied widely among agencies—at June 2008, 10 agencies had ‘no data’ recorded on APSED for more than half of their ongoing employees. Most of these agencies were large or medium in size—the Workplace Ombudsman (no data for 71.5% of ongoing employees), the Workplace Authority (68.5%), Defence (67.1%), the Australian Trade Commission (Austrade) (63.7%), Customs (51.9%) and the Australian Film Commission (AFC) (50%).
While the number of employees with disability fell overall, there were small increases in some agencies. The largest increase was in FaHCSIA where the number of employees with disability increased by 12, although part of this increase was due to employees moving to that agency following machinery of government changes. The agencies with the largest decreases in employment of people with disability were Centrelink (107 fewer employees with disability), Defence (42 employees), ABS and DIAC (both 13 employees), DVA (12 employees), Customs and DHS (both 11 employees) and Medicare Australia (10 employees). Despite the fall in employment of people with disability during 2007–08, Centrelink continues to have above average representation for this group—5.2% at June 2008—although it fell from 5.4% at June 2007.
Figure 3.4 shows the proportion of people with disability in agencies with more than 1,000 ongoing employees at June 2008. Large agencies with representation rates equal to or above the APS average were FaHCSIA (6.3%), Centrelink (5.2%), DoHA (4.2%), BoM (3.6%), ABS and DVA (both 3.3%), and Defence and DEEWR (both 3.1%).

Figure 3.4: Representation of employees with disability in agencies with more than
Source: APSED
The age profile of employees with disability is somewhat older than for the APS overall, with a median age of 47 years at June 2008 compared with the APS average of 42 years. This group also has a much longer length of service than the APS overall with a median length of service of 15 years compared with the APS average of eight years.
The engagement rate for employees with disability was fairly constant at 1.4%. The separation rate fell slightly, from 3.7% to 3.6% (see Table 3.7). The engagement rate was substantially lower than the representation rate of employees with disability in the APS (3.1%) while the separation rate was somewhat higher than the group’s representation. The separation rate for employees with disability has been higher than their APS representation

for all but one of the past 10 years. Employees with disability are overrepresented in retrenchments and age-retirements—the latter likely reflecting their older age profile.
Table 3.7: Representation of employees with disability in engagements and separations of ongoing employees, 1998–99 to 2007–08
1999 2000 2001 2002 2003 2004 2005 2006 2007 2008
Source: APSED
Engagements 162 194 203 270 519 240 261 350 264 224
% of engagements 2.1 1.6 1.5 2.2 3.4 2.6 2.3 1.7 1.4 1.4
Separations 781 515 332 359 317 349 440 454 387 432
% of separations 5.4 4.7 4.2 4.2 4.4 4.8 4.1 4.8 3.7 3.6
% of ongoing staff at 30 June 4.9 4.6 4.3 4.1 4.2 4.1 4.0 3.6 3.4 3.1
The under-representation in engagements of employees with disability has a relatively greater impact than their higher separation rate. This may reflect a range of factors, including misconceptions held by agencies about their ability to undertake a wide range of work, lack of support in the workplace and inability to access job information.
Agency progress in implementing the MAC objectives to support the employment of people with disability
Much stronger commitment by all agencies is needed to reverse the long-term decline in the representation of people with disability in the APS (3.1% in 2008, down from 4.9% in 1999). Over the past year, agencies have worked on implementing the eight Management Advisory Committee (MAC) objectives to promote the employment of people with disability, but those actions are yet to be reflected in a turnaround in employment trends for people with disability. MAC members committed to these objectives in its August 2006 report, Employment of People with Disability in the APS.17 The MAC objectives required that agencies improve their policies and practices to attract and retain employees with disability. It is very disappointing that two years on, there is still no sign of traction on this issue.
While not all initiatives may be appropriate for all agencies, each agency has been asked to determine how best to approach the initiatives in order to meet the MAC objectives. The agency survey in 2009 will seek more information on initiatives that agencies have put in place to support people with disability, consistent with the MAC objectives, and also examine the performance of individual agencies. ‘In light of the outcomes of the 2008–09 State of the Service Report, MAC, through the Commission, will review the achievements and progress of APS agencies at that time.’18
It is clear that considerably more work needs to be done by agencies to boost the representation of people with disability in the APS which continues to lag behind their representation in the community.
Helping agencies meet the MAC objectives

As part of its ‘social inclusion’ agenda, the Government is developing a National Mental Health and Disability Employment Strategy. It is clear from consultations with the Government and the community to date that the APS will play a key role in developing and implementing strategies to encourage the employment of people with disability.
To support agencies in their efforts to improve the employment of people with disability, in December 2007 the Commission released Ability at Work—Tapping the Talent of People with Disability19 and Ability at Work—Working Better Together, 20 which are designed to provide APS managers with good practice advice and a range of information and training resources on approaches to recruitment, retention and day-to-day management of employees with disability. These publications complement Employment of People with Disability in the APS and they are also aimed at providing assistance to disability support providers and others involved in supporting employment of people with disability.
This section looks at agencies’ progress under four key headings: cultural change; access to employment; support; and improving and monitoring performance.
Cultural change
Creating a culture that values diversity and actively promotes the employment of people with disability is the first MAC objective. Agencies made substantial improvements over the past year in highlighting the business case for employing people with disability through workforce and business plans, workplace diversity programmes, and recruitment and retention policies. Thirty-two per cent of agencies implemented these strategies in 2007–08, compared to 15% of agencies in 2006–07.
In this year’s agency survey, 43% of agencies used initiatives specifically targeted at developing a culture that values diversity and actively supports the employment of people with disability. This has increased slightly compared to the proportion of agencies that used these initiatives last year (40%). Fifty-eight per cent of agencies implemented mainstream policies and procedures to encourage the recruitment and retention of people with disability, also up slightly from last year’s result (55%).
Despite these modest improvements by agencies, and apart from the fact that most agencies have in place mainstream policies and procedures to foster the recruitment and retention of people with disability, more than half of agencies do not have strategies designed to create inclusive workplace cultures that value and promote the employment of people with disability.
Agencies also failed to acknowledge the importance of creating this change in culture—an essential ingredient for agencies to become an employer of choice among this diversity group—with very few agencies listing creating or encouraging a diverse workforce among their key workforce challenges as part of this year’s agency survey.
Access to employment
An inability to access job advertisements and recruitment processes, together with employer perceptions and a lack of work experience are just some of the challenges people with disability can encounter when trying to get a job. Table 3.8 shows agencies’ progress on the
following three MAC objectives, which involve providing access to employment for people with disability:
flexible recruitment strategies that are accessible to applicants with disability accessible training, cadetship and mentoring opportunities for people with disability special employment measures to employ people with intellectual disability.
Table 3.8: Agency initiatives to improve access to employment for people with disability, 2007–08
Initiatives Yes (%)
No (%)
(a) Excludes the 19% of agencies who said that this question was not applicable to them.
Source: Agency survey
Objective two—flexible recruitment strategies that are accessible to applicants with disability
Work with organisations that specialise in placing people with disability in employment 37 63
Advertise vacancies through disability employment and support services/networks 13 87
Ensure any recruitment agencies contracted by your agency encourage and support people with disability 39 61
Accept applications in different formats and give people with disability reasonable time to lodge applications and/or make appropriate adjustments to any direct testing situation
88 12
Have processes in place to ensure that methods of selection do not indirectly discriminate against applicants with disability 90 10
Ensure delegates and selection panels are cognisant of the diverse needs of applicants with disability 83 17
Agency collected data on the number of people with disability who applied for positions in their agency(a) 47 53
Objective three—accessible training, cadetship and mentoring opportunities for people with disability
Provide opportunities (such as traineeships or cadetships) for people with disabilities to gain skills and experience under an agency-based employment scheme
9 91
Participate in mentoring programmes for students with disability interested in a career in the APS 7 93
Objective four—special employment measures to employ people with intellectual disability
Use special employment measures limiting employment opportunities only to people with intellectual disability 7 93
Use external organisations to assist in designing appropriate positions and 11 89

Table 3.8: Agency initiatives to improve access to employment for people with disability, 2007–08
Initiatives Yes (%)
No (%)
selection criteria and identifying suitable applicants for positions to be filled by people with intellectual disability
In terms of implementing flexible recruitment, the biggest improvement has been made in the number of agencies that have implemented measures to ensure people with disability are given reasonable time to lodge job applications and that they are able to lodge them in different formats. The number increased substantially, from 63 agencies (72%) last year to 79 agencies (88%) this year.
The number of agencies that worked with organisations specialising in placing people with disability in employment also increased from 28 agencies (32%) last year to 33 agencies (37%) this year. The number of agencies with processes in place to ensure that selection methods do not indirectly discriminate against applicants with disability remains high, increasing slightly this year, from 77 agencies (88%) in 2006–07 to 81 agencies (90%) in 2007–08.
However, agencies need to make substantial improvements in their use of disability employment and support services and networks when advertising job vacancies. Only 13% of agencies (12 agencies) currently use these services and networks, up only slightly from last year (10% or 9 agencies). Agencies can help meet the MAC objective on flexible recruitment strategies through the use of services such as the not-for-profit organisation Disability Works Australia, which is used by Finance and Treasury to advertise vacancies, or the Australian Government initiative, the Disability Employment Network (DEN), which is overseen by DEEWR.
Disability Employment Network—Star ratings for membersThe Disability Employment Network (DEN) is a network of specialist employment services supporting people with disability to find and maintain work in the open labour market. DEN is made up of more than 200 community and private organisations across Australia that provide expert support and services to more than 50,000 people with disability and to employers.
DEN helps job seekers with disability to find and maintain sustainable employment and its members promote the capacity of people with disability, leading to improved employment opportunities and the encouragement of innovation and continuous improvement in employment services. DEN includes: a capped stream, for those people with disability who are assessed as being likely to require ongoing support to retain employment after they have found a job; and an uncapped stream, for people who have an obligation to look for work and are assessed as being able to work for between 15 and 29 hours per week at full award wages with up to two years of employment assistance.

Responsibility for DEN rests with DEEWR, which in June this year put in place a star ratings system for each DEN member. This system will help provide a guide to prospective employees, employers and advertisers such as APS agencies, to the top-performing providers of disability employment services. DEN members are rated against the key performance indicators of efficiency, effectiveness and quality. The performance rating model takes into account the impact of client characteristics and local economic conditions on the outcomes achieved by DEN members.
DEEWR is currently preparing to place vacancies with DEN. More information on the DEN can be found at: <http://workplace.gov.au>
Support
In creating an inclusive workplace, it is vital that agencies provide support to employees with disability by making premises accessible, implementing flexible work practices and reducing the complexity and cost to managers of employing people with disability.
Table 3.9 shows agencies’ progress over the past year on the two MAC objectives relating to the provision of support. These objectives are:
accessible premises, workplaces and supportive work environment for people with disability
reduced complexity, cost and risk for managers employing people with disability.
Table 3.9: Agency initiatives to improve support both to employees with disability and managers of employees with disability, 2007–08
Initiatives Yes (%)
No (%)
Not applicable
(%)
Note: Percentages may not add to 100 as agencies that did not provide a response are not shown in the table. Small differences may also be due to rounding.
Source: Agency survey
Objective five—accessible premises, workplaces and supportive work environment for people with disability
Identify the reasonable adjustments required by new employees with disability, before they commence duty 77 6 18
Provide access to adaptive technology or other practical support required by employees with disability 86 - 14
Identify an SES officer to act as a senior-level advocate for employees with disability 26 51 23
Operate an agency network for people with disability 9 66 26
Offer individual workplace agreements to people with disability to provide flexibility to meet individual reasonable adjustment needs
16 59 26

Table 3.9: Agency initiatives to improve support both to employees with disability and managers of employees with disability, 2007–08
Initiatives Yes (%)
No (%)
Not applicable
(%)
Objective six—reduced complexity, cost and risk for managers employing people with disability
Centralised funding for adaptive technology or other forms of practical support 52 44 -
Adaptive technology provided to employees is transferred with them when they move within the agency 76 2 22
A centralised source of information and expertise (such as disability action officers, case managers or ready access to external sources of information) to assist managers and employees with disability
72 11 17
Provide training and/or awareness programmes for managers and/or employees on mental illness, depression or related disorders
66 30 -
While agencies made some progress over the past year in providing support to employees with disability, there were a number of areas that agencies identified as not being applicable to them. Last year, agencies were simply given the option of a ‘yes’ or ‘no’ answer, so comparisons between the two years may not be meaningful.
The top three initiatives reported by agencies this year were providing access to adaptive technology (86%), identifying reasonable adjustments for new employees before they start (77%), and transferring adaptive technology when an employee moves jobs (76%).
Almost two-thirds of agencies (66%) provide training and awareness programmes for managers and employees on mental illness, depression or related disorders.
Disappointingly, only a little over one-quarter of agencies (26%) had identified an SES officer to act as a senior-level advocate for employees with disability. More than a quarter of agencies (26%) said offering individual workplace agreements to people with disability to provide flexibility in meeting individual reasonable adjustment needs did not apply to them, and only 16% said they did offer these agreements. It is also disappointing that little progress has been made in relation to operating an agency network for people with disability—only 9% of agencies said they had established an agency network.
Improving and monitoring performance
The seventh MAC objective relates to ensuring a ‘consistent conceptual framework for defining disability’. The MAC report said agencies need to adopt consistent definitions of disability in order to help improve and monitor agencies’ performance in managing their employees with disability.

The MAC report identified two definitions of disability for use in the APS. Unfortunately, there has been very little change over the past year in the number of agencies that have adopted these definitions, signalling that it has not been a priority for agencies.
The first (broader) definition is used by agencies in developing recruitment and retention policies. This year, 48 agencies (53%) reported that they had adopted the definition of disability in section 4 of the Disability Discrimination Act 1992as a basis for developing recruitment and retention strategies. This number was unchanged from last year.
The second (more specific) definition of disability is used by agencies as part of their employee data collection. Forty-one agencies (46%) reported that they had adopted the definitions of ‘disability’ used by the ABS Disability, Ageing and Carers: Summary of Findings 2003 survey to collect data and statistics from APS employees. This is the same proportion as recorded last year.
As well as following consistent definitions of ‘disability’ across agencies, making sure employees keep information on their disability status up-to-date is an important monitoring tool to allow agencies to report on the representation of people with disability within the agency. This information also allows agencies to follow up where an employee reports a disability which may require specific workplace adjustments to help the employee to do their job. Regrettably, only a small majority of agencies (55%) reported actively encouraging their employees to update their disability status on their human resources (HR) systems, up slightly from last year (53%).
The final MAC objective relates to agencies making continuous improvements in recruiting and retaining people with disability. More than 20 agencies listed a range of other recruitment and retention strategies that they adopted in 2007–08 to support the employment of people with disability.
Examples of strategies reported by agencies to support the employment of people with disability:
DAFF
DAFF’s Disability Strategy 2008–2010 was launched in July 2008. An SES Disability Champion has been appointed and has commenced holding regular forums with employees with disability. DAFF is also working closely with the Australian Employers Network on Disability (AEND) to finalise a Reasonable Adjustment Policy. DAFF has renewed its Gold Membership with AEND, which will be reviewing the Department’s recruitment documentation and provide disability awareness training to all staff in 2009.
ATO
ATO continued its membership of AEND and its participation in the AEND ‘Stepping into ...’ programme. The Debt business line is offering 12-month non-ongoing positions for hearing impaired people.
Centrelink
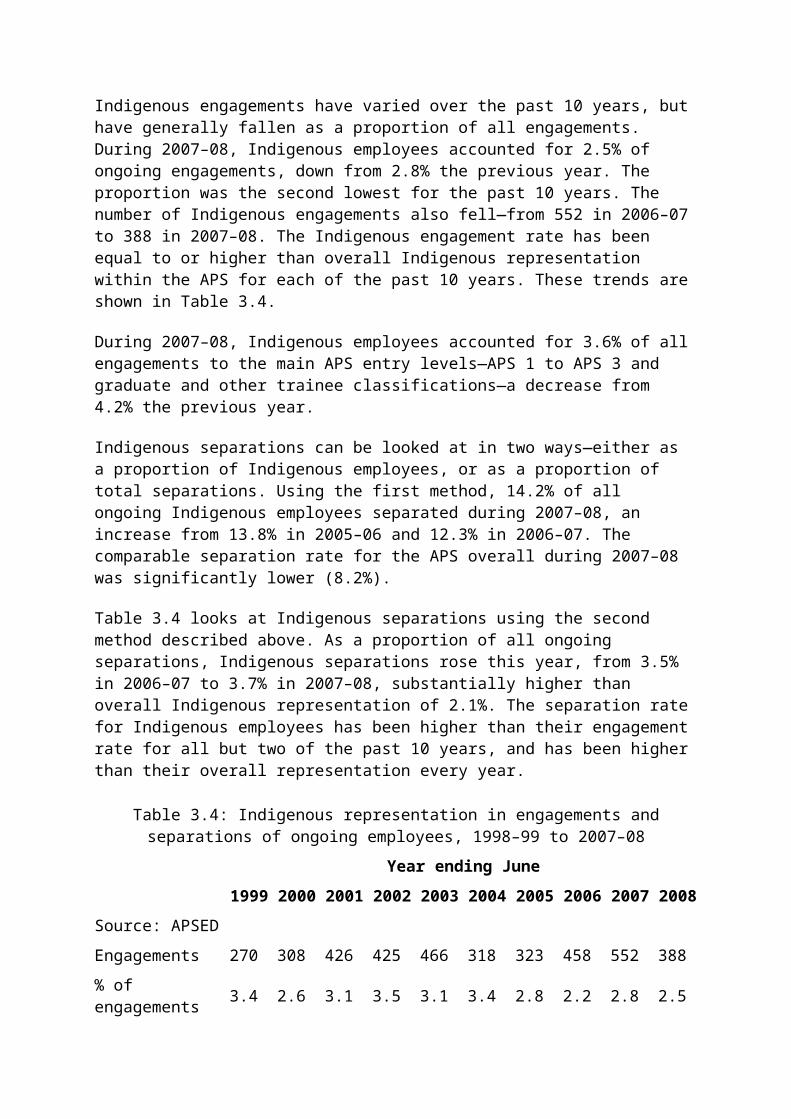
The agency participated in a DEEWR study of measures to attract and retain employees with mental illness. It also centralised recording or early intervention and adaptive technology to inform diversity policy and continued its involvement in work placements for people with disability returning to the workforce.
Seventy-five per cent of relevant agencies reported that they conducted exit interviews and/ or surveys for employees with disability who left the agency. The proportion of relevant agencies that collected data on the number of people with disability who applied for positions in their agency increased, from 34% in 2006–07 to 47% in 2007–08.
Employee perceptions of agency support
Employees with disability were much less likely than other employees to report that their agency valued and managed diversity in the workplace well (49% compared to 66%). When asked whether their organisation was committed to creating a diverse workforce, 55% of employees with disability agreed—this was again substantially lower than the proportion of other employees (69%) who agreed with this question.
These results indicate that agencies need to make substantial improvements or changes to the mechanisms they are using to support their employees with disability, who appear to be largely dissatisfied with agencies’ current efforts to foster diversity in the workplace. This is particularly important because ‘word of mouth’ from APS employees with disability is an important attraction factor for would-be employees with disability.
Attraction and selection
Table 3.10 shows how employees with disability ranked the attributes that attracted them to their current job, and compares their rankings with those of other employees. For employees who ranked the attributes as important, the table also indicates how well expectations were met for each attribute.
Table 3.10: Agency attraction attributes—importance and how well expectations were met by disability status, 2007–08
Agency attribute
Rated important in attracting employee to job Expectations met well(a)
Employees with disability (%)
Employees without
disability (%)
Employees with disability (%)
Employees without
disability (%)
Job security 87 83 71 81
Interests match job 76 71 69 65
Important work 70 61 70 75
Making a difference 69 63 57 61
Career opportunities 64 63 30 45

Location 63 69 82 81
Development opportunities 57 57 44 52
Remuneration 56 66 46 60
Good work practices 52 62 52 63
Work on leading edge projects 49 43 49 54
Gaining experience 45 50 69 65
(a) Expectations relate only to employees who rated agency attribute as important.
Note: The top five attributes selected by both employees with disability and other employees are highlighted.
Source: Employee survey
The top five attributes that attracted employees with disability to their current job were job security, finding a job that matched their interests and experience, the agency’s reputation for doing important work, ability to contribute to making a difference, and future career opportunities in the agency. While these five attributes were similar to the top five attributes for other employees, employees with disability were much more attracted to their job because of the agency’s reputation for doing important work, compared to other employees (70% compared to 61%).
Interestingly, an agency’s reputation for good work practices such as work-life balance and people management was less of an attractor for employees with disability (52%) compared to other employees (62%). This was also the case for remuneration, where 56% of employees with disability said it was important compared to 66% of other employees.
In general, the expectations of employees with disability were less likely to be met than those of other employees. In particular, of the 64% of employees with disability who said future career opportunities were important, only 30% said their expectations had been met well.
Employees with disability reported lower satisfaction levels than employees without disability with 10 of the 12 employee engagement factors (see Figure 3.5). Innovation Culture and Personal Innovation and Flexibility were the only factors where satisfaction levels were similar. The largest differences were for the Learning and Development, Work-Life Balance, and Governance and Integrity factors.

Figure 3.5: Employee satisfaction with factors identified through factor analysis—employees with disability and employees without disability, 2007–08
Source: Employee survey
Employees from non-English speaking backgroundsThe term ‘NESB’, representing people from a non-English speaking background, is used in APSED to capture information about employment disadvantage experience by employees on the basis of race or ethnicity. The analysis in this section concentrates on the category of NESB1, which includes people born overseas whose first language was not English. NESB2 data, which includes children of certain migrants, has not been included as there is little evidence of employment disadvantage occurring for this group.
The proportion of APS employees who identified themselves as being from a non-English speaking background remained steady this year, at 6%. Representation for this group has been very stable over the past decade, varying by no more than half of one percentage point over the period.
The representation of NESB1 employees in the APS, while not directly comparable, appears to be lower than representation in the Australian community, in the broader Australian workforce, and in APS equivalent occupations.
The proportion of employee survey respondents who identified as being from a non-English speaking background, defined as being born outside of Australia and not speaking English as
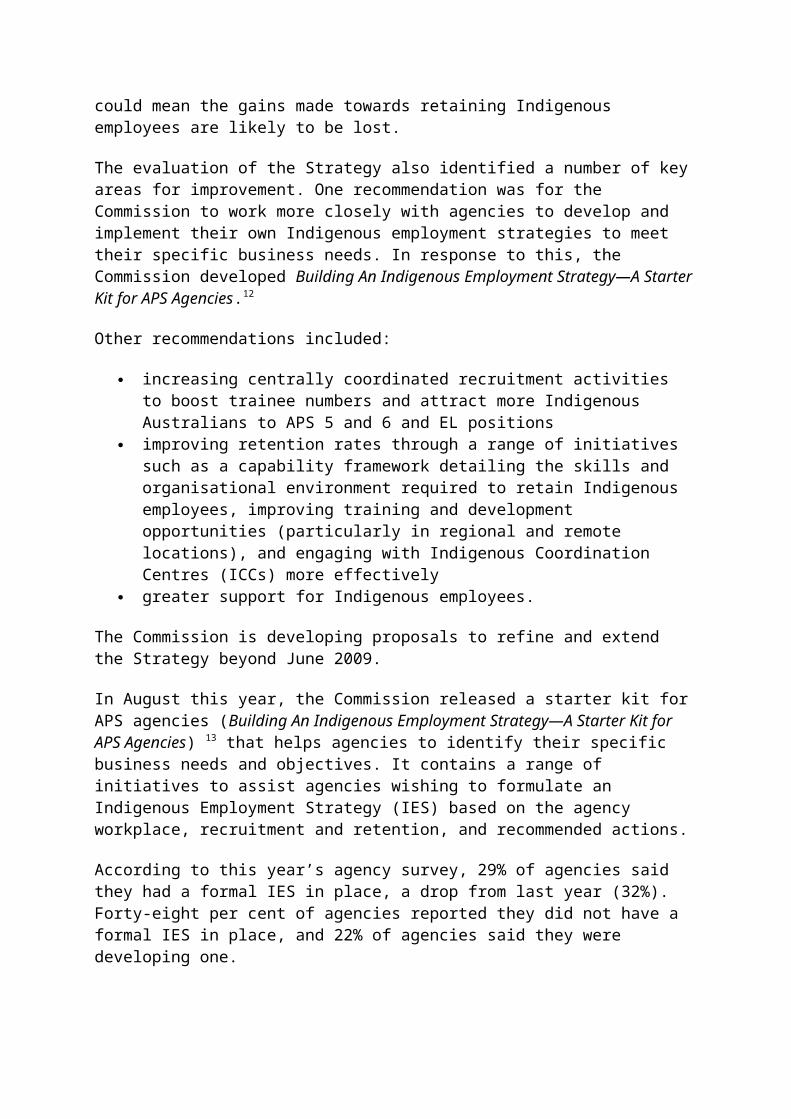
a first language, was 13%—a result closer to the combined figures for NESB1 and NESB2 (14.0%) from APSED. This higher level of reporting in the employee survey has been consistent over a number of years. It is likely that this result reflects some definitional confusion among respondents, but the extent of this cannot be assessed. It is also likely that some under-reporting is occurring on APSED. Given the disparity in results, the employee survey results for employees from non-English speaking backgrounds should be treated with some caution.
The largest group of employees from a non-English speaking background were born in South-East Asia (24.6% of those who provided their country of birth), followed by Southern and Central Asia (19.6%). The five most common languages spoken by ongoing NESB1 employees, beginning with the most common, were Chinese (including Cantonese and Mandarin), Vietnamese, Spanish, Polish and German.
Representation of employees from a non-English speaking background by classification has remained steady over the past 10 years, except for the graduate and trainee classifications where representation has varied from 7.2% in 2000 to 3.0% in 2002—at June 2008 it was also 3.0%. Employees from a non-English speaking background are slightly over-represented at the APS 1–6 levels—75.8% are at these levels compared with 72.0% of the overall APS. They are slightly under-represented in the EL classifications—22.8% compared with 25.1%, and substantially under-represented in the SES—0.7% compared with the APS average of 1.8%.
Although small in number, SES employees from a non-English speaking background increased from 2.1% to 2.5% of all SES during 2007–08.
Employees from a non-English speaking background are much more likely to have graduate qualifications than are other employees—at June 2008, almost three-quarters (74.5%) of employees from a non-English speaking background had a bachelor’s degree or higher, compared with the APS average of 52.5%.21
Agencies with a high representation of employees from a non-English speaking background include the Royal Australian Mint (RAM) (26.0% of all ongoing employees), the Private Health Insurance Ombudsman (PHIO) (18.2%), the National Library of Australia (NLA) (16.9%) and IP Australia (15.2%). Figure 3.6 shows representation of employees from a non-English speaking background in those agencies with more than 1,000 ongoing employees at June 2008. Agencies with the highest representation are DIAC (12.4%), DIISR (12.1%), Medicare Australia (11.4%) and BoM (10.0%). Agencies with the lowest representation are DEWHA (1.5%), AGD (3.0%) and Defence (3.1%).
The quality of data on the status of employees’ non-English speaking backgrounds varied widely among agencies—at June 2008, eight agencies had ‘no data’ recorded on APSED for more than half of their ongoing employees. Most of these agencies were small, except for the Workplace Ombudsman (no data for 67.4% of ongoing employees), the Australian Trade Commission (Austrade) (67.0%) and the Workplace Authority (64.9%).

Figure 3.6: Representation of NESB1 employees in agencies with more than 1,000 ongoing employees, June 2008
Source: APSED
Employee perceptions of agency support
Employees from a non-English speaking background are, to a large extent, satisfied with their agencies’ efforts in creating and encouraging diversity in the workplace. Sixty-seven per cent of employees from a non-English speaking background agreed that their agency valued and managed diversity well, similar to the 64% of other employees. In terms of whether they believed agencies were creating a diverse workforce, 67% of employees from a non-English speaking background agreed that their organisation was committed to creating a diverse workforce. This was similar to the proportion of employees who were not from a non-English speaking background (69%) who agreed with this question.

Attraction and selection
Table 3.11 shows how employees from non-English speaking backgrounds ranked the attributes that attracted them to their current job and compares their ranking with those for other employees. For employees who ranked the attributes as important, the table also indicates how well expectations were met for each attribute.
The top attributes that attracted employees from a non-English speaking background to their current job were job security, the agency’s reputation for doing important work, a job that matched their interests or experience, and the agency’s reputation for good work practices. Geographic location, the remuneration package and future career opportunities were also considered important.22
A greater proportion of employees from a non-English speaking background rated each of the 11 workplace attraction attributes as important. Employees from a non-English speaking background, for example, were much more likely than other employees to consider an agency’s reputation for doing important work (77%) and for good work practices (76%) as important attractors to their current job (compared to 60% and 59% respectively for other employees).
The expectations of employees from a non-English speaking background fell substantially short when it came to remuneration and future career opportunities. Of the 72% of employees from a non-English speaking background who rated remuneration and future career opportunities as important, only 53% and 41% respectively reported that their expectations had been well met.
Table 3.11: Agency attraction attributes—importance and how well expectations were met by non-English speaking background status, 2007–08
Agency attribute
Rated important in attracting employee to job Expectations met well(a)
Employees from non-English
speaking backgrounds
(%)
Employees not from non-
English speaking backgrounds
(%)
Employees from non-English
speaking backgrounds
(%)
Employees not from non-
English speaking backgrounds
(%)
Job security 91 83 79 80
Important work 77 60 78 74
Interests match job 76 71 63 65
Good work practices 76 59 64 62
Location 72 68 75 82
Remuneration 72 65 53 61
Career opportunities 72 62 41 45
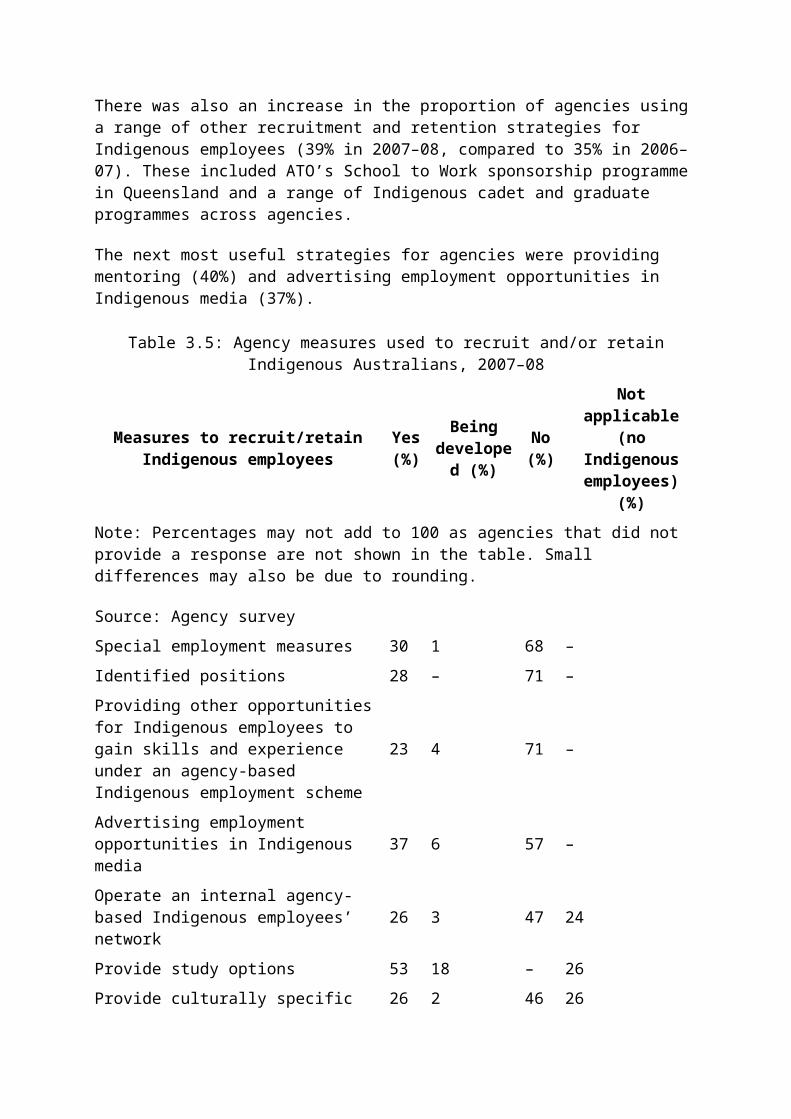
Table 3.11: Agency attraction attributes—importance and how well expectations were met by non-English speaking background status, 2007–08
Agency attribute
Rated important in attracting employee to job Expectations met well(a)
Employees from non-English
speaking backgrounds
(%)
Employees not from non-
English speaking backgrounds
(%)
Employees from non-English
speaking backgrounds
(%)
Employees not from non-
English speaking backgrounds
(%)
Making a difference 71 62 59 62
Development opportunities 66 56 46 52
Gaining experience 66 48 60 67
Work on leading edge projects
54 42 49 54
(a) Expectations relate only to employees who rated the agency attribute as important.
Note: The top five attributes selected by both employees from non-English speaking backgrounds and other employees are highlighted.
Source: Employee survey
Figure 3.7 shows the results for employees from non-English speaking backgrounds against each of the employee engagement factors. There were no clear trends with employees from non-English speaking backgrounds being more satisfied in some factors and less satisfied on others. The largest differences were for the factors Understanding Current Role and Innovation Culture where employees from a non-English speaking background were more satisfied than other employees and the Merit and Career Progression factor where they were less satisfied.

Figure 3.7: Employee satisfaction with factors identified through factor analysis—employees from non-English speaking backgrounds and employees not from non-English speaking backgrounds, 2007–08
Source: Employee survey
Age diversityA growing issue in workplace diversity is the importance of creating a workplace environment that is attractive to, and draws on, the skills of employees of all age groups. Intergenerational issues that arise in the workplace must be handled effectively if agencies are to attract and retain employees from a broad spectrum of ages. This is particularly important given the impact of the ageing APS workforce.
This section looks at the age diversity of APS employees, particularly young employees (aged under 25 years), mature-aged employees (aged 45 to 54 years), and older workers (aged 55 years and older). The age profile of the APS differs to that of the broader workforce, with lower representation of both young employees and older workers. However, the APS is becoming increasingly reliant on mature-aged and older workers. In the past decade the 45 years and over age group has grown from 35.4% of all ongoing employees at June 1999 to 41.8% at June 2008, although there is considerable variation in individual agencies’ reliance on this age group. The proportion of older workers in the APS has almost doubled between 1999 and 2008.
There is also evidence that older workers are increasingly returning to the APS on a more flexible basis after resigning or retiring—48.5% of non-ongoing employees in the 55–59

years age group and 44% in the 60 years and over age group have previously worked as ongoing employees. Older workers are also choosing to incorporate more flexibility into their work-life balance through part-time arrangements as they approach retirement.
A number of factors are likely to affect the ability of the APS to retain employees aged 45 years and over. These include access to flexible working arrangements, general levels of job satisfaction, and the earnings rates of the superannuation funds, which affect the benefits available to those who resign before age 55. This latter factor has important implications for agencies’ ability to retain some mature-aged employees, with the separation rate for those aged 54 years being much higher than for slightly older or younger employees.23
The workforce profile of young employees is different to that of the APS overall, with this group being more likely to work on a non-ongoing basis, and having a much higher separation rate. Young employees accounted for 7.5% of separations during 2007–08, compared with their overall representation of 4.9% at June 2008. Their relatively high separation rate has also increased over time.
Employee perceptions of agency support
Young employees were much more likely to think that their agency valued and managed diversity in their workplace well with 82% of those aged under 25 years agreeing that their agency valued and managed diversity in the workplace well compared to 64% for all age groups. Employees aged under 25 years were also more likely to agree that their organisation was committed to creating a diverse workforce—77% compared to 69% for all age groups.
These results indicate that young employees are substantially happier with their agencies’ efforts to create a diverse workforce, compared to mature-aged and older workers. Agencies need to ensure that their workforce diversity strategies cross, not only cultural barriers, but also age barriers.
Attraction and selection
Workplace attributes that are important to employees can differ across age groups; however, they can also be similar. Job security, for example, was the attribute most likely to be selected by all age groups (young employees, mature-aged employees and older workers). (See Table 3.12.) Younger workers were more likely to be attracted to their current job due to career and development opportunities, while mature-aged and older workers were more likely to be attracted because their interests matched the job or due to the geographical location of the job.
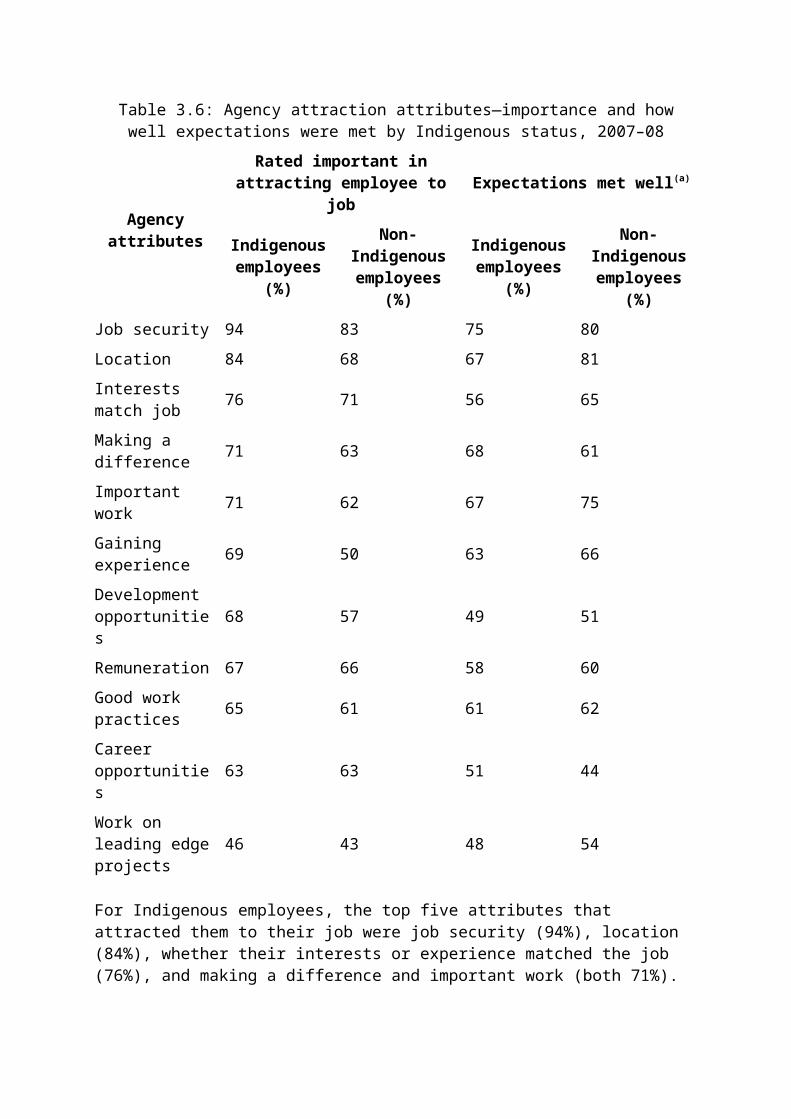
Table 3.12: Agency attraction attributes—importance and how well expectations were met by age group, 2007–08
Agency attribute
Young employees (under 25 years)
Mature-aged employees (45-54 years)
Older workers (55 years and over)
Rated importan
t in attracting employee
to job (%)
Expectations met well(a)
(%)
Rated importan
t in attracting employee
to job (%)
Expectations met well(a)
(%)
Rated importan
t in attracting employee
to job (%)
Expectations met well(a)
(%)
(a) Expectations relate only to employees who rated the agency attribute as important.
Note: The top five attributes selected by each age group are highlighted.
Source: Employee survey
Job security 85 87 83 81 83 71
Career opportunities 80 54 54 46 49 35
Development opportunities 80 59 46 48 47 56
Good work practices 76 68 56 60 59 67
Gaining experience 74 81 42 64 46 66
Making a difference 72 59 62 63 65 62
Interests match job 65 56 72 65 74 68
Location 63 81 71 79 70 81
Remuneration 62 72 64 59 60 71
Important work 62 78 62 79 66 77
Work on leading edge projects
50 54 41 57 41 63
In terms of agencies meeting employees’ expectations in these areas, there were mixed results. For younger employees, agencies performed well in meeting expectations in the areas of job security and providing experience to employees, but not so well in the areas of career and development opportunities. For mature-aged and older workers, agencies generally performed well in meeting expectations in the areas that they considered most important. Remuneration, however, is an area where agencies may be able to better manage expectations

of certain mature-aged employees. It is important for both retention and employee engagement that agencies understand the attractors for different segments of the workforce and effectively manage employees’ expectations in these areas.
Young employees were much more satisfied with a range of measures relevant to employee engagement than both mature-aged employees and older workers (see Figure 3.8). Satisfaction with the summary employee engagement measure for younger employees was 83% compared to 68% for mature-aged employees and 67% for older workers. Factors where younger workers were substantially much more satisfied than their older counterparts were Governance and Integrity, Senior Leaders, Merit and Career Progression, Learning and Development and Agency Culture. They were less satisfied with Understanding Current Role and to a lesser extent with Current Job.
In general, mature-aged and older employees shared quite similar views on the employee engagement factors. The biggest difference was in the Work-Life Balance factor with older workers somewhat more satisfied (64%) than mature-aged employees (54%).
These results again indicate the need for agencies to work on embedding an inclusive and engaging culture for all employees, and to highlight the different work styles and preferences of the various age groups.
Figure 3.8: Employee satisfaction with factors identified through factor analysis—young employees (under 25 years), mature-aged employees (45 to 54 years) and older workers (55 years and over), 2007–08

Source: Employee survey
Key chapter findingsSuccess in creating a diverse workplace has long been seen as an area in which the APS performs well, with the majority of employees agreeing that agencies are committed to this issue. It is also important that the composition of the APS workforce reflects, where possible, that of the broader Australian community. While there are many aspects of workplace diversity in which the APS performs well, there are others in which APS performance is poor, and is in need of improvement.
This year, the employment of women—both at senior levels and overall—has continued to rise. Representation of employees from a non-English speaking background continues to be stable.
The APS also appears to be doing well in improving the participation of mature-aged and older workers—an increasingly important group in a tightening and ageing labour market— through flexible working arrangements. The growing proportion of older, non-ongoing employees who have previously worked in the APS are an important resource for agencies to draw on in managing peak workflows, as well as providing ways of maintaining corporate knowledge and high levels of productivity.
Another pleasing outcome this year is the improvement in the quality of data provided to APSED on the diversity status of employees. This reflects efforts by some agencies to improve their processes for collecting and reporting data, and also promotes an environment in which employees feel comfortable in identifying their diversity status. Many other agencies, however, still do not seem to place sufficient importance on this issue. Greater efforts from these agencies, some of whom are among the largest in the APS, would have a major impact on data quality for the overall APS. Better data quality will provide an increased understanding of the APS workforce, a more accurate measure of the success of our initiatives and also identify areas in which we need to improve.
After two years of growth reported in last year’s report, it is disappointing that the number and proportion of Indigenous employees fell this year, although the decline in proportional terms was small. Employee survey results show that the expectations of Indigenous employees are not being met on several of the attributes that attracted them to their job. While APS-wide efforts to improve the recruitment of Indigenous employees appear to be producing some successes, this group is much more likely to leave the APS than other employees. It is important that agencies find out why this happens, and ameliorate this trend if we are to reverse the long-term decline in Indigenous employment in the APS.
For employees with disability, results suggest that the APS is having little success at both recruiting and retaining ongoing employees. While there are concerns about the quality of the data, there is still a long-term decline in this group’s representation in the APS. Employee survey results indicate that employees with disability are dissatisfied with agencies’ support in the workplace. There is significant room for improvement in all four main areas of the MAC objectives for promoting the employment of people with disability. Next year’s State of the Service report will focus in more detail on individual agencies’ progress in implementing these important strategies.

1 Public Service and Merit Protection Commission 2001, Guidelines on Workplace Diversity, Commonwealth of Australia, Canberra, p. 5.
2 Public Service and Merit Protection Commission 2001, Guidelines on Workplace Diversity, Commonwealth of Australia, Canberra, p. 5.
3 Due to improvements in the quality of historical data, proportions in this table may differ from those published in previous years.
4 In the absence of alternative measures, the concept ‘NESB’, representing people from a non-English speaking background, is used with APSED. This captures information about first language spoken, place of birth and parents’ language. NESB1, the measure reported here, includes people born overseas whose first language was not English. NESB2 has previously been reported in addition to NESB1 and includes children of migrants, including those who were born overseas and arrived in Australia when they were aged five or younger and did not speak English as a first language, those who were Australian born but did not speak English as a first language and had at least one NESB1 parent, and those who were Australian born and neither of whose parents spoke English as a first language. Analysis of APSED data has found that the NESB2 group does not have a substantial disadvantage compared to other employees, and it is therefore not reported on here.
5 ABS, Census of Population and Housing, 2006, ABS, Canberra, <http://www.abs.gov.au>
6 ABS, Census of Population and Housing, 2006, ABS, Canberra, <http://www.abs.gov.au>
7 A sub-set of occupations from the Australian and New Zealand Standard Classification of Occupations (ANZSCO) that is similar to the type of work undertaken in the APS.
8 The method used to calculate the proportion of employees with graduate or tertiary qualifications includes those with qualifications at bachelor’s degree level and above. It excludes from the denominator those for whom no data was provided by agencies, and those who chose not to provide details of their highest qualification.
9 Australian Public Service Commission 2005, APS Employment and Capability Strategy for Aboriginal and Torres Strait Islander Employees, Commonwealth of Australia, Canberra, <http://www.apsc.gov.au>
10 Australian Public Service Commission 2005, APS Employment and Capability Strategy for Aboriginal and Torres Strait Islander Employees, Commonwealth of Australia, Canberra, <http://www.apsc.gov.au>
11 Australian Public Service Commission 2004, State of the Service Report 2003–04, Commonwealth of Australia, Canberra, <http://www.apsc.gov.au>
12 Australian Public Service Commission 2008, Building an Indigenous Employment Strategy—A Starter Kit for APS Agencies, Commonwealth of Australia, Canberra, <http://www.apsc.gov.au>

13 Australian Public Service Commission 2008, Building An Indigenous Employment Strategy—A Starter Kit for APS Agencies, Commonwealth of Australia, Canberra, <http://www.apsc.gov.au>
14 Australian Public Service Commission 2008, Building An Indigenous Employment Strategy—A Starter Kit for APS Agencies, Commonwealth of Australia, Canberra, <http://www.apsc.gov.au>
15 Full details of the factor analysis, including details of the methodology and questions used, are set out in Appendix 3.
16 The method used to calculate the proportion of employees with graduate or tertiary qualifications includes those with qualifications at bachelor’s degree level and above. It excludes from the denominator those for whom no data was provided by agencies, and those who chose not to provide details of their highest qualification.
17 Management Advisory Committee 2006, Employment of People with Disability in the APS, Commonwealth of Australia, Canberra, <http://www.apsc.gov.au/mac>
18 Management Advisory Committee 2006, Employment of People with Disability in the APS, Commonwealth of Australia, Canberra, p. 65, <http://www.apsc.gov.au/mac>
19 Australian Public Service Commission 2007, Ability at Work—Tapping the Talent of People with Disability, Commonwealth of Australia, Canberra, <http://www.apsc.gov.au>
20 Australian Public Service Commission 2007, Ability at Work—Working Better Together, Commonwealth of Australia, Canberra, <http://www.apsc.gov.au>
21 The method used to calculate the proportion of employees with graduate or tertiary qualifications includes those with qualifications at bachelor’s degree level and above. It excludes from the denominator those for whom no data was provided by agencies, and those who chose not to provide details of their highest qualification.
22 Ranked by the proportion of employees who rated the attribute important.
23 The separation rate is calculated as the proportion of employees separating in a particular cohort during the year, divided by the average number of employees in that cohort at the beginning and end of the financial year.

Chapter 4: Attracting, engaging and retaining the APS workforceThe capability of Australian Public Service (APS) employees to design policy and deliver programme outcomes is central to the effectiveness of government and the well-being of Australian society. In turn, effective strategies for attracting, engaging and retaining employees are a critical component in building and maintaining capability.
APS agencies were subject to some highly challenging recruitment and retention forces during 2007–08. Agencies had to manage the Government’s additional one-off 2% efficiency dividend for the period 1 March 2008 until 30 June 2009, which meant that many agencies limited recruitment and managed employee numbers very carefully.
At the same time, they faced demands from the Government to shape a new reform agenda, while continuing to face challenges in attracting and retaining quality employees in a tight labour market. It has been well-documented that the cumulative effects of wider demographic changes, including the ageing of the labour force and the resilience of the economy, have resulted in shortages for some skills and increasing competition for others.
This chapter looks at the workforce challenges that agencies faced in 2007–08 and the strategies they used to meet them in order to attract and retain a high-quality workforce. It also draws on information from the agency and employee surveys to explore perceived levels of employee engagement and job satisfaction. Issues and data on APS remuneration— increases, levels and dispersion—are also canvassed in this chapter, as are issues relating to the APS common classification structure.
Workforce PlanningIt has been recognised for some time, and emphasised in a number of reports over the last few years,1 that agencies should give priority to the implementation of systematic workforce planning to ensure that they have the required skills and capabilities in place to enable them to continue to deliver on their organisational objectives.
In April 2008, the Australian National Audit Office (ANAO) released a performance audit, Management of Recruitment in the Australian Public Service, which suggested that there was still uncertainty in the APS at a strategic level about planning recruitment needs into the future. This, and other findings in the report, for example, that ‘the lack of mature workforce planning processes impairs agencies’ capacity to address challenges arising from the changing workforce environment’,2 reinforces the need for agencies to continue to focus on improving their strategic workforce planning frameworks.
Agencies’ progress with workforce planning
A sizeable proportion of agencies in 2007–08 (79%) reported that they have in place policies and strategies designed to provide them with the skills and capabilities needed for the next one to five years. This is a significant increase on last year when only 53% of agencies

reported having such arrangements in place, and sharply reverses last year’s decline from that of 2005–06 (see Figure 4.1).
Figure 4.1: Agencies’ progress with formal workforce planning, 2002–03 to 2007–08
Source: Agency survey
Workforce challenges
When agencies were asked in an open-ended question to list, in order of importance, the five biggest workforce challenges facing their agency in the next five years, most listed recruiting people with desired skills as either first or second. Retaining such skilled employees, especially in the context of an ageing workforce, was also listed as a major challenge by a number of agencies. Other challenges reported by agencies included: developing the capability of existing employees, particularly future leaders; transferring corporate knowledge (again in the context of an ageing workforce and the impending retirement of senior employees); and maintaining salary levels and competitiveness in a tight labour market and with reduced resources (a number of small agencies saw this as a particular challenge). Some small agencies also reported facing challenges in maintaining performance due to limited budgets.
Impact of skills shortages
During 2007–08, the overwhelming majority of agencies (93%) reported experiencing difficulty in recruiting or retaining skilled employees, resulting in a limited to severe impact on their capability. The shortage of information and communications technology (ICT) professionals continued to be the most pressing challenge for agencies in terms of skills shortages, although the proportion of agencies experiencing a severe impact on their ability to achieve their business objectives because of ICT skills fell slightly to 9% (11% last year). The

percentage of agencies experiencing a moderate impact on their business because of skills shortages in this area remained stable at 39%.
Agencies also continued to report significant skills shortages in the areas of accounting and financial management. Figure 4.2 shows the specific skills shortages reported, and their level of impact on agencies’ business in 2006–07 and 2007–08. These results confirm that, in the context of strong economic growth and low unemployment in Australia, the APS—like the labour market generally—continues to face tight competition for a broad range of skills.
Figure 4.2: Skills shortages and their impact on agency capability, 2006–07 and 2007–08
Source: Agency survey
Attraction and recruitmentEffective strategies to attract and recruit employees are an important component of an agency’s response to the impact of a tight labour market, and an integral part of workforce planning generally. As stressed by ANAO in its performance audit, Management of Recruitment in the Australian Public Service, recruitment ‘can no longer be regarded as a

“soft’’ issue’, as the APS positions itself to compete for talent. ANAO identified three distinct challenges for agencies:
implementing more strategic approaches to recruitment improving the quality of recruitment processes adopting APS-wide approaches to recruiting key occupations.
To meet these challenges the report recommended that agencies consider a number of recommendations:3
in relation to strategic recruitment, identify key workforce capability gaps and address both general and targeted recruitment in a comprehensive strategy
to better attract employees, develop attraction and branding material aimed at promoting the attributes of the agency (while recognising and aligning this with APS-wide approaches)
to improve recruitment processes, develop and implement quality control and/or assurance mechanisms to support employees in complying with recruitment legislation and practices, and establish target timeframes for completing recruitment processes.
The report also recommended that the Commission draw out the performance measures broadly outlined in Better, Faster: Streamlining Recruitment in the APS (2007) and develop a separate performance measurement tool to assist agencies in evaluating and reporting on recruitment outcomes, processes and costs.4
Attraction and recruitment strategies
Most agencies (81%) reported using attraction and/or recruitment strategies to attract people to their agency. The percentages were even higher in large agencies (92%) and medium agencies (89%). Consistent with the major workforce challenges identified by agencies, these strategies were aimed mainly at people with specific skills, for example, accountants or ICT professionals, with 65% of agencies reporting using strategies targeting specific skills sets.
In keeping with the APS Employment and Capability Strategy for Aboriginal and Torres Strait Islander Employees, a substantial proportion of agencies also reported using strategies to attract Aboriginal and Torres Strait Islander peoples (46% overall, up from 42% last year). Seventy-seven per cent of large agencies used such strategies. Nineteen per cent of agencies used strategies to attract younger workers (41% of large agencies). A smaller percentage of agencies also specifically targeted people with disability (14%), older workers (10%) and people from a non-English speaking background (6%).
Fifty-one per cent of agencies reported targeting graduates through a formal recruitment programme. The use of graduate programmes and other measures to recruit new entrants was much more common in large agencies (92%) than in small and medium organisations. Some small agencies reported that it was impractical for them to run their own programmes and suggested that there may be potential for a joint small agency initiative. Similarly, 83% of large agencies used cadetships (33% for all agencies surveyed), 58% used traineeships (32% overall), 29% used school-to-work transition programmes (12% overall) and 21% used apprenticeships (9% overall).
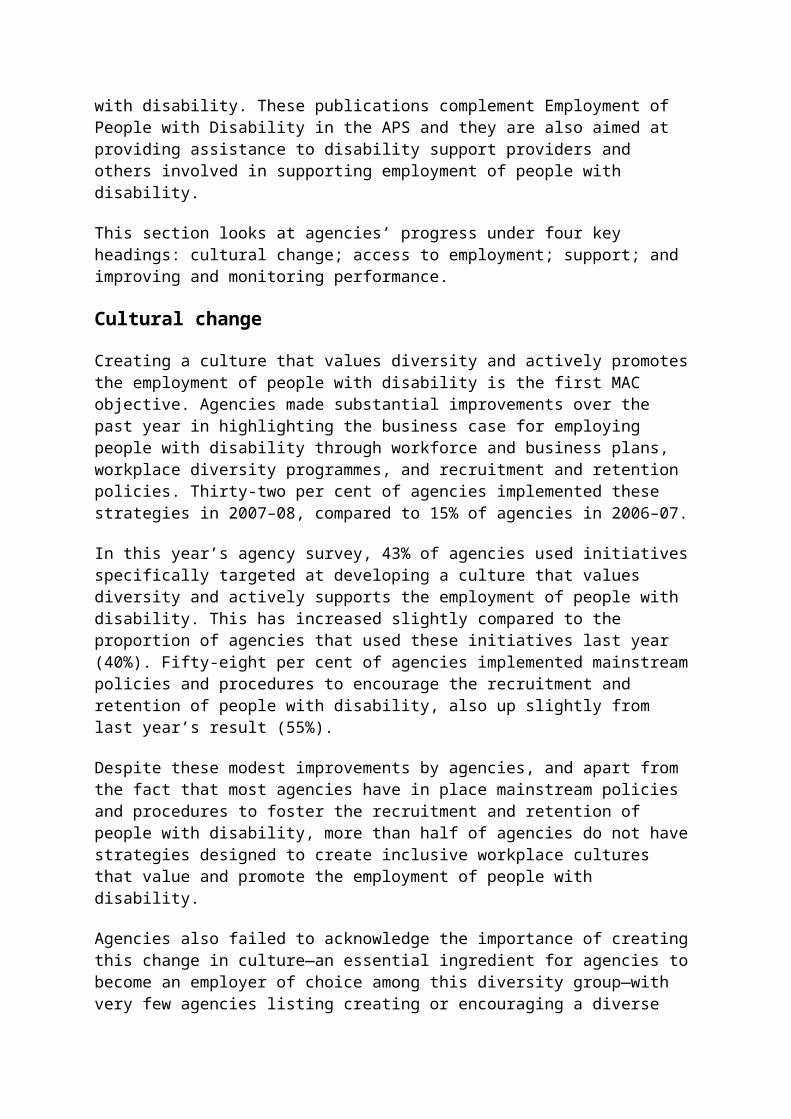
Agencies reported using a range of innovative attraction and recruitment strategies in 2007–08. A number reported increased use of electronic media to advertise vacancies, for example, advertising in professional online newsletters for specific skills, publicising graduate programmes on tertiary websites and using popular online career websites such as Seek and MyCareer. There was also increased use of online application systems. A number of agencies have introduced a more flexible approach to their requirements for job applications, for example, by giving managers the option of asking only for detailed CVs rather than requesting applications against set selection criteria.
Several agencies reported having developed ‘employment value propositions’ or branding strategies to better market the distinctive and competitive aspects of their agencies to prospective employees, consistent with the recommendations of ANAO’s recruitment audit report.
A number of agencies are also making use of innovative study-to-work initiatives such as the ‘Stepping into …’ series of programmes, developed by the Australian Employers Network on Disability (AEND). These programmes provide work experience for university students with disability in the fields of law, accounting, ICT, and human resources (HR) management and marketing. Participating organisations in 2008 included Defence, ATO and AGD.
APS-wide approaches to recruitment
The Government’s approach to the delivery of services by the APS encourages collaboration and cooperation between agencies where this will lead to greater effectiveness and efficiency. To this end, they are considering central coordination of certain activities, such as procurement and travel arrangements. There may also be advantages to agencies in considering the potential gains to be made from more coordinated approaches to attraction and recruitment.
Several APS-wide initiatives have already been introduced to assist agencies’ efforts in attraction and recruitment, for example, the redevelopment of the online Gazette into an APS employment and recruitment website titled ‘APSjobs’. The website, launched in August 2007, was updated with a number of new features and enhancements in April 2008. These changes are detailed in the Australian Public Service Commission Circular 2008/2: APSjobs website enhancements. They include:
enhancement of the ‘Branching Out’ facility to allow current APS employees to register their interest in mobility opportunities across the APS
the addition of a dedicated page incorporating APS agency head and statutory office holder positions (in line with the Government’s policy on merit-based selection for such positions), and SES positions
a new reporting function that enables agencies to generate reports on use of the website, for example, hits per notice, thereby allowing agencies to assess the effectiveness of advertising on APSjobs and obtain information on popular searches.
An existing component of APSjobs is the ‘campaigns’ page, which provides a link to current and upcoming agency-specific and APS-wide recruitment initiatives such as graduate programmes, large bulk recruitment rounds or specialist skills campaigns that are needed in the APS. Accountancy skills have long been identified as an area of critical shortage in the APS. In response, the Commission developed the centralised ‘Finance Jobs’ recruitment

initiative which creates and improves opportunities for attraction due to the scale and profile of the exercise, and reduces costs by achieving economies of scale in advertising and recruitment processes.
The pilot ‘Finance Jobs’ campaign was conducted in September 2007. A second pilot conducted online and exploiting the functionality of the APSjobs website, was conducted in June 2008. The second pilot exceeded expectations with 863 candidates lodging applications, 80% of whom were non-APS employees. With 17 agencies currently using ‘Finance Jobs’, feedback received has been very positive from both agencies and candidates alike.
Another example of an APS-wide attraction and recruitment initiative is the interdepartmental ICT Professional and Skills Development Taskforce, led by Finance through the Australian Government Information Management Office (AGIMO). The Taskforce recommended programmes to improve the recruitment, retention and development of ICT specialists in the APS. Finance is sponsoring a number of programmes to increase the profile and promote the attractiveness of ICT careers.
The second cohort of the APS ICT Apprenticeship Program commenced in February 2008. The programme has placed over 100 ICT apprentices to date and will place over 50 apprentices annually. On completion, apprentices gain a nationally recognised qualification in ICT, will have received on-the-job work experience in an Australian Government agency and are eligible for employment in the APS. The first graduates from this programme commenced employment within the APS in July 2008.
A new APS ICT Cadetship Program will commence in 2009 and provide tertiary students with support for their ICT studies and paid ICT work placements in the APS.
The Women in IT Executive Mentoring (WITEM) program provides professional development guidance to talented female ICT professionals, including those in the APS, to assist them in shaping and progressing their ICT careers. WITEM is sponsored by Dell Australia, and co-partnered by the Australian Government through Finance.
The Smaller Agency Mentoring (SAM) Program for CIOs of smaller Australian Government agencies commenced in 2008. The SAM program pairs ICT executives from larger Australian Government agencies with CIOs or senior ICT officers from smaller agencies.
Streamlining arrangements for the transfer of security clearances to enable ICT staff (contractors and APS employees) to move more easily between APS agencies is also being pursued.
Finance is also examining possible ways to reduce advertising costs across the APS as part of its broader work on procurement.
Recruitment and selection processes
To be successful, attraction strategies must be underpinned by efficient and fair recruitment processes. Not only can inefficient processes convey a negative message about the agency or the APS, but lengthy processes are not generally consistent with the merit principle, as the best applicants may reject job offers or take up other job offers if the process takes too long or otherwise disappoints their expectations.

Agencies’ recognition of the importance of effective recruitment processes is demonstrated by 67% of agencies having reviewed their recruitment and selection guidelines during 2007–08, primarily with a view to improving the speed and flexibility of the processes. The percentage of large and medium agencies that did so was even higher, at 88% and 75% respectively. This should contribute to improvements in the timeliness of selection processes, which have not improved since last year, employees reporting, for example, that 18% of selection exercises took over four months (see Figure 4.3).
Figure 4.3: length of recruitment processes, 2007–08
Source: Employee survey
In reviewing their recruitment processes agencies need to look at all aspects, as timeliness is only one indicator of effectiveness. Moreover, the results of this year’s employee survey indicate no significant improvement in employees’ views on the various aspects of selection processes canvassed in the survey. Table 4.1 presents the views of employees who had applied for an APS job in the previous 12 months, based on their most recent experience of a selection process, in 2006–07 and 2007–08. While the results vary considerably between individual agencies, with agreement rates ranging between 19%5 and 64%, it is of some concern that on average a higher percentage of employees than last year found the process to be overly demanding.
Table 4.1: relevant employees’ views on recruitment experience, 2006–07 and 2007–08
Agree (%), 2006–07
Agree (%), 2007–08
Source: Employee survey
I found the process overly demanding 32 41
I found the process difficult to understand 13 19
I believe the process was transparent 43 42

Table 4.1: relevant employees’ views on recruitment experience, 2006–07 and 2007–08
Agree (%), 2006–07
Agree (%), 2007–08
I believe the process was conducted efficiently 39 39
I was provided with adequate opportunity to seek feedback on application, interview and/or other selection method 45 47
I was left with a positive impression of the agency following the selection process 36 35
Security clearances
In the context of agencies’ efforts to attract and retain skilled employees in a tight labour market, the length of time taken for security clearances is of concern—how can APS agencies manage a tight labour market and tight security provisions without compromising one over the other. The length and complication of the security clearance process can be frustrating, both for agencies whose work programmes are disrupted while waiting for clearances, and for individuals who may have to put their lives on hold for six months or more until vetting processes are completed.
In the current jobs market, a risk for all agencies is that recruitment processes delayed by onerous security clearance requirements will result in the best employees being hired by more nimble competitors. Agencies are responsible for setting their own standards for clearances, provided the minimum standards in the Protective Security Manual are met. Agencies need to be aware that, while they retain the right to add their own requirements, this may affect timeliness and the ability of the agency to get people engaged and working effectively. Some agencies, for example, have used a blanket approach, requiring all ongoing employees to have a particular minimum security clearance. A better method would generally be to use targeted or scenario risk assessment, which involves matching security levels to the requirements of individual roles. Agencies should think seriously about their security classifications to ensure they do not over-classify roles unnecessarily, leading to burdensome processing and reduced usability.
Varying requirements across agencies are also affecting the portability of security clearances. In some cases, people who are cleared at a particular level in one agency are being reassessed when transferring to another agency. As a minimum, all that is required to transfer an existing security clearance when an employee moves from one agency to another is for the employee’s personnel security file to be transferred and a new police check undertaken. Agency heads may simply adopt existing security clearances where appropriate. If an agency head still wants to undertake their own security assessment, however, they can accept the transferring agency’s security appraisal only until such time as their own assessment has been completed. If an agency wishes to employ a person with a security clearance from another APS agency on a short-term contract, as a minimum all that is required is confirmation of the existence of the security clearance from the previous agency.
Given the increasing presence of security issues in the work of agencies and the expectations from government and the community that the APS will respond swiftly and professionally, further investigation of the system for managing personnel security is warranted. There

appear to be persuasive arguments for a more coordinated approach to parts of, or the whole, process.
What attracted employees to their current job?
This year’s employee survey asked employees to rate the importance of a selection of attributes of their agency in attracting them to their current job. Employees were also asked to rate how well their expectations had been met in relation to each attribute.
The top three attraction attributes APS-wide were job security, interests/experience matching the responsibilities of the job or the business of the agency, and geographical location (including commuting costs and time). This is consistent with the top three attributes nominated last year, when employees were asked to rate their top five attributes. The other top five attributes in 2006–07 were future career opportunities and desire to gain experience in the APS. This year, remuneration and ability to contribute to making a difference were rated among the top five.
Last year, when remuneration did not rate in the top five attributes APS-wide, this was seen as a somewhat surprising result, as the research generally suggests that remuneration is a relatively more important attraction attribute. This year’s fourth ranking for remuneration is more in keeping with other research findings, although it should be noted that the question was framed differently this year, with a smaller set of attributes to be rated, on a five-point scale of importance, whereas last year employees were asked to select the five main attraction attributes of their agency. Moreover, results on the importance of remuneration as an attraction attribute need to be treated with some caution, because they may be different if potential employees/graduates (rather than current employees) had been surveyed. Potential candidates, who may value remuneration more highly, may not even consider applying for APS jobs, given the relatively low APS remuneration levels in comparison with those in the private sector.
In 2007–08, the main attributes that attracted employees to their current job were:
job security (84% rating it as important and 76% indicating that their expectations had been well met)
my interests match the responsibility of the job (71% rating it as important and 55% indicating that their expectations had been well met)
geographical location of the job (68% rating it as important and 70% indicating that their expectations had been well met)
remuneration package (66% rating it as important and 50% indicating that their expectations had been well met)
ability to contribute to making a difference (63% rating it as important and 48% indicating that their expectations had been well met)
future career opportunities in the agency (63% rating it as important and 34% indicating that their expectations had been well met).
In 2007–08, as in 2006–07, the top three attributes were similar across most groups. Results varied most for employees in the SES, who rated the ability to contribute to making a difference and the agency’s reputation for doing important work in the top three (along with interests/experience matching their responsibilities).
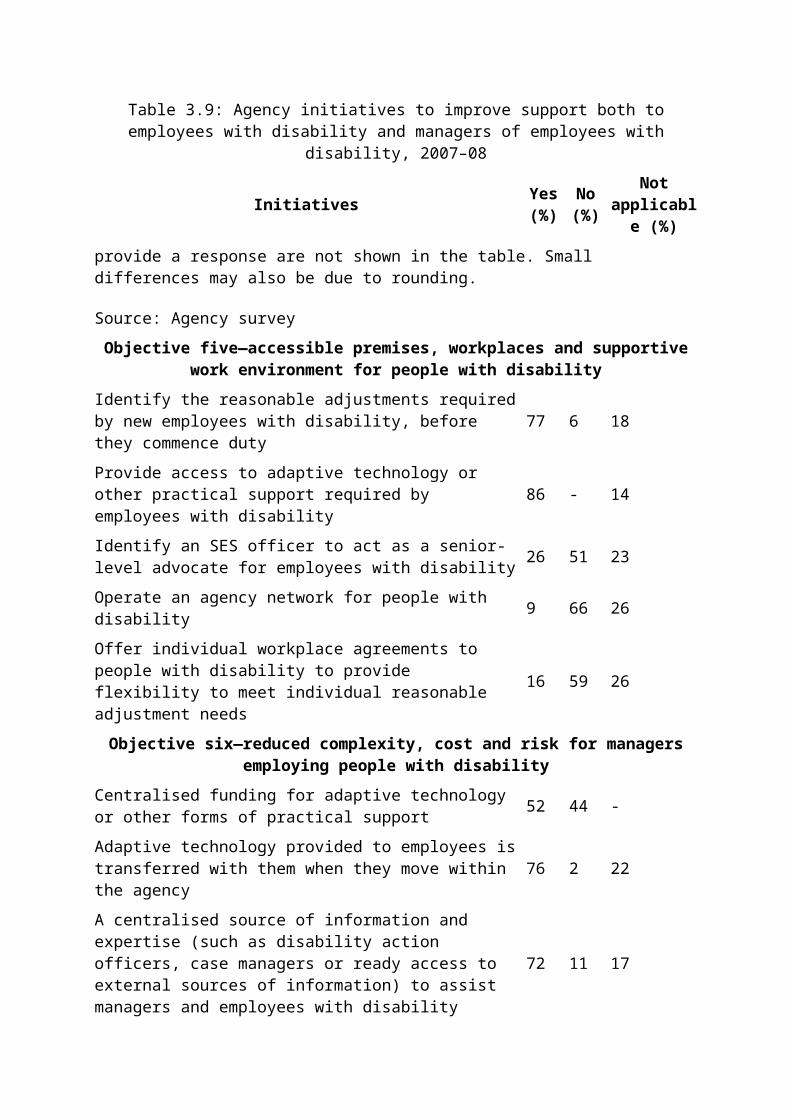
There was also, understandably, some variation in the attributes considered most important by younger employees, with those under 25 years of age rating future career opportunities and developmental/educational opportunities in the top three. The desire to gain experience was also a more important attribute for younger people.
While there was little variation between the percentages of men and women who nominated the top three attributes as being important, it is interesting to note that a considerably higher percentage of women than men thought the agency’s reputation for good work practices (e.g. work-life balance, people management) was important.
The geographical location of the job was a more important attribute for employees working outside the ACT, as was job security, while interests/experience matching the responsibilities of the job was more important to those working in the ACT than elsewhere.
Attraction attributes also varied somewhat depending on the type of work APS employees do. The agency’s reputation for good work practices, for example, was third in order of importance for employees working in service delivery, while employees working in policy considered it less important—slightly below the APS-wide result. Employees working in policy, on the other hand, rated the ability to contribute to making a difference as second highest in importance (equal to career opportunities), while those working in service delivery rated it sixth (rated equal fifth APS-wide). Policy workers also rated the opportunity to work on innovative or leading edge projects much more highly than did most other groups (the SES also rated it as being much more important than it was rated APS-wide).
Table 4.2 presents the attributes that were nominated as ‘very important’ or ‘important’ by the highest percentage of employees. It shows results for the APS as a whole and for a selection of groups. The most popular three attributes for each group are highlighted in bold.
Table 4.2: attributes attracting employees to their current job, 2007–08
Attraction attribute
APS-wide %
APS 1–6 %
ELs %
SES %
Women %
Men %
Policy %
Service delivery %
Source: Employee survey
Job security 84 88 71 45 86 81 65 88
Interests match job 71 68 80 79 72 71 81 62
Location 68 72 61 40 69 67 51 76
Remuneration 66 67 63 40 66 65 61 65
Making a difference 63 62 66 82 63 63 72 61
Career opportunities 63 64 60 49 65 61 72 58
Important work 62 61 62 81 63 60 70 59
Good work practices 61 65 52 44 67 54 57 65

These indications of attraction factors are highly important in marketing the APS for job seekers in particular sub-categories of the market place, such as policy, service delivery and senior management.
How well were employees’ expectations met in relation to the attributes that attracted them to their current agency?
Table 4.3 shows how expectations were met in relation to the attraction attributes in Table 4.2 for those employees who ranked the attributes as ‘very important’ or ‘important’. It presents results for the APS as a whole and for a selection of groups. The three attributes that employees in each group rated most highly in terms of their expectations being met are highlighted in bold.
APS-wide, for two of the attraction attributes rated in the top three—job security and geographical location—employees’ expectations were met to a high degree (80% and 81% respectively). In terms of interests/experience matching the responsibilities of the job or the business of the agency, expectations were not met to the same extent, with 65% of employees rating their expectations as having been well met. The groups who reported a considerably higher level of concurrence with expectations in relation to this attribute were SES and employees working in policy jobs.
It is interesting to note that, while APS-wide an agency’s reputation for doing important work was seventh in terms of attraction attributes, it was third in terms of expectations being well met (for those attributes listed in Table 4.3).
Of the attributes listed in the table, remuneration rated seventh in terms of well met expectations APS-wide, with 60% of employees who thought remuneration was an important attraction attribute reporting that their expectations were well met. EL employees and those working in policy jobs reported that their expectations in terms of remuneration were met to a greater extent than did employees APS-wide.
Table 4.3: agency attributes—employees’ expectations well met,* 2007–08
Attraction attribute
APS-wide %
APS 1–6 %
ELs %
SES %
Women %
Men %
Policy %
Service delivery %
Job security 80 78 88 86 79 81 88 77
Interests match job 65 63 68 90 65 64 73 58
Location 83 80 85 92 82 80 82 81
Remuneration 60 56 71 60 63 55 70 59
Making a difference 61 59 65 86 62 60 66 62
Career opportunities 44 41 52 74 45 42 60 38
Important work 75 73 79 91 76 73 75 77
Good work 64 62 62 58 62 62 60 62

Table 4.3: agency attributes—employees’ expectations well met,* 2007–08
Attraction attribute
APS-wide %
APS 1–6 %
ELs %
SES %
Women %
Men %
Policy %
Service delivery %
practices
*Only includes employees who ranked the attribute ‘very important’ or ‘important’.
Source: Employee survey
Employees who rejoined the APS in the last five years
Ten per cent of respondents indicated that they had at some stage and for one reason or another left the APS and then rejoined within the last five years. Those employees who had rejoined were asked to select their reasons for doing so. Table 4.4 presents the top five reasons selected. Results are presented for the APS as a whole and for a selection of groups.
Table 4.4: Reasons for rejoining the APS
Reason APS-wide (%)
Men (%)
Women (%)
Working in the ACT (%)
Working outside the ACT (%)
Source: Employee survey
Better work-life balance 43 35 48 39 46
Needed work, position available 37 43 32 32 42
Better remuneration in APS 23 16 29 22 25
Family conditions changed 21 15 26 23 20
To make a difference 19 26 15 16 23
The reason nominated by the highest percentage of employees was access to a better work- life balance in the APS (see Chapter 6). A considerably higher percentage of women than men nominated this as a reason for rejoining the APS. This was followed by the pragmatic response that work was needed and a position in the APS was available. Some employees (23%) rejoined because remuneration was better in the APS. Again, a considerably higher proportion of women than men selected better remuneration as a reason for rejoining, probably because women tend to be in lower paid sectors of the wider community. Interestingly, a much higher percentage of men than women said they rejoined the APS in order to make a difference.
Retention Strategies for retaining valued employees are as important to workforce planning as those aimed at attracting and recruiting new employees. Consistent with results last year, however,

while the majority of agencies (61%) reported using retention strategies, this was considerably less than the 81% that used attraction and recruitment strategies.
Retention strategies used by agencies include: transition to retirement strategies and arrangements involving the re-engagement of older workers with valuable skills to facilitate the transfer of those skills to other employees; retention bonuses or allowances for both older employees and those with specific skills; enhanced conditions agreed under s. 24(1) agreements or common law contracts; well-being initiatives; reward and recognition schemes; and career development opportunities.
As with attraction, the group targeted for retention by the highest percentage of agencies was people with specific skills sets, for example, accountants or other professions (48%). More agencies (30%) employed a generic retention strategy aimed at no particular group than was the case for attraction (19%). Generally, a lower percentage of agencies reported using strategies to retain specific groups than had used strategies to attract them, with the exception of older workers and women. The more frequent use of strategies to retain rather than attract older workers is not surprising, given the ageing profile of the workforce. Encouragingly, the percentage of agencies using specific retention strategies for graduates increased to 31% in 2007–08 (23% last year). Retention strategies for Aboriginal and Torres Strait Islander employees were in place in 26% of agencies—up from 21% last year. Nevertheless, there is room for agencies to place more emphasis on the retention of valued employees in their workforce planning strategies.
Many of the key issues affecting retention are discussed in other chapters—work-life balance and managing workloads in Chapter 6 and recognition and quality of senior leaders in Chapter 5. Remuneration, because it is of interest for reasons other than just retention, is dealt with in more detail later in this chapter.
Employee engagement and job satisfactionActive employee engagement and job satisfaction are vital components of agency strategies aimed at improving performance and productivity and retaining talented employees.
‘Employee engagement’ is a broad concept that has featured increasingly in the literature dealing with people management in recent years. There have been several studies focusing on different aspects of what drives employee engagement with varying findings; however, there is a broad consensus that an engaged employee is a more productive one. Engaged employees are fully involved in, and enthusiastic about, their work. When engaged employees have discretion over their activities, including the level of effort they apply, they are more disposed to act in ways that will further their organisation’s interests.
Employee engagement is affected by a broad range of factors. These include employees’ perceptions of the culture, leadership and management of their organisation, as well as aspects of their employment that affect them more immediately, such as the behaviour of co-workers, the type of work they do, and the opportunities they are given to develop their skills and satisfy their career aspirations. Employee engagement can be described as a two-way relationship between the organisation and the employee, based on the effort expended by organisations to engage their employees, and the level of engagement employees offer their employer.
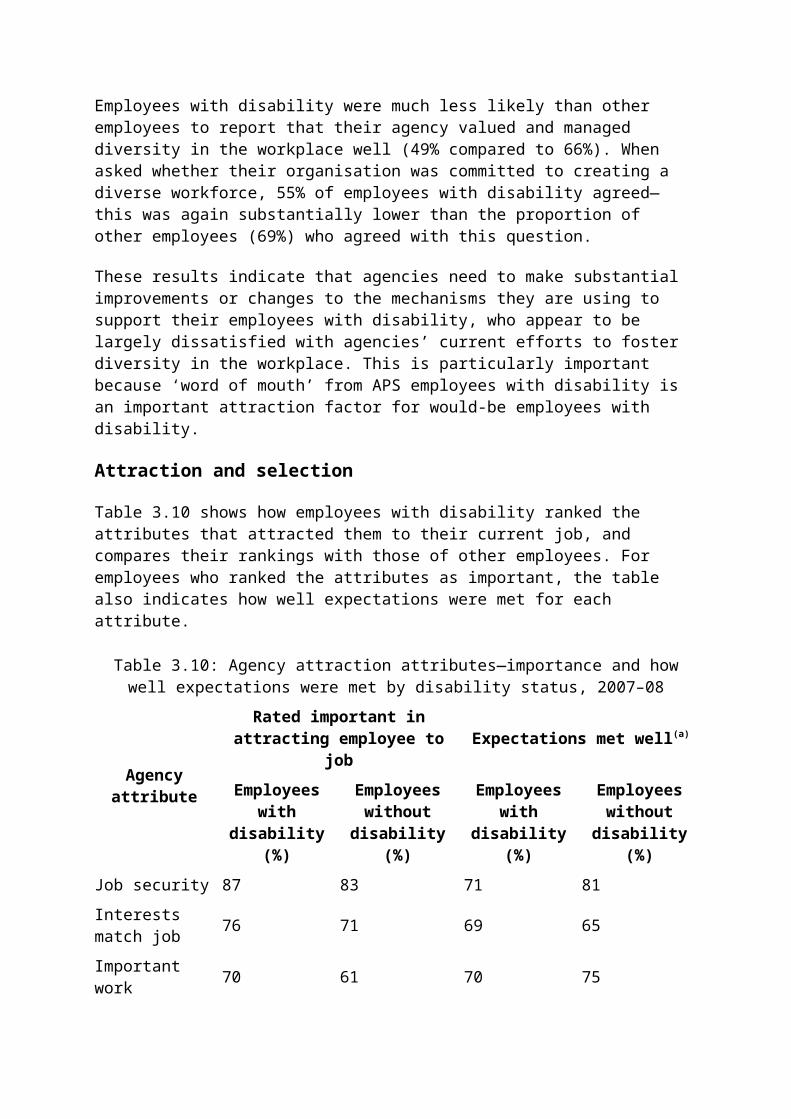
Job satisfaction is a related, but a much narrower concept. It reflects how content employees are with a range of factors that most directly influence how satisfied they are with their current job, such as working relationships and their immediate manager. Job satisfaction is one of the factors that affects employee engagement.
Employee engagement factors
This year, the employee survey again included a number of questions that are related to the concept of employee engagement. As for last year’s report, factor analysis, a statistical technique used to group together variables where responses are highly related, was used to give an overall summary picture of how the APS is performing in the area of employee engagement. Results for the 2008 factor analysis are not directly comparable with the 2007 results, as the factors, and the questions that make up each factor, are not necessarily the same.
The factor analysis this year identified a set of 12 factors which provide an overall summary of employee perceptions of issues such as Governance and Integrity, Agency Culture (and Innovation Culture), Leadership and Management, Merit and Career Progression, Work-Life Balance, and Personal Innovation and Flexibility. They do not attempt to measure how important each factor is to an employee’s overall level of engagement with their organisation. In the broadest sense, however, they can be said to provide a general indication of employee engagement in the APS. Figure 4.4 shows employee satisfaction with each of the 12 factors.
Figure 4.4: employee satisfaction with each of the 12 employee engagement factors, 2007–08
Source: Employee survey

Although the factor results are not directly comparable, they were broadly consistent with the analysis in 2006–07. Employees were most satisfied with the factor Personal Innovation and Flexibility (90%), followed by the factors Understanding Current Role (76%), Current Job (74%), Work Group (73%) and Governance and Integrity (68%). The factors that employees were least satisfied with were Agency Culture, Senior Leaders, Innovation Culture and Merit and Career Progression.
A number of these factors are examined in more detail in relevant chapters, for example, the ‘Senior Leaders’ factor in Chapter 5. The analysis indicates that results vary between groups of employees. In relation to ‘Senior Leaders’, for example, SES employees were more satisfied with this factor, as were employees working in the ACT.
Job satisfaction
In 2007–08, the employee survey asked respondents to choose the five most important workplace attributes that impacted on how satisfied they were with their job, and how satisfied they were with these five attributes. To obtain an indication of overall job satisfaction levels for the APS, a summary index was created from these results. This index ranges from zero (the employee was very dissatisfied with all of the workplace attributes nominated) to 10 (the employee was very satisfied with all of the workplace attributes nominated). An index of five equates to an employee being on average neither satisfied nor dissatisfied. Respondents with a score of six or more on the index are regarded as being on average satisfied.
This year saw a slight decrease in overall job satisfaction, with 77% of employees reporting being on average satisfied with the workplace attributes they nominated (81% in 2006–07). This year’s result nevertheless represents a high level of overall job satisfaction, with the majority of employees expressing satisfaction with most attributes. It is also worth noting that the 2006–07 result of 81% was significantly higher than the level of overall satisfaction reported the previous year (73%), and above the average level reported since 2002–03.
Job satisfaction levels in the APS are consistent with those in the broader Australian workforce. Work, Life and Time: The Australian Work and Life Index,6 a national report on work-life outcomes amongst working Australians, found that 86% of people were satisfied with their present job.7 The Household Income and Labour Dynamics Australia (HILDA) Survey also found that members of the Australian community were quite satisfied with their jobs, equating to an average score of 7.6 out of 10 in each year from 2001 to 2005.8
Job satisfaction attributes
Table 4.5 sets out the range of workplace attributes from which employees were asked to choose the five most important that influenced their job satisfaction. It presents the proportion of employees in 2006–07 and 2007–08 who nominated each attribute as being one of the top five attributes, and the proportion of employees who indicated they were satisfied with that attribute.
There is a wide dispersion of views on the attributes that impact on job satisfaction. Only two of the top five attributes, for example, were nominated as important by more than 50% of respondents. The top five workplace attributes this year were good working relationships, flexible working arrangements, salary, good manager and interesting work provided. These
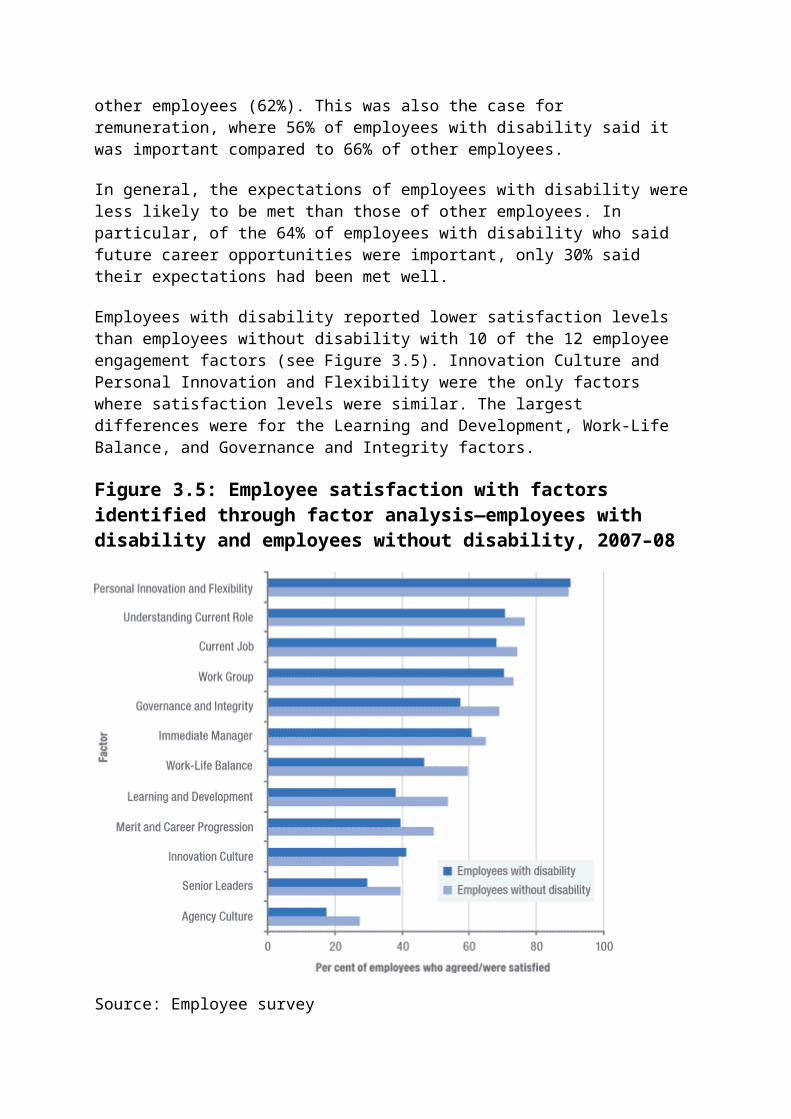
attributes are similar to those selected last year. Interesting work provided moved into the top five this year, in place of opportunities to utilise my skills, which ranked sixth this year. The attribute, good working relationships, continues to be the number one ranked workplace attribute. It has been ranked first since the introduction of the employee survey in 2003. Satisfaction with this attribute has also remained positive, at 86%.
This year, 50% of employees nominated salary as important for job satisfaction, a slight increase on last year’s result (46%). However, the percentage of employees who were satisfied with their salary (60%), decreased in comparison with that in 2006–07 (68%). Encouragingly, more than three-quarters of those who nominated a good manager as important were satisfied with this attribute.
Table 4.5: Job satisfaction—employees’ most important workplace attributes, 2006–07 and 2007–08
Workplace attribute
2006–07 2007–08
Employees who nominated
attributes as important to
them (%)
Employees who nominated
attributes as important who
were ‘satisfied’* (%)
Employees who nominated
attributes as important to
them (%)
Employees who nominated
attributes as important who
were ‘satisfied’* (%)
*Of the employees who nominated this attribute as one of their most important and rated it, the percentage of employees who were ‘very satisfied’ or ‘satisfied’ with the attribute in their current workplace.
Good working relationships 56 89 53 86
Flexible working arrangements 50 91 52 86
Salary 46 68 50 60
Good manager 38 75 42 76
Interesting work provided 32 77 31 71
Opportunities to utilise my skills 39 75 31 68
Regular feedback/ recognition for effort
31 62 31 52
Opportunities to develop my skills
31 64 31 62
Seeing tangible results from my work
29 80 30 75

Table 4.5: Job satisfaction—employees’ most important workplace attributes, 2006–07 and 2007–08
Workplace attribute
2006–07 2007–08
Employees who nominated
attributes as important to
them (%)
Employees who nominated
attributes as important who
were ‘satisfied’* (%)
Employees who nominated
attributes as important to
them (%)
Employees who nominated
attributes as important who
were ‘satisfied’* (%)
Opportunities for career development
22 49 28 44
Chance to make a useful contribution to society
27 83 28 79
Duties/ expectations made clear
29 73 28 74
Appropriate level of autonomy in my job
25 81 26 74
Appropriate workload 19 55 21 49
Chance to be creative/ innovative
21 70 18 54
Job satisfaction by a range of groups
As with satisfaction with employee engagement factors, rates of overall job satisfaction vary across different groups in the APS workforce. Table 4.6 presents overall job satisfaction for a range of groups in 2006–07 and 2007–08. The results in 2007–08 are lower than in 2006–07, possibly reflecting tighter agency budgets and increasing demands for even greater productivity improvements by the Government.
SES employees reported the highest rate of satisfaction. Satisfaction for employees with disability is still well below the APS average. The least satisfied group this year were employees with one to five years of service in the APS (70%, down from 80% last year).

Table 4.6: Job satisfaction by a range of groups, 2006–07 and 2007–08
Job satisfaction summary index
Summary index rating >5 group
2006–07 (%)
Summary index rating >5
2007–08 (%)
Source: Employee survey
Indigenous employees 75 80
Employees from non-English speaking backgrounds 83 82
Employees with disability 73 75
Employees aged 45 years and over 82 81
Young employees (aged under 25 years) 81 76
Women 83 78
Men 79 75
APS 1–6 employees 81 76
Executive Level employees 82 78
SES employees 92 86
Ongoing employees 81 77
Non-ongoing employees 83 81
< 1 year service in APS 86 81
1–5 years service in APS 80 70
>5 years service in APS 81 79
All employees 81 77
APS identity and pride
Levels of pride in the APS remain high, with 79% of employees reporting that they are proud to work in the APS (consistent with last year’s result) and 80% reporting that they would recommend the APS as a good place to work. Employee views about their current agency, although positive, were not as positive as for the APS as a whole. Seventy-one per cent of employees were proud to work in their current agency (69% last year). Sixty-five per cent would recommend their current agency as a good place to work. Despite employees generally being more likely to be proud to work in the APS than in their agency, a higher proportion of employees continue to report that they consider themselves to be primarily employees of their agency (58%, compared to 42% who considered themselves to be primarily APS employees). As discussed further in Chapter 5, only 40% of SES employees ‘definitely’ saw themselves as part of a broader leadership cadre—down from 55% in 2006–07. This is an issue of concern in building better cooperation and collaboration across agencies and reflects the relative independence of agencies.

The high levels of pride in working both in the APS and individual agencies are particularly important in positioning the APS as a good place to work, as they are both key factors in attracting new employees and retaining existing employees.
Remuneration This year’s results on what attracts APS employees to their current job rated remuneration as the fourth most important factor. Remuneration ranked third in importance among the factors that affect on employees’ job satisfaction. Remuneration developments in the APS also have a major impact on agencies’ budgets and are critical to the Government’s overall Budget strategy. This section examines developments in APS remuneration in 2007–08.
The framework within which APS agencies negotiate remuneration with their employees was revised by the new government in February 2008. The revisions reflected the Government’s general workplace relations policies, including the prohibition on the making of new Australian Workplace Agreements (AWAs). The revised Australian Government Employment Framework9 confirmed that agency-level bargaining will be retained in the APS but that collective agreements will be the basis for non-SES employees’ terms and conditions. Scope for negotiating terms and conditions outside of collective agreements is available via s. 24(1) determinations or individual common law contracts.
No data is available at this stage on agencies’ use of s.24(1) determinations or individual common law contracts, but DEEWR has data on those employees who remain covered by AWAs. While no new AWAs have been made since February 2008, 19,546 were still operative at 30 June 2008 covering around 12% of APS employees. This is a small decline from the 20,195 agreements that were in operation in June 2007, reflecting the changed policy. These AWAs are spread unevenly across classifications covering around 87% of SES, 24% of ELs and 7% of APS 1–6 employees.
Most APS employees are covered by collective agreements (CAs). There were 104 CAs operating in the APS and the Australian Parliamentary Service at June 2008.10 Twenty-eight of these have been made directly with employees and cover around 15,400 employees (10%), while the others have been made with one or more trade unions and cover around 119,700 employees (76%). A number of agencies had no operative CA at 30 June 2008. These include several departments (DBCDE, DEEWR, DIISR, Finance, RET, DCC and DHS). These agencies, consistent with the revised bargaining framework are, or will be, negotiating a CA during 2008–09 for their non-SES employees.
Movements in APS remuneration
How do increases in APS remuneration in 2007–08 compare to those in the private sector and the State and Territory public sectors? The most specific source of data available is from a survey commissioned by DEEWR and conducted by Mercer Human Resource Consulting (the APS remuneration survey) each December.11
Table 4.7 presents data on increases in total remuneration packages (which includes base salary plus benefits such as superannuation and motor vehicles) and covers employees on both AWAs and CAs. It shows that employees in most APS classifications experienced increases in remuneration in 2007 that were less than or similar to those for comparable jobs

in the private sector. The exceptions were SES Band 2 and SES Band 3 employees who had increases above those in the private sector.
Table 4.7: total remuneration package, 2007* (% change on the previous year)
APS Combined public services Private sector
*Total Remuneration Package includes base salary plus benefits such as superannuation and motor vehicles but excludes bonuses.
Source: Mercer Human Resource Consulting, 2007 Broader Market Comparison—APS SES and Non-SES Remuneration survey conducted for DEEWR.
Graduate 6.2 N/A N/A
APS 1 2.3 4.0 4.7
APS 2 2.1 4.0 4.7
APS 3 2.5 3.8 4.7
APS 4 4.1 3.7 4.7
APS 5 4.6 3.6 4.5
APS 6 3.8 3.6 4.5
EL 1 4.7 3.5 4.5
EL 2 4.6 3.4 4.5
SES Band 1 4.4 4.4 4.5
SES Band 2 5.8 4.4 4.4
SES Band 3 6.1 4.4 4.2
When the APS is compared to the average for the combined State and Territory public sectors, the median remuneration for APS classifications increased faster than remuneration for comparable jobs in the State public sectors, with the exception of APS 1–3 (which increased more slowly) and SES Band 1 employees (which increased at the same rate).
Other, less specific, comparisons can be made for APS remuneration outcomes as presented in Table 4.8. DEEWR calculates average annualised wage increase (AAWI) for all APS CAs. The AAWI for CAs entered into by APS agencies during the 12 months to 30 June 2008 was 4.2%. When calculated from the nominal expiry date (NED) of an agreement to the NED of that agreement’s replacement, the AAWI was 4.3% for the 12 months to 30 June 2008 (compared to 4.1% for the previous 12 months).
As shown in Table 4.8, salary increases contained in APS CAs (4.2%) were higher than the private sector AAWI at 30 June 2008 (3.8%), but the same as the 4.2% increase in the ABS wage cost index (which covers both the public and private sectors). However, a more accurate method of comparing APS wage increases with those of the private sector limits the comparison to those industry sectors where employees have tertiary qualifications similar to those of APS employees.12 The AAWI in collective agreements current at 30 June 2008 for industry sectors, more than half of whose employees have tertiary qualifications, was 4.1%—a result similar to the APS figure of 4.2%.

The data shows that remuneration increases in the APS over 2007–08 have generally been below or similar to those in the private sector for most classifications but generally higher than those in the combined State and Territory public sectors (except for the APS 1–3 classifications).
Table 4.8: Comparisons of wages growth, 2000–01 to 2007–08
APS AAWI(a)
(%)
APS NED to NED AAWI(b)
(%)
Private sector AAWI(c) (%)
Comparable sectors AAWI(d)
(%)
ABS wage cost index(e)
(%)
(a) Average annual wage increases in APS collective agreements entered into during the 12 months to 30 June. Collected by DEEWR.
(b) The NED to NED AAWI measures the average annual pay increase from the nominal expiry date (NED) of the previous agreement to the NED of the current agreement. The NED to NED AAWI allows for particular comparisons of annual wage increases across APS agency agreements and should only be used in this context.
(c) Average annual wage increase in current private sector collective agreements. Note that some figures in this column have been revised since last reported.
(d) Average annual wage increase in industry sectors with more than half their employees having post-school qualifications. This data is sourced from the ABS, Census of Population and Housing. The data on AAWI by industry sector was collected by DEEWR.
(e) ABS Cat. No. 6345.0, Labour Price Indexes, Australia. Average annual index—ordinary time hourly rates of pay excluding bonuses. It is a broad measure of wages growth in both the Federal and State jurisdictions covering all employees in both the public and private sectors.
Note: There are differences in the way agreements are handled by Public Sector Branch (PSB) and the Workplace Agreements Database and Analysis Section (WADAS) at DEEWR since the introduction of the No Disadvantage Test. PSB work off the approval date whereas WADAS continue to work off lodgement date; therefore, there may be some discrepancy between which agreements have been included for the calculation of the APS NED to NED AAWI and the straight APS AAWI.
2000–01 4.8 3.5 3.9 3.9 3.4
2001–02 4.1 3.9 3.6 4.0 3.3
2002–03 4.9 3.9 3.8 4.1 3.4
2003–04 4.2 4.0 4.0 4.3 3.6
2004–05 4.2 4.0 3.9 4.4 3.8
2005–06 4.2 3.9 4.2 4.4 4.1

Table 4.8: Comparisons of wages growth, 2000–01 to 2007–08
APS AAWI(a)
(%)
APS NED to NED AAWI(b)
(%)
Private sector AAWI(c) (%)
Comparable sectors AAWI(d)
(%)
ABS wage cost index(e)
(%)
2006–07 4.2 4.1 3.6 4.2 4.0
2007–08 4.2 4.3 3.8 4.1 4.2
APS remuneration levels
Table 4.9 presents the median level of total remuneration package for APS employees for each classification level in 2007 (column 2). It uses the median level as a benchmark for comparing APS remuneration levels with the equivalent jobs in the State and Territory public services and in the private sector. At the APS 6 classification, for example, the combined State public services remunerate jobs at only 86% of the APS median (column 3) while the private sector remunerates significantly above the APS level. At the 25th percentile point in the private sector market, jobs equivalent to the APS 6 classification are remunerated at 113% of the APS median (column 4), increasing to 128% at the median point (column 5) in the private sector market.
Table 4.9: Comparative levels of total remuneration package, 2007(a)
APS Median $
State public services(b)
Median(c) %
Private sector
25th percentile(c)
% Median(c) %
(a) Total Remuneration Package includes base salary plus benefits such as superannuation and motor vehicle but excludes bonuses.
(b) Mid-point of equivalent positions in the combined State and Territory public services (excluding Tasmania).
(c) Percentage of the APS median total remuneration package.
(d) Base salary rather than total remuneration package is used for graduates as the later data was unavailable.
(e) As at July 2008. All 18 Departmental Secretaries are remunerated at the same rate ($457,080) except for higher-level Secretaries who receive 6.9% more.
Source: Mercer Human Resource Consulting, 2007 Broader Market Comparison—APS SES and Non-SES Remuneration survey conducted for DEEWR.
Graduate(d) 45902 N/A N/A 99
APS 1 41507 87 69 74
APS 2 47128 95 89 97
APS 3 53679 93 97 107

Table 4.9: Comparative levels of total remuneration package, 2007(a)
APS Median $
State public services(b)
Median(c) %
Private sector
25th percentile(c)
% Median(c) %
APS 4 60806 91 102 113
APS 5 67717 90 108 121
APS 6 78411 86 113 128
EL 1 98234 76 108 124
EL 2 123277 68 105 121
SES Band 1 185606 88 91 108
SES Band 2 233566 88 103 126
SES Band 3 293404 92 124 153
Dept. Secretaries(e) 457080 N/A N/A N/A
The relative position of APS remuneration levels compared to the combined State and Territory public sectors is clear—at every classification for which data is available APS employees are more highly remunerated. Remuneration varies markedly between State and Territory public sectors with NSW and the ACT being closer to APS median remuneration levels.
The relative position of APS remuneration levels compared to equivalent jobs in the private sector is also clear—all classifications except APS 1 and 2 are remunerated at a rate lower than the median rate in the private sector. Graduates are paid around the median rate of the private sector.
While the median remuneration for most APS classifications is at the 25th percentile point (or the bottom quarter) of the private sector market, four classifications in the APS are remunerated more highly—APS 1, 2 and 3 and SES Band 1. For these four classifications, the APS therefore offers a more competitive remuneration package compared to the bottom quartile of the private sector. For other classifications, the APS remunerates at a comparatively low level. The gap between the private sector and the APS is clearly the widest for the SES Band 3 classification level, although there was a relatively large increase in SES Band 3 rates during the year.
Remuneration dispersion
Pay dispersion among agencies has increased significantly both within and among agencies since the devolution of bargaining to the agency level in 1996–97.
Figure 4.5 illustrates the growth in the size of the salary ranges for APS classifications between 1996 and 2007. It provides a graphical representation of the percentage gap between the minimum and maximum of the salary band and is shown as a percentage of the minimum of the salary range. At the EL 2 classification, for example, the gap between the minimum and maximum of the salary range has nearly doubled from 17.2% in 1996 to 30.4% in 2007.

Figure 4.5 presents data on the growth in salary ranges, but it does not show the distribution of remuneration within the ranges. Despite growing dispersion, the majority of employees are still paid within 5% and 10% of the median, although dispersion around the median tends to increase as classification increases.
Figure 4.5: Gap between the minimum and maximum of salary ranges, 1996 and 2007
Source: Mercer data for 2007 base salaries at the 5th and 95th percentiles; for 1996 rates, the Continuous Improvement in the APS Enterprise Agreement 1995–96
The agency-based arrangements for agreement-making have delivered significant productivity gains. Agencies have been able to use agency-level bargaining to remove restrictive work practices, introduce more flexible ways of working, introduce new technology, achieve efficiency gains in administration, change workplace culture and cope with labour market pressures for key staff.
An increase in salary dispersion under such a devolved system is a natural consequence. However, it is important to ensure that the degree of dispersion is still consistent with the concept of a unified APS. The APS as a unified career service has encouraged mobility and a collegial culture among agencies. It has been a great strength of the APS that skilled staff have been encouraged to pursue their careers across portfolios, gaining experience and depth of knowledge about government processes and policy.
There are some indications, in recent years, however, that mobility may be influenced by pay differentials between agencies to the detriment of medium-to-lower-paying agencies. It is also possible that mobility at aggregate levels is also being affected. Mobility rates among agencies, having recovered from the very low levels of the early-to-mid-2000s, fell in 2007–08 to 2.8% from 3.0% in 2006–07 (see Figure 2.9 in Chapter 2). A key issue is how to ensure the APS operates in a sustainable way so that agencies of all types and sizes can attract and retain employees with the capability to deliver on their core functions.
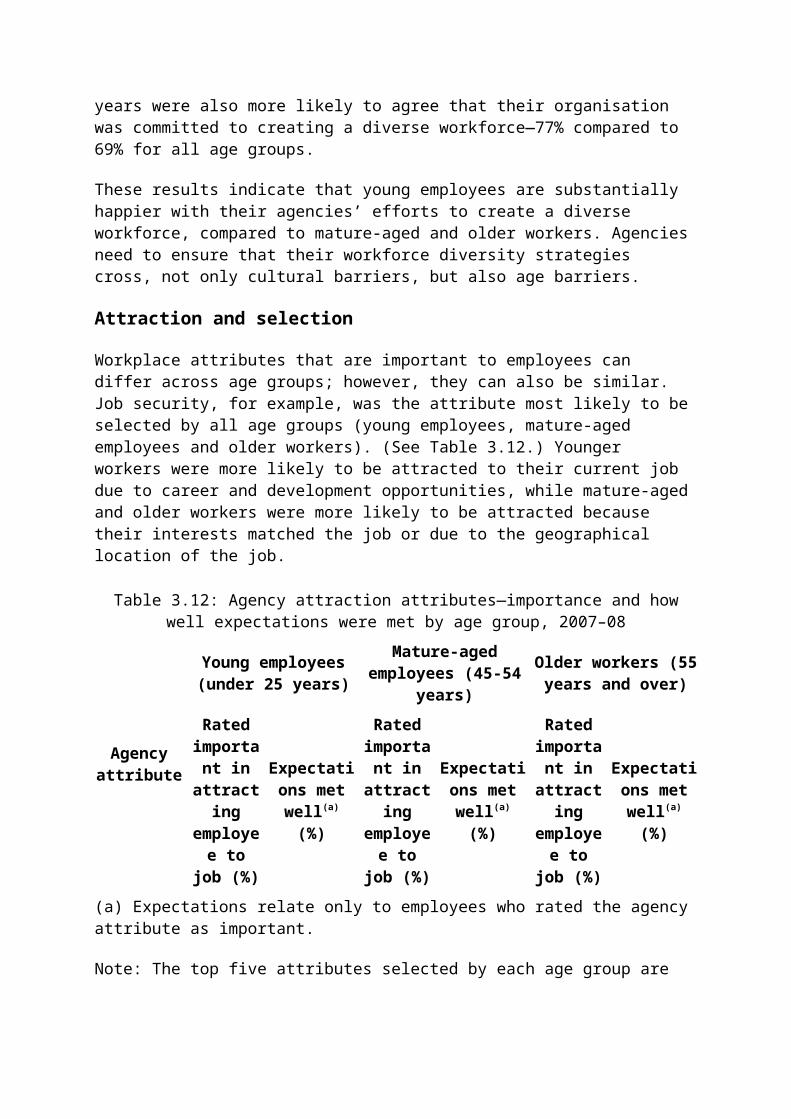
A discussion of remuneration dispersion is fundamentally linked to the funding arrangements and productivity performance of agencies (see Chapter 6 for a more detailed discussion of the productivity performance of the APS). The combined effect of the efficiency dividend and the partial funding arrangements for remuneration increases (where, on average, around half of the remuneration increases over the past decade or so have had to be funded from cost saving productivity improvements within agency budgets) have placed pressure on some agencies whose size, or the nature of whose activities, limited potential for generating cost saving productivity gains, year after year, at the magnitude required. For some of these agencies the need to achieve ongoing cost savings has limited the scope for remuneration increases. Analysis by the Commission indicates that smaller agencies (those with below 250 employees and especially those with fewer than 100 employees) tend, on average, to be lower-paying for most, but not all, classifications. It also appears that agencies with a cultural or Indigenous focus also tend to be lower-paying. It may be timely to consider establishing a safety valve mechanism to determine how the funding arrangements and the efficiency dividend are to be implemented, so as to ensure the ongoing viability of such agencies in what will no doubt continue to be a tight fiscal environment.
Chapter 6 of this report focuses on the impact on agencies of the additional 2% efficiency dividend, including some of the evidence presented to the Joint Committee of Public Accounts and Audit (JCPAA) inquiry into the effects of the efficiency dividend on smaller public sector agencies.
Pay equity
There have also been concerns that this increasing wage dispersion has adversely affected gender pay equity in the APS. APSED data allows a reasonably detailed examination to be made of remuneration by gender. Table 4.10 indicates that at 30 June 2007, the median APS-wide remuneration for women was less than that for men by between 1.5 and 6 percentage points at different classification levels (except for the APS 4 classification where there was no difference).
Importantly, the gap was not larger for those classifications that had higher proportions of employees on AWAs (all SES employees, for example, were on AWAs in June 2007 with around 26% of EL employees and only 8% of APS 1–6 employees on AWAs), suggesting that the use of individual contracts is not a determining factor.
Table 4.10: Median remuneration by gender and classification, June 2007
Men $ Women $ Pay equity ratio
Source: APSED
APS 1 37698 35180 93.3
APS 2 42854 41960 97.9
APS 3 46972 46251 98.5
APS 4 53047 53047 100
APS 5 57937 56549 97.6
APS 6 67276 65496 97.4

Table 4.10: Median remuneration by gender and classification, June 2007
Men $ Women $ Pay equity ratio
EL 1 83050 80928 97.4
EL 2 101299 99750 98.5
SES Band 1 130000 127920 98.4
SES Band 2 165039 160431 97.2
SES Band 3 205588 199300 96.9
Analysis of the APSED data indicates that a key reason underlying the gender gap is the longer median length of service that male employees have accumulated at nearly all classification levels (see Table 4.11). Most classification levels include, under collective or individual agreements, a number of pay points or ‘increments’ allowing for annual performance-related pay movements. The fact that male employees tend to have longer median lengths of service at their classification means that they are likely to have progressed further through a salary range than women and thus they are likely to be on higher pay points. It is interesting to note that the one classification where there is no difference between length of service between men and women—APS 4—is also the only classification where there is no gender gap in median remuneration (see Table 4.10).
Table 4.11: Median length of service (years) at classification level, June 2007
Classification Men Women
Source: APSED
APS 1 5 1
APS 2 4 2
APS 3 3 2
APS 4 4 4
APS 5 3 2
APS 6 4 3
EL 1 4 3
EL 2 5 3
SES Band 1 4 3
SES Band 2 4 2
SES Band 3 4 3
There are several reasons why men have longer lengths of service at most classification levels:
Women have had higher rates of promotion than men over the past decade. In short, they have been less likely to accumulate lengthy service at a particular classification because they are more likely instead to be promoted to the next classification.

Women have also comprised a higher proportion of total engagements (i.e. new recruits to the APS) compared to men over the last decade. Recently engaged employees will have a shorter length of service at any given classification level, and as women constitute a higher proportion of recent engagements, this lowers their median length of service compared to that of men.
Women may interrupt their employment more often for family reasons compared to men. Where this involves resigning and then rejoining the APS this could lower their length of service at a given classification level. The available data, however, indicates that only a small proportion of women who are eligible for maternity leave resign rather than take leave.
From the above analysis it appears that differences in length of service is the major factor behind the gap in median remuneration of men and women at most classification levels rather than issues of pay discrimination.
It has been suggested that there is a link between a female dominated workforce and low-paying agencies. It is possible that the differences in remuneration between agencies occurring under agency-level bargaining arrangements have had some impact on median remuneration between men and women at the APS-wide level. A range of factors will affect where an agency’s remuneration is pitched (e.g. agency size and nature and scope for productivity gains, the labour markets in which they operate, and funding arrangements).
One outcome of the interplay of such factors may be that those agencies employing a significantly higher proportion of women tend to pay in the lower part of the APS remuneration distribution. Investigating this issue would require further detailed analysis and a clear understanding of the factors behind agency remuneration approaches.
Employees’ views on remuneration
Data presented earlier in this chapter on job satisfaction and attraction factors indicated that employees’ satisfaction levels with their remuneration has fallen in 2007–08. This picture is confirmed by employees’ responses to a question which asked directly whether they were fairly remunerated for the work they do. Fifty-nine per cent agreed compared to 61% last year. The results varied significantly between those agencies for which individual results were available—from 41% to 77%. There was a high correlation between levels of job satisfaction and employees’ views on how fairly they were remunerated. Those employees whose job satisfaction index was above five were much more likely to agree that they were fairly remunerated (66%) compared to those whose job satisfaction was five or less (37%).
Other factors that were linked to employees’ views on remuneration include gender, size of agency, classification, the type of work employees do, satisfaction with work-life balance, location and whether employees were satisfied with their career progression:
Women were more likely to agree that they were fairly remunerated compared to men (62% compared with 55%).
Employees in small agencies had higher agreement levels (64%) compared to those in medium (58%) and large (59%) agencies despite, on average, tending to be paid at the lower end of the remuneration distribution.

SES employees were much more likely to agree they were fairly remunerated (71%) compared to APS 1–6 employees (56%). EL employees also had higher agreement rates than APS-wide rates (68% compared with 59%).
Employees in policy (70%), finance (69%) and research (67%) positions had higher levels of agreement compared to those in service delivery (55%), regulatory (53%) and ICT (53%) roles. Agreement levels for those doing legal, programme design/management, HR and administrative support work fell between these ranges.
Those satisfied with their work-life balance were significantly more likely to agree they were fairly remunerated compared to those who were dissatisfied with their work-life balance (64% compared with 48%).
Employees working in the ACT (62%), Queensland (62%), Tasmania (72%) and the NT (66%) were more likely to agree that they were fairly paid than employees working in NSW (53%), Victoria (59%), SA (53%) and particularly WA (44%).
Satisfaction with opportunities for career progression is linked strongly to whether employees agree they are fairly remunerated. Those who are satisfied with their opportunities for career progression have nearly double the agreement rate than those who are dissatisfied (74% compared with 39%).
This data suggests that, while actual remuneration paid does influence employees’ perceptions of whether they are fairly remunerated, other factors are also influential—in particular, employees’ levels of job satisfaction and their satisfaction with opportunities for career progression.
Classification structuresChapter 2 presents detailed data on the changing profile of the classification structures in the APS (see Table 2.1). Over the past 15 years there have been dramatic changes. The numbers of APS 1–6 employees have declined from 83.1% of all ongoing employees at June 1994 to 72.0% at June 2008. Over the same period, EL and SES employee numbers have risen from 15.9% to 26.9%.
Key factors behind the long-term trend to a higher classification profile are the shift to increasingly skilled work in the APS and the outsourcing of some functions. However, there is also anecdotal evidence from some agencies that a reaction to the tightening labour market has been adjustment of the classification profile upward in recent years to improve their recruitment prospects, including for the skills in short supply, for which they are competing with the private sector, where the APS is positioned at only around the 25th percentile. This classification ‘creep’, where agencies are assigning a higher classification level to particular jobs, not because of changes in the work value13 of the jobs, but as a way of paying higher remuneration to attract or retain skills in short supply, has the potential to undermine the integrity of the common classification system across the APS.
Since work-level standards that underpin classification structures were devolved to agencies in the late 1990s, there has been greater scope for inconsistent classification outcomes among agencies, particularly as some agencies do not appear to recognise the importance of a sound approach to classification in their remuneration policies and practices. This may have been compounded by a loss of skills in corporate areas in this field.

Another factor affecting the common classification structure across the APS is the increasing dispersion of remuneration among agencies. There are now considerable overlaps between agencies in remuneration rates for adjoining classifications. In some cases, an employee in a high-paying agency if promoted to a lower-paying agency would have to take a pay cut if placed on the standard CA’s rates in the lower-paying agency. In practice, most CAs have a salary maintenance provision, where a person joining the agency keeps their higher pay rate; however, this can raise issues of internal equity within the lower-paying agency. It also means that the person who has been promoted receives no increase in remuneration despite moving to a classification of higher work value.
Why is it of concern that the common classification structure across the APS is facing the impact of these factors? There are two reasons. The first is that the APS should be a single internal labour market with no disincentives to internal movement on promotion. In other words, the classification structure should facilitate mobility across the APS and reinforce the concept of one career service, which is central to enhancing APS capability for working effectively on whole of government and broader collaboration approaches. The other reason is that it has the potential to adversely affect the merit principle. A fundamental aspect of the application of merit is the definition of ‘promotion’ to a higher classification level—this definition relies on the application of a common classification structure.
It is time for agencies to focus more closely on classification management and work-level standards. The Integrated Leadership System (ILS), by identifying and describing the leadership and management capabilities required at each level of the APS, may assist agencies to structure their work-level standards by incorporating the behaviours described in the ILS Leadership Pathway.
Key chapter findingsAPS agencies were subject to differing recruitment and retention forces during 2007–08. While many agencies still face difficulties in attracting and recruiting particular skills in the continuing tight labour market, they have also had to plan to deal with the financial pressures from the additional 2% efficiency dividend. Responses have included carefully managing recruitment and in some cases reducing staffing. Agencies have adopted a range of measures. There was no APS-wide recruitment freeze. The Career Transition and Support Centre was established within the Commission to assist affected agencies in redeploying staff where possible.
In dealing with these difficult circumstances, the large increase in the number of agencies that report they have now undertaken workforce planning for the next one to five years is very positive. It is also encouraging that nearly two-thirds of agencies report that they have reviewed their recruitment and selection guidelines during 2007–08, primarily with a view to improving the speed and flexibility of these processes. Such reviews are overdue given that around half of selection processes were still taking over two months to complete, with 18% stretching out to over four months. The length of time taken for security clearances is of concern. There appear to be persuasive arguments for a more coordinated approach to this issue across APS agencies.
Another encouraging result is that APS employees had positive views about the key factors that attracted them to their agency and about the most important factors influencing their job

satisfaction. In relation to four out of the five factors that were most important to employees’ job satisfaction, for example, satisfaction levels among employees were over 70%. The exception was satisfaction with remuneration (ranked third most important to job satisfaction and fourth most important in the factors that attracted employees to their current job), where satisfaction levels were not only relatively low, but less than last year’s levels.
It is not clear what is driving employees’ views on remuneration, as APS remuneration levels are competitive against those of the State and Territory public sectors, even the relatively higher-paying ones—NSW and the ACT. It is also the case that the APS has been relatively stable against the private sector, tending, at the median level, to pay at or below the 25th percentile of the private sector market over recent years. Job satisfaction, which is linked strongly to employees’ views on remuneration, fell slightly this year; this may be having some impact, at least at the aggregate level. Another factor that could be increasing APS- wide dissatisfaction with remuneration is the growing dispersion in remuneration among APS agencies, although it is interesting that employees in small agencies have somewhat more positive views on whether they are fairly paid despite smaller agencies tending to be, on average, lower-paying. This is an issue that would need further investigation to untangle the various factors at work.
The growing remuneration dispersion among agencies may be having an impact on the concept of the APS as one career service. A key strength of the APS is that employees have been encouraged to pursue their careers across portfolios, gaining experience and depth of knowledge about government processes and policy. There are some indications that mobility may be influenced by pay differentials between agencies to the detriment of medium-to-lower- paying agencies, and overall mobility rates among agencies fell in 2007–08. A key issue is how to ensure the APS operates in a sustainable way so that agencies of all types and sizes can attract and retain staff with the capability to deliver on their core functions.
The combined effect of the efficiency dividend and the partial funding arrangements for remuneration increases have placed pressure on some agencies whose size, or the nature of whose activities, affect their potential to generate cost saving productivity gains year after year. It may be timely for the consideration of a safety valve mechanism to ensure the ongoing viability of lower-paying agencies in what will no doubt continue to be a tight fiscal environment.
It has been suggested that relatively low rates of remuneration in the APS compared with the private sector are affecting the gender balance in the APS. Women accounted for 61% of ongoing engagements during 2007–08, thus continuing a long-term trend to increasing proportions of women in total engagements and therefore total APS employment. Women now comprise 57.6% of total APS employment. While remuneration as an attraction factor was ranked in importance at much the same level by men and women (65% and 66% respectively), men who ranked remuneration as important were less likely to report that their expectations in relation to remuneration had been well met compared to women (55% and 63% respectively). However, it is interesting to note that men were generally less likely to report that their expectations had been well met in relation to most attraction factors with the exception of interests matching the job and good work practices, where men and women had similar results, and job security where men’s expectations were slightly better met than women’s.

The pattern of engagements into the APS by gender does not generally support the notion that low rates of remuneration are a key factor in the feminisation of the APS. Those classifications that are most competitively remunerated in comparison with the private sector (i.e. graduates, APS 1, 2, and 3 and SES Band 1 employees), are generally those with the highest proportions of engagements filled by women—except for the SES Band 1 classification. Generally, as classification increases, the proportion of women in engagements falls (as can be seen in Figure 2.6 in Chapter 2). The factors behind the long-term trend in the growth in the employment of women in the APS, and the lower levels of their expectations being well met, reported by men, require further detailed analysis to be fully explained.
It would seem to be a good time to further examine both funding arrangements for agencies and classification issues to ensure that the APS operates in a sustainable way, enabling agencies of all types and sizes to attract and retain staff with the capability to deliver on their core functions.
1 See, for example, Management Advisory Committee 2003, Organisational Renewal, and 2005, Managing and Sustaining the APS Workforce, Commonwealth of Australia, Canberra, <http://www.apsc.gov.au/mac>; ANAO 2001, Planning for the Workforce of the Future: A Better Practice Guide for Managers, Commonwealth of Australia, Canberra, <http://www.anao.gov.au>
2 ANAO 2008, Management of Recruitment in the Australian Public Service, Performance Audit Report No. 31, 2007–08, Commonwealth of Australia, Canberra, p. 18, <http://www.anao.gov.au>
3 ANAO 2008, Management of Recruitment in the Australian Public Service, Performance Audit Report No. 31, 2007–08, Commonwealth of Australia, Canberra, pp. 16–28, <http://www.anao.gov.au>
4 The Commission is responding to this recommendation and analysing the suggested recruitment metrics discussed in Better, Faster to develop material for agencies to use. The results will be made available on the Commission’s website.
5 Agencies where respondents indicated levels of agreement under 25% were the Australian Agency for International Development (AusAID), the Australian Competition and Consumer Commission (ACCC), the Bureau of Meteorology (BoM), DCC, DFAT and RET.
6 B. Pocock, N. Skinner & P. Williams 2007, Work, Life and Time: The Australian Work and Life Index (AWALI), Hawke Research Institute for Sustainable Societies, University of South Australia, Magill, SA, <http://www.unisa.edu.au/hawkeinstitute/cwl/default.asp>
7 N. Skinner & B. Pocock 2008, Work, Life and Workplace Culture: The Australian Work and Life Index (AWALI), Hawke Research Institute for Sustainable Societies, University of South Australia, Magill, SA, <http://www.unisa.edu.au/hawkeinstitute/cwl/default.asp> The Australian Work and Life Index 2008 did not specifically report on job satisfaction, focusing more on the work-to-life relationship, but did find there had been little change in the overall work-life index measure between 2007 and 2008.

8 B. Headey & D. Warren 2008, Families, Incomes and Jobs, Volume 3: A Statistical Report on Waves 1 to 5 of the Hilda Survey, Institute of Applied Economic and Social Research, The University of Melbourne and the Commonwealth of Australia, <http://www.melbourneinstitute.com/hilda>
9 Department of Education, Employment and Workplace Relations 2008, Australian Government Employment Bargaining Framework, <http://www.workplace.gov.au>
10 Several of these collective agreements continue to operate but have either passed their nominal expiry date without being renewed or are no longer applicable due to machinery of government changes.
11 Mercer Human Resource Consulting, APS Remuneration survey, commissioned by DEEWR, each year from 2001 to 2007. Since 2002, the Mercer surveys present a snapshot of data at 31 December each year. In previous reports this survey was referred to as the APS Remuneration survey. As participation in the APS Remuneration survey is voluntary, there are some limitations concerning the representativeness of the data collected from the 48 participating agencies (in 2007) to the whole APS. Self-selection into the survey, for example, has resulted in a higher proportion of larger APS agencies, than medium and small agencies, participating in the survey.
12 For comparability purposes the ABS definition of tertiary education has been adopted, that is, formal education beyond secondary education, including higher education, vocational education and training, or other specialist post-secondary education or training. The qualification categories contained in the employee survey question included under this definition of tertiary education are: vocational qualification; associate diploma; undergraduate diploma; bachelor’s degree; postgraduate diploma; master’s degree; and doctorate. It should be noted that other differences between sectors may also drive remuneration results.
13 Work value, that is, the skills and responsibility of jobs—is the fundamental basis of job classification in the APS.

Chapter 5: Leadership, learning and development in the APS Strong and effective leadership supported by investment in learning and development are essential components in building a high-performing, innovative and agile Australian Public Service (APS). The next few years represent a very challenging time for the APS as it embarks on delivering an ambitious policy agenda for the new government, which requires a very strategic response at both an agency and APS-wide level.
Leaders in the APS are leaders of a professional public service that is focused on delivering broader benefits to the Australian community and its citizens. They operate in an uncertain and challenging world. They need to have the capacity to develop innovative solutions to complex policy problems and be able to work with many different stakeholders, irrespective of whether these are other government organisations, industry bodies or the community. Increasingly, they also need to be adept at delivering business in different ways, ranging from being the deliverer of services to supporting other sectors which deliver services to the Australian community.
APS leaders are also responsible for building agile organisations that have the depth of capability to adapt, so they can support the Government of the day effectively. The APS needs leaders who can not only drive performance and productivity improvements, but also act as role models of the APS Values (the Values) to other employees.
This chapter begins by examining the existing leadership capability across the APS, and then assesses how the APS and agencies are progressing towards establishing three pillars that underpin effective leadership strategies. The chapter then considers broader learning and development issues, including how agencies are aligning learning and development to their business goals, employee satisfaction with learning and development, and agencies’ investment in off-the-job learning and development.
LeadershipThe last two State of the Service reports have highlighted leadership as a critical challenge for the APS. The UK Civil Service and the Canadian Public Service have also given leadership capability and continuity considerable attention.
International approaches to leadership continuityThe UK Civil Service’s leadership strategy is shaped around four key objectives aimed at positioning the civil service to meet the challenges of the 21st century. The Senior Leadership Committee has the responsibility for ensuring that the UK Civil Service has the right leadership capability to deliver on current and future priorities. The UK has recognised that a key aspect of leadership is planning for the future, including identifying and developing people who are able to fill the most demanding jobs in the civil service when they become available. The Civil Service Capability Group helps departments identify new posts, likely vacancies and potential successors to ensure the civil service has the right capability to

achieve its objectives. The UK uses a Senior Civil Service survey to identify what improvements can be made to leadership.1
The Canadian Public Service is increasing its focus on leadership development as part of the Public Service Renewal Action Plan. In 2007–08, it launched an Advanced Leadership Program targeted at promising senior leaders and Deputy Ministers, and also implemented talent management plans with Assistant Deputy Ministers. Tools such as the Career Assignment Program and the Accelerated Executive Development Program are also being strengthened in order to effectively support the timely preparation of the next generation of public service leaders. Canada’s public service is also taking steps to identify and report on key indicators designed to track the state of the public service and the people management within it.2
Leadership capability
As the demands and challenges facing the public sector change, so too do the skills required of its leaders. APS leaders are increasingly required to think and work in innovative and more entrepreneurial ways, and to exhibit personally, and to reward in others, flexibility and creativity. This section examines employee and agency views about current leadership capability.
Ils framework
The APS leadership model, the Integrated Leadership System (ILS), outlines the five key capability areas that APS leaders need to develop: achieves results; cultivates productive working relationships; communicates with influence; exemplifies personal drive and integrity; and shapes strategic thinking. These capabilities apply to all APS employees, although the extent to which employees will be required to demonstrate skills commensurate with these capability clusters varies between levels, and to a lesser extent, across different positions.
To assist managers and employees in identifying their leadership development needs and plan for the future, the Commission has developed a range of guidance material, for example, the ILS book,3 which provides practical support tools designed to assist individuals, leaders and HR practitioners in applying the descriptions and behaviours in the Leadership Pathway. The guidance material includes:
support tools such as Layers of Complexity which describes the increasing levels of complexity as roles change
critical transition points which have been identified for each capability across the various levels and are points where new behaviours have been introduced
an ILS Capability Assessment Kit that informs an individual’s thinking about their capabilities and assists them to prepare a development plan.
The ILS can be integrated into agencies’ broader HR practices, and used as a capability guide for both recruitment and selection processes and in managing performance.

Employee views of leadership capability
Employees continue to be most positive about their immediate supervisor’s performance in the leadership capability areas of achieves results and exemplifies personal drive and integrity (see Figure 5.1). Compared to those of 2006–07, this year’s results were stable across the five capability clusters. Trend results, however, indicate that employees’ perceptions of their supervisor’s performance in the areas of cultivates productive working relationships, achieves results, and communicates with influence have improved since 2002–03.4 Recent results in the area of shaping strategic thinking are also showing signs of improvement.
Against most capability clusters, SES employees were much more likely than employees at other classifications to rate their supervisor’s capability as ‘high’. Employees within the ACT were also more positive about their supervisor’s ability than those outside the ACT. Employees working in policy, administration, legal and programme design or management were generally the most positive, with those in research, exercising regulatory authority and service delivery generally being less positive about their immediate supervisor’s performance.
Although the results of the employee survey indicate that employees hold positive perceptions of their supervisor’s ability to achieve results, assessment of participant capability through the Career Development Assessment Centre (CDAC) leadership development programme for high-performing EL 2 employees suggests that ‘achieves results’ and ‘shapes strategic thinking’ are the weakest capability areas among EL 2 participants.5
Figure 5.1: Proportion of employees who rated their immediate supervisor as ‘high’ on leadership capabilities, 2002–03, 2004–05, 2006–07 and 2007–08
Source: Employee survey
Agency reported skills gaps for the SES and SES feeder group
Consistent with last year’s results, agencies continue to report skills gaps among their SES feeder group (EL 2s).6 Around two-thirds of agencies reported at least one skills gap for their

SES feeder group compared to around one-third of agencies for their existing SES employees. The most commonly reported skills gaps continue to be in the areas of people management, capacity to steer and implement change and capacity to think strategically, although a higher proportion of agencies reported these as skills gaps for their SES feeder group. The continuing high incidence of reported skills gaps for the SES feeder group supports the need to invest further in the leadership development of this group, notably in the areas of effectively managing people, steering and implementing change and strategic thinking.
Views of APS leaders (SES and EL 2s)
Most SES and EL 2 employees are confident that they have the leadership skills to do their jobs effectively. Although the views of senior leaders vary, SES officers are generally much more positive about the leadership of their agency (and their involvement in it) than their EL 2 colleagues (see Figure 5.2).
Those SES and EL 2 employees who do not feel like that they are actively engaged in the leadership of their agency, need to look at ways to become more engaged. SES officers also need to identify opportunities they can provide to engage their EL 2 employees in the broader leadership of the agency. This is particularly important given research on agency health which indicates that a disconnect between senior leaders and middle managers can be an indicator of an agency at risk of poor performance.7
Figure 5.2: SES and EL 2 views about leadership in their agency, 2007–08
Source: Employee survey
Figure 5.2 shows that EL 2 employees were least likely to agree that the SES in their agency give their time to identify and develop talented people and that the SES encourage innovation and creativity. It is of concern that these two areas are continually ranked lowest by EL 2s given the important role that SES officers should play in succession management and facilitating a culture of innovation. Agencies need to consider ways of building the skills of existing leaders so they are better able to recognise talent and provide appropriate support,

and so that they can more consistently recognise and reward innovation and creativity. The inclusion of these capabilities in performance agreements supported by development plans that encourage SES employees to build skills in the areas of coaching and mentoring may enhance existing leaders’ capacity to develop the leaders of the future.
Employee views of senior leaders
Despite the very positive views SES employees hold about leadership in the APS, employees more generally did not hold overly positive views about senior leaders, with only 39% of all employees satisfied with the Senior Leaders factor.8 The term ‘senior leaders’ was not defined in the employee survey, and for some employees it may include employees outside the SES.
Employee satisfaction with the Senior Leaders factor varied for different segments of the workforce. Employees within the ACT were more satisfied with their senior leaders than those outside the ACT, as were SES employees (66%) compared to EL and APS 1–6 employees. The wide variation in the results for agencies of 18% to 72% suggests that it is possible for agencies to improve employees’ perceptions of their senior leaders and that some agencies have a problem in need of immediate attention. Within this range, nine agencies (Aboriginal Hostels Limited (AHL), the Australian Competition and Consumer Commission (ACCC), the Commission, Comcare, Finance, RET, PM&C, Treasury and the National Library of Australia (NLA)) have results substantially better than the APS-wide result.
Employees were most likely to agree that senior leaders lead by example in ethical behaviour and least likely to agree that communication between senior leaders and other employees is effective, or that senior leaders are receptive to ideas put forward by other employees (see Table 5.1). These last two results are of particular concern, as these areas have been highlighted in the two most recent State of the Service reports as ones requiring attention, but there has been no improvement.
Table 5.1: Satisfaction/agreement with questions comprising the senior leaders factor, 2007–08
Satisfied/agreed (%)
Source: Employee survey
Senior managers in my organisation lead by example in ethical behaviour 57
Formal and informal communication within my agency was effective 54
Within my agency the most senior leaders are sufficiently visible 52
In my agency, the leadership is of a high quality 46
My agency is well managed 45
I feel change is managed well in my agency 36
In my agency, communication between senior leaders and other employees is effective 35
In my agency, senior leaders are receptive to ideas put forward by other employees 35

In assessing employees’ views of senior leaders, it is important to note the tendency for employees to rate senior leaders lower than their immediate supervisor. This is likely to reflect, at least in part, the remoteness of junior employees from senior leaders. It may also be difficult for junior employees to make an informed decision about senior leaders’ performance and in some circumstances employees may feel more comfortable providing a neutral response to statements relating to senior leaders. Nevertheless, the continuing lower levels of satisfaction being recorded in the area of senior leaders, and in some instances higher levels of dissatisfaction, suggest that this is an area where improvements can be made.
Increasing effective communication, with an emphasis on active listening, was one of the key themes to emerge from comments provided by employees about ways senior leaders could improve their performance. Other broad themes were senior leaders: becoming more innovative and flexible; being more reactive and not constrained by procedures; providing effective guidance; consulting more often; and uniting together as leaders. Some examples of suggested improvements included:
Attendance at team-based meetings and workshops to both hear/learn how the grass roots staff operate and work whilst taking the opportunity to communicate information to staff and receive innovation and feedback from staff.
Consult, actively listen and consider— explain goals and strategic direction.
It would benefit staff if leaders listened to the views of staff who actually do the work before they implement procedural changes that impact on staff. These changes very often don’t work and cause enormous stress to staff.
Notwithstanding the time pressures that many senior leaders face, it is important that they are able to communicate and build effective relationships with their staff. Effective communication skills are essential for enhancing agency productivity and also provide the basis for modelling and building relationships with external stakeholders.
Strengthening the leadership of today and developing leaders for the future
Enhancing the capacity of existing leaders and developing the leaders of tomorrow is a joint responsibility between agencies and employees. Leaders (and potential leaders) need to be as professional and disciplined about their own leadership development as they are about their work.
At the same time, agencies need to develop effective leadership strategies to support leadership development. It is important for agencies to build links with academic institutions and research bodies in order to develop and deliver programmes that equip current and future leaders with the skills they need to navigate an increasingly complex world.
The three pillars
Three pillars are integral to effective leadership strategies: a cohesive leadership cadre; strong investment in leadership development; and systematic and integrated succession management planning. These three pillars need to be reinforced in agencies’ performance management systems. A strategic approach to learning and development is also essential. This section examines progress towards the three pillars.

1. Towards an APS leadership cadre
The first pillar of an effective leadership strategy is a cohesive leadership cadre that supports whole of government and collaboration with a range of stakeholders. A united and connected APS-wide leadership group is essential if senior leaders are to be effective in seeing the bigger picture, juggling complex policy priorities and communicating a clear sense of purpose and direction. The identity of the SES as an APS leadership cadre is clearly and very deliberately reinforced through s. 35 of the Public Service Act 1999 (the Act). The notion of a single SES was also reiterated by the Secretaries of MAC through the One APS—One SES statement issued in 2005.9 Yet, building this sense of identity continues to be a challenge for the APS.
Only 40% of SES employees ‘definitely’ see themselves as part of a broader leadership cadre—down from 55% in 2006–07. This decline was offset by an increase in the proportion of SES employees who see themselves as ‘somewhat’ part of a broader leadership group (48% in 2007–08 compared to 34% in 2006–07). Perceptions of the SES as an APS-wide leadership group continue to be lower among non-SES employees, with only 16% of EL and APS 1–6 employees seeing their SES as ‘definitely’ part of a broader leadership group.
Building a broader identity among senior leaders—An international challengeThe value of a service-wide leadership cadre has been highlighted by the Organisation for Economic Cooperation and Development (OECD) in its report, Ireland: Towards an Integrated Public Service,10 where it recommended the creation of a Senior Public Service in Ireland to further promote strong, central leadership across the public service. Establishing a broader leadership identity among senior executives is proving challenging in many countries. In most of its Member States the OECD has found that ‘the goal of establishing a go-anywhere corps is still far to be achieved as camaraderie or esprit de corps seems not to be present …[and] interdepartmental mobility is still low’.11 Despite the emphasis on managerial and leadership skills across OECD countries, it seems that too much emphasis is on technical expertise among senior executives, although recent changes in appraisal systems may enhance a more managerial approach.
In 2007–08, the decline in the proportion of SES employees seeing themselves as ‘definitely’ part of a broader leadership group was more evident for particular groups of SES employees, namely:
SES working in departments (down from 64% last year to 40% this year), which is now consistent with the views of SES employees in non-departments
SES working in large agencies (down from 59% last year to 39% this year), which is now consistent with the views of SES employees in small and medium agencies
SES working in the ACT (down from 61% last year to 42% this year), which is now consistent with the views of SES employees working outside the ACT
SES Band 1 employees (down from 51% last year to 37% this year), which is well below the 55% of SES Band 2s and 3s.
This is clearly an area where the APS needs to improve its performance, especially as many of the issues confronting the APS, such as climate change and Indigenous disadvantage, and the

other long-term issues as identified through the Council of Australian Governments (COAG) agenda, need strong connected leadership across a number of agencies and levels of government. Agency heads have an important role to play in fostering a collegial cross-APS leadership culture, and SES Band 2s and 3s should also be communicating to their SES Band 1 employees the importance of being part of a broader leadership group. Existing performance management arrangements should also be reviewed in order to ensure that these systems encourage and reward collaborative behaviour. Increasing the mobility of SES across the APS, coupled with a greater focus on cross-agency project work and placements and attendance at APS-wide development programmes, may also assist in building a stronger APS-wide leadership identity.
Strategies that facilitate greater mobility and diversity of career experience, particularly among employees with limited opportunities to advance, or potential leaders, are an important part of building a cohesive leadership cadre.
Employees continue to be more satisfied with the opportunities for career progression in the APS (59%) compared to opportunities in their agency (46%). The level of satisfaction with opportunities for career progression is similar this year to that in 2006–07. However, satisfaction varies for different segments of the APS workforce.
Younger employees (aged under 25 years) are more satisfied, with 62% satisfied with opportunities in their agency and 74% satisfied with opportunities in the APS.
Female employees are more satisfied than male employees, with 48% of females satisfied with opportunities in their agency and 62% satisfied with opportunities in the APS.
Satisfaction increased with classification, for example, 70% of SES were satisfied with opportunities in their agency (84% satisfied with opportunities in the APS) compared to 41% of APS 1–4 employees (53% satisfied with opportunities in the APS)—the one exception was graduates and trainees, who were most likely to be satisfied with opportunities in their agency (78%) and the APS (85%).
Satisfaction with opportunities in the agency increased with agency size, for example, 38% of employees in small agencies were satisfied compared to 46% of employees in large agencies; but satisfaction levels with APS opportunities were similar across agency size bands.
Satisfaction decreased as employees’ time at their current classification level increased, for example, 61% of employees with less than one year of experience at their current level were satisfied with opportunities in their agency (71% satisfied with opportunities in the APS) compared to 35% of employees with 10 or more years’ experience at their current level (48% satisfied with opportunities in the APS).
Although levels of satisfaction varied for different groups of employees, across all of these groups, employees were more likely to be satisfied with career progression opportunities in the APS compared to those in their agency. This suggests that mobility may be a key lever that can be used to foster a broader leadership identity. The results also highlight the value of APS-wide approaches to leadership development, succession management and improving employee retention across the public service.
2. Investing in leadership development
The second pillar of an effective leadership strategy is strong investment in leadership development for the SES and the SES feeder group. This includes investing in development at both the service-wide and the agency levels.
The Australian Public Service Commissioner has a specific responsibility under the Act to ‘contribute to, and foster, leadership in the APS’.12 The Commissioner exercises this responsibility on a cost-recovery basis in close collaboration with agencies, consulting on the development of leadership and development programmes for SES and EL employees.
Programmes offered by the Commission to SES and EL employees are designed to challenge and stretch employees’ thinking and approaches to issues, to promote cooperation and collaboration, and to foster a sense of a single APS identity. In particular, they are designed to shift the focus from the immediate daily work issues to bigger picture leadership considerations. They complement many of the agency-specific leadership development programmes offered by agencies.
There are eight flagship programmes for SES employees and three for the SES feeder group. These programmes are fundamental building blocks for enhanced leadership across the public service and all SES and EL 2 employees should participate in these programmes. The flagship programmes are summarised below.
SES Orientation—this programme provides new senior executives with the essential information they need to operate effectively in the APS environment and also gives them an opportunity to build valuable networks with their peers. This year the Commission delivered 15 iterations of the SES Orientation programme, with 235 senior executives attending, which represented 69% of newly appointed SES. This is a good improvement on the previous year’s result, where 54% of newly appointed SES attended.
New Leadership Horizons (SES Band 1)—this programme is designed to assist SES Band 1s who have been appointed in the past three years to gain confidence in their new roles and leverage their experience so as to enable them to make significant contributions to their organisation and across the APS. This year, 76 SES from 37 agencies participated in the programme, up from the 58 SES from 28 agencies in 2006–07.
Transforming Leadership (SES Band 1)—this programme is for SES officers with three or more years of experience at the SES Band 1 level and is designed to help them harness their considerable experience and skills in the APS to take them to a new level of leadership capability. This year, 89 SES from 37 agencies participated in the programme, up from the 85 SES from 36 agencies in 2006–07.
Leading Across Boundaries (SES Band 2)—this programme helps SES Band 2 officers to manage the complexities of leading in a contemporary APS environment. This year, 30 SES from 24 agencies participated in the programme, down from the 51 SES from 26 agencies in 2006–07.
Leadership Mastery (SES Band 3)—this programme builds on the extensive leadership experience of SES Band 3s and exposes them to new ways of thinking and developing solutions to key challenges facing the APS, for example, whole of government problems, engaging citizens effectively, and appropriate governance and

accountability arrangements. The 2007–08 iteration was rescheduled to November 2008, but in 2006–07, 15 SES from 15 agencies participated in the programme.
Leading Australia’s Future in the Asia-Pacific (LAFIA)—LAFIA enables senior executives to respond strategically to changes in the Asia-Pacific region. In 2007–08, the Commission led one LAFIA programme in the Pacific—19 senior leaders undertook a two-week study of PNG, Vanuatu and Samoa.
Leadership Across Borders—this groundbreaking international leadership initiative is designed for senior public sector leaders working within a Westminster system. The inaugural programme, launched in February 2008, attracted ten Australian, two New Zealander, 12 Canadian and 12 British SES Band 2 (equivalent) participants and provides an opportunity for these senior leaders to work across borders on topical and relevant case studies.
Preparing to Appear Before a Parliamentary Committee—using a simulation approach, this programme is designed to provide practical guidance to SES and EL employees when preparing to appear before a parliamentary committee. This year, 67 SES and EL employees attended this programme, up from the 45 participants in 2006–07.
EL 2 Executive Leadership Dimensions—this programme provides an opportunity for participants to reflect on their professional role and engage in a challenging and collegial learning environment. It focuses on the behaviours required to be highly effective as an EL 2. This year, the Commission delivered seven iterations of this programme, with 139 participants from 47 agencies—an increase on the 44 employees from 16 agencies who participated in the two iterations delivered in 2006–07, the inaugural year of the programme.
The Career Development Assessment Centre (CDAC)—CDAC assesses high-performing EL 2s identified by their agencies as having clear potential to reach the SES. The ongoing success of the programme provides a benchmark for the Commission’s focus on strengthening the leadership capability of the SES feeder group. In 2007–08, there were 145 participants from 30 agencies—a number similar to last year’s. A comparison of the progression from EL to SES classifications between CDAC participants and non-participants continues to show that CDAC participants are more likely to become SES officers—at June 2008, 45.8% of 2004–05 CDAC participants were in the SES compared to 6.3% of non-participating EL 2s (who were EL 2s in June 2005). This is not necessarily a measure of the success of the programme, but it does indicate that suitable people are generally being nominated, and they are provided with assistance and guidance in identifying their development needs for further advancement.
Australia and New Zealand School of Government (ANZSOG) Executive Master of Public Administration (EMPA)—ANZSOG’s EMPA is a two-year part-time postgraduate degree aimed at high-performing EL 2s, which is intended to develop the depth and breadth of management and policy skills needed in today’s public sector. The 2008 cohort included 137 new students from Australia and NZ, with around one-quarter being from the APS. The programme’s core subjects are taught in five-day residential blocks in various Australian and NZ locations.
The Commission also delivers expertise programmes to assist employees at all levels. In 2007–08, it released two new expertise development programmes to assist senior executives in developing their knowledge and skills in key areas—Policy for SES, which discusses emerging and complex policy issues and challenges, and the Strategic Communications
programme that explores communicating strategically and engaging with diverse internal and external stakeholders to best achieve objectives. The Leader to Leader series was also launched this year—it is a new programme of strategic discussions aimed at stimulating debate about APS-wide challenges and future public sector reforms. The six areas covered in 2007–08 were: Australia’s Climate Change Challenge; Stepping up to Change; What is the Point of the Public Service?; APEC and the Economic Challenges facing the Asia-Pacific; Defence Management Review; and Impacts of the Intergenerational Report.
Other opportunities for SES feeder group development include the Executive Level Leadership Network and a range of learning and development programmes that specifically target executive level needs, including report writing in the APS, and the preparation of Ministerials. New programmes to be delivered in 2008–09 include Governance, Boards and the APS Employee and Navigating the Regulatory Environment for EL 2s.
Commission programmes are an important part of the mix of activities agencies should be using to develop leadership capability, complemented by agency initiatives. Agencies are continuing to take an active and targeted approach to leadership development and are most commonly using general leadership development programmes and programmes tailored to agency-specific requirements, mentoring and personal sponsorship, internal coaching and structured individual learning agreements (see Figure 5.3). These are consistent with those used in 2005–06.
Figure 5.3: Leadership development activities offered by agencies, 2007–08
Source: Agency survey

Agencies continue to report that they are focusing on leadership development of their EL employees through various programmes and coaching. However, there continues to be less use of structured placements (both within and outside the APS) in developing these leaders. There may be potential for agencies to make greater use of such approaches to improve organisational agility and generate a greater sense of a whole-of-APS identity for senior leaders in the APS.
3. Succession management
The third pillar of an effective leadership strategy is systematic and integrated succession management planning. Developing a robust succession management strategy that focuses on the identification and development of talented people at all levels is a fundamental and desirable long-term investment in the APS. Without adequate succession planning and management, especially at senior levels, agencies are at risk of corporate failure.
To ensure they are well-positioned for the future and to deal with tighter labour market conditions and an ageing workforce, some agencies have developed, or are in the process of developing, agency-specific succession management strategies. Yet, there remains a lack of focus on a more integrated and structured whole-of-APS approach to succession management.
Approaches to identifying and developing future leaders in the APS have continued to be relatively informal. Only 6% of agencies had a talent management strategy in place, with a further 29% indicating they were developing such a strategy. Large agencies (17%) were more likely than medium and small agencies to have a talent management strategy in place, although around one-quarter of medium and small agencies were developing such a strategy.
It was a more positive story when it came to agencies’ use of plans to manage succession for critical roles and leadership positions. One-quarter of agencies indicated that they had such plans in place and a further 40% reported developing plans to address succession management. Those agencies with plans in place tended to focus on succession management for critical roles (e.g. IT), SES and EL roles (between 65% and 74%).
There appears to be considerable room for improvement in monitoring and evaluating the effectiveness of succession management plans. Only one-fifth of agencies with plans had systems in place to monitor and evaluate succession planning, with large agencies (57%) more likely to do so. A further 25% of agencies with plans were developing processes to evaluate their succession management plans.
Agencies have different pressures (e.g. age profile of employees in critical roles and the agency’s ability to attract similar people from the private sector) driving the urgency of succession management strategies. Therefore, it is not surprising that agencies are at different stages in developing approaches to succession management. ATO is relatively advanced with approaches to succession management, and Centrelink piloted their succession management strategy in 2007–08.
ATOATO continues to refine its talent management strategy. The succession management risk assessment allows ATO to first identify risks and once the risks have been identified, they are

used to prioritise talent management efforts. By using this process ATO has identified key risks to one core business capability—technical decision-making. This has become a priority area for talent efforts, and ATO has a high-level, executive-sponsored project looking to identify high-potential staff with these capabilities, and also to manage high-risk staff (high intention to leave, high impact) to ensure their retention. The ‘talent scout’ tools are used by business lines to identify and discuss high-potential staff in key risk areas. The criteria for identifying talent was established by the leaders in the business lines, which ensures relevance to the business as well as giving business leaders some ownership of the process.
CentrelinkIn 2007–08, Centrelink developed and piloted a succession management strategy targeting the development of high-performing employees with potential to move into senior executive roles. As a result of the lessons learned, the processes and tools have been refined and implementation is progressing. Work is also progressing on a policy direction and implementation plan to enable succession management principles and processes to be adopted nationally at the Team Leader (APS 5–6) levels and EL classifications, as part of an integrated capability development strategy.
Communication strategies and education of managers, along with seamless integration with performance management reporting cycles, remains a priority. It is too early to quantify the benefits of implementation, as it may take between two and five years for outcomes to become measurable in terms of gains made in capability development aligned to business needs and competitiveness at selection.
Anecdotally, candidates and managers are reporting increased confidence, clarity around expectations and development needs, improved effectiveness and relationship management, and ability to target information and opportunity and overall commitment and motivation.
Most agencies report using a range of more informal approaches to succession planning and talent management, rather than integrated succession management strategies or formalised plans. Almost all agencies reported using managers and agency heads to identify potential leaders, with identification through development opportunities and the performance management system, along with self-identification by individuals also commonly used for employees at all classification levels (see Figure 5.4). Career development assessment centres were used only by a minority of agencies, although around one-third of agencies used them for EL employees.
Informal methods can play a role in identifying potential leaders, but an integrated and strategic approach to succession management where all leaders have the skills and responsibility for identifying and developing ‘new’ talent is needed. Agencies should focus on developing approaches which effectively align retention, recruitment and succession management strategies.
Due to threshold issues, it may be difficult for smaller agencies to develop comprehensive succession management strategies. In such cases, these agencies could work with their portfolio department or in partnership with other agencies or even relevant stakeholder bodies to expose their employees to a broader range of opportunities.

Agencies should also consider how their individual strategies help to support a broader APS culture, especially by encouraging mobility as a means of improving individual and service- wide leadership capability.
To facilitate a greater strategic approach to talent identification and succession management across the APS, the Commission has produced the publication, Ensuring Leadership Continuity in the Australian Public Service: A Guide to Succession Management.13
Figure 5.4: Methods agencies use to identify future leaders, 2007–08
Source: Agency survey
Learning and developmentThis section examines learning and development issues more broadly across the APS. There are many learning and development options available to agencies, including formal off-the-job training, structured work placements and giving employees opportunities to work on ‘stretch’ projects or activities. Learning and development is a fundamental cornerstone in any strategy to strengthen agencies’ organisational agility (i.e. the depth of skills and capacity) and to improve productivity. Over three-quarters of employees surveyed indicated that increased knowledge or experience in the job and access to effective learning and development were important in helping them increase their productivity.
Learning and development can also produce other benefits for agencies, for example, as part of an attraction strategy—almost six out of 10 employees indicated that developmental and/ or educational opportunities were important in attracting them to their current job. These opportunities were particularly important for younger employees, with just over seven in 10 employees aged under 35 years rating access to these opportunities as important.
In recognising the organisational benefits that can be realised through learning and development, a strong focus has been placed on this area both internationally and in Australia.

In the UK, the National School of Government has released a new online portal to give public servants greater control over their learning and development. The portal offers a range of information about leadership and management issues and provides tools to assist in improving performance, for example, ‘Finance Skills for All’ and ‘Understanding the Civil Service’.
In the APS, learning and development is a service-wide and agency issue. The Commission offers a range of programmes focused on generic skills that can help APS employees to become more effective in their roles. The Commission is assisted in this role by the Leadership and Learning Advisory Committee (LALAC), which provides strategic high-level advice to the Commissioner on whole-of-APS capability building. LALAC comprises primarily SES Band 3 employees representing line and central agencies—member agencies at September 2008 were the Commission, Defence, PM&C, Treasury, FaHCSIA, DoHA, DIAC, and the Office of the Commonwealth Ombudsman (the Ombudsman).
In examining learning and development activities across the APS, the following section considers issues such as the alignment of learning and development to business goals, employee satisfaction, and agencies’ investment in off-the-job learning and development.
Learning and development priority areas and alignment to organisational business goals
To maximise the productivity gains achievable from learning and development, it is important for agencies to take a strategic approach to identifying learning and development needs across the organisation and prioritise these needs according to business requirements. Planning for learning and development requires the same amount of vigour and attention as any other management task, and should not be seen as an ‘optional extra’. It is therefore pleasing that results from the agency survey suggest that agencies have taken their responsibilities seriously and have progressed well in these areas.
Identifying learning and development needs and priority areas
Agencies collect information about employees’ learning and development needs in different ways, for example, through employee self-identification or manager identification via the performance management system, through formal skills needs analyses and/or organisational skills gaps identified by higher-level managers.
Consistent with results in previous years, around three-quarters of employees indicated that their learning and development needs had been identified and agreed with their manager. It is disappointing, however, that yet again one in five employees report that this is not the case.14
There continues to be a large variation across agencies—the proportion of employees in the 47 agencies with agency-specific results who indicated their needs had been identified ranged from 30% to 85%. Substantial work needs to be undertaken by agencies with results at the lower end of the spectrum in order to rectify their performance in this area.
Last year’s State of the Service report noted that employees in small agencies and employees working outside the ACT were less likely to indicate that their learning and development needs had been identified and agreed to. This year, however, these employees were just as likely as their ACT-based colleagues to indicate that their needs had been identified. Variation continues to exist by type of work, with employees working in regulatory and legal roles most

likely to report that their learning and development needs had been identified and agreed to, and employees in administrative support, clerical or corporate roles least likely to indicate that this was the case.
SES employees (63%) continue to be less likely than EL (70%) and APS 1–6 (74%) employees to report that their learning and development needs have been identified. The last two State of the Service reports have highlighted the need for agencies to improve their performance in this area, but this has not occurred.
Agencies continue to have a good understanding of how learning and development requirements vary for employees at different levels. In the next 12 months, learning and development targeted at technical skills is a priority across all classification levels; however, its importance decreases as classification increases (see Table 5.2). Another priority across all classifications is other public administration, with the types of skills targeted in this category varying across classifications—integrity training (e.g. APS Values and Code of Conduct) is a priority for APS 1–6 employees and working with Ministers and appearing before parliamentary committees is a priority for EL 2 and SES Band 1 employees. For SES Band 2 and SES Band 3 employees, who are not included in the table below, two dominant priorities emerged—leadership and broader management skills (e.g. strategic management, operational planning and managing risk).
Given investing in leadership development is one of the three pillars of an effective leadership development strategy, it is pleasing that agencies see leadership and people management skills as development priorities for their EL and SES employees. Agencies need to ensure that they action these priorities.
Table 5.2: Agencies’ anticipated learning and development priorities for employees, 2008–09(a)
Rank APS 1–4 APS 5–6 EL 1 EL 2 SES Band 1
(a) Agencies were asked to identify, by classification, the top five learning and development needs for their employees in 2008–09. The results in Table 5.2 are the five areas most commonly reported by agencies.
Source: Agency survey
1Technical, relevant to current job
Technical, relevant to current job
People management Leadership Leadership
2 Other public administration
People management Leadership People
managementOther public administration
3 Writing Other public administration
Other public administration
Other public administration
People management
4 Interpersonal skills
Interpersonal skills
Technical, relevant to current job
Technical, relevant to current job
Building partnerships and relationships
5 Information technology Writing Business and/or
financeInterpersonal skills
Technical, relevant to current job
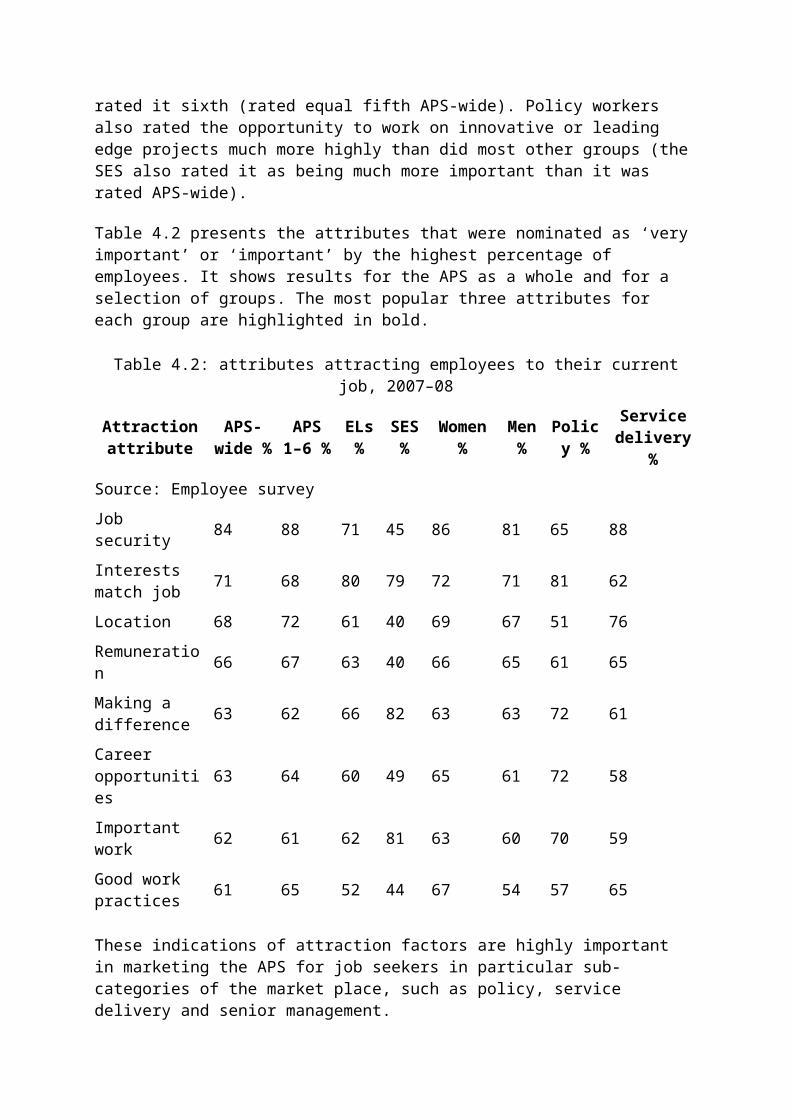
Last year’s State of the Service report identified new ways of working as a future challenge for the APS. Strong and effective interpersonal skills are foundation skills for modern public servants who are increasingly required to have the ability to listen to the views of others, take them into account, resolve conflict when needed and negotiate effectively. It is encouraging that agencies are placing a priority on interpersonal skills for three of the five groups, and that building partnerships and relationships has been identified as a priority for SES employees. Effective relationship management skills for all employees will be important in building agile and responsive organisations that are better able to engage with stakeholders and the community.
Aligning learning and development to organisational business goals
Agencies continue to have a strong focus on aligning their learning and development with their organisational business goals. The most common way of doing this is by identifying priorities through the performance management system (see Figure 5.5). The inclusion of learning and development priorities in collective and/or individual agreements has declined, but there has been an increase in the identification of learning and development priorities in work group plans and corporate plans over the last five years. This is a positive result and, coupled with most employees having their learning and development needs identified and agreed with their manager, suggests that learning and development is increasingly being integrated with business processes and organisational needs.
Figure 5.5: Measures used to align learning and development to organisational business goals, 2002–03, 2004–05 and 2007–08
Source: Agency survey
Despite a change in the types of measures being used to align learning and development with organisational business goals, almost all agencies continue to report using at least one measure. The proportion of agencies using four or more measures decreased from 68% in 2004–05 to 60% this year. As agency size increases so does the tendency to use a broader range of measures to align learning and development with business goals.

Employee satisfaction and access to learning and development
Given the influential role that learning and development can play in attracting and retaining employees, it is important that employees perceive it is managed well.
Satisfaction with learning and development
This year, employees held mixed views about learning and development, with just over half of employees satisfied with the Learning and Development factor.15 Satisfaction varied for different segments of the workforce, with younger employees (i.e. those aged under 25 years) recording higher levels of satisfaction, as did women, employees in small agencies and employees working in the ACT. In contrast, people with disability reported very low levels of satisfaction (38%).
Employees were most satisfied with less formal areas of learning and development that had helped them improve their productivity (see Table 5.3). They were much less positive about the effectiveness of the learning and development they had received in the last 12 months. Only 31% of employees agreed that the learning and development they received in the last 12 months was highly effective in helping them improve their performance, but a further 41% believed it had been moderately effective.
One key issue related to perceived effectiveness was employees’ satisfaction with their access to learning and development—52% of those who were satisfied with their access also rated the effectiveness of their learning and development as high, and 59% of employees who were dissatisfied with their access rated the effectiveness of their learning and development as low.
Table 5.3: Satisfaction/agreement with questions comprising the learning and development factor, 2007–08
Satisfied/agreed (%)
(a) Employees were asked to rate effectiveness on a five-point scale from ‘very high’ to ‘very low’. Respondents who indicated that the effectiveness of their learning and development had been ‘very high’ or ‘high’ were included in the satisfied/agreed category.
Source: Employee survey
I increased my knowledge or experience in the job 78
I had access to the information, resources and/or technology I needed to perform my job 71
I had access to effective learning and development 58
My agency places a high priority on the learning and development of employees 55
Overall, how satisfied are you with your own access to learning and development in your organisation? 55
Please rate the overall effectiveness of the learning and development you received in the last 12 months in helping you improve your performance(a)
31

Some employees also provided general comments about learning and development, which were both positive and negative. Some examples of such comments included:
I have a thirst to learn but no training or opportunity has arisen.
Workloads are increasing which leaves no time for training.
There is a strong recognition and emphasis in the agency overall on the need to keep updating and developing skills throughout one’s career.
I find learning on the job most useful for me.
Far too much emphasis is put on formal training and higher education. Better opportunities for mobility and secondment are more important.
Agencies and managers need to be innovative in providing learning and development options to staff, for example, by using eLearning options and internal or cross-agency project opportunities. To assist agencies in the eLearning environment, the Commission launched an eLearning Support Services and Solutions Panel in September 2008. It has been established to improve access to eLearning service providers with a demonstrated track record, encourage the adoption of innovative services, and ensure content developed for the eLearning environment is of a high standard and appropriate for accreditation (where required). The eLearning Support Services and Solutions Panel supplements the Commission’s Leadership, Learning and Development Panel and provides services in relation to content development and accreditation, content deployment, training and support services, and consultancy services.
Amount of off-the-job learning and development
Most employees continue to report that they had spent some time on off-the-job learning and development activities in the last 12 months. Just over half of employees spent between one and five days and a further 30% spent six or more days on such activities. For the second consecutive year, a minority of employees (17%) indicated that they had spent no time on these activities.
Last year’s State of the Service report noted that employees inside the ACT were more likely than employees outside the ACT to have spent time on off-the-job learning and development. This was not the case in 2007–08 and employees outside the ACT were more likely than those inside the ACT to have spent six or more days on off-the-job learning and development (employees inside the ACT were more likely to have spent between one and five days on these activities). Consistent with last year’s result, employees in large agencies were more likely than employees in other agencies to report that they had spent six or more days on off-the-job learning and development, whereas employees in medium and small agencies were more likely to report that they had spent between one and five days on these activities. SES and EL employees were most likely to report that they had spent some time on off-the-job learning and development. Differences also emerged by type of work, with employees working in legal and regulatory areas most likely to report spending six or more days on off-the-job learning and development, and administrative support and clerical employees most likely not to have spent any time on such activities.

It is important to recognise that there is a range of learning and development options available for agencies to use beyond off-the-job activities. The employee survey results suggest that many employees are receptive to informal opportunities that help them to improve their performance. Around 85% of employees agreed that they ‘often look for opportunities to develop new skills’ and that they ‘enjoy challenging and difficult tasks at work where they learn new skills’.
Agencies’ investment in off-the-job learning and development
Collection of data about expenditure on learning and development has been increasing, and this year 90% of agencies indicated that they could estimate their investment in formal off-the-job learning and development activities. This is up from 78% in 2004–05 (when this information was last collected by the Commission). This year almost all large (96%) and medium (93%) agencies, and the great majority of small agencies (84%), could estimate their investment.
Of the 81 agencies indicating they could estimate their total off-the-job learning and development expenditure:16
54% spent $500,000 or more 21% spent between $250,000 and $499,999 the remainder (25%) spent less than $250,000 on formal off-the-job learning and
development in 2007–08.
These results suggest that agencies’ expenditure on off-the-job learning and development has held up over time. In 2004–05, 48% of relevant agencies spent $500,000 or more and 37% spent less than $250,000.
Not surprisingly, larger agencies continue to report spending more on formal learning and development than smaller agencies. All relevant large agencies and two-thirds of relevant medium agencies spent $500,000 or more, compared to only 13% of relevant small agencies.
Slightly fewer agencies (79 agencies) indicated that they were able to estimate their total expenditure as a percentage of departmental (agency) operating expenses.17 Around three-quarters of these agencies reported that their expenditure on formal off-the-job learning and development activities was less than 2% of their departmental (agency) operating expenditure; this is largely consistent with the results for 2004–05 (see Table 5.4).
Table 5.4: Relevant agencies’ expenditure on formal off-the-job learning and development as a percentage of departmental operating expenses, by agency size, 2004–05 and 2007–08
Expenditure as % of operating
expenses
Small Medium Large All agencies
2004–05 (%)
2007–08 (%)
2004–05 (%)
2007–08 (%)
2004–05 (%)
2007–08 (%)
2004–05 (%)
2007–08 (%)
Source: Agency survey
Less than 0.99% 44 50 28 42 28 19 34 39
1.00 to 1.99% 36 31 56 38 39 43 43 37
2.00 to 2.99% 12 13 11 15 6 24 10 16

Table 5.4: Relevant agencies’ expenditure on formal off-the-job learning and development as a percentage of departmental operating expenses, by agency size, 2004–05 and 2007–08
Expenditure as % of operating
expenses
Small Medium Large All agencies
2004–05 (%)
2007–08 (%)
2004–05 (%)
2007–08 (%)
2004–05 (%)
2007–08 (%)
2004–05 (%)
2007–08 (%)
3.00% or more 8 6 6 4 28 14 13 8
Relevant large agencies continue to be more likely than relevant medium and small agencies to spend more than 2% of their departmental (agency) operating expenditure on formal off-the-job learning and development activities (see Table 5.4). This suggests that large agencies invest more in absolute as well as proportional terms in such activities. These results—coupled with the employee survey results—indicate that employees in larger agencies continue to have more access to formal off-the-job learning and development activities.
It is important to recognise, however, that this does not necessarily mean that large agencies place a greater emphasis on developing their employees. In fact, as discussed earlier in this chapter, employees in small agencies reported higher levels of satisfaction with the Learning and Development factor than their colleagues in larger agencies. The differences reported by agencies in their investment in off-the-job learning and development may reflect the different learning and development strategies they have in place, for example, some agencies may have a greater focus on online training and on-the-job opportunities. Agencies’ business and capability needs are also an important part of the mix that will inform their approaches to learning and development.
Key chapter findingsAgency and employee views of leadership capability indicate that developing and strengthening leadership across the APS continues to be a key challenge. This challenge should be addressed by:
building a cohesive senior leadership cadre investing in leadership development for the SES and SES feeder group taking a systematic and integrated approach to succession management.
Critical to the success of these actions is the need for reinforcement in agencies’ performance management systems.
The majority of employees continue to be positive about their supervisor’s performance against the five ILS capability clusters. Longer-term trend information indicates gradual improvement in four of the capability areas; however, the stabilisation of results this year is of concern and agencies may need to renew their focus on developing these capabilities among managers.
Employees’ views of their senior leaders continue to be at lower than desirable levels. Being able to create a culture that values and rewards innovation is a skill that all SES and EL employees need to develop if the APS is to provide influential advice to assist the Government in achieving its objectives. It is disappointing that there has been no improvement in employees’ perceptions of communication between senior leaders and other

employees, or that senior leaders are receptive to ideas put forward by other employees. As the Government looks to the APS for big ideas and innovation, it is essential that all senior leaders model a principles-based decision-making framework that facilitates devolved leadership and promotes a culture of innovation.
Agencies also continue to report skills gaps among the SES and SES feeder group, most notably in the areas of effectively managing people, steering and implementing change, and strategic thinking. These results reinforce the need to invest in capability development for both the SES feeder group and the SES.
The need to invest at an agency and APS-wide level in leadership development for the SES and SES feeder groups is one of the three pillars that underpin effective leadership strategies. In accordance with its statutory responsibility, the Commission offers eight flagship programmes for SES employees and three for the SES feeder group. These programmes represent the key building blocks for leadership across the APS, and all SES and EL 2 employees should participate in these programmes at some stage in their career. These programmes are complemented by agency-specific approaches, with many agencies continuing to focus on the development of their EL employees.
The creation of a cohesive senior leadership cadre is another pillar of effective leadership strategies. Almost a decade on from the implementation of the Public Service Act 1999, it is disappointing that many SES employees do not see themselves as part of a broader APS-wide leadership cadre. Action needs to be taken immediately to reverse the decline in the proportion of SES employees who identify as ‘definitely’ part of this broader leadership group. It is the responsibility of agency heads and their deputies to model and develop a culture within their agency that promotes leadership identity within a broader APS-wide context. It is also the responsibility of each and every SES employee to see themselves in the bigger picture and to recognise that their leadership role goes beyond their current agency.
Targeted mobility options and cross-APS leadership development programmes are just two ways that may assist in creating a greater sense of APS identity among senior leaders. Employees’ higher levels of satisfaction with career progression within the APS (compared to that within their agency) provide further evidence of the value of APS-wide approaches to leadership development and succession management.
The final pillar of effective leadership strategies is systematic and integrated succession management planning. Given the ageing of the APS workforce and the tightening labour market conditions, it is important that agencies focus on developing leaders for the future. This is not an easy process, but requires targeted and integrated strategies, where recruitment, retention, succession planning and leadership development opportunities are considered holistically and not in isolation. A comprehensive approach to succession management requires significant investment, rigorous and future-oriented strategic leadership and careful planning. At this stage, most APS agencies are relying on more informal approaches, which is a good start, but will not be sufficient for the future.
Agencies need to consider how and when they are going to identify leadership talent and potential. Key career points when an assessment could be made are: after three to five years in the public service; at the middle manager (EL 2) level; and at all levels in the SES. Potential can be gauged by a combination of talent (intellectual and organisational), engagement with the workplace (how hard employees work and how committed they are), and aspiration (their

desire and commitment to developing themselves and moving up). Nevertheless, some talented employees may decide not to take the next step or to defer it for personal reasons. Agencies may need to consider ways to support these employees, especially in addressing the issue of work-life balance.
Although employees held mixed views about learning and development, it is pleasing to report that employees in small agencies and those working outside the ACT were as likely as their colleagues to report that their learning and development needs had been identified and agreed to with their manager—this is a solid turnaround on last year’s results.
Agencies continue to have a good understanding of how learning and development needs differ across classification levels, and most agencies are aligning their learning and development with their organisational business goals. It is encouraging that the skills for the future, for example, interpersonal skills as well as building relationships, were recognised as a priority for most groups of APS employees. It is also pleasing to report that more agencies are able to provide information about their expenditure on learning and development.
Agencies need to continue their strong investment in learning and development, even as financial pressures become greater. Learning and development is an area often targeted for reduction when agencies are being asked to cut back on their discretionary expenditure. Agencies may need to become more strategic and targeted in the types of activities they offer employees, but any reduction in expenditure on learning and development needs to be carefully considered, given its importance in enhancing productivity. In building agile organisations with the depth and breadth of capability needed to achieve both short-term and long-term benefits for the APS, learning and development is an area where agencies need to continue to invest.
1 UK Civil Service 2007, Leadership Strategy, <http://www.civilservice.gov.uk/iam/leadership/strategy.asp>
2 Canada Public Service Agency 2008, 2007–08 Public Service Renewal Action Plan, <http://www.psagency-agencefp.gc.ca>
3 Australian Public Service Commission 2006, The Integrated Leadership System, Commonwealth of Australia, Canberra, <http://www.apsc.gov.au>
4 Some caution should be exercised when comparing the results for 2006–07 and 2007–08 with those of earlier years, as the 2007 and 2008 employee surveys included a brief description of what skills and behaviours relate to each of the capability clusters. This was not included in previous surveys.
5 Australian Public Service Commission, Unpublished data, CDAC Series 3, September 2005 to August 2008.
6 See the State of the Service Report 2006–07 for more detailed analyses of skills gaps for SES and SES feeder group employees.

7 Australian Public Service Commission 2007, Agency Health: Monitoring Agency Health and Improving Performance, Commonwealth of Australia, Canberra, <http://www.apsc.gov.au>
8 The Senior Leaders factor is derived from the factor analysis of satisfaction with issues related to employee engagement discussed in Chapter 4 and provides a summary of employees’ views about senior leaders. Full details of the factor analysis, including details of the methodology and questions used, are set out in Appendix 3.
9 Management Advisory Committee 2005, Senior Executive Service of the Australian Public Service: One APS—One SES, Australian Government, Canberra (leaflet).
10 OECD 2008, Ireland: Towards an Integrated Public Service, <http://www.oecd.org>
11 OECD Public Employment and Management Working Party 2008, The Senior Civil Service in National Governments of OECD Countries, p. 135, <http://www.oecd.org>
12 PS Act s.41(1)(j).
13 Australian Public Service Commission 2008, Ensuring Leadership Continuity in the Australian Public Service: A Guide to Succession Management, Commonwealth of Australia, Canberra, <http://www.apsc.gov.au>
14 The remaining employees were unsure about whether their learning and development needs had been identified and agreed to with their manager in the last 12 months.
15 The Learning and Development factor is derived from the factor analysis of satisfaction with issues related to employee engagement discussed in Chapter 4 and provides a summary of employees’ views about learning and development. Full details of the factor analysis, including details of the methodology and questions used, are set out in Appendix 3.
16 Total expenditure was defined in the agency survey as ‘the sum of all costs associated with learning and development activity including venue costs, catering, presenter fees, travel expenses, development and design costs, material, salary costs+on-costs of participants etc’.
17 Departmental operating expenses were defined in the agency survey as including employee, supplier, depreciation and other expenses. It does not include administered items.

Chapter 6: Increasing APS efficiency and effectiveness Increasing efficiency and effectiveness is central to the Australian Public Service (APS) enhancing productive capacity. There are many drivers of productivity improvement and ways to increase labour productivity—through attracting and retaining the right people, productivity-based workplace agreements, effective leadership, and investing in learning and development. Agencies can also realise productivity gains through enhancing processes—better business processes, embracing up-to-date information and communications technology (ICT) systems and by reducing unnecessary levels of internal red tape.
Increasing productivity is something that the APS has focused on for a long time, with reforms such as new public management and the devolution of financial and people management responsibility to agencies all designed to increase the efficiency and effectiveness of the APS. Nevertheless, the transitioning for the APS from the previous government to the current government, and Government measures such as Razor Gang I and II (including an additional one-off efficiency dividend being applied to agencies’ operating budgets) have renewed the focus across the public service on ways to increase efficiency and effectiveness, including consideration of greater use of shared purchasing arrangements. Given the current global economic circumstances, it is clear that the focus on these issues for the APS will intensify.
At the same time, the impact on smaller agencies of the across the board measures such as the efficiency dividend is being considered by the Joint Committee of Public Accounts and Audit (JCPAA), through its inquiry into the effects of the ongoing efficiency dividend on smaller public sector agencies. The key issue is whether all APS agencies can continue to realise real productivity gains of the magnitude required under current funding arrangements, without this having an impact on the quantity and quality of services. Productivity improvements are linked very much to each agency’s circumstances and in particular, to the nature of their core functions.
This chapter begins by discussing some of the issues associated with measuring APS productivity, including the cumulative impact of the efficiency dividend and partial supplementation for remuneration increases and the specific impacts already being felt by agencies from the additional one-off 2% efficiency dividend. Broader APS-wide and agency-specific approaches over the last 12 months to improving efficiency and effectiveness are then considered as are APS employees’ views of their own productivity. The remainder of the chapter focuses on three key human resource (HR) influences on productivity—worklife balance, managing for improved performance, and leave management (including the management of unscheduled absence and annual leave).
Managing in a tighter fiscal environmentThere is pressure on managers in the private and public sectors, both in Australia and internationally, to adopt approaches that realise efficiency and effectiveness gains for their organisation. This pressure was increased towards the end of 2007–08 in the APS, with an

additional one-off 2% efficiency dividend applied to most APS agencies’ operating budgets (effective from 1 March 2008 to 30 June 2009). The first part of this section discusses the issue of measuring productivity in the APS, and the second examines developments in 2007–08 to improve efficiency and effectiveness in the APS.
Measuring APS productivity
One of the ongoing difficulties associated with assessing productivity increases in the APS is that there is no agreed methodology of how productivity in the APS should be measured. The main reason for this is that the APS operates overwhelmingly in a non-market sector, thus there are no market-determined price signals, and this means that there are difficulties in measuring the value of outputs.
Nevertheless, agencies have been able to demonstrate productivity gains by the cost savings they have been required to make due to the current funding arrangements and the efficiency dividend. Such arrangements have been an important driver of efficiency improvement in the APS over many years, although their sustainability for some agencies is discussed below (see ‘Cumulative Impact of the Efficiency Dividend and Partial Supplementation for Remuneration Increases’) and also in other sections of this report (see, for example, the remuneration section in Chapter 4).
In broad terms, the current funding arrangements provide agencies with indexation supplementation to existing funding, and additional funding for new policy. Supplementation requires agencies to find substantial cost savings every year in order to fund wage increases and the efficiency dividend.
The wage cost indexes applied to departmental funding require that agencies achieve productivity gains to finance increases in wage costs above a certain minimum. This approach has resulted in funding for increases in wage costs of around 2.1% per annum over the last 10 years. Given that average wage increases have averaged around 4% per annum over recent years, agencies have needed to find cost savings of around 2% per annum to help meet wage increases.1
Cost savings have also been returned to governments for reallocation by means of the efficiency dividend, which is cumulative in its impact on agency base funding. The efficiency dividend was introduced in 1987–88 and has been applied at various rates ever since. In 2008–09, an ongoing 1.25% efficiency dividend plus the additional one-off 2% efficiency dividend was applied to agency departmental appropriations, with some exceptions.2
Over the last decade average labour productivity has increased by 1.4% per annum in the Australian economy generally and by 1.7% per annum in the market sector.3 A direct comparison between the level of cost savings in the APS and labour productivity growth in the rest of the Australian economy is not possible because of difficulties in measuring the quality and quantity of inputs and outputs. It is also difficult to take into account the effect of funding injections for new policy and service initiatives, and the changes in the quantity and quality of outputs, on APS agencies’ ability to find cost savings necessary to fund the efficiency dividend and wage cost increases.

Nevertheless, the total cost savings that are required to be made each year by every agency in the APS are substantial, and compare very favourably with annual labour productivity growth in the economy more broadly.
Cumulative impact of the efficiency dividend and partial supplementation for remuneration increases
Efficiency dividends are not new to the APS, and have been in place for the last 20 years. Such cost savings are one concrete way in which agencies can demonstrate productivity gains, as long as the savings have not been made by reducing the quality or quantity of outputs produced by the agency. However, it has become clear that the pressure on agency budgets from the cumulative, combined effect of the efficiency dividend and the partial supplementation for wage increases has resulted in some agencies having to reduce the quality and/or quantity of their outputs. Submissions made to the current JCPAA inquiry into the ongoing effects of the efficiency dividend on smaller public service agencies, for example, have revealed that:
the Australian National Maritime Museum (ANMM) has reduced its core programmes and services
the Australian National Audit Office (ANAO) has reduced the number of performance audits it conducts
the Insolvency and Trustee Service Australia (ITSA) has reduced the extent to which it investigates alleged offences.
The size of an agency and/or the nature of an agency’s activities (including, for example, cultural institutions, smaller agencies, and those with a high proportion of fixed costs in their budgets) can limit their potential for generating cost saving productivity gains, year after year, of the magnitude required.
On the other hand, in some agencies it may be that quality and/or quantity of outputs increase over and above the levels explicitly funded by the Government (such as when minor new policy proposals are required to be absorbed into agencies’ activities with no additional funding) and productivity in these agencies could be even higher than the level of cost savings required to be realised each year.
Specific impacts of the additional 2% efficiency dividend
Previous State of the Service reports have raised concerns about the ongoing cumulative impact of the efficiency dividend and the partial supplementation for wage increases.4 This year’s agency survey included questions to assess specifically the initial impact the additional 2% efficiency dividend (effective from 1 March 2008 to 30 June 2009) was having on agencies, with some early patterns evident.
The majority of agencies reported that the additional efficiency dividend had already had an impact on their agency. Five agencies indicated that they were exempt from the additional efficiency dividend (CRS Australia, IP Australia, the Workplace Authority, the Australian Pesticides and Veterinary Medicines Authority (APVMA), and the Royal Australian Mint (RAM)).5 Of the remaining 85 agencies, the most common impacts were a reduction in staffing levels and increased working hours for existing employees (each reported by around

50% of agencies). Almost one-third of relevant agencies indicated that the additional efficiency dividend had already had other impacts, including increased workloads and/or pressure on staff, increased customer service waiting times, reduced service standards for some customer activities due to fewer staff, training being postponed and a reduction in some programmes. Smaller proportions of relevant agencies indicated that employees’ annual leave balances had increased due to staff being unable to take leave due to high workloads (18%) or that the agency’s ability to offer flexible working arrangements had been reduced (14%).
Not surprisingly, most of the 85 agencies were already taking action to adjust to the additional efficiency dividend under the ‘Responsible Economic Management Package’ Budget measures. Seventy-two agencies (85%) reported taking a series of actions to respond to the Budget measures, although 13 agencies (15%) indicated that currently, they did not need to take any actions. Six themes emerged from the actions being taken by the 72 agencies to respond to the Budget measures:
tighter control over recruitment actions (e.g. recruitment freezes and pauses, reviewing the need for positions when they become vacant, and requiring SES approval to fill vacancies)
decreasing the number of employees (e.g. using voluntary redundancies, reducing overall full-time equivalent (FTE) and non-ongoing contracts not being renewed)
reducing the amount (and type) of travel undertaken by staff (e.g. not allowing SES employees to travel business class on some sectors, and greater use of video conferencing)
reprioritising activities (e.g. spending freezes on non-critical activities, transferring resources to activities of greatest need, changes to service delivery arrangements and programme cutbacks)
re-engineering approaches and using more efficient systems (e.g. automating payroll systems, using shared ICT services and relying on better ICT)
reducing the number of contractors and/or consultancies.
The most common actions being taken were to place a tighter control over recruitment actions (51%), to decrease the number of employees (44%) and to reduce the amount (and type) of travel undertaken (38%) (see Table 6.1). When the proportions of relevant agencies taking some type of action relating to staff are combined, just over two-thirds (69%) of agencies reported that they are placing a tighter control over recruitment and/or reducing the number of staff.
Table 6.1: Most common actions already taken by relevant agencies to respond to the additional 2% efficiency dividend by agency size, 2007–08
Action Small (%)
Medium (%)
Large (%)
All relevant agencies (%)
Source: Agency survey
Tighter control over recruitment 70 29 52 51
Decreasing the number of employees 37 42 57 44
Reducing travel 37 25 52 38
Reprioritising activities 26 29 19 25
Re-engineering approaches 4 13 29 14

Table 6.1: Most common actions already taken by relevant agencies to respond to the additional 2% efficiency dividend by agency size, 2007–08
Action Small (%)
Medium (%)
Large (%)
All relevant agencies (%)
Reducing the number of contractors and/or consultancies 11 21 24 18
The types of action taken varied by agency size, for example, relevant large agencies were more likely than medium and small agencies to reduce travel, whereas small agencies were most likely to place a tighter control over recruitment (see Table 6.1). Relevant small agencies (85%) were more likely than large (71%) or medium (50%) agencies to report that they are taking actions related to tightening recruitment and/or reducing staffing levels.
These differences based on agency size, may in part reflect agencies’ opportunity costs and/or substitution effects, for instance, their capacity to substitute less cost-effective approaches with more technologically cost-effective approaches. This may especially be the case in areas of discretionary spending, for example, larger agencies may have the ICT infrastructure that enables video conferencing rather than interstate travel to be used; whereas this may not be an option for smaller agencies due to the initial technology outlay needed to reap longer- term benefits. Larger agencies may also have been undertaking more discretionary travel and therefore be able to reduce the level of travel more easily. Of particular concern is the longer-term productivity impact such constraints could place on small agencies—if smaller agencies are not in a position to invest both in ICT and their people, they will be less well-placed to realise longer-term productivity gains (see Chapter 5 for a discussion of agencies’ investment in learning and development).
Differences between agencies’ approaches in responding to the additional 2% efficiency dividend may also be related to functional responsibilities of the agency. Those agencies where the range of outputs and services for which they are responsible is narrow and cannot be varied (e.g. where their functions are largely statutorily determined), may have to cut the quantity of the services they deliver as they have more limited scope to secure funding for new programmes and services. Similarly, agencies whose discretionary spending makes up a very low proportion of their operating expenses have less capacity to absorb ongoing efficiency measures, which may mean they need to reduce staffing numbers and the services they deliver. These issues have been raised in agency submissions to the JCPAA inquiry into the ongoing effects of the efficiency dividend on smaller public service agencies.
The additional efficiency dividend appears to have led to a tightening of recruitment activities and a need to manage carefully or reduce staffing levels across agencies. To assist agencies manage the redeployment of excess and potentially excess employees, the Commission is responsible for the Career Transition and Support Centre.
Career Transition and Support CentreOn 28 March 2008, Senator the Hon. John Faulkner announced the establishment of the Career Transition and Support Centre to assist with the redeployment of excess and potentially excess staff. The Centre was established with a view to minimising the personal
impact of the Government’s efficiency measures and to ensure the retention of quality public servants with specialised skills sets.
The Centre opened for business on 1 May 2008 and has worked actively with agencies to provide best practice advice on redeployment, in particular, the set of redeployment principles promulgated by the Australian Public Service Commissioner.
The Centre is run on a partial cost recovery basis, with agencies required to pay a $2,200 referral fee per employee referred. A total of 75 employees were referred to the Centre between 1 May and 30 June 2008 for career transition support. Agencies appear to be handling redeployment issues internally without the need to refer large numbers of employees to the Centre.
Many agencies commented that at the time of the agency survey (in the field from 4 June to 16 July 2008) it was too early to assess the impact of the additional efficiency dividend. Nevertheless, most agencies have already begun to take action to deal specifically with the one-off increase in the efficiency dividend. This action is above and beyond previous approaches agencies have adopted over the last decade, partly in response to the ongoing efficiency dividend, to increase their efficiency and effectiveness. The key issue is the ongoing and cumulative impact of the efficiency dividend and the partial supplementation for wage increases, especially on smaller agencies’ core activities.
Developments in 2007–08 to improve efficiency and effectiveness in the APS
Notwithstanding the possible implications for small agencies arising from the efficiency dividend, current global economic circumstances and the need for fiscal rigour domestically will require an even greater focus on efficiency in the APS.
Broader APS-wide developments
Upon taking office, the current government announced that it would undertake a comprehensive review of government expenditure in two stages. The first stage—Razor Gang I—focused on realising cost savings by better targeting government assistance and cutting ineffective programmes, for example, introducing a means test on the baby bonus, ceasing the Commercial Ready Program, abolishing the Access Card project and imposing an additional 2% efficiency dividend on the public service.6
Razor Gang II, the second stage of this review, is focused on identifying areas of Government where there is potential to increase the efficiency and effectiveness of programmes and services.7 A taskforce has been established in Finance, and is working with agencies to analyse and advise the Government on opportunities where improvements in expenditure can be made.
As part of improving APS-wide efficiency and effectiveness, Finance is also examining potential whole of government procurement arrangements in areas where there is little diversity of requirement across agencies and that are substantial and in common use by all (or most) agencies. Coordinated arrangements would be directed at establishing whole of government contracts to better leverage the Government’s buying power. They would not involve a single agency purchasing all goods and services for the Government. These moves represent a sensible recalibration within the agency-based devolved environment towards new

coordinated service arrangements that will harness cost reductions for agencies and savings to the Government.
Coordinated contracts are not new to the APS, and coordinated contracting arrangements for motor vehicle fleet management, telecommunications and central advertising have worked well for a number of years. Coordinated arrangements can result in a reduction in administration costs for both agencies and suppliers.
In addition to work being led by Finance, another key response by the Government in increasing efficiency and effectiveness across the APS was commissioning Sir Peter Gershon to undertake a review of the Australian Government’s Use of ICT. As part of the review Sir Peter conducted wide consultation within government, the ICT industry and other related representative organisations.
In his report to the Government, Sir Peter highlighted seven key findings. Central to these findings was his conclusion that the high levels of agency autonomy involved with the current model of ICT are leading to sub-optimal outcomes for Government and that there is a need to rebalance agency autonomy and coordination across government. Sir Peter made a series of recommendations in six areas as to how the Australian Government could strengthen whole of government management of ICT: governance; capability; ICT spend; skills; data centres; and sustainable ICT.8
The findings of this review highlight the need for APS agencies to change their current approaches in many areas relating to ICT, and as part of this change process some agencies may be required to make more savings. At the time of publication of this report, the Government was considering the recommendations of Sir Peter’s review.
Agency approaches
At the same time as broader APS-wide approaches have been undertaken to identify efficiency and effectiveness improvements, APS agencies have focused on reviewing their own structures and processes to realise efficiency and/or effectiveness gains. Almost all agencies (97%) had taken specific actions to improve their efficiency and/or effectiveness in 2007–08. The four most common actions identified by agencies were:
enhanced ICT capability or greater use of technological solutions improved financial arrangements (e.g. improved internal budget and/or procurement
processes) improved governance and accountability arrangements within the agency organisational restructuring or realignment of priorities to better meet the needs of the
Government.
These actions are already resulting in improved performance across agencies, with two-thirds of agencies reporting that the action they had taken had been successful in improving their efficiency and/or effectiveness. Around one-third of agencies reported that it was too early to tell whether or not the action(s) had been successful. For some small agencies, consistent with their submissions to the JCPAA, their capacity to invest in and implement solutions of this kind is being circumscribed by the ongoing impact of the efficiency dividend.
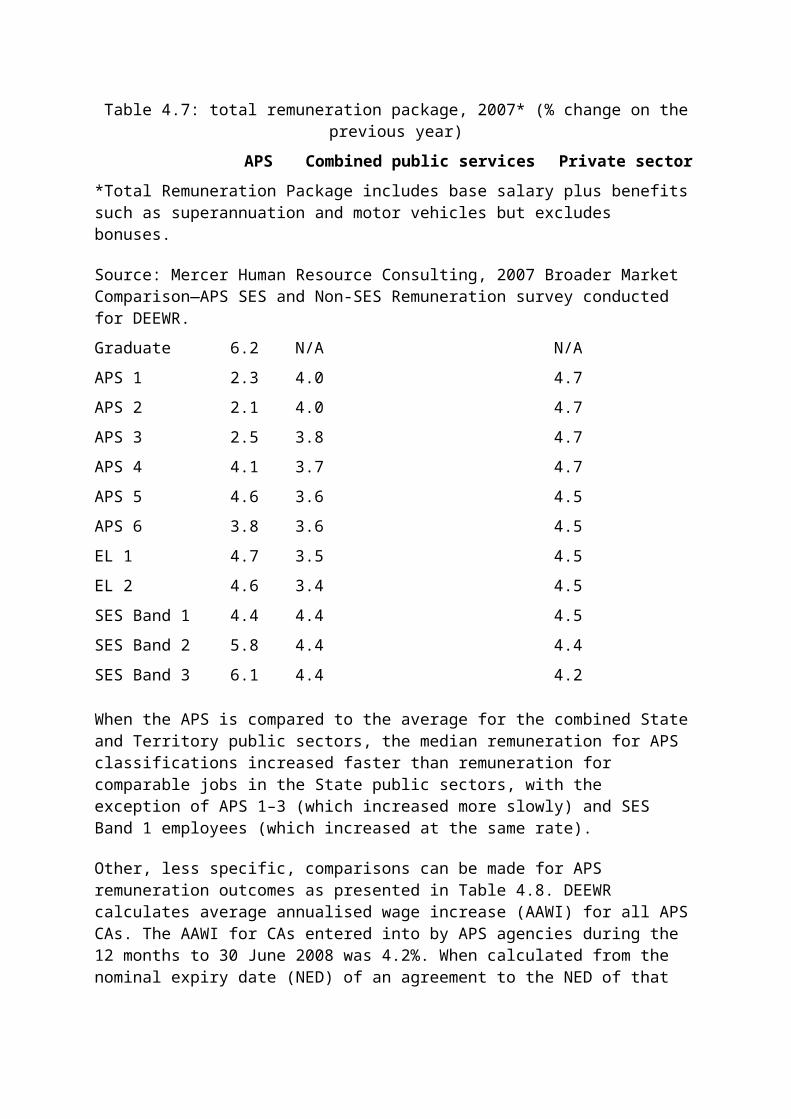
Employee perceptions of productivityTo gain an insight into employees’ perceptions of their own levels of productivity, employees were asked a series of questions that explored their perceptions of productivity improvement over the last year. These perceptions are not a direct measure of actual productivity improvement; however, they can assist agencies target areas that may boost productivity.
Improving personal productivity
Employees were fairly positive when it came to whether they thought their own productivity had increased in the last 12 months. Six in 10 employees reported that their productivity had increased markedly (26%) or somewhat (35%) in the last 12 months, while a further 19% indicated it had remained about the same. Only 7% of employees indicated that their productivity had declined in the last 12 months, and the remaining 14% reported that the question was not applicable (e.g. they had recently changed jobs). These results are consistent with those reported in 2004–05 and 2005–06 (when employees were last asked this question).
To identify what employees believed to be the important areas in improving or maintaining their personal productivity over the next 12 months, they were asked to rate the importance of several areas relating to productivity improvement (see Table 6.2). Over 90% of employees indicated that good working relationships, working to realistic performance expectations and access to the information, resources and/or technology they need to do their job were important in maintaining or improving their productivity in the next 12 months. Interestingly, only 47% of employees reported that greater levels of calculated risks being taken in their work area were important for their personal productivity. This area was, however, more important for SES employees, with almost two-thirds (64%) of SES employees rating greater levels of calculated risks being taken as being important.
Table 6.2: Employee views on areas as ‘important’ to improve or maintain productivity in the next 12 months, 2007–08
‘Important’ area in improving or maintaining productivity in next 12 months
(%)
Source: Employee survey
Good working relationships with manager and colleagues 94
Working to realistic performance expectations 92
Access to the information, resources and/or technology needed to do the job 92
Effective feedback from manager 88
A manager that encourages and manages innovation 87
Clear work plans and timetables 87
Effective formal and informal 84

Table 6.2: Employee views on areas as ‘important’ to improve or maintain productivity in the next 12 months, 2007–08
‘Important’ area in improving or maintaining productivity in next 12 months
(%)
communication within agency
Increased knowledge and/or experience in the job 81
Access to effective learning and development 77
Greater levels of calculated risks being taken in area 47
To identify how employees viewed their agency’s performance in each of these areas in the last 12 months, employees were asked to what extent they agreed with a series of statements relating to productivity. In highlighting key areas where agencies may be able to achieve the greatest levels of productivity improvement, Figure 6.1 shows the levels of agreement reported by employees who rated the area as ‘important’ in maintaining or improving their performance. Figure 6.1 suggests that, for example, agencies may be able to increase levels of productivity through better communication—of the 84% of employees who indicated that effective formal and informal communication was important to their future productivity, 57% of these employees were satisfied with their agency’s performance in this area in the last 12 months. Based on the results in Table 6.2 and Figure 6.1, other key areas for productivity improvement include:
having managers who encourage and manage innovation (87% of employees rated it as important, but only 59% of these employees were satisfied with their agency’s performance)
setting and communicating realistic performance expectations for employees (92% of employees rated it as important, but only 60% of these employees were satisfied with their agency’s performance)
managers providing more effective feedback to employees (88% of employees rated it as important, but only 65% of these employees were satisfied with their agency’s performance).

Figure 6.1: Employees who rated area as ‘important’ in improving or maintaining their productivity by level of agreement with agency performance in last 12 months, 2007–08
Source: Employee survey
These results highlight the important role that the manager plays in assisting employees improve their productivity. The issue of employees’ views of their immediate manager and the manager’s role in enhancing employee productivity is discussed in more detail later in this chapter in the section ‘Managing for Improved Performance’ and an exploration of the issues associated with building a culture of innovation in the APS can be found in Chapter 11.
Improving efficiency and effectiveness
As senior leaders at an agency and whole-of-APS level, SES and EL 2 employees have an important responsibility to identify and shape initiatives that drive efficiency and effectiveness gains in their immediate work area as well as across their agency and the APS.
Consistent with the actions reported last year, SES and EL 2 employees were most likely to report that more streamlined administrative processes, the recruitment of high-quality staff and better internal communication were important in achieving greater efficiency and/or effectiveness (see Figure 6.2).

Figure 6.2: SES and EL 2 views about what actions would increase efficiency and/or effectiveness in their agency, 2006–07 and 2007–08
Source: Employee survey
SES and EL 2 employees also provided other ideas about how their agency could improve its efficiency and/or effectiveness. Many of their suggestions related to areas covered in Figure 6.2, although some employees commented on the need for more staff or recognition of more realistic workloads. Some examples of suggestions included:
Bringing back some administrative support, so there is room enough to breathe and consider improving things.
It is often assumed that improved effectiveness comes from junior staff. It requires not only that. SES staff need to do more to improve their effectiveness. If they are more effective it flows on and benefits others. As SES we don’t do enough to change ourselves, but expect others to change.
Establishing and fostering processes within the department for developing medium to longer-term strategic policies that cross traditional policy silos within the department ...

[G]reater use of scenario scanning techniques, and policy officers in the department should have access to policy modelling techniques (and be trained how to use them).
My agency’s efficiency is in decline simply because we have to spend too much time working out how to do what needs to be done without enough resources ... We try to maintain the mirage of increasing productivity, but it has passed the point of diminishing returns.
Last year’s State of the Service report highlighted the key role corporate areas play in streamlining administrative processes and reducing internal red tape. The results from this year’s employee survey indicate that there is still a way to go in this area. The comments provided by some employees also suggest that some agencies may be finding it difficult to increase efficiency without compromising effectiveness. Although such comments are of concern, they are consistent with submissions made by some agencies to the JCPAA inquiry into the ongoing effects of the efficiency dividend on smaller public service agencies.
Work-life balanceA key challenge for the APS is the need to increase efficiency and effectiveness, but not at the expense of its reputation as an employer that enables employees to achieve a good work-life balance. In its broadest sense, work-life balance is a person’s satisfaction with their ability to manage the interactions between the multiple roles and activities in their life. Adopting policies and practices that support employees in balancing their work and life commitments makes good business sense—benefits to the agency can include increased levels of productivity, organisational commitment, improved morale and job satisfaction, and reduced levels of unscheduled absences and staff turnover. An agency’s reputation for good work practices (including work-life balance) can also be an important attractor for potential job candidates—61% of APS employees rated this as important in attracting them to their current job.
Managing excessive workloads
Managing priorities and workloads is an area that managers in both the public and private sectors must be skilled in. However, recent anecdotal evidence suggests that managing excessive workloads is something that has intensified for the APS. To assess the extent to which this issue has an impact on the APS, this year—for the first time—the agency survey asked agencies a series of questions relating to excessive workloads.
Managing excessive workloads appears to be an issue for many APS agencies. Just over half (54%) of agencies indicated that managing excessive workloads was an issue that had intensified for them in the last 12 months. Similar proportions of small, medium and large agencies reported that this was the case.
One of the difficulties in identifying the extent and impact of excessive workloads across the APS is the limited information available about who in the workforce is affected. Of those agencies that indicated the management of excessive workloads had intensified in 2007–08, under half (41%) were able to estimate the proportion of the workforce affected. Where agencies could estimate the proportion of staff affected, 55% reported that at least half of their workforce was affected by excessive workloads. When it came to which segments of the workforce are particularly affected, the most common response (given by around one-quarter
of relevant agencies) was that all areas and/or levels were affected. Other commonly reported segments of the workforce affected included corporate support areas, the SES and EL staff.
When it came to what those agencies affected were doing to address the issue of excessive workloads, around one-third of agencies were reprioritising work, reviewing existing workloads and/or examining ways to improve their organisational structure. Smaller proportions of agencies were actively promoting work-life balance (e.g. through well-being strategies and regular reports to senior management about additional hours being worked) and/or deferring some work programmes or discretionary work. Not surprisingly, these approaches are consistent with the actions agencies are taking to respond to the additional 2% efficiency dividend. This does not imply cause and effect, and agencies may be experiencing higher workloads due to reasons other than the additional efficiency dividend, for example, being responsible for the delivery of key Government priorities.
It is important that agencies continue to monitor workload levels, especially ‘hot spots’ in the agency, and that they implement flexible strategies to assist both employees and managers to deal with excessive workloads. Where possible, existing workforce metrics, for example, unscheduled absence, high levels of flex leave and/or annual leave being accrued (but not taken) and high turnover levels should be regularly monitored in order to identify any early warning signs that excessive workloads could adversely be affecting employee well-being.
In addition to the strategies outlined above, other options suggested by agencies for assisting the APS to manage excessive workloads include:
flexible resourcing approaches which enable employees to be moved temporarily to higher priority areas without the need for traditional staff movement processes
regular liaison with Ministers and their offices to improve workflows providing access to personal development programmes to enable employees to better
manage priorities and/or workloads.
Early indications, as measured through the agency survey, suggest that agencies are taking reasonable steps to manage excessive workloads; however, one of the key ways to test the effectiveness of such strategies is to examine employees’ perceptions of their work-life balance.
Employee satisfaction with work-life balance
Despite some evidence of increasing workloads in the APS, levels of employee satisfaction in relation to work-life balance declined only slightly this year compared to last year’s. Two- thirds of employees agreed that their workplace culture supports people to achieve a good work-life balance, which is down from the 71% recorded in 2006–07, but slightly above the 63% recorded in 2005–06.
Employees working in small agencies continue to be more likely than their colleagues in medium and large agencies to report that their workplace culture supports people to achieve a good work-life balance (77% compared to around 67% in other agencies). The results for the SES continue to be below those for employees at other classification levels, with 54% of SES agreeing that their workplace culture supports people to achieve a good work-life balance (compared to 61% of EL and 69% of APS 1–6 employees). There was also wide variation in
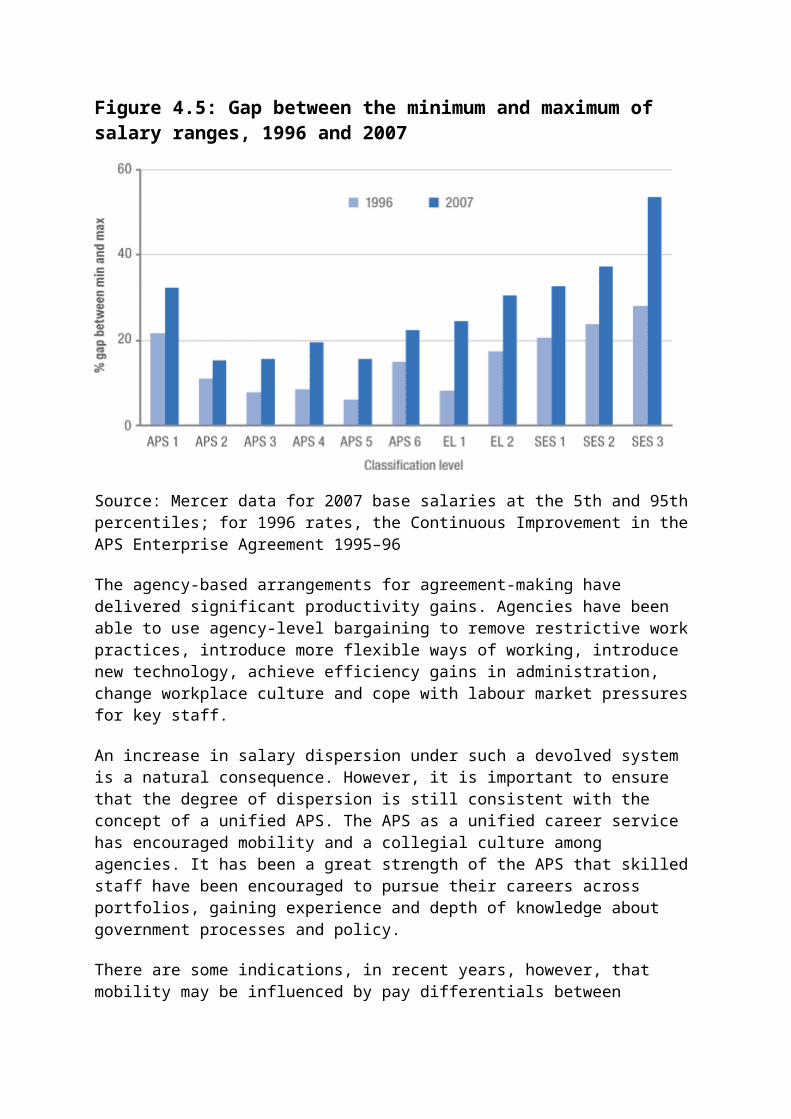
levels of employee agreement for agencies with individual agency-specific results, with agreement levels ranging from 35% to 84%.
Employees were slightly more positive when asked about their perceptions of their current work-life balance. In 2007–08, 71% of employees were satisfied with the work-life balance in their current job, which is midway between the 74% recorded last year and the 68% recorded in 2005–06.
Unlike the results for workplace culture, employees in small agencies reported similar levels of satisfaction with their work-life balance to those of employees in other agencies. However, levels of satisfaction with personal work-life balance were again lowest for SES employees (45% compared to 67% for EL and 73% for APS 1–6 employees). There was also wide variation in employee satisfaction levels for agencies with individual agency-specific results (50% to 83%). These results coupled with those above suggest that work-life balance is an area where some agencies can improve their performance.
Average hours worked in the last fortnight
One area that can have a significant impact on employees’ perceptions of their work-life balance is the amount of time they dedicate to work activities. Previous State of the Service reports have suggested that many employees work more or significantly more than their standard or agreed hours. However, the actual number of hours worked has not previously been quantified. To gain a better understanding of the hours worked by full-time APS employees, this year’s employee survey took a snapshot approach and asked employees how many hours they had worked in their current job in the last fortnight.
Notwithstanding the slight differences that exist between agencies in what constitutes a standard day for full-time employees (e.g. 7 hours and 21 minutes or 7 hours and 30 minutes), the employee survey results suggest that about one-third (35%) of full-time employees are working around standard hours (i.e. they reported that they had worked 75 hours or less in the last fortnight).9 This is similar to the 37% of all employees last year who reported working over the last six months, on average, around their standard or agreed hours. This year, 32% of full-time employees reported working more than 75 hours but less than 80 hours; 21% between 80 hours and less than 90 hours; 6% between 90 hours and less than 100 hours; and 3% worked more than 100 hours in the last fortnight.10
The likelihood of working extra hours varied for different segments of the full-time workforce. Classification had the most significant impact, with 87% of SES employees working 80 hours or more in the last fortnight (compared to 52% of EL and 22% of APS 1–6 employees).11 Almost half (45%) of SES employees worked 100 hours or more in the last fortnight. These results help to explain the poorer perceptions SES employees have about work-life balance.
Other segments of the full-time workforce more likely to report working 80 hours or more included: employees in small agencies (45% compared to 36% in medium and 30% in large agencies); employees working in departments (38% compared to 25% in non-departments); and employees working inside the ACT (39% compared to 25% outside the ACT). There was also significant variation across agencies in the likelihood that employees worked 80 hours or more in the last fortnight (18% to 71%). This variation may be due to the differences reported

above (e.g. a higher proportion of EL and SES employees) and/or it may reflect high workloads in that agency at the time the employee survey was in the field.
Although many issues can impact on employees’ levels of satisfaction with their work-life balance, there was a strong negative relationship between hours worked and levels of satisfaction with work-life balance. Over three-quarters (79%) of employees who reported that they had worked 75 hours or less in the last fortnight were satisfied with the work-life balance in their current job, compared to only one-third of employees who worked 100 or more hours in the last fortnight. The decline in satisfaction levels was particularly marked at the 100 hours level, with 54% of employees working between 90 and less than 100 hours satisfied with the work-life balance in their current job compared to only 33% working 100 or more hours. Working longer hours had a similar negative impact on employees’ agreement levels that their workplace culture supports people in achieving a good work-life balance.
It is important in a time where there is increasing pressure on agencies to do more with less, that extra efficiency is not gained at the expense of impacting adversely on employees’ ability to achieve a work-life balance. One of the advantages the APS has in a tight labour market is its reputation as an employer that enables people to balance their work and personal commitments. Given remuneration in the APS at most classification levels is not on par with that in the private sector, agencies need to manage excessive workloads in a strategic, yet practical, manner to ensure that the APS can maintain its competitive advantage in the employment market as an employer that supports work and life balance.
Managing for improved performanceSystematic approaches to performance management are an integral element in improving individual and organisational productivity. However, developing the most effective approaches to managing performance continues to pose challenges both in Australia and internationally. A study on public sector performance found that public service managers in Australia, Canada, Germany, the UK and the USA view problems with the management of people, funds and technology as significant barriers to improving performance.12 A House of Commons report in the UK also concluded that performance management was an area in need of urgent attention.13 In examining drivers of improved performance in the APS context, the following sections explore employees’ views of their immediate manager and agencies’ performance management systems.
Employees’ views of immediate managers
An immediate manager plays an influential role in assisting employees improve their performance and productivity. A manager’s effectiveness can also influence a range of other issues that can motivate employees to maximise their contribution to the organisation, for example, job satisfaction, employee engagement, and retention. Good manager, featured yet again this year as one of the most important workplace attributes that impact on employees’ overall levels of job satisfaction—42% of employees rated it as important and of these employees, 76% were satisfied (see Chapter 4 for a detailed discussion on job satisfaction).
Employees generally held positive perceptions about their immediate manager’s performance. Almost two-thirds of employees were satisfied with the Immediate Manager factor, which is derived from the factor analysis14 of satisfaction with issues related to employee engagement

discussed in Chapter 4 and provides a summary of employees’ views about their immediate manager (see Table 6.3).
Table 6.3: satisfaction/agreement with questions comprising the Immediate manager factor, 2007–08
Satisfied/agreed (%)
Source: Employee survey
My manager shows concern for the welfare of his/her staff 77
My manager demonstrates honesty and integrity 77
There were good working relationships with my manager and colleagues 76
My manager works effectively and sensitively with people from diverse backgrounds 75
My manager ensures fair access to developmental opportunities for employees in my work group 72
My manager stands up for his/her staff when necessary 69
My manager encourages me to build capabilities and/or skills required for new job roles 69
My immediate supervisor is effective in managing people 66
My manager delegates work effectively 65
I receive adequate feedback on my performance to enable me to deliver required results 64
I receive support from my manager when I suggest new ideas 64
I received effective feedback from my manager 63
I was working to realistic performance expectations 60
My team had clear work plans and timetables 58
My manager draws the best out of his/her staff 57
My manager encouraged and managed innovation 55
I am satisfied with the recognition I receive for doing a good job 52
The people in my work group feel they are valued for their contribution 50
My manager appropriately deals with employees that perform poorly 39
Satisfaction with the Immediate Manager factor varied for some segments of the workforce, with younger employees, SES employees and employees in legal roles most satisfied with their immediate manager. The wide variation in employee satisfaction with the Immediate Manager factor for agencies with individual agency-specific results, 49% to 77%, suggests that some agencies have a problem which needs to be addressed. Given the important role immediate managers play in improving productivity, improving management capability in

agencies where employee perceptions are relatively low, may be one immediate step these agencies can take to improve their productivity.
Consistent with last year’s results, employees tend to rate their immediate manager as strong in areas related to their general behaviour and ethics, but not as strong when it comes to addressing issues that impact on work performance. Employees, for example, continue to report lower levels of satisfaction with the way their manager deals with poor performance, recognises good performance and makes people feel valued for their contribution (see Table 6.3). These more negative results are of concern given the importance of managers providing effective feedback in keeping employees productive. The Commission’s publication, Leading Productive People: A Manager’s Seven Steps to Success,15 outlines the three elements and seven steps of the employee life cycle that managers invariably take with staff. The three key elements of the cycle are: finding people; getting productive; and keeping productive. The guide provides practical advice for managers in the APS to enhance their people management skills, and in turn, build the productivity and effectiveness of their staff.
Enhancing performance
The broad framework for performance management in the APS is established by the Public Service Act 1999 (the Act) and the Public Service Commissioner’s Directions 1999 (the Commissioner’s Directions). Agencies, however, have flexibility within this framework to develop and implement performance management systems that meet their business needs and the needs of their staff.
At a minimum, the Commissioner’s Directions indicate that a fair and open performance management system should provide each employee with a clear statement of performance expectations and an opportunity to comment on these expectations. Most APS agencies continue to report that they have a formal, systematic process in place for managing employee performance, with 93% of agencies requiring all staff to have a formal performance agreement (Chapter 7 discusses the role of the APS Values (the Values) in the performance management process).
It is important also for agencies to build performance management cultures, where performance discussions are common practice in ongoing work behaviour. Research in the
USA suggests that agencies need to lay the groundwork for changing culture and involving employees in defining performance management and successful performance. This also involves managers taking a more comprehensive and forward-looking approach to enhancing employees’ job performance and not relying solely on annual evaluations.16
There is room for improvement in developing a more integrated performance management culture in the APS. Nine out of 10 employees indicated that they had received formal individual performance feedback in the last 12 months, but only six out of 10 employees reported that they receive adequate feedback on their performance to enable them to deliver required results.
Of the employees who reported that they had received formal performance feedback in the last 12 months, the majority (87%) indicated that their performance was assessed against a formal performance agreement or work plan as previously agreed on with their supervisor.

This means that seven out of 10 APS employees had their performance assessed against an agreed plan—this is similar to last year’s result.
Employees who had received formal feedback in the last 12 months were generally positive about the experience, although levels of satisfaction across all areas were down on those reported last year, for example:
66% agreed that the feedback session was conducted in a way that provided them with the assistance and/or guidance they needed (down from 68% last year)
62% agreed that their learning and development needs were adequately considered as part of the feedback discussion (down from 66% last year)
53% agreed that the performance review would help them improve their performance (down from 59% last year).
Most agencies have a suite of measures in place to support managers in implementing the agency’s performance management system. Almost 90% of agencies reported that they had three or more measures in place to support line managers, with the most common measures being advice from corporate area (99% of agencies), providing consistent guidelines and forms for establishing performance agreements (96%) and self-nominating training on the performance management system (82%). These results are generally consistent with those reported last year, although the use of self-nominating training increased slightly this year.
A large proportion of agencies (82%) also had two or more mechanisms in place to ensure that line managers are accountable for implementing the agency’s performance management system. Consistent with last year’s results, the most common approaches taken by agencies were including mechanisms in senior managers’ and line managers’ performance agreements (73% and 60% respectively). Forty-two percent of agencies tested compliance in their staff survey and 49% used other mechanisms (e.g. central monitoring that agreements are complete, internal audits and compliance monitored by SES and/or agency’s Executive).
Employee perceptions of performance management are somewhat at odds with agencies’ strong focus on performance management in the last 12 months. It may be, however, that despite agencies having measures in place to assist managers implement the performance management system, they are not being targeted and promoted to managers in need of most assistance. Employees stepping into management roles for the first time or managing in the APS environment for the first time, and longer-term managers who have not moved with the times to modern management practices in the APS may benefit most from targeted development in providing performance feedback.
Addressing underperformance
An important aspect of managing for improved performance is effectively addressing underperformance issues. Previous State of the Service reports have highlighted that this is an area where there is room for improvement.
It is disappointing that employees continue to report much less positive views about the handling of underperformance. One in four employees did not think that their manager deals appropriately with employees who perform poorly—this is up from one in five employees in 2006–07. Over one-third (37%) of employees did not think that their agency deals with underperformance effectively (a similar result to last year’s). Nevertheless, the variation in
disagreement levels between employees in agencies with individual agency- specific results (10% to 36% for their manager dealing appropriately with underperformance and 14% to 51% for agency performance in this area) suggests that it is possible for agencies to improve employees’ perceptions of how underperformance is handled. These results also suggest that those agencies recording relatively high levels of disagreement have a substantial problem that they need to address.
Nevertheless, the continued poor results at an aggregate level are of concern, especially given that preventing and/or effectively managing underperformance are ways that the APS can increase its productivity. An underperformance issue that is not addressed can have a negative impact on productivity across the work group. Managers have an important balance to achieve in maintaining confidentiality and addressing underperformance issues and keeping other team members motivated—this can be especially difficult in the absence of sufficient guidance and/or support from HR areas. The Commission’s guide, Sharpening the Focus: Managing Performance in the APS,17 is designed to assist managers and agencies improve performance. It also provides guidance on handling underperformance.
Leave managementOne of the key influences on enhancing the productive capacity of an agency is the effective management of leave. If not managed well at both a strategic and operational level, agencies can potentially reduce their productivity and their ability to deliver business outcomes. They are also at risk of being exposed to the increased costs associated with employment and accruing leave entitlements.
Reducing workplace absence (or unscheduled leave) can be one of the most effective ways that agencies can improve their productivity. Just as high levels of turnover and workplace injuries can sometimes be indicators of broader workplace problems, so too can high levels of workplace absence. Studies of unscheduled absence have found that for organisations with high levels of workplace absence, up to half may be avoidable.18 Agencies should be regularly monitoring and analysing workplace absences to identify potential problems.
Similarly, the effective management of annual leave can have a direct impact on improving the productivity and well-being of individual employees, as well as reducing the costs associated with agency leave liabilities. Given that the liabilities for employee leave and other entitlements for Australian Government entities at 30 June 2004 was approximately $6 billion and growing,19 agencies need to consider this as an area of priority.
The following section examines two areas of leave management—workplace absence or unscheduled leave and the management of annual leave.
Workplace absence
In response to growing concerns about the levels of workplace absence in the APS and the lack of a common definition, the Commission in consultation with a range of agencies developed the following definition for the purpose of APS-wide benchmarking and reporting through the State of the Service report:

Workplace absence refers to absence from work in recognition of circumstances that can generally arise irregularly or unexpectedly, making it difficult to plan, approve or budget for in advance, and which is inclusive of planned medical procedures.20
As part of the definition, workplace absence was also divided into five categories: sick leave; carer’s leave; compensation; specific types of miscellaneous leave; and unauthorised leave. This is the second year that this definition has been used by the Commission to collect information about unscheduled absence across the APS.
Despite the use of a common definition to monitor absence across the APS, the diversity and nature of APS work and the workforces of agencies means that no optimum or standard level of acceptable workplace absence is applicable APS-wide.
Measuring levels of absence
In an attempt to maximise data comparability across the APS, agencies were asked to provide data on an FTE basis if possible, although agencies who were unable to extract FTE counts from their Human Resources Information System (HRIS) were still able to report using the ‘headcount’ measure. Of the 90 agencies in the agency survey, 21 provided data on a ‘headcount’ basis.
Agencies were also asked, where data was available, to provide the number of absence days for each of the five workplace absence categories as defined below:
Sick leave—an absence, regardless of duration, whether paid or unpaid, resulting from an employee being too sick or injured to work, or to undergo a planned medical procedure. This category excludes absences related to accepted compensation cases.
Carer’s leave—an absence, regardless of duration, whether paid or unpaid, resulting from a member of the employee’s immediate family or household, for which the employee has caring responsibilities, being sick or injured and in need of care.
Compensation—an absence resulting from personal injury or disease sustained out of, or in the course of, employment (i.e. work-related) and accepted by Comcare. The leave includes the total number of days or part-days an employee is absent from work due to incapacity. It excludes time spent at work on rehabilitation programmes, where rehabilitation takes place at the workplace in paid employment.
Specific types of miscellaneous leave—an absence, regardless of duration, whether paid or unpaid, resulting from a personal, family or household emergency, or loss of a close family member or friend.
Unauthorised leave—an absence, regardless of duration, whether paid or unpaid, that given the circumstances is not supported or approved by management.
Where an agency’s HRIS did not allow reporting against each of the categories separately, it was asked to provide a total only—seven agencies indicated this to be the case.
Levels of absence
Aggregate rates of unscheduled absence in the APS continue to be at undesirable levels and rising. The median APS-wide absence rate this year was 10.1 days per employee, which is just over a half day more than the 9.4 days per employee reported in 2006–07. These

aggregate results, however, hide the wide variation in agencies’ levels of unscheduled absence, which ranged from 2.9 days per employee to 16.2 days per employee (see Table 6.4).
Table 6.4: level of workplace absence(a) by agency, 2007–08
Absence per employee
FTE or Headcount Agencies
(a) When the ratio of days of absence per employee is calculated using the FTE measure in an agency where some employees are working part-time, the ratio is higher than one that is calculated using the headcount measure. In most APS agencies this is likely to have a marginal effect but users need to be cautious in making direct comparisons between agencies.
Source: Agency survey
0.0 to 5.9 daysFTE AOFM, ASADA, BoM, DCC, AFPCS, FFMA, GBRMPA,
HREOC
Headcount Geoscience Australia, NOPSA, PSR
6.0 to 7.9 daysFTE
ANAO, AusAID, Cancer Australia, DEWHA, FSANZ, NCA, Productivity Commission, PM&C, Workplace Ombudsman
Headcount AIFS, ANMM, Austrade, Federal Court, ABCC, ONA
8.0 to 9.9 daysFTE ACCC, AUSTRAC, AWM, CDPP, CRS Australia, DBCDE,
Finance, NMA, Privacy Commissioner, RET
Headcount AIHW, CrimTrac, DFAT, FMC, NBA,NNTT
10.0 to 11.9 days
FTEACC, ACIAR, AGD, AEC, AIR, the Commission, APVMA, ARC, ARPANSA, ASIC, Comcare, Customs, Defence, DHA, DIISR, ITSA, Ombudsman, OPC, Treasury
Headcount CGC, DEEWR, DHS, Infrastructure
12.0 to 13.9 days
FTEAAT, ABS, ACMA, AHL, Centrelink, ComSuper, CSA, DAFF, FaHCSIA, IP Australia, Medicare Australia, NAA, NHMRC, NLA, MRT/RRT
Headcount TSRA, Workplace Authority
14.0 to 17.0 days FTE AIATSIS, ATO, DIAC, DVA, Family Court, Health, RAM,
SSAT
The rise in overall levels of absence in 2007–08 appears to be driven mainly by increases in rates of sick leave. This year the median sick leave rate was 7.7 days per employee, an increase on the previous year of 7.3 days.
Sick leave continues to be the most common type of unscheduled leave used by employees. Where agencies could break down their total absence by absence type, over three-quarters (77%) was taken as sick leave. The next most common absence type was carer’s leave (12%) followed by compensation leave (6%) and specific types of miscellaneous leave (4%). Unauthorised absence made up less than one per cent of all unscheduled absence.

Although sick and carer’s leave make up almost 90% of all absence, it must be remembered that a certain level of workplace absence is an unavoidable element of working life. Supporting employees with genuine illness and caring responsibilities underpins the APS as a model employer that promotes family-friendly and flexible working arrangements.
Levels of absence also continue to vary by agency size; however, in 2007–08 there was not a uniform increase in absence rates across the three agency size bands. Consistent with last year’s results, small agencies generally report lower levels of absence than medium and large agencies. In 2007–08, rates of absence increased in small (from a median of 7.2 days per employee in 2006–07 to 8.3 days per employee this year) and large (from a median of 11.0 days per employee in 2006–07 to 11.9 days per employee this year) agencies. In contrast, absence levels in medium agencies were down slightly this year compared to last year (medians of 9.4 days per employee and 9.8 days per employee respectively).
Some agencies have been successful at sustaining lower rates of workplace absence and, as reported last year, this seems to be a result of strong employee job interest and alignment to their work. There appears to be a strong relationship between creating a culture where employees are engaged and committed to the organisation and its leadership and reduced levels of absence. The results from the employee and agency surveys (see Table 6.5) show that employees who have more positive views on aspects of employee engagement are less likely to be working in an agency with a high level of unscheduled absence, for example, 67% of employees who were dissatisfied with the Current Job factor were working in an agency with a high level of unscheduled absence.
Table 6.5: views on selected employee engagement attributes and level of unscheduled absence in agency, 2007–08
Factor/index(a)% working in agency with high levels of unscheduled
absence (i.e. 12 or more days)
% working in agency with average or low levels of
unscheduled absence (i.e. less than 12 days)
Agree/ satisfied
with factor/ index
Disagree/ dissatisfied with
factor/ index
Agree/ satisfied with factor/ index
Disagree/ dissatisfied with
factor/ index
Current Job factor 59 67 41 33
Merit and Career Progression factor 57 66 43 34
Innovation Culture factor 56 64 44 36
Loyalty/commitment to agency index 57 67 43 33
Loyalty/commitment to APS index 60 69 40 31
(a) Full details of the factor analysis and indices, including details of methodology and questions used, are set out in Appendix 3.

Table 6.5: views on selected employee engagement attributes and level of unscheduled absence in agency, 2007–08
Factor/index(a)% working in agency with high levels of unscheduled
absence (i.e. 12 or more days)
% working in agency with average or low levels of
unscheduled absence (i.e. less than 12 days)
Source: Employee and agency surveys
Comparisons with other jurisdictions
Workplace absence rates are often one of the key HR indicators used to benchmark people management performance across agencies, industry sectors and internationally. Nevertheless, care should be taken in making such comparisons given that overall results can be influenced by several issues, including variations in definition, leave provisions, reporting periods and monitoring and recording practices.
Comparisons of absence levels with international and other Australian public sector jurisdictions are limited because of differences in definitions of absence type. Where comparable data are available, however, rates of absence due to sick leave in the APS are on par with those in other public sector jurisdictions (see Table 6.6).
Table 6.6: sick leave levels for selected jurisdictions, 2006–07 and 2007–08
Public sector jurisdiction Annual sick leave rate per employee
(a) Data for Inland Revenue, a department accounting for around a fifth of all staff covered, was not available and not included in this rate. Calculations based on previous years’ suggest that the 2006–07 rate is an underestimate of the true rate.
(b) Based on full-time permanent employees.
Source: Red Scientific Limited 2007, Analysis of Sickness Absence in the Civil Service, FY2006–07, Report Version 1.0, <http://www.civilservice.gov.uk>; State Services Commission 2007, Human Resource Capability Survey of Public Service Departments, as at 30 June 2007, <http://www.ssc.govt.nz>; Department of the Premier and Cabinet 2007, The South Australian Public Sector Workforce Information—June 2007: Summary Report, <http://www.premcab.sa.gov.au>; Department of the Premier and Cabinet 2007, Profile of the Western Australian State Government Workforce, June 2007, <http://www.dpc.wa.gov.au>; Agency survey
UK Civil Service, 2006–07 9.3 days(a)
NZ Public Service, 2006–07 6.5 days of sick and domestic leave(b)
SA, 2006–07 8.2 days per FTE
WA, 2006–07 54 hours per FTE (approx. 7.2 days)
APS, 2007–08 7.7 days

Fostering an attendance culture
Fostering an attendance culture where employees are engaged with the organisation and its business has been shown to result directly in reduced levels of absence. While absence management strategies should emphasise the prevention of avoidable absence, they should also provide support to those who are unavoidably absent such as employees who are ill or returning to work after a long period of absence.
A clear, fair and well-communicated policy supported by senior and line management is one of the most effective strategies for addressing workplace absence. All except two small agencies were using strategies to manage workplace absence in 2007–08, with most (87%) using at least four strategies—in general, the larger the agency, the more strategies they used.
The most common strategies used by agencies were raising awareness of health and safety issues, healthy lifestyle promotion and other prevention mechanisms (97%), and providing flexible working arrangements to enable employees to manage work-life balance (94%) (see Table 6.7).
Table 6.7: strategies used to manage workplace absence by agency size, 2007–08
Strategy to manage workplace absence Agency size
Source: Agency survey
Small (%)
Medium (%)
Large (%)
Total agencies
(%)
Raise awareness of health and safety issues, healthy lifestyle promotion and other prevention mechanisms (e.g. flu vaccinations)
92 100 100 97
Provide flexible working arrangements so that employees can manage work-life balance 87 96 100 94
Establish and/or communicate attendance expectations (e.g. specific policies, procedures and/or people management practices)
61 79 88 73
A reporting framework to assist management to monitor absences, identify patterns and trends and highlight areas for further investigation
55 71 96 71
Initiatives to build a positive workplace culture that encourages employees to want to come to work
45 64 71 59
Provide support and training to line managers to build their confidence and capability in managing workplace absence
47 61 67 57
Workplace absence included as a regular agenda item at senior management meetings 21 46 83 46

Given the widespread adoption of strategies to foster attendance by agencies, it is of concern that levels of unscheduled absence are still increasing. Some of this could, however, be a result of increased workplace pressures and demands on employees.
Agencies should examine whether individual managers within the organisation have the appropriate skills, and whether they are taking responsibility for absence management. Part of the approach in ensuring managers take responsibility for fostering an attendance culture, and in turn reducing levels of unscheduled absence, could be to include this as a key management outcome in performance agreements.
It is also important that agencies continue to monitor absence trends, as it is only by doing this that agencies will be able to understand and develop strategies to address the underlying issues impacting on work attendance. The Commission has developed a better practice guide, Fostering an Attendance Culture: A Guide for APS Agencies21 to assist agencies to identify workplace absences and their possible causes, and improve their capacity to address problems through the implementation of better practice strategies. As discussed above, managers play a pivotal role in managing absence and it is critical that they have the appropriate training, support and advice to enable them to do so effectively. To assist line managers, the Commission has also released a companion guide, Turned Up and Tuned In—A Manager’s Guide to Maximising Staff Attendance.22
Presenteeism
An issue related to unscheduled absence and fostering an attendance culture is presenteeism. Presenteeism is a term used to describe the loss of productivity that occurs when employees come to work, but are not fully functioning because of illness, injury, or lack of motivation. When compared to absenteeism, presenteeism is considerably less visible in the workplace and harder to monitor. It is estimated that on average six working days of productivity are lost for each employee annually as a result of presenteeism. This is nearly four times the estimated cost of absenteeism.23 The causes range from health-related issues to a lack of work-life balance and job-related stress. Minimising the impact of presenteeism is yet another reason for APS agencies to remain focused on performing well in the area of work-life balance. Agencies also need to be careful that in their efforts to reduce levels of workplace absence, they do not create inflexible workplace practices that encourage presenteeism.
Management of annual leave
Annual leave is a benefit that entitles employees to a paid break from their work each year. One of the reasons for annual leave is to allow employees to refresh and recharge in order to remain fully productive. If agencies make it difficult for employees to take annual leave, they run the risk of inadvertently encouraging employees to access other types of leave, thereby increasing rates of unscheduled absence. The 2006 ANAO report, The Management and Processing of Leave,24 identified a need for agencies to establish appropriate arrangements in relation to the management of annual leave and effective internal controls over leave processing. The report recommended that agencies adopt certain practices to capture, process, review and monitor staff attendance and their leave entitlements. In light of the earlier discussion in this chapter where the impact of the recent additional 2% efficiency dividend has meant that employees in a number of agencies have been unable to take leave due to high workloads, it is timely to examine the recommendations of the ANAO report and the extent to which agencies have implemented them.

Most agencies appear to be using a series of strategies, consistent with the recommendations in the ANAO report to manage employees’ levels of annual leave. All except two small agencies reported that they had at least one measure in place to manage annual leave, with around 80% of agencies having at least four measures in place. All medium and large agencies had at least four measures in place, as did around two-thirds of small agencies. The most popular measures used were: leave arrangements as outlined in the agency’s collective agreement (CA) are fully implemented; agency’s CA outlines a threshold where an employee can be directed to take annual leave or is deemed on leave; excess leave balances are monitored on a regular basis and appropriate follow-up action is taken when required; and line managers are provided with information to assist in the proactive management of annual leave (see Table 6.8).
Table 6.8: actions taken by agencies to manage employees’ levels of annual leave by agency size, 2007–08
Action to manage employees’ level of annual leaveNumber of agencies (N=90)
Yes
Being developed No Not
applicable
(a) Includes one agency that did not provide a response.
(b) Includes two agencies that did not provide a response.
Source: Agency survey
Excess leave balances are monitored on a regular basis and appropriate follow-up action is taken when required 80 5 5 0
Leave arrangements as outlined in the agency’s collective agreement are fully implemented 79 1 1 9
Line managers are provided with information to assist in the proactive management of annual leave 78 6 5 1
Agency’s collective agreement outlines a threshold where an employee can be directed to take annual leave or is deemed on leave (e.g. 60 days)
72 1 8 9
Control measures to manage unactioned leave applications in Employee Self-Service system 63 7 11 9
Risks associated with the management and processing of leave are included in relevant fraud control plans 56 9 22 3(a)
Excessive leave balances and leave liabilities included as a regular agenda item at senior management meetings 43 8 36 3(a)
Agency’s collective agreement outlines a threshold where an employee cannot be denied leave (e.g. 40 days)
11 1 67 11
Risks associated with the management and processing of leave are included in relevant risk management plans 42 13 30 5(b)
Key chapter findings

The APS has continued to achieve significant improvements in productivity which compare favourably with those in the private sector. In achieving greater efficiency and effectiveness APS agencies have relied on a range of approaches, for example, enhancing ICT capacity, using productivity-based workplace agreements and investing in employees’ learning and development. Employees also continue to report high levels of productivity improvement, with the most important drivers being good working relationships, working to realistic performance expectations and access to the information, resources and/or technology needed to do the job.
The use of an annual efficiency dividend and partial supplementation for wage increases was an integral part of shifting an APS culture to one that focused on efficiency and effectiveness. However, it may be time to consider whether uniform across the board approaches are impacting adversely on smaller agencies and resulting in undesirable output impacts as well as poor investment choices for the future. It seems timely that the existing funding arrangements be reviewed, and any recommendations made by the JCPAA in relation to smaller agencies will be a welcome development.
As a starting point, some possible options to alleviate the adverse consequences of the efficiency dividend for categories of agencies (e.g. agencies whose functions are largely statutory) or small agencies include:
selective releases from the efficiency dividend or applying a lower rate of efficiency dividend
exempting from the efficiency dividend fixed budget components, or supplementing the full cost of rent increases and ICT escalations
undertaking a regular five-yearly review of an agency’s funding to ensure it is viable and able to perform its core functions on an ongoing basis—the current approach is designed so that a small agency with no new policy additions—no matter how efficient—will eventually be unable to meet normal increases in running costs and will require assistance from the Government to continue to operate
full wage indexation adjustment, rather than a discounted adjustment, so that at least salary increases are matched and the distributed agency bargaining system remains sustainable.
Nevertheless, in an increasingly tight fiscal context, it is critical for the APS to continue to focus on ways to achieve further productivity gains. There are clearly some areas where more savings can be made, for example, through greater use of whole of government contracting arrangements, and a continued strong emphasis on improving all aspects of an agency’s operations.
Managing excessive workloads is an issue that has intensified for many agencies in the last 12 months. An important part of managing excessive workloads is identifying ‘hot spots’ in the organisation or areas most at risk. A full appreciation of workforce pressures across the agency is essential in developing flexible strategies to assist employees and managers deal with excessive workloads. At this stage it appears that agencies are taking a sensible approach to managing excessive workloads, although employee perceptions about satisfying work-life balance are lower than those reported last year. Nevertheless, employee satisfaction with work-life balance continues to be an area of strength for the APS, and agencies need to ensure that they continue to provide flexible working practices that uphold the reputation of the APS as an employer which assists employees achieve a good work-life balance.

An employee’s immediate manager is one of the key drivers of productivity improvement, and many employees continue to be satisfied with their manager’s performance. There are also positive signs in the area of performance management, although the APS does not appear to have yet developed an integrated performance management culture. Although most employees are receiving formal individual feedback, fewer believed that they receive adequate feedback on their performance to enable them to deliver the required results.
Addressing underperformance is an integral part of an integrated performance management culture, yet this is an area where many agencies continue to struggle. The wide variation in agency results from the employee survey suggest that this is not an impossible issue to address and that agencies can take steps to improve employee perceptions in this area.
Of particular concern is the rising level of unscheduled absence across the APS. Although a certain level of workplace absence is a normal feature of a healthy workplace, managers must take responsibility and be held accountable for fostering an attendance culture. It is important that managers and agencies monitor and understand absence trends, especially at a time when many agencies are experiencing excessive workloads. A high level of unscheduled absence in an area can be an early warning sign that the area does not have the resources to cope with the current workload; likewise, it might suggest that broader management issues need to be addressed in the area. Effective management is the most cost-effective way agencies can reduce unscheduled absence, especially when good managers can create and foster a culture where employees are committed to the organisation and its leadership. This in turn will enhance the productive capacity of the APS.
1 The measure of APS wage increases used is the average annual wage increases from 1999–2000 to 2007–08 (the latest data available) in collective agency agreements as measured from the nominal expiry date of the previous agreement to the nominal expiry date of the current agreement.
2 For more information on the application of the efficiency dividend, see Finance’s submission to the JCPAA’s inquiry into the effects of the ongoing efficiency dividend on smaller public sector agencies, and the transcript of Finance’s appearance before the JCPAA.
3 Average calculated using data from ABS, Australian System of National Accounts, 2007–08, Cat. No. 5204.0, ABS, Canberra, <http://www.abs.gov.au>
4 In their submissions to the JCPAA inquiry, Finance indicated that there are mechanisms available to agencies to seek a review of their funding arrangements. If meeting the costs of the efficiency dividend, for example, requires consideration of reducing service levels to clients, such considerations can be brought to the attention of the relevant Minister, who can agree to bring it to the Finance Minister, with the aim of seeking additional funding as a new policy proposal.
5 The Workplace Authority was not subject to the additional dividend due to a significant general budget reduction.
6 Hon. Lindsay Tanner MP, ‘Address to the CEDA 2008 State of the Nation Conference’, Canberra, 5 June 2008, p. 3, <http://www.financeminister.gov.au>

7 Hon. Lindsay Tanner MP, ‘Address to the CEDA 2008 State of the Nation Conference’, Canberra, 5 June 2008, p. 5, <http://www.financeminister.gov.au>
8 Sir Peter Gershon, Review of the Australian Government’s Use of Information and Communication Technology (October 2008), <http://www.finance.gov.au>
9 Some results may be affected by flex-time arrangements, which are used in many agencies to assist APS 1–6 employees balance work and life commitments.
10 Two per cent of full-time employees indicated that the question was not applicable (e.g. because they were on a graduated return to work programme or they were on leave for the whole fortnight).
11 This is likely, at least in part, due to flex-time arrangements, which are used in many agencies to assist APS 1–6 employees balance work and life commitments.
12 KPMG International 2007, Performance Agenda: An International Government Survey—Focusing Public Sector Performance, pp. 4–5, <http://www.kpmg.com>
13 UK House of Commons Public Administration Select Committee, Skills for Government: Volume 1, 6 August 2007, pp. 13–14; Skills for Government: Government Response, 21 November 2007, p. 3, <http://www.parliament.uk/pasc>
14 Full details of the factor analysis, including details of the methodology and questions used, are set out in Appendix 3.
15 Australian Public Service Commission 2007, Leading Productive People: A Manager’s Seven Steps to Success, Commonwealth of Australia, Canberra, <http://www.apsc.gov.au>
16 H. Risher & C. Fay 2007, Managing for Better Performance: Enhancing Federal Performance Management Practices, IBM Center for The Business of Government, Washington, D.C., p. 3, <http://www.businessofgovernment.org>
17 Australian Public Service Commission 2006, Sharpening the Focus: Managing Performance in the APS, Commonwealth of Australia, Canberra, <http://www.apsc.gov.au>
18 ANAO 2003, Absence Management in the Australian Public Service, Performance Audit Report No. 52, 2002–03, Commonwealth of Australia, Canberra, <http://www.anao.gov.au>
19 ANAO 2006, The Management and Processing of Leave, Performance Audit Report No. 16, 2005–06, Commonwealth of Australia, Canberra, <http://www.anao.gov.au>
20 Australian Public Service Commission 2006, Fostering an Attendance Culture: A Guide for APS Agencies, p .8, <http://www.apsc.gov.au>
21 Australian Public Service Commission 2006, Fostering an Attendance Culture: A Guide for APS Agencies, Commonwealth of Australia, Canberra <http://www.apsc.gov.au>
22 Australian Public Service Commission 2006, Turned Up and Tuned In—A Manager’s Guide to Maximising Staff Attendance, Commonwealth of Australia, Canberra, <http://www.apsc.gov.au>
23 Medibank Private 2007, Sick at Work—The Cost of Presenteeism to Your Business, Employees and the Economy, <http://www.medibank.com.au>
24 ANAO 2006, The Management and Processing of Leave, Performance Audit Report No. 16, 2005–06, Commonwealth of Australia, Canberra, <http://www.anao.gov.au>

Chapter 7: Ethics and integrityThe APS Values (the Values), together with the Code of Conduct (the Code) provide the ethical framework that underpins the operation of the Australian Public Service (APS) and its relationships with governments and the Australian community, as well as workplace relationships. They establish a high benchmark for the professional and personal behaviour of APS employees. Each agency must integrate the Values and the Code into its operations so that they are embodied in daily decision-making and behaviour.
In addition to guiding personal behaviour and underpinning organisational performance, elements of the Values and the Code also reflect the role of the APS in Australia’s democratic system of government—as an institution that is responsive to the elected government, apolitical and impartial and one which provides the same high standard of policy advice, implementation and professional support, irrespective of which political party is in power.
A public service that impartially serves and advises the government of the day is a feature of the Westminster tradition, upon which Australia’s parliamentary system is based. In April 2008, in an address to heads of agencies and the SES, the Prime Minister, Hon. Kevin Rudd MP, outlined the seven elements of his Government’s vision for the future APS,1 a key element of which was ‘reinvigorating the Westminster tradition of an independent public service’. In support of this aim, the Government had already introduced a standard merit-based process for selecting most APS agency heads and statutory office holders, revised Secretaries’ remuneration arrangements, and indicated that public servants must provide ‘timely, well argued, robust and forward looking policy advice’ frankly and without fear of retribution.
The Prime Minister also stated that the Government’s agenda included ‘rebuilding a culture of accountability across all levels of government’, beginning with the introduction of Standards of Ministerial Ethics (December 2007), the Register of Lobbyists (May 2008), and the Lobbying Code of Conduct (May 2008). Mr Rudd also foreshadowed the Government’s intention to introduce a Code of Conduct for Ministerial Staff, which came into effect on 1 July 2008. In addition, the Prime Minister committed the Government to ‘enhancing the culture of transparency in government through reforms to Freedom of Information laws’.
It is also noteworthy that the Government has appointed a Cabinet Minister with responsibility for public sector integrity issues. As the Minister pointed out:
… for the first time, many integrity and governance functions are brought together under a single Minister—FOI, public service administration, privacy, codes of conduct, the register for lobbyists, transparency, accountability, electoral law, the guidelines and administration of tax-payer funded entitlements, government advertising and the National Archives.2
These initiatives provide a sound framework that will assist agencies in their continuing efforts to embed the Values and the Code in their cultures and structures. There may also be additional benefits in terms of efficiency and effectiveness. Research conducted by the NSW Independent Commission Against Corruption (ICAC) found that strong, clearly-stated values could guide people through choices, so that making ethical decisions was the path of least resistance. The research also found that the ethical tone of an organisation impacts on

efficiency and effectiveness, decision-making processes, employee commitment and job satisfaction, employee stress and employee turnover. On the basis of these findings it was argued that making ethical practices a priority was not just about functioning with integrity or being credible; it was also about optimising the efficient functioning of an organisation. Organisations that perform well are generally characterised by high ethical standards, both externally in their dealings with stakeholders and the community, and internally, in relationships between agency employees.3
In exploring issues of ethics and integrity, this chapter draws on both employee perceptions and agency practices in discussing the extent to which agencies have embedded the Values and the Code in their everyday operations. Issues covered include the application of the Code, harassment and bullying findings, and APS employees’ perceptions of merit and fairness in employment decisions.
Embedding the APS Values and the Code of ConductThe Values are set out in s.10(1) of the Public Service Act 1999 (the Act) and the Code in s.13. agency heads must uphold and promote the Values (s.12) and are bound by the Code (s.14). The Act also places an obligation on SES employees to promote the Values and compliance with the Code through personal example and other appropriate means. APS employees are required to uphold the Values and are bound by the Code.
Awareness of and commitment to the Values
The large differences in the ethical frameworks required in the public sector and those in other sectors makes it essential for public service agencies to have effective induction programmes in place. The use of a range of learning and development programmes by agencies to promote the Values and the Code to new employees shows continuing commitment to integrating the Values into agency cultures. The Commission has provided links to the APS Induction Programme kit modules on its website,4 and agencies are able to download and install the modules on their intranets. The programme provides new starters with greater contextual information about the wider APS, including the Values and the Code. This has become increasingly important with more than a quarter of non-entry level APS vacancies being filled from outside the APS in recent years (29.2% in 2007–08).
Figure 7.1 shows that agencies used a range of induction programmes in 2007–08 for new employees that focused, among other issues, on the APS Values. Agency-specific programmes were the most popular type of induction programme, with 61% of agencies reporting their use by all new agency employees.

Figure 7.1: Agency use of induction programmes, 2007–08
Source: Agency survey
Results relating to employee perceptions of ethics and integrity remained high in 2007–08. Seventy-seven per cent of employees agreed that their manager demonstrates honesty and integrity. Eighty per cent of employees agreed that people in their work group treat each other with respect and 74% of employees agreed that people in their work group are honest, open and transparent in their dealings. Seventy-one per cent of employees agreed that their agency operates with a high level of integrity.5
Employees’ views of ethical behaviour in the APS are generally consistent with those in WA and Tasmania. Eighty-four per cent of APS employees agreed that their organisation actively encourages ethical behaviour by all of its employees. This has remained stable since last year. This compares to 83% agreeing in Tasmania and 81% in WA. The proportion of APS employees agreeing that senior managers in their organisations lead by example in ethical behaviour (57%) is similar to that in Tasmania (58%) but lower than that in WA (70%).6
The Values and performance management
The incorporation of the Values into an agency’s performance management arrangements is critical to embedding the Values into an agency’s culture. Eighty-six per cent of agencies now require that an assessment be made about the extent to which employees demonstrate and consistently apply some or all of the Values and/or agency-specific ‘values’ and behaviours when considering individual performance—slightly down from 88% last year but up from 61% in 2002–03.
Table 7.1 sets out the types of measures used by agencies to ensure employees are assessed on how they demonstrate and consistently apply the Values. The most common measure is an assessment of APS values and/or behaviours as well as results in individual performance assessments.

Table 7.1: Measures used by agencies in performance assessments to ensure employees demonstrate and consistently apply the Values, 2002–03 to 2007–08
An assessment of values/ behaviours as well as
results in performance assessments
Regular multi-source feedback
Training of all staff on how values/behaviours
relate to effective performance
Yes (% of agencies)
Being developed (% of agencies)
Yes (% of agencies)
Being developed
(% of agencies)
Yes (% of agencies)
Being developed (% of agencies)
Source: Agency survey
2002–03 61 15 22 16 27 17
2003–04 78 7 22 16 36 10
2004–05 77 9 27 13 35 18
2005–06 81 8 19 12 46 20
2006–07 83 10 22 15 53 14
2007–08 83 12 27 10 51 21
Agencies can use more than one approach to how they incorporate the Values into performance assessments. Most agencies (72%) reported assessing their employees against all the Values as a set. Performance assessment against agency-specific values was also common (53%). A smaller proportion of agencies (20%) assessed employees against the Values most relevant to the duties being performed. Twenty-five per cent of agencies used other behavioural indicators.
Operation of the Code of ConductThe standards of behaviour required of APS employees are set out in the Code of Conduct. An employee whose conduct does not meet the standard of one or more elements of the Code can be found to have breached the Code.
Reporting suspected breaches of the Code
Agencies need to be proactive in addressing suspected breaches of the Code. This can be achieved by providing and promoting mechanisms for the reporting of suspected misconduct by the public and APS employees. Internal reporting of suspected misconduct is vital to the integrity of the APS.

Raising the awareness of employees about how they can report suspected misconduct is one way of contributing to a culture where integrity is recognised and valued. Table 7.2 shows the range of mechanisms agencies have used to promote awareness among employees about how they can report suspected misconduct.
Table 7.2: Agency use of mechanisms to promote awareness among employees about how they can report suspected misconduct (including harassment and bullying) during 2007–08
Activities Agencies using measure %
Agencies developing measure %
Source: Agency survey
Online training/ information on intranet 83 8
Awareness raising as part of induction/ orientation 91 6
Sessions on how the Values and Code should operate in practice 73 8
Use of promotional material (e.g. pamphlets or posters) 66 4
Other 44 2
Awareness-raising as part of induction and/or orientation, online training and/or information on the intranet, and sessions on how the Values and Code should operate in practice are the three most common methods of promoting awareness among employees. Promotional material such as pamphlets or posters was also used by a substantial proportion of agencies.
Table 7.3 shows the range of measures agencies use to identify suspected breaches of the Code. Conduct identified by colleagues accounted for 38% of investigations in 2007–08, compared with 21% last year. The growth is due to a considerable increase in the number of investigations in one large agency. For APS employees, reporting what they consider to be breaches of the Code is an obligation—not just an option. As noted last year, there is potential for agencies to put further effort into promoting employees’ responsibility to report misconduct and into creating a culture where employees who report misconduct feel protected.
Table 7.3: Measures accounting for Code of Conduct investigations, 2006–07 and 2007–08
Measure % of investigations 2006–07
% of investigations 2007–08
Source: Agency survey
Conduct identified by colleague 21 38
Conduct identified by supervisors and/or managers 23 24
Conduct identified by an agency’s compliance or monitoring system 39 23
Complaints initiated by members of the 10 9

Table 7.3: Measures accounting for Code of Conduct investigations, 2006–07 and 2007–08
Measure % of investigations 2006–07
% of investigations 2007–08
public or stakeholders
Other sources 4 5
Managing suspected breaches of the Code of Conduct
The way in which suspected breaches of the Code are managed can have a powerful influence on perceptions of integrity and fairness within the APS. Under s.15(3) of the Act, agency heads must establish procedures for determining if an APS employee has breached the Code, including having due regard to procedural fairness. A sanction for misconduct can be imposed only where there has been a determination of a breach of the Code made in accordance with these procedures.
Levels of investigation
This year, 1,019 employees were subject to finalised investigations by agencies into suspected breaches of the Code of Conduct (compared to 945 in 2006–07 and 1,491 in 2005–06). Sixty-six per cent of employees (669) who were investigated were found to have breached the Code—a decline from 70% last year and 76% in 2005–06.
There continues to be a large variation between agencies in the proportion of employees subject to investigations into suspected breaches of the Code. Four large agencies accounted for 69% of misconduct investigations in 2007–08. This year, of the large agencies, nine reported fewer than two investigations per 1,000 employees (ABS, AGD, the Australian Securities and Investments Commission (ASIC), ATO, CRS Australia, DFAT, DEWHA, FaHCSIA and IP Australia). Two large agencies reported more than 10 investigations per 1,000 employees (DIAC and DAFF), with DAFF reporting more than 47 investigations per 1,000 employees.7 All large agencies reported at least one investigation per 1,000 employees.
Previous evaluation work by the Commission suggests that a range of factors contribute to this variation, including the nature of work of different organisations and the fact that some agencies are quick to initiate formal investigations into reported breaches of the Code. Others do so only after some form of detailed preliminary investigation that indicates it is likely a formal determination will find the employee has breached the Code.
Nature of reported breaches
Table 7.4 shows the number of employees investigated for a breach of the Code, by the different elements of the Code. The element that was suspected of being breached by the highest number of employees was the same as last year’s, that is, s.13(11) of the Act—‘an APS employee must at all times behave in a way that upholds the APS Values and the integrity and good reputation of the APS’.

Table 7.4: Elements of the Code suspected of being breached in investigations finalised during 2007–08
Element of the Code
No. of employees investigated for a suspected breach
of this element (Number)
Percentage of cases where a breach was found (%)
No. of agencies with finalised investigations
(Number)
Note: Agencies were asked for data on employees who were the subject of formal investigations, and were specifically asked not to include data on initial investigations that did not proceed to formal misconduct procedures. However, it is possible that some agencies may have provided information on elements of the Code that were suspected of being breached in both formal and informal investigations.
Source: Agency survey
An employee must:
at all times behave in a way that upholds the APS Values and the integrity and good reputation of the APS (s.13(11))
639 67 33
behave honestly and with integrity in the course of APS employment (s.13(1))
536 52 33
use Commonwealth resources in a proper manner (s.13(8)) 417 74 29
comply with any lawful and reasonable direction given by someone in the employee’s agency who has authority to give the direction (s.13(5))
359 62 19
when acting in the course of APS employment, treat everyone with respect and courtesy, and without harassment (s.13(3))
231 59 39
when acting in the course of APS employment, comply with all applicable Australian laws (s.13(4))
229 64 14
act with care and diligence in the course of APS employment (s.13(2))
205 65 24
disclose, and take reasonable steps to avoid, any conflict of interest (real or apparent) in connection with APS employment (s.13(7))
139 53 15

Table 7.4: Elements of the Code suspected of being breached in investigations finalised during 2007–08
Element of the Code
No. of employees investigated for a suspected breach
of this element (Number)
Percentage of cases where a breach was found (%)
No. of agencies with finalised investigations
(Number)
not make improper use of: inside information, or the employee’s duties, status, power or authority; in order to gain, or seek to gain, a benefit or advantage for the employee or for any other person (s.13(10))
104 47 18
not provide false or misleading information in response to a request for information that is made for official purposes in connection with the employee’s APS employment (s.13(9))
39 64 11
while on duty overseas, at all times behave in a way that upholds the good reputation of Australia (s.13(12))
7 29 2
comply with any other conduct requirement that is prescribed by the regulations (s.13(13))
6 67 5
maintain appropriate confidentiality about dealings that the employee has with any Minister or Minister’s member of staff (s.13(6))
0 0 0
Agencies were asked to place the Code of Conduct investigations into categories of types of misconduct. Table 7.5 shows the number of employees investigated by types of misconduct. Improper use of internet/email is the most common area of misconduct investigations, with DAFF accounting for the majority of these investigations. There was also a substantial increase in the number of investigations for harassment and bullying since last year (from 76 employees to 118 employees).

Table 7.5: Number of employees by types of misconduct in investigations finalised during 2007–08
Type of misconduct
No. of employees(a) investigated for this type of misconduct
(Number)
Percentage of cases where a breach was found (%)
No. of agencies with finalised investigations
(Number)
(a) An individual employee may be counted against more than one type of misconduct.
Note: Agencies were asked for data on employees who were the subject of formal investigations, and were specifically asked not to include data on initial investigations that did not proceed to formal misconduct procedures. However, it is possible that some agencies may have provided information on elements of the Code that were suspected of being breached in both formal and informal investigations.
Source: Agency survey
Improper use of internet/ email 350 84 20
Inappropriate behaviour of employees (other than harassment or bullying) during working hours (e.g. treating clients or stakeholders disrespectfully)
163 61 28
Improper access to personal information (e.g. browsing) 150 70 9
Harassment and/or bullying 118 47 28
Fraud other than theft (e.g. identity fraud) 86 44 10
Improper use of position status (e.g. abuse of power, exceeding delegations)
74 20 11
Improper use of resources other than internet/ email (e.g. vehicles)
60 60 17
Conflict of interest 41 46 13
Private behaviour of employees (e.g. at social functions outside working hours)
30 53 15
Unauthorised disclosure of information (e.g. leaks) 25 40 8
Theft 16 31 6
Misuse of drugs or alcohol 1 100 1
Misconduct in areas where investigation of a suspected breach relies on physical evidence (e.g. computer records or actions identified through routine audit practices) rather than on

opinion or observation are more likely to result in a finding that the Code was breached, largely because the evidence is irrefutable. Previous evaluation work by the Commission suggests that different practices by agencies also influence the likelihood of a finding that the Code was breached. As noted above, some agencies delay commencing a formal investigation until a preliminary investigation has found grounds for proceeding further, whereas other agencies routinely commence formal investigations as soon as they are notified of a suspected breach.
Outcomes of finalised investigations
Agencies may impose a range of sanctions on an employee who is found to have breached the Code. Table 7.6 shows the outcomes of investigations into suspected breaches of the Code finalised in agencies in 2007–08.
Table 7.6: Outcomes of finalised investigations into suspected breaches of the Code, 2007–08
Outcome No. of employees affected(a)
No. of agencies that reported the outcome
(a) An employee may be counted against more than one outcome.
Note: Agencies were asked for data on employees who were the subject of formal investigations, and were specifically asked not to include data on initial investigations that did not proceed to formal misconduct procedures. However, it is possible that some agencies may have provided information on elements of the Code that were suspected of being breached in both formal and informal investigations.
Source: Agency survey
Deduction from salary by way of a fine 218 17
Reprimand 212 32
No breach found 184 25
Investigation discontinued because of resignation of employee under investigation 162 17
Employee counselled 111 18
Reduction in salary 93 14
Termination of employment 79 22
Reduction in classification 32 12
Breach found but no sanction imposed 28 12
Reassignment of duties 26 13
Other 22 11
The most common sanction applied to employees was a deduction from salary by way of a fine, followed by a reprimand; together these accounted for 54% of all sanctions.

High-impact sanctions, including reduction in salary, termination of employment or a reduction in classification, continue to be relatively less common; they accounted for 26% of all sanctions.
The use of termination of employment as a sanction was more heavily concentrated in DAFF (32%) and Defence (24%)—compared to last year when terminations were evenly spread across the three largest agencies (Centrelink, ATO and Defence).
The total number of sanctions imposed by large agencies continues to vary considerably, ranging from zero to 176. The imposition of high-impact sanctions was concentrated in three large agencies—Centrelink (28%), DAFF (24%) and Defence (15%). High-impact sanctions were not imposed in eight large agencies.
Previous evaluation work by the Commission has suggested that this variation reflects the nature of the work of different organisations, variations in approach to how suspected misconduct is dealt with (e.g. whether minor misconduct is dealt with through a formal investigation) and some agencies taking a strong line in relation to sanctions.
While agencies with differing responsibilities need some flexibility in the way they apply sanctions and given that sanctions can be reviewed and amended by the Merit Protection Commissioner, it is arguable that it is inconsistent with the Value that requires the APS to provide a fair workplace to have too great a discrepancy between sanctions for the same offence, particularly within agencies. Agencies may need better internal guidance from the Commission on how to apply sanctions more consistently, and it will be looking into this in 2009.
Assurance mechanisms
The integrity of the processes in place for handling suspected breaches of the Code is a fundamental part of effective governance.
The Commission’s good practice guide, Handling Misconduct,8 suggests a large number of quality assurance mechanisms. These include:
ensuring that the decision maker responsible for determining whether a breach has occurred is equipped with the necessary skills, experience and resources to do so
following a final checking process prior to a final determination being made ensuring that only a small number of employees in the agency have the delegation to
determine a sanction making available to all employees detailed and clear guidance material about the
reporting and management of suspected misconduct conducting periodic training which focuses on the relevance of the Code to
employees’ day-to-day work regularly reviewing agency written guidance material periodically conducting a file audit of a sample of misconduct files to assess if correct
procedures and recordkeeping requirements are being followed testing employee confidence that suspected breaches are handled fairly and effectively
(e.g. by the use of staff surveys or other consultative mechanisms).

Employee reviews are also a systemic assurance mechanism. The regulations provide non-SES employees with a review right in relation to a determination that they breached the Code and/or the sanction imposed for a breach (other than termination decisions). An application for such a review is lodged directly with the Merit Protection Commissioner.
In 2007–08, the Merit Protection Commissioner received 40 applications for review. This represents a review rate of around 6% of finalised agency investigations where employees were found to have breached the Code—the same review rate as last year’s.
The Merit Protection Commissioner had 14 applications for Code of Conduct reviews on hand at the start of the year and, as noted above, received 40 applications during the year. Of this total of 54 applications, 24 applications were reviewed; 9 applications were not accepted; 9 applications lapsed or were withdrawn; and 12 applications were on hand at the end of the financial year.
In regard to each of the 24 completed reviews, the Merit Protection Commissioner made formal recommendations to the relevant agency head that the decision under review be either confirmed (15), varied (7) or set aside (2).
Whistleblower reports
The APS whistleblowing scheme is provided for in legislation and supporting instruments. Section 16 of the Act prohibits the victimisation of, or discrimination against, an APS employee because the employee has reported a breach or an alleged breach of the Code of Conduct to a person authorised to receive the report. Regulation 2.4 of the Public Service Regulations 1999 (the Regulations) provides a framework for agencies to develop processes for dealing with such whistleblower reports.
A high proportion of agencies (89%) have established procedures for dealing with whistleblower reports, as required by the Regulations—consistent with last year’s result (88%). The remaining agencies reported that whistleblower procedures were being developed.
The number of employees investigated as a result of a report made under their agency’s whistleblower procedures (six agencies investigating 11 employees) continued to decline for the third consecutive year. This represented 1% of misconduct investigations and compares to 2% in 2006–07 and 3% in 2005–06. It is important to understand in this context that conduct identified by colleagues was the most common way that suspected misconduct was reported to agencies (38% of investigations), and that most employees choose not to report such conduct under an agency’s formal whistleblowing procedures.
People authorised to receive reports
There continues to be a wide variation in who is authorised to receive whistleblower reports within agencies (see Table 7.7). Twenty-four per cent of agencies rely solely on the agency head and have not authorised other people to receive reports—this is an increase from 18% last year (a percentage which had been unchanged for the previous three years).
The people most commonly authorised to receive whistleblower reports continue to be the head of corporate services and the HR manager, followed by all SES employees. Employees

in a specialist conduct unit and all line managers are less commonly authorised by agencies to receive whistleblower reports.
Table 7.7: Person(s) authorised to receive whistleblower reports, 2007–08
Categories of ‘authorised’ persons Agencies reporting each category (%)
Source: Agency survey
Head of corporate services 54
HR manager 44
Agency head only person 24
All SES employees 22
SES Band 2s and 3s 13
All line managers 12
Employees in a specialist conduct unit 8
In circumstances where it is not appropriate for an agency head to deal with a whistleblower report by an APS employee, or where the whistleblower is not satisfied with the outcome of the investigation by the agency, the whistleblower may refer the report to the Australian Public Service Commissioner or the Merit Protection Commissioner. Information related to these referrals is reported in the Australian Public Service Commissioner’s annual report, incorporating the annual report of the Merit Protection Commissioner.
Submission to the Commonwealth Inquiry into Whistleblowing Protections within the Australian Government Public Sector
On 10 July 2008, the Attorney-General, the Hon. Robert McClelland MP, on behalf of the Cabinet Secretary, Senator the Hon. John Faulkner, asked the House of Representatives Standing Committee on Legal and Constitutional Affairs to inquire into and report on whistleblowing protections within the broader Australian Government public sector. The inquiry is consistent with the Government’s commitment to broadening and strengthening public interest disclosure measures within its ethics/integrity framework through a pro- disclosure system across the Australian Government sector.
The Committee has called for submissions from interested people and organisations and arranged a series of public hearings and a roundtable discussion. The Australian Public Service Commissioner was invited to appear before the Committee at a public hearing in September 2008. In her evidence to the inquiry, on 25 September, the Commissioner observed that, while the Act already provides for the protection of whistleblowers, it is timely for it to contain a comprehensive whistleblowing scheme to support that protection.
The Commissioner noted that many of the whistleblower reports referred to the Commission are from APS employees complaining about personal employment-related grievances, or relate to concerns expressed by members of the public about the conduct of individual APS employees, rather than matters of public interest. This reflects some misunderstanding of the purpose of the existing whistleblower system. This view is supported by the Commission’s
2005–06 evaluation of managing breaches of the Code, which identified some confusion among agencies about how the processes they are required to have in place for whistleblowing interact with those dealing with allegations of suspected breaches of the Code more generally, and the protections which apply in both instances. In the Commissioner’s view, the current system has worked reasonably well and it is preferable to build on the good foundation provided by the existing provisions, rather than totally reinvent them.
The Commissioner submitted that a sensible approach to dealing with reports of misconduct would be for individual grievances to be dealt with by agencies under existing Code of Conduct investigation provisions, while more systemic or widespread misconduct would fall under a public interest disclosure scheme. It would be a natural extension of the Commission’s current role for the oversight of such a scheme to rest with the Commissioner. The Commissioner also expressed support for the extension of whistleblower protection to cover a broader range of public sector employees.
The outcomes of the current inquiry into whistleblowing protections and the findings of the ‘Whistling While They Work’ research project will help to determine the preferred model for future legislation aimed at protecting public interest disclosures (whistleblowing) within the Australian Government public sector.
‘Whistling While They Work’ research projectFor the past three years, Griffith University has led a collaborative national research project, ‘Whistling While They Work’, to examine the management and protection of internal witnesses, including whistleblowers, in the Australian public sector. The Commission was a minor contributor to the project.
The research involved the study of organisational experiences under public interest disclosure regimes in various Australian Government, State and Territory Government agencies and comparing, identifying and promoting current best practice.
The project’s first report, Whistleblowing in the Australian Public Sector: Enhancing the Theory and Practice of Internal Witness Management in Public Sector Organisations, was launched in September 2008. This report will help to inform the Government’s consideration of a new public interest disclosure system.
Harassment and bullyingThe Code requires that an APS employee, when acting in the course of APS employment, must treat everyone with respect and courtesy, and without harassment (s.13 (3) of the Act).
Nineteen per cent of APS employees reported that they had been subject to harassment or bullying in the last 12 months. This figure, which is significantly higher than that of 15% for 2005–06 and 2006–07, is attributable to the results of two large agencies. When these agencies are removed the result is on a par with last year’s. Rates of perceived harassment and bullying are lower than in two other jurisdictions that had data available for comparative purposes—Tasmania (28%) and WA (24%).9

There continues to be a degree of variation among agencies in the proportion of employees reporting that they had experienced harassment and bullying across the 47 agencies with individual agency-specific results (ranging from 8% to 32%). Within this range, 10 agencies (the Australian Communications and Media Authority (ACMA), the Australian Crime Commission (ACC), ATO, the Australian Trade Commission (Austrade), BoM, DAFF, DFAT, Treasury, Geoscience Australia, the National Library of Australia (NLA)) have results significantly better than the APS-wide result. The fact that a number of agencies have achieved low rates of reported harassment and bullying illustrates that agencies performing badly in this area have considerable scope to improve their performance.
In 2007–08, a significantly higher proportion of women (21%) than men (16%) believed that they had been subjected to harassment or bullying in their workplaces during the last 12 months, compared with 17% and 12% respectively last year. Unlike last year, APS 1–6 and EL employees were not more likely to believe they had experienced harassment or bullying than the SES.
This year, employees who believed that they had experienced harassment or bullying in the previous 12 months were asked who was responsible for the harassment or bullying. The results suggest that supervisors (42%) and someone more senior other than supervisors (37%) are the two groups most likely to be responsible for harassment and bullying. It is of great concern that some agencies appear to have a culture in which managers who bully may be tolerated. It must also be kept in mind, however, that giving critical performance feedback or refusing to accede to unreasonable requests may still be being misinterpreted by some staff as harassment and bullying.
Co-workers (32%) were the third most likely group to be considered responsible for harassment or bullying. Someone more junior (8%), clients (7%) and consultant/service providers (1%) were less likely to be thought responsible for harassment or bullying.
Respondents who said their main type of work was service delivery to the public (e.g. call centres, shopfront/counter service) were more likely to be harassed/bullied by a client (51%), or by consultants/service providers (44%). In contrast, respondents who worked in policy were more likely to be harassed by a Minister or a ministerial adviser (31%) and representatives of another APS agency (22%). Respondents who worked in corporate services were more likely to be harassed or bullied by someone more junior (29%) or a co-worker (23%).
While any harassment or bullying is actively discouraged through the Code of Conduct for APS employees, in some cases agencies need to maintain a level of service to clients, when employees may be at risk of experiencing harassment or bullying, for example, in Centrelink. There can be situations where harassment and/or bullying can be an occupational health and safety issue and agencies are encouraged to keep this in mind when dealing with complaints.
Guidelines on dealing with difficult or aggresssive clientsIn August 2008, the Ombudsman released a report into Centrelink: Arrangements for the Withdrawal of Face-to-Face Contact With Customers.10 This arose from the Ombudsman’s Office receiving a number of complaints from people who had been banned from attending Centrelink Offices as a result of unacceptable behaviour. Investigation of the complaints

found that, while in most instances the decisions to withdraw face-to-face contact were not unreasonable, there was a need for national procedural guidelines to assist staff in managing customers who exhibit abusive or threatening behaviour. In response to earlier investigations by the Ombudsman’s Office, Centrelink had implemented new national Guidelines for Working With Customers With Difficult or Aggressive Behaviours in February 2007. Since the implementation of these guidelines, the Ombudsman’s Office has identified issues for further attention and their recent report made a number of recommendations to improve Centrelink’s ability to provide continuing services to difficult or aggressive clients.
A variety of information is available to support agencies in developing systems and processes to address harassment and bullying. The Commission’s Respect11 good practice guide and Respect summary publication promote an APS culture free from harassment and bullying and Comcare’s Bullying in the Workplace12 is a guide to prevention for managers and supervisors.
Employees made comments that indicate harassment or bullying continues to raise difficult issues for employees and managers alike:
I wasn’t directly involved with bullying or harassment but was witness to it in my section.
It was a period of uneasiness and brought down the team morale. Nothing seemed to be done at the proper level—e.g. EL 2 which is a shame since we lost the services of a very dedicated EL 1.
Difficult to implement when the bullying is done by those in positions of authority who are not accountable to anyone else …
I know of at least 3 colleagues (in past 18 months) who have resigned as they believe they were bullied by management (small team of 14).
I think that the bullying and harassment in the PS is overstated, and is too often confused with other issues.
I am an Harassment contact officer and I do know of occasions where the correct behaviour has not been demonstrated by Managers. I believe that they should be leading from the front. I do know that some people do not report cases of harassment or bullying because they are scared of any repercussions.
Merit and fairness in APS EmploymentWithin the framework of the APS ethics and integrity framework, a key value is that the APS is a public service in which employment decisions are based on merit. Merit in the APS means that employment decisions should be based on a person’s ability to do the job, and that decisions must be objective and fair and avoid patronage, favouritism and unjustified discrimination. For ongoing employment or promotion, all eligible members of the community, including non-APS employees, should have a reasonable opportunity to apply for jobs and there must be a competitive assessment of applicants’ suitability to perform the duties of the job. Within these parameters, agencies have the flexibility to design recruitment processes that meet their specific business needs. For movement at level, or temporary movement to a higher-level job, the decision must be based on the ability of the person to do

the job as well as being fair, transparent and unbiased. A competitive assessment is not required in these cases.
Recruitment to the APS is guided by the minimum requirements and principles that are set out in the Public Service Act 1999, the Public Service Regulations 1999, the Public Service Commissioner’s Directions 1999 and the Public Service Classification Rules 2000. These requirements give agencies considerable flexibility and do not prescribe a lengthy or complex process, nor do they suggest that a recruitment process has to be slow to meet the requirement of merit. Indeed, the Management Advisory Committee (MAC) report, Reducing Red Tape in the Australian Public Service, found that if the time it takes to fill one or a few vacancies is longer than four weeks, the delay is unlikely to be due to legal requirements. The cause is often poor planning and preparation by managers, or unnecessary internal processes put in place by the agency.13
Employees’ perceptions of merit and fairness
For the merit principle to operate properly employees need to be confident that engagement and promotion decisions are transparent, that consistent principles are applied, and that there is no evidence of favouritism. They also need to understand how merit is applied under the Act and be confident that recruitment results in the selection of high-quality staff.
In the past five years employees’ perceptions of how merit is applied have been relatively low in APS agencies; they have declined even further this year. When specifically asked about whether their agency routinely applied merit in engagement and promotion decisions resulting from a competitive selection process, only 50% of employees agreed that this was the case.14 This is a significant decrease compared to the 59% who agreed in 2006–07 and the lowest level of agreement in the last five years (see Table 7.8). Offsetting this decrease were significant increases in both the proportions of employees who neither agree nor disagree (25%, up from 19% in 2006–07) and those who disagree (19%, up from 14% in 2006–07).
Table 7.8: Employees’ perceptions of whether their agency routinely applies merit (as defined in the Public Service Act) in decisions regarding engagement and promotion resulting from a
competitive selection process, 2003–04 to 2007–08
Year Agree (%) Neither agree nor disagree (%) Disagree (%) Not sure (%)
Source: Employee survey
2003–04 59 18 18 4
2004–05 53 19 21 7
2005–06 54 19 18 10
2006–07 59 19 14 9
2007–08 50 25 19 6
Perceptions about whether merit is applied continue to vary widely amongst employees in agencies with individual agency-specific results. In 2007–08, results varied between 34% and 72% of employees in these agencies who agreed that merit is routinely applied in their agency for engagement and promotion decisions. Thirteen agencies (ABS, ACCC, ACMA, AGD,

AHL, Comcare, the Commission, FaHCSIA, Finance, Geoscience Australia, PM&C, RET and Treasury) had results that were significantly better than the APS average.
When employees were asked about their most recent experience in applying for a job in the APS, those who had had a positive experience were more likely to agree that merit is routinely applied in their own agency for engagement and promotion decisions (even though some small proportion of the jobs applied for would have been in other agencies).
Employees who believed that the recruitment process had been conducted efficiently, for example, were much more likely to agree that their agency routinely applies merit in engagement and promotion decisions (65%) than those who found the recruitment process overly demanding (44%).
Not surprisingly, employees who had applied for and were successful in obtaining a job in the last 12 months were also much more likely to agree that their agency routinely applies merit in engagement and promotion decisions than those who were unsuccessful (57% compared to 37%). Unsuccessful applicants were almost twice as likely to disagree (28% compared to 15%). It is likely that a lack of success in job applications will always be a factor in poor perceptions of merit.
Nevertheless, the wide variation in perceptions of merit between agencies suggests that there is considerable room for improvement in employees’ perceptions of merit in those agencies with poor results. There is a range of issues relating to employees’ perceptions of merit. There is, for example, a positive relationship between the level of job satisfaction of employees and their level of agreement that their agency routinely applies merit in decisions regarding engagement and promotion. Similarly, employees who agree that their agency has procedures and systems that ensure objectivity in decision-making, provides them with information that clearly outlines their agency’s decision-making processes, or values or manages diversity in the workplace, are much more likely to believe that their agency routinely applies merit in engagement and promotion decisions. Employees who received formal individual performance feedback within the last 12 months were also more likely to believe that their agency routinely applies merit in these decisions.
Levels of agreement tended to be lower in larger agencies, for example, 58% of employees in small agencies agreed compared to 50% in large agencies. Employees working in the ACT were also more likely to agree (57% compared to 46% working outside the ACT). An employee’s classification was particularly significant—APS 1–6 employees (46%) recorded much lower levels of agreement than EL (62%) and SES (90%) employees.
The employee survey asked some additional questions on employees’ perceptions of employment decisions and these also continue to be relatively low. Just over half of employees (54%) reported that in their work group the process of selecting a person for a position is done fairly, and well under half (41%) agreed that recruitment and promotion decisions in their organisation are fair.
Employee perceptions of employment decisions were also low compared to those in other public sector jurisdictions. While the results are not directly comparable because of the different survey methodologies used, the 2007–08 APS-wide result (41%) for employees who believed that recruitment and promotion decisions are fair in their organisation was below that reported in WA (51%) and in Tasmania (46%).15

Our factor analysis of satisfaction with a range of issues related to employee engagement includes a merit and career progression factor that provides a summary of employees’ views about merit and their career progression.16 The overall rate of satisfaction or agreement on the merit and career progression factor was 49%. This was in the lowest third of results for the 12 employee engagement factors, confirming that there is substantial room for improvement in employees’ views of merit and career progression.17
Agency selection processes
Despite the flexibility available under the Act where direct recruitment is possible, many agencies still choose to conduct competitive selection processes for movements at level and temporary assignment of higher duties. Sixty-six per cent of agencies reported that they routinely require competitive selection processes to be used for non-SES movements at level from another agency—a similar result to those recorded in the last two years. For movements at level within the agency, the figure was 59% and for long-term temporary assignment of higher duties the figure was 74%. Both results are similar to those reported in previous years.
While there may be circumstances where competitive processes for movements at level and higher duties are appropriate, these would need to be conducted in an efficient and timely way so as not to impose undue red tape and delays. The poor results for the time taken to finalise a competitive selection exercise where, for example, 18% of selection exercises took over four months, can be partly attributed to agency processes that are not required under the legislation. Speed in recruitment is generally conducive to merit as the best person for the job may well have found another job if the process takes too long or may decide that they do not want to work in an agency that has such drawn-out processes. The Commission’s Better, Faster: Streamlining Recruitment in the APS publication provides HR practitioners with a tool for the focused evaluation of agency recruitment processes.18 However, reducing the time it takes to fill vacancies requires more than just changing the process; it must be backed by a commitment from line managers, the SES and human resources (HR) practitioners to make recruitment a priority.
Assurance processes
As with other APS Values, it is important that agencies take steps to monitor compliance with the merit Value. The relatively poor perceptions of merit in many agencies point to the need to place even greater importance on assurance processes in this area.
When asked about the mechanisms used during 2007–08 to collect information on employees’ confidence in the agency ensuring that the merit principle is applied in employment decisions, 34% of agencies reported using staff surveys (unchanged from 2006–07), 41% reported using consultative committees (up from 33% last year) and 25% reported using other mechanisms. The fact that 33% of agencies had no mechanisms for collecting this information indicates that more could be done by some agencies to monitor compliance with the merit Value.
The ability of APS employees to apply to the Merit Protection Commissioner for the review of promotion decisions up to the APS 6 classification is one of the assurance mechanisms that protect merit as the basis for the promotion of employees. In 2007–08, there were 429 individual applications for promotion review (303 in 2006–07), and 78 cases (cases can deal with one or more individual applications) were completed during the year (45 in 2006–07).19 Of the promotion decisions reviewed in 2007–08, 4.3% were varied. This is higher than the

percentage of promotion decisions varied last financial year (2.6%), but is comparable with rates of about 5% of decisions reviewed in the previous three years.
During the year the Merit Protection Commissioner has updated several brochures related to the Role and Functions20 of the Merit Protection Commissioner, Review of Actions,21 Review of Breaches of the APS Code of Conduct,22 Review of Promotion Decisions,23 and Independent Selection Advisory Committees.24
More detailed information relating to reviews of promotion decisions is reported in the Australian Public Service Commissioner’s annual report, which incorporates the annual report of the Merit Protection Commissioner.
SES and agency head selectionsSpecial arrangements govern the selection of SES staff and agency heads.
SES selections
Promotion and engagement decisions at SES level take place following selection arrangements that are designed to ensure a high level of transparency in the process. In addition to the minimum requirements relating to merit set out in Chapter 4 of the Commissioner’s Directions, Chapter 6 specifies some additional requirements that must be satisfied in relation to SES promotion and engagement decisions. These include that SES employment opportunities must be notified on both the APS Employment Gazette (now the electronic APS employment gazette, incorporated in the APSjobs website) and externally (usually in the national press).
In addition, each SES selection committee must include one member who acts as the Commissioner’s representative. The representative will generally be an experienced public servant from a different portfolio and at a higher level than the vacancy or job opportunity. The Commissioner’s representative is required to certify at the end of the selection exercise that the processes followed were appropriate, and the Commissioner’s endorsement of that certification must be obtained before any promotion or engagement can proceed. In 2007–08, the Commissioner’s endorsement was sought and provided in relation to 254 SES selection processes. The Commissioner was also consulted in relation to a further 51 staffing actions arising from selection processes endorsed earlier.
Changes to the Public Service Commissioner’s Directions
Clause 6.3 of the Commissioner’s Directions sets minimum requirements applying to promotion and engagement as an SES employee. Because of the way in which this clause was originally drafted, there has been some uncertainty about whether or not it is possible to engage non-ongoing SES employees for periods of no more than 12 months without the need for the employment opportunity to be notified (as is the case for non-SES employees). Agencies require this flexibility in order to meet short-term SES staffing requirements in a timely and efficient manner.
To remove any ambiguity, a new subclause—6.3(3)—was added to the Commissioner’s Directions with effect from 2 April 2008, clarifying the capacity of APS agencies to engage

an SES employee on a non-ongoing basis for no more than 12 months without the employment opportunity needing to be notified. The clause specifies that a decision engaging a person as an SES employee meets the minimum requirements (clause 6.3) if the engagement is for a specified term of no more than 12 months, and the requirements of Chapter 4 of the Commissioner’s Directions have been satisfied. This means that a non-ongoing engagement still requires the employment decision to have been based on merit, including that there be an assessment made of the relative suitability of the candidates for the duties.
In Australian Public Service Commission Circular 2008/1, which provides more details about the amendment, it was recommended that agencies put in place arrangements, similar to those applying to their non-SES non-ongoing employment arrangements, whereby individuals can register their interest in being considered for short-term, non-ongoing engagement at SES level.
Agency head selections
On 5 February 2008, the Australian Government introduced a policy implementing transparent and merit-based assessment in the selection of most APS agency heads. The policy applies to agency heads and other statutory officers working in, or in conjunction with, APS agencies, unless specifically excluded. Specific exclusions include Portfolio Secretaries and Secretary-equivalent appointments, that is, the Australian Public Service Commissioner, the Commissioner of Taxation, the Auditor-General, the Chief Executive Officer of the Australian Customs Service and the Australian Statistician.
Key requirements of the policy are that:
vacancies must be advertised, at a minimum, on the APSjobs website and in the national press
the advertising process and assessment of applicants’ claims against a set of core selection criteria must be overseen by the relevant Portfolio Secretary (or Chair of the Board where applicable) and the Australian Public Service Commissioner
core criteria may be supplemented by additional criteria agreed by the Minister (or Chair of the Board) and the Secretary
a report recommending shortlisted candidates, endorsed by the Australian Public Service Commissioner, is to be provided by the Secretary to the Minister
the Minister must give reasons to the Prime Minister if he or she wishes to appoint someone not recommended by the panel.
Further details of the new arrangements are contained in the policy document and associated guidelines, Merit and Transparency: Merit-Based Selection of APS Agency Heads and Statutory Office Holders.25
Between the introduction of the policy on 5 February, and 30 June 2008, 14 vacancies (covering a number of positions in several agencies) were advertised in accordance with the new procedures. During that time, five processes were finalised and recommendations made for appointing one person as an agency head and two people as statutory office holders, to be effective in 2008–09. The reappointment of two existing statutory office holders was also recommended. All five recommendations were accepted by the relevant Minister.

Use of Clause 4.2A of the Commissioner’s DirectionsClause 4.2A of the Commissioner’s Directions enables the Commissioner to authorise an agency head to engage a non-ongoing APS employee as an ongoing APS employee in exceptional circumstances. The Commissioner has undertaken to report on usage of this provision on an annual basis through this report.
In 2007–08, the Commissioner agreed to three requests from agency heads pursuant to clause 4.2A. These requests related to SES employees in Finance, Defence and the National Competition Council (NCC). In each case, the agency concerned had decided to engage the employee for a specified term due to a variety of factors, including uncertainty over the ongoing nature of the role, the views of the individual concerned and the potential desirability of having change over time in the roles concerned. A further assessment of the quality of fields of applicants who may have been attracted if the jobs were to be advertised again, suggested that they would be small given the level of knowledge and expertise required. It was deemed that any additional applicants were unlikely to be competitive against the existing employees who had each demonstrated high levels of ability in discharging their duties.
Review of employment actionsOne of the APS Values relevant to ensuring integrity and fairness in decision-making is that the APS provides a fair system of review of actions taken in respect of APS employees. The Act, the Regulations and the Commissioner’s Directions establish a review of actions framework for the APS. The intent of the framework is to encourage the resolution of employee concerns in the workplace, including through the use of alternative dispute resolution methods where appropriate.
Under the Regulations, non-SES employees may seek review of certain actions or decisions that relate to their employment. Subject to some exceptions, the Regulations provide for a primary review by the relevant agency. The Regulations also provide that in cases where employees’ concerns are not resolved, employees can apply to the Merit Protection Commissioner for secondary review of the relevant action. Reviews of actions relating to breaches of the Code are also dealt with directly by the Merit Protection Commissioner.
Agencies’ internal reviews
The process of primary review of employment actions remains an important part of the assurance processes used across the APS to ensure the application of integrity and fairness. In 2007–08, 43% of agencies reported receiving at least one application for primary review, that is, an application for review of an employment action (other than decisions about breaches of the Code or matters that went to a Promotion Review Committee) lodged by an employee directly with the agency. This is the same as last year’s result. As previously, applications were concentrated in large agencies.
Agencies also reported on the number of applications for primary review that were finalised during 2007–08. Forty-one per cent of agencies reported having finalised at least one application for primary review, compared to 38% last year. Those agencies that had finalised reviews reported that the subject of performance feedback or assessment was relevant to a little over half of the completed matters (54%). Access to leave or other conditions of
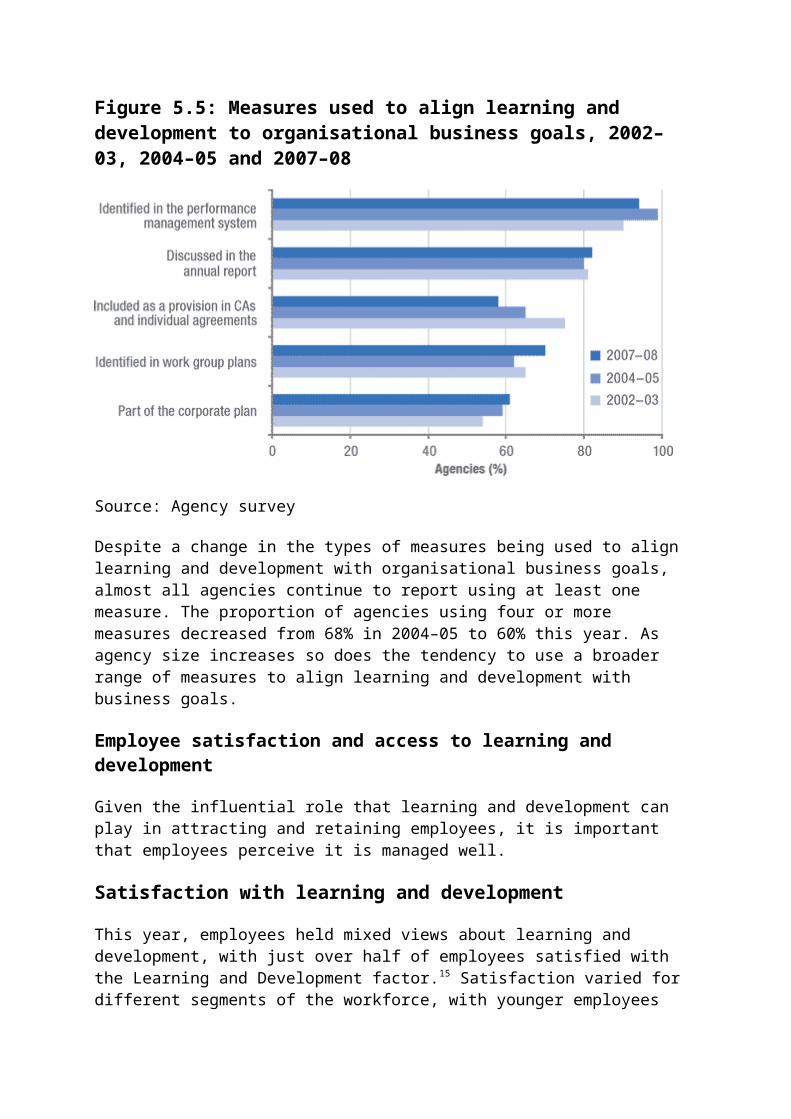
employment was relevant to 49%. Procedural issues relating to selection exercises were relevant to 43%, discrimination, harassment or bullying was relevant to 30%, and inappropriate behaviour in the workplace was relevant to 14%.
During 2007–08, the original agency decision in 81% of applications was not varied or overturned, compared to 65% last year. Twenty per cent of finalised applications became the subject of external review by the Merit Protection Commissioner, compared to 13% last year.
Employee confidence
The degree of confidence reported by employees in the processes used for resolving grievances within agencies remains low. This year, only 41% of employees surveyed agreed that they had confidence in the processes used by their organisation to resolve employee grievances—a return to the same level reported in 2005–06, after an increase to 46% last year. As well, 38% of employees responded neutrally, that is, they did not agree or disagree with the statement that they had confidence in their agencies’ processes for resolving grievances. Despite this, agencies continue to favour making information available to staff about these processes, rather than more proactive measures to raise awareness, with only 21% of agencies reporting that they provided training to line managers or other staff on the principal features of internal review processes during 2007–08. Given the relatively low level of confidence reported by employees, agencies should consider providing more targeted training on the handling of employee grievances, particularly for managers.
Key chapter findingsThere have been a number of positive developments in the areas of ethics and integrity within the APS during 2007–08. The Government’s commitment to reinvigorating the Westminster traditions and values and having a sound framework in place to achieve this has focused attention on the APS Values and the key differences between the ethics and behaviour expected of public service agencies compared to organisations in other sectors. The new policy for the selection of most APS agency heads will strengthen the application of merit in these key employment decisions. It is also clear that most APS agencies have now consistently embedded the Values into their performance management systems—a key strategy for incorporating the Values into their culture. Nearly all agencies are ensuring that their new employees receive some training in the Values. This is essential, given the high levels of recruitment from sectors outside the APS, including for non-entry level positions.
Although the basic tools for fostering an ethical culture in the APS on the basis of the Values and the Code exist, messages and strategies are not getting across to everyone. Improper use of information and communications technology (ICT) is an area of ongoing concern, even allowing for the fact that the detection of breaches may be partly the result of better monitoring. There appears to be pockets in the APS where ethical failures of one sort or another arise. This suggests scope for new ethics education initiatives, including a mandatory ethics component in all Commission courses, further promotion and if necessary upgrading of induction training in ethics, as well as encouraging and assisting agencies to better integrate ethics into their management systems. With the continued variation among sanctions applied for misconduct across the APS, it is time to look into developing better guidance on the application of sanctions.
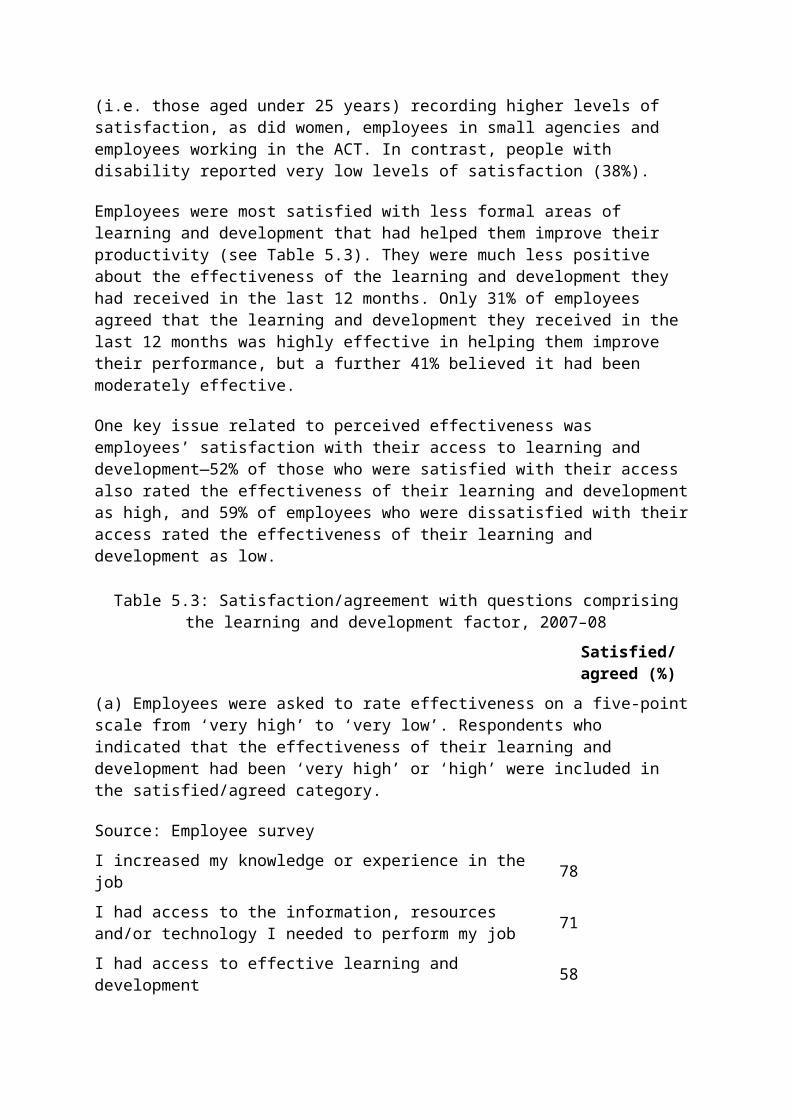
The significant fall in employees’ perceptions of merit in employment decisions, from an already low base, is a cause for concern. While an employee’s own experience in applying for jobs will influence their perceptions of merit, as will misunderstandings over the merit requirements under the legislation, there are obviously other forces at play. This is clearly the case when only 57% of employees who were successful in obtaining a job agree that their agency routinely applies merit in engagement and promotion decisions and when 15% of such employees disagree. This conclusion is also reinforced by the good performance of some agencies which have achieved over 65% of their employees agreeing that merit is routinely applied.
It is clear that, in general, employees’ satisfaction with the application of merit continues to be lower than their satisfaction with a range of factors relevant to employee engagement. What can agencies do to improve the merit perceptions of their employees? Research suggests that training in the merit requirements under the APS framework for all staff, not just those involved in selection exercises, is positively related to employees’ perceptions of merit. Ensuring greater transparency in the processes applying in selection exercises for both agency employees and outside applicants and providing feedback to unsuccessful candidates can also assist. There is also much potential for agencies to review their selection processes to ensure that unnecessary processes do not delay selection exercises and for line managers, the SES and HR practitioners to make recruitment a priority.
Another disappointing result in this area in 2007–08 is the rise in the proportion of employees reporting that they had been subject to harassment and bullying in the last 12 months. Again, the range of results across agencies, where some agencies have achieved results of below 10% of employees reporting such incidents, indicates that there is much more some agencies need to do, particularly at the manager and supervisor levels, to create a culture where such behaviour is unacceptable.
1 Hon. Kevin Rudd MP, ‘Address to Heads of Agencies and Members of the Senior Executive Service’, Great Hall, Parliament House, Canberra, 30 April 2008, <http://www.pm.gov.au>
2 Senator the Hon. John Faulkner, ‘New Directions: Setting the Agenda on Accountability and Integrity’ (Speech, 16 July 2008), p. 3, <http://www.cabinetsecretary.gov.au>
3 ICAC 2000, What is an Ethical Culture? Key Issues to Consider in Building an Ethical Organisation—Summary Report, ICAC, Sydney, <http://www.icac.nsw.gov.au>; ICAC 2000, Ethics: The Key to Good Management, ICAC, Sydney, <http://www.icac.nsw.gov.au>; F. Vogl 2001, ‘Corporate Integrity and Globalization—The Dawning of a New Era of Accountability and Transparency’ (Lecture delivered at the Pennsylvania State University, 23 March).
4 See Australian Public Service Commission, ‘APS Induction Programme’, <http://apsc.gov.au>
5 This year’s employee survey did not ask employees about their awareness of the Values and the Code given the high results in previous years (an average of 89% of employees said they were familiar with the APS Values in the three years from 2004–05 to 2006–07).

6 Care needs to be taken in making comparisons between jurisdictions due to the different methodologies used by the various jurisdictions. The Tasmanian data is from the State Service Employee Survey 2007. The Western Australian data is from the Climate Survey 2007–08. More information is available from the Office of the State Service Commissioner, Tasmania in relation to Tasmanian survey data and from the Office of the Public Sector Standards Commissioner, Western Australia, in relation to Western Australian survey data. Jurisdictional comparisons with data from previous State of the Service reports may differ, as this year percentages were calculated excluding the ‘not stated’, ‘don’t know’ and ‘not applicable’ response categories.
7 The increase in investigations over last year reflects the investigations announced by DAFF in July 2007 in relation to employees allegedly abusing the Department’s ICT system.
8 Australian Public Service Commission 2007, Handling Misconduct: A Human Resource Practitioner’s Guide to the Reporting and Handling of Suspected and Determined Breaches of the APS Code of Conduct, Commonwealth of Australia, Canberra, <http://www.apsc.gov.au>
9 Care needs to be taken in making comparisons between jurisdictions due to different methodologies used by the various jurisdictions. The Tasmanian data is from the State Service Employee Survey 2007. The Western Australian data is from the Climate Survey 2007–08. More information is available from the Office of the State Service Commissioner, Tasmania in relation to Tasmanian survey data and from the Office of the Public Sector Standards Commissioner, Western Australia, in relation to Western Australian survey data. Jurisdictional comparisons with data from previous State of the Service reports may differ, as this year percentages were calculated excluding the ‘not stated’, ‘don’t know’ and ‘not applicable’ response categories.
10 Commonwealth Ombudsman 2008, Centrelink: Arrangements for the Withdrawal of Face-to-Face Contact With Customers, Commonwealth of Australia, Canberra, <http://www.ombudsman.gov.au>
11 Australian Public Service Commission 2007, Respect: Promoting a Culture Free from Harassment and Bullying in the APS, Commonwealth of Australia, Canberra, <http://www.apsc.gov.au>
12 Comcare 2006, Bullying in the Workplace: A Guide to Prevention for Managers and Supervisors, Commonwealth of Australia, Canberra, <http//www.comcare.gov.au>
13 Management Advisory Committee 2007, Reducing Red Tape in the Australian Public Service, Commonwealth of Australia, Canberra, <http://www.apsc.gov.au/mac>
14 Additional questions about the application of merit in other types of employment decisions were asked in previous years. As the pattern of results was similar to those for engagement and promotion decisions resulting from a competitive process, they were not asked in 2007–08.
15 Care needs to be taken in making comparisons between jurisdictions due to different methodologies used by the various jurisdictions. The Tasmanian data is from the State Service Employee Survey 2007. The Western Australian data is from the Climate Survey 2007–08.

More information is available from the Office of the State Service Commissioner, Tasmania in relation to Tasmanian survey data and from the Office of the Public Sector Standards Commissioner, Western Australia, in relation to Western Australian survey data. Jurisdictional comparisons with data from previous State of the Service reports may differ, as this year percentages were calculated excluding the ‘not stated’, ‘don’t know’ and ‘not applicable’ response categories.
16 Full details of the factor analysis, including details of the methodology and questions used, are set out in Appendix 3.
17 The 12 factors in order of agreement/satisfaction were: Personal Innovation and Flexibility, Understanding Current Role, Current Job, Work Group, Governance and Integrity, Immediate Manager, Work-Life Balance, Learning and Development, Merit and Career Progression, Innovation Culture, Senior Leaders and Agency Culture.
18 Australian Public Service Commission 2007, Better, Faster: Streamlining Recruitment in the APS, Commonwealth of Australia, Canberra, <http://www.apsc.gov.au>
19 A ‘case’ encompasses any and all applications for review arising from a selection exercise and therefore can cover several individual applications.
20 Australian Public Service Commission 2008, Merit Protection Commissioner: Role and Functions, Commonwealth of Australia, Canberra, <http://www.apsc.gov.au>
21 Australian Public Service Commission 2008, Merit Protection Commissioner: Review of Actions, Commonwealth of Australia, Canberra, <http://www.apsc.gov.au>
22 Australian Public Service Commission 2008, Merit Protection Commissioner: Review of Breaches of the APS Code of Conduct, Commonwealth of Australia, Canberra, <http://www.apsc.gov.au>
23 Australian Public Service Commission 2008, Merit Protection Commissioner: Review of Promotion Decisions, Commonwealth of Australia, Canberra, <http://www.apsc.gov.au>
24 Australian Public Service Commission 2008, Merit Protection Commissioner: Independent Selection Advisory Committees, Commonwealth of Australia, Canberra, <http://www.apsc.gov.au>
25 Australian Public Service Commission 2008, Merit and Transparency: Merit-Based Selection of APS Agency Heads and Statutory Office Holders, Commonwealth of Australia, Canberra, <http://www.apsc.gov.au>

Chapter 8: Interactions with Ministers and the ParliamentA strong, professional relationship between Australian Public Service (APS) agencies, Ministers, their offices and the Parliament is central to effective government and Australia’s democratic system. The Westminster system is the broad framework within which these relationships operate. A key goal of the current government is reinvigorating Australia’s Westminster tradition.1 In support of this approach the Government has introduced in 2007–08, among other things, a revised set of Standards of Ministerial Ethics, a Code of Conduct for Ministerial Staff, reductions in the number of ministerial advisers, additional guidance around the involvement of public servants in public information campaigns and new requirement for the approval of government media campaigns. For the first time, the public service provided presentations to all new Ministers and their advisers on their respective roles and responsibilities and the roles and responsibilities of APS employees. Key developments are outlined in this chapter along with information from the employee and agency surveys on agencies’ interactions with Ministers, their offices and the Parliament.
The last time agencies’ interactions with Ministers and the Parliament were examined was in the 2004–05 State of the Service report. It is timely that in an eventful year for such interactions, they are revisited in this report. The year 2007–08 covers a period that includes agencies’ interactions with the previous government in the lead-up to the caretaker period, the caretaker period itself and the period in which agencies were establishing relationships, protocols and processes with new Ministers and new ministerial staff.
The pace and quantity of ministerial and parliamentary business for most agencies has continued to increase over recent years for a range of reasons, including technology and media expectations. ‘There is generally more ministerial correspondence to handle, more briefings for ministers on cabinet and other government business, more parliamentary question responses to prepare, more parliamentary committee questions to research, and more parliamentary papers to draft and table.’2 On top of this, a change of government always increases public service workloads as the new government changes policy directions and implements its priorities.
The Commission published in 2006 a good practice guide, Supporting Ministers, Upholding the Values, to assist agencies to handle, with integrity, the increasing pace and number of interactions with their Minister and ministerial staff. As the Australian Public Service Commissioner commented in launching the guide:
Public servants are neither political advisers nor consultants … We have roles and responsibilities, professional standards and legislative employment arrangements that distinguish us from both of these groups. If we do not understand or keep to those standards, then we have nothing to offer government that is not available elsewhere and the public service has no future.3
Under the Westminster tradition, public servants, Ministers and parliamentarians operate under the law within a democratic political system in which there is ultimate accountability of governments to the Australian people through the electoral process. Many commentators over

the last two decades, in endorsing the need for greater responsiveness, have highlighted that the elected government alone has the authority to determine the public interest in terms of policies and programmes, while public servants assist governments to deliver that policy agenda and those priorities. The APS does, however, have a responsibility for protecting the public interest in terms of ensuring the integrity of government processes, including compliance with the law and fair and impartial decision-making in accordance with approved guidelines. It also has an important role to play in providing governments with a longer-term perspective on decision-making and policy-making, including a balanced view of the impact of policy options on the Australian community as a whole, and on the most vulnerable parts of the community.
Interactions with Ministers and Ministerial offices A good relationship between agencies and Ministers and their offices, where roles and responsibilities are well-understood and respected, forms a foundation of trust that underpins the ability of agencies to be responsive to elected governments and gives the Government confidence in the services it receives from agencies.
Agency contact with Ministers and Ministerial offices
The extent and nature of interactions between APS employees and ministerial staff in 2007–08 is likely to have been influenced by a range of factors, including the lead-up to the 2007 federal election, the caretaker period, the change of government in November and the experience and attitudes of Ministers and ministerial staff in the previous and new governments.
Seventy-seven per cent of agencies reported providing (i.e. monthly or more often) services or advice to Ministers regularly in 2007–08 compared to 72% and 69% of agencies in 2004–05 and 2003–04 respectively. Clearly, there has been a slow upward trend in the number of agencies providing regular services to Ministers and their offices over recent years. All large agencies, 79% of medium agencies and 61% of small agencies reported providing regular services or advice. This represents increases for medium and small agencies, up from 73% and 54% respectively in 2004–05.
Despite the increase in the proportion of agencies providing regular services to Ministers, the proportion of staff reporting that they had had direct contact with the Minister and ministerial advisers fell in 2007–08 (to 17%) compared to that in previous years (20% in both 2003–04 and 2004–05). Direct contact with the Minister is less common (seven per cent of employees) than contact with ministerial advisers (16%). As expected, SES employees were much more likely to have direct contact with Ministers and ministerial advisers (82%) compared to ELs (30%) and APS 1–6 employees (12%).
Of those employees who had direct contact with ministerial advisers, 20% reported that the contact was weekly or fortnightly, while a large majority reported ad hoc contact (73%). Those employees who reported having had contact with Ministers or ministerial staff were asked about the sorts of matters that the contact entailed. Table 8.1 summarises employees’ responses.

Table 8.1: Types of matters upon which relevant APS employees came into direct contact with Ministers and/or their advisers, 2003–04, 2004–05, 2007–08(a)
Relevant employees (%)
Type of matter 2003–04 2004–05 2007–08
(a) Multiple response questions—proportions will not add up to 100%.
(b) Other contact involved a degree of contact due to the change of government, including visits to agencies by new Ministers, facilitation of support services. There was also some informal, personal contact at agency events and official functions.
Source: Employee survey
Provision of advice (e.g. policy, legal, programme delivery) 58 52 50
Provision of purely factual information (e.g. programme-related information) 57 54 47
Provision of public affairs support for the Minister (e.g. preparation of speeches, draft media releases) 30 32 24
Parliament-.related functions (e.g. tabling of documents, possible parliamentary questions, correspondence) 32 28 27
Constituent issues (e.g. electorate briefing, individual constituent matters) 25 19 19
Administrative arrangements (e.g. arranging travel or meetings) 16 17 17
Other(b) 4 8 8
The consistent downward trend for the provision of advice, factual information and public affairs support and for parliament-related functions all suggest a possible lessening of reliance on the APS in these areas by Ministers and their offices. This may be a function of the growth in ministerial advisers between 1996 and 2007 (see Table 8.2) and the stock of knowledge built up by Ministers and advisers in the previous government. It could also reflect the effect of the caretaker period and the impact of the period of lower activity while new ministerial offices were staffed and established. It may also be that the ready availability of information online makes it quicker and easier for advisers to source some types of factual information for themselves. This downward trend is evident for the different classification groups. APS 1–6 and EL 1–2 employees reported less direct contact in these four categories while SES contact was relatively stable for policy advice and factual information but trending down for public affairs support and parliament-related functions.
Table 8.2: total government personal staff and numbers of ministerial advisers, 1995–2008
Year Total personal staff Ministerial advisers(a)
(a) This figure excludes all secretaries, administrative assistants and executive assistants/office managers as well as Parliamentary Secretary and other non-ministerial advisers.

Table 8.2: total government personal staff and numbers of ministerial advisers, 1995–2008
Year Total personal staff Ministerial advisers(a)
Sources:
(b) Department of Finance and Administration. Estimate based on paper files.
(c) State of the Service Report 2003–04.
(d) Department of Finance and Administration tabled at Senate Estimates 2007–08. See <http://www.aph.gov.au/senate/ committee/fapa_ctte/estimates/>
May 1995(b) 323 172
May 1996(b) 293 181
May 2004(c) 392 258
May 2007(d) 470 299
May 2008(d) 340 218
The steep reduction in 2008 in the numbers of government personal staff and ministerial advisers can be attributed to the Government’s policy of reducing ministerial adviser numbers to either 1996 levels or by a factor of 30%. The size of ministerial offices can have a direct effect on the frequency and type of interactions with the APS. However, the nature of this effect is difficult to predict: larger staff numbers could indicate more self-sufficiency within ministerial offices or they can create more contacts as larger numbers of advisers seek more advice from APS employees. It is generally considered in the APS that large numbers of ministerial staff have created confusion about roles and responsibilities and some duplication of public service roles, rather than providing a complement to them.
New code of conduct for Ministerial staff
On 1 July 2008, a new Code of Conduct for Ministerial Staff 4 came into effect. Much of it is similar to the APS Code of Conduct (the Code) but it has some significant differences, particularly around how ministerial staff should work with APS employees. Of significance are the requirements to:
acknowledge that ministerial staff do not have the power to direct APS employees in their own right and that APS employees are not subject to their direction
recognise that executive decisions are the preserve of Ministers and public servants and not ministerial staff acting in their own right
facilitate direct and effective communication between their Minister’s department and their Minister
make themselves aware of the APS Values (the Values) and the Code which bind APS and Parliamentary Service employees.
These aspects of the expected behaviour of ministerial staff were emphasised in presentations by the Australian Public Service Commissioner, together with the then Secretary of PM&C, to the new Ministry in December 2007. Senior staff from the Commission, PM&C and

Finance also provided a series of briefings for ministerial staff, as part of their mandatory induction training. These presentations covered the role and responsibilities of the APS and the ethical framework within which it operates, including the Values and the Code.
The formal clarification of the roles and responsibilities of ministerial advisers at the start of a new government should assist agencies and ministerial offices in their dealings with each other, and help to avoid situations where public servants are challenged in balancing the values of responsiveness and being apolitical and accountable.
The quality and evaluation of services provided to Ministers and ministerial offices
The agency survey presented a list of measures relating to quality control, recordkeeping and the evaluation of ministerial services and advice, and asked agencies whether they have these measures in place. Most agencies reported using a range of measures, although a number of agencies noted that they did not have any formal measures in place to guide and evaluate services and advice as their parliamentary workflow was conducted either through their portfolio department or was of such low levels that formal measures were not needed. A small group indicated that their independent status made measures of this nature unnecessary.
Agency quality control measures
Table 8.3 sets out the processes that agencies providing regular services or advice to Ministers used for quality control purposes. The results suggest a consolidation in the quality control of information that agencies are providing to ministerial offices. The proportion of agencies reporting requirements for a minimum classification level for signing off ministerial briefs (96%) is similar to that in 2005, slightly up on the 2004 result. Sixty-two per cent of agencies report having a requirement for a minimum classification level for phone contact with ministerial advisers. This is a similar result to that in 2005 but markedly higher than the result in 2003–04.
Table 8.3: Agency quality control measures, 2003–04, 2004–05 and 2007–08
Agency protocol Year % of agencies with protocol in place(a)
(a) Percentage of agencies that provide regular (i.e. monthly or more often) services/advice to Ministers
Source: Agency survey
Requirement for a minimal classification level for signing off ministerial briefs
2003–04 95
2004–05 97
2007–08 96
Requirement for a minimal classification level for phone contact with ministerial advisers
2003–04
47

Table 8.3: Agency quality control measures, 2003–04, 2004–05 and 2007–08
Agency protocol Year % of agencies with protocol in place(a)
2004–05 61
2007–08 62
Table 8.4 presents data on the range of awareness levels of these protocols among staff who have direct contact with Ministers and their offices in large agencies that had the protocol in place. The level of awareness among relevant employees of the requirement for a minimum level for the signing-off of briefs was relatively high (ranging from a low of 66% to a high of 91%). The level of awareness about a minimum level to handle phone contact with ministerial advisers was significantly lower (ranging from 15% to 32% of employees). Given the potential for problems with information quality, and for misunderstandings to arise between agencies and ministerial offices via phone contact between ministerial staff and agency employees at more junior levels, agencies with protocols in place to manage this issue need to regularly communicate their existence and requirements to employees. It is advisable to include such information in agency induction packages for employees, especially the SES, who have direct contact with ministerial offices.
Table 8.4: employees’ awareness of quality control measures, 2003–04, 2004–05 and 2007–08
Aware of protocol (% employees)(a)
Agency protocol Year Low High
(a) Results include only those employees who, in the last 12 months, have had direct contact with Ministers and/or ministerial advisers.
(b) The results include only those large agencies (more than 1,000 employees) that report having this protocol in place and that had statistically valid results from the employee survey (12 agencies in 2003–04, 15 agencies in 2004–05 and 10 agencies in 2007–08).
(c) The results include only those large agencies (more than 1,000 employees) that report having this protocol in place and that had statistically valid results from the employee survey (2 agencies in 2003–04, 3 agencies in 2004–05 and 4 agencies in 2007–08).
Source: Agency and employee surveys
Requirement for a minimal classification level for signing off ministerial briefs(b)
2003–04 69 99
2004–05 52 96
2007–08 66 91
Requirement for a minimal classification level for phone contact with ministerial advisers(c)
2003–04 23 32
2004–05 13 26
2007–08 15 32

Recordkeeping measures
Another group of formal measures designed to guide APS employees’ interactions with ministerial offices relates to recordkeeping. This includes written confirmation of oral briefings, file notes of significant conversations and the filing of significant email communication. Table 8.5 gives the proportions of agencies reporting these measures. The most common measure is to ensure that email communication is retained (91%), a similar result to that in 2004–05, but significantly up on the 2003–04 result. The other measures have been stable at around 70% for both 2004–05 and 2007–08. It is of concern that these rates are not higher, given the importance of such recordkeeping for accountability and in avoiding communication misunderstandings.
Table 8.5: Agency recordkeeping protocols, 2003–04, 2004–05 and 2007–08
Agency protocol Year % of agencies with protocol in place(a)
(a) Percentage of agencies that provide regular (i.e. monthly or more often) services/advice to Ministers
Source: Agency survey
Requirement that oral briefing to Ministers or Ministers’ staff on key issues is confirmed in writing (including emails or follow-up minutes)
2003–04 62
2004–05 71
2007–08 71
Requirement that file notes are routinely made after significant phone calls or oral discussions with Ministers or ministerial advisers
2003–04 70
2004–05 69
2007–08 70
Requirement that significant email communications with ministerial advisers be retained
2003–04 80
2004–05 93
2007–08 91
The ranges of relevant employee awareness of these measures among large agencies with statistically significant results are set out in Table 8.6. This reveals a relatively high level of awareness among employees who have regular contact with their Minister and ministerial office, of the need to retain email communications (between 56% and 80%). However, employees’ awareness of the protocols governing the need to confirm in writing the details of oral briefings, discussions and significant phone calls is relatively low and has fallen since 2004–05. These results indicate a continuing need for agencies to implement these

recordkeeping measures as well as to actively promote them to relevant employees. Given that accountability is a key APS Value, agencies should be making further efforts to ensure that their recordkeeping, particularly in this regard, is both accurate and comprehensive.
Table 8.6: employees’ awareness of recordkeeping protocols, 2003–04, 2004–05 and 2007–08
Aware of protocol (% employees)(a)
Agency protocol Year Low High
(a) Results include only those employees, who in the last 12 months, have had direct contact with Ministers and/or ministerial advisers.
(b) The results include only those large agencies (more than 1,000 employees) that report having this protocol in place and that had statistically valid results from the employee survey (3 agencies in 2003–04, 9 agencies in 2004–05 and 5 agencies in 2007–08).
(c) The results include only those large agencies (more than 1,000 employees) that report having this protocol in place and that had statistically valid results from the employee survey (6 agencies in 2003–04, 10 agencies in 2004–05 and 6 agencies in 2007–08).
(d) The results include only those large agencies (more than 1,000 employees) that report having this protocol in place and that had statistically valid results from the employee survey (8 agencies in 2003–04, 13 agencies in 2004–05 and 6 agencies in 2007–08).
Source: Agency and employee surveys chapter
Requirement that oral briefing to Ministers or Ministers’ staff on key issues is confirmed in writing (including emails or follow up minutes)(b)
2003–04 27 39
2004–05 24 63
2007–08 27 45
Requirement that file notes are routinely made after significant phone calls or oral discussions with Ministers or ministerial advisers(c)
2003–04 41 54
2004–05 30 65
2007–08 31 62
Requirement that significant email communications with ministerial advisers be retained(d)
2003–04 43 87
2004–05 47 75
2007–08 56 80

Evaluation measures
Agencies were asked to report on the sorts of formal measures they had in place to evaluate the quality of services provided to Ministers and their offices. Table 8.7 shows the proportions of agencies with these measures in place in comparison to those in previous years in which data was collected.
Table 8.7: Proportions of agencies with formal evaluation measures in place, 2003–04, 2004–05 and 2007–08
Formal measure 2003–04 (%)
2004–05 (%)
2007–08 (%)
Source: Agency survey
Formal ministerial feedback is collected via some form of rating system (for example, a rating scale for such criteria as timeliness, quality of analysis and accuracy)
47 44 41
A requirement that oral feedback is collected from Ministers 22 22 26
A requirement that oral feedback is collected from ministerial staff 33 27 33
Some form of internal peer review is undertaken of written briefing material 80 64 77
Twenty-eight of the 69 agencies (41%) that provide regular (monthly or more often) services/advice to Ministers indicated that they collected formal feedback via a rating system. This represents a decline in the use of this measure compared to that in previous years. Although all large agencies report having regular contact with ministerial offices, less than half (46%) report collecting feedback via some form of rating system, largely because these systems have been dispensed with for time saving reasons. Indeed, the data in Table 8.7 suggests a trend away from rating systems towards oral feedback and reliance on some form of internal peer review in order to ensure the quality of briefing materials provided to Ministers.
In the case of agencies who reported having a formal rating mechanism for ministerial feedback in their annual report for the previous year,5 an analysis was conducted of whether this information was reported publicly. Only 11 of the 28 agencies reported on the quality, timeliness or general satisfaction of Ministers with agency briefs, submissions, correspondence and responses to questions from Parliament. These ranged from simple statements such as ‘the Minister expressed high levels of satisfaction’ and ‘the Minister’s Office was generally satisfied’ to more quantitative reports like ‘briefings were consistently rated four out of five for timeliness and quality’ and ‘the department achieved a 90% satisfaction level for all ministerial items’.
Three agencies indicated that their ministerial offices discouraged the use of such formal rating methods. However, in these circumstances, it may still be possible to gather oral feedback from ministerial advisers and to use internal peer review from within the agency.
Given the importance of establishing effective relationships with Ministers and their offices, underpinned by high-quality services and advice, and the resources that agencies expend in

providing services to Ministers, it is important that more agencies establish mechanisms to evaluate the quality of their outputs, including how satisfied Ministers are with their services. the Australian National Audit Office (ANAO) Better Practice Guide, Agency Management of Parliamentary Workflow, provides some useful guidance on the collection and reporting of performance data in this area.6
UK experience Ministers report that written material drafted for them by government officials is boring, too detailed, long and full of ‘management-speak’ or jargon. A new Centre for Working with Ministers and Parliament at the National School of Government has been launched to address this. The Centre is founded on an understanding of the parliamentary and ministerial environment and offers a number of programmes and publications, and new consultancy and e-learning services to all departments and agencies.7
Challenges in managing the relationship with Ministers and ministerial offices
Focus groups of APS employees conducted for the Commission’s 2006 good practice guide, Supporting Ministers, Upholding the Values, identified certain situations and types of work where APS employees are more likely to face a challenge in balancing the need to be apolitical, responsive and accountable:
prior to the caretaker period, as an election approaches, as well as during the caretaker period
when discussing advice with Ministers’ offices on disbursement of grants or appointing statutory office holders
when responding to requests from Ministers’ offices for revised briefing materials in response to requests for electorate-based briefings supporting Cabinet processes supporting Budget processes recordkeeping (including handling freedom of information requests) responding to parliamentary questions and questions on notice.
The employee survey asked employees who had contact with Ministers or their offices whether in the past 12 months they had faced a challenge in balancing the need to be apolitical, impartial and professional, responsive to government and openly accountable. Twenty per cent reported that they had faced such a challenge in 2007–08. This finding is significantly lower than the one-third of employees who had reported facing the same challenge in 2004–05 and 2003–04. SES employees were much more likely to report facing this challenge (31%) than ELs (21%) and APS 1–6 employees (18%), although there was no difference between ACT and non-ACT-based staff.
Possible factors behind the large decline in those employees who reported facing a challenge in balancing the Values in 2007–08 compared to 2004–05 include: the lower proportion of employees who report having direct contact with Ministers and ministerial advisers in 2008 (17% in 2007–08 compared with 20% in 2004–05); and the significant fall in the number of ministerial advisers under the new government. It is also likely that the Commission’s activities in this area (for example, the release of Supporting Ministers, Upholding the Values and the presentations to new Ministers and ministerial staff following the November 2007

federal election), as well as the new government’s requirements for its Ministers and advisers have enhanced employees’ confidence in balancing these Values. These recent initiatives have also improved ministerial staffers’ understanding of their roles and responsibilities in interacting with public servants. The awareness-raising prior to the introduction of the new Code of Conduct for Ministerial Staff in July 2008 may have also had some impact.
Not surprisingly, the type of contact APS employees had with Ministers and their offices affected whether they were likely to face a challenge in balancing the Values. Generally, these were broadly consistent with the situations identified in the Commission’s good practice guide as being more likely to pose challenges for APS employees. An additional situation evident from the employee survey results has been identified, however, in which employees are required to provide public affairs support to Ministers. Employees who reported having contact in regard to the provision of public affairs support (e.g. preparation of speeches and media releases) were the most likely to report facing a challenge (30%).
Employees who had contact with regard to parliament-related functions (e.g. possible parliamentary questions and correspondence) also had experienced relatively high levels of challenges (29%). Employees least likely to report having faced a challenge were those having contact in relation to administrative arrangements (e.g. arranging travel or meetings) (16%). Of those employees in contact in relation to the provision of advice (e.g. policy, legal or programme delivery) or purely factual information (e.g. programme-related information), 23% and 26% respectively reported facing a challenge.
Whether employees reported facing a challenge also varied with the main type of work employees perform. Highest levels of facing a challenge were reported by those working in service delivery (26%) and policy roles (24%). Lowest levels were reported by those doing corporate work (14%) and legal work (10%).
Comments from employees help to describe some of the sorts of challenges faced by employees in 2007–08:
The tensions in balancing the need to be apolitical, impartial and professional, responsive to the Government and openly accountable, as per the APS Values, in dealing with Ministers and/or Ministers’ offices occur on a daily basis at the branch head level, and you use your judgement to steer the appropriate course through any discussion, in accordance with the Code of Conduct and APS Values.
Due to an inexperienced office there are unrealistic expectations placed on our department and portfolio agencies to provide copious amounts of material to the office to the point that they do not know what they have or what they need.
There is an inconsistency between guidelines or the adherence to protocol regarding communication between lower level staff and ministerial advisers. Lower level staff are apparently ‘not permitted’ to contact ministerial advisers directly, however, they have no qualms in contacting us directly and putting pressure on us to answer their questions immediately without going through appropriate channels. This puts undue pressure on lower level staff, especially in situations where the senior management have not kept us informed of other negotiations relating to the matter we are being questioned on.

It is very disappointing to see official information deliberately distorted, and not have anything done about it.
I think that my agency’s support for the Government would be more effective if the Government did not treat us with suspicion, acknowledged that the Department has valuable knowledge, and was willing to work with the Department rather than against it.
The Government wants evidence [-based] policy advice which I strongly support. The APS needs to educate the Government that such advice will take time to gather and will require patience on the part of the Government. At the moment we appear to be generating policy off the back of press releases.
Canadian approach The recently passed Federal Accountability Act [2007] abolished the practice of ministerial staff being given preferential treatment through placement on a priority list that guaranteed them priority selection for public service appointments after they ceased being staffers; now they have to apply for jobs like everyone else. The Act was silent, however, on public servants who leave the bureaucracy to work for Ministers and wish to return to the public service on a preferential basis. The Public Service Commission expressed reservations about the character and extent of dealings between Ministers’ Offices and these public servants after they return to the bureaucracy and has recommended closer monitoring of the activities of this category of public servant after they return from Ministers’ Offices. A possible model for such reform is a system now in place in Ontario, which forbids such officers from working in Ministers’ Offices for longer than two years (in the case of senior executives, six months), so as to minimise the potential for public servants to become too involved with the Executive branch of government.8
Processes for resolving concerns with requests from Ministers’ offices
Table 8.8 indicates that there has been a substantial increase in the number of agencies reporting that they have agreed on unwritten processes for resolving staff concerns that may arise about the nature of requests from ministerial offices. This year, 72% of agencies reported that they have such unwritten processes in place (up from 56% of agencies in 2004–05). Unwritten processes are much more common than written ones with only 22% of agencies reporting that they have written processes in place (up from 10% of agencies in 2004–05).
Table 8.8: Agency processes for resolving concerns with ministerial offices, 2003–04, 2004–05 and 2007–08
Agency protocol Year % of agencies with protocol in place(a)
(a) Percentage of agencies that provide regular (i.e. monthly or more) services/advice to Ministers.
Source: Agency survey
Agreed unwritten process for resolving staff concerns that may arise about the nature of requests from ministerial
2003–04
NA

Table 8.8: Agency processes for resolving concerns with ministerial offices, 2003–04, 2004–05 and 2007–08
Agency protocol Year % of agencies with protocol in place(a)
offices
2004–05 56
2007–08 72
Agreed written process for resolving staff concerns that may arise about the nature of requests from ministerial offices
2003–04 NA
2004–05 10
2007–08 22
While the increase in agencies that have introduced such processes to assist employees is a positive development, employee awareness that their agency has such processes in place is relatively low. Table 8.9 looks at the levels of employees who have direct contact with Ministers and/or ministerial offices who report that they are aware that their agency has a particular protocol within those large agencies that report having the same protocol in place. The level of employee awareness of unwritten processes for resolving employees’ concerns ranged from 15% to 47% of relevant employees. Surprisingly, awareness levels concerning written processes were even lower (from 17% to 25%). This suggests that agencies need to be much more proactive in ensuring that employees who have direct contact with ministerial offices know about the protocols in place to resolve concerns that may arise about the nature of requests from ministerial offices.
Table 8.9: employees’ awareness of processes for resolving concerns with ministerial offices, 2003–04, 2004–05 and 2007–08
Aware of protocol (% employees)(a)
Agency protocol Year Low High
(a) Results include only those employees who, in the last 12 months, have had direct contact with Ministers and/or ministerial advisers.
(b) The results include only those large agencies (more than 1,000 employees) that report having this protocol in place and that had statistically valid results from the employee survey (10 agencies in 2003–04, 9 agencies in 2004–05 and 10 agencies in 2007–08).
(c) The results include only those large agencies (more than 1,000 employees) that report having this protocol in place and that had statistically valid results from the employee survey (2 agencies in 2004–05 and 3 agencies in 2007–08).
Source: Agency and employee surveys
Agreed unwritten process for resolving staff concerns 2003– 21 33

Table 8.9: employees’ awareness of processes for resolving concerns with ministerial offices, 2003–04, 2004–05 and 2007–08
Aware of protocol (% employees)(a)
Agency protocol Year Low High
that may arise about the nature of requests from ministerial offices(b)
04
2004–05 16 29
2007–08 15 47
Agreed written process for resolving staff concerns that may arise about the nature of requests from ministerial offices(c)
2003–04 NA NA
2004–05 8 32
2007–08 17 25
Other developments
There have been a number of developments in the area of agencies’ interactions with Ministers and their offices in 2007–08. In December 2007, the Government introduced revised Standards of Ministerial Ethics. Among other things the standards emphasise compliance with relevant standards of procedural fairness, appropriate use of resources available to Ministers for public purposes and that ‘Ministers must not encourage or induce other public officials, including public servants, by their decisions, directions or conduct in office to breach the law, or to fail to comply with the relevant code of ethical conduct applicable to them in their official capacity.’9
Another issue relevant to the interaction of agencies and Ministers in 2007–08 occurred in relation to the involvement of public servants in public information campaigns, including the involvement of the Director of the Workplace Authority in the media promotion of the Work Choices legislation, at the request of her Minister, prior to the caretaker period. The Commission has issued new Guidelines on the Involvement of Public Servants in Public Information and Awareness Initiatives.10 These guidelines clarified the roles and responsibilities of public servants and Ministers and will assist future interactions between agencies and Ministers in this area. They make a basic distinction between two types of public information activity. The first is that helping to explain the Government’s policies and programmes is a core responsibility of public servants and includes activities such as working ‘at the counter’ in government shopfronts, speaking at public forums and responding to ministerial correspondence and media queries. The focus is on explaining what the Government’s policies mean and how they operate in practice. Justifying and promoting Government policy, however, is the Minister’s responsibility.
The second type of public information activity involves more proactive campaigns to publicise particular government policy and programme initiatives. Public servant involvement in these types of campaigns involves a significant risk of perceptions of political bias. The

Government’s policy, as made clear in the Commission’s guidelines, is not to use public servants in government media campaigns unless that role is essential in the communication of a public interest or safety issue such as a Chief Medical Officer warning. Agency heads who wish to use public servants in government television, radio, print media or internet-based campaigns must now first seek the agreement of the Australian Public Service Commissioner.
Also in the area of public information campaigns, Finance released in June 2008 Guidelines on Campaign Advertising by Australian Government Departments and Agencies.11 These guidelines will assist agencies in their interactions with Ministers and their offices on this potentially challenging issue as they contain specific guidelines on what constitutes legitimate campaign advertising. Heads of agencies are now required to certify that any proposed campaign complies with the new guidelines and relevant government policies. This includes conducting a cost-benefit analysis in which the nature of the campaign, including the methods proposed, the medium to be used, and the volume of publicity activities envisaged will have to be justified in terms of society’s needs, efficiency and effectiveness.
There will also need to be a clear audit trail regarding decision-making. For those campaigns with expenditure in excess of $250,000 (or where the Minister requests) the Auditor-General is also required to provide a report to the relevant Minister on the proposed campaign’s compliance with the guidelines.
Chapter 7 of this report outlines the new arrangements for more transparent and merit- based assessment in the selection of most APS agency heads that were introduced in February 2008. The appointment of statutory office holders has been, at times, a challenging area of agencies’ interactions with Ministers and their offices. These new arrangements should assist in reducing the difficulties that APS employees have experienced in balancing the values of being apolitical, responsive and accountable.
Finally, ANAO released a report on the operation of the Regional Partnerships Program over the period July 2003 to June 2006. The report highlights the pitfalls that agencies can fall into when interacting with Ministers and their offices on the disbursement of grants. The Regional Partnerships Program operated as a very flexible discretionary grants programme that was aimed at stimulating growth in regional Australia. Funding decisions were taken by Ministers based on advice from the then Department of Transport and Regional Services (DOTARS).
The ANAO report found two aspects of the programme to be of concern:
The flexibility in the application assessment and Ministerial approval processes creates challenges in ensuring transparent, accountable and cost-effective administration and in demonstrating the equitable treatment of applicants; and the manner in which the Programme had been administered over the three year period to 30 June 2006 … had fallen short of an acceptable standard of public administration, particularly in respect to the assessment of grant applications and the management of Funding Agreements.12
Significant changes to the programme were made under the former government after June 2006 in order to overcome these shortcomings. These changes included revising the briefing material to be provided to the Ministerial Committee when considering the departmental assessment of a Regional Partnerships application. The revised material identifies the obligations on Ministers arising under the financial framework, including when considering approving funding for a project that has not been recommended by the Department. The

changes also included, in September 2007, enhanced procedures approved by the Ministerial Committee to manage potential conflicts of interest in respect of projects located in the electorate of a member of the Committee.
Further, ANAO recommended that:
in the interests of accountability, transparency and equity during the assessment and decision-making stages, the Department develop, for consideration by the Ministerial Committee, procedures for recording the participants in and outcomes of any significant meetings or substantive communications that may occur between applicants and Ministers and/or their offices in relation to Regional Partnership applications
the Department appropriately qualify its assessment and advice to Ministers in circumstances where the assessment of a Regional Partnership application was truncated or expedited as, for example, occurred in the lead-up to the 2004 federal election
in light of the Minister’s statutory obligations when approving the expenditure of public money, the Department advise Ministers on any measures considered necessary to effectively manage the risks to the Commonwealth and achieve value for money when acting on election commitments.
The current government has closed the programme and will replace it with the Regional and Local Community Infrastructure Program in 2009. It is expected that the new programme will address the administrative deficiencies of its predecessor.
Strengthening the relationship with Ministers and their offices
This year’s agency survey asked agencies which provide regular (i.e. monthly or more often) services and advice to Ministers to nominate the five most important strategies or approaches they use to strengthen relations with Ministers and their offices. Table 8.10 consolidates these free text responses into a number of categories.
Table 8.10: Summary of agencies’ five most important strategies for strengthening relations with Ministers and their offices, 2007–08 (N=69)
Type of Strategy Agencies
Proportion (%)
Source: Agency survey
Regular meetings 67 96
Coordinated communications and business (including portfolio agencies using departmental liaison resources and ministerial coordination units)
45 62
Emerging or potentially important issues awareness/advice 38 54
Ad hoc meetings 33 48
Updates and briefings on programmes and initiatives 32 45
Provision of agency liaison officers in ministerial offices 28 41
Documented policies and procedures for interactions between 22 32
Table 8.10: Summary of agencies’ five most important strategies for strengthening relations with Ministers and their offices, 2007–08 (N=69)
Type of Strategy Agencies
Proportion (%)
agency and ministerial office and training
Responsiveness, including maintaining awareness of Minister’s activities/policies and providing rapid responses to requests 20 29
Facilitating contact at many levels within the agency and ministerial office 19 28
Clearly defined roles 17 25
Invitations to Ministers to be involved in agency activities, including departmental visits and events 10 13
Quality assurance strategies 7 10
Regular meetings with Ministers and their offices is the most common way of maintaining strong relationships. Coordinating communications and workflow through a ministerial coordination unit and agency liaison officers are also frequently cited as good strategies, especially for agencies within larger portfolio departments. Keeping the Minister abreast of emerging issues through briefings and updates, providing advice on issues and ad hoc meetings were also strategies commonly nominated by agencies. Somewhat surprising is that only 25% of agencies nominated ‘clearly defined roles’ as one of their top five strategies. Defining roles is a very important way of avoiding misunderstandings and maintaining positive relationships between agencies and ministerial offices.
Nonetheless, together the agency responses represent a close approximation of the sorts of detailed strategies and approaches suggested in the Commission’s Supporting Ministers, Upholding the Values good practice guide and ANAO’s Agency Management of Parliamentary Workflow publication.
The only strategy not identified within agencies’ top five, when compared to the guidelines provided in these publications, is the need for active leadership. Leadership in this respect refers to regular reminders and discussions by agency heads with SES employees about the agency’s responsibilities to support Ministers and how to maintain good relationships with ministerial offices and their legislated responsibility to uphold and promote the Values. It also involves agencies adopting the types of strategies reported here and ensuring that these messages are actively communicated to all employees who have contact with ministerial offices.
UK Civil Service reform In a 2007 Green Paper, The Governance of Britain, the UK Government proposed that in 12 important areas the Prime Minister and the Executive should be made more accountable to Parliament through a number of reforms, including the creation of a more independent Civil Service. Consultations on the Bill are underway with key parliamentary committees, the Civil Service Commissioners, the Civil Service unions, specialist parliamentary research bodies and the public.

The chief implications of these reform initiatives for Britain’s public sector are:
placing the Civil Service on a statutory footing instituting pre-appointment hearings by parliamentary select committees before
appointing key public officials a new structure and role for the National Audit Office.13
In his 3 July 2007 statement to the House of Commons on the Civil Service reform proposal, the Prime Minister argued that, under the terms of these changes, ‘To reinforce the neutrality of the civil service, the core principles governing it will no longer be set at the discretion of the executive but will be legislated by Parliament— and so this government has finally responded to the central recommendation of the Northcote-Trevelyan report on the Civil Service made … in 1854.’14
The First Civil Service Commissioner stated that the proposed reforms would not only engender greater Civil Service accountability and transparency, but increase public understanding of, and confidence in, public sector appointments and appeals processes.
Asked whether this would generate fresh dilemmas for civil servants—chiefly, a conflict between this new, formal accountability to Parliament and their ‘ancestral loyalty to ministers’—the Commissioner responded that one of the strengths of the proposed changes is that they address the problems created for civil servants by their ‘informal accountability’ to Ministers.15
Relations with the Parliament There are a number of formal courses for public servants about their rights and obligations in relation to Parliament. The Department of the Senate, the Department of the House of Representatives and the Commission all provide training in this area. Table 8.11 sets out the numbers of employees who attended these courses over the past three financial years.
Table 8.11: Attendance at parliamentary accountability training courses, 2005–06 to 2007–08
Course Year Attendance
Note: Courses are generally open to APS and other Commonwealth employees.
(a) The SES Orientation Programme run by the Commission addresses, among other things, rights and responsibilities as well as the procedures and expectations of parliamentary committee witnesses.
(b) Preparing to Appear Before a Parliamentary Committee is run by the Commission and open to SES and EL employees. It builds upon the relevant section in the SES Orientation Programme.
(c) The Parliament, Privilege and Accountability seminar run by the Department of the Senate is open to SES employees and focuses on the accountability of public servants to the Parliament.
(d) Senate Committees is a seminar run by the Department of the Senate, which provides a

Table 8.11: Attendance at parliamentary accountability training courses, 2005–06 to 2007–08
Course Year Attendance
detailed examination of the structure and operation of the Senate committee system. It is aimed at those who may be required to write submissions for committees, to appear as witnesses before committees or to monitor the progress of committee inquiries.
(e) About Committees, a seminar run by the Department of the House of Representatives, provides detailed information on all aspects of committee work, including types of committees and how they conduct their investigations.
Sources: (a) and (b) Australian Public Service Commission; (c) and (d) The Department of the Senate; (e) The Department of the House of Representatives.
SES Orientation Programme(a) (Commission)
2005–06 164
2006–07 243
2007–08 235
Preparing to Appear Before a Parliamentary Committee(b) (Commission)
2005–06 19
2006–07 45
2007–08 67
Parliament, Privilege and Accountability(c) (Senate)
2005–06 59
2006–07 120
2007–08 51
Senate Committees(d) (Senate)
2005–06 47
2006–07 131
2007–08 35
About Committees(e) (House of Representatives)
2005–06 67
2006–07 49
2007–08 20
Total attendance at above courses
2005–06 356
2006–07 588
2007–08 414
As reported in Chapter 5 of this report, the rate of attendance at the Commission’s SES Orientation Programme, which provides new SES employees with the essential information they need to operate effectively in the APS environment, including their interactions with Ministers’ offices and the Parliament, has increased substantially since last year to around 70%. Given that in 2007–08 25% of newly appointed senior executives came from outside the APS and that a good proportion are unlikely to have any or recent experience in dealing with parliamentary matters (around half of these had previous ongoing experience in the APS), this is an encouraging result and the APS can be fairly confident that these employees are receiving the information they need to represent their agencies to Parliament.

The timing of the 2007 federal election and the associated caretaker period affected attendance at the About Committees course, and the Senate courses appear to have been similarly affected. While total attendance at these courses fell in 2007–08 compared to that in the previous year, it remained higher than in 2005–06 and the preceding three years, which averaged 255 attendees annually, that is, between 2002 and 2005.
This trend is reflected in the number of employees reporting their attendance at formal training courses dealing with their accountabilities, rights and responsibilities to Parliament, both during their careers and in the previous 12 months. Table 8.12 shows that the gap between SES and ELs reporting formal training has widened. This suggests a consolidation of this training into the SES and away from ELs, and possibly a reduction in the number of non-SES employees appearing before committees.
Table 8.12: Proportion of SES and EL staff who have received formal training in accountabilities, rights and responsibilities to Parliament, 2005 and 2008
2005 2008
Classification Yes (%) No (%) Yes (%) No (%)
Source: Employee survey
SES
Received training in career 67 30 70 28
Received training in previous 12 months 13 87 26 74
EL 2 and EL 1
Received training in career 21 72 17 81
Received training in previous 12 months 17 81 21 77
Ninety per cent of agencies indicated that some or all of their SES employees appear before parliamentary committees (excluding Chief Executive Officers (CEOs)). This compares to 94% of agencies in 2005. Given the exclusion of CEOs from the survey, it is not surprising that, while all large agencies have SES attending parliamentary committees, only 79% of small agencies do.
For those agencies reporting that their SES staff appear before parliamentary committees, the agency survey also asks agencies to report on the sorts of measures they have in place to ensure SES staff understand their rights and responsibilities in relation to parliamentary accountability. The most common measure in place is for employees to learn by attending and observing committee processes. Internal briefing and self-nominated training are also frequently reported measures. Large agencies are more likely than small agencies to use all measures except internal briefing.
Figure 8.1 compares the proportion of measures reported by relevant agencies for the period 2002–03 to 2004–05 with this year’s results. For these measures there has been a gradual, general trend upwards since 2002–03, except for voluntary training which fell slightly in relation to the previous two years. This is consistent, however, with the relatively high rates of attendance over recent years at relevant courses run by these parliamentary departments and the Commission.

Figure 8.1: Selected agency measures to ensure SES staff understand their rights and responsibilities in relation to parliamentary accountability, 2002–03, 2003–04, 2004–05 and 2007–08
Source: Agency survey
Key chapter findings The year 2007–08 has been an eventful one for interactions between APS agencies, Ministers and ministerial offices. It covers a period that includes agencies’ interactions with the previous government in the lead-up to the caretaker period, the caretaker period itself and the period where agencies were establishing relationships, protocols and processes with new Ministers and new ministerial staff. The post-election environment has been influenced by the Government’s goal of reinvigorating Australia’s Westminster tradition. The revised Standards of Ministerial Ethics, the Code of Conduct for Ministerial Staff, the reductions in the number of ministerial advisers, additional guidance concerning the involvement of public servants in public information campaigns and new requirements for the approval of government media campaigns have all assisted in clarifying roles and responsibilities. The priority in 2008–09 is to ensure that these new codes and guidelines are embedded into ongoing working arrangements.
There have been other positive developments. The proportion of employees reporting that they faced a challenge in balancing the need to be apolitical, impartial and professional, responsive to government and openly accountable fell significantly compared to that recorded in 2004–05 (the latest period of comparison available). That the fall occurred in an election year is somewhat surprising, but is a good sign. It may be due to a range of factors, including the smaller proportion of staff who reported having direct contact with Ministers and ministerial advisers in 2007–08, and the significant fall in the number of ministerial advisers under the Rudd Government. It is also likely that the Commission’s activities in this area have helped employees to become more confident in balancing these APS Values and have also improved ministerial staffers’ understanding of their roles and responsibilities in interacting

with public servants. The awareness-raising in the earlier half of 2008, prior to the Government’s introduction of the new Code of Conduct for Ministerial Staff in July 2008, would also have had an important impact.
The new guidelines on public servants’ involvement in public information campaigns and agency spending on campaign advertising will also assist agencies in their interactions with Ministers and their offices on these potentially challenging issues.
The growth in the proportion of agencies reporting that they now have protocols to assist staff in resolving concerns that may arise about the nature of requests from ministerial offices is another positive development, although employee awareness that their agency has such processes in place is relatively low. Low levels of awareness of many of the protocols that agencies have in place to guide employees’ interactions with Ministers and their offices in relation to issues such as recordkeeping and quality control was a general problem in 2007–08; there is a strong case for agencies investing more in proactively promoting awareness of these protocols to those employees who have regular contact with Ministers and their offices.
The proportion of agencies that report having established formal evaluation measures to assess the quality of the services and advice provided to Ministers was also relatively low. Given the resources that agencies expend in providing services to Ministers and the importance of forging strong relationships with Ministers and their offices, underpinned by high-quality services and advice, it is essential that more agencies implement mechanisms to enable them to evaluate the quality of their outputs, including how satisfied Ministers are with their services.
1 Hon. Kevin Rudd MP, ‘Address to Heads of Agencies and Members of the Senior Executive Service’, Great Hall, Parliament House, Canberra, 30 April 2008, p. 4, <http://www.pm.gov.au>
2 ANAO 2008, Agency Management of Parliamentary Workflow, Better Practice Guide, Commonwealth of Australia, Canberra, p. 2, <http://anao.gov.au>
3 L. Briggs, ‘Supporting Ministers, Upholding the Values: A Good Practice Guide’ (Publication Launch Speech, 9 March 2006), <http://www.apsc.gov.au>
4 Australian Government, Code of Conduct for Ministerial Staff, July 2008, <http://www.smos.gov.au>
5 The 2008 survey data relates to the current government while 2006–07 annual reports relate to the previous financial year and relationships with the former government.
6 ANAO 2008, Agency Management of Parliamentary Workflow, Better Practice Guide, Commonwealth of Australia, Canberra, Chapter 7, ‘Managing and Reporting Organisational Performance’, pp. 67–75, <http://www.anao.gov.au>
7 National School of Government, Centre for Working with Ministers and Parliament (CWMP), ‘Trust and Confidence in Learning’ (Programme); C. Jary, Working with Ministers, CWMP, Sunningdale Park, Ascot, 200?, <http://www.nationalschool.gov.uk/cwmp>

8 Public Service Commission of Canada, Annual Report 2006–2007, The Commission, Ottawa, <http://www.psc-cfp.gc.ca>
9 Australian Government 2007, Standards of Ministerial Ethics, p. 6, <http://www.pmc.gov.au>
10 Australian Public Service Commission 2007, Guidelines on the Involvement of Public Servants in Public Information and Awareness Initiatives, Circular No. 2007/5, <http://www.apsc.gov.au>
11 Finance 2008, Guidelines on Campaign Advertising by Australian Government Departments and Agencies, Commonwealth of Australia, Canberra, <http://www.finance.gov.au>
12 ANAO 2007, Regional Partnerships Programme: Volume 1—Summary and Recommendations, Performance Audit Report No. 14, 2007–08, Commonwealth of Australia, Canberra, pp. 19–20, <http://www.anao.gov.au>
13 Ministry of Justice, The Governance of Britain, The Stationery Office, London, June 2007, <http://www.justice.gov.uk>. Progress achieved on its key commitments was reviewed in Governance of Britain: One Year On (July 2008).
14 Rt. Hon. Gordon Brown MP, ‘Constitutional Reform Statement’, 3 July 2007, p. 2, <http://www.number10.gov.uk>
15 The Spectator (London), 17 November 2007, pp. 18–19.

Chapter 9: Agency governanceThe Australian National Audit Office (ANAO) and PM&C define governance as:
… the set of responsibilities and practices, policies and procedures, exercised by an agency’s executive, to provide strategic direction, ensure objectives are achieved, manage risks and use resources responsibly and with accountability.1
While there is no ‘one size fits all’ approach to governance, it is important to realise that effective governance will contain the following building blocks:
strong leadership, culture and communication appropriate governance committee structures clear accountability mechanisms comprehensive risk management, compliance and assurance systems strategic planning, performance monitoring and evaluation flexible and evolving principles-based systems working effectively across organisational boundaries.
These building blocks were identified in the Commission’s 2007 publication, Building Better Governance,2 a guidance document for those establishing or reviewing governance arrangements.
Each building block is important in itself, and each agency needs to develop a governance framework that suits its respective role with the building blocks reinforcing each other to enable the best outcomes. The framework also needs to be readily understood and consistent with legislation and government policies. It is important that an agency’s governance framework has a strategic outlook, and is self-evaluating in its approach to enable implementation.
Governance is an issue that has been extensively researched, and guidance has been developed to assist agencies, with publications available from the Commission, ANAO, Finance and PM&C. Independent reviews, such as the recent Equine Influenza Inquiry, also provide lessons for all public servants.
In a speech at the Public Sector Governance Forum on 4 September 2008, Ian McPhee, Auditor-General for Australia, pointed out that ‘Through sound corporate governance, agencies effectively enhance their likelihood of success, and reduce the likelihood of failure.’3
This chapter looks at issues relevant to governance in the APS against six building blocks of effective governance. Issues around the seventh building block—working effectively across organisational boundaries—are examined in detail in Chapter 10.
Key governance developments in 2007–08The year 2007–08 has seen a number of governance developments in the APS. These developments have ranged from government initiatives on the recruitment and performance of

Secretaries and agency heads; re-examination of the Freedom of Information Act 1982 (the FOI Act); a review by the Australian Law Review Commission of the Privacy Act 1988; and reform of the financial reporting and procurement systems of the APS.
The Government’s strong commitment to engaging with the states and territories, communities and the not-for-profit sector to progress its reform agenda, has also resulted in agencies having to consider how they can respond flexibly to incorporate these working arrangements. The proposed development of a Compact between the Government and the third sector, for example, is likely to impact on what measures are used to assess good governance in future years. In addition, there have been specific reviews around governance in particular agencies. The need to embed good governance and to establish a process for continuous improvement of government arrangements, is highlighted once again for APS agencies by the issues identified in the Equine Influenza Inquiry report.
Equine influenza outbreakOn 17 and 20 August 2007, two horses at the Eastern Creek Quarantine Station (NSW) displayed symptoms consistent with equine influenza. All horses residing at Eastern Creek and Spotswood (VIC) Quarantine Stations were tested and it was revealed that a number of the horses housed at both quarantine stations were infected with the virus.
On 22 August, two horses at the Centennial Parklands Equestrian Centre, in the eastern suburbs of Sydney, were identified as having equine influenza. Around the same time a number of other cases were reported throughout NSW and in the outskirts of Brisbane in Queensland. It is believed that a contaminated person or piece of equipment left the Eastwood Quarantine Station enabling the virus to escape.
A national response, involving the Australian Government, State and Territory Governments, and a number of industry organisations, was launched to contain and eradicate the virus.
The outbreak that eventuated was the most serious emergency animal disease Australia has experienced in recent history. At its peak, over 47,000 horses were infected, impacting both horse owners and the supporting industry.
The campaign to eradicate the disease was the largest of its type ever undertaken in Australia, using the latest laboratory, vaccine, surveillance, mapping and communications and information technologies.
On 30 June 2008, Australia was declared to be free of equine influenza, although disease surveillance activities will continue until December 2008 to meet the requirements of the world animal health organisation (Office Internationale des Epizooties) and it is confirmed that Australia is completely clear of equine influenza.
In September 2007, the Australian Government appointed a retired High Court judge, the Hon. Ian Callinan AC to conduct an independent inquiry into the outbreak of equine influenza in Australia. The Equine Influenza Inquiry Report identified a number of matters involving the Australian Quarantine and Inspection Service (AQIS) and the horse industry which may have contributed to the outbreak.

The major areas identified by the report included: the formulation, implementation and monitoring of biosecurity measures; the documentation of, and adherence to, procedures; the roles and responsibilities of employees; the suitability of current quarantine stations; and the effectiveness of AQIS in communicating core requirements.
The Equine Influenza Inquiry Report and the Government’s response to it were released on 12 June 2008. The Government agreed to all 38 of the report’s recommendations, which it intends to implement within two years. A copy of the report and the Government’s response can be found at: <http://www.daff.gov.au/about/publications/eiinquiry>
Governance policies, procedures and structuresEffective governance policies, procedures and structures are essential to the operation of the APS, as they provide the framework within which agencies achieve their business goals. They can also affect public confidence in the capability and integrity of the APS, the ability of agencies to attract high-quality staff, and overall levels of employee satisfaction.
The questions in the employee survey that relate to an agency’s governance have been combined in such a way as to provide a summary assessment of employee views of their agency’s governance structures, procedures and policies. This summary measure, the ‘Governance and Integrity Factor’ achieved an overall satisfaction rating of 68%. This is identical to last year’s figure and generally comparable since most of the questions that go to make up the factor are common to both years.
Nonetheless, satisfaction levels varied across the APS and within particular employment sub-groups. Satisfaction levels ranged from 36% to 84% among agencies with individual agency-specific results. The best performing agencies included Treasury, RET and ATO. Poorer performing agencies on this measure included DHS, DCC and the Federal Court.
Other variation occurs among classifications––SES employees were much more likely to be satisfied with governance (85%), than were APS 1–6 employees (67%). Younger employees (aged under 25 years) were also far more satisfied than other age groups. Interestingly, agency size and employee location (whether inside or outside the ACT) have little effect on employees’ satisfaction with this factor. In terms of the type of work, human resources (HR) employees were most satisfied (77%) and researchers were least so (62%).
Building block 1—Leadership, culture and communication
Strong and effective leadership is a key building block in enhancing agencies’ governance capability. Leaders within the organisation play a critical role in setting the right tone and shaping a culture whereby employees understand their governance responsibilities, and are able to contribute to better governance practices in the agency. Strong and effective linkages between senior and middle managers, coupled with the effective management of poor performance and leaders who are open to ideas and dissenting views are also important in building good governance.
An effective agency culture is also an essential underpinning for good governance. Agency culture is difficult to define, but can be said to be what people experience when they deal with an organisation or work in it—‘the way things are done around here’. Agency culture relates

to shared assumptions, beliefs, values, norms and actions. These collective beliefs shape behaviour.
There is still considerable room for improvement in many of these areas across the APS. Employees’ perceptions of their senior leaders continue to be stable at lower than desirable levels, for example, although 57% of employees agreed that the senior managers in their agency lead by example in ethical behaviour, only 35% agreed that their senior leaders are receptive to ideas put forward by other employees. There also continues to be a disconnect between EL 2s and their SES which needs to be addressed (see Chapter 5 for further discussion of leadership issues). Employee satisfaction with the way underperformance is handled has also remained stable at low levels (24% of employees agreed that their agency deals with underperformance effectively). Although these aggregate results suggest that there is a need for service-wide improvements, the wide variation in agency-specific results in many of these areas also suggests that some agencies have made considerably more progress than others.
In addition to these results, the factor analysis of satisfaction with a range of issues related to employee engagement includes a summary of employees’ views about agency culture.4 The overall rate of satisfaction or agreement with Agency Culture was the lowest of all the factors at 27%.5
Employee satisfaction with the Agency Culture factor varied for different segments of the workforce. Employees in small agencies were more satisfied with Agency Culture than those in larger agencies, as were SES employees (45%) compared to around 25% for EL and APS 1–6 employees. Employees working in policy and administrative support or clerical roles were most likely to be satisfied, and those working in legal and programme design and/or management least satisfied. The wide variation in the results for agencies with individual agency-specific results, 14% to 52%, suggests that it is possible for many agencies to improve their culture and that some agencies have a problem in need of immediate attention.
In his speech at the Public Sector Governance Forum, Ian McPhee, Auditor-General for Australia, said:
… through organisational leadership and investing in staff development, we are able to positively influence the culture of the organisations we work in so that there is a close match between the image we convey in our corporate documents and the reality of the way we work on a daily basis. And we need to monitor the effectiveness of our arrangements over time. In this context, I expect we will see Audit Committees taking a stronger interest in the well-being of agencies’ governance arrangements; that is, they are working as expected, and improvements are being made in the light of agency, APS or private sector experience.6
To this end, agencies’ Audit Committees should review their agency culture results. Frequent and consistent communication with all employees about their objectives and responsibilities is the final component of the first building block of effective governance. Agencies continue to report high levels of communication of governance issues to employees. Almost all agencies indicated that they have policies and procedures in place to ensure all staff are kept informed about updates, changes or revisions that relate to financial and other delegations, and that Chief Executive Instructions (CEIs) are available to all staff. Most agencies (92%) also had policies and procedures in place to ensure all staff have access to information that outlines the agency’s decision-making processes and/or relevant committee structures. The likelihood of

having these policies and procedures in place was similar across agency size bands, and was consistent with previous years’ results.
Given the continued high levels of communication reported by agencies, it is surprising that employees’ awareness of such policies and processes is not higher. Seven out of 10 employees agreed that their agency provided them with information about updates, changes or revisions that relate to financial and other delegations, and almost six out of 10 agreed that this was the case for agency decision-making processes. These results are consistent with those from last year and like agency responses, employees’ agreement levels were similar across agency size bands.
Although these results suggest fairly high levels of awareness among staff of important governance issues, there is still room for improvement and existing approaches to communication should be examined. One key area where communication may be enhanced is through more effective communication between senior leaders and other employees. Only one-third (35%) of employees agreed that communication is effective between senior leaders and other staff, with a further 35% disagreeing that this is the case.
Building block 2—Appropriate governance committee structures
The second building block of effective governance is the establishment of appropriate governance committee structures. All agencies use committees to support the agency head in decision-making and governance arrangements. Some committees are mandatory (such as those for audit and occupational health and safety) while others are discretionary and agency-specific, reflecting the particular governance needs of agencies. The appropriate committee structure for an agency depends on its size, its functions, the complexity of its responsibilities, its geographic dispersion and its risk profile.
Responses to last year’s agency survey showed that agencies had a number of different governance committees in place. Almost all agencies utilised audit, occupational health and safety, and senior management committees as part of their governance systems while over two-thirds used workplace consultation/relations committees. The likelihood of using more specialised committees generally increased with agency size.
It is good practice for agencies to establish and retain only those committees that contribute to the effective and efficient running of the organisation. Each committee should have a clear purpose and a clear sense of its strategic obligations. Where committees are established for specific purposes or projects, their viability should be reconsidered when projects are completed or after a predetermined interval.
Agencies were asked whether they had reviewed their governance structures during 2007–08. Seventy-six per cent of agencies reported that they had done so (up from 73% last year).
Agencies were also asked about their reasons for conducting reviews. The review was part of a regular process for almost 60% of agencies, a similar result to last year. DIAC, for example, reported in the agency survey that it:
… reviews its key governance committee structures and membership each year. The structure of the key governance committees was modified on 1 July 2007 as a result of a departmentally commissioned independent review of its governance arrangements that

occurred in 2006–07. That review found that substantial improvements have been made to the department’s governance systems, processes and structures, indicating that the importance placed on cultural reform, behaviours and standards, accountability and stakeholder engagement in the department has been beneficial. Further improvement in … governance arrangements were progressively implemented during 2007–08 following recommendations from that review, including better education of staff on governance, clearer lines of accountability and a more strategic focus on departmental priorities.
Other reasons nominated for reviewing governance structures included examining ways of improving the governance capability of staff (44%), and responding to problems identified with existing frameworks (25%).
A number of agencies also reviewed their governance structures in light of machinery of government changes brought about by the change in government, and the need to address new priorities. DEEWR, for example, reported fundamental changes to its predecessor department’s governance, including:
Reprioritisation of resources and functions to implement new policy initiatives as a result of election commitments; changes to practices as part of continual improvement and as a result of regular internal and external review processes; review of structures, functions and processes to reflect machinery of government changes and, [subsequently, of the] Outcomes/ Output structure.
Several agencies also reported reviewing governance due to transitions from the Commonwealth Authorities and Companies Act 1997 to the Financial Management and Accountability Act 1997 coverage following the Review of the Corporate Governance of Statutory Authorities and Office Holders (Uhrig Review) (2003).
Agencies also reported making a range of specific changes as a result of reviewing their governance arrangements. The Child Support Agency (CSA), for example, reported that it:
… implemented a new range of governance committees to assist and improve agency decision-making and governance … updated its strategic risk review and improved its risk management framework ... commenced the development of a new fraud control plan … participated in DHS reorganisation that generated further adjustments to the governance structure to meet the Secretary’s needs.
As a result of the inquiry into the Equine Influenza outbreak, AQIS has established two new committees:
A Horse Industry Consultative Committee has been established to advise AQIS on horse import and export issues. The committee, comprising major horse importers and airport representatives, also has members from the:
Australian Horse Industry Council Australian Racing Board Equestrian Federation of Australia Australian Harness Racing Thoroughbred Breeders Association Australian Veterinary Association.

The second new committee, an Expert Group, chaired by the Commonwealth Chief Veterinary Officer and comprising representatives from the Animal Health Committee, the Australian Health Laboratory and the Equine Veterinarians’ Association, has been appointed to advise on biosecurity containment and animal health and safety issues at Sydney and Melbourne airports, as well as transfer arrangements to and from facilities at the Eastern Creek (NSW) and Spotswood (VIC) animal quarantine stations.
Further consultation between government and industry has also occurred through the recent National Equine Influenza Summit, held on 25 September 2008.
Case study: Governance structures in AusAIDThe Australian Agency for International Development (AusAID) is the agency responsible for planning, coordinating and managing Australia’s overseas aid programme. The agency is undergoing a major transformation, which is being driven by two significant developments in its operating environment: a focus on improving the effectiveness of aid, particularly through how it is delivered; and a significantly increasing aid budget, which the Government has committed to raising from its current level of 0.3% of Gross National Income (GNI) to 0.5% of GNI by 2015.
To deliver aid more effectively, the agency is moving away from ‘traditional’ projects managed by contractors to a model based on partnering arrangements. As well as working more closely with other donors to ensure better harmonisation of aid activities, it is making greater use of sector-wide approaches, which involve working jointly with partner governments and other donors in a particular sector. These approaches are rather more complex than the traditional model and it is more difficult to measure the direct impact of Australian support. At the same time, the proposed increases in the aid budget require ‘scaling up’ of programmes, which is likely to attract increased scrutiny and further pressure to demonstrate results and effectiveness.
To support this new way of working, AusAID needed to ensure it had a strong governance framework in place including, crucially, a forward looking strategy for managing change. It also needed to improve its capacity to measure performance in a more complex operating environment and to establish a strong corporate spine to support the delivery of an effective aid programme.
The agency embarked upon a staged restructuring process, which recognised the need for a strong centre in Canberra to set strategic directions, support the aid delivery function and manage the risks posed by the shift to a predominantly offshore operating state, with an expanded role for country offices and an increased number of people located overseas. To strengthen the aid programme’s access to sectoral expertise, a range of technical or thematic groups (e.g. health, economic, gender, education, rural development, infrastructure, governance, environment) were established. In addition to providing technical support, the groups play a critical role in ensuring the contestability of programme design and review.
An Office of Development Effectiveness (ODE) was also established within AusAID to monitor programme quality and effectiveness and provide robust assessment and review processes. ODE reports directly to the Director-General and is oversighted by a Development Effectiveness Steering Committee comprising the Deputy Secretaries of key departments.7

ODE prepares an Annual Review of Development Effectiveness report which assesses the effectiveness of all Australian overseas development assistance. The report is publicly available and is an important mechanism for demonstrating to Australian tax-payers the transparency and accountability of the aid programme.
As well as setting up the Development Effectiveness Steering Committee, the agency reviewed its existing internal management committee structure to ensure that existing committees had the right membership and appropriate terms of reference for the new environment, and that new committees were created in relation to knowledge management and resourcing.
AusAID’s corporate functions were strengthened to support the increased overseas presence, for example, by establishing a dedicated corporate enabling division to strengthen operations in Canberra, and internationally by creating designated corporate positions for all large overseas offices.
AusAID is also mapping its core business processes. Rigid quality assurance, peer review and user-testing methodologies are being applied to produce a standardised, quality controlled set of simple instructions with mandatory steps that apply to all staff in all locations. These processes, which are being progressively released, will manage risk, assure quality, increase efficiency and meet the needs of a mixed workforce in several global localities with cultural and language diversity.
Building block 3—Clear accountability mechanisms
One of the key areas of failure identified in the Equine Influenza Inquiry report was the lack of clear internal accountability structures for adherence to policies and procedures within AQIS. Managers and staff assumed that instructions were being followed and that systems and processes were being adhered to, but failed to undertake the appropriate checks. This extended from the front line operation of the quarantine station to regional senior management being unaware of their responsibility to ensure that key operating instructions were being carried out.
Procedures relating to the quarantine of horses, for example, required farriers, grooms and other visitors to quarantine stations to change and shower before leaving the facility, but did not explicitly state that staff were required to enforce this process, and as a result no one was made to wear protective clothing or shower. Nor was anyone in the regional office clearly responsible for identifying and reporting to the central office that instructions and procedures were being implemented in the region.
In response to the failure of existing accountability structures, Standard Operating Procedures within AQIS are being amended, and additional documentation developed to make it clear what actions are required, and who is responsible for enforcing and reporting compliance. Greater training and more supporting information are also being provided to staff. An SES officer within DAFF has also been given responsibility for the importation of horses into Australia to ensure senior management ownership of the process.

Financial budget reform
In addition to internal accountability structures, agencies also operate within a comprehensive budget accountability framework. In 2007, work was undertaken to improve the financial management and reporting systems of the Government in order to improve the Budget accountability arrangements for all agencies. Portfolio Budget reports have been redesigned to increase transparency and, through the Council of Australian Governments (COAG), the financial arrangements with the states and territories are being overhauled with the focus on measuring performance and achieving outcomes.
Operation Sunlight was implemented to enhance the transparency, accountability and operation of the Budget, and resulted in changes in the 2008–09 Budget. The objectives of Operation Sunlight include: improving the readability and usefulness of Budget papers; improving the transparency of estimates; improving intergovernmental reporting; and tightening the current outcomes and outputs framework.
Budget Paper 1 (Budget Strategy and Outlook) introduced additional information on major programmes and a single set of financial statements. Budget Paper 4 (Agency Resourcing) provided summary level information on Special Appropriations and their estimates, as well as a register of the Special Accounts of agencies. Portfolio Budget Statements were redesigned, to enhance the focus on the planned performance of agencies, and include for the first time an Agency Resource Statement to provide Parliament with information on the resources available to an agency, regardless of the source.
The Government also asked then Senator Andrew Murray (former Senator for WA), to undertake a broad review of budget transparency, including Operation Sunlight.8 Mr Murray’s report is being considered by the Government.
Finance continued the Gateway Review Process (Gateway) for agencies covered by the Financial Management and Accountability Act 1997 to ensure successful delivery of high-risk projects. Twenty-two reviews over 19 projects were conducted in 2007–08 and 54 reviews have been completed since Gateway commenced in July 2006.
A ‘Two Pass’ Budget review process for major non-Defence proposals also commenced in June 2008. It applies to new programme and policy proposals with high risks in terms of technical complexity, skilled ICT workforce supply requirements or schedules, and where the project includes an ICT cost of $10 million or more. The information from the ‘Two Pass’ process will form the basis of an ICT investment database (for tracking activity and identifying agency ICT investment intentions).
A key area of attention in Budget arrangements in recent years has been the effective management of whole of government initiatives, including the availability of cross-agency reporting against government priorities. This issue is dealt with in Chapter 10 of the report.
Commonwealth-State financial relations
A new framework for Commonwealth-State Financial Relations was agreed at the 2008 March COAG meeting and will commence on 1 January 2009 (the new national healthcare agreement will commence on 1 July 2009). All aspects of the new framework will be underpinned by a new Intergovernmental Agreement.

Under the new framework, the Commonwealth will reduce significantly the number of payments for specific purposes, without reducing the overall quantum of payments. The states will continue to receive general revenue assistance, including all GST revenue, but payments for specific purposes (which currently number more than 90) will be rationalised into a much smaller number (five or six). These new specific purpose payments (SPPs), which are to be supported by new national agreements, cover healthcare, early childhood development and schools, vocational education and training, disability services, and affordable housing. National Partnership payments will also be introduced to support the delivery of specified projects by the states and to facilitate or reward reforms of national importance.
The COAG Reform Council will also have an expanded role in relation to performance reporting and the assessment of whether predetermined performance benchmarks have been achieved before National Partnership reward payments are made.
Reforms in procurement
Procurement is one of the tangible ways the public service deals with non-government organisations (NGOs). A well-structured, well-governed, process provides clarity for providers dealing with the APS (regardless of APS agency). This also promotes accountability, the achievement of value for money in procurement decisions, and continual improvement from previous lessons learned.
It is one of the Government’s priorities to ensure it gets value from the expenditure of public monies, not only in terms of price, but also with regard to quality and service. For this to occur, it is important that the public service has the capability to centrally coordinate procurement where aggregated purchasing makes sense, and to manage big ticket procurements—from purchase to implementation to service delivery.
On 10 October 2008, the Government released the revised Commonwealth Procurement Guidelines (CPGs) which take effect from 1 December 2008. The CPGs represent the policy framework under which agencies govern and undertake their own procurement, and inform departments and agencies about the new Coordinated Procurement Contracting Arrangements. The revised CPGs can be found at: <http://www.finance.gov.au/publications/ fmg-series/procurement-guidelines/index.html>.
The framework will apply to Australian Government departments and agencies that are subject to the Financial Management and Accountability Act 1997. Agencies subject to the Commonwealth Authorities and Companies Act 1997 will be able to access coordinated contracts where appropriate. Where they are established, use of coordinated contracts will be mandated for Financial Management and Accountability Act 1997 agencies.
Finance has begun by initiating a number of scoping studies on procurement for both ICT and non-ICT goods and services. The scoping studies themselves will further define the exact goods and services that will be subject to coordinated arrangements.
Apart from ICT, other key areas being examined include:
travel and related services telecommunications office machines

accounting services desktop computing services Microsoft products.
Innovation and procurementOn 9 September 2008, the National Innovation System Review Panel submitted its report on Australia’s innovation system, Venturousaustralia: Building Strength in Innovation.9 The report is designed to prepare the ground for a partnership— between industry, the research sector and government—dedicated to creating a pervasive culture of innovation.
One of the recommendations of the report focused on improving government procurement practices by:
actively managing its ability to enable and demand innovation in procured services and products given its significant presence as a major purchaser
being more open to risk sharing in relation to innovation pursuing forward purchasing commitments as a means of fostering more innovative
approaches to government procurement working with the States and Territories to implement a pilot small business innovation
contracting programme, based on similar programmes in the USA, in order to strengthen the growth of highly innovative firms in Australia. If an advocate for government innovation is created (as recommended separately in the report) it would be envisaged that the position would operate as a source of expertise and provide seed funding for resourcing such approaches to procurement.
AusTender redevelopment
A major upgrade to AusTender, the Australian Government’s web-based procurement information facility, was launched on 1 September 2007 and represents the culmination of more than two years of system development and business process adjustment in collaboration with Australian Government agencies.
AusTender allows agencies to comply more easily with their procurement reporting obligations, and improves access to information about awarded contracts and the transparency of procurement processes in general. As the central source of Australian Government procurement information, AusTender is now positioned to support the planned rationalisation of procurement reporting regimes, consistent with the requirements of the Parliament.
Recordkeeping
Effective recordkeeping is essential in enabling agencies to meet their accountability obligations to the Government, Parliament and the Australian public. The maintenance of effective recordkeeping systems allows agencies to demonstrate that due process has been followed in their actions and decisions. It allows the Government to keep track of what it has done, so that future activities can be examined on the basis of comprehensive and accurate knowledge of what has occurred and what has been decided in the past. It should be a fundamental function of all APS agencies.

The need for effective recordkeeping has been highlighted by ANAO which has, in recent years, undertaken a number of audits to assess the effectiveness of APS recordkeeping practices and by the Management Advisory Committee (MAC) in its 2007 report, Note for File: A Report on Recordkeeping in the Australian Public Service.10 In response to the MAC report’s finding that the Designing and Implementing a Recordkeeping System (DIRKS) process was a barrier to effective recordkeeping in the APS, the National Archives of Australia (NAA) developed a new, more efficient one-step approach to obtaining a records authority. Since the development of this new approach, NAA has assisted 26 agencies to transition from the previous process.
The first project solely to use the new approach, with the Office of the Commonwealth Ombudsman (the Ombudsman), was completed in September 2008. The project confirmed that a single step submission focusing on higher-level core business was quicker and more practical for both the agency and NAA. The new approach, which complies with the Australian and International Standard for Records Management, allows agencies the flexibility to target the categories of records of greatest concern.
This year’s agency and employee surveys continue to monitor the range of measures used to improve recordkeeping based on the recommendations of the most recent ANAO report11 and the views of employees. In 2007–08, almost all agencies (98%) had at least one measure in place to improve recordkeeping with 86% reporting that they had four or more measures in place. Figure 9.1 provides a summary of the recordkeeping measures used by agencies in
2007–08 compared to those used in the previous year. The most common measures were: policies and/or guidance to assist employees understand the information that needs to be created, received and maintained in agency recordkeeping systems (78% of agencies); specific training to assist record creators and users to meet their recordkeeping responsibilities (74%); and contingency arrangements aimed to ensure in a disaster that vital records are available to enable the agency to resume business (73%). Most progress had been made in agencies identifying vital records (electronic and paper) as part of business continuity planning processes (56%, up from 42% in 2006–07).
Although the number of agencies using a recordkeeping strategy that identifies the agency’s needs over the next three to five years had increased (36%, up from 30% in 2006–07), it was still the least common measure.

Figure 9.1: Recordkeeping measures used by agencies, 2006–07 and 2007–08
(a) One medium agency that did not provide a response to this question is included in the denominator.
Source: Agency survey
In general, large agencies are most likely, and small agencies are least likely, to have a recordkeeping measure in place. In particular, large agencies are much more likely than other agencies to have compliance assessments (i.e. audits) (83% compared to 48% for other agencies); a strategy that addresses current agency-wide recordkeeping responsibilities (83% compared to 52% for other agencies); and a commitment to recordkeeping that has been included in the agency’s high-level strategic documents (e.g. corporate plan) (79% compared to 55% for other agencies). Agencies were also asked about the processes used to store corporate emails, that are useful or important records,12 as the official corporate record in the agency. The responses show that agencies continue to rely on traditional practices designed

for paper records with most agencies (90%) printing and filing into registered paper correspondence files. However, there is also recognition that an increasing proportion of records are being created electronically and this can be seen in the continuing growth of saving into a corporate Electronic Document and Records Management (EDRM) system (46% of agencies, up from 40% in 2006–07).
While the use of electronic systems has improved many aspects of work in the APS, it has also made it easy for agencies to adopt more ad hoc or substandard recordkeeping practices. Records stored in hard drives, personal email folders or the shared folders of individual public servants or workgroups is not uncommon. Of concern is that in 2007–08, a high proportion of agencies still store corporate emails that are useful or important records in personal email folders (60%), in shared drives (56%) and in personal drives (32%) (see Figure 9.2). Smaller agencies were particularly prone to this, perhaps reflecting the greater cost of developing more formal recordkeeping systems for small agencies.
Figure 9.2: Agency recordkeeping practices to store corporate emails, 2005–06 to 2007–08
Source: Agency survey
Consistent with the relatively high number of recordkeeping measures used by agencies to improve recordkeeping, most employees (87%) continue to consider good recordkeeping practices to be very important. Employee views about the support provided by their agency were similar to last year’s with most employees agreeing that their agency provides adequate equipment, facilities and/or storage to enable them to meet their recordkeeping responsibilities (72%), and that they receive appropriate training and/or have access to information that enables them to meet their recordkeeping responsibilities (69%).
On the other hand, although agreement levels were still quite high, employees were slightly less likely to agree that they understand their responsibility in relation to creating and maintaining records (86%, down from 89% in 2006–07) and think that an important aspect of their job is meeting their recordkeeping responsibilities (77%, down from 80% in 2006–07).

Views of employees regarding the time available for recordkeeping are even more negative this year with only 54% agreeing that, given their work demands, they have enough time to meet their recordkeeping responsibilities (down from 58% in 2006–07). Also of concern is the decrease in the proportion of employees who agree with the statement that in the last 12 months, recordkeeping practices in their agency have generally improved (44%, down from 48% in 2006–07). This suggests that even though agencies have been active in adopting measures to improve recordkeeping, their practical implementation may not be so successful.
Views on whether agency recordkeeping practices had improved over the last 12 months varied widely within agencies, with individual agency-specific results ranging from 14% to 66%. Employees’ views also varied between groups. Employees from small agencies tended to be less positive (38%) than those from medium (43%) or large (44%) agencies as were EL and SES employee views compared to those of APS 1–6 employees (38% compared to 46%), and employees in the ACT compared to those outside the ACT (40% compared to 46%).
It seems that, in spite of the high priority agencies have given to recordkeeping and the fact that employees themselves generally recognise the importance of recordkeeping, employees still don’t have enough time to perform these functions adequately nor do they feel that recordkeeping in the agency has improved. Unlike other employee views of recordkeeping, the issue of having enough time to perform this task is consistent across all agency sizes. It may be that employees’ views will improve as more efficient and effective electronic systems are introduced to relieve the burden. Agencies, however, cannot rely solely on this but must continue to provide support and commitment from senior management in order to ensure that recordkeeping becomes an integral part of an agency’s governance processes.
Freedom of Information
It is worth noting in the context of accountability the reforms that the Government will be making to the FOI Act. The Government plans to release an exposure draft of FOI reform legislation for consultation early in 2009. It will include the establishment of an FOI Commissioner and other measures to improve and streamline the FOI Act. As a first step, however, legislation will be introduced in 2008 to abolish conclusive certificates. This will remove the power of Ministers to use such certificates to refuse access to documents despite a decision by the Administrative Appeals Tribunal (AAT) that the documents should be released.
As FOI access is improved, APS agencies will need to take care not to stifle creative and innovative policy debate within the APS. Public servants should not become reluctant to provide frank advice, particularly in writing, to their Minister in case it becomes publicly available or to reduce their recordkeeping standards.
Lobbying Code of Conduct
Recently, a new measure was introduced to manage APS relationships with lobbyists. The Government’s Lobbying Code of Conduct came into operation on 1 July 2008, and is intended to ensure that lobbying activities are carried out ethically and transparently and that Government representatives who are approached by lobbyists are aware of the interests they represent. The Lobbying Code applies only to ‘third party’ lobbyists, that is, those who lobby professionally on behalf of others. It does not apply to people who are directly employed by a particular firm or organisation, nor does it apply to NGOs and charities, for example. The

Lobbying Code’s definition of Government representatives covers APS employees and Australian Defence Force (ADF) personnel as well as Ministers and their advisers, so it will apply to all contact APS employees have with lobbyists.
Lobbyists also need to join the new Register of Lobbyists, an online facility that will provide details of the clients and interests the lobbyists represent. Lobbyists will be required to inform the Government representatives they approach that they are lobbyists, that they are registered, the name(s) of their clients and the issues they wish to raise. Failure to comply with the Lobbying Code could mean removal from the Register.
Agencies will need to develop frameworks and processes to manage contracts with lobbyists that ensure the Lobbying Code has been observed. Agency staff will need to be made aware of the Lobbying Code, and their obligations in dealing with lobbyists; they will also need to know about the Register of Lobbyists and how they may access it. Where breaches occur, a process should also be in place for a report to be made to the Secretary of PM&C.
Building block 4—Comprehensive risk management, compliance and assurance systems
Risk management is fundamental to any organisation’s approach to achieving its objectives and improving performance. It involves agencies being aware of the risks that could be potentially harmful to their business, implementing strategies to effectively monitor and deal with these risks, and also identifying and seizing potential opportunities that emerge through risk management activities.
Over the last three years there has been a gradual increase in the proportion of agencies with policies and procedures in place to ensure that appropriate assessments of risk are made. In 2007–08, almost all agencies (97%) had such policies and procedures in place. However, awareness among employees remained consistent with levels in previous years (this year, 71% of employees agreed that their agencies had such policies and procedures in place). A slightly lower proportion of employees (67%) agreed that generally employees in their agency assess risk appropriately—this represents an improvement on the 62% of employees who agreed last year that this was the case.
Comcover’s Risk Management Better Practice GuideComcover, which is administered by a branch of the Department of Finance and Deregulation, is the Australian Government’s general insurer. Comcover provides insurance and risk management services to all General Government Sector agencies and the High Court of Australia. A key objective of Comcover is to promote best practice risk management in order to improve policy formulation and the delivery of government programmes and services. To this end, Comcover delivers a range of education and assessment programmes.
In June 2008, Comcover released its Better Practice Guide: Risk Management.13 The Guide provides advice to agencies on the key principles and concepts to be considered when developing and implementing an enterprise-wide approach to the management of risk. The Guide emphasises the importance of developing a culture of positive risk management as well as providing a summary of the key requirements and obligations relating to the management

of risk, as contained within the Australian Government financial management framework, including legislation, policy and other related guidance material.
The Better Practice Guide: Risk Management identifies five key elements which underpin an effective framework for managing risk in an agency. It outlines why each element is important and provides practical tips on implementation. The five key elements are:
risk management policy and objectives accountability and responsibility integration review and evaluation positive risk culture.
To support the concepts discussed in the Guide, Comcover will continue to develop and release a range of better practice guidance material. This will include case studies and fact sheets providing further practical examples that illustrate and promote good risk management practice within the APS.
The importance for effective compliance and assurance systems was highlighted in the Equine Influenza Inquiry report, which found that operational manuals covering horse quarantine had not been finalised and that staff in key positions were unaware or had not read core operational instructions. The report also found that, while management used the intranet as the key channel for disseminating instructions and procedures, none of the operational staff regarded the intranet as a useful or authoritative source.
As the report’s author, Hon. Ian Callinan stated, ‘the existing systems … including business plans, business plan reviews and any requirements for audit—did not bring to the attention of senior management the fact that nationally promulgated and documented work instructions for the quarantine of horses were not being implemented.’14
DAFF developed an Equine Influenza Inquiry Response Plan to implement the Government’s response to the Equine Influenza Inquiry report. DAFF has adopted a project management approach with the recommendations of the report being translated into a number of project deliverables. By focusing on deliverables rather than recommendations DAFF is better able to track and assess progress with implementation, especially where one body of work addresses multiple recommendations.
The implementation plan articulates clearly who is responsible for achieving each deliverable, and also contains a detailed communication plan for ensuring that the management of animals in quarantine is improved. The full implementation report can be found at: <http://www.daff.gov.au/aqis/about/eiimplementation>
Progress has been made in implementing the Equine Influenza Inquiry Response Plan, including:
appointment of an interim Inspector-General of Horse Imports, Dr Kevin Dunn amendments to import conditions inspection of pre-export quarantine facilities revision of work instructions upgrade of the facilities at Melbourne and Sydney airports.

As recommended in the Equine Influenza Inquiry report, an independent expert, Professor Peter Shergold AC, has been engaged to oversee the process of implementing the recommendations in the Commissioner’s report and to provide regular external assessments on progress to June 2010. In addition, an external independent audit will be undertaken two years after implementation of the response.
In response to one of the recommendations in the Equine Influenza Inquiry report the Government has instigated a separate review into Australia’s quarantine and biosecurity systems, which is chaired by Roger Beale AO, and is underway.
Conflict of interest
As public servants, it is critical that APS employees are aware of and manage conflict of interest issues. It is also important for agencies to have effective measures in place that help employees achieve this objective. Failure on the part of agencies or employees to manage conflicts of interest is both a real and a reputational risk for the APS.
The agency survey asks agencies to report on the number, type and outcome of Code of Conduct investigations they have undertaken during the previous financial year. One type of investigation is into suspected breaches of Clause 7 of the Code: An APS employee must disclose, and take reasonable steps to avoid, any conflict of interest (real or apparent) in connection with APS employment. Breaches as a proportion of the total number of APS employees remain extremely low (less than 0.05%), suggesting that agencies’ communication of the need for employees to act in accordance with the Code and some high-profile initiatives, such as Centrelink’s 2005–06 clampdown, have been successful in getting the message across to employees.
This outcome may be a result also of agencies’ greater use of measures to ensure compliance with requirements to disclose and avoid conflict of interest. Figure 9.3 below shows that this increasing trend in the use of such measures has been maintained in 2007–08 and in some areas accelerated. This may in part be due to the policy of the current government to revitalise the Westminster tradition and some of the initiatives arising out of it. The large increase in agencies reporting a policy on employment after leaving the APS (62%, compared to an average of around 50% for previous years) may reflect aspects of the new Lobbying Code of Conduct which contains provisions regarding post-separation employment.

Figure 9.3: Measures used by agencies to raise employee awareness of conflict of interest obligations, 2003–04 to 2007–08
Source: Agency survey
Almost three-quarters of agencies have four or more measures in place. All large agencies have five or more measures and only one of the smallest agencies reports having no measures at all.
The high level of activity in this area is reflected in employee awareness of these measures. In 2007–08, 74% of employees reported that their agencies had policies and procedures in place to assist employees to manage conflicts of interest.
Building block 5—Strategic planning, performance monitoring and evaluation
All governments seek to have the most effective public service possible to help them meet the challenges of today’s complex policy and service delivery environments. In responding to these challenges, public service agencies need to be agile—to be able to respond quickly to changing agendas and to the fast-moving pace of the operating environment—while operating within the legislative and governance framework.
The APS has a number of processes for examining governance in an agency:
independent reviews after an agency experiences difficulties (like the Equine Influenza Inquiry Review)
Finance’s Agency Function and Financial Reviews that focus on agencies experiencing financial difficulties
ANAO’s assessments that relate to specific areas of public administration.
No single benchmark has yet been developed to measure the performance and capabilities of different agencies, and thereby provide the Government with a considered and fair

comparative picture of actual and relative agency performance, ideally followed by the establishment of a process for monitoring improvement.
Lessons from ANAO auditsIn his speech at the Public Sector Governance Forum on 4 September, Ian McPhee, Auditor-General for Australia had some messages for public sector managers arising from audits undertaken by ANAO:
good process delivers good outcomes investment upfront is more cost-effective than ‘recovery action’ sound risk management (at the enterprise, divisional and project levels) is no longer
discretionary project methodologies are designed to facilitate risk management regular reporting and monitoring allows for performance expectations to be confirmed
or adjustments to be made where required in contracting out, ensure the incentives for the private sector are appropriately aligned
to the programme or project objectives be alert to cost-shifting in other jurisdictions where federal programmes complement
state or local government programmes.15
In October, 2007, the Commission released the ‘Contemporary Government Challenges’ series to draw attention to and stimulate debate about key issues impacting on a sustainable and high-performing APS, and to provide practical ideas and guidance. One of these papers was on agency health.16 The paper outlined that high levels of corporate health are directly linked to high levels of overall performance, which in turn allows agencies to deliver the outcomes required by government.
Case studies were used to identify key indicators of corporate health, and a checklist was developed to assist in identifying early warning signs before organisational performance has been affected. The checklist focused on several matters, including organisational direction, leadership, organisational capability, corporate governance processes, relationships and integrity, and agency culture.
The focus on agency health was reinforced by presentations by Commission staff to the Comcare National Customer Seminar Series which were attended by over 1,000 delegates across Australia. Presentations covered key messages on agency health and relevant findings from the State of the Service report.
UK Capability Reviews ProgrammeIn late 2005, the UK Civil Service launched the Capability Reviews programme as part of the wider reform of the civil service in the UK. The programme is administered from within the Cabinet Office by the Civil Service Capability Group, and consists of all agencies being reviewed every two years by a team of public servants and experienced people from outside government. The programme is designed to assess how well-equipped departments are to meet their delivery challenges and provide targeted support to make any improvements required in three key areas—leadership, strategy and delivery.

Interim reports indicate that most departments have welcomed this process as an opportunity to improve their capabilities. Corporate leadership is an area against which there has been the most progress with senior civil servants being held accountable by the Cabinet Office which, in turn, offers central leadership and support through performance management initiatives benefiting new directors. In an attempt to address gaps in people skills and capabilities, departments have enhanced their human resources sections and introduced new appraisal systems and skills audits. In addition, the Cabinet Office launched a new Skills Strategy for Government in April 2008 to raise skills.
In the area of delivery and performance, while departments are taking a more strategic approach to priorities and relationship management, an understanding of current delivery models is needed to inform policy decisions that involve organisational change. To date, all agencies have been reviewed once and, when the second rounds of agency reviews are undertaken, performance against the initial review findings will be incorporated into the reports, and Secretaries held to account for performance improvements.
An evaluation of the programme in 2007 found that the reviews had provided a catalyst for change, with capability issues being discussed more widely and openly.
Building block 6—Flexible and evolving principles-based systems
CEIs and other such ‘rules’, guidelines and processes that guide the way decisions are made and the way employees go about their work are core parts of any agency’s governance framework. However, an agency that is strictly bound by rules may not be able to respond appropriately to unusual, complex or new circumstances. Unnecessarily detailed rules, instructions and processes can also hinder agency efficiency and effectiveness as outlined in the MAC 2007 report, Reducing Red Tape in the Australian Public Service.17
It is of particular concern that 53% of all SES and EL 2 employees in the APS are of the view that ‘more streamlined administrative processes within my agency’ is the single most important action that would assist their agency to achieve greater efficiency and effectiveness. They rate it as more important than recruiting high-quality staff (47%) and improved ICT (29%)—two of the more generally accepted means of driving higher performance. This means that agencies appear to have scope to achieve considerable gains by reviewing their internal rules, guidelines and processes, that is, their governance processes. Regular reviews of such processes need to be built into governance systems to ensure that they support, rather than hinder, the requirements of the agency and its staff. In addition, the more flexibly they can be expressed, clearly identifying the principles underlying the reason for having such processes, the less frequently they will need to be adjusted.
A number of agencies indicated that they have reviewed their governance structures as a result of machinery of government changes and/or the new government’s reform agenda following the federal election of 2007. Such reviews are made easier within flexible and principles-based governance systems.
Agency governance reviewsComcare—the restructured organisation is based on creating better information flows and the new business model. The review of governance arrangements is an ongoing activity.

Infrastructure—following the change of government and consequential organisational restructure a review of the delegations framework and membership of the governance committees was undertaken.
Prime Minister and Cabinet—the Department’s structure was revised to better manage the Government’s formal agenda. The financial delegations were amended and the CEIs are under review. Business plans have been reviewed to reflect the changing work environment for PM&C.
Key chapter findingsIt is essential for all public servants, regardless of level, to ‘make time available’ to implement effective governance measures, such as recordkeeping, recognising that such core activities can be forgotten, given the many other demands on their time.
Corporate governance is not static and needs to be refined in light of the developments in the environment, and developments directly affecting agencies. Public sector agencies commonly have significant responsibilities for programme delivery and policy advice and, while these responsibilities are interconnected, the span of control can be very broad, underlining the importance of sound governance arrangements.
With the recent reforms being undertaken within the public service there are opportunities for agencies to improve their reporting, both individually and en masse, to better meet the needs of stakeholders, and to facilitate comparative analysis between agencies. Operation Sunlight and the drive to simplify Budget reporting should assist in better specifying outcomes, and in developing performance indicators to enable agencies to identify and measure their contribution to the achievement of outcomes and the efficiency of outputs.
1 ANAO and PM&C 2006, Implementation of Programme and Policy Initiatives: Making Implementation Matter, Better Practice Guide, Commonwealth of Australia, Canberra, p. 13, <http://www.anao.gov.au>
2 Australian Public Service Commission 2007, Building Better Governance, Commonwealth of Australia, Canberra, <http://www.apsc.gov.au>
3 I. McPhee (Auditor-General for Australia), Speech to the Australian Institute of Company Directors and The Institute of Internal Auditors—Australia, Canberra, 4 September 2008, p. 2, <http://www.anao.gov.au>
4 Full details of the factor analysis, including details of the methodology and questions used, are set out in Appendix 3.
5 The 12 factors in order of agreement/satisfaction were: Personal Innovation and Flexibility, Understanding Current Role, Current Job, Work Group, Governance and Integrity, Immediate Manager, Work-Life Balance, Learning and Development, Merit and Career Progression, Innovation Culture, Senior Leaders and Agency Culture.

6 I. McPhee (Auditor-General for Australia), Speech to the Australian Institute of Company Directors and The Institute of Internal Auditors—Australia, Canberra, 4 September 2008, p. 8, <http://www.anao.gov.au>
7 PM&C, DFAT, Treasury and Finance.
8 Hon. Lindsay Tanner MP, ‘Address to the CEDA Conference, 2008 State of the Nation’, Canberra, 5 June 2008, p. 4, <http://www.financeminister.gov.au/speeches>
9 Review of the National Innovation System, Venturousaustralia: Building Strength in Innovation (Chair: Dr T. Cutler) (September 2008), <http://www.innovation.gov.au>
10 Management Advisory Committee 2007, Note for File: A Report on Recordkeeping in the Australian Public Service, Commonwealth of Australia, Canberra, <http://www.apsc.gov.au/mac>
11 ANAO 2006, Recordkeeping including the Management of Electronic Records, Performance Audit Report No. 6, 2006–07, Commonwealth of Australia, Canberra, <http://www.anao.gov.au>
12 Useful records help the organisation do its business; important records assist the organisation to meet its obligations. Electronic messages sent or received in the performance of an agency’s business are corporate records.
13 For additional information on the Better Practice Guide: Risk Management and other better practice guidance material, see < http://www.finance.gov.au/comcover/better-practice-guide.html>
14 Hon. Ian Callinan 2008, Equine Influenza Inquiry Report, Commonwealth of Australia, Canberra, p. xxii, <http://www.equineinfluenzainquiry.gov.au>
15 I. McPhee (Auditor-General for Australia), Speech to the Australian Institute of Company Directors and The Institute of Internal Auditors—Australia, Canberra, 4 September 2008, <http://www.anao.gov.au>
16 Australian Public Service Commission 2007, Agency Health: Monitoring Agency Health and Improving Performance, Commonwealth of Australia, Canberra, <http://www.apsc.gov.au/publications07/agencyhealth.htm>
17 Management Advisory Committee, 2007, Reducing Red Tape in the Australian Public Service, Commonwealth of Australia, Canberra, <http://www.apsc.gov.au/mac>

Chapter 10: Working with government agencies and stakeholders A key feature of the modern environment for public services across the world is collaboration—working well with other agencies and jurisdictions and engaging effectively with stakeholders to achieve government objectives. How well the APS can work with many stakeholders to deliver effective, timely, coordinated and seamless service will be a hallmark of future success.
Tackling complex policy issues typically requires more collaborative and innovative approaches, where other parties, collectively and/or individually, also take responsibility for shaping and delivering the responses required.1 The Prime Minister has recently committed to ‘a new way of governing—particularly increased cooperation between federal, state and local governments, businesses and community organisations’.2 Increased taxpayer expectations about the quality of government services have led the APS to consider with whom, and how best, to work on both the design and delivery of programmes and services.
The new Government’s approach has included some specific initiatives to enhance scope for collaboration between the APS and external stakeholders including, for example, an increased reliance on the Council of Australian Governments (COAG) to progress reforms. This chapter focuses on how the APS is working with state and local government, and other key stakeholders, such as industry and non-government organisations (NGOs) (e.g. environmental groups and charities). It also considers framework and employee capability issues for improving cooperation and collaboration with external stakeholders. The question of citizen engagement is dealt with in Chapter 11.
Key themes in 2007–08 Community expectations, increasing globalisation and technological innovation, as well as the complex nature of some of the long-term challenges facing governments today, have increased the need to consider adopting collaborative and whole of government approaches to address those challenges. The 2004 Management Advisory Committee (MAC) report, Connecting Government: Whole of Government Responses to Australia’s Priority Challenges, highlighted the need to connect with and invest in relations with external stakeholders:
... understanding the different perspectives of external groups is essential to the government’s desire to see policies and programs make a constructive contribution ‘on the ground’, as well as in managing the risks associated with new initiatives.
The Australian Public Service (APS) has a significant role in making these connections work. While there will always be strong external links at the political level—-ministers, members of parliament, ministerial staff—the APS also needs to foster and maintain close linkages to meet its responsibilities for comprehensive policy advising, and for effective implementation of government policies and programs.3

The concept of agile government is also founded on collaboration. A report by Victoria’s State Services Authority, Towards Agile Government, suggests that agility provides the prospect of ‘an open and imaginative system of government that is constantly scanning for new information, making sense of that information and using it to develop more effective responses to challenges and opportunities.’ To enhance agility in public service, the following six approaches are recommended:
create accessible spaces for shared understanding innovate, learn and implement network and collaborate foster workforce flexibility and adaptability balance short- and long-term priorities engage citizens in decision-making.4
A continuum of relationships with external stakeholders is identified in Victorian Approaches to Joined Up Government: An Overview,5 extending from networking to collaboration (see Table 10.1).
Table 10.1: Continuum of relationships
Networking Coordinating Cooperating Collaborating
Source: Adapted from A.T. Himmelman, ‘On Coalition and the Transformation of Power Relationships’, American Journal of Community Psychology, Vol. 29, No. 2, 2001, pp. 277–284. Cited in State Services Authority, Victorian Approaches to Joined Up Government: An Overview (2007), p. 5.
Exchange of information for mutual benefit
Exchanging information for mutual benefit
Exchanging information Exchange information
Informal relationship Alter activities Alter activities Share resources
Minimal time and trust Formal relationship
Sharing resources to achieve a common purpose
Enhance capacity of another to achieve a common purpose
No sharing of resources
Requires moderate time and trust Formal relationship Formal relationship
Minimal sharing of resources
Substantial time and trust required
Extensive time and trust required
Share resources Share risk, responsibilities, rewards
Some sharing of risk and reward
Building and maintaining effective relationships across the full spectrum is required to ensure that government objectives can be achieved. Strategic decisions and flexible approaches will be necessary to enable agencies and employees to engage in external stakeholder relationships suited to the policy issue and implementation mode at hand. For some issues, a fully collaborative relationship will be required, for example, collaboration with a range of

stakeholders to deliver measures to address Indigenous disadvantage, whereas for other issues, a networking approach will be adequate, for instance, in advising on changes to taxation or regulation arrangements. As relationships move progressively towards being fully collaborative, it is likely to require more time and investment, and greater dependence on stakeholders will emerge. As relationships also can involve a range of stakeholders (including at the government level), leadership and clarity about roles needs to be clearly established. It may be necessary to ensure that the Government has a single, rather than a multiplicity, of faces.
During 2007–08, the impetus for building sound relationships in the APS as the basis for cooperation and collaboration with external stakeholders intensified, particularly with the cross-government agreement to use COAG and its agenda to progress reforms in key policy areas. Additional opportunities for working with external stakeholders also emerged, through the Australia 2020 Summit process, the introduction of Community Cabinet meetings and the commencement of a large number of reviews, seeking public comments and input, in many policy areas.
In December 2007, COAG agreed to a new model of cooperation and new working arrangements to progress reforms in seven key areas: health and ageing; the productivity agenda, including education, skills, training and early childhood; climate change and water; infrastructure; business regulation and competition; housing; and Indigenous reform.6
Other areas for reform, including deregulation and a review of payments made to the states and territories, were also identified as priorities to be addressed through COAG. Seven working groups overseen by a Commonwealth Minister, with deputies nominated by the states and territories at a senior departmental level were established; these include senior officials from all jurisdictions. Implementation plans for each working group were agreed as the basis for further work. A nominee of the Australian Local Government Association is included in the working groups on climate change, infrastructure and housing. COAG also agreed to meet four times during 2008, and in 2009 a meeting dedicated to Indigenous issues has been scheduled.
COAG productivity agendaThe objectives of the COAG Productivity Agenda Working Group are to pursue substantial reform in the areas of education, skills and early childhood development, to deliver significant improvements in human capital outcomes for all Australians, and to strengthen Australia’s economic and social foundations through this reform work plan. Reform will involve collaboration across the public and private sectors, and a genuine partnership involving parents, children, students, employers and all levels of government.
The Minister for Education, Employment and Workplace Relations, the Hon Julia Gillard MP is Chair of the Working Group on the Productivity Agenda, with the Deputy Chair from Victoria. In March 2008, COAG agreed to a number of high-level targets, including:
that in five years all Indigenous four-year-olds in remote Indigenous communities will have access to a quality early childhood education programme
to lift the Year 12 or equivalent attainment rate to 90% and to halve the gap for Indigenous students in Year 12 or equivalent attainment rates, by 2020

to halve the gap for Indigenous students in reading, writing and numeracy within a decade
to halve the proportion of Australians aged between 20 and 64 years without qualifications at Certificate III level and above between 2009 and 2020
to double the number of higher qualification completions (Diploma and Advanced Diploma) between 2009 and 2020.
COAG also agreed to further advance reforms in the areas of early childhood development, schooling and skills and workforce development.
Central agencies have continued to play a key role in coordinating major cross-government initiatives, including those being pursued through the COAG agenda.
The Australia 2020 Summit,7 held on 19 and 20 April 2008, was supported by the APS, with more than 200 volunteers drawn from across the public service assisting with administrative functions. Portfolio secretaries and other agency heads attended relevant stream discussions. Collaboration and the need for increased government interaction with stakeholders was identified as one of the big ideas to be taken forward from the Summit governance stream,8 along with specific proposals to underpin its achievement, including technology-based models to ensure improved citizen engagement, active citizenship as a curriculum topic for schools and strengthening of government relations with the third sector.
Community Cabinet meetings9 directly include Ministers and Departmental Secretaries or their representatives. Commitments made during the Community Cabinet meetings are recorded and monitored in quarterly reports to Cabinet.
The first meeting of the Australian Council of Local Government (ACLG) is scheduled for November 2008, where 565 heads of Australia’s local councils will meet with the Australian Government, State and Territory Governments and key groups to discuss issues around national and local infrastructure, including urban planning and design.
Many major policy reviews have commenced, with some already concluded (including the reviews of Innovation10 and the Australian Automotive Industry),11 while others are ongoing (e.g. the Henry Tax Review, led by the Treasury Secretary, Dr Ken Henry) or have been a multi-stage process (the release of and further consultation with key stakeholders regarding the Carbon Pollution Reduction Scheme Green Paper).12 These reviews have invited submissions and input from all interested stakeholders.
Development of a National Compact, as part of the new Social Inclusion Agenda,13 is another initiative linking government more directly to external stakeholders. A first public consultation phase has been completed and it is expected that a compact will provide a platform for ongoing discussion and outline how the Government intends working with the not-for-profit sector to improve and strengthen ties.
In relation to APS interactions with external stakeholders, the Lobbying Code of Conduct14 was developed and has been operational since 1 July 2008. APS employees will need to take the lobbying code into account in future, to help clarify what particular interests are being represented when they deal with external stakeholders. Agencies will be required to make sure their employees are aware of, and comply with, the Code.

In light of these developments, concerns raised in previous State of the Service reports about the need to continue to promote a stronger culture and better arrangements in the public sector for improving collaboration with external stakeholders, and which enable more effective government policy approaches to be adopted, are even more relevant. Issues identified included: providing more clarity around the Budget and accountability framework, and the composition, role and leadership of joint working arrangements; improved governance arrangements; and consideration of the role of information and communications technology (ICT) in better supporting shared initiatives. The imperatives for ensuring these issues are addressed, and that appropriate models for engagement with all stakeholders are in place, have increased.
Other jurisdictions
The strong international focus on using collaboration and connected government to address complex policy issues is continuing. In the UK, the Social Exclusion Task Force expanded the cross-government measures available to support and mitigate issues of chronic social disadvantage. This included the launch of a further 10 collaborative pilot projects in 2007 to provide intensive intervention for young people at high risk of being taken into care and custody. In early 2008, the Families at Risk Review was completed and 15 pilot projects were launched in different locations to test innovative ways of supporting vulnerable families.
In NZ, Transforming the State Services: State of the Development Goals Report 2007,15 reported on progress being made across the State Services in relation to Networked State Services and
Coordinated State Agencies. The State Services Commission research suggested an all-of-government culture in coordination is developing. It noted the need, however, for more progress—particularly in relation to performance measurement, better alignment of ministerial priorities and agency shared interests, and a still stronger focus on building the public service capability needed to better support coordination. More recently, the 2007–08 annual report of the State Services Commission noted that Ministers and State sector leaders recognised there was still room for improvement in the areas of coordination and cooperation between agencies.16
Across the UK, NZ and Canada, there have been continuing efforts to improve joined up government, including new Budget arrangements in the UK,17 aimed at enhancing collaboration with stakeholders and citizens in the policy, programme and service delivery roles of government. These developments are reviewed in more detail in the discussion of citizen engagement in Chapter 11.
In April 2008, the Organisation for Economic Cooperation and Development (OECD) released Ireland: Towards an Integrated Public Service, a report which emphasised the importance of pursuing reform from a whole-of-public sector perspective in order to improve efficiency. OECD found that Ireland ‘needs to think increasingly about the Public Service as an integrated “system”’ and recommended adoption of a combined suite of actions, including better information sharing across agencies. To underpin these actions, OECD also included a recommendation for creation of a Senior Public Service to promote strong, central leadership across the public service.18

Finland’s Prime Minister released the Government Strategy Document 2007 in April 2008, outlining a Public Sector Reform Programme for the period 2008–2015. The programme is focused on reforms aimed at improving social outcomes in the areas of employment, health and the well-being of children, youth and families. One of the eight specific areas of reform is ‘revision of administration’, with restructuring of both central and regional administration foreshadowed. Citizen engagement has been promoted through the establishment of policy making networks of Ministers and civil servants who work across departmental boundaries to deliver outcome goals.19
Throughout the OECD, improving cross-government connections, as well as fostering effective collaboration with external stakeholders, is recognised as central to transforming the role of government—moving it from being a problem solver to that of being an enabler, assisting stakeholders to resolve problems and change circumstances.20 Across jurisdictions, there is also a renewed emphasis on harnessing technology as a means of improving internal and external government coordination and enhancing engagement and collaboration with external stakeholders and the community. The UN E-Government Survey 2008 assesses the new role of government in enhancing public service delivery, while improving the efficiency and productivity of government processes and systems, through the use and better leverage of ICT infrastructure.21 The UN report, and Australia’s ranking in the survey, are considered in more detail in Chapter 11.
APS developments
There have been a number of developments across the APS in the last 12 months. The following sections examine framework initiatives, devolved government and cross-portfolio and collaboration initiatives.
Framework initiatives
During 2007–08, central agencies’ important role in coordinating whole of government initiatives was particularly apparent. Changes were announced in the May Budget to strengthen the role of PM&C through the formation of the Strategic Policy and Implementation Group. The Group includes the Cabinet Implementation Unit (CIU) which continues to work closely with departments and agencies on implementation planning, governance and reporting arrangements. Reports for the Government focusing specifically on activities against measures agreed through COAG were prepared by CIU. CIU was also initially responsible for the coordination of the whole of government response to the Prime Minister on the Australia 2020 Summit.
A Strategy and Delivery Division has also been formed to provide focus to strategic policy across government, and to ensure forward-looking policy is prioritised in the face of the day-to-day demands of government. The Division will work with the rest of PM&C on strategic policy projects. Along with other roles, the Division will lead APS implementation of the Government’s response to the Australia 2020 Summit recommendations.
Chapter 9 outlines details of other financial governance arrangements in place, including Gateway reviews, to assist agencies covered by the Financial Management and Accountability Act 1997 with project delivery. Through Operation Sunlight, changes have also been made to the Budget reporting framework to increase transparency and accountability.

In addition, the new framework for federal financial relations (also detailed in Chapter 9) will change the way that APS line agencies interact with State agencies in considering the development and implementation of programmes affecting service delivery. This may have implications for the roles of central agencies at both the federal and state levels; it is also likely to affect the measurement and reporting of performance against the new agreed outcomes.
Last year’s State of the Service report highlighted the findings of ANAO’s report, Whole of Government Indigenous Service Delivery Arrangements,22 released in October 2007. That report argued there were opportunities to streamline the administrative arrangements supporting the delivery of Indigenous services in the APS and pointed to the need to improve overall performance information (across agencies) in order to assess progress against shared priority areas for reform. The ANAO report was considered by the Secretaries’ Group on Indigenous Affairs (SGIA) in September last year, and the two recommendations made in ANAO’s report were accepted. The first recommendation related to the need for a protocol to monitor and where appropriate escalate and resolve administrative matters affecting the efficient and effective implementation of the Indigenous affairs arrangements. FaHCSIA has developed a protocol to this effect. The second recommendation advocated a stronger collective focus by departments on assessing performance against the Government’s Indigenous priorities.
To address this recommendation, a whole of government approach to funding Indigenous organisations is being developed, including multi-year, multi-agency funding agreements. SGIA has agreed to a set of generic performance indicators for all Indigenous funding arrangements and the application of the performance indicators to all Indigenous funding arrangements across government. Further work is also being undertaken to improve clarity and consistency of contracting arrangements, and to support better whole of government evaluation of Indigenous initiatives.
More broadly, the new COAG arrangements have also meant significant changes for governance and policy surrounding Indigenous disadvantage. Through COAG, the Closing the Gap of Indigenous Disadvantage strategy has been agreed, with a range of specific targets, covering health, education, employment and life-expectancy to close the gap in Indigenous disadvantage now agreed, and to be implemented within specific time frames. The Prime Minister has made a public commitment to report annually to Parliament on the progress the Government makes in closing the gap between Indigenous and non-Indigenous Australians (this report will be presented on the first parliamentary sitting day of each year).
In December 2007, under COAG, the Working Group on Indigenous Reform (WGIR) was also formed. Within the Commonwealth, a number of the previous whole of government arrangements remained in place, including SGIA, which retains its role in leading whole of government work across the APS. However, as part of the reform of Commonwealth-State funding arrangements, WGIR is developing a national framework for reporting expenditure by all jurisdictions, which will include both Indigenous-specific and mainstream spending. There will be alignment between the performance and reporting framework developed by SGIA and the national framework now being developed through COAG.
ANAO’s report of October 2007 into whole of government Indigenous service delivery arrangements, is currently being reviewed by the Joint Committee of Public Accounts and Audit (JCPAA), as part of its normal review processes for ANAO reports. The report also

recommended that Finance consider opportunities for improving guidance for all agencies on whole of government Budget and reporting arrangements. This would assist with addressing employee perceptions, identified in last year’s State of the Service report, that the Budget framework imposes constraints on whole of government approaches. Finance has provided some additional guidance to agencies on managing whole of government outlays, through the Explanatory Memorandum to the Financial Framework Legislation Amendment Bill 2008,23 which stated:
52. The reference in the note to a Chief Executive being able to enter contracts ‘in relation to the affairs of the Agency’ is to be read in broad terms. In particular, the Government will generally expect agencies to work cooperatively in a range of areas, including the implementation of whole-of-government policies.
In the Explanatory Memorandum to the Appropriation Bill (No. 1) 2008–2009,24 it was also indicated that:
14 Departmental items involve costs over which an agency has control. Departmental appropriations can be used to make any payment related to the functions of the agency …
There can also be occasions when an agency, such as a portfolio department, needs to cover matters in relation to other areas of the Government. Examples can include whole of government activities or a portfolio department assisting with the formation and initial costs of a new portfolio body (for which the department might later be reimbursed).
This advice helps clarify when it is possible, within the current accountability framework, to cover costs that may arise in implementation of whole of government approaches.
As noted in last year’s State of the Service report, reporting of cross-agency initiatives also needs to be improved. Cross-agency outcomes are able to be used, but ANAO has suggested that the concept of cross-agency outcomes be reviewed in light of its lack of application by agencies. ANAO’s report also indicated the need to ensure clear leadership of cross-agency initiatives.
These same issues—the need to ensure clarity, leadership and effective performance reporting and monitoring—are also relevant to shaping and considering the types of financial relations with external stakeholders that need to be established for effective cooperation and collaboration.
The Commission is preparing a new publication in the ‘Contemporary Government Challenges’ series that focuses on how further flexibility can be incorporated into the performance and accountability framework, in order to support more innovative and collaborative responses to policy issues, including with external stakeholders. It highlights that there is already scope within current arrangements to support joined up and collaborative responses, but that further amplification of how these arrangements can work is required. It also suggests that adopting a fit-for-purpose approach to performance and accountability may assist, where the performance and accountability arrangements to be applied to new initiatives are considered as part of the policy design process and, where appropriate, they reflect stakeholder responsibilities in delivering outcomes.

Devolved government
For the first time, last year’s State of the Service report also provided data on devolved government expenditure. Reliance on third parties to deliver services and programmes is of course likely to increase, and puts an increased emphasis on ensuring an appropriate Budget and performance framework that takes account of the different sorts of external stakeholder relationships that may be required. The Prime Minister has made it clear that the Government has no ‘ideological preference for the public sector, nor for the private sector’.25
Estimated devolved government expenditure for 2007–08 is set out below, along with actual data for 2006–07 (see Table 10.2). The data has been provided by Finance, and is broadly consistent with the information produced for the first time in the State of the Service Report 2006–07. It measures the dispersions that occur outside the Commonwealth for the purposes of funding third party providers. It shows that around 63% of non-Commonwealth expenditure is provided to State and Territory Governments, over 1% to local government, and approximately 36% to NGOs. The data shows an increase in the estimated expenditure being made available to those external providers of around $6 billion for 2007–08 compared with 2006–07.
Table 10.2: Estimated devolved government expenditure
2006–07 actual $ billion
Percentage of total
2007–08 estimates $
billion
Percentage of total
Source: Department of Finance and Deregulation
State/Territory Government 28.17 64.0 31.60 62.9
Local Government 0.38 0.9 0.55 1.1
Non-government organisations 15.43 35.1 18.08 36.0
Total expenditure 43.98 100.0 50.23 100.0
This expenditure encapsulates the various grant payments for the categories listed above. Between 2006–07 and 2007–08 it is estimated there will be an increase in payments to the states and territories of $3.43 billion and to NGOs of $2.65 billion (which includes an increase in payments to universities of $1.68 billion). These payments are being made to support initiatives in a range of areas, including Indigenous affairs and health, the environment and local government ICT projects, as well as to provide assistance to farmers.
The Commission is preparing a more detailed research paper on devolved government and its implications for the APS.
Cross-portfolio and collaboration initiatives
Reliance on collaboration and whole of government approaches to progress reforms in a number of key areas is continuing. Inter-departmental committees and task forces have played an effective role in developing joined up responses, and underpin the COAG reform agenda.

Partnering approaches have also been used, to support projects undertaken with community and business stakeholders.
COAG—reducing the regulatory burdenThe Department of Finance and Deregulation provides support to the COAG Business Regulation and Competition Working Group, which is addressing ways to reduce the regulatory burden on business in areas of shared Commonwealth and State responsibility. The Working Group is targeting overlaps and inconsistencies between the Australian Government and the states and territories, as well as between the states and territories themselves, including, for example, different State-based occupational health and safety regimes, environmental, food and transport regulation, and workers’ compensation.
At its July 2008 meeting COAG reached agreement on reforms in a number of these areas, including the standardisation of occupational health and safety laws, the development of a national trade licensing system, the introduction of a new Business Names Registration system and a new Standard Business Reporting system, and measures to provide better protections for financial consumers. The progress of implementation of the COAG reform agenda is monitored by the COAG Reform Council (CRC), which is independent of individual governments and reports directly to COAG. At the request of COAG, CRC also reports to the Prime Minister as Chairman of COAG on the progress of reforms.26
A number of environmental initiatives have been addressed using collaborative approaches. On 26 March 2008, a new, single body to manage the Murray and Darling Rivers—the Murray-Darling Basin Authority (MDBA)—was established with the support of all Basin States, to progress necessary water reforms and management arrangements within the Basin.27
In the APS, this work was led by DEWHA. This initiative is one of a number being implemented under the National Water Initiative (NWI), and was progressed through the new COAG arrangements. It is founded on a cross-government approach, with the states advising the Commonwealth through a Ministerial Council and Officials Committee.
Across the APS, DCC led the development of the Carbon Pollution Reduction Scheme Green Paper,28 released in July 2008. The paper was the culmination of extensive government consultation with industry, community groups and other stakeholders. It drew on work undertaken by the former Government’s Task Group on Emissions Trading (TGET), the States and Territories’ National Emissions Trading Taskforce (NETT) and the Garnaut Climate Change Review.29 A whole of government task force has also been established to work on ways of reducing greenhouse gas emissions, waste, energy, and water use in government operations, as well as the sustainable use of Commonwealth land. A report has been prepared and the task force will oversee the implementation of government action on sustainability.
DoHA has continued to lead coordination across the Commonwealth to ensure that Australia is well-prepared in case of a disease outbreak, including a possible pandemic, and played a key role in supporting this work at the cross-government level. DoHA also coordinated development of a national plan to boost the number of life saving organ transplants for Australians.

A whole of government approach, led by FaHCSIA and involving six Australian Government portfolios, underpinned the roll out of the Northern Territory Emergency Response (NTER). The APS is working in conjunction with the NT Government to address issues of child abuse, safety and stability in Indigenous communities. The NTER Taskforce and Operations Centre played a key coordination role. A local Australian Government presence in communities has been created through 51 Government Business Managers servicing 72 remote NT communities, supported by the network of Indigenous Coordination Centres (ICCs) in the NT.
The NTER Taskforce provided a report to the Government on 30 June 2008, which indicated that the successful roll out of the NTER measures had been supported by effective whole of government measures. It also strongly supported the role of the Government Business Managers ‘as they have played a key role in coordinating in a whole-of-government, cross-portfolio, cross-jurisdictional manner within each community’.30 Additional funding has been provided for the employment in 2008–09 of up to 20 Indigenous community members to act as community agents. These agents will be ‘a conduit between community and government representatives, engaging families and individuals in the NTER and working to bring about greater community input into government decision-making’.31
A separate review of the NTER was also undertaken by the NTER Review Board.32 The NTER Review Board’s report has been considered by the Government, with an interim response announced on 23 October, confirming the NTER will continue in its current form until the end of June 2009.33 In addition, the national ‘Closing the Gap of Indigenous Disadvantage: A Generational Plan of Action’ was announced in February 2008 and, as discussed above, it now forms the basis of the Budget and national COAG reforms being progressed to address Indigenous disadvantage.
A number of other whole of government and coordinated activities undertaken by MAC agencies are detailed in Chapter 12.
The Sustainable Communities Initiative (SCI), led by the Commonwealth Scientific and Industrial Research Organisation (CSIRO), is an example of coordination to develop place-based responses to sustainability issues for local communities, and draws on a variety of partners, including government (at all levels), local businesses, environmental and community groups. APS agencies that have been involved in SCI include DEWHA, RET, Infrastructure, DAFF and DIISR.
Cross-sector coordinationThe Sustainable Communities Initiative34 has been in place for just over two years. Six projects are underway, including:
urban redevelopment of the East Lake area in the ACT support for the Surat Basin community in Queensland to respond to current and future
impacts of the mining boom in their region development of sustainability outcomes for the Whitsunday Shire building Natural Resource Management (NRM) partnerships with local government in
the Avon River Basin, WA

involvement in the new Lockerbie urban development project in Victoria to ensure long-term sustainability (local partners are Delfin, Lend Lease and relevant local councils).
The sixth project—in Castlemaine, Victoria,35—involves working with large commercial energy users in the Mount Alexander Shire to contribute towards a 30% reduction in greenhouse gas emissions from 2006 levels by 2010. It is also working towards zero net emissions by 2020 while increasing the security of energy supply in the Shire. The project partners span government, private industry and NGOs, as well as community representatives. Mount Alexander Shire relies on its local industries as a source of employment and economic growth. However, the energy intensity of these industries, coupled with increasing energy demands from a growing population in the face of climate change, is presenting significant economic, social and environmental sustainability issues for the Shire.
The Castlemaine project is identifying and testing a range of behaviours and technologies to reduce greenhouse gas emissions from four major local employers: KR Castlemaine, Flowserve, Victoria Carpets and Mount Alexander Hospital. The project has three major stages:
Foundation Building—formally implementing the project plan and establishing a baseline understanding of energy use within the Mount Alexander Shire industry group
Options Development—identifying the range of options available to the partnership to deliver the project objectives, and assessing the merit of each option
Detailed Planning—developing an implementation plan for the preferred option/s.
Implementation of the agreed option/s will be the subject of subsequent projects following on from this planning phase project.
A key challenge highlighted by SCI is the need to provide ongoing support for collaborative approaches of this kind which cross a number of portfolio and government boundaries, but importantly encompass non-government partners and actively encourage community involvement and collaboration. SCI concludes formally at the end of 2009, and at present it is not clear how it will continue. It does provide a model, however, for successful cross-sector partnering and support for approaches of this kind, as well as promulgation of the lessons learned, and it will be critical to developing broader APS capability to build effective partnering relations with external stakeholders.
Agency experience: Interaction with external stakeholdersSpecific data on whole of government arrangements was not collected as a separate item this year and, unless otherwise stated, the following data reported relates to 2007–08.
The agency survey showed continuing high levels of consultation across the APS with nine stakeholder groups in the areas of policy development, programme delivery and government regulation. Groups consulted included NGOs, industry stakeholders, tertiary education and research centres, other APS agencies, State and Territory Governments, local government, unions and members of the public.

Figure 10.1: Agency consultation on different government activities with external stakeholders (usually or sometimes), 2007–08
Source: Agency survey
It is clear from Figure 10.1 that consultation is well-entrenched in APS activities. Almost two-thirds of all agencies reported consultation with at least one of the nine groups of stakeholders in all three areas. Sixty-five per cent of agencies reported carrying out some consultation with at least one of the groups on policy, with around one-third consulting more than five groups of stakeholders. Eighty-six per cent of agencies consulted with at least one of these groups on programme delivery, while around half consulted with more than five groups. The level of consultation on government regulation was higher than in 2006–07, and was reported by 69% of agencies to have taken place with at least one of the external stakeholder groups, while around two-thirds of agencies indicated they consulted more than five groups on regulation.
Consistent with the employee survey results, the most frequently consulted group in all areas were other APS agencies. Industry stakeholders were the second highest group in terms of consultation around regulation, and the third group most frequently consulted on policy and programme issues. For policy and programme issues, State and Territory Governments were the second most frequently consulted group. Excluding government, industry stakeholders and NGOs were the groups most frequently consulted by agencies. Levels of consultation with NGOs were highest in the areas of programme (72%) and regulation (52%) activities while consultation with the public was highest in relation to programme issues (66%).
Consultations with unions increased slightly in 2007–08, with 26% of agencies indicating consultations with unions in relation to policy (27% last year), 43% in relation to programme issues (39% last year) and 27% in relation to regulation issues (22% last year).
New methods of consultation
A majority of agencies introduced new methods of consultation during the year (60% or 54 agencies of the 90 agencies surveyed). While the new methods were quite broad-ranging, in

many instances they seemed to reflect an expansion of the widely-accepted practices of forming stakeholder groups and adopting direct marketing approaches to encourage participation at meetings and in stakeholder surveys.
Use of ICT to enable enhanced consultation appeared to provide the most scope for adopting innovative ways to increase consultation. Examples provided by agencies included using blogs to support interaction with specific stakeholder groups and establishing a technology user group to enable stakeholders to share experience of developing and operating new technologies (DEWHA). The internet was identified as a way of enabling people in remote areas to access consultation processes. The Federal Sex Discrimination Commissioner undertook a listening tour across Australia to gather community views, and her tour was supported by a blog.
It is likely that reliance on technology to support engagement with stakeholders will continue to grow. In June 2008, the Australian Government Information Management Office, (AGIMO) published the outcomes of its consultation on the proposed development and functionality of an Australian Government Consultation Blog. In all three phases of the consultation there was overwhelming support for the concept of a Government consultation blog and discussion forum.36 The recently released report on Innovation recommended action to assist with government consideration of Web 2.0 applications for future engagement with stakeholders and delivery of services.37
Agencies were also asked about how effective the new approaches were, with responses largely positive, and a smaller number indicating that it was still too early to fully gauge the effectiveness of the new approaches. Even though the majority of agencies indicated new methods of consultation, and were generally positive about the results, the new approaches outlined seem still to be focused around the exchange of information. As indicated earlier, it is important for agencies to consider what form of engagement with external stakeholders is required and whether it is suited to the issues at hand. Although exchange of information is a useful first step, there will often be increasing pressure to resolve some issues by building more interdependent relationships and moving further towards collaboration, particularly as governments assume a greater enabling role in society.
What type of interaction?The agency survey also asked agencies about the nature of their employees’ involvement with external stakeholders. Figure 10.2 shows overall levels of involvement were high, and attending meetings to hear stakeholder views clearly remained the most common form of interaction, with almost all agencies indicating that their employees either often or sometimes had such meetings. Employee responses were consistent with agency responses on the forms of interaction with external stakeholders.
Other common forms of involvement were negotiations with stakeholders to develop mutually agreed policy positions or negotiation with stakeholders over implementation processes—the latter still being more commonly acknowledged.

Figure 10.2: extent and type of agency involvement with external stakeholders, 2007–08
Source: Agency survey
Agency support for working with external stakeholders
Within agencies, support for staff dealing with external stakeholders continued to be through provision of policies and protocols on dealing with external stakeholders. As shown in Table 10.3, the vast majority of agencies indicated that they had such protocols in place, with the proportions for 2007–08 being slightly higher across all categories compared with those in 2006–07.
Table 10.3: agency and employee survey results for agency protocols/policies dealing with external stakeholders, 2007–08
Agency policy/protocol
Agencies Relevant employees
Yes %
Being developed
%
No %
Agree %
Neither agree nor
disagree %
Disagree %
Source: Agency and employee surveys
Promote consistent and accurate contract management decisions by staff
89 5 5 48 19 6
Safeguard access to ICT systems and protect private and commercially sensitive information
93 3 2 73 11 2

Table 10.3: agency and employee survey results for agency protocols/policies dealing with external stakeholders, 2007–08
Agency policy/protocol
Agencies Relevant employees
Yes %
Being developed
%
No %
Agree %
Neither agree nor
disagree %
Disagree %
Measure and evaluate overall performance (e.g. outcomes, value for money)
83 5 10 49 21 9
Protect citizens’ interests in projects managed jointly with stakeholders
55 3 10 60 17 4
Table 10.3 shows that agencies most commonly report providing policy and protocols in order to assist employees to:
promote consistent and accurate contract management decisions safeguard access to ICT systems and protect private and commercially sensitive
information measure and evaluate performance (e.g. outcomes, value for money).
Almost all agencies had at least one of the policy and protocol measures in place and close to half reported having all four measures in place (an increase compared with 2006–07). Over 80% of agencies indicated they had at least two of the four policies and protocols in place. Compared to 2006–07, the incidence of these protocols is increasing but it is likely that along with the protocols, further initiatives may still need to be implemented to support stronger collaboration and achievement of better joined up outcomes. Better protecting citizens’ interests remains an issue in need of attention by a greater number of agencies.
Employees working with external stakeholders were also asked to indicate whether they agreed with a range of statements relating to their agency’s support for dealings with external stakeholders (see Table 10.3). Consistent with the 2007 result, around half or more of relevant respondents agreed with each of the statements, with employees being most confident that processes were in place to protect private and commercially sensitive information held on ICT systems. The level of employee agreement recorded in 2007–08 was much the same for all categories as in 2006–07, apart from an increase in the level of agreement recorded in relation to ICT processes.
Employee experience of working with external stakeholdersWorking with external stakeholders is a frequent activity for many APS employees.38 Most employees (80%) reported that they had dealt directly with external stakeholders and that they did this mainly through liaison with stakeholders, or attendance at meetings.

Working with other agencies and other levels of government
Working with other Australian Government agencies continues to be the most common form of interaction for APS employees (55% of respondents), although this was less than in 2006–07 (61%). Declines were recorded in the frequency of interactions by all APS employees with State and Territory Government agencies and local government during 2007–08 (see Table 10.4).
Table 10.4: Interactions with government agencies, 2006–07 and 2007–08
StakeholdersTotal APS EL/SES
2006–07 (%) 2007–08 (%) 2006–07 (%) 2007–08 (%)
Source: Employee survey
Commonwealth agencies 61 55 75 77
State/Territory agencies 34 30 40 42
Local government 19 15 12 13
As in previous years, SES and EL respondents reported much higher levels of working with people from other Australian Government agencies (77%) compared to other groups of stakeholders. For the SES and EL classification groups, dealings with people from other levels of government in 2007–08 remained similar in number to those of previous years.
Some 83% of all APS employees, and 84% of EL and SES employees, who had worked directly with people from any of the government agencies, indicated that their agency culture encourages a constructive approach to collaboration with public service agencies.
These results are encouraging, but the survey data also shows that the SES continue to see themselves as working collaboratively with staff from other agencies (more than 80%); ELs rated SES collaboration much lower (53%).
Employees were asked to provide suggestions about their ability to work with external stakeholders. A small number of comments were provided specifically in regard to improving whole of government approaches, and included recommendations for better information sharing between agencies, as well as improved understanding of shared responsibilities and a suggestion that a body responsible for inter-agency collaboration be established to resolve issues of poor cooperation.
Working with other stakeholders
Public servants identify a range of stakeholders with whom they work directly outside government; those levels of interaction vary. Such interaction is necessary to support effective programme and policy development, and the forms of interaction include direct liaison, attendance at meetings, negotiation around policy positions and/or agreement on, or implementation of, contracts. Tables 10.5 and 10.6 show the most frequently consulted groups (excluding government) for all APS 1–6 and EL and SES staff.
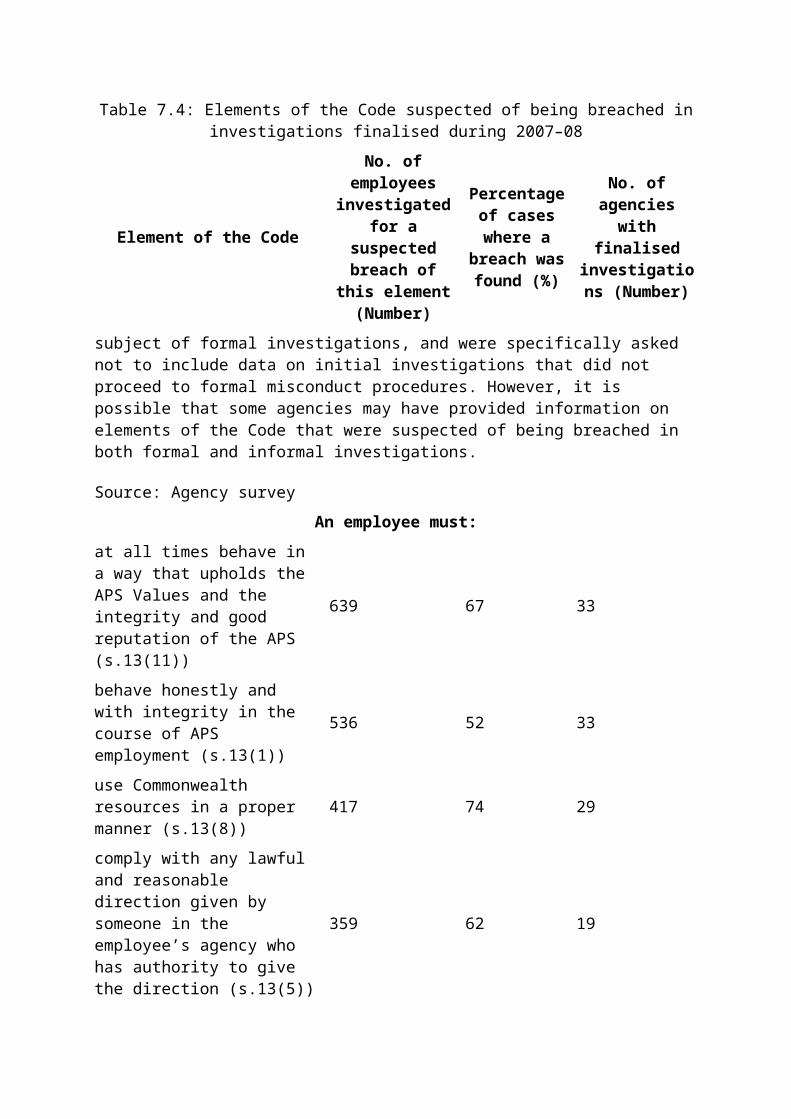
Table 10.5: employee interaction with non-government stakeholders (all APS), 2006–07 and 2007–08
Stakeholders 2006–07 (%) 2007–08 (%)
Source: Employee survey
Groups representing communities 22 20
Industry stakeholders 38 37
Outsourced service providers 23 23
Other contractors or consultants 34 35
Members of the public 46 43
Outside of government, for APS employees, members of the public are identified as the group of stakeholders (43%) that they most frequently work directly with, typically by liaising with them or attending meetings to hear their views.
Table 10.6: employee interaction with non-government stakeholders (EL/SES), 2006–07 and 2007–08
Stakeholders 2006–07 (%) 2007–08 (%)
Source: Employee survey
Industry stakeholders 43 51
Tertiary and/or research groups 22 29
Outsourced service providers 23 26
Other contractors or consultants 43 53
Members of the public 34 35
This year, levels of interaction were highest for EL and SES employees, with other contractors or consultants (53%), and much higher than in 2006–07 (43%). Excluding government agencies, the public ranked third for EL and SES employees’ interaction in 2007–08 (35%), similar to the outcome for this group in 2007 (34%). Industry stakeholders comprise the second largest non-government group that APS employees report they most frequently and directly work with, including amongst EL and SES employees. For APS employees overall, there did not appear to be any change in the frequency of working with unions in 2008 (8%), compared with 2007 (7%), although some increase was reported by EL and SES staff (10% compared with 7%).
Figure 10.3 shows the main types of interactions employees reported, with liaison the most common activity followed by attending meetings and negotiating with stakeholders to develop mutually agreed positions or understanding of issues.
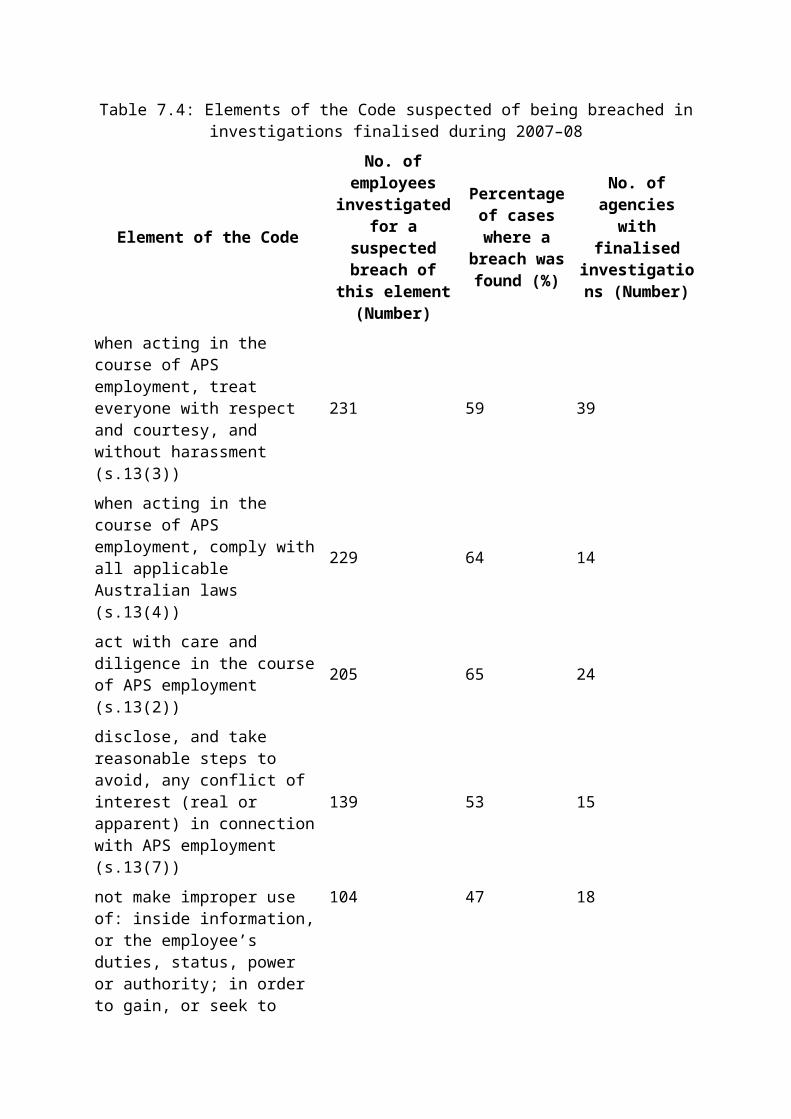
Figure 10.3: Proportion of relevant APS employees(a) involved in different types of interactions with external stakeholders, 2007–08
(a) Employees who responded ‘Don’t know’ are included in the denominator.
Source: Employee survey
Employee views on support for dealing with external stakeholders
In relation to the support provided by their agency for employees in their dealings with external stakeholders, over half (56%) of relevant employees reported that they have access to appropriate training and information to meet their responsibility to stakeholders—up from 51% in 2007. Seventy-three per cent agreed that processes are in place to protect private and commercially sensitive information and to safeguard access to ICT systems—up from 69% in 2007.
However, there was a decline in the proportion (58%) of relevant employees reporting that they are usually able to resolve conflicts and address concerns quickly—down from 65% in 2007. Just over half of all employees (52%) reported that they usually foster teamwork and reward these behaviours in others—this was also another significant reduction on the outcome for 2007 (60%).
There was also a small reduction in the number of employees agreeing they were able to share information with stakeholders to ensure people are kept informed of progress and issues—63% compared to 67% in 2007. Given the increased emphasis being placed on collaboration and the value of seeking views from and working with stakeholders, further consideration of how to ensure that employees are able to provide information to stakeholders may be required.

Employees were also asked about how confident they were, when working with external stakeholders, of being able to balance the APS Values (the Values) of being fair, effective, impartial and courteous in delivering their services to the Australian public, and responsive to Government. Over 70% of employees continued to indicate high levels of confidence in their ability to do so, a result similar to those in previous years.
Suggestions were sought from employees on how they could improve their ability to work with external stakeholders. They also provided feedback on how their agency could improve their capacity to collaborate with other agencies. As in previous years, common themes emerged:
A need for cultural change to better support collaboration with other APS stakeholders or external stakeholders.
The organisation culture is not conducive to engaging in truly collaborative partnerships with other agencies. Staff are encouraged to withhold information and compete against the interests of other agencies.
Agencies seem to operate in their own independent cells because of funding pressures. This, combined with the very risk averse culture of the public service means that APS employees are reluctant to collaborate with other agencies, maybe for fear of sharing strategic policy directions? This might be improved by encouraging, rather than discouraging, contact between employees at levels other than the executive, as well as more communication between agencies at the executive level.
More confidence that the senior management would back my judgements/advice—so that I could negotiate more effectively i.e. in a true negotiation, sometimes you have to be willing to give a bit. However, needing to get the OK from busy senior people often slows down the process or results in them needing to take over because they won’t give an indication of their view.
A need for greater provision of staff learning and development to support engagement with external stakeholders, including some comments about the need for more support in contract management.
Our organisation needs to develop a clearer, simpler guide to the steps required in engaging with external stakeholders. At present, there is no singular point of reference to give appropriate information about documentation, submissions required, etc.
Provision of appropriate training (appropriate in quality) in the range of stakeholder engagement skills, contract management, tendering, negotiation, conflict resolution etc.
Further training relating to legal issues and risk management would be good.
Some specific training in external stakeholder management and alliance management would be useful—most agencies really just stumble through and often take a very defensive approach offering little engagement with external partners and where they are required to do so by Government drawing the boundaries of the engagement as narrowly as possible and adopting a passive placating approach to negotiations with industry.

Contract management is particularly poor, there needs to be more rigor around establishing and maintaining contracts and contractor management.
More support around contracts, including legal issues, and privacy issues.
Resources to support external organisations to better meet their obligations.
Training in and the ability (time and staff resources) to assess and deliver capacity building and business governance assistance to organisations and/or assess needs of organisations and work with them more comprehensively to achieve their outcomes.
Technology enablement
As indicated above, harnessing technology and using it where appropriate to underpin relations with external stakeholders will be a key issue for the APS in the future. To date, AGIMO has introduced a range of specific initiatives to provide support for and guidance to agencies on whole of government ICT issues. Responsive Government: A New Service Agenda39 provides strategic advice to agencies on collaboration, and the Secretaries’ Committee on Information and Communications Technology (SCICT), established in June 2006, operates to help drive whole of government approaches to the use of ICT. Members include the Secretaries of central and service delivery departments and agencies.
SCICT is supported by a Deputy Secretaries Group, the Business Process Transformation Committee (BPTC). A blueprint has been drafted by Finance, on behalf of BPTC, to facilitate cross-agency coordination in service delivery. The blueprint outlines the primary business processes, services and technologies required for agency systems to communicate and interoperate. The Australian Government Email Address Naming Standards were also released by Finance, on behalf of BPTC, in February 2008, providing a common approach to email addresses. Some other initiatives progressed by AGIMO are discussed in Chapter 11.
There would appear to be considerably further scope for harnessing technology improvements and building on cross-service approaches to underpin better external stakeholder relations, including consideration of whether a more coordinated approach across agencies is required.
Sir Peter Gershon’s Review of the Australian Government’s Use of Information and Communication Technology will be important in this regard. The report, released in October 2008, made clear the need for better coordination across the APS on ICT and recommended changes to the existing ICT governance arrangements.40 The Government is currently preparing its response to the Gershon Review.
Information and communication technology reviewSir Peter Gershon’s Review of the Australian Government’s Use of Information and Communication Technology was released in October 2008.41 A key issue in the findings is a conclusion that there has been weak governance of ICT at a whole of government level:
There is no strong line of sight between agency ICT activity and whole of government priorities ...There is also too much variation in the degree and quality of interaction between policy formulation and implementation ... The totality of these issues ultimately hinders the

ability of the Government to provide efficient and effective joined-up ICT-enabled services to citizens and businesses.
A major programme of administrative reform and cultural change is recommended to:
improve Government and APS ICT governance tighten APS management of ICT operations manage the APS ICT skills base better plan for the Government’s overall data centre requirements interact with the industry more effectively ensure that the Government’s own ICT operations are sustainable.
Key chapter findingsConsultation, collaboration and joined up approaches, including whole of government arrangements, are being used in a variety of areas across the APS and are likely to be used even more. The cooperative government model, using COAG and involving State, Territory and local government partners, as well as other key groups to implement strategic reforms, is increasing the imperative to make sure that there is an appropriate APS framework for working well with external stakeholders. At the same time, the APS framework for supporting cooperative and collaborative approaches is also evolving. The key issues for the future that need to be considered are whether the framework and existing approaches to working with external stakeholders are evolving rapidly enough to meet this increased imperative for working well with external stakeholders. More effort would appear to be required in a number of areas.
The decline in employee perceptions about being able to resolve conflicts or to foster teamwork and collaboration, as well as to share information with external stakeholders are matters for concern. These issues suggest that an increased focus by agency leaders on promoting and supporting sound relationships with external stakeholders is required. A stronger leadership cadre that supports cooperation and collaboration—with all stakeholders—is essential.
The framework and skills required for building effective relationships of all types are likely to be similar, even where the APS is engaging with different sets of stakeholders. The APS must create a cross-service culture that identifies collectively, is interconnected and at the same time, outward-looking. It is disappointing that this year’s employee survey showed a significant decline (40% in 2007–08, compared to 55% in 2006–07) in the proportion of SES staff who identified more with the APS than with their own line agency. Leadership across the APS has an important role to play, and one of the key pillars of an effective leadership strategy is to build a cohesive senior leadership cadre that supports working with a range of stakeholders, including government partners, and citizens and communities. Portfolio Secretaries and MAC will also play an important part in providing guidance and reinforcing a culture that rewards cooperative and outward-looking approaches. The role of performance management schemes in encouraging these leadership styles also needs to be considered.
For APS employees, new capabilities will be called for, including being able to think holistically about the full range of stakeholders, as well as the type of relationships required to develop cooperative and effective responses. Skills to develop and build those relationships
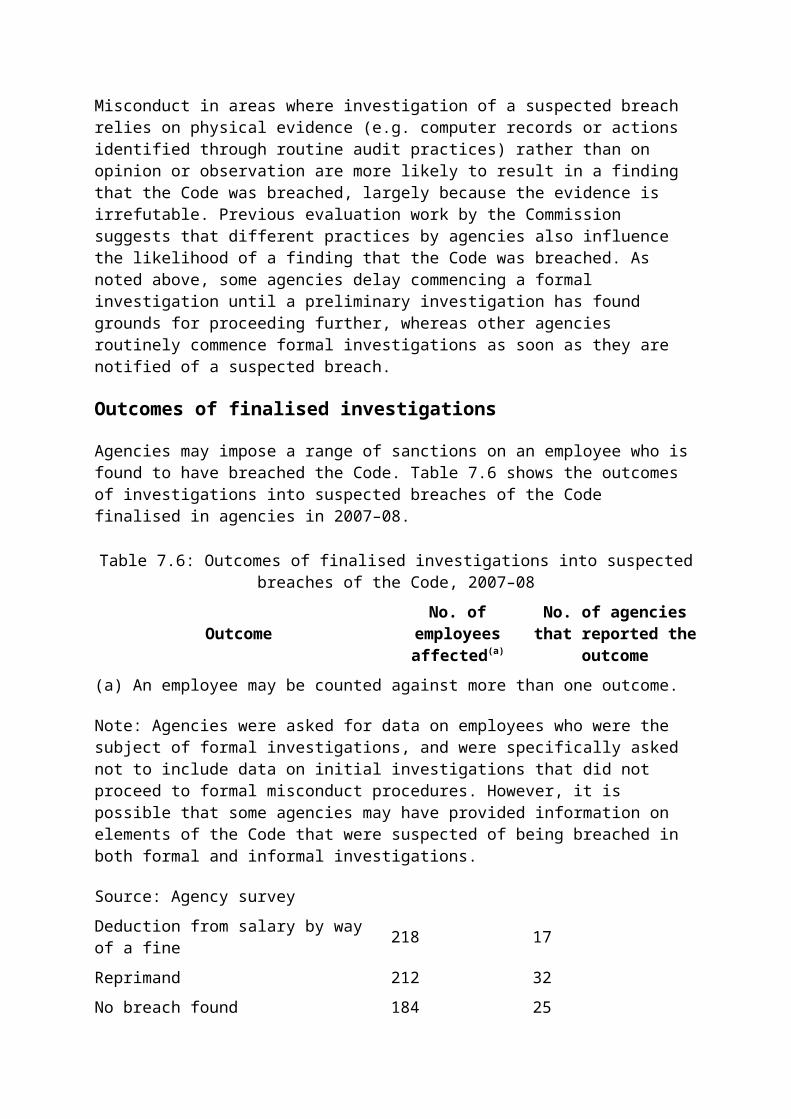
will also be needed. To tackle cross-border issues, forging stronger links with external stakeholders in other countries may also be important. Encouragement to work flexibly with external stakeholders, along with support for trialling new approaches that rely on active stakeholder participation, is essential. Employee perceptions are already quite positive about agency support for working with other government agencies, and this needs to be broadened to include relations with other groups of stakeholders outside government. Internal governance arrangements in agencies will need to be aligned as well.
To support the development of these skills, agencies need to invest strategically in learning and development across the APS—including for their leader cohorts. The Commission offers a broad suite of programmes designed to enhance leadership development and develop skills and capability more broadly across the APS. It has focused on including strategic thinking and innovation components in its programmes and has also included a new cross borders programme for senior leaders. Other new initiatives have been introduced to support collaboration and working with external stakeholders. Chapter 5 provides further information on the Commission’s learning and development programmes and services.
There is already a wealth of experience across the APS in working with external stakeholders. Different agencies have experience with using different types of collaborative arrangements, and there is a need to ensure that other agencies can benefit from these experiences. Sharing knowledge and ideas on how to determine the appropriate relationship with external stakeholders is vital. Case study information on approaches that have been used, for example, profiles of place-based approaches, issues-based approaches, as well as experience of working with third party providers for delivery of services, would be beneficial.
Further consideration of whether there should be central agency support for trialling new partnering and collaborative approaches may be desirable. The current issue being experienced with the SCI—where there is no obvious ‘home’ for initiatives that cross agency boundaries—highlights the need to reflect on whether there is adequate support for the development and promulgation of best practice partnering and collaboration approaches. The need for further clarity around the Budget framework and how it can support cross-agency initiatives or more devolved arrangements is likely to intensify, especially as the reform of federal-state and territory financial relations is progressed. Finally, arrangements for more coordination in the area of ICT to provide the APS with a better basis for working with external stakeholders should also be considered.
1 Australian Public Service Commission 2007, Tackling Wicked Problems: A Public Policy Perspective, Commonwealth of Australia, Canberra, p. 1, <http://www.apsc.gov.au>
2 Hon. Kevin Rudd MP, ‘Quality Education: The Case for an Education Revolution in Our Schools’, Address to the National Press Club, Canberra, 27 August 2008, p. 4, <http://www.pm.gov.au>
3 Management Advisory Committee 2004, Connecting Government: Whole of Government Responses to Australia’s Priority Challenges, Commonwealth of Australia, Canberra, p. 89, <http://www.apsc.gov.au/mac>

4 State Services Authority and Demos 2008, Towards Agile Government, State Government of Victoria, Melbourne, pp. 1, 21, <http://www.ssa.vic.gov.au>
5 State Services Authority 2007, Victorian Approaches to Joined Up Government: An Overview, State Government of Victoria, Melbourne, <http://www.ssa.vic.gov.au>
6 COAG Meeting, Melbourne, Communiqué, 20 December 2007, <http://www.coag.gov.au>
7 The Australia 2020 Summit website is <http://www.australia2020.gov.au>
8 Department of the Prime Minister and Cabinet 2008, Australia 2020 Summit Final Report, Commonwealth of Australia, Canberra, <http://www.australia2020.gov.au>
9 <http://www.pmc.gov.au/community_cabinet/meeting.cfm>
10 Review of the National Innovation System, Venturousaustralia: Building Strength in Innovation (Chair: Dr T. Cutler) (September 2008), <http://www.innovation.gov.au>
11 Review of Australia’s Automotive Industry, Final Report (Leader: Mr S. Bracks) (July 2008), <http://www.innovation.gov.au/automotivereview>
12 Department of Climate Change, Carbon Pollution Reduction Scheme Green Paper (July 2008), <http://www.climatechange.gov.au/greenpaper/report/index.html>
13 DEEWR 2008, A National Compact, <http://www.socialinclusion.gov.au/A_National_Compact.htm>
14 APSC Circular No. 2008/4: Requirements Relating to the Lobbying Code of Conduct and Post-Separation Contact With Government, <http://www.apsc.gov.au/circulars>
15 NZ State Services Commission, State of the Development Goals Report 2007— ‘Transforming the State Services’, <http://www.ssc.govt.nz>
16 NZ State Services Commission, Annual Report: 2007–08, <http://www.ssc.govt.nz>
17 UK Cabinet Office, Annual Report and Accounts: 2007–08, ‘Comprehensive Spending Review, 2007 (CSR)’ pp. 69–71, <http://www.cabinetoffice.gov.uk>
18 OECD 2008, Ireland: Towards an Integrated Public Service, pp. 12, 14, <http://www.oecd.org>
19 Prime Minister’s Office, Finland, 2008, Government Strategy Document 2007, <http://www.government.fi/ministeriot/vnk/en.jsp>
20 State Services Authority and Demos 2008, Towards Agile Government, State Government of Victoria, Melbourne, p. 23, <http://www.ssa.vic.gov.au>
21 UN Department of Economic and Social Affairs, Division for Public Administration and Development Management 2008, UN E-Government Survey 2008: From E-Government to

Connected Governance, <http://www.unpan1.un.org/intradoc/groups/public/documents/UN/UNPAN028607.pdf>
22 ANAO 2007, Whole of Government Indigenous Service Delivery Arrangements, Performance Audit Report No. 10, 2007–08, Commonwealth of Australia, Canberra, <http://www.anao.gov.au>
23 Department of Finance and Deregulation 2008, Explanatory Memorandum to the Financial Framework Legislation Amendment Bill 2008, <http://www.comlaw.gov.au>
24 Department of Finance and Deregulation, Explanatory Memorandum to the Appropriation Bill (No. 1) 2008–2009, <http://www.comlaw.gov.au>
25 Hon. Kevin Rudd MP, ‘Address to Heads of Agencies and Members of the Senior Executive Service’, Great Hall, Parliament House, Canberra, 30 April 2008, p. 7, < http://www.pm.gov.au>
26 COAG Reform Council, CRC Report to COAG, March 2008, <http://www.coag.gov.au>. CRC was established in March 2007.
27 Department of the Environment, Water, Heritage and the Arts 2008, Water for the Future, <http://www.environment.gov.au/water>, <http://www.coag.gov.au>
28 Department of Climate Change 2008, Carbon Pollution Reduction Scheme Green Paper (July 2008), <http://www.climatechange.gov.au/greenpaper/report/index.html>
29 R. Garnaut, The Garnaut Climate Change Review: Final Report, Cambridge University Press, Port Melbourne, Vic., 2008, <http://www.garnautreview.org.au>.
30 Northern Territory Emergency Response Taskforce, Final Report to Government (June 2008), p. 16, <http://www.fahcsia.gov.au/nter>
31 Budget Statement, 2008–09, Closing the Gap between Indigenous and Non-Indigenous Australians, 13 May 2008, p. 32, <http://www.budget.gov.au/2008-09/content/ministerial_statements/html/index.htm>
32 Hon. Jenny Macklin MP, Minister for Families, Housing, Community Services and Indigenous Affairs, Media Release, 6 June 2008, <http://www.jennymacklin.fahcsia.gov.au>
33 Hon. Jenny Macklin MP, Minister for Families, Housing, Community Services and Indigenous Affairs, Media Release, 23 October 2008, <http://www.jennymacklin.fahcsia.gov.au>
34 <http://www.csiro.au/science/SCI.html>
35 <http://www.csiro.au/news/newsletters/Energy/0408_energy/HTML/Maines.htm>
36 AGIMO 2008, Consulting with Government—Online, <http://www.finance.gov.au>

37 Review of the National Innovation System, Venturousaustralia: Building Strength in Innovation (Chair: Dr T. Cutler), (September 2008), Recommendation 10.2, pp. 129–130, 175, <http://www.innovation.gov.au>
38 For the purpose of the State of the Service surveys, the term ‘working with external stakeholders’ was broadly defined as working with other government agencies and jurisdictions, community groups and not-for-profit organisations, industry groups and businesses, tertiary institutions and various research groups, unions, outsourced service providers, other contractors or consultants and individuals within the wider Australian community.
39 AGIMO 2006, Responsive Government: A New Service Agenda, <http://www.finance.gov.au>
40 Sir Peter Gershon, Review of the Australian Government’s Use of Information and Communication Technology (October 2008), <http://www.finance.gov.au>
41 Sir Peter Gershon, Review of the Australian Government’s Use of Information and Communication Technology (October 2008), <http://www.finance.gov.au>

Chapter 11: Inclusive and innovative government The new government has put a high priority on engaging with Australian citizens and communities to progress its reform agenda. ‘We want to take Australians with us by engaging with the community, by harnessing the best ideas and by drawing on the best talents of our people.’1 Innovation and trying new approaches has also been identified as one of the key objectives for the Australian Public Service (APS) by the new government.2
Working with the community and citizens has always been a core element of APS work. This has been achieved through the delivery of a broad range of services, consultation on policy development or programme implementation, and active engagement with the community to address issues of concern.
Improving service delivery has also been a key objective for the APS in recent years, with the introduction of initiatives designed to make the delivery of public services more customer- focused. These include: better approaches to monitoring and gaining feedback on services; reviewing how services can best be delivered and by whom; enhancing employees’ skills, especially communication and networking skills; and harnessing information and communications technology (ICT) as an enabler of better service delivery.
At the same time, tackling many of the priority issues identified by the Government, such as climate change, social inclusion and Indigenous disadvantage, requires citizens to take on a more active role in making changes at the local level. There are growing pressures on the APS to consider and reflect on how to improve its interactions with Australians.
Debate has focused increasingly on how to provide services that are citizen-centred where there is greater citizen and community involvement in all phases of the governmental process—policy and programme design, as well as service delivery. In discussing the challenges of globalisation, the Prime Minister has indicated the need to ‘continue to reform our system of government and government service, so that our citizens lie at the centre rather than the inflexible behemoths of official bureaucracy’.3
Recent government initiatives such as the Australia 2020 Summit and the commencement of regular Community Cabinets have provided new opportunities for direct community interaction with the Government, and for exchanging ideas. The APS will need to respond and build on these initiatives to better incorporate citizen and community views, including how agencies can develop and support more effective and coordinated responses.
The model for collaboration outlined in Chapter 10 indicates that, depending on the issue, a need exists to engage with citizens and communities through a range of relationships—from networking (exchanging information) to collaboration (sharing risks, responsibilities, and rewards). This model of relationships is similar to the Organisation for Economic Cooperation and Development (OECD) model outlined in last year’s State of the Service report, which included three levels of citizen engagement in government policy making— information sharing, consultation and active participation. Further work is being undertaken by OECD

which builds on this schema and examines how to move from ‘open to inclusive government’ where citizens are at the centre of policy design and services.
In Australia, agencies and APS employees will need to continue to develop skills and capabilities to support stronger relations with citizens as well as being strategic about the level of engagement required to address issues as they arise. Differing levels of engagement will be required to tackle different issues, as well as consideration of whether citizens need to take a more active role and change their behaviours to make reforms possible. At the same time, it will be important to adopt innovative approaches to underpin new forms of citizen engagement and reshape policy, programmes and services to respond to community views.
This chapter examines current service delivery arrangements and the mechanisms in place to incorporate feedback from citizens and communities. It also discusses employees’ perceptions of their ability to provide feedback about services, given their experiences as service delivery workers. Approaches to engage citizens in the policy and programme design phases, as well as getting their views on service delivery are also considered, along with the implications for the APS. The role of innovation, and employee perceptions regarding this issue, are also considered, given the key role innovation can play in helping to engage citizens and improve service delivery.
Approaches to service deliveryAs in previous years, service delivery continues to be one of the most important elements of APS activity.
The largest proportion and almost one-quarter (24%) of APS employees work in service delivery roles, in locations such as call centres, shopfronts and at counters—of those employees, 58% deal directly with members of the public.
Three-quarters of the employees working directly with the public said they were satisfied with their job.
The importance of service delivery is recognised in the APS Values (the Values). Section 10(1) (g) of the Public Service Act 1999 (the Act) states that ‘The APS delivers services fairly, effectively, impartially and courteously to the Australian public and is sensitive to the diversity of the Australian public.’4
Community feedback and review of services are some of the ways in which the views of citizens can be integrated into existing services to support improvements in the quality and effectiveness of government services.
Agencies with public contact use a range of feedback mechanisms to obtain information from the public (Figure 11.1). The mechanisms used most frequently include complaints/ feedback website link (92%), liaison with peak bodies (90%) and complaints/feedback phone hotline (78%). Visitors’ book (19%) has the lowest usage rate.

Figure 11.1: Use of feedback mechanisms to obtain information from the public—relevant agencies, 2007–08
Source: Agency survey
Most agencies that collect feedback from the public have mechanisms to ensure that it is fed into service delivery improvements. Figure 11.2 shows that relevant agencies were most likely to integrate feedback into decision-making processes to improve programmes and/or systems, with 82% of agencies reporting that they did so often. Fewer agencies presented feedback findings in public forums.

Figure 11.2: use of feedback collected from the public—relevant agencies, 2007–08
Source: Agency survey
With their direct engagement with clients, service delivery employees are likely to be able to provide feedback to agencies on issues that may arise in service delivery. It is important that agencies emphasise the need to ensure good feedback loops in and across agencies between policy, programme and service delivery activities.
In terms of employee engagement with stakeholders, 66% of those in service delivery areas reported that they rarely met with stakeholders to hear their views. However, more than half of those in policy and programme areas said they usually met with stakeholders to do so. This reinforces the need for effective communication between service delivery and policy and programme development areas. In 2007–08, only 54% of employees believed that their agency used effective feedback mechanisms between the service delivery and policy development areas.
Employee comments suggest there is considerable scope to improve the level of communication and feedback between service delivery and policy development areas. Employees provided a range of suggestions for improving communication in order to improve services, particularly between different areas in agencies:
Greater importance should be given to feedback and suggestions from service delivery staff as they have important insights into the actual impact of policies and could assist in developing policies that assist individuals and address the practicality of implementation.
One key factor is time frames—that is ensuring service delivery is consulted in a meaningful way with enough lead-time for their feedback and suggestions to be incorporated into future

policy directions. In my experience this consultation process occurs after decisions have already been made.
There is a lack of effective communication between policy development and service delivery areas in my agency. This communication gap could be improved through more streamlined reporting, and greater recognition and understanding of the role of the policy unit.
Less of a ‘silo’ mentality and more of a culture of collegial sharing.
Is it a matter of feedback? Or is it a matter of ensuring that feedback is given serious consideration? … How do you make certain public servants stop, listen and innovate?
Recent service improvementsOver the last decade there has been a steady focus on improving the quality of service delivery. These initiatives have included an increasing emphasis on using ICT where appropriate to improve government service delivery within the framework of the Government’s e-government strategies. One key example of this is the development of <http://www.australia.gov.au> and <http://www.business.gov.au>, websites designed to consolidate themes of interest to the public and business in one location. Developments in ICT that support community involvement and innovation are discussed later in this chapter.
Improved use of technology can direct government services and resources more effectively, for example, the introduction of the BasicsCard, a PIN-protected card for buying essential goods and services through the existing EFTPOS network is an initiative to ensure half of welfare payments are used to buy essential items. This is an initiative announced by the Government to improve income management by welfare recipients.
Designing other new ways to make services more readily accessible to the community has also been a priority.
Centrelink’s Drought Bus InitiativeCentrelink’s Drought Bus initiative successfully delivered drought assistance to drought devastated areas of Australia by making connections with people in the community in need of assistance. The Drought Bus initiative has been effective in breaking down barriers, as many farmers were previously reticent about contacting Centrelink to seek help. A large proportion of the 13,000 customers assisted through the buses were new to Centrelink.
Agency reviews have resulted in a range of improvements over the past two years. Of the agencies that responded, a substantial proportion (82%) have reviewed their approaches to delivering services to the public. Eighty-four per cent of relevant agencies made changes to their approaches to service delivery as a result of the reviews. A further 15% of agencies were still finalising reviews.
Most agencies reported an ongoing process of review, for example, ATO’s programme of research continually receives feedback on the services required by the public such as the evaluation process from Easier, Cheaper and More Personalised, client contact review,

Internal Audit and superannuation. The nature of specific reviews and the ways in which they have influenced changes to service delivery are diverse.
Improving agency performance
ATO—Making It Easier to Comply booklet
ATO’s publication of the Making It Easier to Comply booklet details ATO’s current and future work designed to make the taxpayer experience easier, cheaper and more personalised. This is the fifth year ATO has published this booklet, and this year’s edition encompasses ATO-wide activities that help the community comply with their taxation and superannuation obligations. The booklet also details ATO’s achievements for the year as well as the results of the organisation’s community, business and tax practitioner research.
DAFF—Review of service to portfolio industries on international technical market issues
In 2006–07, DAFF reviewed the service it provided to its portfolio industries on international technical market issues. Australia’s primary producers rely heavily on exports and look to DAFF to establish, maintain and improve commercially viable access arrangements in existing and new markets. These issues are often complex and require industry and government to work together closely to develop strategies that achieve results in these markets. The review resulted in better management and coordination of these issues across DAFF.
DVA—Review of compensation claim processing
DVA reviewed compensation claim processing in order to reduce the time taken to process disability compensation claims and applications for increases. As a result, compensation claims are no longer processed only in the location where the applicant resides and/or the applicant lodges the claim.
CSA—Building a Better CSA
As part of Building a Better CSA and implementing child support reforms, CSA has been engaged in a significant process of change aimed at improving customer service and delivering a new child support scheme. This has involved an ongoing review of existing processes and implementation of new processes to provide better outcomes for customers. Additional communication products targeted at particular stakeholder and customer groups (e.g. multicultural and Indigenous, products for young people affected by separation), and additional community information sessions (including for Indigenous and multicultural stakeholders) have also been developed. Major service changes arising from the reviews include the establishment of Regional Service Centres in local communities, intensive customer service training for all staff, call recording, online services, smaller team sizes, better referral processes to other service providers, customer receipts and personalised services, as well as delivery case management for customers with complex cases.
International approaches to service improvements

Internationally, it is becoming increasingly common for generic surveys, which can be applied by a range of agencies, to be undertaken to measure citizen satisfaction with government services. Many agencies already have their own in-house surveys, but the more broad generic kind allows benchmarking across services. The Canadian Citizens First survey, based on the Common Measurements Tool, is now being used in NZ. Public sector agencies in SA and Victoria have also commenced using an adapted version of the Common Measurements Tool to gauge satisfaction with their services.
International highlight—New Zealand Kiwis Count public surveyThe Kiwis Count all-of-government public satisfaction survey5 was conducted in September and October 2007 by the Nielson Company. It surveyed 6,500 New Zealanders, and received a response rate of 61%.
Kiwis Count uses the Canadian Common Measurements Tool to measure public satisfaction with government services. New Zealand has now integrated this survey into the performance measures of portfolios.
New Zealand Government agencies are encouraged to use the information gathered by the Common Measurements Tool to track performance and identify areas for improvement.
The Kiwis Count survey confirmed the six drivers of satisfaction that have the greatest impact on New Zealanders’ overall satisfaction with the quality of service delivery, which accounts for 69% of New Zealanders’ satisfaction. These are:
the service experience met your expectations staff were competent staff kept their promises—that is, they did what they said they would do you were treated fairly you feel your individual circumstances were taken into account it’s an example of good value for tax dollars spent.
The outcomes from these surveys enable the recipients of the service to provide performance feedback directly to service providers; they also allow benchmarking of results across services.
Comments from this year’s employee survey indicate that APS employees recognise an increasing need to consider service delivery from the perspective of the citizen in order to facilitate further improvements:
Recognising that what is clear to those who have worked in the Public Service is often confusing to those who do not understand how the system works. Involve consumers in developing information/forms etc—not just well educated community representatives, but users of the services.
The difficulty continues to be in ensuring that people who need access to services know about them when they are needed. There is little resource for promoting services in city, metro, rural

and remote areas. Time to discuss a customer’s full circumstances is not always available given current funding models.
Difficult for citizens to access relevant area through a phone call. Can be difficult even when working internally to know where to refer people to.
The quality of the basic web information is quite variable across agencies. Any agency should tell you clearly (a) where its offices are (b) what its structure is (c) who you ring to get what and (d) be forbidden to arbitrarily channel all calls to an 1800 number, as distinct from a proper phone number or numbers, because that conflates basic service queries with citizen-interest or citizen-information queries.
Principles of quality service deliveryIn keeping with international trends and the expectations of the Government, there is a need for the APS to continue to focus on improving service delivery. Key principles for providing quality service delivery are articulated in the Dutch Burger Service Code, namely:
a commitment to delivering excellence in client service a detailed understanding of citizen needs and expectations, together with service
delivery realities, should direct service design and delivery government services should be readily accessible to all users government agencies should work collaboratively to improve services to citizens government agencies should work in partnership with other agencies, State and
Territory Governments and the private and not-for-profit sectors service delivery strategies should be developed to mutually enhance citizen value and
best utilise the service delivery capability of different agencies common standards for channels, business processes and supporting infrastructure
across agencies provide the best basis for citizen-centred service delivery effective accountability for outcomes for citizens.6
In its performance audit report on ATO’s Taxpayers’ Charter in June this year, ANAO suggested that ATO, given its experience with charters, could assist the Commission to undertake a review of and update the Client Service Charter Principles. ANAO’s report7 argued that, given the value of charters in shaping the culture of an organisation and improving service delivery to clients, there would be benefits in reviewing the principles so as to ensure their currency and increase awareness of them. Incorporation of the approach to service delivery promoted by the Burger Service Principles, and adapting them to agency circumstances, including exploring opportunities for better coordination and collaboration by agencies, is a key way to take the Client Service Charter Principles forward.
Seeking broader citizen engagement in both the policy and programme design phases, as well as community feedback once services are in place, will be critical to underpinning further service improvements. The level of citizen and community involvement will, of course, vary according to the type of initiative. It will also provide a better basis for securing changes in behaviour by citizens, which is likely to be a tool increasingly relied on to address some of the complex reform challenges facing Australia today.

In NZ, one of the Development Goals adopted for the State Services is ‘Accessible State Services’.8 The Goal is based on the expectation that both policy and services will be designed from an understanding of the different perspectives, capabilities and aspirations of the intended recipients, rather than from the perspectives, convenience or structures of the responsible agency. It represents a major shift in the current practices of many agencies away from ‘one size fits all’ approaches. The design and delivery of policies and services will be undertaken increasingly in partnership with the relevant communities rather than simply delivered to them.
International highlight—UK Public Service AgreementsIn the UK, new Public Service Agreements (PSAs) set out the key priority outcomes the Government wants to achieve in the next spending period (2008–2011). Each PSA is underpinned by a single Delivery Agreement shared across contributing departments and developed in consultation with delivery partners and frontline workers. It is recognised that a government-wide commitment to build services around the needs of citizens and businesses will be integral to the achievement of the PSA outcomes. The UK Government has also published a Service Transformation Agreement, which underpins delivery of the new PSA framework, setting out the UK Government’s vision for building services around the citizen and specific actions for each department in taking forward this challenging agenda.
Increasing engagement with citizens and communitiesThe new government has put in place some specific new initiatives to provide more scope to engage citizens and the community in the ‘ideas’ process, the results of which can be fed into policy and programme development. The Australia 2020 Summit, held in April this year, was a good example of community engagement and open dialogue. The Summit represented the largest ever gathering of Australians in a genuine, community consultation. It enabled the Australian Government to engage directly with 1,000 Australians, and receive input from thousands more, to get their ideas on how to tackle the long-term challenges confronting Australia. Members of the community can continue to give their views on the Summit through the internet at: <http://www.australia2020.gov.au>.
Summit participants emphasised the need to embed processes for greater interaction between government and citizens and the community, as part of their future recommendations for improving governance in Australia.
The Australia 2020 SummitPeople from all around Australia responded keenly to an open invitation to contribute in April 2008 to the development of long-term strategies for the future. The Summit was supplemented by more than 500 local summits throughout Australia, a national youth summit, and nearly 8,800 public submissions. From these, ideas were submitted ranging from a national train network powered by solar energy, to a proposal to develop bamboo as a major forestry industry.

The Australian 2020 Summit Final Report9 included ideas to improve the public service, many based on increasing citizen engagement with government, as well as better collaboration between government agencies and recognition of innovative performance.
Ideas for improving the public service included:
greater interaction between the public service and the community in policy development
greater incentives and recognition for innovative performance and the development of expertise in service delivery and the capacity to move these skills throughout government agencies
harmonisation of service delivery and policy between the Australian Government and State Governments.10
Community Cabinet meetings have been introduced to provide the public with direct access to Cabinet Ministers to present their matters and concerns. Reports on individual Community Cabinet meetings can be found at: <http://www.pmc.gov.au/community_cabinet/>.
Community Cabinet meetingsCommunity Cabinet occurs every four to five weeks in metropolitan and regional centres across the country, usually on a weekend afternoon or weekday evening to maximise community attendance. During the first half of 2008, Community Cabinet meetings were held in Canning Vale, Western Australia, on Sunday 20 January; in Narangba, Queensland, on Sunday 2 March; in Penrith, New South Wales, on Tuesday 15 April; and in Mackay, Queensland, on Sunday 29 June. These meetings attracted some 2,300 members of the public. Subsequent to the Community Cabinet meeting itself, Ministers have also held about 300 one-on-one meetings with individuals who attended.
The Prime Minister and his Cabinet Ministers take questions from the floor in an open forum for about half an hour. After the public forum, individuals attend one-on-one meetings with a Cabinet Minister of their choice to pursue matters of personal interest to them. Individuals have pre-registered for the meetings, and Ministers are supported by senior departmental officials.
All issues discussed and commitments made at the meeting are tracked and a quarterly report is submitted to Cabinet.
International highlight—Canada, Province of New Brunswick—A new model for public engagementDr Donald G. Lenihan, as Advisor on Public Engagement to the Government of NewBrunswick, established and oversaw five pilot projects in New Brunswick on behalfof the provincial government in developing a new model of public engagement.
The model is based on four key principles:
First, the traditional view that government planning and policy making should be the sole responsibility of government officials is too narrow and must change. There is a role for the public in making choices, developing plans and taking action to achieve important social goals. Government must open up the policy process to allow the public to play a role.
Secondly, to make this kind of engagement work, government needs to play a role different from the one it now plays in consultation processes. It must learn to act more as a convenor, a facilitator, an enabler and a partner.
Thirdly, the public is not a monolith, but a complex entity made up of different sub-groups, including stakeholders, opinion leaders, ordinary citizens and communities, all of whom can and should be engaged for different purposes.
Finally, if the public is a complex entity, so is public dialogue. Different kinds of dialogues should be used for different tasks; and different sub-groups are suited to different kinds of dialogue. At present, however, public dialogue is often far less ordered, coherent and disciplined than it should be.
The pilot projects tested the use of ‘new tools’, such as the internet and a variety of techniques aimed at ensuring that the dialogue connects with the people being engaged.
The five pilot projects covered a range of fields such as knowledge management, health, the environment, and sustainable development. These projects were: Skills Development; Reckoning with the New Economy; the Wellness Project; the Climate Change Action Plan Initiative; the Miramichi Action Committee; and Sustainable Communities in a Self-Sufficient Province—Planning our Future Together.
The research found there was no single answer to the question of how government should engage the public. Governments need to adopt different approaches for different tasks. Learning, capacity-building, the development of new guidelines and practices, and culture change are needed to ensure success. The proposed model of public engagement will bring about a fundamental change in the relationship between government, on the one hand, and citizens, stakeholders and communities, on the other. If government is expected to be more flexible, open and collaborative in making decisions and plans, stakeholders, communities and citizens must take on new responsibilities to help solve problems and achieve goals.
The final report from the New Brunswick project, It’s More Than Talk: Listen, Learn and Act—A New Model of Public Engagement, can be found at: <http://www.crossingboundaries.ca>.
Consultation over the proposed national Indigenous representative body to give Aboriginal and Torres Strait Islander people a voice in national affairs and policy development has also commenced.11
Community engagement through advisory councils continues to be promoted. Members of the recently established Prime Ministerial Advisory Council on Ex-Service Matters12 are drawn from every part of the veterans’ community, including servicemen, partners of veterans, war widows and veterans’ advocates. The Council will advise the Government on veterans’ and ex-service issues, and identify problems and priorities to improve the Government’s provision of services.
Other new models of community engagement are likely to emerge, and overseas models may also provide new approaches to engagement suitable for adoption in the Australian context.

Implications for the APSThe dual expectations of improving services for citizens, and including them in policy and programme design stages, are increasing. However, there is no ‘right way’ or model for engagement, nor is there a structural level of engagement that must occur. Agencies and employees will need to ensure they consider citizens in their work, take into account the key principles of quality service delivery, and select the most suitable way forward. Sharing of experiences across agencies will be important, and it will be imperative for all agencies to consider how they can work together in framing their approaches and services for citizens and communities, within the context of budgetary and governance requirements. Research into community engagement and service delivery indicates that citizens see government as a single entity and not as a set of separate agencies they are required to deal with.
This new way of working will have important implications for how agencies operate, and for the skills and capabilities they are seeking in their employees. In terms of agency culture, there will need to be increased emphasis on how to engage and support collaboration with citizens and communities, as well as a focus on promoting best practice endeavours. APS employees’ views suggest that agencies may not be adapting quickly enough to meet the need to incorporate citizens’ views more broadly into policy and programme design. There has been no significant change over the past three years in the proportion of employees agreeing (48%) that their agency encourages the public to participate in shaping and administering policy (e.g. seeks and uses feedback, consults and engages communities on issues affecting them).
Agencies will also need to ensure that all areas of departmental activity (i.e. policy, programmes and service delivery) are cognisant of the importance of citizen engagement— and that a continuous cycle of feedback is in use, as well as effective evaluation tools—in order to harness learning from current service delivery operations. Opportunities for broader sharing of lessons across the APS should also be provided. APS leaders will have to reflect on and model ways of encouraging community engagement and adaptation to reflect community responses.
Agencies must invest more in training and experimental learning for the policy-makers and programme designers, and encourage a style of management in which policy-makers consider how best to seek out and incorporate citizen input. Employees will need to develop a blend of skills, including the ability to build and maintain relationships, manage significant contracts (preferably in partnership with the community), negotiate and resolve conflict, analyse and integrate a range of differing views into policy and service delivery, examine issues creatively, as well as develop the ability to work across portfolio boundaries. Issues related to leadership, learning and development in the APS are explored in more detail in Chapter 5.
Use of information and communications technology
The increasing use of information and communications technology (ICT) to enhance government service delivery provides opportunities for agencies to engage and involve citizens and communities in innovative ways. While traditional forms of engagement will continue, agencies are exploring online approaches to involve the community more.

The Australian Government Information Management Office (AGIMO), a business group of Finance, undertakes a range of activities designed to improve the online access of citizens to government services and resources. Two reports of particular relevance are Consulting with Government—Online13 and Australians’ Use of and Satisfaction with e-Government Services—2007.14
The Consulting with Government—Online report identifies and highlights the findings of public consultations, focus groups and online surveys conducted to collect public opinion on the concept of and interest in a government consultation blog and discussion forum. The consultation was conducted in three phases between 24 September 2007 and 1 December 2007 via a public discussion paper, focus groups and an online survey. In all three phases there was overwhelming support for the concept of a Government consultation blog and discussion forum.
The second publication, Australians’ Use of and Satisfaction with e-Government Services—2007, is the third report in a series of annual studies designed to monitor the level of community satisfaction with and uptake of APS e-government services. Results from these annual reports are a useful tool, enabling agencies to measure the effectiveness of their e-government approaches and to identify areas for improvement. However, it is important to note that citizens without internet access are not included in these studies.
In 2008, the internet became the most commonly reported means for Australians’ last contact with government, replacing telephone and in-person contact as the most commonly used service delivery channels. Over the past 12 months more than three in five people (63%) contacted government using the internet, an increase from 39% in 2004–05. The report also revealed that the proportion of people who undertook most of their dealings with government using the internet increased to 31% in 2007–08, up from 14% in 2004–05.
Although the internet and e-technology are of great importance, a strong case can still be made for using a range of communication tools to interact with citizens, given individual preferences and differing levels of access to ICT across the community.
The APS is making advances in using e-government to improve levels of service delivery to citizens and business. The Australian Government Online Service Point (AGOSP) programme run by AGIMO will leverage Australian Government online infrastructure and technical services to transform <http://www.australia.gov.au>, to make it more convenient for individuals to gain access to and use government information and services. It is expected to improve the online experience of citizens by providing, over time, a single access point for government services and the opportunity to personalise online engagement with government. For business, the Australian Government’s business portal, <http://www. business.gov.au> continues to offer simple and convenient access to government information, transactions and services.
While good progress has been made, there is considerable scope to further harness the internet’s potential to support and improve service delivery and rationalise access points.
In addition, e-Government supports e-participation and citizen engagement in the decision- making process. The UN E-Government Survey 200815 presented a comparative assessment of the 192 UN Member States’ response to the demands of citizens and businesses for quality

government services and products. The survey evaluates the application of ICT by governments. It is pleasing to see that Australia has been rated number eight overall.
Innovation and technology
APS agencies are developing innovative and practical ways of applying new technologies to benefit the community, business and government. Examples of agency initiatives designed to meet users’ needs include:
The use of electronic voting for Defence personnel serving overseas in the 2007 federal election. This was the first time this capability has been used in both a technical and a business context.
The Standardised Business Reporting (SBR) programme was announced by the Council of Australian Governments (COAG) in July 2008 and several Australian and State Government agencies are working on the programme. The SBR programme will develop standard reporting definitions across relevant agencies, making it easier for businesses to identify necessary information to include in business accounting software which will be sent directly to participating agencies.
In June this year a Finance report found there to be significant community support for the development of a government online consultation web space that includes blogs and online discussion forums. Apart from using email and websites, other forms of technology such as blogs are now being used by MPs, Senators and government agencies to provide a more direct channel for conversations with the community.
The Minister for Finance and Deregulation, the Hon Lindsay Tanner MP, for example, has established a business blog on The Age newspaper website to foster citizen engagement. Later this year, Mr Tanner is expected to produce trial blogs for other Ministers and senior public servants to increase their opportunities to interact with citizens.16 ATO also released an e-tax Facebook page called ‘Lodge your Australian tax return online using e-tax’ in July this year. According to the latest ABS data17 on innovation in Australian businesses, ICT skills (35%) were the most prevalent skills type used for innovation purposes.
Increasing the use of Web 2.0 technologies such as blogs, wikis and Facebook could be a way of encouraging broader discussion of innovation among APS employees. Other possible strategies include the introduction of a style of consultation or network among APS employees and senior leaders, both within agencies and across the APS, similar to the Australia 2020 Summit and Community Cabinet meetings, to engage employees.
Creating a culture of innovation Innovation is viewed increasingly as being important to enable APS agencies to respond to complex policy issues, create public value, and improve the performance and responsiveness of public services to citizens in the community.
As one of the seven elements of the Government’s vision for the future of the APS, Prime Minister Kevin Rudd has stated that future public policy professionals need to be characterised by:

... policy innovation, by policy creativity, by policy contestability, by long-term policy planning and by a parallel commitment to excellence and innovation in how we best deliver services to the Australian community.18
The need for a diversity of skills within the APS in order to create innovate policy was also reflected in Mr Rudd’s speech. In it he said:
The leadership groups within the public service should reflect a wide diversity of past work experience. This diversity better enables us to understand the different needs of the Australian community and to develop and deliver better public policy.19
Public service reforms in recent years have attempted to open up government to greater innovation and flexibility. Many of these changes have been essentially structural reforms, such as reducing hierarchy and increasing autonomy for staff, but the structure and processes of government still need to change significantly in order for innovation to thrive in the APS—including consideration of the performance and accountability framework reporting requirements, and whether there are sufficient incentives in their performance management systems to encourage innovation among staff.
Agency cultures need to support and reward innovation, and encourage trials of new approaches and policy options. Agencies also need to increase collaboration between each other, as well as with other stakeholders such as State and Territory Governments, businesses, research groups and community organisations. Improving links and gathering knowledge from overseas government agencies will also foster a culture within APS agencies of new ideas and new directions.
As part of this year’s employee survey, staff were asked for the first time what they thought their agency or the APS could do to meet the challenges of the future. Over one-third of employees in the survey responded, mainly with recommendations for actions in the areas of climate change, education, welfare, the economy, health and the community.
A review of Australia’s National Innovation System (Venturousaustralia: Building Strength in Innovation, 2008)20 was released on 9 September 2008. Among the review’s recommendations were the need to embed a culture of innovation into the public sector, and the creation of a single body to coordinate the innovation activities of public sector agencies. The Government will respond to the review’s recommendations by the end of this year.
A shift from ‘command and control’ to ‘innovation and collaboration’ was one of the four key imperatives driving governments to become more agile and innovative, according to the Victorian Government report, Towards Agile Government (2008):
Governments increasingly recognise that they cannot drive improvements in public services simply by specifying targets from the centre, investing more money and pushing for ever higher standards. Sustainable improvements will only come from enabling public sector agencies to innovate from within, developing their own new approaches in ways that meet the distinctive needs of a wide range of citizens.21
Harnessing ideas from the broader Australian community and encouraging their participation in government processes, through forums such as the Australia 2020 Summit and Community Cabinets, will help APS agencies better understand how government policies affect

Australians. This will also assist the APS to create a culture of innovation, and design the most appropriate services to meet community needs. Embedding citizen-centred service delivery principles into business processes will help achieve this as well.
Review of Australia’s National Innovation SystemBuilding a strong innovation system has been a key focus for the new government in enhancing productivity and economic growth.
On 22 January this year, the Minister for Innovation, Industry, Science and Research, Senator the Hon Kim Carr, announced a wide-ranging review of Australia’s national innovation system to identify gaps and weaknesses in the present system and develop proposals to address them.
The review, conducted by an expert panel led by the industry consultant and CSIRO board member, Dr Terry Cutler, received more than 700 submissions by the 30 April 2008 deadline. The review panel’s report, Venturousaustralia: Building Strength in Innovation, was released by Senator Carr on 9 September 2008.
The review panel made recommendations across a number of key areas, including innovation in business, excellence in national research and information and innovation in government.
The panel made clear that, while Australian Governments have many policy innovations to their credit, they have been less successful at harnessing the insights of those at the government ‘coal face’ and of consumers of government services.
To this end, the review panel recommended a suite of low-cost measures to inculcate a culture of innovation in the public sector from the ‘bottom up’. These include:
1. A body to operate as—
an advocate for those within the public or private sectors who seek to innovate but who are stymied by government culture, practices, structures or regulation
a source of funds and skills for the development of innovative approaches to public policy and/or service delivery, the running of policy trials and government tendering that maximises scope for innovation in the supply of goods and services to government.
2. The use of COAG reform payments to encourage innovation, experimentation and evaluation among the states and territories.22
The review panel also recommended that the appointment of an advisory committee of Web 2.0 practitioners be established to propose and help steer governments as they experiment with Web 2.0 technologies and ideas.23
Evidence of an innovation culture

Given the importance of an innovation culture, it is disappointing that employee perceptions of innovation within APS agencies were largely ambivalent. It is also clear that there is a disparity of views between SES and non-SES employees.
Taking a closer look at the underlying trends from employees’ responses using factor analysis24 (see Figure 11.3), 52% of employees were non-committal or neutral about the existence of an innovative culture in their organisation, specifically in relation to the development of new ideas and whether or not their agency encouraged them to find better ways of doing things. Of the 12 employee engagement factors, Innovation Culture ranked tenth and was among the lowest ranked factors for employee engagement. It was equal to the Senior Leaders factor (39%) and ahead of the Agency Culture factor (27%).
When asked specifically about whether an employee’s agency encourages innovation and the development of new ideas, nearly 70% of SES agreed compared to 49% of EL employees and 45% at the APS 1–6 levels. Members of the SES also felt they had much more opportunity to be innovative and creative at work, with only 10% disagreeing, compared to 22% of ELs and 21% of APS 1–6 employees.
This year there was also a significant drop in the number of employees from large agencies who were satisfied with their opportunities to be creative or innovative in their work (52% in 2007–08, down from 69% in 2006–07). Employees from small agencies believed they had the best chance to be innovative (72%). In large agencies, however, more than double the amount of respondents believed that the SES discourage innovation and creativity compared to those in small agencies. When it came to questions regarding personal innovation, however, employees ranked this factor first out of the twelve employee engagement factors.
Figure 11.3: Factor analysis on innovation in the APS, 2007–08
Source: Employee survey

Employees were asked a number of new questions to gauge their views on their own innovative ability in this year’s survey.
Figure 11.4: Employees’ views on innovation at work, 2007–08
Source: Employee survey
At an individual level, employees strongly agreed with a number of statements on innovation. Ninety-four per cent of employees said they were keen to learn about new ideas at work, with more than 80% interested to try new ideas regardless of how long they have been in the APS. Ninety per cent said they always looked for better ways to do things. (see Figure 11.4).
Most employees (93%) also said they were able to adapt and respond to new challenges quickly and 85% were flexible and open to change. But employees were less confident about how well their agencies managed change, with a seven percentage point drop in 2007–08 (36%) compared to 2006–07 (43%).
Further, there was a significant decrease in the proportion of employees who were satisfied with their chance to be creative and innovative at work (54% in 2007–08, down from 70% in 2006–07) (see Figure 11.5), although satisfaction levels were much higher among SES (78%) and ELs (60%).

Figure 11.5: Chance to be creative and innovative, 2006–07 and 2007–08
Note: Only employees who selected ‘Chance to be creative/innovative’ in their top five most important workplace attributes that impact on how satisfied they are with their job were asked to rate their satisfaction with this attribute.
Source: Employee survey
This data appears to indicate that, while most employees are keen to be innovative and act on new ideas, more than half do not clearly perceive an innovation culture in their agency. It also shows that SES feel significantly more able to be innovative at work than those at lower levels. Innovation is recognised as one of the key ways for organisations to improve their performance and a culture that encourages innovation is also important for job satisfaction.
The value of an innovation culture is well-recognised at management level; just over one-quarter of SES and EL 2 employees (26%) said working in an agency that supports greater levels of innovation was one of the five most important ways that their agency could achieve greater efficiency and effectiveness.
Innovation requires a level of risk-taking, but only 17% of APS 1–6 employees, 25% of ELs and 39% of SES disagreed with the statement: ‘I want to try new ideas, but the public service discourages risk-taking.’
There could be value in public servants participating in conversations around risk-taking and innovation to explore barriers to innovation and change, which may also assist them in resolving issues of personal preference versus agency culture.

Senior leaders, communication and innovation
In agencies where communication between senior leaders and employees was effective, employees were more likely to be innovative and to feel encouraged to develop new ideas. This suggests that there may be scope for considering how communication and perceptions about communication between senior leaders and employees can assist with building a positive innovation culture.
Seventy-one per cent of employees who said communication between senior leaders and employees was effective also said their agency encouraged innovation (see Figure 11.6). Employees who felt change was managed well in their agency were also more likely to believe communication between senior leaders and their employees is effective.
Figure 11.6: Relationship between effective communication in an agency and level of encouragement of innovation, 2007–08
Source: Employee survey
Eighty-four per cent of employees said effective formal and informal communication within their agency was important to them. While 87% of employees said it was important to them to have a manager who encourages and manages innovation, only 55% of employees believe their manager has done this in the last 12 months, and only 35% of employees said senior leaders were receptive to their ideas.
This contrasts with the results that 64% of all employees who had suggested new ideas said they received support from their manager, indicating employees may perceive that their immediate manager is more supportive of innovation than the APS as a whole. Sixty-eight per cent of the SES also agreed that in the last 12 months their manager encouraged and managed innovation well; this was significantly higher than EL employees (56%) and APS 1–6 employees (54%).

Employees suggested ways of improving communication, including how they might best put forward their ideas to senior leaders, in this year’s employee survey comments. One employee said:
The senior executives of our organisation could not care less what the employees think and nor are they interested or receptive to any ideas put forward by other employees. There is no industrial democracy within this organization. There is no consultation or effective communication at all from senior executives towards the employees. Senior executives need to treat their employees with respect and listen to what they are saying and provide venues by which people can express their opinions without being victimised or ignored.
Employee comments suggested that an innovative culture, one where managers communicate effectively and encourage and manage innovation well, was also linked to an increase in an individual’s productivity. One employee said:
Communication has fluctuated in its effectiveness over the last year, however, positive improvements were made after feedback was sought after the staff survey. Since providing further feedback, some really constructive changes have been made to build team morale/ employee engagement by engaging innovation through colleague-based meetings every fortnight ... our section manager has taken a lead in meeting with us all on a monthly basis to see how we are progressing. This has been very important in terms of providing feedback on my future work. This is having a great impact on my productivity and workplace engagement levels.
Employees also commented on the lack of leadership and communication in encouraging and managing innovation within APS agencies.
Managers in the APS do not know how to lead or are not allowed to lead. Innovation does not happen when people are managed.
The senior leadership team have not engendered a climate whereby staff are energised and working to the same goal. Innovation and robust conversation between the senior leadership team and the remainder of staff is not encouraged.
The need to improve communication skills in senior leadership in the APS is considered in more detail in Chapter 5.
Key chapter findingsBuilding an innovative culture and designing services that can meet citizen and community needs continue to be challenges for APS employees, in all areas—policy design, programme design and service delivery.
The Government has made it clear that engaging citizens and the community is a high priority, and while the APS has been making steady progress in improving services and has been receptive to new ways of engaging citizens and the community, significant additional effort is likely to be required on the part of agencies and employees to meet government expectations.

Effective communication between policy, programme and service delivery areas within an agency, and between different agencies, is essential to ensuring that quality services are delivered to citizens at a pace that matches community expectations.
The Rudd Government believes that service delivery should be contestable, with services delivered by whichever sector—public or private—the evidence shows can deliver services most efficiently and effectively. It has also emphasised the importance of engaging with the community, for example, through initiatives such as the Australia 2020 Summit and Community Cabinets.
It is pleasing to see that agencies are continuing to put a strong emphasis on collecting, and responding to, feedback on the quality and effectiveness of government services. As APS agencies work towards building a better future there may be scope to explore international initiatives such as the New Model for Public Engagement developed by the Province of New Brunswick under the leadership of Dr Lenihan and other strategies that take a coordinated approach to benchmarking the quality of service delivery, for example, the New Zealand approach to Kiwis Count that draws on the Common Measurements Tool.
Research by AGIMO shows overwhelming support for the concept of a Government consultation blog and discussion forum for public consultations. There may be potential for more public consultations using ICT in the future. From this perspective it is encouraging to note that the UN E-Government Survey 200825 ranked Australia eighth out of 192 member countries. Innovation, including the use of ICT will be a key tool for improving engagement opportunities.
Innovation will also be important in responding to citizens’ views and designing better services. Employees strongly agreed with statements about their own acceptance and practice of innovation at work. Ninety-four per cent of employees, for example, were keen to learn about new things and new ideas. However, the proportion of public servants who believe innovation is important for their job satisfaction has declined over the past five years, from 30% in 2002–03 to 18% in 2007–08. Employees at the APS 1–6 levels (14%) are the least motivated by innovation, compared to the SES (38%). This indicates there is still some way to go to bring employees along with new visions.
Of note was the large disparity of views between SES and non-SES employees on innovation from a personal work view as well as their agency-wide perspective. Nearly 70% of SES believed their agency encouraged innovation compared to 49% of EL employees and 45% of APS 1–6 employees. SES also said they had more opportunities to be innovative and creative at work. This shows that in the APS, innovation and creativity are more likely to be identified by the SES and that SES employees are happy with their current levels, while non-SES are far less likely to consider they have the chance to be innovative at work. This contrasts with the finding of the Review Panel on Australia’s National Innovation System (Venturousaustralia: Building Strength in Innovation) (2008), which recommended greater innovation at junior levels in the APS. This could be addressed by a series of discussions between SES and non-SES employees around risk-taking and innovation.
In agencies where communication between senior leaders and employees was effective, employees were more likely to be innovative and felt encouraged to develop new ideas. This highlights the importance of effective communication in helping agencies to create and

maintain an innovative culture. This suggests that there is a need for all SES to consider ways of improving communication with non-SES employees.
1 Hon. Kevin Rudd MP, ‘Quality Education: The Case for an Education Revolution in Our Schools’, Address to the National Press Club, Canberra, 27 August 2008, p. 4, <http://www.pm.gov.au>
2 Hon. Kevin Rudd MP, ‘Address to Heads of Agencies and Members of the Senior Executive Service’, Great Hall, Parliament House, Canberra, 30 April 2008, p. 4, <http://www.pm.gov.au>
3 Hon. Kevin Rudd MP, ‘Hard Heads, Soft Hearts: A Future Reform Agenda for the New Australian Government’, Address to the Progressive Governance Conference, London, 4 April 2008, p. 4, <http://www.pm.gov.au>
4 PS Act s.10(1)(g).
5 New Zealand Government 2008, Public Satisfaction with Service Quality 2007: The Kiwis Count Survey, <http://www.ssc.govt.nz>
6 <http://www.burgerservicecode.nl/home>
7 ANAO 2008, Taxpayers’ Charter—Follow-up Audit, Performance Audit Report No. 40, 2007–08, Commonwealth of Australia, Canberra, p. 15, <http://www.anao.gov.au>
8 State Services Commission, Development Goals for the State Services: 2008, NZ Government, <http://www.ssc.govt.nz>
9 Department of the Prime Minister and Cabinet 2008, Australia 2020 Summit Final Report, Commonwealth of Australia, Canberra, <http://www.australia2020.gov.au>
10 Department of the Prime Minister and Cabinet 2008, Australia 2020 Summit Final Report, Commonwealth of Australia, Canberra, p. 334, <http://www.australia2020.gov.au>
11 FaHCSIA, ‘Giving Indigenous Australians a Voice’, <http://www.fahcsia.gov.au>
12 Prime Minister of Australia, Hon. Kevin Rudd MP, Joint Media Release with the Minister for Veterans’ Affairs, Mr Alan Griffin MP, ‘PM Announces Membership of the Veterans Advisory Council’, 6 September 2008, <http://www.pm.gov.au>
13 AGIMO 2008, Consulting with Government—Online, Commonwealth of Australia, Canberra, <http://www.finance.gov.au>
14 AGIMO 2007, Australians’ Use of and Satisfaction with e-Government Services—2007, Commonwealth of Australia, Canberra, <http://www.finance.gov.au>
15 UN Department of Economic and Social Affairs, Division for Public Administration and Development Management 2008, UN E-Government Survey 2008: From E-Government to
Connected Governance, <http://www.unpan1.un.org/intradoc/groups/public/documents/UN/UNPAN028607.pdf>
16 M. Franklin, ‘Out, Out Damned Waste, We Can Drive a Harder Bargain’, The Weekend Australian, 20 September 2008, p. 22.
17 ABS, Innovation in Australian Business, 2006–07, Product No. 8158, <http://www.abs.gov.au>
18 Hon. Kevin Rudd MP, ‘Address to Heads of Agencies and Members of the Senior Executive Service’, Great Hall, Parliament House, Canberra, 30 April 2008, p. 4, <http://www.pm.gov.au>
19 Hon. Kevin Rudd MP, ‘Address to Heads of Agencies and Members of the Senior Executive Service’, Great Hall, Parliament House, Canberra, 30 April 2008, p. 5, <http://www.pm.gov.au>
20 Review of the National Innovation System, Venturousaustralia: Building Strength in Innovation (Chair: Dr T. Cutler) (September 2008), <http://www.innovation.gov.au>
21 State Services Authority and Demos 2008, Towards Agile Government, State Government of Victoria, Melbourne, p. 4, <http://www.ssa.vic.gov.au>
22 Review of the National Innovation System, Venturousaustralia: Building Strength in Innovation (Chair: Dr T. Cutler) (September 2008), <http://www.innovation.gov.au>
23 Review of the National Innovation System, Venturousaustralia: Building Strength in Innovation (Chair: Dr T. Cutler) (September 2008), <http://www.innovation.gov.au>
24 In 2007–08, factor analysis on the employee survey identified a set of 12 factors. These factors provide an overall summary of employee perceptions of issues such as governance and integrity, agency culture (and innovation culture), leadership and management, merit and career progression, work-life balance and personal innovation and flexibility. Chapter 4 contains more information on the employee engagement factor results.
25 UN Department of Economic and Social Affairs, Division for Public Administration and Development Management 2008, UN E-Government Survey 2008: From E-Government to Connected Governance, <http://www.unpan1.un.org/intradoc/groups/public/documents/UN/UNPAN028607.pdf>

Chapter 12: Agency achievements and the way forwardA high-performing and professional APS is critical to the successful design and implementation of policies, programmes and services that underpin the Government’s reform agenda. There was a landmark change for the APS with the transition to the new Rudd Government in November 2007. The smooth nature of the transition reflects the APS’s resilience and professionalism, which was also reflected in the significant preparations undertaken in the pre-election phase and the speed with which the APS moved to support the new government once installed.
Following the November 2007 election, over 12,000 ongoing and non-ongoing employees were moved between agencies as a result of machinery of government changes during 2007–08. It is a tribute to the health of the APS that it managed an efficient transition to these new arrangements and at the same time ably assisted the new government as it embarked on a challenging policy agenda. This chapter provides an indication of the range of work undertaken and delivered by MAC agencies1 throughout 2007–08.
This year’s report shows that overall the APS is a strong organisation that has transitioned well to the new government’s agenda and has also adapted to the more stringent fiscal environment. There are, however, a number of areas where the APS will need to improve to meet the challenges ahead:
further embedding ethics and integrity improving the performance of all agencies building a unified highly professional APS making smarter policy and regulation moving citizens to the centre and encouraging innovation getting workforce issues right.
This is the fourth year the State of the Service report has provided an opportunity for MAC agencies to outline their key achievements and provide a more complete picture of the state of the public service. These achievements provide an indication of the breadth and depth of activity of the APS as a whole. This chapter highlights some of our most important achievements in the areas of environmental sustainability and designing reforms to mitigate the impacts of climate change, improve national security and ensure a robust and productive economy. The APS continues to address the needs of rural communities through drought assistance and has a strong focus on meeting the needs of Indigenous communities. Additional steps have also been taken to create a more flexible, efficient and responsive public service.
Many of these achievements were progressed during the year by agencies working together.
In addition to these achievements, the APS has been working to support finalisation of measures the Government is seeking to implement through the Council of Australian Governments (COAG) and in key areas where reviews of policy have been undertaken.

The themes of this chapter are broadly aligned to the 2020 Summit themes and encapsulate the major policy challenges facing Australia, that is:
the productivity agenda and the Australian economy population sustainability, climate change, water and our cities rural industries and rural communities improving the health of Australians and strengthening communities, supporting
families and social inclusion Indigenous Australians Australian governance Australia’s security and prosperity in a rapidly changing region and world a flexible, efficient and responsive public service.
The responses from MAC agencies can be found in the table at the end of this chapter. Agency achievements are also highlighted at relevant points throughout this report. The scale of these achievements and their significance to Australia and to the region, accentuate the importance of maintaining and enhancing the capability of the APS to deliver effective outcomes.
The productivity agenda and the Australian economyAustralia’s economic credentials have remained robust, even in an increasingly challenging global environment. To meet future challenges, a focus on productivity has included reforms to the labour market, to early childhood education and care, and to the education system. Central agencies have also continued to work on measures to consolidate our economy’s fundamentals.
DEEWR prepared the ‘Transition to Forward with Fairness Bill’, which was the first piece of legislation brought before the new Parliament. Based on principles of fairness and flexibility, the Bill supports a simpler workplace relations system for Australian business and enables the award modernisation process to begin. A universal safety net of 10 National Employment Standards to underpin collective bargaining was also created. Harmonisation of Occupational Health and Safety Laws in Australia was progressed.
In a short time, DEEWR has implemented initiatives to strengthen early childhood education and care, rolled out the first phase of the computers in schools programme, and provided additional training places under Skilling Australia.
To help address skills shortages, DIAC delivered the largest ever skilled migration programme. The programme has been formulated to respond to ongoing labour market needs and recognises that large increases in skilled migration are unsustainable without some corresponding increase in family migration.
DIISR established an Australian Research Advisory Council (ARAC) comprising individuals who represent a broad cross-section of research disciplines.
Significant efforts to improve Australia’s export earning capacity were also undertaken.

RET managed and supported growth in the fastest growing tourism markets, notably the Chinese tourism market, while DAFF provided new and improved opportunities for Australian exporters. This included successful efforts to expand or maintain opportunities for export in the horticultural, beef and grain sectors.
The Treasury continued to work towards meeting the core outcomes of a sound macroeconomic environment, effective government spending arrangements, effective taxation and retirement income arrangements and well-functioning markets.
ATO continued to sustain Australia’s strong culture of voluntary compliance. Revenue collections once again exceeded Budget forecasts. ATO also continued to develop new ways to engage taxpayers, focusing on better engagement with large business, providing direct help with taxation and superannuation and working closer with industry bodies. ATO also enhanced its e-tax capability with over two million individual taxpayers expected to use electronic lodgement for their 2007–08 tax returns.
Finance, PM&C and Treasury supported the Government in formulating and delivering its first Budget, on a schedule that was accelerated by the timing of the 2007 federal election.
DFAT initiatives to boost Australia’s economic growth potential focused on continuing to promote market access for Australian goods and services and the maintenance of the global rules-based trading system.
Infrastructure assisted the Government in developing a National Aviation Policy Statement/ White Paper to guide the industry’s growth over the next decade and beyond.
ABS successfully launched the 2006 Census results primarily via the internet, thereby providing immediate access to results. ABS also launched the 2006 Social Atlas series and the Socio-Economic Indexes for Areas and the Year Book Australia 2008.
Population sustainability, climate change, water and our citiesThe worst drought Australia has experienced for over a century continues to intensify the focus on the urgent need for improved water management. Following the commencement of the Water Act 2007, DEWHA assisted in the implementation of many of the elements of the National Water Initiative (NWI), including the establishment of a water market and trading scheme for the Murray-Darling Basin (MDB) and best practice water pricing.
DCC established a mandatory corporate reporting system for greenhouse gas emissions and energy consumption and production. Large corporations are now required to report their greenhouse gas emissions and energy consumption and production on an annual basis. DCC also supported the development and launch of the International Forest Carbon Initiative (IFCI) and established the National Climate Change Adaptation Research Facility (NCCARF). This facility is one of only a few research institutions around the world focusing specifically on how we adapt to the physical impacts of climate change and climate variability.

DCC also led the drafting of the Government’s Carbon Pollution Reduction Scheme Green Paper which outlines the Government’s approach to the design of a national emissions trading scheme.
DEWHA launched three Solar Cities during the year, in Blacktown, Adelaide and Alice Springs and added nineteen places to the National Heritage list.
RET established the most comprehensive legal and regulatory framework for offshore storage of greenhouse gases in the world, to provide a management system for ensuring that storage is both safe and secure.
Rural industries and rural communitiesDAFF continued drought assistance to support rural families and their farming businesses hit by the worst drought in over 100 years. DAFF also continued to implement measures to assist the agricultural industry and irrigators as they respond to the current drought, the possible reduced water availability under climate change scenarios, and the national water reform agenda.
DAFF advised on and implemented the Government’s reforms to the single wheat desk. A new statutory body, Wheat Exports Australia (WEA), was established to formulate and administer a new wheat export accreditation scheme and to monitor and enforce wheat export arrangements.
Centrelink delivered drought assistance to drought devastated areas of Australia and implemented the Drought Bus initiative to assist farmers reach Centrelink. A large proportion of the 13,000 customers assisted through this initiative are new customers of Centrelink.
Centrelink also led the delivery of assistance to Australians affected by the Equine Influenza outbreak.
Improving the health of Australians and strengthening communities, supporting families and social inclusionMeasures have been introduced to assist priority groups with specific health and medical needs, and to streamline approaches to veterans’ services.
DoHA introduced new funding arrangements for residential care and worked with a number of community, clinical and government stakeholders to develop a national plan to boost the number of life saving organ transplants for Australians.
FaHCSIA developed significant reforms in the areas of disability, mental health and autism and began implementation of the ‘Helping Children with Autism’ package which aims to provide support and services for children with autism spectrum disorders.
DVA streamlined arrangements with 190 private medical day procedure centres resulting in veterans gaining improved access to surgical facilities. Counselling for veterans and veterans’

families remains a vital service area, with almost 11,000 counselling intake sessions being provided in 2007–08.
Centrelink provided disaster recovery assistance in January and February 2008 to those devastated by floods in the Mackay, Whitsunday and Central Queensland regions. Centrelink’s flexible approach to service delivery focused on ensuring that assistance was provided to those in need.
FaHCSIA and the Child Support Agency (CSA) implemented the most significant reforms to the Child Support Scheme since it began in 1988. The changes better reflect the cost of raising children in Australia, balance the interests of both parents, support shared parental responsibility and improve compliance with child support obligations.
DVA continued to reduce the time taken to process compensation claims and finalised all F-111 Deseal/Reseal claims, delivered the majority of ex gratia payments for former Prisoners of War (Europe) and finalised most claims for health treatment for Australian participants in the British Nuclear Test Program.
Steps have also been taken to improve consultation and collaboration with the community. The Australia 2020 Summit achieved its key objective of harnessing ideas from across the nation and produced several hundred policy options, ambitions and themes for consideration by the Government. PM&C provided logistical and secretariat support and over 200 volunteers from the APS assisted in ensuring the event was successful.
Indigenous AustraliaFaHCSIA played a pivotal role to ensure the success of the proceedings and celebrations surrounding the historic Motion of Apology to Australia’s Indigenous People on 13 February 2008. FaHCSIA also took a leading role in organising and implementing the very successful and historic ‘Welcome to Country’ at the opening of the 42nd Parliament. For the first time the Parliament officially recognised the traditional owners of the lands on which Parliament meets.
FaHCSIA led the coordination and establishment of the Northern Territory Emergency Response (NTER) Taskforce Operations Centre with representatives across agencies to coordinate the on-the-ground roll out of all measures and to engage and work closely with communities. NTER is a whole of government initiative involving six government portfolios working in conjunction with the NT Government to address issues of child abuse, safety and stability in Indigenous communities.
Centrelink, DoHA and DHS have all played a major role in the NTER response measures. Significant progress with NTER measures include: additional policing; over 10,000 child health checks; and income management of income support recipients. Required follow-up services resulting from the child health checks have also commenced; these include packages to assist Indigenous people dealing with the effects of alcohol withdrawal after the introduction of alcohol bans and implementation of a new outreach model to support children and families suffering from the effects of abuse and trauma. The NTER measures are aimed at establishing a better standard of living and improved opportunities for children, by improving health, education, employment and welfare services.

The Australian Public Service Commission has continued to foster Aboriginal and Torres Strait Islander employment in both mainstream and Indigenous-specific areas in the APS, and a continuation of this strategy until 30 June 2009 will enable achievements to be consolidated and built upon.
Australian governanceDuring 2007–08, further measures to enhance the transparency and accountability of government were introduced.
Finance supported and contributed to the framework for the conduct of the Government’s fiscal policy and sought to improve outcomes by enhancing the transparency and accountability of the Government’s finances and decision-making processes, and completed over 180 election costings in accordance with the Charter of Budget Honesty Act 1998. Finance also enhanced the transparency of government procurement processes through a major upgrade of AusTender.
PM&C established the Register of Lobbyists and a Lobbying Code of Conduct.
Treasury worked to progress reform of the architecture underpinning Commonwealth-State financial arrangements. Directions were agreed at the March 2008 COAG meeting, including modernising payments for specific purposes and developing National Partnership payments to drive national reform.
Agencies were also active in strengthening other elements of governance. In implementing the Government’s new approach to more transparent and merit-based selection processes for senior APS positions, for example, the Commission introduced new arrangements for senior appointments in the APS, including issuing guidelines for the new process. The publication, Merit and Transparency: Merit-Based Selection of APS Agency Heads and Statutory Office Holders, was released to assist agencies understand the new policy and how it works in practice.
DoHA continued to play a key role in the development of the national registration and accreditation scheme for health professionals, culminating in agreement by COAG to implement the national scheme by 1 July 2010.
DHS successfully progressed current activities that address fraud and non-compliance to effectively target strategic risks for health and social welfare payments.
Infrastructure initiated and organised the first national summit devoted to motorcycle and scooter safety issues, and through the Australian Transport Safety Bureau (ATSB) has adopted the Code of the International Standards and Recommended Practices for a Safety Investigation into a Marine Casualty or Marine Incident, which is a major advancement in the interests of safety for the world maritime industry.
RET strengthened Australia-Timor petroleum governance in 2007–08 by working with the Timor-Leste Government to strengthen the skills and governance systems of the Timor Sea Designated Authority. The work of the Capacity Building Team provided a solid foundation

which will assist the Timorese National Petroleum Authority to become a benchmark for other Timor-Leste Government organisations.
Australia’s security and prosperity in a rapidly changing region and worldMeasures to enhance security, counter-terrorism, and international cooperation were major activities for agencies in 2007–08.
AGD implemented a system to process background checks (AusCheck). This has increased the speed of background checks and is underpinned by the ability of the system to transfer data automatically between the checking partners.
AGD coordinated the Australian Government’s Security support for the APEC Leaders’ Meeting in conjunction with the State and Territory police; this combined effort resulting in an incident-free APEC event.
Customs developed the SmartGate automated border processing solution, as existing border processing methods were no longer able to provide the capacity to process the increased arrivals for eligible travellers.
Defence supported the continued high operational tempo of the Australian Defence Force (ADF) by collaborating internationally, and by actively engaging with stakeholders to progress important initiatives to enhance interoperability, capability development and information sharing.
DFAT continued to enhance key partnerships, including strengthening the alliance with the USA. Engagement with Japan was strengthened. DFAT also led efforts to engage more deeply with China, Indonesia and India on a range of issues. Governance in the region was a key priority and DFAT continued to work to strengthen governance and accountability in PNG under the Strongim Gavman Program.
A flexible, efficient and responsive public serviceMachinery of government changes resulted in the establishment of a number of new agencies and the re-alignment of operations in several existing agencies. These changes were implemented smoothly and the transition to the new government was seamless. Agencies also had to adjust to new budgetary measures, which affected the APS from 1 March 2008. During the year, the APS has implemented a range of programmes designed to extend and increase the responsiveness, efficiency and flexibility of the public service.
The Commission released downsizing principles and the Commission established the Career Transition and Support Centre to assist agencies manage staff redundancies resulting from budgetary measures and to ensure retention of experienced public servants and those with specialist skills. The Commission also upgraded the APSjobs website in order to modernise and improve recruitment across the APS.

ATO developed a workforce plan incorporating leading edge succession planning and an integrated skilling curriculum, which will help to create a sustainable workforce for the future.
DBCDE introduced a wide range of initiatives to improve communications and has increased substantially investment in people through formal leadership, learning and training programmes.
Defence has enhanced its governance framework and developed a new business model to ensure that accountabilities are clearly defined and devolved to the lowest appropriate level.
Finance commenced implementing the Government’s reform agenda in a professional and efficient manner and enhanced the quality, transparency and consistency of Budget reporting aligned to Operation Sunlight and the Murray Review.
ConclusionI am very pleased to be able to conclude this year’s State of the Service report with an overview of the achievements of MAC agencies. These achievements provide a sound understanding of the scope and complexity of the work that agencies have undertaken and demonstrate the interconnectedness of the APS. They also demonstrate the flexibility of the APS and its capacity to move quickly to meet the needs of a new government.
To address the long-term priorities set by the Government, it is imperative that we continue to build our capacity to work strategically, collaboratively and resourcefully today and into the future.
Management Advisory Committee agencies’ key achievements, 2007–08
Theme: The productivity agenda and the Australian economy
Australian Bureau of Statistics
Unveiled the Children and Youth Statistical Portal on 8 October 2007, an online service that improves access to statistical information about Australia’s children. The Children and Youth Statistical Portal is both a source of information and a collaborative forum for researchers. Other agencies contributed to the portal, including Medicare, the Australian Drug Foundation, the Australian Transport Safety Bureau (ATSB), the Australian Institute of Criminology, the Australian Research Centre in Sex, Health and Society and the Telethon Institute for Child Health Research.
Successfully launched the 2006 Census results, primarily via the internet, and for the first time provided immediate access to results. The second release occurred on 25 October 2007 and included data on labour force, hours worked, industry, occupation, journey to work, education and internal migration.

The 2006 Social Atlas series and the Socio-Economic Indexes for Areas were launched in March 2007, along with the ‘Community Profile’ series. On 13 September 2007, ABS handed over the census time capsule to the Director-General of the National Archives of Australia (NAA), which is now the custodian of this information.
Launched the Year Book Australia 2008, in February 2007. At this time the ABS released (online), a century of Australian Year Books, from the earliest edition published in 1908 to the latest 2008 edition.
Australian Public Service Commission
Gained accreditation as a registered training organisation (RTO) in May 2008. The Commission formally commenced operations as an RTO on 1 July 2008, initially offering recognition services for the Certificate IV in Government and the Diploma of Government from the Public Sector Training Package. In the longer-term, nationally recognised training and a range of qualifications will be offered to meet the needs of the APS.
Education, Employment and Workplace Relations
Prepared the ‘Transition to Forward with Fairness Bill’, which was the first piece of legislation brought before Parliament by the new government. The legislation assisted in establishing the Forward with Fairness principles of fairness and flexibility and created a simpler system for Australian businesses. DEEWR developed the underlying policy and legal provisions for the Bill that prevented the establishment of any new Australian Workplace Agreements (AWAs), replaced the ‘fairness’ test with a no-disadvantage test ensuring that employees’ overall terms and conditions of employment were not reduced, and enabled the award modernisation process to commence.
In alignment with the workplace relations legislation, the Australian Government Employment Bargaining Framework (AGEBF) and the Supporting Guidance were also developed, setting out the workplace relations policies applicable to both APS and non-APS agencies. In consultation with the Community and Public Sector Union (CPSU), DEEWR developed the AGEBF, and it was implemented on 29 February 2008. It ensured fairness and flexibility, promoted productivity, provided for collective agreements, negotiated at the individual agency level to become the principal means of setting terms and conditions of employment for non-SES level employees, and enshrined accountability for compliance with the AGEBF on the part of individual agencies.
Formed a governance committee which is overseeing the implementation of around 75 key initiatives. Achievements include: implementing initiatives to strengthen early childhood education and care; rolling out the first phases of the computers in schools program; providing additional training places under Skilling Australia; creating a universal safety net of 10 National Employment Standards to underpin collective bargaining; and making significant progress towards the harmonisation of occupational health and safety laws in Australia.
Established a Strategic Policy Group to provide an enhanced policy scope that spans the lifecycle, from early childhood, through education and into employment and reskilling in adulthood. To proactively identify and take forward the opportunities that come with the integrated agenda, DEEWR quickly put in place structures that capture ideas and thinking in the broader policy context. A taskforce was established to coordinate our significant input to

the COAG agenda. This taskforce has played a critical role in supporting the Deputy Prime Minister directly in her role as chair of the COAG Working Group on the Productivity Agenda.
Commenced a review of the current Employment Service System in July 2007, including the Job Network and Disability Employment Network (DEN). By the end of February 2008, 260 submissions had been received from stakeholders, detailing their suggestions. These submissions were analysed in early March 2008, forming the basis for detailed advice submitted to the Government later that month. Following the Government’s consideration, DEEWR prepared a discussion paper, issued on 16 May 2008, seeking feedback on this advice. Over 190 stakeholders had commented on the paper by 12 June 2008, and their comments initiated the process of designing the policy behind the new system. Taking account of stakeholder feedback, the proposed new system is substantially different to existing arrangements, providing more assistance to highly-disadvantaged job seekers, a stronger focus on skills acquisition and training, and greater incentives for meeting employer demand; it is also a more flexible and efficient system that will reduce waste and enable providers to tailor solutions to individual job seekers.
Innovation, Industry, Science and Research
Progressed Australia’s bid to host the world’s largest and most powerful telescope, the $2 billion Square Kilometre Array (SKA). Achievements in relation to the SKA for 2007–08 included Australia hosting the inaugural international SKA Forum in Perth in April 2008. The second SKA Forum will be held in South Africa in 2009 and a site decision is expected in 2012.
To revitalise Australia’s Public Research Sector, various reviews were commenced during 2007–08. These included the Review of the National Innovation System; the Cooperative Research Centres Review; the Automotive Industry Review; and the Textile, Clothing and Footwear Review.
Established an Australian Research Council (ARC) Advisory Council comprising individuals with backgrounds encompassing academia and/or industry to represent a broad cross section of research disciplines.
Resources, Energy and Tourism
Managed and supported growth in the fastest-growing tourism markets, notably China, particularly through the leadership of the China Approved Destination Status Scheme. This was achieved through the compliance regime and inbound tour operator education and training.
Treasury
Contributed to Australia’s hosting of APEC in 2007. In particular, improved the effectiveness of the APEC Finance Ministers’ process by encouraging effective policy setting and reforming the process by strengthening the link between the Finance Ministers’ and Economic Leaders’ Meetings.

Agriculture, Fisheries and Forestry
Achieved some important wins in market access that will provide new and improved opportunities for Australian exporters. Achievements in recent months have included: successful efforts to maintain access for the $200 million in grain exports to Thailand following changes to plant quarantine regulations; maintenance of the $1.2 billion market in beef following new testing requirements introduced by the USA; reopening of trade in live animals to Libya and Egypt and signing of a MOU with Qatar to ensure that animals are unloaded on arrival; and new or improved conditions for trade in stone fruit to Canada, citrus fruit to Taiwan and Japan, mangoes to Malaysia, and cherries to the USA, providing significant new export opportunities for the horticultural sector.
Australian Taxation Office
Developed new ways to engage taxpayers. A year ago ATO revitalised the Small Business Assistance Program, with a more personalised approach and closer working arrangements with industry bodies and others. So far, it has provided direct help with tax and superannuation to around 60,000 businesses, including more than 5,600 assistance visits to new and emerging businesses. The program also features online services and support tools such as the business portal, self-help calculators and free recordkeeping tools.
Similarly, ATO has focused on better engagement with large businesses. Following on from its Forward Compliance Arrangement initiative introduced in 2006, ATO continued to work with large corporates to codesign a set of options to enable them to better manage their tax risks. In May 2008, ATO launched its Annual Compliance Arrangement (ACA) initiative, which goes a long way down the path of ‘no surprises’. ACAs offer a practical approach to move away from an adversarial relationship to a more constructive one underpinned by collaboration, trust and openness.
Enhanced e-tax capability with the latest e-tax pre-filling initiative that transfers data held by banks and government agencies directly into e-tax, thereby reducing taxpayer burden. ATO has also increased its sophistication in data-matching activities. Over two million individual taxpayers are expected to use this popular electronic lodgement system for their 2007–08 tax returns, ensuring fast tax refunds.
Finance
Successful and smooth delivery in 2008 of the Government’s first Budget. Due to the timing of the election in 2007, the 2008–09 Budget needed to be developed and implemented within a compressed time frame. A new Budget process framework was established that embeds mechanisms to ensure there is clear strategic guidance for the Budget process, greater scrutiny of all expenditure decisions, a strong commitment to programme evaluation and reviews, and enhanced Budget documentation.
Foreign Affairs and Trade
Contributed to economic growth by continuing to promote market access for Australian goods and services and the maintenance of the global rules-based trading system. DFAT led efforts to pursue a successful outcome to the World Trade Organisation (WTO) Doha (Qatar) Round,
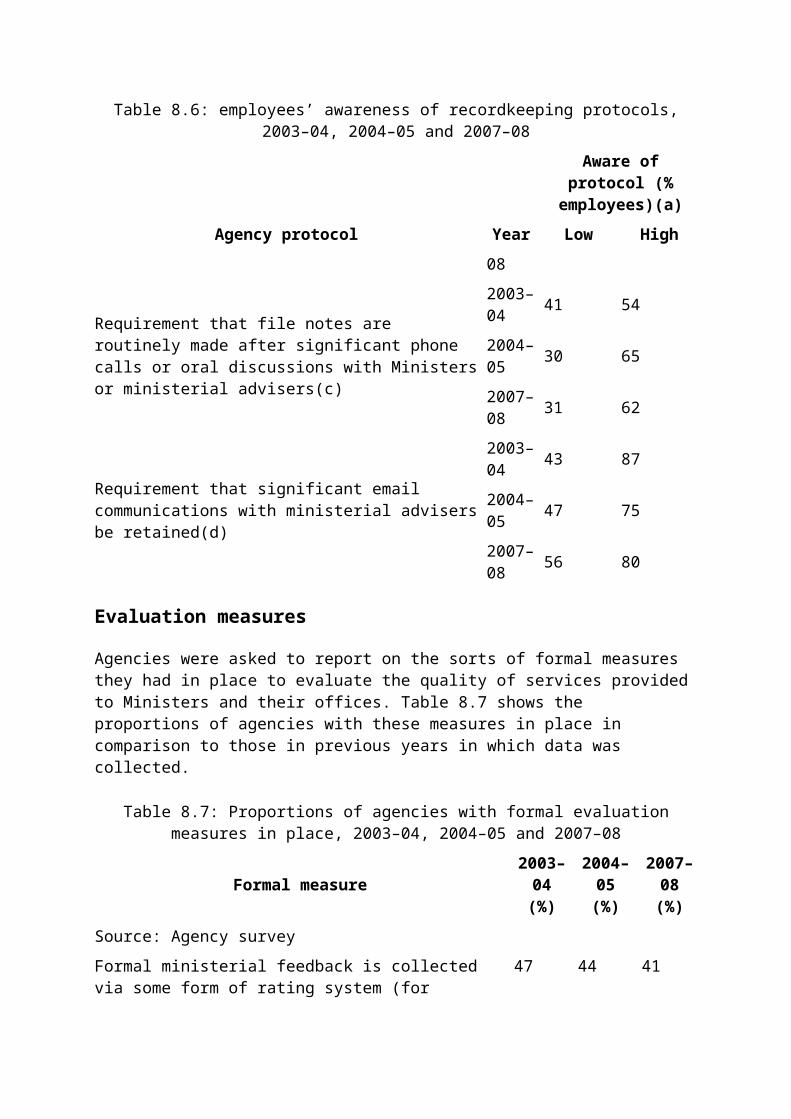
including through the Cairns Group. DFAT also continued to negotiate free trade agreements to open markets for Australian business and investment, and to reduce trade barriers with China, Japan and the Association of Southeast Asian Nations (ASEAN). In May 2008, DFAT finalised Free Trade Agreement (FTA) negotiations with Chile on a high-quality agreement covering goods, services and investment which will deliver new trade and investment opportunities to Australia. In addition, DFAT commenced: a joint feasibility study with Indonesia on the merits of a bilateral FTA in August 2007; commenced a joint feasibility study with Indian officials on an Australia-India FTA in April 2008; and supported a joint non-government feasibility study into an Australia-Republic of Korea FTA, which was released in April 2008. DFAT also strengthened dialogue with the USA on a range of trade issues by building on the Australian-United States Free Trade Agreement (AUSFTA) and announcing that future discussion on trade issues would occur under the framework of Australia-US Ministerial Trade Talks.
Advanced global interests by supporting the Government’s deeper engagement with multilateral institutions, particularly the UN. Prior to the creation of the Department of Climate Change (DCC), DFAT led efforts to address climate change and coordinate whole of government policy on climate change, including coordinating Australia’s participation in the meetings and conference of the parties to the United Nations Framework Convention on Climate Change (UNFCCC) at Bali. Following the transfer of responsibility for climate change negotiations to DCC, DFAT continued to support and advocate the Government’s international environmental policy, including on climate change, biodiversity, biosafety, whaling and forests. DFAT contributed significantly to Australia’s role as host of APEC, which culminated in the Economic Leaders’ Meeting in Sydney in September 2007. DFAT also continued to advocate free trade, regional economic integration and commitment to address international issues such as climate change and human security within APEC. DFAT’s efforts helped secure an invitation for the Prime Minister to attend the G8 Outreach Summit in July 2008, a first for an Australian Prime Minister.
Immigration and Citizenship
Successfully delivered the largest ever skilled migration programme. The 2007–08 Migration Program is on track to deliver very close to the planning level of 158,800 places. This includes a Skill Stream of some 108,500 places (the largest ever) and follows DIAC’s positive response to an increase of 6,000 places in February 2008 to address ongoing skill shortages. The 2007–08 Program is likely to deliver 11,000 more skill stream places than in 2006–07 with the bulk of this increase in the employer-sponsored, demand-driven categories. Planning has commenced on the implementation of the 2008–09 Migration Program which will increase to a total of 190,300—a skill stream of 133,500 places (an increase of 31,000 places from the initial 2007–08 planning level of 102,500) and a Family Stream of 56,500 (an increase of 6,500 places). The programme has been formulated in response to ongoing labour market needs and in recognition that the large increases in skilled migration are unsustainable without some corresponding increase in family migration.
Delivered fully its programme of 13,000 visa grants under the Humanitarian Program in 2007–08. Australia continues to be one of the top three resettlement countries in the world along with the USA and Canada. Humanitarian entrants have been drawn from three main regions (Africa, 30%, the Middle East, 35% and Asia, 35%), in line with the priorities of the UN High Commissioner for Refugees and in consultation with the Australian community and government agencies. The main nationalities of persons granted humanitarian visas in 2007–

08 were Burmese, Iraqi, Afghan and Sudanese. Australia continued to work closely with international partners to find durable solutions to protracted situations such as the Burmese refugees in Thailand and the Bhutanese refugees in Nepal. DIAC administers assistance to help humanitarian entrants settle in Australia and participate equitably in social and economic life.
Implemented a range of new measures to improve support for newly arrived humanitarian entrants, including additional assistance with rental, utilities and public transport costs in the first month after arrival, incentives for interpreters in new and emerging languages and community grants to support sustainable settlement in regional areas. Settlement services focus on building self-reliance, developing English language skills and fostering links with mainstream services.
Implemented the new government’s policy commitments, including cessation of the ‘Pacific Strategy’ and Temporary Protection visas. DIAC moved rapidly to dismantle the ‘Pacific Strategy’ and close the offshore processing centres in Nauru and Manus Province, PNG. The cases of the remaining 89 residents of Nauru offshore processing centre were resolved quickly, with the last group of refugees departing Nauru for resettlement in Australia on 8 February 2008. On 31 March 2008, the International Organisation for Migration (IOM), which operated the centres in Nauru and PNG, closed the centres, returned the sites and gifted assets to the respective host governments. Closure of the centres formally ended the ‘Pacific Strategy’. DIAC is currently amending the legislation so that in future all people found to be owed Australia’s protection under the Refugees Convention will be granted a Permanent Protection visa. Current and former Temporary Protection visa holders still in Australia will have access to a permanent Resolution of Status visa.
Infrastructure, Transport, Regional Development and Local Government
Assisted the Government in developing a National Aviation Policy Statement/White Paper to guide the industry’s growth over the next decade and beyond. The policy development process commenced with the release of an Issues Paper outlining a range of challenges facing the Australian aviation industry as a basis for public consultation. Based on the feedback received from the Issues Paper, Infrastructure developed a Green Paper outlining possible policy directions, settings and reforms for the Australian aviation industry. The Green Paper will be released by the end of 2008 and another opportunity for public comment will be provided. The policy development process will result in the release of a National Aviation Policy Statement or White Paper in mid-2009 addressing each of the short-, medium- and long-term challenges identified.
Prime Minister and Cabinet
Supported the Government in formulating and delivering its first Budget on a schedule accelerated by the election. PM&C adapted and improved existing processes to meet the new government’s requirements and worked closely with Treasury, Finance and line agencies throughout the Budget process. All PM&C policy divisions provided extensive briefing on Budget matters, often within tight time frames.
Treasury
Continued to work towards meeting the core outcomes of a sound macroeconomic environment—effective government spending arrangements, effective taxation and retirement income arrangements and well- functioning markets. Treasury has assisted government with the implementation of election commitments, for example, its involvement in economy-wide reforms such as the review of the tax and retirement incomes system and managing Australia’s transition to a less carbon intensive economy.
Met obligations under the Charter of Budget Honesty during the 2007 federal election, including producing a Pre-Election Economic and Fiscal Outlook (PEFO) report in conjunction with Finance and costing commitments upon request from government and opposition parties.
Assisted the Government to deliver its first Budget in May 2008 and in implementing its economic and fiscal strategy.
Theme Population sustainability, climate change, water and our cities
Climate Change
Established a mandatory corporate reporting system for greenhouse gas emissions and energy consumption and production. The National Greenhouse and Energy Reporting Act 2007 was passed in September 2007 and the first reporting period under the Act began on 1 July 2008. Large corporations are now required to report their greenhouse gas emissions and energy consumption and production on an annual basis.
Reporting by businesses is done on the Online System for Comprehensive Activity Reporting (OSCAR), a web-based portal that enables businesses to compile and report their data online. A key objective of OSCAR is to reduce the greenhouse and energy reporting burden on industry by streamlining the greenhouse and energy reporting requirements of the Australian, State and Territory Governments. This will reduce the number of reports that corporations are required to submit under the current patchwork of Australian greenhouse and energy programmes by 2009–10.
Supported a high-level ministerial delegation to the 13th United Nations Framework Convention on Climate Change (UNFCCC) Conference of the Parties in Bali, December 2007. Made a leading contribution to the significant outcomes in Bali, including providing support for the active participation in the proceedings of the Prime Minister and the Minister for Climate Change and Water. DCC also supported the development and launch of the International Forest Carbon Initiative. The Initiative supports international efforts to reduce deforestation through the UNFCCC and aims to demonstrate that reducing emissions from deforestation and forest degradation can be part of an equitable and effective international agreement on climate change. Two Partnerships have been established under the Initiative. DCC established the Papua New Guinea-Australia Forest Carbon Partnership in March 2008 and the Indonesia-Australia Forest Carbon Partnership in June 2008 to assist both nations in reducing emissions from deforestation and forest degradation.

Established the National Climate Change Adaptation Research Facility (NCCARF) at Griffith University earlier this year. Over the next five years, $20 million will be provided to NCCARF to fund its core functions. Up to an additional $30 million will be made available to fund priority research identified by NCCARF; this will be carried out by researchers from around Australia best placed to do the work. NCCARF is one of only a few research institutions around the world focusing specifically on how we adapt to the physical impacts of climate change and climate variability.
Led the drafting of the Government’s Green Paper on Australia’s Carbon Pollution Reduction Scheme. The Green Paper outlined the Government’s approach to the design of a national emissions trading scheme. It identifies the key design decisions that are required, discusses alternative approaches to dealing with the key questions to be resolved and indicates preferences among options. The Green Paper was the culmination of extensive consultation with industry, community groups and other stakeholders over the past year. Consultation with other Australian Government agencies was also undertaken to ensure that the Green Paper reflected a whole of government approach. Following the release of the Green Paper on 16 July 2008, detailed consultations on the final design of the scheme commenced. The intention is to release a White Paper incorporating these decisions along with exposure draft legislation by the end of 2008.
Customs
Achieved effective deterrence in the area of illegal foreign fishing, thereby consolidating on the gains made in 2006–07.
Environment, Water, Heritage and the Arts
Began operation of flights to Antarctica during the 2007–08 austral summer season. A total of 13 flights were conducted using a specifically modified Airbus A319 aircraft. The Antarctic Airlink is an invaluable service allowing staff and researchers—both Australian and international—to travel to Antarctica from Australia by air in about four hours, rather than up to two weeks by sea.
The Water Act 2007 commenced on 3 March 2008 and supports the implementation of many of the elements of the National Water Initiative (NWI), including: establishment of a water market and trading scheme for the Murray-Darling Basin (MDB); best practice water pricing; working with all parties in the Basin to ensure a balance is kept between all water users, including water to sustain wetlands and the health of river systems; and keeping up-to-date records of water availability and use.
Launched three Solar Cities during the year in Blacktown, Adelaide and Alice Springs. The expanded $93.8 million Solar Cities Program is an innovative programme designed to demonstrate how solar power, smart meters, energy efficiency and new approaches to electricity pricing can combine to provide a sustainable energy future in urban locations throughout Australia. It is a partnership approach that involves all levels of government, the private sector and the local community.
Added 19 places to the National Heritage List. As of 30 June 2008, there were 78 places on the list with every state and heritage environment represented.

Immigration and Citizenship
Implemented an integrated programme of awareness and testing across Australia and overseas for the new Australian citizenship test, which commenced on 1 October 2007. Tests are administered by departmental officers in every DIAC office in Australia, at DIAC posts overseas, and in 30 Medicare Australia and four Centrelink offices around regional Australia. Test outcomes between 1 October 2007 and 31 March 2008 show that 25,067 clients sat a citizenship test and 23,781 of these clients (or 94.9%) passed the test on their first or subsequent attempt.
DIAC is providing secretariat assistance to the independent citizenship test review, which is being chaired by Mr Richard Woolcott AC. The review committee is examining all aspects of the content and operation of the test, the experiences of applicants, the impact on citizenship applications and any other related issues. The Government is confident that the citizenship test can play a valuable role in encouraging people to find out more about Australia and to understand the responsibilities and privileges which being an Australian citizen brings. The committee is yet to report.
Prime Minister and Cabinet
Played a key role in the delivery of APEC Leaders’ Week which culminated in the APEC Economic Leaders’ Meeting (AELM) held in Sydney on 8 and 9 September 2007. The APEC Australia 2007 Taskforce developed, implemented and delivered comprehensive security, logistical and organisational arrangements in consultation with other agencies and the NSW Government. In the lead-up to APEC Leaders’ Week PM&C worked with other agencies to develop key policy outcomes and objectives for Australia and its leaders. Australia’s hosting of APEC 2007 and AELM reaffirmed APEC’s position as the premier regional forum and produced three important statements:
Sydney APEC Leaders’ Declaration on Climate Change, Energy Security and Clean Development
Statement on the World Trade Organisation Negotiations 2007 APEC Leaders’ Declaration.
Around APEC Leaders’ Week in Australia PM&C supported Guest of Government visits that strengthened bilateral relations and promoted cooperation on the key issues of climate change and energy security.
Resources, Energy and Tourism
Established the most comprehensive legal and regulatory framework for offshore storage of greenhouse gases in the world. (Carbon Dioxide Capture and Storage Legislation). The ‘Offshore Petroleum Amendment (Greenhouse Gas Storage) Bill 2008’ was publicly released on 17 May 2008 and subsequently introduced into Parliament on 18 June 2008. The Bill proposes a new range of offshore titles providing for the transportation by pipeline and injection and storage in geological formations of carbon dioxide and potentially other greenhouse gases. The proposed legislation deals primarily with the provision of access and property rights for greenhouse gas injection and storage activities in Commonwealth offshore waters and provides a management system for ensuring that storage is safe and secure, while

balancing the rights of this new industry with the petroleum industry in a manner that encourages investment in both industries.
Led the implementation of a number of Ministerial Council on Energy milestones. These include the finalisation of the new national regulatory regime for gas pipelines contained in the National Gas Law and Rules, and the commitment to a national roll out of electricity smart meters. RET has implemented and overseen the selection process for the board of the Australian Energy Market Operator, and secured agreement that this body will be jointly owned by the energy industry and government.
Agriculture, Fisheries and Forestry
Continued drought assistance to support rural families and their farming businesses hit during 2007–08, by the worst drought in more than 100 years. Over 23,000 families continue to access Exceptional Circumstances income support and more than 53,000 applications for Exceptional Circumstances Interest Rate Subsidies have been approved since 2001. A total of $2.6 billion has been provided to farmers since 2001. Commenced a national review of drought policy, the review consisting of three separate investigations of the economic and social aspects of drought and drought support, as well as a climatic assessment by the Bureau of Meteorology (BoM) and the CSIRO. It will draw upon previous studies undertaken by the Australian Bureau of Agricultural and Resource Economics (ABARE) and the Bureau of Rural Sciences (BRS).
Continued to implement measures to assist the agricultural industry, and irrigators in particular, to respond to the current drought, prospective reduced water availability under climate change scenarios and the national water reform agenda. During the year, more than 7,700 grants of up to $20,000 have been provided to irrigators in the Murray-Darling Basin (MDB) to facilitate improvements in water efficiency—more than $142 million has been expended. $7.5 million has supported more than 3,700 farmers, growers and service providers in the MDB in managing low water allocations. In addition, DAFF has undertaken economic and biophysical work to support sound policy development. A survey done by ABARE provides a deeper understanding of the economic characteristics of irrigators, analyses the effects of water trading in the MDB and the impacts of reduced water availability. BRS also completed aerial surveys of the geology and groundwaters of the central River Murray Corridor revealing new knowledge about the location and quantities of groundwater, salt, and the interactions between surface activities and groundwater.
Provided advice on and implemented the Government’s reforms to the single wheat desk. The new arrangements increase competition in the export marketing of bulk wheat by allowing more marketers to participate in the bulk export sector. A new statutory body, Wheat Exports Australia (WEA), was established to formulate and administer a new wheat export accreditation scheme and to monitor and enforce wheat export arrangements to protect the interests of growers and other industry participants.
Centrelink
Delivered drought assistance to drought devastated areas of Australia. Many areas of Australia remain drought-declared and the social consequences of the drought continue to deepen. The Drought Bus initiative has been very effective in breaking down barriers, as many farmers were previously reticent to contact Centrelink and seek help. A large proportion

of the 13,000 customers assisted through the buses are new to Centrelink. In November 2007, Centrelink received the Prime Minister’s Gold Award for the Drought Bus initiative. The effects of the drought have been particularly stark in the Murray-Darling Basin (MDB) where the water crisis has reached a critical point and communities have come under increasing pressure. In the 2007–08 Budget, Centrelink received funding for two years to support farmers in the MDB hardest hit by the drought. This has funded an MDB hotline, additional Rural Service Officers, social workers and psychologists and the establishment of a new service delivery coordination unit in Griffith, NSW to build community resilience and take a whole of government approach to service delivery.
Led the delivery of government assistance to Australians impacted by equine influenza. Centrelink held a number of special information sessions in affected areas to help industry workers access equine influenza assistance payments.
Human Services
Conducted the Drought Assistance Campaign in September and October 2007, in conjunction with Centrelink and with advice from DAFF. The campaign used television, radio and press advertising to inform farmers and small businesses that depend on the agricultural sector of the government assistance available to them. The Southern Murray-Darling Basin Campaign provided information about Australian Government drought support programmes to irrigators affected by reduced water allocations.
Theme: Improving the health of Australians and strengthening communities, supporting families and social inclusion
Prime Minister and Cabinet
Provided organisational, logistical and secretariat support for the Australia 2020 Summit, which was held at Parliament House over the weekend of the 19 and 20 April 2008. The Australia 2020 Summit was the largest genuine community consultative forum held in Australia to date, involving 1,000 participants from around Australia. A preceding series of events, and a public submissions process, gave thousands more people the chance to debate, discuss, and put forward their ideas and aspirations for the nation. The Australia 2020 Summit achieved its key objective of harnessing ideas from across the nation, and produced several hundred policy options, ambitions and themes for consideration by the Government. More than 200 volunteers, drawn from across the APS, attended the Summit to assist with recording the discussions, escorting participants and invited guests, managing participant registration, and media liaison.
Families, Housing, Community Services and Indigenous Affairs
Developed significant reforms and major projects in the areas of disability, mental health and autism. Began implementation of the ‘Helping Children with Autism’ package, which aims to provide support and services for children with autism spectrum disorders. This is the first national initiative to help families deal with this disorder and is a major breakthrough in support for children and their families. Implemented mental health initiatives under the COAG National Action Plan on Mental Health 2006–11: Personal Helpers and Mentors (48 new services); Mental Health Respites (56 new services); and Mental Health Community

Based (36 new services). These programmes work at different levels to include and support people affected by mental illness within the community and link them to appropriate care and support. This involved collaboration with State and Territory Governments to coordinate and integrate delivery with State services.
Played a key role in negotiating with State and Territory Governments to match the Commonwealth’s $900 million in funding from the Disability Assistance Package. Funding of $1.8 billion will provide more in-home support; supported accommodation; individual support packages; and respite places. The Commonwealth also provided $100 million in capital funding to the States to establish new supported accommodation facilities. This $1.9 billion is the single biggest injection of funding for disability services since the commencement of the Commonwealth State/Territory Disability Agreement (CSTDA).
Health and Ageing
Introduced new funding arrangements for residential aged care on 20 March 2008. The funding arrangements affected both subsidies paid by the Commonwealth and fees and charges paid by residents. DoHA worked closely with an industry reference group and conducted a broad range of communication activities to support implementation. Other changes included combining the Concessional Resident Supplement and Pensioner Supplement into a single asset-tested Accommodation Supplement simplifying and making fairer the arrangements governing Accommodation Charges.
Worked with a number of community, clinical and government stakeholders to develop a national plan to boost the number of life saving organ transplants for Australians. This included in 2007 providing secretariat services and support to the National Clinical Taskforce on Organ and Tissue Donation which presented its final report to the Government in February 2008. The reforms will introduce a nationally consistent and coordinated approach to organ and tissue donation for transplantation under the direction of an independent national authority. A comprehensive evidence-based proposal on reform was prepared for the Government’s consideration.
Worked on a comprehensive Pharmaceutical Benefits Scheme (PBS) Reform package. Streamlined authority arrangements commenced on 1 July 2007 to reduce the administrative burden on prescribers and allow them to spend more time with patients by removing the need to contact Medicare Australia before prescribing. DoHA also introduced new price disclosure arrangements. Over time these arrangements will ensure that the price the Government pays for multiple brand medicine more closely reflects the price at which they are sold to pharmacies. PBS Reform also included incentives for pharmacy and software vendors to process PBS claims online. This has enabled the PBS Online programme to be implemented successfully in approximately 95% (over 4,950) pharmacies nationwide.
Veterans’ Affairs
Introduced streamlined arrangements with 190 private medical day procedure centres around Australia. This has resulted in veterans having improved access to surgical facilities. In recognition of the need to cut red tape wherever possible, DVA has simplified the process for medical and allied health professionals to register as a DVA provider. DVA has also introduced paperless online claiming for providers. In 2007–08, DVA launched the At Ease mental health awareness and information materials, including a new website for the veteran

and defence force communities to access. In May 2008, the Veterans and Veterans Families Counselling Service commenced a national Stepping Out programme to better support Australian Defence Force (ADF) members and their families during the transition to civilian life. Veterans and veterans family counselling remains a vital service area, providing almost 11,000 counselling intake sessions for the year.
DVA continues to enjoy great success from its MATES program which provides information to patients, doctors and pharmacists to help improve veterans’ use of medicines and reduce the risk of adverse affects from multiple medications. In May 2008, DVA and its partner, the University of South Australia, were recognised with the Quality Use of Medicines Award from the National Prescribing Service.
Centrelink
Provided disaster recovery assistance in January and February 2008, by distributing the Australian Government Disaster Recovery Payment that was activated for the floods that devastated the Mackay, Whitsunday and Central Queensland regions. More than 8,000 claims have been granted and $9.5 million has been paid to those affected. The response to this crisis situation highlights Centrelink’s ability to take a more flexible approach to service delivery to ensure that assistance gets to those who need it.
Families, Housing, Community Services and Indigenous Affairs
Implemented the most significant reforms to the Child Support Scheme, since it began in 1988. The reforms were rolled out in three stages between July 2006 and July 2008. Stage Three, which commenced on 1 July 2008, introduced most of the changes, including a new administrative formula for calculating child support (and associated changes to Family Tax Benefits). The changes affect almost all 1.5 million parents and 1.1 million children in the Scheme.
With the best interests of children as paramount, the Reforms bring the Scheme up-to-date with contemporary socio-economic conditions and attitudes. The changes better reflect the costs of raising children in Australia, balance the interests of both parents, support shared parental responsibility, and improve compliance with child support obligations.
The implementation was underpinned by a rigorous project management approach, a clear governance framework to manage the significant legislative and ICT change, and a major communication campaign across multiple Australian Government agencies. This enabled the active management of milestones and risks and resulted in each stage of the reforms being implemented smoothly, on time and on budget.
Veterans’ Affairs
Continued to reduce the time taken to process compensation claims, for example: significantly reduced the number of claims outstanding for more than a year, including a decrease in Veterans’ Entitlement Act 1986 (VEA) processing times; Military, Rehabilitation and Compensation Act 2004 (MRCA) is down from 9% to 2% and Safety Rehabilitation and Compensation Act 1988 (SRCA) is down from 10% to 1%. Finalised all F-111 Deseal/Reseal claims on hand; delivered the majority of ex gratia payments for former Prisoners of War

(Europe); and finalised most claims for health treatment for Australian participants in the British Nuclear Test Program.
Implemented new MRCA/SRCA assessment processes to ensure rehabilitation is properly considered for serving or former members, along with their medical treatment and compensation needs.
Assisted 1,300 policy holders affected by storms in NSW and Queensland. An important focus was a review of operations to ensure Defence Service Home Insurance (DSHI) can sustain quality services and flexible insurance products. Internal business changes commenced in June 2008, and DVA’s objective is to ensure these changes do not negatively affect the services received by DVA clients.
Supported another successful round of services at Gallipoli, ANZAC Day 2008, that was marked by a special ANZAC Day Dawn Service for the 90th anniversary of the battle of Villers-Bretonneux in France. Just after ANZAC Day, DVA dedicated the Australian Light Horse Memorial at the Park of the Australian Soldier at Be’er-Sheva, Israel. DVA supported a range of national events for the 40th anniversary of the Battles of Coral and Balmoral during the Vietnam War throughout May 2008. The Office of Australian War Graves completed extensions to the Gardens of Remembrance in Sydney, Hobart and Launceston, DVA implemented the Overseas Privately Constructed Memorials Restoration Program to support work on non-official memorials, completed the Parit Sulong memorial in Malaysia and commenced work to rebuild the Australian Corps Memorial at Le Hamel in France.
Theme: Indigenous Australia
Australian Public Service Commission
Continued to foster Aboriginal and Torres Strait Islander employment in both mainstream and Indigenous-specific areas in the APS. Held the first National Indigenous Employees Conference, to identify areas for future actions, which was attended by 140 delegates from 50 Commonwealth agencies. The initiative was aimed at continuing the growth of Indigenous employees that occurred over 2007–08. A mentoring programme for Indigenous Coordination Centre (ICC) managers was also established. An evaluation of the APS employment and capability strategy for Aboriginal and Torres Strait Islander employees, implemented in 2005, showed significant and measurable progress toward meeting strategic objectives. A continuation of the strategy until 30 June 2009 will enable those achievements to be further consolidated and built on.
Centrelink
Took part in the Northern Territory Emergency Response (NTER) measures. Centrelink played a major role in the measures, which included child health checks, deploying police and government business managers, banning alcohol and pornography, cleaning up communities, introducing an income management regime and changing participation requirements for income support recipients. Income management was successfully rolled out in prescribed communities, town camps and related outstations in the NT well in advance of the target date of June 2008.

Families, Housing, Community Services and Indigenous Affairs
Played a pivotal role to ensure the success of the proceedings and celebrations around the historic Motion of Apology to Australia’s Indigenous Peoples introduced by the Prime Minister on 13 February 2008 and unanimously supported by the House of Representatives. The National Apology was a major step forward in Australia’s journey of reconciliation and was made on behalf of the Government for the policies of past governments which forcibly separated Indigenous children from their families and communities. FaHCSIA was instrumental in bringing 130 members of the Stolen Generations to Canberra to witness the apology in Parliament, as well as 24 carers and 10 counsellors. Over 300 members of the Stolen Generations and other VIPs witnessed this historic occasion from the Chamber of the Parliament. Many thousands tuned in to the live broadcast to be a part of this historic occasion. Hundreds watched from the Great Hall in Parliament House and thousands watched on the big screen on the lawns in front of Parliament House, where celebrations continued through the day.
FaHCSIA also took a lead role in organising and implementing the very successful and historic ‘Welcome to Country’ at the opening of the 42nd Parliament. For the first time the Parliament officially recognised the traditional owners of the lands on which the Parliament meets and the associated performance and presentation resulted in a memorable and successful event.
Led coordination and the establishment of the Northern Territory Emergency Response (NTER) Taskforce Operations Centre, with representatives across agencies to coordinate the on-the-ground roll out of all measures and to engage and work closely with communities. NTER is a major whole of government initiative involving six Australian Government portfolios which are working in conjunction with the NT Government to address issues of child abuse, safety and stability in Indigenous communities. A local presence has been created through 51 NT Government Business Managers (GBMs) servicing 72 remote communities, supported by the network of Indigenous Coordination Centres (ICCs) in the NT.
Significant progress made with NTER measures has included additional policing, over 10,000 child health checks, income management of income support recipients, licensing and improved functioning of community stores and the translation of over 1,300 Community Development Employment positions involved in government service delivery into regular jobs. An independent review of NTER after its first 12 months is now underway.
Health and Ageing
Managed the implementation of the Improving Child and Family Health measure under the whole of government NTER. As of 26 June 2008 health checks were delivered to 8,963 Indigenous children under 16 years of age in remote communities in the NT. Commencement of required follow-up services resulting from the child health checks include implementation of a package of measures to assist Indigenous people dealing with the effects of alcohol withdrawal after the introduction of the alcohol bans and implementation of a new outreach model to support children and families suffering from the effects of abuse and trauma.

Human Services
Focused on coordinating and improving the effectiveness of services for Indigenous Australians to tackle social dysfunction in Indigenous communities. DHS focused on implementing a wide range of NTER measures initially aimed at protecting Aboriginal children in the NT from abuse and over the longer-term, at establishing a better standard of living and improved opportunities by improving health, education, employment and welfare services.
Prime Minister and Cabinet
Provided briefing and advice to the Prime Minister and his office on matters relating to the apology to members of the Stolen Generations, delivered in the Australian Parliament on 13 February 2008. Following the Prime Minister’s apology, responded to, or prepared, draft replies for over 150 items of correspondence from organisations and individuals who wrote to the Prime Minister on this issue.
Theme: Australian governance
Australian Bureau of Statistics
Celebrated ten years of successfully monitoring and reducing the reporting burden on businesses. The Statistical Clearing House (SCH) is responsible for reviewing surveys involving 50 or more businesses conducted by or on behalf of Australian Government departments and agencies. The primary purpose of the SCH is to reduce the burden of Australian Government surveys on businesses by ensuring such surveys do not duplicate existing collections and are of sufficient quality to warrant the burden imposed.
Australian Taxation Office
Continued to sustain Australia’s strong culture of voluntary compliance. Revenue collections of $279.9 billion were $9.8 billion above Budget forecasts. In collecting this money ATO also made very substantial payments of almost $75.5 billion. These payments include income tax refunds, GST input tax credits and $9.3 billion in excise grants and social benefits.
ATO’s work with other Commonwealth agencies and overseas tax administrations is enhancing its capacity to detect those attempting to conceal their taxable income and assets by hiding them in tax havens. ATO’s work on ensuring compliance with Australia’s superannuation law underpins the ongoing strong growth in retirement savings, with around $60 billion in employer contributions being paid into superannuation.
Focused on the development of seamless policies, strategies and delivery, in particular through significant work on tax and superannuation issues which led to comprehensive briefings and a smooth transition for the new government. ATO’s work on the First Home Savers Accounts proposal and the new Education Tax Refund has led to simpler administrative arrangements. For the First Home Savers Accounts proposal, this includes potential savings for account providers, software developers and first home savers; and for the Education Tax Refund, for parents of school children. In addition, there is increased awareness of wider eligibility rules for fuel credits. ATO stewardship of the Australian

Business Register (ABR) has seen it expand as the main identifier for Australian businesses, providing the framework for whole of government initiatives such as Standard Business Reporting (SBR).
Finance
Supported services during the 2007 election period and successfully completed the Mid-Year Economic and Fiscal Outlook (MYEFO), Pre-Election Economic and Fiscal Outlook (PEFO) in accordance with the Charter of Budget Honesty Act 1998. During the 2007 election campaign, Finance provided assistance to the then Prime Minister, the Leader of the Opposition and their travelling parties. During this time and following the outcome of the election, Finance also provided advice about entitlements and transition arrangements to new Ministers, Senators, Members and over 800 ministerial staff. The Government’s MYEFO and the PEFO were both published in October 2007. In addition, on 28 September 2007, the then Treasurer released the 2006–07 Final Budget Outcome (FBO). The FBO, MYEFO and PEFO contribute to the framework for the conduct of Government fiscal policy and seek to improve outcomes by enhancing the transparency and accountability of the Government’s finances and decision-making processes.
Completed over 180 election costings in accordance with the Charter of Budget Honesty Act 1998 and published them on the website, <http://www.electioncostings.gov.au> during the caretaker period. The costing of election commitments, of both the Government and the Opposition, is a joint responsibility undertaken with The Treasury, when requested by the Prime Minister.
Enhanced the transparency of government procurement processes by a major upgrade to AusTender, which concluded in September 2007. This was the result of over two years of design and development activities that incorporated significant consultation with agencies to align business processes and reporting needs with AusTender capability. The new AusTender features include central publication of Australian Government contracts awarded and a standard reports facility that provides quick access to contract information. All 100 agencies under the Financial Management and Accountability Act 1997 have successfully transitioned their contract reporting to AusTender during Financial Year 2007–08. Additionally, AusTender underwent a substantial programme of change in February 2008 to reflect the recent Administrative Arrangements Orders. Finance worked closely with affected agencies to implement the machinery of government changes, enabling a smooth and timely transition of agencies’ procurement processes.
Health and Ageing
Continued to play a key role in the development of the national registration and accreditation scheme for the health professions. DoHA maintained collaborative arrangements with State and Territory Governments, provided comprehensive policy advice and options for consideration by Government, and maintained effective relationships with key stakeholders representing the affected professions. This work facilitated agreement by the Council of Australian Governments (COAG) on 26 March 2008 to implement the national scheme by 1 July 2010.

Human Services
Successfully progressed, with other agencies, current activities that address fraud and non-compliance to effectively target strategic risks for health and social welfare payments. Also explored opportunities to improve the efficiency and effectiveness of existing programmes to protect taxpayer funds as part of its service delivery reform agenda. In 2007–08, the Core Department, with Finance, established a working group of officials to develop a more strategic approach to managing fraud and non-compliance, including consideration of performance measurement, integration of compliance activity and strategies to reduce overpayments.
Infrastructure, Transport, Regional Development and Local Government
Initiated and organised the first national summit devoted to motorcycle and scooter safety issues. Co-sponsored by the Department, the Federal Chamber of Automotive Industries and the ACT Department of Territory and Municipal Services, the two-day summit was held in Canberra on 10–11 April 2008. The summit developed ideas for improvements in the following areas: motorcycle crash data; effectiveness and availability of protective clothing; targeted education messages for all road users; application of best practice rider training; improved use of enforcement methods; and consideration of the needs of riders in road infrastructure design and roadside hazard detection. Work is being undertaken with the Motorcycle Safety Consultative Committee to consolidate the many ideas into a list of recommended actions.
Through the Australian Transport Safety Bureau (ATSB), drafted the ‘Code of the International Standards and Recommended Practices for a Safety Investigation into a Marine Casualty or Marine Incident’ and negotiated its content with Member States of the International Maritime Organization (IMO). The Code was adopted on 16 May 2008 and will come into effect on 1 January 2010 for the vast majority of IMO Member States as part of the International Convention on the Safety of Life at Sea. The adoption of the Code is a major advance in the interests of safety for the world maritime industry.
Prime Minister and Cabinet
Established the Register of Lobbyists and introduced the Lobbying Code of Conduct. The Standards of Ministerial Ethics released by the Prime Minister on 6 December 2007 committed the Government to the establishment of a Register of Lobbyists. The Lobbying Code of Conduct was prepared for consideration by Government and on 2 April 2008, the Cabinet Secretary released an exposure draft of the Lobbying Code of Conduct for public comment. Following consideration of submissions received in response to the exposure draft, a number of changes were made and the Code was tabled in the Senate by the Cabinet Secretary on 13 May. Lobbyists could apply for registration on the Register of Lobbyists later that day. The Code became fully operational on 1 July 2008.
Resources, Energy and Tourism
Strengthened Australia-Timor petroleum governance in 2007–08, through the Australian and Timor-Leste Governments working together to strengthen the skills and governance systems of the Timor Sea Designated Authority (TSDA) prior to TSDA’s functions transitioning to the

Timorese National Petroleum Authority (NPA). TSDA regulates and administers petroleum activities in the Joint Petroleum Development Area (JPDA) on behalf of the people of Australia and Timor-Leste. On 1 July 2008, TSDA’s functions transitioned into the Timorese bureaucracy, with NPA taking responsibility for regulating JPDA on behalf of Australia and Timor-Leste. Key outcomes included: revised regulations that govern companies operating in JPDA; implementation of better practice corporate governance systems; development of a risk management strategy; and establishment of cooperative relationships between NPA and other internationally recognised government organisations. The work of the Capacity Building Team provided a solid foundation which will assist NPA to become a benchmark for other Timor-Leste Government organisations.
Treasury
Provided leadership for the reform of the architecture underpinning Commonwealth-State financial relations, which was agreed at the March 2008 COAG meeting. Treasury, for instance, developed a new model for financial relations, with priority to modernise payments for specific purposes and the development of National Partnership payments to drive national reform.
Australian Public Service Commission
Introduced new arrangements for senior appointments in the APS to implement the Government’s new approach to more transparent and merit-based selection processes for senior APS positions. The Commission also issued guidelines for the new processes and released the publication, Merit and Transparency: Merit-Based Selection of APS Agency Heads and Statutory Office Holders, to assist agencies understand the new policy and how it works in practice.
Theme: Australia’s security and prosperity in a rapidly changing region and world
Attorney-General’s
Implemented AusCheck. In its first nine months of operation, AusCheck received more than 100,000 requests for background checks for people working in the secure areas of air and seaports. Of these, 66% were processed in less than five days and 97.9% in less than 20. The speed of this service is underpinned by AusCheck’s IT system which automatically transfers data between the system and the checking partners (ASIO, CrimTrac and DIAC), as well as the issuing authority which lodged the request.
Coordinated the Australian Government’s security support for the APEC Leaders’ Meeting and all of the preliminary senior officials’ and ministerial meetings over a period of eight months. While the State and Territory police had operational responsibility, AGD provided strategic support and tangible Australian Government assistance (including the provision of funding for police horses, jet skis and helicopters and upgrades to the NSW Police Operations Centre). This combined effort resulted in an incident-free APEC event.

Customs
Developed the Customs 2015 Strategic Outlook to assist in: formulating policy guidance; developing strategies and operational responses; and identifying capability development requirements. The key complexities of Customs’ operating environment include: the size and diversity of the Australian border, encompassing activities in extreme natural environments such as the coastlines and oceans in the north and south of Australia; the typically short intervention times at the border to prevent illegal movement of people or harmful goods; the responsiveness of those trying to breach the border to the interventions Customs develops; the importance of working closely with the range of agencies with an interest in the border often exercising powers on their behalf, and at other times working with them to complement each other’s capabilities and powers; and the tension inherent in the border protection role.
Implemented the first phase of the SmartGate automated border processing solution, as Customs has recognised that existing border processing methods can no longer provide the capacity to process the increased arrivals for eligible travellers. SmartGate has been introduced into Brisbane, Cairns, Sydney and Melbourne international airports. It is due to be introduced into the remaining Australian international airports by 2009.
Defence
Effectively supported the continued high operational tempo of the Australian Defence Force (ADF) which is dealing with the complexity and challenges of the global environment. Defence has maintained a robust preparedness management system that is used to provide accurate and well-considered advice to government on military options and concurrency implications. Additionally, Defence personnel and assets remain available to respond to Australia’s domestic and regional responsibilities.
Collaborated internationally and actively engaged with stakeholders and whole of government. This included progressing important initiatives with the USA to enhance interoperability, capability development and information sharing. In the Asia-Pacific, Australia’s interests centred on counter-proliferation and capacity building in support of peace operations. Closer dialogue and interaction of Defence issues was pursued through security agreements and arrangements with the Philippines, Indonesia, Turkey, France and Japan. The Defence and Industry Policy statement was reviewed in 2007 and engagement with industry was expanded to ensure that cost-effective and timely delivery of equipment and support to the ADF is achieved.
Agriculture, Fisheries and Forestry
Responded promptly to coordinate the rapid eradication of the August 2007 outbreak of equine influenza by the end of June 2008. The national emergency animal disease systems ensured that the response was timely, well-structured, well-resourced, inclusive of industry and comprehensive. The Australian Chief Veterinary Officer chaired the Consultative Committee on Emergency Animal Diseases that was charged with technical management of the eradication effort and, in turn, reported to the National Management Group, chaired by the DAFF Secretary, which had overall responsibility. These committees included representatives from all states and territories as well as various industry sectors. Crucial technical input into contingency plans was provided, and included: vaccination regimes; movement controls; and

most importantly, establishing the regime to prove that Australia has eradicated equine influenza from the country.
Organised quarantine clearance and emergency registration of the vaccine used in the eradication, provided national and international stakeholders with situation reports on eradication progress, and kept the media updated. To ensure the eradication effort could continue, resources were allocated to affected jurisdictions. DAFF assisted industry business continuity by developing relevant policies for the distribution of financial assistance.
Foreign Affairs and Trade
Continued to enhance key partnerships, including strengthening the alliance with the USA, Australia’s most important strategic partner. DFAT supported efforts to conclude the Work and Holiday visa arrangement with the USA in September 2007, which will further enhance strong people-to-people links. DFAT worked to strengthen engagement with Japan, one of Australia’s key partners, on security cooperation, economic relations, climate change, energy security and taxation. DFAT also led efforts to engage more deeply with China, Indonesia and India on trade and economic cooperation, regional security and disarmament and environmental issues.
Further strengthened DFAT’s role as coordinator of the Government’s international security, non-proliferation and counter-terrorism strategies and worked toward enhanced security cooperation with a range of key partners, including Indonesia, Japan and China. Security cooperation with Indonesia was enhanced with the exchange of notes in February 2008, bringing into force the Lombok Treaty which enables deeper engagement and establishes a mechanism for dialogue on cooperation on defence, law enforcement, counter-terrorism, as well as transnational crime, maritime security, non-proliferation, and emergency cooperation. In September 2007, DFAT agreed on an action plan to implement the Joint Declaration on Security Cooperation with Japan. Australia continued to provide support for the rule of law, governance and the promotion of economic development to East Timor and Solomon Islands. Australia also continued to support the return of security, governance and economic development in Iraq and Afghanistan. DFAT supported the Government’s renewed commitment to the promotion of nuclear disarmament. Australia participated actively in the 2008 Preparatory Committee for the Nuclear Non-Proliferation Treaty and provided strong support to the Comprehensive Nuclear-Test-Ban Treaty.
Worked towards strengthening governance in our region through the Pacific Engagement Strategy by chairing a high-level interdepartmental Steering Committee and the Pacific Partnerships Taskforce. DFAT supported the negotiation of new Pacific Partnerships for Development with Pacific Island countries (initially with PNG and Samoa) and other key initiatives to strengthen their service delivery, governance and economic growth capacities. In April 2008, Australia and PNG agreed that Australia would continue to help strengthen governance and accountability in PNG under the Strongim Gavman Program. DFAT continued to lead efforts to promote stability and growth in Solomon Islands through the Regional Assistance Mission to Solomon Islands (RAMSI), and strongly advocated a return to democratic rule in Fiji.
Theme: A flexible, efficient and responsive public service
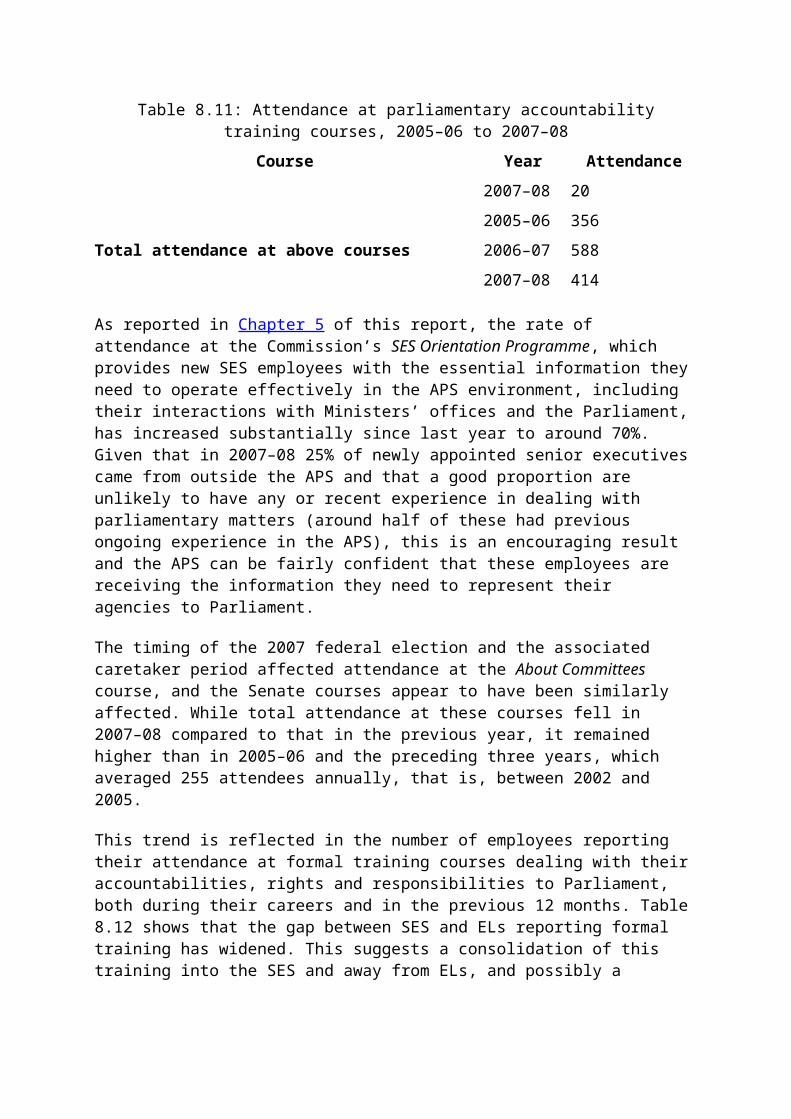
Attorney-General’s
Assumed responsibility for Australia’s inter-country adoption programme during the year. AGD provides strategic direction for this programme and manages our relationships with our partner countries (including China, South Korea and Ethiopia). In 2006–07, 405 overseas children were adopted by Australians under this programme. The states and territories will continue to process individual applications for adoption of children identified through the inter-country programme and AGD is working closely with them to harmonise inter-country adoption laws and practices.
Australian Bureau of Statistics
Created a new organisational structure for ABS on 2 July 2007, through the ABS Strategic Alignment Program, enabling ABS to more effectively meet future challenges and priorities.
Australian Public Service Commission
Established the Career Transition and Support Centre to assist agencies manage staff redundancies resulting from budgetary measures and to ensure retention of experienced public servants and those with specialist skills. The Centre opened in May 2008 and it has worked actively with agencies to provide best practice advice on redeployment, including guidance on the application of the redeployment principles, and providing case management services to APS agencies.
Modernised and improved recruitment across the APS, by upgrading the APSjobs website, which replaced the Public Service Gazette. APSjobs provides an up-to-date online image for the APS, offering a range of interactive alerts and information for job seekers. Usage has grown to approximately 3,000,000 hits per month. New publications aimed at streamlining recruitment were launched, supported by interactive workshops held around the country, and a streamlined recruitment project has been piloted for 17 APS agencies, aimed at tackling the shortage of key finance and accounting skills.
The Commission managed the machinery of government changes needed to give effect to the new APS organisational structure.
Australian Taxation Office
Developed a workforce plan, including leading edge succession planning and an integrated skilling curriculum, helping to create a sustainable workforce for the future. It has been showcased globally by the Corporate Leadership Council (CLC) and all APS agencies will soon be able to access the succession management framework and tools. ATO has developed a new manager’s survival skills programme and an emergent leaders programme which have both been accredited for a Diploma in Government and will be delivered across the APS by the Australian Public Service Commission.
In December 2007, ATO launched the Reconciliation Action Plan, which commits ATO to a range of measures in employment and retention, cultural awareness and assistance to Indigenous Australians. ATO’s health and safety early intervention and prevention strategies

continue to deliver results with the number of claims accepted by Comcare declining by almost half this financial year.
Broadband, Communications and the Digital Economy
Boosted DBCDE’s capability in the areas of strategy and leadership. A range of new initiatives have been introduced to improve communication. These measures have assisted in communicating the Minister’s and the Government’s priorities and in raising awareness of service-wide and industry issues. Stronger linkages have been established across levels and between areas within DBCDE and beyond. Examples of initiatives include: staging a Departmental Expo which was opened by the Minister; commencing a programme of regular lunchtime presentations by external speakers; introducing a monthly departmental newsletter; establishing regular all-staff department-wide meetings, all-staff branch meetings and a programme of cross-branch SES presentations to branch meetings; establishing Executive Level-led forums; group and individual training for SES within DBCDE on strategic issues; and installation of a portfolio showcase to promote DBCDE’s portfolio linkages to visitors and staff.
Substantially increased investment in people over the year through formal leadership, learning and training programmes and new initiatives to brief staff on strategic issues and directions. In dollar and resource terms, investment in these areas has increased, and the depth and quality of initiatives have been substantially improved through the introduction of: a face-to-face induction programme to brief new staff on the strategic context of DBCDE by senior staff; a staff rotation scheme to promote staff development; checklists for university and Year 12 graduates to ensure they receive a breadth of challenges and experience during their rotations; upward feedback for SES officers from the mid-term stage of the performance agreement process; and the introduction of a programme of guest speakers for professional development.
Improved and reviewed the risk management approach and streamlined processes to more effectively support outcomes over 2007–08. A balanced approach has been adopted to ensure that appropriate accountability and controls are maintained while cutting red tape. The Chief Executive’s Instructions (CEIs) have been reduced by more than 50% to provide clear and concise guidance to staff, and briefing sessions have been held—reaching over 95% of staff and contractors—in order to raise levels of assurance that staff understand their obligations.
Initiated review processes for all DBCDE programmes and implemented an improved business reporting process to raise standards and accountability in line with the Government’s wider policy priorities.
Boosted strategy and leadership, thereby making a more effective contribution to future policy. Strengthened responsiveness and strategic policy development capability to take account of feedback from stakeholders, including the Minister’s Office, central agencies, industry and clients. DBCDE has implemented an evidence- based approach and increased responsiveness to meet the policy agenda in a timely and appropriate manner with early progress on all major commitments, including the National Broadband Network, Digital Switchover, Cyber-safety, the digital economy and a strengthened consumer focus in communications. The progress achieved by DBCDE has attracted positive feedback and recognition from the Minister and central agencies.

Centrelink
The 2007 Centrelink People Survey presented some positive results. Key findings included an increase in the number of employees who reported job satisfaction and who are able to balance their work and personal life. There was also an increase in the proportion of employees who felt they had received appropriate training to do their job effectively. Another positive result was a dramatic improvement in staff motivation across all drivers with the most significant improvement in leadership, influence, development and alignment.
Customs
Focused on developing workforce capability, in particular through leadership and management skills, including Customs’ ‘Leading at the Frontline’ programme for frontline supervisors and the SES Development Program.
Successfully transitioned to new ICT service providers and the implementation of new service delivery and ICT management arrangements through CustomsIT.
Defence
Enhanced our governance framework to ensure accountabilities are clearly defined and devolved to the lowest appropriate level. This included implementation of the new Defence Business Model which clearly identified roles and responsibilities, improved information management to support decision-making, a strengthened internal service delivery model, strengthened cost visibility and enhanced performance management. Defence also strengthened its ability to support its Ministers and other portfolios, and whole of government decision-making through creation of a central policy development division.
Continued to focus on recruiting, building and retaining a highly-skilled, adaptable and responsive workforce. A new strategic HR policy organisation has been created, aligned to Defence priorities and decision-making. The new organisation focuses on policy, planning and evaluation in relation to key issues such as recruitment and retention, remuneration and reward, people development, leadership and the working environment.
Continued to build strong business systems and effective processes. Financial management and systems reform remains a high priority. The savings and efficiency programme will deliver up to $1 billion per annum for the next 10 years in savings and efficiencies for reinvestment in priority areas of Defence. As part of the development of the new Business Model, Defence has mapped core business processes.
Climate Change
Since the creation of DCC in December 2007, core administrative functions to support governance and accountability frameworks and support services for the Minister have been established. Policies, procedures, systems and reporting arrangements to meet the reporting and legislative requirements of departments of state and to ensure that there is adequate capacity to deliver on the Government’s climate change agenda have been established. The success of these administrative functions was demonstrated by DCC’s ability to expand from

a single person on 3 December 2007 to over 250 by 30 June 2008 while supporting its delivery of government initiatives and existing programmes.
Education, Employment and Workplace Relations
Successfully implemented structural changes to the Portfolio, including the creation of DEEWR which brought together a range of policy areas and provided the opportunity to positively impact on all Australians throughout their lives. The challenge was building an organisation able to respond and deliver on this new and exciting agenda. To manage the huge process of establishing DEEWR, a Committee and Taskforce were formed. The Committee played a key role in establishing corporate governance arrangements, initiating risk and strategic planning processes, parliamentary workflow systems and the integration of key enabling areas. The Committee is currently involved with further aligning its organisational structure to reflect the Government’s participation, productivity and social inclusion agenda.
Environment, Water, Heritage and the Arts
Successfully implemented structural changes to the Portfolio, including establishing Screen Australia and the National Film and Sound Archive as new statutory authorities in March 2008.
Families, Housing, Community Services and indigenous affairs
Strengthened significantly FaHCSIA’s financial management systems and processes, ensuring that sound financial management is a priority. This has been recognised by ANAO and is evidenced by a significant reduction in ‘category B’ findings over the past three years, from 15 ‘category B’ findings in 2004–05 to only one in 2007–08 which is expected to be cleared during the year end audit. The agency faced a number of financial challenges in 2007–08, including leading the initial roll out of the Northern Territory Emergency Response (NTER), implementing machinery of government changes, and responding proactively to the additional efficiency dividends.
Adopted specific strategies to lift financial performance, including: setting up a Senior Level Task Group, chaired at Deputy Secretary level, to focus on addressing ANAO findings; implementing a March hard close; implementing out-posted Group Finance Managers (from the Chief Finance Officer) to support groups with their financial obligations; developing and implementing a Budget allocation tool to improve the accuracy and ease of financial reporting; enhancing monthly monitoring and reporting to the Executive Management Group; conducting two rigorous Budget reviews; approving and allocating a balanced Budget for 2008–09 before the end of the 2007–08 financial year; requiring Certificate of Compliance sign-offs at Branch and State Office levels; and expanding financial management training across the agency.
Finance
Provided services and advice for the 2007 election and transition to the new government. Finance provided assistance to the then Prime Minister, the Leader of the Opposition and their travelling parties throughout the election campaign period. Following the election, Finance provided advice on entitlements and transition arrangements to new Ministers, Senators,

Members and their staff. The busy workload included processing final entitlements payments to over 800 staff affected by the change of government, the establishment of new electorate and ministerial offices and the provision of home department services to new Ministers.
Commenced implementing the new government’s reform agenda with the establishment of teams to deal with deregulation, an expenditure review taskforce, centralised procurement, new superannuation arrangements, new investment funds, COAG reform and assisting with the Gershon Review of ICT Procurement. Finance undertook significant work towards achieving these new initiatives within the first few months of the new government coming to power.
Enhanced the quality, transparency and consistency of Budget reporting through the implementation of the Operation Sunlight reform agenda. A first round of reforms was introduced as part of the 2008–09 Budget, including the redesign of agency Portfolio Budget Statements and enhancing Budget Paper 4 (Agency Resourcing) through the introduction of new tables on special appropriations and agency special accounts, and the removal of repetitive information. Finance has also supported Mr Andrew Murray (ex Senator for WA) in preparing his report to Government on options to further improve the Operation Sunlight reform agenda by providing background information on the financial framework, and by discussing implementation issues.
Human Services
Improved customer services by coordinating a Portfolio-wide approach to improving forms and letters produced by DHS Portfolio agencies with the objective of making services easier for customers to access and understand. During the year, more than 200 letters and 253 forms were reviewed and amended to remove excessive complexity and adopt best practice design. As a result, 22 forms were abolished.
Effectively worked with stakeholders to develop new quality assurance and performance frameworks for Job Capacity Assessment, to be implemented from 1 July 2008, and began an overhaul of training, guidelines and processes.
Immigration and Citizenship
Processed applications effectively and efficiently to meet the considerable demand for temporary migration (as well as permanent migration). In 2007–08, approximately 23.5 million people crossed Australia’s borders. Around 333,000 people came to Australia for more than one year to work, study or travel. Strategies to provide better access for clients and more timely processes resulted in, for example, students lodging 50% of visa applications electronically.
Infrastructure, Transport, Regional Development and local Government
Infrastructure Australia was established following the 2007 federal election. Infrastructure defined the initial work programme of Infrastructure Australia as including the National Infrastructure Audit, the Infrastructure Priority List and best practice guidelines for Public Private Partnerships. Key activities included drafting new legislation to establish Infrastructure Australia, supporting the new Minister in appointing Infrastructure Australia
members, and providing the secretariat support necessary to ensure they were able to meet in early June 2008. The work required the cooperation of a number of government agencies, including the Office of Legislative Drafting, the Remuneration Tribunal and a number of central agencies. The work will enable government and the private sector to get high-level policy advice in the future in support of their infrastructure investment decisions.
Collated and launched the inaugural Australian Transport Statistics Yearbook in March 2008. The yearbook provides detailed coverage of: the relationship between the transport industry and the Australian economy; freight and passenger activity; the modes of transport activity; and impacts of transport relating to safety, energy and the environment. The yearbook is an annual publication available from the Bureau of Infrastructure, Transport and Regional Economics at: <http://www.bitre.gov.au>.
Innovation, Industry, Science and Research
Successfully implemented structural changes to the Portfolio, including forming the Department of Innovation, Industry, Science and Research. Together with IP Australia, DIISR brought together a number of agencies to form a portfolio which included: the Commonwealth Scientific and Industrial Research Organisation (CSIRO), the Australian Nuclear Science and Technology Organisation (ANSTO), the Australian Research Council (ARC), the Australian Institute of Marine Science (AIMS) and the Anglo-Australian Telescope Board (AATB). The Australian Institute of Aboriginal and Torres Strait Islander Studies (AIATSIS) joined DIISR in a second round of Administrative Arrangements Orders on 25 January 2008.
DIISR implemented machinery of government changes as a result of the 2008–09 Budget announcements.
Resources, Energy and Tourism
Successfully implemented structural changes to the Portfolio, including establishing Resources, Energy and Tourism (RET), on the 3 December 2007. Within days—with the support of the former Industry, Tourism and Resources (ITR) infrastructure—RET was operational. It continues to deliver the programmes and administer the legislation, providing support to the Minister and his Offices, and building corporate capability.
Veterans’ Affairs
Improved significantly the way client calls are handled through the establishment of the Veterans Service Centre. The financial year 2007–08 was the first full year of operation and by year’s end many enquiries were being addressed on the client’s first call. The Centre is being supported by aDVAnce, a significant ICT development flowing from DVA’s investment in the Curam system. The Client Liaison Unit was established during the year to address complex issues more effectively, and to provide coordinated support for clients who are more vulnerable and need closer case management in claiming their entitlements. Work has also commenced on options to provide advice to DVA’s younger clients on their mobile phones using SMS. DVA has also finalised arrangements with Centrelink and a number of other agencies to increase veterans’ access to information services in Victoria, NSW, Queensland, WA and Tasmania.

Continued to build stronger links with Defence during 2007–08. DVA was an active participant in the Integrated People Support Strategy Pilots, which aim to enhance support to ADF members as they make the transition to civilian life and DVA forged new links with the Defence Community Organisation to support members and their families. Following the creation of the Single Access Mechanism (SAM) team in 2006–07, DVA implemented the DocTracker service to increase efficiency and responsiveness in the movement of personnel records between DVA and Defence. DVA supported the development of Defence’s Deployment Health Surveillance Program and continued work to streamline rehabilitation services to discharging members.
1 These agencies were: Department of the Prime Minister and Cabinet (PM&C), Australian Public Service Commission (APSC), Department of the Environment, Water, Heritage and the Arts (DEWHA), Department of Resources, Energy and Tourism (RET), Department of Health and Ageing (DoHA), Department of Families, Housing, Community Services and Indigenous Affairs (FaHCSIA), Department of the Treasury (Treasury), Department of Foreign Affairs and Trade (DFAT), Department of Immigration and Citizenship (DIAC), Department of Agriculture, Fisheries and Forestry (DAFF), Department of Climate Change (DCC), Department of Innovation, Industry, Science and Research (DIISR), Department of Education, Employment and Workplace Relations (DEEWR), Department of Broadband, Communications and the Digital Economy (DBCDE), Department of Veterans’ Affairs (DVA), Department of Infrastructure, Transport, Regional Development and Local Government (Infrastructure), Department of Defence (Defence), Department of Finance and Deregulation (Finance), Department of Human Services (DHS), Australian Taxation Office (ATO), Australian Bureau of Statistics (ABS), Australian Customs Service (Customs) and Centrelink.

Appendix 1: APS agencies (or semi-autonomous parts of agencies) and APS employees as at 11 April 2008
Agency Total APS employees
Responded to agency survey
(a) For the purpose of the employee survey, these semi-autonomous parts of agencies were treated as part of their department so as not to be excluded from the employee survey.
(b) Includes 228 employees from the Australian Film Commission which became a non-APS agency from 1 July 2008 and was therefore deemed to be out of scope of the employee and agency surveys.
Source: APSED
Aboriginal Hostels Limited 549 Yes
Administrative Appeals Tribunal 161 Yes
Attorney-General’s Department 1563 Yes
Australian Agency for International Development 836 Yes
Australian Bureau of Statistics 3098 Yes
Australian Centre for International Agricultural Research 46 Yes
Australian Commission for Law Enforcement Integrity 6 Yes
Australian Communications and Media Authority 587 Yes
Australian Competition and Consumer Commission 688 Yes
Australian Crime Commission 626 Yes
Australian Customs Service 6284 Yes
Australian Electoral Commission 862 Yes
Australian Fair Pay Commission Secretariat 30 Yes
Australian Industrial Registry 176 Yes
Australian Institute of Aboriginal and Torres Strait Islander Studies 106 Yes
Australian Institute of Family Studies 61 Yes
Australian Institute of Health and Welfare 246 Yes
Australian National Audit Office 346 Yes
Australian National Maritime Museum 117 Yes

Agency Total APS employees
Responded to agency survey
Australian Office of Financial Management (a) 36 Yes
Australian Pesticides and Veterinary Medicines Authority 147 Yes
Australian Public Service Commission 270 Yes
Australian Radiation Protection and Nuclear Safety Agency 146 Yes
Australian Research Council 84 Yes
Australian Securities and Investments Commission 1656 Yes
Australian Sports Anti-Doping Authority 64 Yes
Australian Taxation Office 24254 Yes
Australian Trade Commission 525 Yes
Australian Transaction Reports and Analysis Centre 319 Yes
Australian War Memorial 290 Yes
Bureau of Meteorology 1440 Yes
Cancer Australia 27 Yes
Centrelink 26600 Yes
Child Support Agency 4255 Yes
Comcare 496 Yes
Commonwealth Grants Commission (a) 53 Yes
Commonwealth Ombudsman 175 Yes
ComSuper 614 Yes
Corporations and Markets Advisory Committee 2
CrimTrac Agency 122 Yes
CRS Australia 2010 Yes
Defence Housing Australia 705 Yes
Department of Agriculture, Fisheries and Forestry 5045 Yes
Department of Broadband, Communications and the Digital Economy 594 Yes
Department of Climate Change 201 Yes
Department of Defence 21736 Yes
Department of Education, Employment and Workplace Relations 6147 Yes
Department of Families, Housing, Community Services and Indigenous Affairs 3054 Yes

Agency Total APS employees
Responded to agency survey
Department of Finance and Deregulation 1576 Yes
Department of Foreign Affairs and Trade 2809 Yes
Department of Health and Ageing 5441 Yes
Department of Human Services 210 Yes
Department of Immigration and Citizenship 7011 Yes
Department of Infrastructure, Transport, Regional Development and Local Government 1258 Yes
Department of Innovation, Industry, Science and Research 2225 Yes
Department of Resources, Energy and Tourism 391 Yes
Department of the Environment, Water, Heritage and the Arts 3000 Yes
Department of the Prime Minister and Cabinet 536 Yes
Department of the Treasury 1034 Yes
Department of Veterans’ Affairs 2454 Yes
Equal Opportunity for Women in the Workplace Agency 18
Export Wheat Commission 17
Family Court of Australia 712 Yes
Federal Court of Australia 450 Yes
Federal Magistrates Court of Australia 219 Yes
Food Standards Australia New Zealand 138 Yes
Future Fund Management Agency 27 Yes
Geoscience Australia 761 Yes
Great Barrier Reef Marine Park Authority 224 Yes
Human Rights and Equal Opportunity Commission 128 Yes
Insolvency and Trustee Service Australia 318 Yes
Inspector-General of Intelligence and Security 9
Inspector-General of Taxation 6
IP Australia 1003 Yes
Medicare Australia 5941 Yes
Migration Review Tribunal and Refugee Review Tribunal 273 Yes
National Archives of Australia 460 Yes
National Blood Authority 46 Yes

Agency Total APS employees
Responded to agency survey
National Capital Authority 76 Yes
National Competition Council 11
National Health and Medical Research Council 242 Yes
National Library of Australia 517 Yes
National Museum of Australia 292 Yes
National Native Title Tribunal 241 Yes
National Offshore Petroleum Safety Authority 46 Yes
National Water Commission 16
Office of National Assessments 132 Yes
Office of Parliamentary Counsel 51 Yes
Office of the Australian Building and Construction Commissioner 118 Yes
Office of the Commonwealth Director of Public Prosecutions 544 Yes
Office of the Privacy Commissioner 65 Yes
Office of the Renewable Energy Regulator 12
Private Health Insurance Ombudsman 10
Productivity Commission 191 Yes
Professional Services Review 23 Yes
Royal Australian Mint 186 Yes
Social Security Appeals Tribunal (a) 70 Yes
Torres Strait Regional Authority 75 Yes
Workplace Authority 789 Yes
Workplace Ombudsman 365 Yes
Total 160450(b)

Appendix 2: State of the Service survey methodologies Agency survey methodology The scope of the agency survey was the 90 APS agencies, or semi-autonomous parts of agencies, employing at least 20 staff under the Public Service Act 1999.
The 90 participating agencies were sent the online survey on 4 June 2008 for completion. Agencies were given six weeks to complete and submit their response. As part of their survey return, agency heads were required to ‘sign off’ their agency’s response. All 90 agencies responded to the online agency survey. The results of the agency survey are one of the key sources of information which the Commission has relied on throughout the preparation of this report.
Employee survey methodology The employee survey sampling methodology was developed in consultation with the Australian Bureau of Statistics. This year, the content was designed to establish the views of APS employees on a range of issues, including work-life balance, learning and development, job satisfaction, leadership, personal productivity, interactions with Ministers and the Parliament and general impressions about the APS. The results of the employee survey are one of the main sources of information on which the Commission has drawn in preparing this report.
Scope and coverage
The scope of the employee survey was all APS employees (both ongoing and non-ongoing) in agencies with at least 100 APS employees. Employees in agencies that employed fewer than 100 APS employees were excluded on the basis that their responses could possibly identify them.
The survey sample was drawn from APSED on 11 April 2008, at which time APSED indicated that the total number of APS employees was 160,450. The survey sample was selected from the total population of APS employees from agencies with at least 100 APS employees, which was 159,394. Appendix 1 provides information on agencies’ APS employee numbers as at 11 April 2008.
Stratification
A stratified random sample of 9,406 APS employees was selected from APSED. The sample was stratified by:
level (APS 1–6, EL and SES classification groups) agency size (small: 100–250 APS employees; medium: 251–1,000 APS employees;
and large: >1,000 APS employees)

agency (for agencies with at least 400 employees, the three smaller portfolio departments, the Department of Climate Change (DCC), the Department of Human Services (DHS), the Department of Resources, Energy and Tourism (RET) and the Commission)
location (ACT and non-ACT).
To enable sound statistical inferences to be made about all APS employees, individuals were randomly selected from each of the strata. Each individual within a stratum had an equal chance of selection.
The sampling rates varied between the strata to ensure that sufficient statistical accuracy would be achieved for survey estimates from APS employees with the key characteristics captured by the stratification variables (level, location, agency and agency size). To gain the same accuracy for estimates for a small population (such as the SES) a much higher sampling rate was required than for a larger population (such as APS 1–6 employees).
The accuracy requirements varied between the demographic variables listed above, and this also led to differing sampling rates for these demographic variables.
This stratification process has not introduced a bias in the population estimates because the responses are appropriately weighted to take these differing sample rates into account (see the section ‘Weighting and Estimation’ below for further details).
Reporting of results from agencies with at least 400 employees
The survey was designed to enable agencies with at least 400 employees, DCC, DHS, RET and the Commission to receive a copy of their own results from the employee survey for internal management purposes—subject to the results satisfying a statistical accuracy benchmark. For this to occur, these 47 agencies were included separately in the stratification process (see the section ‘Stratification’ above).
Privacy, anonymity and confidentiality
Maintaining confidentiality throughout the entire employee survey process was of primary concern to the Commission.
Privacy arrangements for APSED preclude Commission staff, other than those in the APSED Team, the Group Manager of the Evaluation Group, and the Commission’s Executive, from accessing APSED data relating to individuals. This meant that the identity of those individuals selected in the sample from APSED was not available to the Commission’s State of the Service Team or any other non-APSED staff involved in the survey. A small number of ORIMA Research staff had access to the sample. All responses to the survey were anonymous so individuals could not be identified.
Each person invited to participate in the employee survey was provided with a unique password. This prevented multiple responses from individual respondents.
Survey design
The employee surveys conducted in previous years were used as the basis for this year’s survey. Some questions have been included on an annual basis, other questions have been cycled through on a two- or three-year basis, and others were included for the first time this year to address topical issues. To ensure the Commission maintains comparable time series data, any changes to questions repeated from previous years were kept to a minimum.
The draft employee survey was subjected to individual and paired pilot testing involving individuals at the APS 1–6 and EL classifications from Infrastructure, DAFF, Medicare Australia, ATO, WO, FaHCSIA, DEEWR, Centrelink, AEC and Customs.
The employee survey was delivered using two methods. The main delivery method was online via a password-protected Internet site. The majority of employees in the sample were sent an email from ORIMA Research on behalf of the Commissioner inviting them to participate in the online survey.
A secondary, paper-based delivery method was developed and implemented for employees working in agencies who do not have access to an individual email account or do not have (or have only limited) access to the Internet. These employees received a letter from the Commissioner inviting them to participate in the survey, as well as a paper copy of the survey to complete and return to ORIMA Research.
The 9,406 invitation emails and letters were sent out to employees in the sample on 12 May 2008. Respondents were asked to complete the survey and submit or return it to ORIMA Research by Friday 6 June 2008.
An adjustment was made to the final sample size to account for those out of scope of the survey (including repeatedly bounced emails, those ‘out of office’ for the entire survey period and those known to be no longer employed in the APS at the time of the survey).1 As a result, the final sample was reduced by 328 to 9,078.
Weighting and estimation
The survey responses were re-weighted to reflect the characteristics of the underlying population of APS employees. This was done to ensure that the overall demographic characteristics (used for sample selection) of the survey results exactly matched the demographic characteristics of all APS employees. The re-weighting process was based on the four demographic characteristics used for selection of the sample, namely:
level (APS 1–6, EL and SES classification groups) agency size (small: 100–250 APS employees; medium: 251–1,000 APS employees;
and large: >1,000 APS employees) agency (for agencies with at least 400 employees, DCC, DHS, RET and the
Commission) location (ACT and non-ACT).
There were, therefore, 294 different weights applied—level (3) multiplied by location (2) multiplied by agency size and agency (49). For this survey, the weights were calculated by dividing the populations of each stratum by the number of respondents to the survey in each stratum; for example, if there are 4,000 ELs in medium agencies in the ACT, and 200 responded, the weight assigned to each EL working in a medium agency in the ACT is 20. If

the data were not re-weighted, some strata could be over-represented and others underrepresented in the total survey results.
The weighting approach is based on that taken in previous years. The application of a uniform approach to sample selection and weighting continues to assist in the development of time series data.
The weighting approach adopted assumes that respondents respond in the same way as non-respondents for the characteristics of interest. The weighting method above assumes that the responding persons represent the non-responding persons.
In this survey, with a response rate of 65%, there would need to be a marked difference in the views of non-respondents from those of the respondents to alter or bias the overall results to any significant extent. For analysis presented in this report it was assumed that there was no significant bias between those who responded in the survey and those who did not respond. This should be considered when using the data to make inferences about the APS population.
Results have generally been presented rounded to the nearest whole percentage point (i.e. 38% not 37.7%). Due to this rounding, the percentage results for some questions may not add up to exactly 100%.
Measures of error and accuracy
Two types of error can occur in sample surveys: sampling error and non-sampling error. Sampling error arises because in a sample survey not all of the population are surveyed. Hence a measured sample statistic is not usually identical with the true population behaviour. Non-sampling errors cause bias in statistical results and can occur at any stage of a survey and can also occur with censuses (i.e. when every member of the target population is included). Sampling error can be estimated mathematically, whereas estimating non- sampling error can be difficult. It is important to be aware of these errors, in particular non-sampling error, so that they can be either minimised or eliminated from the survey.
Non-sampling error
The survey received a response rate of 65%—the highest response rate since the employee survey was first conducted six years ago. This response rate excludes responses that were received but were insufficiently complete to provide input into the data generated. This response rate is very creditable for a voluntary survey.
Non-sampling errors can result from imperfections in reporting by respondents, errors made in recording and coding of responses, and errors made in processing the data. No quantifiable estimates are available on the effect of non-sampling errors. However, every effort has been made to reduce the non-sampling errors to a minimum by careful survey design and efficient operating procedures. In particular, the online survey design minimised the possibility of errors being made in the recording and coding of responses, as the respondents themselves entered the data when responding to the survey.
In addition, identifiable errors made by respondents while completing the survey were removed from the results database; for example, responses made by APS 1–6 employees to an SES-only question have been removed to ensure the integrity of the data. Blank responses

were generally coded to non-response categories. The exception to this practice arose where responses were needed for demographic items for weighting purposes. In instances where this occurred, survey responses were disregarded.
Sampling error
One measure of the sampling error of an estimate is the standard error. There are about 19 chances in 20 that a sample estimate will be within two standard errors of the true population value. This is known as the 95% Confidence Interval.
We are 95% confident, for instance, that the estimate of the population who agree that their manager ensures fair access to developmental opportunities for employees in their work group is between 70.9% and 73.5% (an estimate of 72.2% and a confidence interval of +/-1.3 percentage points based on a standard error of 0.65 percentage points).
The following table illustrates the standard errors from the sample design associated with estimates from 10 key questions in the employee survey.
Question95%
confidence interval
Estimate result
Understand how their agency’s decision-making processes operate (e.g. relevant committee structures and how committees are linked)
±1.3pp 63.2%
Agree that their manager ensures fair access to developmental opportunities for employees in their work group ±1.3pp 72.2%
Agree that in their agency, the leadership is of a high quality ±1.3pp 45.6%
Agree that their agency encourages the public to participate in shaping and administering public policy ±1.4pp 47.7%
Agree that their input is adequately sought and considered about decisions that directly affect them ±1.4pp 52.0%
Considering their work and life priorities, they are satisfied with the work-life balance in their current job ±1.3pp 71.2%
Agree that in their experience, their agency’s culture usually encourages a constructive approach to collaboration with other public service agencies
±1.6pp 82.7%
Agree that their agency values and manages diversity in the workplace well ±1.3pp 64.9%
Want to try new ideas, but the public service discourages risk taking ±1.3pp 38.9%
Results have not been reported for questions where the number of unweighted responses is fewer than 30. This approach has been adopted for two reasons: firstly, to eliminate the possible identification of individuals who responded to these questions; secondly, to remove less reliable results from the analysis. Results with a confidence interval of more than ± 15

percentage points have also been excluded from the analysis. This approach has not affected reporting of results at the aggregate level; however, it has limited our ability to report on disaggregated data where the sample size is small—as is sometimes the case for questions following ‘filter’ questions.
It should also be noted that estimates relating to disaggregated data where the sample size is small will have wider confidence intervals because the population size responding to that question is lower than for aggregated data or disaggregated data where the sample size is large; for example, as can be seen from the following table illustrating the confidence intervals associated with estimates for disaggregated data, the confidence interval for Indigenous employees is higher than other confidence intervals because the population size responding to that question is small.
Question95%
confidence interval
Estimate result
Agree that their manager ensures fair access to developmental opportunities for employees in their work group (women) ±1.5pp 71.1%
Agree that their manager ensures fair access to developmental opportunities for employees in their work group (men) ±1.7pp 73.7%
Agree that their manager ensures fair access to developmental opportunities for employees in their work group (people with disability)
±4.8pp 68.9%
Agree that their manager ensures fair access to developmental opportunities for employees in their work group (people without disability)
±1.2pp 72.4%
Agree that their manager ensures fair access to developmental opportunities for employees in their work group (Indigenous employees)
±7.3pp 66.9%
Agree that their manager ensures fair access to developmental opportunities for employees in their work group (non-Indigenous employees)
±1.1pp 72.3%
Interpretation of scales
Scales were included in any question that required a respondent to measure the strength or level of a theoretical construct. In its simplest form in the survey, a scale asked a respondent to rate the level of importance, satisfaction or effectiveness of various workplace variables on a five-point scale.
The scales used in the surveys were generally balanced, that is, they allowed respondents to express one of the two extremes of view (e.g. satisfaction and dissatisfaction). These scales were also designed with a midpoint that allowed respondents to enter a ‘neutral’ response.
When interpreting scales it is important to realise that there is not an ordinal relationship between points in a scale, that is, the strength of opinion to shift a respondent from ‘neutral’

to ‘satisfied’ may be much smaller than the strength required to shift a respondent from ‘satisfied’ to ‘very satisfied’.
Open-ended responses
The employee survey questionnaire provided specified response options for most questions. It also included open-ended response options for some questions, which enabled respondents to provide a text response to a question. Open-ended options were commonly provided, for example, as part of a specified response question in the form of ‘other (please specify)’.
Coding
Some open-ended responses have been coded to assist analysis. Coding involved, for example, removing irrelevant and incidental comments from statistical outputs as well as counting relevant comments against the appropriate response option.
Interpretation
The report draws on the actual comments employees provided through the open-ended questions to complement other information. Employees’ comments represent a rich and valuable data source; however, they do not necessarily represent the views of all employees.
Data cleaning
Every effort has been made to ensure the integrity of data from the employee and agency surveys. Where inaccuracies are discovered, or a different methodology is adopted, the historical data has been revised. For this reason, caution should be exercised when comparing data in this year’s report with that in previous reports. Time series analysis in this report incorporates the historical revisions made to previous datasets.
1 The sample was drawn in April 2008 and this was based on the most recent data provided by agencies, which was January 2008 for the majority (over 90%) of employees.

Appendix 3: Factor analysis A factor analysis was conducted on a broad range of questions in the 2008 State of the Service employee survey, with the questions in the analysis being selected based on their relevance to employee engagement. These included most of the general impressions questions, and the questions related to work-life balance, individual productivity, learning and development and agency culture.1 Factor analysis is a ‘data reduction’ technique, which statistically groups together highly related questions. The factor analysis process primarily uses high correlations between question responses to group them together. A high positive correlation between two questions, for example, is where most of the responses to one question show a very similar pattern of responses as those to the other question (i.e. across individuals, high scores on one generally correspond to high scores on the other). Factors are considered to reflect underlying processes or relationships that have created the correlations among variables.2
In this case, a factor analysis was conducted to determine whether, based on the questions from the employee survey, broader groups of engagement issues or ‘factors’ existed. Therefore, each factor represents a measure of a broader construct than the individual employee engagement questions in the 2008 employee survey. The factor analysis for the employee engagement items resulted in a 12 factor structure.3 The factors were then named based on their item content. The 12 factors were:
1. Immediate Manager2. Senior Leaders 3. Agency Culture 4. Governance and Integrity 5. Current Job 6. Work Group7. Personal Innovation and Flexibility 8. Learning and Development 9. Merit and Career Progression 10. Understanding Current Role11. Work-Life Balance 12. Innovation Culture
Comparability with 2007 factor analysis The 2008 factor analysis produced two new factors—Personal Innovation and Flexibility, and Innovation Culture while two 2007 factors, Diversity and Career and Development Opportunities were dropped. In addition, the 2007 Governance and Merit factors merged with other employee engagement attributes to become the Governance and Integrity factor and the Merit and Career Progression factor in 2008. The primary reason for the change in the factors between 2007 and 2008 is the inclusion of new questions and other questions being cycled out.

Results for the 2008 factor analysis are not directly comparable with the 2007 results, as although some factors may measure the same concept, the principal components of each factor are not necessarily the same.
Factor content The following tables show the principal components of each factor. In the text of the report, factor names appear with the first letter of each word capitalised to distinguish them from other uses of the word(s).
Immediate Manager
q18j. I receive adequate feedback on my performance to enable me to deliver required results.
q18k. I am satisfied with the recognition I receive for doing a good job.
q19e. I receive support from my manager when I suggest new ideas.
q21a. The people in my work group feel they are valued for their contribution.
q22a. My manager ensures fair access to developmental opportunities for employees in my work group.
q22b. My manager encourages me to build the capabilities and/or skills required for new job roles.
q22c. My manager appropriately deals with employees that perform poorly.
q22d. My manager demonstrates honesty and integrity.
q22e. My manager works effectively and sensitively with people from diverse backgrounds.
q22f. My manager stands up for his/her staff when necessary.
q22g. My manager delegates work effectively.
q22h. My manager shows concern for the welfare of his/her staff.
q22i. My manager draws the best out of his/her staff.
q58ii b. My manager encouraged and managed innovation.
q58ii c. I received effective feedback from my manager.
q58ii d. I was working to realistic performance expectations.
q58ii e. My team had clear work plans and timetables.
q58ii i. There were good working relationships with my manager and colleagues.
q70h. My immediate supervisor is effective in managing people.

Senior Leaders
q20c. I feel change is managed well in my agency.
q23i a. In my agency, the leadership is of a high quality.
q23i b. My agency is well managed.
q23i c. In my agency, communication between senior leaders and other employees is effective.
q23i d. In my agency, senior leaders are receptive to ideas put forward by other employees.
q26d. Within my agency the most senior leaders are sufficiently visible.
q58ii a. Formal and informal communication within my agency was effective.
q70d. Senior managers in my organisation lead by example in ethical behaviour.
Agency Culture
q25d. Employees in my agency feel they are valued for their contribution.
q25g. My agency deals with underperformance effectively.
q70b. My input is adequately sought and considered about decisions that directly affect me.
q70f. I have confidence in the processes that my organisation uses to resolve employee grievances.
Governance and Integrity
q24a. My agency has procedures and systems that ensure objectivity in decision-making.
q24b.
My agency has policies and procedures in place that assist employees manage conflicts of interest.
q24c. My agency has policies and procedures in place to ensure that appropriate assessments of risk are conducted.
q24d.
My agency provides me with information about updates, changes or revisions that relate to financial and other delegations.
q24e. My agency provides me with information that clearly outlines the agency’s decision-making processes.
q25b. In general, employees in my agency effectively manage conflicts of interest.
q25c. In general, employees in my agency appropriately assess risk.
q25f. My agency operates with a high level of integrity.

Governance and Integrity
q25h.
My agency encourages the public to participate in shaping and administering policy (e.g. seeks and uses feedback, consults and engages communities on issues affecting them).
q70c. My organisation actively encourages ethical behaviour by all of its employees.
Current Job
q18a. I enjoy the work in my current job.
q18b. I am motivated to do the best possible work that I can.
q18c. When needed, I am willing to put in the extra effort to get a job done.
q18d. My job allows me to utilise my skills, knowledge and abilities.
q18e. My current job will help my career aspirations.
q18f. My job gives me a feeling of personal accomplishment.
q18i. I have the authority (e.g. the necessary delegation(s), autonomy, level of responsibility) to do my job effectively.
q25a. My agency is a good place to work.
Work Group
q21b. People in my work group use time and resources effectively.
q21c. The people in my work group cooperate to get the job done.
q21d. The people in my work group share job knowledge with each other.
q21e. People in my work group are honest, open and transparent in their dealings.
q21f. People in my work group treat each other with respect.
q21g. My work group resolves conflict quickly when it arises.
Personal Innovation and Flexibility
q19a. I generally like to try new ideas at work.
q19b. I am always looking for better ways to do things.
q19c. I want to learn about new things and ideas.

Personal Innovation and Flexibility
q20a. Wherever I have been, I have been influential in bringing about constructive change.
q20b. I am able to adapt/respond to new challenges quickly.
q20d. Others would describe me as flexible and open to change.
q63a. I often look for opportunities to develop new skills and knowledge.
q63b. I enjoy challenging and difficult tasks at work where I learn new skills.
Learning and Development
q25e. My agency places a high priority on the learning and development of employees.
q58ii f. I increased my knowledge and/or experience in the job.
q58ii g. I had access to effective learning and development.
q58ii h. I had access to the information, resources and/or technology I needed to perform my job.
q60i. Overall, how satisfied are you with your own access to learning and development opportunities in your organisation?
q61. Please rate the overall effectiveness of the learning and development you received in the last 12 months in helping you improve your performance.
Merit and Career Progression
q21i. In my work group, the process of selecting a person for a position is done fairly.
q24f. My agency routinely applies merit (as defined in the Public Service Act) in decisions regarding engagement and promotion resulting from a competitive selection process.
q26c. I am satisfied with the opportunities for career progression in my current agency.
q26g.
I am satisfied with the opportunities for career progression in the Australian Public Service.
q70e. Recruitment and promotion decisions in this organisation are fair.
Understanding Current Role
q18g. I have a clear understanding of how my own job contributes to my work team's role.
q18h. I clearly understand what is expected of me in this job.
q18m.
I understand how my agency's decision-making processes operate (e.g. relevant committee structures and how committees are linked).
q21h. I have a clear understanding of how my work group's role contributes to my agency's strategic directions.

Work-Life Balance
q32. Considering your work and life priorities, how satisfied are you with the work-life balance in your current job?
q70a. My workplace culture supports people to achieve a good work-life balance.
Innovation Culture
q19d. I want to try new ideas, but the public service discourages risk taking.
q19f. My agency encourages employees to examine what they do and find ways to do it better.
q19g. My current agency encourages innovation and the development of new ideas.
Calculation of factor scores for each factor A factor score was calculated for each of the 12 factors. Each factor score is the average (mean) of the responses to the questions contained in the factor. Factor scores will therefore range from 1 to 5 on a continuous scale (i.e. they will not necessarily be whole numbers). Factor scores can be used in a similar way to question results, for example, in cross-tabulations with other questions and other factor scores. Each respondent to the survey has one score for each factor. For ease of interpretation, the factor scores have been recoded as such:
1 to 2.499 = agree/satisfied 2.5 to 3.499 = neutral (neither agree nor disagree) 3.5 to 5 = disagree/dissatisfied
Factor score results
The table below contains the APS-wide frequency results for the 12 factors based on the approach outlined above.
Factor Agree/ Satisfied Neutral Disagree/ Dissatisfied
Immediate Manager 65% 26% 9%
Senior Leaders 39% 38% 23%
Agency Culture 27% 46% 27%
Governance and Integrity 68% 29% 3%
Current Job 74% 21% 5%

Factor Agree/ Satisfied Neutral Disagree/ Dissatisfied
Work Group 73% 21% 6%
Personal Innovation and Flexibility 90% 10% 0%
Learning and Development 53% 36% 11%
Merit and Career Progression 49% 34% 17%
Understanding Current Role 76% 20% 4%
Work-Life Balance 59% 27% 14%
Innovation Culture 39% 52% 9%
Summary indexes To complement the factor analysis a series of summary indexes have been created to assist in the analysis of results of survey questions that (i) comprise several parts or (ii) are related survey questions. The indexes operate to condense a multiple response question or a series of questions into a single index for comparative purposes. In exploring respondents’ overall level of job satisfaction, for example, a question comprising 15 attributes was summarised into a single index using a point scoring system. In this way, analysis of the 15 job satisfaction attributes can be supplemented by analysis at the summary level. Similarly, an employee engagement index was created using all the questions in each factor resulting from the factor analysis combining a range of employee survey questions relating to employee engagement.
Other summary indexes comprised the following questions:
Loyalty/Commitment to Agency
q26a. I am proud to work in my current agency.
q26b. I would recommend my current agency as a good place to work.
Loyalty/Commitment to APS
q26f. I am proud to work in the Australian Public Service.
q26g. I would recommend the Australian Public Service as a good place to work.
As was the case for each factor, scores for Engagement, Loyalty/Commitment to Agency and Loyalty/Commitment to APS were calculated using the same scale as that used for the factors. The following table shows the APS-wide frequency results for these summary indexes.
Index Agree/ Satisfied Neutral Disagree/ Dissatisfied
Engagement 68% 30% 2%

Index Agree/ Satisfied Neutral Disagree/ Dissatisfied
Loyalty/Commitment to Agency 62% 25% 13%
Loyalty/Commitment to APS 76% 20% 4%
The score for Job Satisfaction was calculated using a 10-point scale based on the following approach:
9 to 10 = high satisfaction 6 to 8 = moderately high satisfaction 3 to 5 = moderately low satisfaction 0 to 2 = low satisfaction
The table below shows the APS-wide frequency results for Job Satisfaction using this approach.
Index 9 to 10 6 to 8 3 to 5 0 to 2
Job Satisfaction 26% 51% 20% 3%
1 All of the items included in the factor analysis are listed in this appendix under each factor heading. Individual item results for all employee survey questions are available in the State of the Service Employee Survey Results 2007–08 publication.
2 B. G. Tabachnick & L. S. Fidell 2001, Using Multivariate Statistics, 4th edn, Allyn & Bacon, Needham Heights, MA.
3 Extraction Method: Principal Axis Factoring. Rotation Method: Varimax with Kaiser Normalisation.

Glossary2007 agency survey
The agency survey conducted in June–July 2007 for the State of the Service report2007 employee survey
The employee survey conducted in May–June 2007 for the State of the Service report2008 agency survey
The agency survey conducted in June–July 2008 for the State of the Service report2008 employee survey
The employee survey conducted in May–June 2008 for the State of the Service reportAAT
Administrative Appeals TribunalAATB
Anglo-Australian Telescope BoardAAWI
Average annualised wage increaseABARE
Australian Bureau of Agricultural and Resource EconomicsABCC
Office of the Australian Building and Construction CommissionerABR
Australian Business RegisterABS
Australian Bureau of StatisticsACA
Annual Compliance Arrangement (ACA) InitiativeACC
Australian Crime CommissionACCC
Australian Competition and Consumer CommissionACIAR
Australian Centre for International Agricultural ResearchACLG
Australian Council of Local GovernmentACMA
Australian Communications and Media AuthorityAct
Public Service Act 1999ACT
Australian Capital TerritoryADF
Australian Defence ForceAEC
Australian Electoral CommissionAELM
APEC Economic Leaders’ MeetingAEND
Australian Employers Network on Disability

AFCAustralian Film Commission
AFPCSAustralian Fair Pay Commission Secretariat
AGDAttorney-General’s Department
AGEBFAustralian Government Employment Bargaining Framework
AGIMOAustralian Government Information Management Office
AGOSPAustralian Government Online Service Point
AHLAboriginal Hostels Limited
AIATSISAustralian Institute of Aboriginal and Torres Strait Islander Studies
AIFSAustralian Institute of Family Studies
AIHW Australian Institute of Health and Welfare
AIMSAustralian Institute of Maritime Science
AIRAustralian Industrial Registry
ALGAAustralian Local Government Association
ANAOAustralian National Audit Office
ANMM Australian National Maritime Museum
ANSTOAustralian Nuclear Science and Technology Organisation
ANZSCOAustralian and New Zealand Standard Classification of Occupations
ANZSOGAustralia and New Zealand School of Government
AOFMAustralian Office of Financial Management
APECAsia-Pacific Economic Cooperation
APSAustralian Public Service
APSEDAustralian Public Service Employment Database
APVMAAustralian Pesticides and Veterinary Medicines Authority
AQISAustralian Quarantine and Inspection Service
ARACAustralian Research Advisory Council

ARCAustralian Research Council
ARPANSAAustralian Radiation Protection and Nuclear Safety Agency
ASADA Australian Sports Anti-Doping Authority
ASEAN Association of Southeast Asian Nations
ASICAustralian Securities and Investments Commission
ASIO Australian Security Intelligence Organisation
ATO Australian Taxation Office
ATSB Australian Transport Safety Bureau
AusAID Australian Agency for International Development
AUSFTA Australia-United States Free Trade Agreement
AUSTRAC Australian Transaction Reports and Analysis Centre
Austrade Australian Trade Commission
AWA Australian Workplace Agreement
AWMAustralian War Memorial
BoM Bureau of Meteorology
BPTC Business Process Transformation Committee
BRS Bureau of Rural Sciences
CACollective Agreement
CDACCareer Development Assessment Centre
CDPP Office of the Commonwealth Director of Public Prosecutions
CEIs Chief Executive Instructions
CEO Chief Executive Officer
CGC Commonwealth Grants Commission
CIUCabinet Implementation Unit
CLC Corporate Leadership Council

COAG Council of Australian Governments
Code APS Code of Conduct (s.13 of the Public Service Act 1999)
Commission Australian Public Service Commission
Commissioner Australian Public Service Commissioner
Commissioner’s Directions Public Service Commissioner’s Directions 1999
CRC COAG Reform Council
CrimTrac CrimTrac Agency
CSA Child Support Agency
CSIRO Commonwealth Scientific and Industrial Research Organisation
CSR Comprehensive Spending Review
CSTDA Commonwealth State/Territory Disability Agreement
CustomsAustralian Customs Service
DAFF Department of Agriculture, Fisheries and Forestry
DBCDE Department of Broadband, Communications and the Digital Economy
DCC Department of Climate Change
DCITA Department of Communications, Information Technology and the Arts
DEEWR Department of Education, Employment and Workplace Relations
Defence Department of Defence
DEN Disability Employment Network
DESC Development Effectiveness Steering Committee (AusAID)
DEW Department of the Environment and Water Resources
DEWHA Department of the Environment, Water, Heritage and the Arts
DEWR Department of Employment and Workplace Relations
DFAT Department of Foreign Affairs and Trade
DHS Department of Human Services

DIACDepartment of Immigration and Citizenship
DIISR Department of Innovation, Industry, Science and Research
DirectionsPublic Service Commissioner’s Directions 1999
DIRKS Designing and Implementing a Recordkeeping System
DITR Department of Industry, Tourism and Resources
DoHA Department of Health and Ageing
DOTARS Department of Transport and Regional Services
DVA Department of Veterans’ Affairs
EDRMElectronic Document and Records Management (EDRM) System
EEOEqual employment opportunity
EFPExecutive Fellows Program (ANZSOG)
ELExecutive Level
EMPAExecutive Master of Public Administration (ANZSOG)
EWCExport Wheat Commission
FaCSIADepartment of Families, Community Services and Indigenous Affairs
FaHCSIADepartment of Families, Housing, Community Services and Indigenous Affairs
FBOFinal Budget Outcome
Federal CourtFederal Court of Australia
FFMAFuture Fund Management Agency
FinanceDepartment of Finance and Deregulation
FMCFederal Magistrates Court of Australia
FOIFreedom of Information
FOI ActFreedom of Information Act 1982
FSANZFood Standards Australia New Zealand
FTAFree trade agreement

FTEFull-time equivalent
GBMGovernment Business Manager
GBRMPAGreat Barrier Reef Marine Park Authority
GNIGross National Income
HILDAHousehold Income and Labour Dynamics Australia Survey
HRHuman resources
HREOCHuman Rights and Equal Opportunity Commission
HRISHuman Resources Information System
ICAC (NSW)Independent Commission Against Corruption
ICCIndigenous Coordination Centre
ICTInformation and communications technology
IESIndigenous Employment Strategy
IFCIInternational Forest Carbon Initiative
ILSIntegrated Leadership System
IMOInternational Maritime Organization
InfrastructureDepartment of Infrastructure, Transport, Regional Development and Local Government
IOMInternational Organisation for Migration
IP Australia Intellectual Property Australia
ITInformation technology
ITSAInsolvency and Trustee Service Australia
JCPAA Joint Committee of Public Accounts and Audit
LAFIALeading Australia’s Future in Asia
LALACLeadership and Learning Advisory Committee
MACManagement Advisory Committee
MDB

Murray-Darling BasinMDBA
Murray-Darling Basin AuthorityMOU
Memorandum of UnderstandingMRT/RRT
Migration Review Tribunal and Refugee Review TribunalMYEFO
Mid-Year Economic and Fiscal OutlookNAA
National Archives of AustraliaNBA
National Blood AuthorityNCA
National Capital AuthorityNCC
National Competition CouncilNCCARF
National Climate Change Adaptation Research FacilityNED
Nominal expiry dateNESB
Non-English speaking backgroundNETT
National Emissions Trading TaskforceNGOs
Non-government organisationsNHMRC
National Health and Medical Research CouncilNLA
National Library of AustraliaNMA
National Museum of AustraliaNNTT
National Native Title TribunalNOPSA
National Offshore Petroleum Safety AuthorityNRM
Natural resource managementNSW
New South WalesNT
Northern TerritoryNTER
Northern Territory Emergency ResponseNWI
National Water InitiativeNZ
New ZealandODE

Office of Development Effectiveness (AusAID)OECD
Organisation for Economic Cooperation and DevelopmentOmbudsman
Office of the Commonwealth OmbudsmanONA
Office of National AssessmentsOPC
Office of Parliamentary CounselORER
Office of the Renewable Energy RegulatorOSCAR
Online System for Comprehensive Activity ReportingOWS
Office of Workplace ServicesPBS
Pharmaceutical Benefits SchemePEFO
Pre-Election Economic and Fiscal OutlookPHIO
Private Health Insurance OmbudsmanPM&C
Department of the Prime Minister and CabinetPNG
Papua New GuineaPS Act
Public Service Act 1999PSA
Public Service AgreementRAM
Royal Australian MintRAMSI
Regional Assistance Mission to Solomon IslandsRAP
Reconciliation Action PlanRegulations
Public Service Regulations 1999RET
Department of Resources, Energy and TourismRTO
Registered Training OrganisationSA
South AustraliaSAM
Smaller Agency Mentoring (SAM) ProgramSBR
Standard Business Reporting programmeSCH
Statistical Clearing HouseSCI

Sustainable Communities InitiativeSCICT
Secretaries’ Committee on Information and Communications TechnologySES
Senior Executive ServiceSGIA
Secretaries’ Group on Indigenous AffairsSPPs
Specific Purpose PaymentsSSAT
Social Security Appeals TribunalTGET
Task Group on Emissions TradingTreasury
Department of the TreasuryTSRA
Torres Strait Regional AuthorityUK
United KingdomUN
United NationsUNFCCC
United Nations Framework Convention on Climate ChangeUSA
United States of AmericaValues
APS Values (s.(10)(1) of the Public Service Act 1999)VIC
VictoriaWA
Western AustraliaWEA
Wheat Exports AustraliaWGIR
Working Group on Indigenous Reform (COAG)WITEM
Women in IT Executive Mentoring (WITEM) ProgramWO
Office of the Workplace Ombudsman