state of the market: fire protection - sdm magazine€¦ · state of the market: fire protection...
TRANSCRIPT

Fourth in the exclusive series.
State of the Market:
Fire ProtectionBegins on page 70.
SDM04134SPEC-CC.indd 1 3/19/13 4:47 PM
Environmental Ratings for Video Equipment Integrators Optimize Networks Movable PERS?
May 2013

Many security providers seemed to have harnessed lightning last year, using it to successfully power their sales and deliver stronger security solutions to their customers. The effect was a significant
surge in recurring monthly revenue (RMR) among the SDM 100 — a ranking of the largest U.S.-based security companies by their RMR.
SDM 100 companies’ RMR collectively improved 16 percent in 2012. Part of the increase is due to the first-time ranking on the SDM 100 of several large systems integrators with RMR. They include Tyco Integrated Security ($70.8 M, estimated by SDM); Diebold Security ($12.7 M); G4S Technology ($1.5 M); RFI Communications & Security Systems ($536,765); and Johnson Controls Inc. ($335,417).
Collectively, RMR grew from $552.3 million to $642 million among the SDM 100. The dealers and inte-grators also performed very well individually — 93 of 100 companies recorded an increase.
Most impressively, approxi-mately four in 10 companies had double-digit RMR growth. Looking just at the 15 companies ranked, those with double-digit RMR increases are Stan-ley Convergent Security (51.6 percent), Vivint Inc. (26.5 percent), Monitronics
RMR Skyrockets 16 Percent, in Part Due to Newly Ranked Companies
Recurring monthly revenue (RMR), a prime revenue stream for SDM 100 companies, surged up 16 percent in 2012. Contributing to the increase is the fact that several large “systems integrators” are ranked for the first time, including Tyco Integrated Security, Diebold Security, G4S Technology, RFI Communications & Security Systems, and Johnson Controls. In addition, many SDM 100 companies had double-digital RMR growth in 2012, and only five companies’ RMR declined.
The metamorphosis of the security industry into a services-based business capable of serving many sectors has taken hold, evidenced by the largest security providers — the 2013 SDM 100.
Power Surge
Source: 2013 SDM 100, SDM Magazine, May 2013
2006 2007 2008 2009
$250
$350
$450
$550
$650
2010 2011 2012
Based on responses from, or estimates of, 100 firms
Tota
l SDM
100
RM
R(b
ased
on
12/3
1/12
, in
$ m
illio
ns)
$511
$642
$552
$410 $413$439
$466
By Laura E. Stepanek, Editor
May 2013 47

48 May 2013
(22.1 percent), Guardian Protection Services (11.9 percent), ASG Security (12.4 percent), Interface Security Systems Hold-ings Inc. (34.6 percent), Security Networks (42.4 percent), and Protect America (14.8 percent).
Sales volume increased only slightly by comparison among the SDM 100. Contracted services and retrofits led the way to RMR growth — offerings such as remote, interactive services (using a mobile device to control and interact with a security system); home automation features/services; central-station-managed access control; and cloud-based or monitored video surveillance.
“The markets we operate in were strong in 2012 and our best segments were remote services for security systems and hosted solutions for video and access,” concurs ADS Security L.P., No. 26 on the SDM 100. (See rankings beginning on page 49.)
“The market was stronger in 2012 than in 2011, especially in the adoption of home automation,” states Vivint Inc., ranked No. 4 on the SDM 100. “Seventy-one percent of our customers’ homes are home-automation enabled, and 53 percent of custom-ers in 2012 adopted at least one home automation feature.”
All of these RMR-based services had a positive effect in the financial community: a sustained wave of investment in the alarm industry. (See related article, “The Financial Community Assesses Change in the SDM 100,” on page 52.)
This new wave of services not only helped dealers build a base of higher RMR per customer; it also drew a substantial number of new customers. The SDM 100 grew its subscriber base from 13.3 million subscribers to 18.4 million subscribers.
SDM 100 companies earn their revenues from the sale, instal-lation, service, hosting and monitoring of electronic security systems, such as intrusion and fire alarm, access control, video sur-veillance, and related low-voltage systems. Now in its 23rd year of publication, the SDM 100 Report continues to prove that security is a significant concern of both homeowners and business leaders.
Business was not without its challenges and not all of the segments performed as well as others. The large-commercial-projects market still suffers from a lack of capital spending, according to some of the dealers.
“2012 was another challenging year for the larger commer-cial integrated systems business. It wasn’t worse than 2011, but about the same. There are still fewer projects, less funding and great pressure on margins,” reports No. 11-ranked ASG Security. “However, the low and mid markets performed very well for us again — specifically, a continued great resurgence in residential sales with excitement around our enhanced service platform. Small business was also a continued strong growth segment for the company, led by enhanced intrusion sales and cloud-based video services.”
Security Networks, ranked No. 14 on the SDM 100, also found the residential market to be strong for its Affiliate Fund-ing Program.
Not all of the dealers found the large-commercial market to be flat and some even had opportunities in sectors such as new construction.
*percentage of SDM 100 companies, based on 96 responses
Source: 2013 SDM 100, SDM Magazine, May 2013
This time last year, 83 percent of SDM 100 companies pre-dicted that their total annual revenue would improve in 2012 compared with 2011. They predicted correctly: 79 percent of companies for which revenue could be compared year-over-year experienced an actual increase in total gross revenue in 2012. Even more companies expect improvement in 2013.
Positive Forecast of 2013 Revenue
Up86%*
Same14%
Down0%
*percentage of SDM 100 companies, based on 94 responses
Source: 2013 SDM 100, SDM Magazine, May 2013
More than half of SDM 100 companies reported they increased their net profit margins in 2012, and among those that did, the average rate of increase was 35 percent. For the 15 percent of companies that reported a net profit decrease, the average rate of decrease was just 14 percent.
SDM 100 Profit MarginsSDM 100 companies were asked, “Did your company’s net profit margin increase, decrease or stay about the same in 2012 compared with 2011?”
Increase53%*
Stay the Same32%
Decrease15%
May 2013 49
RANK RANK COMPANY RECURRING RMR COMPARED SUBSCRIBERS SALES SALES GROSS FULL TIME NO. OF 2013 2012 MONTHLY REVENUE, WITH REVENUE, REVENUE, REVENUE EMPLOYEES LOCATIONS DEC. 31, 2012 DEC. 31, 2011 RES. INSTALLS NON-RES. INSTALLS 2012 ($ MIL)
e = SDM estimate No. 1 – Became a public company trading under the symbol ADT on the New York Stock Exchange. n No. 2 – First-time ranking on the SDM 100 as Tyco Integrated Security since splitting from ADT in fall 2012. All figures are SDM estimates. n No. 3 – SDM’s 2009 Dealer of the Year. n No. 4 – Acquired by The Blackstone Group in November 2012 for more than $2 billion. SDM’s 2011 Dealer of the Year. n No. 6 – Most significant accomplishment in 2012 was to attain the high-est level of national account growth the company has seen to date. SDM 2012 Dealer of the Year. n No. 7 – Developed in-house managed cloud-based services. n No. 8 – First-time ranking on the SDM 100. n No. 9 – SDM’s 2003 Dealer of the Year. n No. 10 – Embarked on a campaign to upgrade customers to home automation services. n No. 11 – Benefiting from increased market penetration and greater sales force adoption across all markets with the ASG Connect brand, an enhanced interactive service platform for intrusion systems. Also launched ASG Video, a new hosted video service, in 2012. SDM’s 2008 Dealer of the Year.
$0
$2.0
$4.0
$8.0
$6.0
$10.0
2010 2011
Tota
l SDM
100
ann
ual r
even
ue (
$ bi
llion
s)
Year when revenue was posted20122006 2007 2008 2009
Based on responses from, or estimates of, 99 firms.
$12.0
$14.0
$18.0
$16.0
$20.0
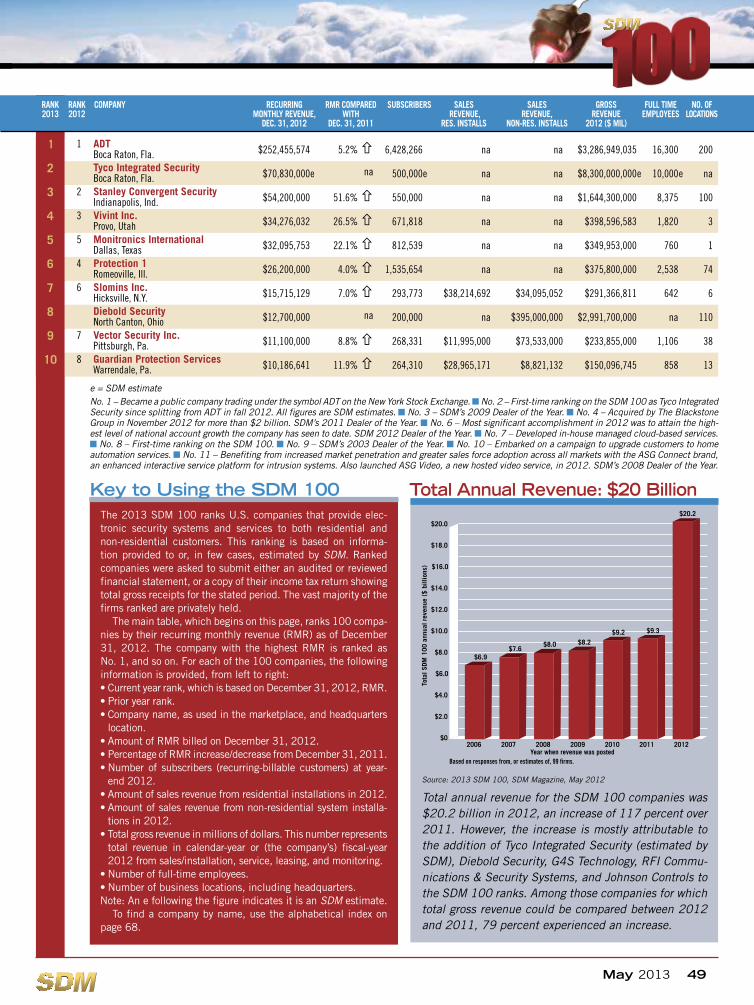
Total Annual Revenue: $20 Billion
Source: 2013 SDM 100, SDM Magazine, May 2012
Total annual revenue for the SDM 100 companies was $20.2 billion in 2012, an increase of 117 percent over 2011. However, the increase is mostly attributable to the addition of Tyco Integrated Security (estimated by SDM), Diebold Security, G4S Technology, RFI Commu-nications & Security Systems, and Johnson Controls to the SDM 100 ranks. Among those companies for which total gross revenue could be compared between 2012 and 2011, 79 percent experienced an increase.
1 1 ADT Boca Raton, Fla. $252,455,574 5.2% 6,428,266 na na $3,286,949,035 16,300 200
2 Tyco Integrated Security Boca Raton, Fla. $70,830,000 na 500,000 na na $8,300,000,000 10,000 na
3 2 Stanley Convergent Security Indianapolis, Ind. $54,200,000 51.6% 550,000 na na $1,644,300,000 8,375 100
4 3 Vivint Inc. Provo, Utah $34,276,032 26.5% 671,818 na na $398,596,583 1,820 3
5 5 Monitronics International Dallas, Texas $32,095,753 22.1% 812,539 na na $349,953,000 760 1
6 4 Protection 1 Romeoville, Ill. $26,200,000 4.0% 1,535,654 na na $375,800,000 2,538 74
7 6 Slomins Inc. Hicksville, N.Y. $15,715,129 7.0% 293,773 $38,214,692 $34,095,052 $291,366,811 642 6
8 Diebold Security North Canton, Ohio $12,700,000 na 200,000 na $395,000,000 $2,991,700,000 na 110
9 7 Vector Security Inc. Pittsburgh, Pa. $11,100,000 8.8% 268,331 $11,995,000 $73,533,000 $233,855,000 1,106 38
10 8 Guardian Protection Services Warrendale, Pa. $10,186,641 11.9% 264,310 $28,965,171 $8,821,132 $150,096,745 858 13
The 2013 SDM 100 ranks U.S. companies that provide elec-tronic security systems and services to both residential and non-residential customers. This ranking is based on informa-tion provided to or, in few cases, estimated by SDM. Ranked companies were asked to submit either an audited or reviewed financial statement, or a copy of their income tax return showing total gross receipts for the stated period. The vast majority of the firms ranked are privately held.
The main table, which begins on this page, ranks 100 compa-nies by their recurring monthly revenue (RMR) as of December 31, 2012. The company with the highest RMR is ranked as No. 1, and so on. For each of the 100 companies, the following information is provided, from left to right:• Current year rank, which is based on December 31, 2012, RMR.• Prior year rank.• Company name, as used in the marketplace, and headquarters
location.• Amount of RMR billed on December 31, 2012.• Percentage of RMR increase/decrease from December 31, 2011. • Number of subscribers (recurring-billable customers) at year-
end 2012.• Amount of sales revenue from residential installations in 2012.• Amount of sales revenue from non-residential system installa-
tions in 2012.• Total gross revenue in millions of dollars. This number represents
total revenue in calendar-year or (the company’s) fiscal-year 2012 from sales/installation, service, leasing, and monitoring.
• Number of full-time employees.• Number of business locations, including headquarters.Note: An e following the figure indicates it is an SDM estimate.
To find a company by name, use the alphabetical index on page 68.
Key to Using the SDM 100
e e e e

50 May 2013
RANK RECURRING MONTHLY SUBSCRIBERS SALES REVENUE, SALES REVENUE, GROSS REVENUE FULL TIME NUMBER OF 2009 COMPANY REVENUE, DEC. 31, 2007 2007 RES. INSTALLS NON-RES. INSTALLS 2007 ($ MIL) EMPLOYEES LOCATIONS RANK RANK COMPANY RECURRING RMR COMPARED SUBSCRIBERS SALES SALES GROSS FULL TIME NO. OF 2013 2012 MONTHLY REVENUE, WITH REVENUE, REVENUE, REVENUE EMPLOYEES LOCATIONS DEC. 31, 2012 DEC. 31, 2011 RES. INSTALLS NON-RES. INSTALLS 2012 ($ MIL)
No. 12 – Acquired and successfully integrated Westec Intelligent Video Surveillance into operations. n No. 14 – Sustained continuous growth of more than 30 percent each year, with a growth in gross revenue of 48 percent from 2011 to 2012. The company also increased its staff by 27 percent. n No. 15 – 25 percent increase in new customer additions over 2011. n No. 16 – 23 percent growth and some fold-in acquisitions.
11 9 ASG Security Beltsville, Md. $7,900,095 12.4% 187,021 $3,874,000 $26,679,000 $118,647,000 922 18
12 11 Interface Security Systems Holdings Inc. Earth City, Mo. $7,814,849 34.6% 106,522 $1,500,000 $20,140,000 $112,768,000 826 22
13 10 Bay Alarm Company Pacheco, Calif. $7,244,745 8.4% 118,917 $4,122,496 $10,578,116 $103,065,201 599 15
14 12 Security Networks West Palm Beach, Fla. $7,168,895 42.4% 172,339 na na $78,490,055 301 2
15 13 Protect America Inc. Austin, Texas $5,252,900 14.8% 142,736 $1,588,300 na $59,915,000 339 1
16 16 Security Systems Inc. Cromwell, Conn. $5,224,716 23.3% 138,788 $839,500 $209,765 $53,756,200 180 3
17 14 Central Security Group Inc. Tulsa, Okla. $5,223,059 14.9% 165,841 $335,833 $37,314 $60,344,697 296 6
18 15 Guardian Alarm Company Southfield, Mich. $4,625,900 9.1% 119,535 na na $79,173,635 429 9
SDM 100: Group Growth Impresses
2012 2011 2010 2009
Total recurring monthly revenue
$641.9 mil* $552.3 mil $510.7 mil $465.8 mil
Total subscribers 18.4 mil† 13.3 mil 12.2 mil 12.6 mil
Total annual revenue $20.2 bil** $9.3 bil $9.2 bil $8.2 bil
Total residential sales revenue
$171.9 mil†† $170.1 mil $146.6 mil $157.4 mil
Total non-residential sales revenue
$947.2 mil†† $852.47 mil $1.83 bil $2.31 bil
Business locations operated 992 995 1,044 996
Full time employees 55,950*** 53,219 56,259 53,086
Part time employees 1,950 1,037 512 618
Acquisitions 87 60 73 50
Accounts gained 79,269 34,242 49,178 42,738
* Total monthly recurring revenue, based on RMR of Dec. 31, 2012. Based on responses from 100 companies.
† Based on responses from or estimates of 91 companies. Not included: Habitec Security; Kastle Systems; Koorsen Fire & Security; Mijac Alarm; Safeguard Security; Scarsdale Security Systems Inc.; SDT Inc.; Sonitrol Tri-County; SSD Alarm Systems / Kern Security & Fire / Alpha Security & Fire
** Total annual (2012) revenue from electronic security system sales, installation, service, leasing, monitoring, and sales of subscriber accounts, as reported to or esti-mated by SDM. Based on responses from 99 companies. Not included: SAFE Security Companies
†† Based on responses from or estimates of 73 compa-nies. Note: Some firms either did not choose to report this figure or did not have sales/installation revenue to report in one of the categories.
Not included in Residential Sales Revenue are: A-Com Protection Services Inc.; ADT; Alarm Capital Alliance; ARK Systems Inc.; Briscoe Protective Systems Inc.; Diebold Security; Devcon Security; DTT; Electric Guard Dog; Fire Protection Inc.; G4S Technology LLC; Guardian Alarm Co.; Johnson Controls Inc.; Kastle Systems; Mijac Alarm; Monitronics Int’l; Protection 1; Redwire / Sonitrol of Tal-lahassee, Bay, NW FL, EC FL; RLC Security Inc.; Safe-guard Security; SafeTouch; Scarsdale Security Systems Inc.; SDT Inc.; Security Networks; Security Systems of America; Select Security; Sonitrol of Indianapolis; Sonitrol Tri-County; SSD Alarm Systems / Kern Security & Fire / Alpha Security & Fire; Stanley Convergent Security; Tyco Integrated Security; Vivint Inc.
Not included in Non-residential Sales Revenue are: A-Com Protection Services Inc.; ADT; Alarm Capital Alliance; Devcon Security; DTT; Electric Guard Dog; Fire Protection Inc.; Guardian Alarm Co.; Johnson Controls Inc.; Kastle Systems; Mijac Alarm; Monitronics Int’l; NorthStar Alarm Services LLC; Protect America Inc.; Protection 1; Redwire / Sonitrol of Tallahassee, Bay, NW FL, EC FL; RLC Security Inc.; Safeguard Security; SafeTouch; Scarsdale Security Systems Inc.; Security Networks; Select Security; Sonitrol Tri-County; SSD Alarm Systems / Kern Security & Fire / Alpha Security & Fire; Stanley Convergent Security; Tyco Integrated Security; Vivint Inc.
*** Based on responses from or estimates of 94 com-panies.
Not included: Crime Prevention Security Systems LLC; Diebold Security; Kastle Systems; Koorsen Fire & Security; Safeguard Security; SSD Alarm Systems / Kern Security & Fire / Alpha Security & Fire
Source: 2012 SDM 100, SDM Magazine, May 2012
The table, above, presents aggregate figures for the SDM 100 group of companies, which are ranked by their recurring monthly revenue — an industry standard of valuation of a security installation and monitoring business. Most of the SDM 100 companies are privately held. Sub-mitting recurring monthly revenue (RMR) is required for ranking; other figures are not required but mostly provided. Most companies — but not all — also reported their total annual revenue, number of subscribers, and installation revenues. Therefore, one should exercise caution in using this information to extrapolate industry totals or to benchmark. Beginning in 2011, “sys-tems integrator” companies that collect RMR were allowed to be ranked on the SDM 100. This year, several new integrators are ranked for the first time, including Tyco Integrated Security, Diebold Security, G4S Technology, RFI Communications & Security Systems, and Johnson Controls. The inclusion of these companies, as well as solid growth among other dealers, are the main reasons for the big boost in both RMR and total revenue growth.
52 May 2013
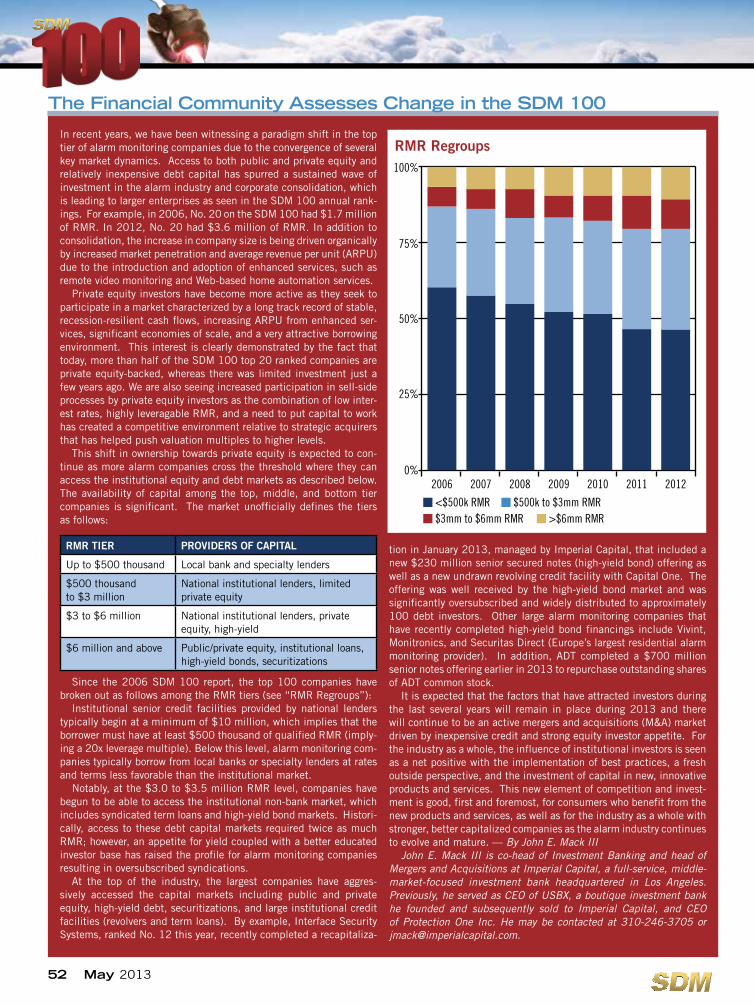
In recent years, we have been witnessing a paradigm shift in the top tier of alarm monitoring companies due to the convergence of several key market dynamics. Access to both public and private equity and relatively inexpensive debt capital has spurred a sustained wave of investment in the alarm industry and corporate consolidation, which is leading to larger enterprises as seen in the SDM 100 annual rank-ings. For example, in 2006, No. 20 on the SDM 100 had $1.7 million of RMR. In 2012, No. 20 had $3.6 million of RMR. In addition to consolidation, the increase in company size is being driven organically by increased market penetration and average revenue per unit (ARPU) due to the introduction and adoption of enhanced services, such as remote video monitoring and Web-based home automation services.
Private equity investors have become more active as they seek to participate in a market characterized by a long track record of stable, recession-resilient cash flows, increasing ARPU from enhanced ser-vices, significant economies of scale, and a very attractive borrowing environment. This interest is clearly demonstrated by the fact that today, more than half of the SDM 100 top 20 ranked companies are private equity-backed, whereas there was limited investment just a few years ago. We are also seeing increased participation in sell-side processes by private equity investors as the combination of low inter-est rates, highly leveragable RMR, and a need to put capital to work has created a competitive environment relative to strategic acquirers that has helped push valuation multiples to higher levels.
This shift in ownership towards private equity is expected to con-tinue as more alarm companies cross the threshold where they can access the institutional equity and debt markets as described below. The availability of capital among the top, middle, and bottom tier companies is significant. The market unofficially defines the tiers as follows:
RMR TIER PROVIDERS OF CAPITAL
Up to $500 thousand Local bank and specialty lenders
$500 thousand to $3 million
National institutional lenders, limited private equity
$3 to $6 million National institutional lenders, private equity, high-yield
$6 million and above Public/private equity, institutional loans, high-yield bonds, securitizations
Since the 2006 SDM 100 report, the top 100 companies have broken out as follows among the RMR tiers (see “RMR Regroups”):
Institutional senior credit facilities provided by national lenders typically begin at a minimum of $10 million, which implies that the borrower must have at least $500 thousand of qualified RMR (imply-ing a 20x leverage multiple). Below this level, alarm monitoring com-panies typically borrow from local banks or specialty lenders at rates and terms less favorable than the institutional market.
Notably, at the $3.0 to $3.5 million RMR level, companies have begun to be able to access the institutional non-bank market, which includes syndicated term loans and high-yield bond markets. Histori-cally, access to these debt capital markets required twice as much RMR; however, an appetite for yield coupled with a better educated investor base has raised the profile for alarm monitoring companies resulting in oversubscribed syndications.
At the top of the industry, the largest companies have aggres-sively accessed the capital markets including public and private equity, high-yield debt, securitizations, and large institutional credit facilities (revolvers and term loans). By example, Interface Security Systems, ranked No. 12 this year, recently completed a recapitaliza-
tion in January 2013, managed by Imperial Capital, that included a new $230 million senior secured notes (high-yield bond) offering as well as a new undrawn revolving credit facility with Capital One. The offering was well received by the high-yield bond market and was significantly oversubscribed and widely distributed to approximately 100 debt investors. Other large alarm monitoring companies that have recently completed high-yield bond financings include Vivint, Monitronics, and Securitas Direct (Europe’s largest residential alarm monitoring provider). In addition, ADT completed a $700 million senior notes offering earlier in 2013 to repurchase outstanding shares of ADT common stock.
It is expected that the factors that have attracted investors during the last several years will remain in place during 2013 and there will continue to be an active mergers and acquisitions (M&A) market driven by inexpensive credit and strong equity investor appetite. For the industry as a whole, the influence of institutional investors is seen as a net positive with the implementation of best practices, a fresh outside perspective, and the investment of capital in new, innovative products and services. This new element of competition and invest-ment is good, first and foremost, for consumers who benefit from the new products and services, as well as for the industry as a whole with stronger, better capitalized companies as the alarm industry continues to evolve and mature. — By John E. Mack III
John E. Mack III is co-head of Investment Banking and head of Mergers and Acquisitions at Imperial Capital, a full-service, middle-market-focused investment bank headquartered in Los Angeles. Previously, he served as CEO of USBX, a boutique investment bank he founded and subsequently sold to Imperial Capital, and CEO of Protection One Inc. He may be contacted at 310-246-3705 or [email protected].
The Financial Community Assesses Change in the SDM 100
2006 2008 20102007 2009 2011 2012
100%
75%
50%
25%
0%
<$500k RMR $500k to $3mm RMR$3mm to $6mm RMR >$6mm RMR
RMR Regroups
54 May 2013
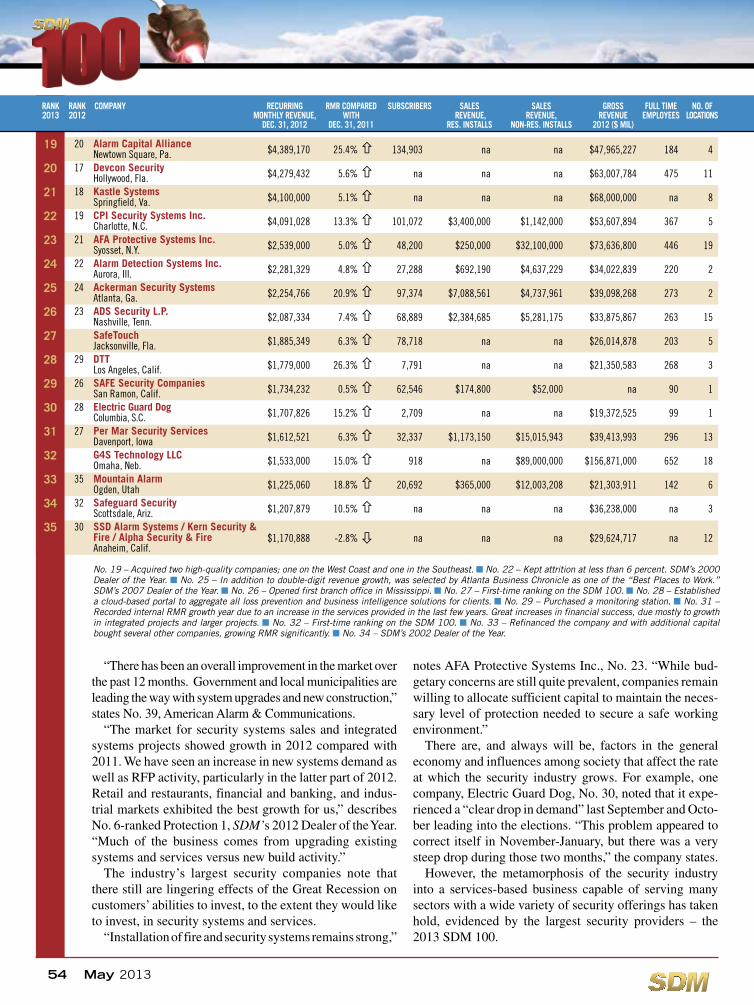
No. 19 – Acquired two high-quality companies; one on the West Coast and one in the Southeast. n No. 22 – Kept attrition at less than 6 percent. SDM’s 2000 Dealer of the Year. n No. 25 – In addition to double-digit revenue growth, was selected by Atlanta Business Chronicle as one of the “Best Places to Work.” SDM’s 2007 Dealer of the Year. n No. 26 – Opened first branch office in Mississippi. n No. 27 – First-time ranking on the SDM 100. n No. 28 – Established a cloud-based portal to aggregate all loss prevention and business intelligence solutions for clients. n No. 29 – Purchased a monitoring station. n No. 31 – Recorded internal RMR growth year due to an increase in the services provided in the last few years. Great increases in financial success, due mostly to growth in integrated projects and larger projects. n No. 32 – First-time ranking on the SDM 100. n No. 33 – Refinanced the company and with additional capital bought several other companies, growing RMR significantly. n No. 34 – SDM’s 2002 Dealer of the Year.
19 20 Alarm Capital Alliance Newtown Square, Pa. $4,389,170 25.4% 134,903 na na $47,965,227 184 4
20 17 Devcon Security Hollywood, Fla. $4,279,432 5.6% na na na $63,007,784 475 11
21 18 Kastle Systems Springfield, Va. $4,100,000 5.1% na na na $68,000,000 na 8
22 19 CPI Security Systems Inc. Charlotte, N.C. $4,091,028 13.3% 101,072 $3,400,000 $1,142,000 $53,607,894 367 5
23 21 AFA Protective Systems Inc. Syosset, N.Y. $2,539,000 5.0% 48,200 $250,000 $32,100,000 $73,636,800 446 19
24 22 Alarm Detection Systems Inc. Aurora, Ill. $2,281,329 4.8% 27,288 $692,190 $4,637,229 $34,022,839 220 2
25 24 Ackerman Security Systems Atlanta, Ga. $2,254,766 20.9% 97,374 $7,088,561 $4,737,961 $39,098,268 273 2
26 23 ADS Security L.P. Nashville, Tenn. $2,087,334 7.4% 68,889 $2,384,685 $5,281,175 $33,875,867 263 15
27 SafeTouch Jacksonville, Fla. $1,885,349 6.3% 78,718 na na $26,014,878 203 5
28 29 DTT Los Angeles, Calif. $1,779,000 26.3% 7,791 na na $21,350,583 268 3
29 26 SAFE Security Companies San Ramon, Calif. $1,734,232 0.5% 62,546 $174,800 $52,000 na 90 1
30 28 Electric Guard Dog Columbia, S.C. $1,707,826 15.2% 2,709 na na $19,372,525 99 1
31 27 Per Mar Security Services Davenport, Iowa $1,612,521 6.3% 32,337 $1,173,150 $15,015,943 $39,413,993 296 13
32 G4S Technology LLC Omaha, Neb. $1,533,000 15.0% 918 na $89,000,000 $156,871,000 652 18
33 35 Mountain Alarm Ogden, Utah $1,225,060 18.8% 20,692 $365,000 $12,003,208 $21,303,911 142 6
34 32 Safeguard Security Scottsdale, Ariz. $1,207,879 10.5% na na na $36,238,000 na 3
35 30 SSD Alarm Systems / Kern Security & Fire / Alpha Security & Fire Anaheim, Calif.
$1,170,888 -2.8% na na na $29,624,717 na 12
“There has been an overall improvement in the market over the past 12 months. Government and local municipalities are leading the way with system upgrades and new construction,” states No. 39, American Alarm & Communications.
“The market for security systems sales and integrated systems projects showed growth in 2012 compared with 2011. We have seen an increase in new systems demand as well as RFP activity, particularly in the latter part of 2012. Retail and restaurants, financial and banking, and indus-trial markets exhibited the best growth for us,” describes No. 6-ranked Protection 1, SDM’s 2012 Dealer of the Year. “Much of the business comes from upgrading existing systems and services versus new build activity.”
The industry’s largest security companies note that there still are lingering effects of the Great Recession on customers’ abilities to invest, to the extent they would like to invest, in security systems and services.
“Installation of fire and security systems remains strong,”
notes AFA Protective Systems Inc., No. 23. “While bud-getary concerns are still quite prevalent, companies remain willing to allocate sufficient capital to maintain the neces-sary level of protection needed to secure a safe working environment.”
There are, and always will be, factors in the general economy and influences among society that affect the rate at which the security industry grows. For example, one company, Electric Guard Dog, No. 30, noted that it expe-rienced a “clear drop in demand” last September and Octo-ber leading into the elections. “This problem appeared to correct itself in November-January, but there was a very steep drop during those two months,” the company states.
However, the metamorphosis of the security industry into a services-based business capable of serving many sectors with a wide variety of security offerings has taken hold, evidenced by the largest security providers – the 2013 SDM 100.
RANK RECURRING MONTHLY SUBSCRIBERS SALES REVENUE, SALES REVENUE, GROSS REVENUE FULL TIME NUMBER OF 2009 COMPANY REVENUE, DEC. 31, 2007 2007 RES. INSTALLS NON-RES. INSTALLS 2007 ($ MIL) EMPLOYEES LOCATIONS RANK RANK COMPANY RECURRING RMR COMPARED SUBSCRIBERS SALES SALES GROSS FULL TIME NO. OF 2013 2012 MONTHLY REVENUE, WITH REVENUE, REVENUE, REVENUE EMPLOYEES LOCATIONS DEC. 31, 2012 DEC. 31, 2011 RES. INSTALLS NON-RES. INSTALLS 2012 ($ MIL)
56 May 2013
RANK RECURRING MONTHLY SUBSCRIBERS SALES REVENUE, SALES REVENUE, GROSS REVENUE FULL TIME NUMBER OF 2009 COMPANY REVENUE, DEC. 31, 2007 2007 RES. INSTALLS NON-RES. INSTALLS 2007 ($ MIL) EMPLOYEES LOCATIONS RANK RANK COMPANY RECURRING RMR COMPARED SUBSCRIBERS SALES SALES GROSS FULL TIME NO. OF 2013 2012 MONTHLY REVENUE, WITH REVENUE, REVENUE, REVENUE EMPLOYEES LOCATIONS DEC. 31, 2012 DEC. 31, 2011 RES. INSTALLS NON-RES. INSTALLS 2012 ($ MIL)
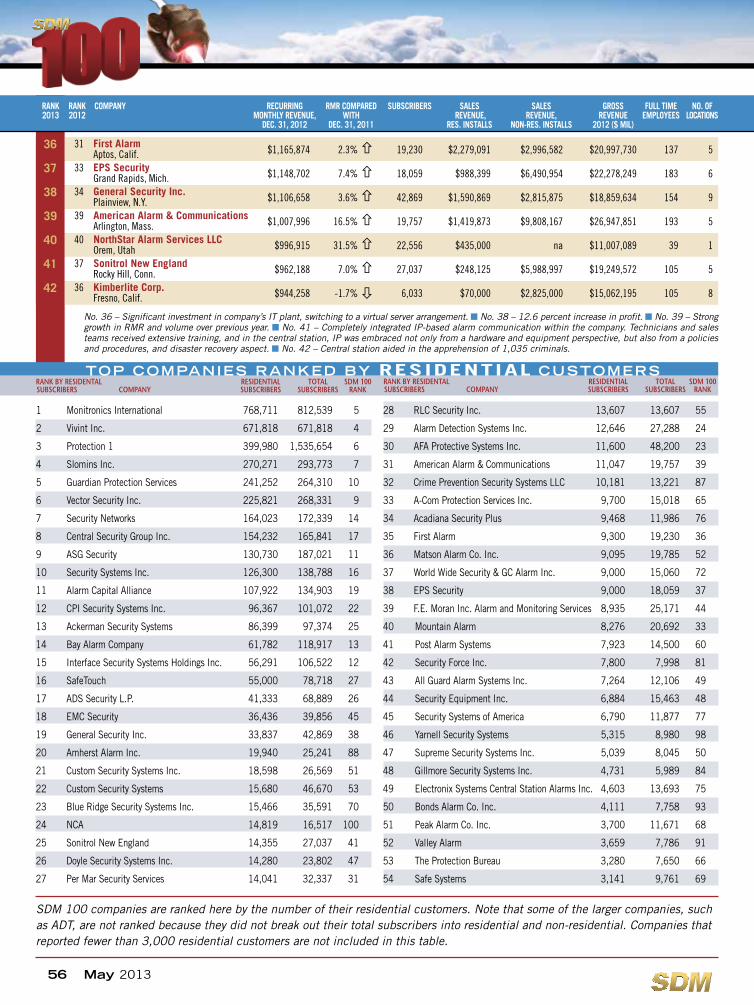
1 Monitronics International 768,711 812,539 5
2 Vivint Inc. 671,818 671,818 4
3 Protection 1 399,980 1,535,654 6
4 Slomins Inc. 270,271 293,773 7
5 Guardian Protection Services 241,252 264,310 10
6 Vector Security Inc. 225,821 268,331 9
7 Security Networks 164,023 172,339 14
8 Central Security Group Inc. 154,232 165,841 17
9 ASG Security 130,730 187,021 11
10 Security Systems Inc. 126,300 138,788 16
11 Alarm Capital Alliance 107,922 134,903 19
12 CPI Security Systems Inc. 96,367 101,072 22
13 Ackerman Security Systems 86,399 97,374 25
14 Bay Alarm Company 61,782 118,917 13
15 Interface Security Systems Holdings Inc. 56,291 106,522 12
16 SafeTouch 55,000 78,718 27
17 ADS Security L.P. 41,333 68,889 26
18 EMC Security 36,436 39,856 45
19 General Security Inc. 33,837 42,869 38
20 Amherst Alarm Inc. 19,940 25,241 88
21 Custom Security Systems Inc. 18,598 26,569 51
22 Custom Security Systems 15,680 46,670 53
23 Blue Ridge Security Systems Inc. 15,466 35,591 70
24 NCA 14,819 16,517 100
25 Sonitrol New England 14,355 27,037 41
26 Doyle Security Systems Inc. 14,280 23,802 47
27 Per Mar Security Services 14,041 32,337 31
28 RLC Security Inc. 13,607 13,607 55
29 Alarm Detection Systems Inc. 12,646 27,288 24
30 AFA Protective Systems Inc. 11,600 48,200 23
31 American Alarm & Communications 11,047 19,757 39
32 Crime Prevention Security Systems LLC 10,181 13,221 87
33 A-Com Protection Services Inc. 9,700 15,018 65
34 Acadiana Security Plus 9,468 11,986 76
35 First Alarm 9,300 19,230 36
36 Matson Alarm Co. Inc. 9,095 19,785 52
37 World Wide Security & GC Alarm Inc. 9,000 15,060 72
38 EPS Security 9,000 18,059 37
39 F.E. Moran Inc. Alarm and Monitoring Services 8,935 25,171 44
40 Mountain Alarm 8,276 20,692 33
41 Post Alarm Systems 7,923 14,500 60
42 Security Force Inc. 7,800 7,998 81
43 All Guard Alarm Systems Inc. 7,264 12,106 49
44 Security Equipment Inc. 6,884 15,463 48
45 Security Systems of America 6,790 11,877 77
46 Yarnell Security Systems 5,315 8,980 98
47 Supreme Security Systems Inc. 5,039 8,045 50
48 Gillmore Security Systems Inc. 4,731 5,989 84
49 Electronix Systems Central Station Alarms Inc. 4,603 13,693 75
50 Bonds Alarm Co. Inc. 4,111 7,758 93
51 Peak Alarm Co. Inc. 3,700 11,671 68
52 Valley Alarm 3,659 7,786 91
53 The Protection Bureau 3,280 7,650 66
54 Safe Systems 3,141 9,761 69
TOP COMPANIES RANKED BY RESIDENTIAL CUSTOMERS RANK BY RESIDENTAL RESIDENTIAL TOTAL SDM 100 SUBSCRIBERS COMPANY SUBSCRIBERS SUBSCRIBERS RANK
RANK BY RESIDENTAL RESIDENTIAL TOTAL SDM 100 SUBSCRIBERS COMPANY SUBSCRIBERS SUBSCRIBERS RANK
No. 36 – Significant investment in company’s IT plant, switching to a virtual server arrangement. n No. 38 – 12.6 percent increase in profit. n No. 39 – Strong growth in RMR and volume over previous year. n No. 41 – Completely integrated IP-based alarm communication within the company. Technicians and sales teams received extensive training, and in the central station, IP was embraced not only from a hardware and equipment perspective, but also from a policies and procedures, and disaster recovery aspect. n No. 42 – Central station aided in the apprehension of 1,035 criminals.
36 31 First Alarm Aptos, Calif. $1,165,874 2.3% 19,230 $2,279,091 $2,996,582 $20,997,730 137 5
37 33 EPS Security Grand Rapids, Mich. $1,148,702 7.4% 18,059 $988,399 $6,490,954 $22,278,249 183 6
38 34 General Security Inc. Plainview, N.Y. $1,106,658 3.6% 42,869 $1,590,869 $2,815,875 $18,859,634 154 9
39 39 American Alarm & Communications Arlington, Mass. $1,007,996 16.5% 19,757 $1,419,873 $9,808,167 $26,947,851 193 5
40 40 NorthStar Alarm Services LLC Orem, Utah $996,915 31.5% 22,556 $435,000 na $11,007,089 39 1
41 37 Sonitrol New England Rocky Hill, Conn. $962,188 7.0% 27,037 $248,125 $5,988,997 $19,249,572 105 5
42 36 Kimberlite Corp. Fresno, Calif. $944,258 -1.7% 6,033 $70,000 $2,825,000 $15,062,195 105 8
SDM 100 companies are ranked here by the number of their residential customers. Note that some of the larger companies, such as ADT, are not ranked because they did not break out their total subscribers into residential and non-residential. Companies that reported fewer than 3,000 residential customers are not included in this table.
58 May 2013
Revenue Segmented by Business Services
Average percentage of total revenue among SDM 100 companies, distributed by types of services
RANK RECURRING MONTHLY SUBSCRIBERS SALES REVENUE, SALES REVENUE, GROSS REVENUE FULL TIME NUMBER OF 2009 COMPANY REVENUE, DEC. 31, 2007 2007 RES. INSTALLS NON-RES. INSTALLS 2007 ($ MIL) EMPLOYEES LOCATIONS RANK RANK COMPANY RECURRING RMR COMPARED SUBSCRIBERS SALES SALES GROSS FULL TIME NO. OF 2013 2012 MONTHLY REVENUE, WITH REVENUE, REVENUE, REVENUE EMPLOYEES LOCATIONS DEC. 31, 2012 DEC. 31, 2011 RES. INSTALLS NON-RES. INSTALLS 2012 ($ MIL)
No. 44 – Doubled the number of employees and experienced significant RMR growth. n No. 45 – Continued to expand monitoring of school systems with seven total school systems now being monitored. Large increase in number of monitored systems being placed online. Connected services business growing with continued expansion of the “SecurePath” marketing message that includes three connected paths for security monitoring. n No. 47 – Acquired two companies in Albany, N.Y., and opened a full-service branch. n No. 48 – Expanded hosted and managed services. n No. 49 – Installed a large residential security system integrating burglar, fire, CCTV and fence protection.
43 38 Sonitrol Pacific Portland, Ore. $902,667 0.4% 4,500 $60,000 $2,574,780 $13,752,302 85 5
44 47 F.E. Moran Inc. Alarm and Monitoring Services Champaign, Ill.
$837,164 42.1% 25,171 $606,829 $10,992,478 $25,693,946 183 7
45 42 EMC Security Suwanee, Ga. $759,500 15.0% 39,856 $3,593,022 $1,576,595 $13,367,270 100 1
46 41 Sonitrol of Sacramento & Sonitrol Orange County Roseville, Calif.
$757,800 4.8% 4,553 $80,679 $3,683,886 $12,943,346 68 2
47 44 Doyle Security Systems Inc. Rochester, N.Y. $719,850 11.3% 23,802 $640,000 $2,326,000 $12,201,278 94 5
48 43 Security Equipment Inc. Omaha, Neb. $688,479 6.2% 15,463 $712,820 $9,424,237 $20,043,472 140 4
49 46 All Guard Alarm Systems Inc. Hayward, Calif. $609,048 1.8% 12,106 $670,284 $1,316,587 $9,771,760 63 2
50 45 Supreme Security Systems Inc. Union, N.J. $576,340 -4.0% 8,045 $255,665 $1,137,773 $9,058,236 71 1
51 49 Custom Security Systems Inc. Baton Rouge, La. $572,538 8.7% 26,569 $1,501,069 $843,935 $10,250,281 61 1
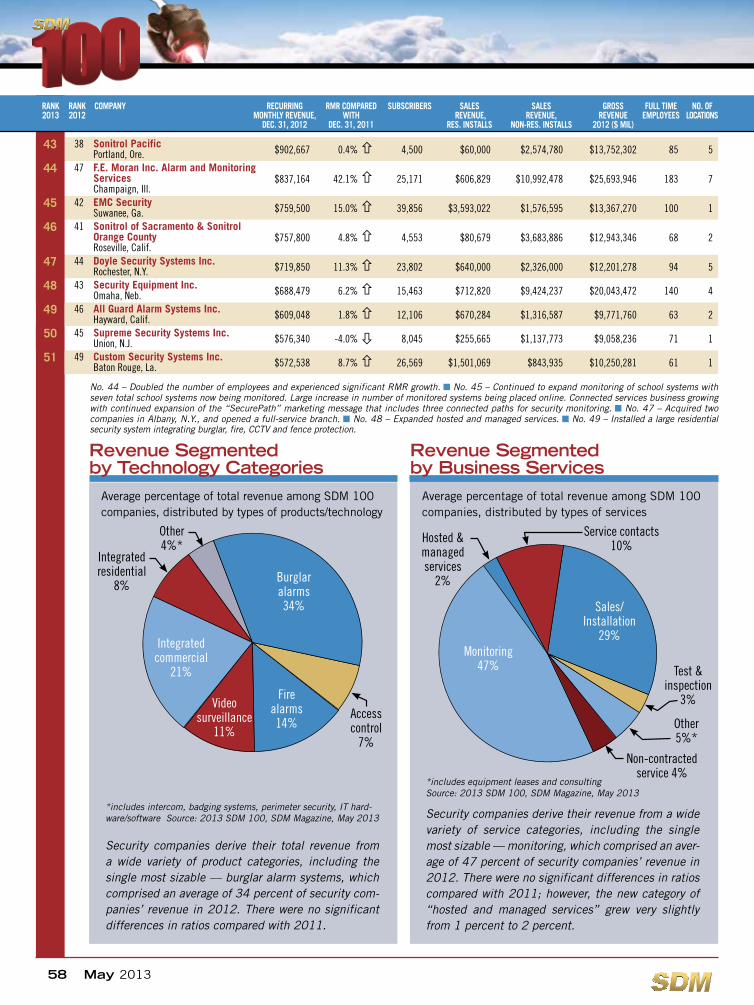
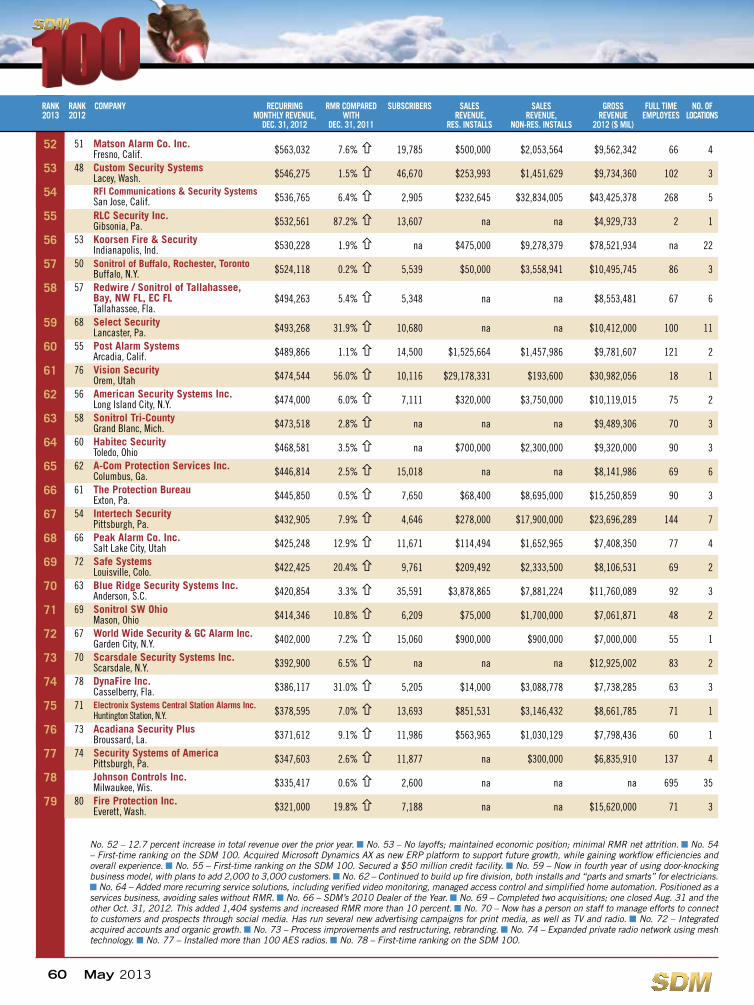
Security companies derive their revenue from a wide variety of service categories, including the single most sizable — monitoring, which comprised an aver-age of 47 percent of security companies’ revenue in 2012. There were no significant differences in ratios compared with 2011; however, the new category of “hosted and managed services” grew very slightly from 1 percent to 2 percent.
Revenue Segmented by Technology Categories
Average percentage of total revenue among SDM 100 companies, distributed by types of products/technology
Security companies derive their total revenue from a wide variety of product categories, including the single most sizable — burglar alarm systems, which comprised an average of 34 percent of security com-panies’ revenue in 2012. There were no significant differences in ratios compared with 2011.
*includes intercom, badging systems, perimeter security, IT hard-ware/software Source: 2013 SDM 100, SDM Magazine, May 2013
*includes equipment leases and consultingSource: 2013 SDM 100, SDM Magazine, May 2013
Burglar alarms34%
Fire alarms14%
Access control
7%
Video surveillance
11%
Integratedcommercial
21%
Integratedresidential
8%
Other4%*
Sales/Installation
29%Monitoring
47%
Hosted & managed services
2%
Service contacts10%
Test & inspection
3%
Other5%*
Non-contracted service 4%
60 May 2013
RANK RECURRING MONTHLY SUBSCRIBERS SALES REVENUE, SALES REVENUE, GROSS REVENUE FULL TIME NUMBER OF 2009 COMPANY REVENUE, DEC. 31, 2007 2007 RES. INSTALLS NON-RES. INSTALLS 2007 ($ MIL) EMPLOYEES LOCATIONS RANK RANK COMPANY RECURRING RMR COMPARED SUBSCRIBERS SALES SALES GROSS FULL TIME NO. OF 2013 2012 MONTHLY REVENUE, WITH REVENUE, REVENUE, REVENUE EMPLOYEES LOCATIONS DEC. 31, 2012 DEC. 31, 2011 RES. INSTALLS NON-RES. INSTALLS 2012 ($ MIL)
No. 52 – 12.7 percent increase in total revenue over the prior year. n No. 53 – No layoffs; maintained economic position; minimal RMR net attrition. n No. 54 – First-time ranking on the SDM 100. Acquired Microsoft Dynamics AX as new ERP platform to support future growth, while gaining workflow efficiencies and overall experience. n No. 55 – First-time ranking on the SDM 100. Secured a $50 million credit facility. n No. 59 – Now in fourth year of using door-knocking business model, with plans to add 2,000 to 3,000 customers. n No. 62 – Continued to build up fire division, both installs and “parts and smarts” for electricians. n No. 64 – Added more recurring service solutions, including verified video monitoring, managed access control and simplified home automation. Positioned as a services business, avoiding sales without RMR. n No. 66 – SDM’s 2010 Dealer of the Year. n No. 69 – Completed two acquisitions; one closed Aug. 31 and the other Oct. 31, 2012. This added 1,404 systems and increased RMR more than 10 percent. n No. 70 – Now has a person on staff to manage efforts to connect to customers and prospects through social media. Has run several new advertising campaigns for print media, as well as TV and radio. n No. 72 – Integrated acquired accounts and organic growth. n No. 73 – Process improvements and restructuring, rebranding. n No. 74 – Expanded private radio network using mesh technology. n No. 77 – Installed more than 100 AES radios. n No. 78 – First-time ranking on the SDM 100.
52 51 Matson Alarm Co. Inc. Fresno, Calif. $563,032 7.6% 19,785 $500,000 $2,053,564 $9,562,342 66 4
53 48 Custom Security Systems Lacey, Wash. $546,275 1.5% 46,670 $253,993 $1,451,629 $9,734,360 102 3
54 RFI Communications & Security Systems San Jose, Calif. $536,765 6.4% 2,905 $232,645 $32,834,005 $43,425,378 268 5
55 RLC Security Inc. Gibsonia, Pa. $532,561 87.2% 13,607 na na $4,929,733 2 1
56 53 Koorsen Fire & Security Indianapolis, Ind. $530,228 1.9% na $475,000 $9,278,379 $78,521,934 na 22
57 50 Sonitrol of Buffalo, Rochester, Toronto Buffalo, N.Y. $524,118 0.2% 5,539 $50,000 $3,558,941 $10,495,745 86 3
58 57 Redwire / Sonitrol of Tallahassee, Bay, NW FL, EC FL Tallahassee, Fla.
$494,263 5.4% 5,348 na na $8,553,481 67 6
59 68 Select Security Lancaster, Pa. $493,268 31.9% 10,680 na na $10,412,000 100 11
60 55 Post Alarm Systems Arcadia, Calif. $489,866 1.1% 14,500 $1,525,664 $1,457,986 $9,781,607 121 2
61 76 Vision Security Orem, Utah $474,544 56.0% 10,116 $29,178,331 $193,600 $30,982,056 18 1
62 56 American Security Systems Inc. Long Island City, N.Y. $474,000 6.0% 7,111 $320,000 $3,750,000 $10,119,015 75 2
63 58 Sonitrol Tri-County Grand Blanc, Mich. $473,518 2.8% na na na $9,489,306 70 3
64 60 Habitec Security Toledo, Ohio $468,581 3.5% na $700,000 $2,300,000 $9,320,000 90 3
65 62 A-Com Protection Services Inc. Columbus, Ga. $446,814 2.5% 15,018 na na $8,141,986 69 6
66 61 The Protection Bureau Exton, Pa. $445,850 0.5% 7,650 $68,400 $8,695,000 $15,250,859 90 3
67 54 Intertech Security Pittsburgh, Pa. $432,905 7.9% 4,646 $278,000 $17,900,000 $23,696,289 144 7
68 66 Peak Alarm Co. Inc. Salt Lake City, Utah $425,248 12.9% 11,671 $114,494 $1,652,965 $7,408,350 77 4
69 72 Safe Systems Louisville, Colo. $422,425 20.4% 9,761 $209,492 $2,333,500 $8,106,531 69 2
70 63 Blue Ridge Security Systems Inc. Anderson, S.C. $420,854 3.3% 35,591 $3,878,865 $7,881,224 $11,760,089 92 3
71 69 Sonitrol SW Ohio Mason, Ohio $414,346 10.8% 6,209 $75,000 $1,700,000 $7,061,871 48 2
72 67 World Wide Security & GC Alarm Inc. Garden City, N.Y. $402,000 7.2% 15,060 $900,000 $900,000 $7,000,000 55 1
73 70 Scarsdale Security Systems Inc. Scarsdale, N.Y. $392,900 6.5% na na na $12,925,002 83 2
74 78 DynaFire Inc. Casselberry, Fla. $386,117 31.0% 5,205 $14,000 $3,088,778 $7,738,285 63 3
75 71 Electronix Systems Central Station Alarms Inc. Huntington Station, N.Y. $378,595 7.0% 13,693 $851,531 $3,146,432 $8,661,785 71 1
76 73 Acadiana Security Plus Broussard, La. $371,612 9.1% 11,986 $563,965 $1,030,129 $7,798,436 60 1
77 74 Security Systems of America Pittsburgh, Pa. $347,603 2.6% 11,877 na $300,000 $6,835,910 137 4
78 Johnson Controls Inc. Milwaukee, Wis. $335,417 0.6% 2,600 na na na 695 35
79 80 Fire Protection Inc. Everett, Wash. $321,000 19.8% 7,188 na na $15,620,000 71 3

62 May 2013
RANK RECURRING MONTHLY SUBSCRIBERS SALES REVENUE, SALES REVENUE, GROSS REVENUE FULL TIME NUMBER OF 2009 COMPANY REVENUE, DEC. 31, 2007 2007 RES. INSTALLS NON-RES. INSTALLS 2007 ($ MIL) EMPLOYEES LOCATIONS RANK RANK COMPANY RECURRING RMR COMPARED SUBSCRIBERS SALES SALES GROSS FULL TIME NO. OF 2013 2012 MONTHLY REVENUE, WITH REVENUE, REVENUE, REVENUE EMPLOYEES LOCATIONS DEC. 31, 2012 DEC. 31, 2011 RES. INSTALLS NON-RES. INSTALLS 2012 ($ MIL)
80 75 Washington Alarm Inc. Seattle, Wash. $314,288 2.6% 5,320 $153,960 $1,085,556 $5,361,247 46 1
81 Security Force Inc. Raleigh, N.C. $312,116 141.5% 7,998 $400,000 $35,000 $7,100,000 42 3
82 77 Richmond Alarm Company Midlothian, Va. $305,630 2.2% 10,060 $1,152,000 $1,041,000 $6,902,388 76 3
83 79 Bates Security LLC / Sonitrol of Lexington Lexington, Ky. $302,982 7.4% 4,355 $350,178 $3,289,740 $8,152,321 53 1
84 83 Gillmore Security Systems Inc. Cleveland, Ohio $292,684 13.1% 5,989 $1,065,000 $565,000 $5,147,919 42 1
85 90 ARK Systems Inc. Columbia, Md. $286,392 23.5% 1,196 na $12,000,000 $18,300,000 117 3
1 G4S Technology LLC 212 $89,000,000 32
2 Vector Security Inc. 4,665 $73,533,000 9
3 Slomins Inc. 1,471 $34,095,052 7
4 RFI Communications & Security Systems 1,294 $32,834,005 54
5 AFA Protective Systems Inc. 6,400 $32,100,000 23
6 ASG Security 18,735 $26,679,000 11
7 Interface Security Systems Holdings Inc. 4,800 $20,140,000 12
8 Intertech Security 530 $17,900,000 67
9 Per Mar Security Services 7,372 $15,015,943 31
10 Mountain Alarm 1,488 $12,003,208 33
11 ARK Systems Inc. 200 $12,000,000 85
12 F.E. Moran Inc. Alarm and Monitoring Services 4,087 $10,992,478 44
13 Bay Alarm Company 9,940 $10,578,116 13
14 American Alarm & Communications 3,421 $9,808,167 39
15 Security Equipment Inc. 822 $9,424,237 48
16 Koorsen Fire & Security 2,400 $9,278,379 56
17 Guardian Protection Services 3,335 $8,821,132 10
18 The Protection Bureau 550 $8,695,000 66
19 SDT Inc. 317 $7,890,000 97
20 Blue Ridge Security Systems Inc. 2,065 $7,881,224 70
21 EPS Security 645 $6,490,954 37
22 Custom Alarm 865 $6,000,000 92
23 Sonitrol New England 2,055 $5,988,997 41
24 ADS Security L.P. 2,174 $5,281,175 26
25 Ackerman Security Systems 2,129 $4,737,961 25
26 Alarm Detection Systems Inc. 861 $4,637,229 24
27 American Security Systems Inc. 150 $3,750,000 62
28 Sonitrol of Sacramento & Sonitrol Orange County 1,434 $3,683,886 46
29 Sonitrol of Buffalo, Rochester, Toronto 179 $3,558,941 57
30 Bates Security LLC / Sonitrol of Lexington 319 $3,289,740 83
31 Electronix Systems Central Station Alarms Inc. 542 $3,146,432 75
32 DynaFire Inc. 680 $3,088,778 74
33 First Alarm 1,563 $2,996,582 36
34 Kimberlite Corp. 459 $2,825,000 42
35 General Security Inc. 887 $2,815,875 38
36 Sonitrol Pacific 338 $2,574,780 43
37 Safe Systems 1,067 $2,333,500 69
38 Doyle Security Systems Inc. 480 $2,326,000 47
39 Habitec Security 650 $2,300,000 64
40 Moon Security Services Inc. 600 $2,165,792 95
41 Matson Alarm Co. Inc. 899 $2,053,564 52
42 Sentry Security 521 $1,954,369 96
43 Briscoe Protective Systems Inc. 80 $1,879,745 94
44 Sonitrol SW Ohio 75,000 $1,700,000 71
45 Peak Alarm Co. Inc. 844 $1,652,965 68
46 EMC Security 775 $1,576,595 45
47 Yarnell Security Systems 120 $1,500,000 98
48 Post Alarm Systems 314 $1,457,986 60
49 Custom Security Systems 485 $1,451,629 53
50 All Guard Alarm Systems Inc. 480 $1,316,587 49
51 Sonitrol of Indianapolis 150 $1,303,100 89
52 CPI Security Systems Inc. 1,532 $1,142,000 22
53 Supreme Security Systems Inc. 518 $1,137,773 50
54 Amherst Alarm Inc. 160 $1,120,000 88
55 Washington Alarm Inc. 1,092 $1,085,556 80
56 Richmond Alarm Company 100 $1,041,000 82
57 Acadiana Security Plus 131 $1,030,129 76
RANK BY NON-RESIDENTIAL NON- SDM INSTALLATION INSTALLATIONS RESIDENTIAL 100 REVENUE COMPANY 2012 REVENUE RANK
RANK BY NON-RESIDENTIAL NON- SDM INSTALLATION INSTALLATIONS RESIDENTIAL 100 REVENUE COMPANY 2012 REVENUE RANK
TOP COMPANIES RANKED BY NON-RESIDENTIAL INSTALLATION REVENUE
No. 80 – Invested in a new building, infrastructure and personnel. n No. 81 – First-time ranking on the SDM 100. Expanded operation further north and south into Virginia and South Carolina. n No. 82 – Integrated a 2011 acquisition into operation. Closed a central station and organized and updated the accounts. n No. 83 – Moved to a brand new corporate headquarters, a three-story 14,000-sq.-ft. building, while continuing strong sales growth and maintaining a high level of customer service. n No. 84 – Integrated an acquisition.
SDM 100 companies are ranked here by the amount of their installation revenue from non-residential projects. Note that some of the larger companies, such as Tyco Integrated Security and Stanley Convergent Security, are not ranked because they did not report this number to SDM. Companies that reported less than $1 million are not included in this table.
64 May 2013
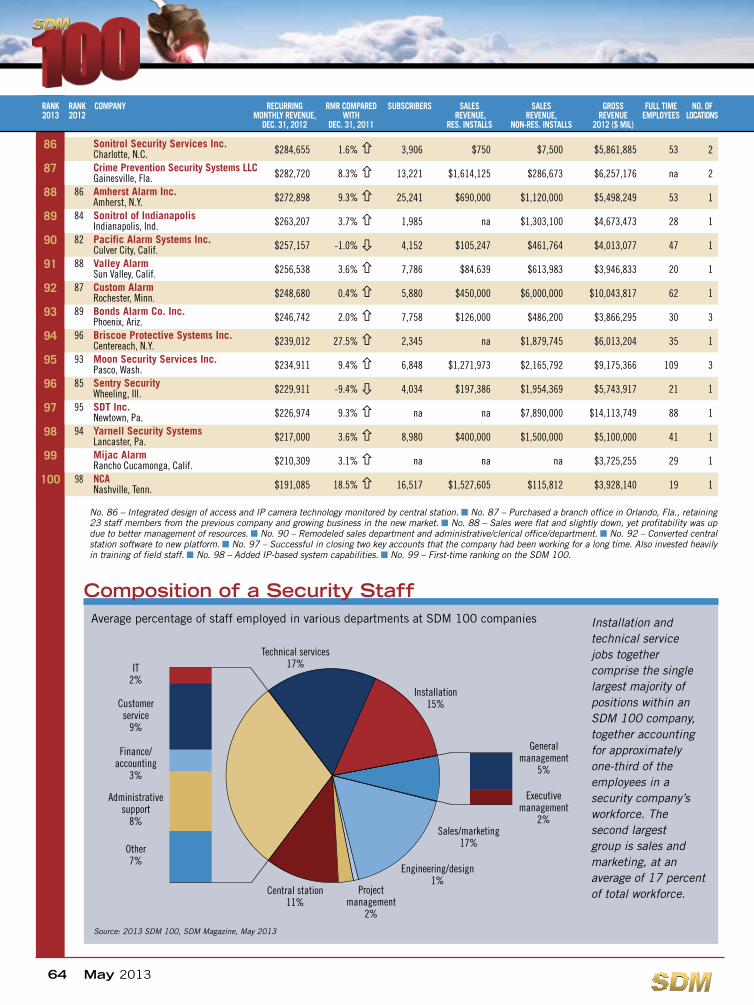
Installation and technical service jobs together comprise the single largest majority of positions within an SDM 100 company, together accounting for approximately one-third of the employees in a security company’s workforce. The second largest group is sales and marketing, at an average of 17 percent of total workforce.
Source: 2013 SDM 100, SDM Magazine, May 2013
Average percentage of staff employed in various departments at SDM 100 companies
Composition of a Security Staff
RANK RECURRING MONTHLY SUBSCRIBERS SALES REVENUE, SALES REVENUE, GROSS REVENUE FULL TIME NUMBER OF 2009 COMPANY REVENUE, DEC. 31, 2007 2007 RES. INSTALLS NON-RES. INSTALLS 2007 ($ MIL) EMPLOYEES LOCATIONS RANK RANK COMPANY RECURRING RMR COMPARED SUBSCRIBERS SALES SALES GROSS FULL TIME NO. OF 2013 2012 MONTHLY REVENUE, WITH REVENUE, REVENUE, REVENUE EMPLOYEES LOCATIONS DEC. 31, 2012 DEC. 31, 2011 RES. INSTALLS NON-RES. INSTALLS 2012 ($ MIL)
86 Sonitrol Security Services Inc. Charlotte, N.C. $284,655 1.6% 3,906 $750 $7,500 $5,861,885 53 2
87 Crime Prevention Security Systems LLC Gainesville, Fla. $282,720 8.3% 13,221 $1,614,125 $286,673 $6,257,176 na 2
88 86 Amherst Alarm Inc. Amherst, N.Y. $272,898 9.3% 25,241 $690,000 $1,120,000 $5,498,249 53 1
89 84 Sonitrol of Indianapolis Indianapolis, Ind. $263,207 3.7% 1,985 na $1,303,100 $4,673,473 28 1
90 82 Pacific Alarm Systems Inc. Culver City, Calif. $257,157 -1.0% 4,152 $105,247 $461,764 $4,013,077 47 1
91 88 Valley Alarm Sun Valley, Calif. $256,538 3.6% 7,786 $84,639 $613,983 $3,946,833 20 1
92 87 Custom Alarm Rochester, Minn. $248,680 0.4% 5,880 $450,000 $6,000,000 $10,043,817 62 1
93 89 Bonds Alarm Co. Inc. Phoenix, Ariz. $246,742 2.0% 7,758 $126,000 $486,200 $3,866,295 30 3
94 96 Briscoe Protective Systems Inc. Centereach, N.Y. $239,012 27.5% 2,345 na $1,879,745 $6,013,204 35 1
95 93 Moon Security Services Inc. Pasco, Wash. $234,911 9.4% 6,848 $1,271,973 $2,165,792 $9,175,366 109 3
96 85 Sentry Security Wheeling, Ill. $229,911 -9.4% 4,034 $197,386 $1,954,369 $5,743,917 21 1
97 95 SDT Inc. Newtown, Pa. $226,974 9.3% na na $7,890,000 $14,113,749 88 1
98 94 Yarnell Security Systems Lancaster, Pa. $217,000 3.6% 8,980 $400,000 $1,500,000 $5,100,000 41 1
99 Mijac Alarm Rancho Cucamonga, Calif. $210,309 3.1% na na na $3,725,255 29 1
100 98 NCA Nashville, Tenn. $191,085 18.5% 16,517 $1,527,605 $115,812 $3,928,140 19 1
No. 86 – Integrated design of access and IP camera technology monitored by central station. n No. 87 – Purchased a branch office in Orlando, Fla., retaining 23 staff members from the previous company and growing business in the new market. n No. 88 – Sales were flat and slightly down, yet profitability was up due to better management of resources. n No. 90 – Remodeled sales department and administrative/clerical office/department. n No. 92 – Converted central station software to new platform. n No. 97 – Successful in closing two key accounts that the company had been working for a long time. Also invested heavily in training of field staff. n No. 98 – Added IP-based system capabilities. n No. 99 – First-time ranking on the SDM 100.
IT2%
Projectmanagement
2%
Engineering/design1%
Sales/marketing17%
Central station11%
Technical services17%
Installation15%Customer
service9%
Finance/accounting
3%
Administrative support
8%
Other7%
General management
5%
Executivemanagement
2%
66 May 2013
1 Tyco Integrated Security $8,300,000,000 22 ADT $3,286,949,035 13 Diebold Security $2,991,700,000 84 Stanley Convergent Security $1,644,300,000 35 Vivint Inc. $398,596,583 46 Protection 1 $375,800,000 67 Monitronics International $349,953,000 58 Slomins Inc. $291,366,811 79 Vector Security Inc. $233,855,000 910 G4S Technology LLC $156,871,000 3211 Guardian Protection Services $150,096,745 1012 ASG Security $118,647,000 1113 Interface Security Systems Holdings Inc. $112,768,000 1214 Bay Alarm Company $103,065,201 1315 Guardian Alarm Company $79,173,635 1816 Koorsen Fire & Security $78,521,934 5617 Security Networks $78,490,055 1418 AFA Protective Systems Inc. $73,636,800 2319 Kastle Systems $68,000,000 2120 Devcon Security $63,007,784 2021 Central Security Group Inc. $60,344,697 1722 Protect America Inc. $59,915,000 1523 Security Systems Inc. $53,756,200 1624 CPI Security Systems Inc. $53,607,894 2225 Alarm Capital Alliance $47,965,227 1926 RFI Communications & Security Systems $43,425,378 5427 Per Mar Security Services $39,413,993 3128 Ackerman Security Systems $39,098,268 2529 Safeguard Security $36,238,000 3430 Alarm Detection Systems Inc. $34,022,839 2431 ADS Security L.P. $33,875,867 2632 Vision Security $30,982,056 6133 SSD Alarm Systems / Kern Security & Fire / Alpha Security & Fire
$29,624,717 35
34 American Alarm & Communications $26,947,851 3935 SafeTouch $26,014,878 2736 F.E. Moran Inc. Alarm and Monitoring Services $25,693,946 4437 Intertech Security $23,696,289 6738 EPS Security $22,278,249 3739 DTT $21,350,583 2840 Mountain Alarm $21,303,911 3341 First Alarm $20,997,730 3642 Security Equipment Inc. $20,043,472 4843 Electric Guard Dog $19,372,525 3044 Sonitrol New England $19,249,572 4145 General Security Inc. $18,859,634 3846 ARK Systems Inc. $18,300,000 8547 Fire Protection Inc. $15,620,000 7948 The Protection Bureau $15,250,859 6649 Kimberlite Corp. $15,062,195 4250 SDT Inc. $14,113,749 9751 Sonitrol Pacific $13,752,302 4352 EMC Security $13,367,270 4553 Sonitrol of Sacramento & Sonitrol Orange County $12,943,346 4654 Scarsdale Security Systems Inc. $12,925,002 7355 Doyle Security Systems Inc. $12,201,278 47
56 Blue Ridge Security Systems Inc. $11,760,089 7057 NorthStar Alarm Services LLC $11,007,089 4058 Sonitrol of Buffalo, Rochester, Toronto $10,495,745 5759 Select Security $10,412,000 5960 Custom Security Systems Inc. $10,250,281 5161 American Security Systems Inc. $10,119,015 6262 Custom Alarm $10,043,817 9263 Post Alarm Systems $9,781,607 6064 All Guard Alarm Systems Inc. $9,771,760 4965 Custom Security Systems $9,734,360 5366 Matson Alarm Co. Inc. $9,562,342 5267 Sonitrol Tri-County $9,489,306 6368 Habitec Security $9,320,000 6469 Moon Security Services Inc. $9,175,366 9570 Supreme Security Systems Inc. $9,058,236 5071 Electronix Systems Central Station Alarms Inc. $8,661,785 7572 Redwire / Sonitrol of Tallahassee, Bay, NW FL, EC FL $8,553,481 5873 Bates Security LLC / Sonitrol of Lexington $8,152,321 8374 A-Com Protection Services Inc. $8,141,986 6575 Safe Systems $8,106,531 6976 Acadiana Security Plus $7,798,436 7677 DynaFire Inc. $7,738,285 7478 Peak Alarm Co. Inc. $7,408,350 6879 Security Force Inc. $7,100,000 8180 Sonitrol SW Ohio $7,061,871 7181 World Wide Security & GC Alarm Inc. $7,000,000 7282 Richmond Alarm Company $6,902,388 8283 Security Systems of America $6,835,910 7784 Crime Prevention Security Systems LLC $6,257,176 8785 Briscoe Protective Systems Inc. $6,013,204 9486 Sonitrol Security Services Inc. $5,861,885 8687 Sentry Security $5,743,917 9688 Amherst Alarm Inc. $5,498,249 8889 Washington Alarm Inc. $5,361,247 8090 Gillmore Security Systems Inc. $5,147,919 8491 Yarnell Security Systems $5,100,000 9892 RLC Security Inc. $4,929,733 5593 Sonitrol of Indianapolis $4,673,473 8994 Pacific Alarm Systems Inc. $4,013,077 9095 Valley Alarm $3,946,833 9196 NCA $3,928,140 10097 Bonds Alarm Co. Inc. $3,866,295 9398 Mijac Alarm $3,725,255 99
RANK TOTAL GROSS SDM BY TOTAL REVENUE, 2010 100 REVENUE COMPANY ($ MIL) RANK
RANK TOTAL GROSS SDM BY TOTAL REVENUE, 2010 100 REVENUE COMPANY ($ MIL) RANK
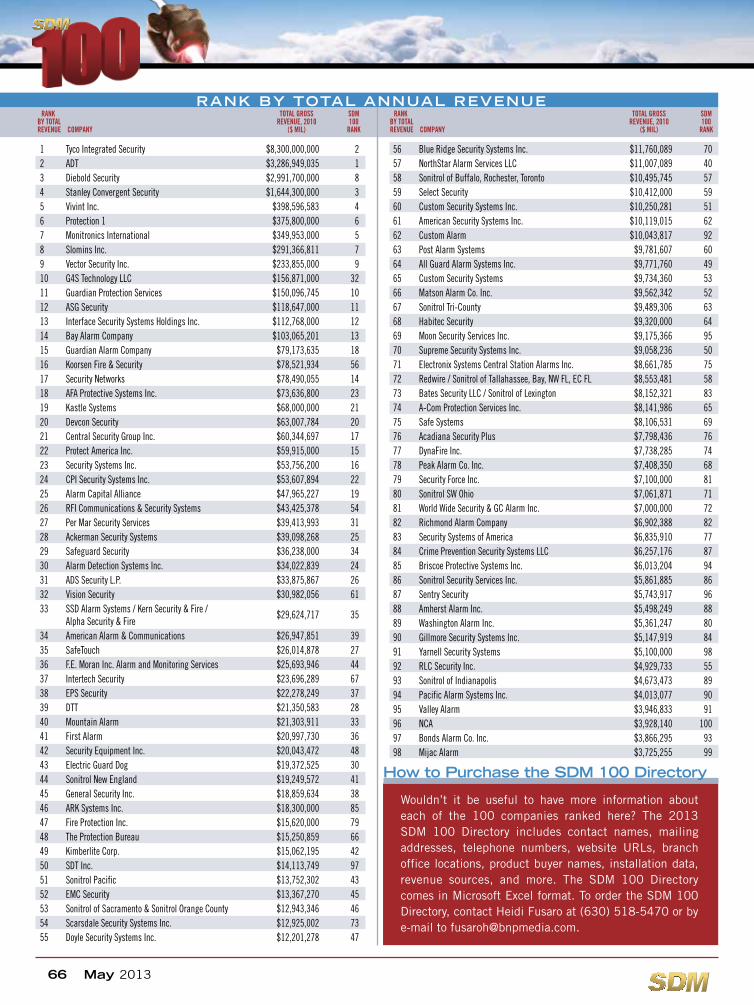
RANK BY TOTAL ANNUAL REVENUE
Wouldn’t it be useful to have more information about each of the 100 companies ranked here? The 2013 SDM 100 Directory includes contact names, mailing addresses, telephone numbers, website URLs, branch office locations, product buyer names, installation data, revenue sources, and more. The SDM 100 Directory comes in Microsoft Excel format. To order the SDM 100 Directory, contact Heidi Fusaro at (630) 518-5470 or by e-mail to [email protected].
How to Purchase the SDM 100 Directory

68 May 2013
Acadiana Security Plus 76
Ackerman Security Systems 25
A-Com Protection Services Inc. 65
ADS Security L.P. 26
ADT 1
AFA Protective Systems Inc. 23
Alarm Capital Alliance 19
Alarm Detection Systems Inc. 24
All Guard Alarm Systems Inc. 49
American Alarm & Communications 39
American Security Systems Inc. 62
Amherst Alarm Inc. 88
ARK Systems Inc. 85
ASG Security 11
Bates Security LLC / Sonitrol of Lexington 83
Bay Alarm Company 13
Blue Ridge Security Systems Inc. 70
Bonds Alarm Co. Inc. 93
Briscoe Protective Systems Inc. 94
Central Security Group Inc. 17
CPI Security Systems Inc. 22
Crime Prevention Security Systems LLC 87
Custom Alarm 92
Custom Security Systems 53
Custom Security Systems Inc. 51
Devcon Security 20
Diebold Security 8
Doyle Security Systems Inc. 47
DTT 28
DynaFire Inc. 74
Electric Guard Dog 30
Electronix Systems Central Station Alarms Inc. 75
EMC Security 45
EPS Security 37
F.E. Moran Inc. Alarm and Monitoring Services 44
Fire Protection Inc. 79
First Alarm 36
G4S Technology LLC 32
General Security Inc. 38
Gillmore Security Systems Inc. 84
Guardian Alarm Company 18
Guardian Protection Services 10
Habitec Security 64
Interface Security Systems Holdings Inc. 12
Intertech Security 67
Johnson Controls Inc. 78
Kastle Systems 21
Kimberlite Corp. 42
Koorsen Fire & Security 56
Matson Alarm Co. Inc. 52
Mijac Alarm 99
Monitronics International 5
Moon Security Services Inc. 95
Mountain Alarm 33
NCA 100
NorthStar Alarm Services LLC 40
Pacific Alarm Systems Inc. 90
Peak Alarm Co. Inc. 68
Per Mar Security Services 31
Post Alarm Systems 60
Protect America Inc. 15
Protection 1 6
Redwire / Sonitrol of Tallahassee,
Bay, NW FL, EC FL 58
RFI Communications & Security Systems 54
Richmond Alarm Company 82
RLC Security Inc. 55
SAFE Security Companies 29
Safe Systems 69
Safeguard Security 34
SafeTouch 27
Scarsdale Security Systems Inc. 73
SDT Inc. 97
Security Equipment Inc. 48
Security Force Inc. 81
Security Networks 14
Security Systems Inc. 16
Security Systems of America 77
Select Security 59
Sentry Security 96
Slomins Inc. 7
Sonitrol New England 41
Sonitrol of Buffalo, Rochester, Toronto 57
Sonitrol of Indianapolis 89
Sonitrol of Sacramento & Sonitrol Orange County 46
Sonitrol Pacific 43
Sonitrol Security Services Inc. 86
Sonitrol SW Ohio 71
Sonitrol Tri-County 63
SSD Alarm Systems /
Kern Security & Fire / Alpha Security & Fire 35
Stanley Convergent Security 3
Supreme Security Systems Inc. 50
The Protection Bureau 66
Tyco Integrated Security 2
Valley Alarm 91
COMPANY SDM 100 RANK COMPANY SDM 100 RANKCOMPANY SDM 100 RANK
SDM 100 ALPHABETICAL INDEX
SDM 100: Its Purpose & Approach
The SDM 100 has been published since 1991. Its primary objective is to mea-sure consumer dollars gained by alarm companies, in order to present an account of the size of the market captured by the 100 largest security providers. SDM 100 firms are ranked by their recurring monthly revenue. RMR is the revenue associated with the contractual agreement between a security company and its subscriber — derived from customer billing for services such as monitoring, con-tracted service/system maintenance, security-as-a-service/managed solutions, and leasing of security systems — and is typically the basis for valuation of a security company. RMR is the language of security company executives and is meaningful in comparative analysis among industry peers. Of the 100 security dealers ranked, 39 of them earned more than $1 million in RMR in 2012.
MORE ONLINEHear more from several of the SDM
100 companies about the factors contributing to their double-digit growth in SDM’s podcast series, “SDM 100 Executives Share Suc-cesses,” at www.SDMmag.com/media/podcasts
To find this article online, as well as previous years’ editions of the SDM 100, visit www.SDMmag.com/SDM100Report.
Register to attend SDM’s virtual tradeshow, iSecu-rity, taking place on June 13, 2013, to hear more about the SDM 100 in the webinar, “RMR Growth Among the SDM 100.” Visit www.isecuritytradeshow.com to register.