state of the climate in africa
TRANSCRIPT

WEA
THER
CLI
MAT
E W
ATER
WMO-No. 1253
State of the Climatein Africa2019

Contributors
Organizations:
African Centre of Meteorological Application for Development (ACMAD); African National Meteorological and Hydrological Services; Archiving,
Validation and Interpretation of Satellite Oceanographic data (AVISO); Bureau of Meteorology (BoM), Australia; Global Precipitation Climatology
Centre (GPCC); Deutscher Wetterdienst (DWD); Food and Agriculture Organization of the United Nations (FAO); Intergovernmental Authority on
Development (IGAD); Climate Prediction and Application Centre (ICPAC); International Organization for Migration (IOM); Laboratoire d’Etudes en
Géophysique et Océanographie Spatiales (LEGOS), France; Météo-France/RSMC La Réunion; National Oceanic and Atmospheric Administration
(NOAA)/National Centers for Environmental Information (NCEI), United States; United Nations High Commissioner for Refugees (UNHCR); United
Nations Economic Commission for Africa (UNECA) – African Climate Policy Centre (ACPC); United Kingdom Meteorological Office (Met Office),
United Kingdom; United Nations Environment Programme (UNEP); World Climate Research Programme (WCRP); World Health Organization
(WHO); World Meteorological Organization (WMO)
Individuals:
Blair Trewin (Lead author, Bureau of Meteorology, Australia), Jean-Paul Adam (UNECA), Mahamane Rabiou Almadjir (FAO), Jorge Alvar-Beltrán
(FAO), Mahamadou Nassirou Ba (UNECA), Abubakr Salih Babiker (ICPAC, Kenya), Omar Baddour (WMO), Jessica Blunden (NOAA/NCEI,
USA), Hind Aissaoui Bennani (IOM), Anny Cazanave (LEGOS Centre National d'Études Spatiales and Observatoire Midi-Pyrénées, France),
Ladislaus Changa (TMA, United Republic of Tanzania), Maxx Dilley (WMO), Elena Conte (FAO), Alessandro Costantino (FAO), Simon Eggleston
(Global Climate Observing System (GCOS) Secretariat), Andre Kamga Foamouhoue (ACMAD), Maarten Kappelle (UNEP), Florence Geoffroy
(UNHCR), Veronica Grasso (WMO), Joy Shumake Guillemot (WHO), Dina Ionesco (IOM), John James Kennedy (Met Office, UK), Lisa Lim Ah Ken
(IOM), Diarmid Campbell Lendrum (WHO), Filipe Domingos Freires Lúcio (WMO), Juerg Luterbacher (WMO), Isabelle Michal (UNHCR), Linus Mofor
(UNECA), Joseph Mukabana (WMO), Richard Munang (UNEP), James Murombedzi (UNECA-ACPC), Lev Neretin (FAO), Wilfran Moufouma Okia
(WMO), Bob Alex Owgang (ACMAD), Jonathan Pound (FAO), Michel Rixen (WCRP/WMO), Oscar Rojas (FAO), Mxolisi Shongwe (IPCC Secretariat),
Doug Smith (Met Office, UK), Monika Tothova (FAO), Ying Wang (UNEP/WASP), Markus Ziese (Deutscher Wetterdienst, Germany)
The right of publication in print, electronic and any other form and in any language is reserved by WMO. Short extracts from WMO publications may be reproduced without authorization, provided that the complete source is clearly indicated. Editorial correspondence and requests to publish, reproduce or translate this publication in part or in whole should be addressed to:
Chair, Publications BoardWorld Meteorological Organization (WMO)7 bis, avenue de la Paix Tel.: +41 (0) 22 730 84 03P.O. Box 2300 Fax: +41 (0) 22 730 81 17CH-1211 Geneva 2, Switzerland Email: [email protected]
ISBN 978-92-63-11253-8
NOTE
The designations employed in WMO publications and the presentation of material in this publication do not imply the expression of any opinion what-soever on the part of WMO concerning the legal status of any country, territory, city or area, or of its authorities, or concerning the delimitation of its frontiers or boundaries.
The mention of specific companies or products does not imply that they are endorsed or recommended by WMO in preference to others of a similar nature which are not mentioned or advertised.
The findings, interpretations and conclusions expressed in WMO publications with named authors are those of the authors alone and do not neces-sarily reflect those of WMO or its Members.
Cover illustration: Adobe Stock, Frédérique Julliard
© World Meteorological Organization, 2020WMO-No. 1253
ContentsForeword 2
Executive summary 3
State of the climate indicators 5
Temperature and precipitation . . . . . . . . . . . . . . . . . . . . . . . . . . . . . . . . 5
Box 1. Availability and reliability of precipitation dataBox 1. Availability and reliability of precipitation data . . . . . . . . . . . . . . . . . . . . . . . . . . . . . . . . . . 88
Ocean heat content and sea levels . . . . . . . . . . . . . . . . . . . . . . . . . . . . .11
High impact events in 2019 14
Drought affects large parts of Africa. . . . . . . . . . . . . . . . . . . . . . . . . . . . .15
Drought turns to flood in the Greater Horn of Africa . . . . . . . . . . . . . . . . . . . .16
Flooding affected many other parts of Africa . . . . . . . . . . . . . . . . . . . . . . . .17
Other notable extremes. . . . . . . . . . . . . . . . . . . . . . . . . . . . . . . . . . . .17
Risks and impacts on food security and population 18
Climate change and climate policy 22
Long-term projections . . . . . . . . . . . . . . . . . . . . . . . . . . . . . . . . . . . .22
Implications for agriculture and food security . . . . . . . . . . . . . . . . . . . . . . .23
Health implications . . . . . . . . . . . . . . . . . . . . . . . . . . . . . . . . . . . . . .23
Implications for economic growth . . . . . . . . . . . . . . . . . . . . . . . . . . . . . .24
African climate policy: Gaps and opportunities. . . . . . . . . . . . . . . . . . . . . . .25
Box 2. Climate services still weak despite enhanced finance opportunitiesBox 2. Climate services still weak despite enhanced finance opportunities . . . . . . . . . .2828
Box 3. Using solar energy in AfricaBox 3. Using solar energy in Africa. . . . . . . . . . . . . . . . . . . . . . . . . . . .. . . . . . . . . . . . . . . . . . . . . . . . . . . .3030
Box 4. Tropical Cyclone Box 4. Tropical Cyclone IdaiIdai and Mozambique and Mozambique . . . . . . . . . . . . . . . . . . . . . . . . . . . . . . . . . . . . . . . . . .3232
Methods and data for state of the climate indicators 34
Data sets . . . . . . . . . . . . . . . . . . . . . . . . . . . . . . . . . . . . . . . . . . . .34

2
Although climate change is a global phenom-enon, its impacts are felt at the regional and local levels, and it is at these levels where actions to adapt to it and mitigate its effects are required. It is therefore crucial that gov-ernments and individuals have access to science-based knowledge that is regularly updated and derived from robust data.
The State of the Climate in Africa report is a multi-agency report involving key in-ternational and continental organizations. It provides a snapshot of climate trends, observed high-impact events and associated risks and impacts in key sensitive sectors. The report draws attention to lessons from climate action on the continent, including areas for improvement. It identifies gaps in current climate policies and challenges facing policymakers in their efforts to create an effective and integrated climate policy that contributes to the United Nations 2030 Agenda for Sustainable Development, the Paris Agreement and the Agenda 2063 of the African Union.
A standard methodology has been employed to assess the physical aspects of the climate
system drawing on that of the annual WMO Statement on the State of the Global Climate. A multidisciplinary expert group was es-tablished to develop and review the report through an interactive process.
During 2019, several high-impact events affected the continent and were associated with loss and damage to vital aspects of communities and populations, resulting in issues relating to food security, population displacement, and the safety, health and livelihoods of people.
It is evident from the various analyses pro-vided in this report that urgent efforts should be pursued to enhance resilience through appropriate prevention and risk management strategies. The devastation that resulted from Tropical Cyclone Idai demonstrates the critical need to strengthen Multi-hazard Early Warning Systems and enhance syner-gy among the various stakeholders at the national and international levels.
The World Meteorological Organization plans to regularly issue this report and to develop similar reports for other regions in collaboration with key partners.
I take this opportunity to congratulate the lead author and co-authors and to thank all those who contributed to this report by providing data, analyses and reviews.
(P. Taalas)Secretary General
Foreword

3
Temperatures in Africa have been rising in recent decades at a rate comparable to that of most other continents and thus somewhat faster than global mean surface temperature, which incorporates a large ocean component. The year 2019 was among the three warmest years on record for the continent.
Annual rainfall exhibited sharp geographical contrasts in 2019, with totals remarkably below long-term means in Southern Africa and west of the High Atlas Mountains and above-average rainfall recorded in other areas, in particular in Central and East Africa.
There is significant regional variability in sea-level trends around Africa. Sea-level increase reached 5 mm per year in several oceanic areas surrounding the continent and exceeded 5 mm per year in the south-western Indian Ocean from Madagascar eastward towards and beyond Mauritius. This is more than the average global sea-level rise of 3–4 mm per year.
Africa was severely hit by extreme weather and climate events in 2019, including Tropical Cyclone Idai, which was among the most de-structive tropical cyclones ever recorded in the southern hemisphere. Tropical Cyclones Idai and Kenneth resulted in severe humanitarian impacts, including hundreds of casualties and hundreds of thousands of displaced persons.
The areas most severely affected by drought in 2019 were in Southern Africa and were many of the same areas that were also affect-ed by a protracted drought in 2014–2016. In contrast, a dramatic shift in conditions was experienced in the Greater Horn of Africa, from very dry conditions in 2018 and most of 2019 to floods and landslides associated with heavy rainfall in late 2019. Flooding also affected the Sahel and surrounding areas from May to October 2019.
In addition to conflicts, instability and eco-nomic crises, climate variability and change are among the key drivers of the recent increase in hunger on the continent. In the drought-prone sub-Saharan African countries, the number of undernourished people has increased by 45.6% since 2012 according to the Food and Agriculture Organization of the United Nations (FAO).
The state of the climate in Africa in 2019, as depicted in this report, was characterized by continued warming temperatures, rising sea levels and impacts associated with extreme weather and climate events. It constitutes a snapshot within a continuum of rapidly rising longer-term climate-related risks associat-ed with global warming. Agriculture is the backbone of Africa’s economy and accounts for the majority of livelihoods across the continent. Africa is therefore an exposure and vulnerability “hot spot” for climate variability and change impacts. Projections under Intergovernmental Panel on Climate Change (IPCC) Representative Concentration Pathway (RCP) 8.5 suggest that warming scenarios will have devastating effects on crop production and food security.
Post-2015, the Nationally Determined Contributions (NDCs) to the Paris Agreement have become the main instrument for guiding policy responses to climate change. The African countries have submitted their first NDCs and are in the process of submitting revised NDCs in 2020. Africa and the small island developing States are the regions facing the largest capacity gaps with regard to climate services. Africa also has the least developed land-based observation network of all continents.
The poor are highly affected by extreme weather and climate events and are often overrepresented in the number of individuals displaced by these events. One promising approach throughout the continent to reduc-ing the impacts of these events has been to reduce poverty by promoting socioeconomic growth, in particular in the agricultural sector. In this sector, which employs 60% of Africa’s population, value-addition techniques using efficient and clean energy sources are report-ed to be capable of reducing poverty two to four times faster than growth in any other sector. Solar-powered, efficient micro-irri-gation, for example, is increasing farm-level incomes by five to ten times, improving yields by up to 300% and reducing water usage by up to 90% while at the same time offsetting carbon emissions by generating up to 250 kW of clean energy.
Women constitute a large percentage of the world’s poor, and about half of the women in the
Executive summary
4
world are active in agriculture – in developing countries, this figure is 60%, and in low-income, food-deficit countries, 70%. Reducing poverty by means of growth in Africa’s agricultural sector is therefore of particular benefit to women. It also may be the case that in some instances, women do not have access to weather and climate services; it is important that all individuals be provided with access to these services in order to enhance their individual resilience and adaptive capacity.
Lessons learned highlighted in the WMO Statement on the State of the Global Climate in 2019 also show that efforts need to be
pursued to build resilience against high-im-pact events through effective Multi-hazard Early Warning Systems (MHEWS) and ap-propriate prevention and risk management strategies. MHEWS should be based on risk knowledge, detection, monitoring and forecasting, communication of actionable warnings, and preparedness at all levels and should complement other long-term prevention and resilience activities. Clearer roles and responsibilities should be defined for National Meteorological and Hydrological Services (NMHSs) and other government agencies responsible for different aspects of disaster risk management and response.
5
TEMPERATURE AND PRECIPITATION
Temperature and precipitation are two key indicators that characterize the state of the climate in Africa and which have continuously affected living conditions in African societies. Agriculture, food security and water resources are strongly impacted by variations in these two indicators. Agriculture contributes to a significant portion of the gross domestic product (GDP) of many African nations and provides a major source of employment. Crop performance in particular, which is based predominately on rainfed agriculture, is highly sensitive to temperature and precipitation variations.
Increases in temperature and changes in rainfall patterns also significantly affect population health across Africa. Warmer temperatures and higher rainfall increase habitat suitability for biting insects and the transmission of vector-borne diseases such as dengue fever, malaria and yellow fever. The monitoring and prediction of these two indicators therefore constitute a primary entry point to analyse the state of the African climate and associated impacts.
GLOBAL TEMPERATURE
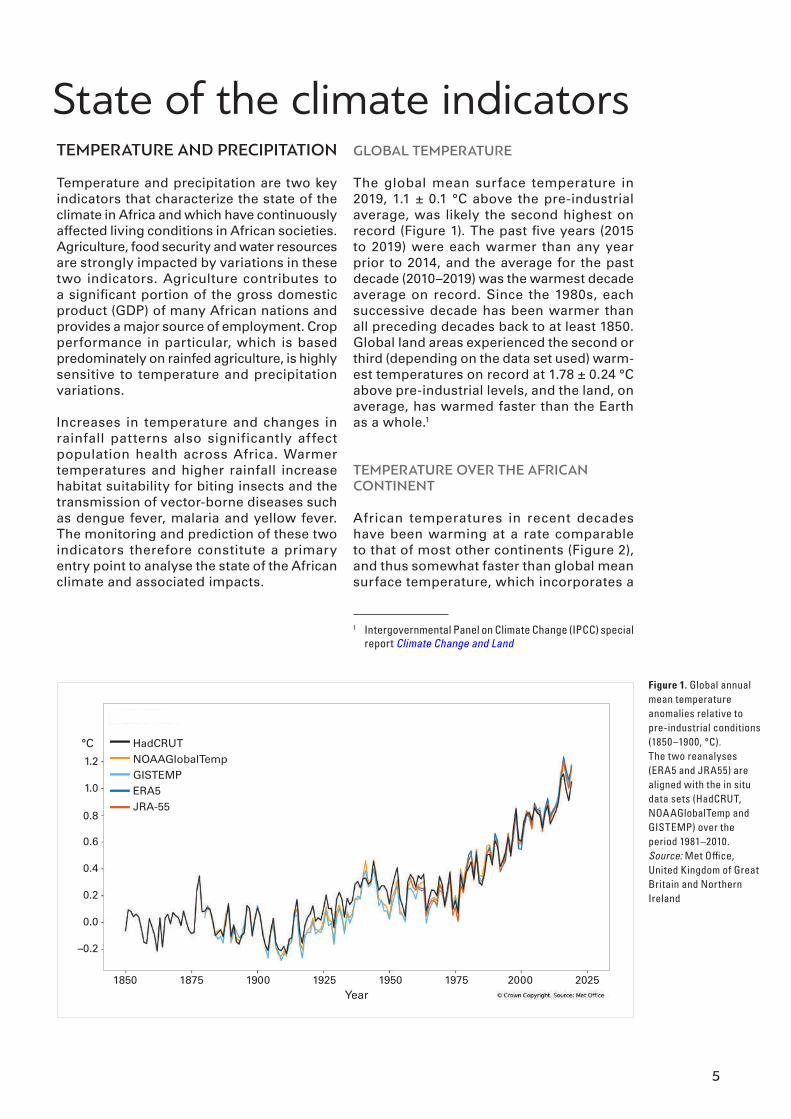
The global mean surface temperature in 2019, 1.1 ± 0.1 °C above the pre-industrial average, was likely the second highest on record (Figure 1). The past five years (2015 to 2019) were each warmer than any year prior to 2014, and the average for the past decade (2010–2019) was the warmest decade average on record. Since the 1980s, each successive decade has been warmer than all preceding decades back to at least 1850. Global land areas experienced the second or third (depending on the data set used) warm-est temperatures on record at 1.78 ± 0.24 °C above pre-industrial levels, and the land, on average, has warmed faster than the Earth as a whole.1
TEMPERATURE OVER THE AFRICAN CONTINENT
African temperatures in recent decades have been warming at a rate comparable to that of most other continents (Figure 2), and thus somewhat faster than global mean surface temperature, which incorporates a
1 Intergovernmental Panel on Climate Change (IPCC) special report Climate Change and Land
Figure 1. Global annual mean temperature anomalies relative to pre-industrial conditions (1850–1900, °C). The two reanalyses (ERA5 and JRA55) are aligned with the in situ data sets (HadCRUT, NOAAGlobalTemp and GISTEMP) over the period 1981–2010. Source: Met Office, United Kingdom of Great Britain and Northern Ireland
1850 1875 1900 1925 1950 1975 2000 2025
1.2
1.0
0.8
0.6
0.4
0.2
0.0
–0.2
HadCRUTNOAAGlobalTempGISTEMPERA5JRA-55
Year
°C
State of the climate indicators

6
large ocean component. Averaged across mainland Africa, at 0.56 °C to 0.63 °C above the 1981–2010 long-term mean, 2019 was most likely the third warmest year on record, following 2010 and 2016. Both 2010 and 2016 were also warm years globally due in part to El Niño conditions at the start of the year. There were regional variations in tempera-ture anomalies at a subcontinental scale in 2019 (Figure 3). Temperatures exceeding 2 °C above the 1981–2010 average were recorded in South Africa, Namibia and parts of Angola. Large areas extending from the south to the north of the continent were more than 1 °C above normal. Only limited areas in the north-west, including Mauritania, as well as
adjacent ocean areas, were slightly cooler than the 1981–2010 average.
PRECIPITATION2
Overall assessment
Annual precipitation totals in 2019 were below the long-term means in Southern Africa, east of the Gulf of Guinea, along the south-west coast of West Africa, north-west of the High Atlas Mountains, on the Madeira and Canary
2 The availability and reliability of precipitation data is dis-cussed in Box 1, below.
Figure 2. Trends in mean surface air temperature over four sub-periods using the HadCRUT4, NOAAGlobalTemp and GISTEMP data sets. The bars indicate the trend in the mean of the three data sets, and the black lines indicate the range between the largest and smallest trends in the three individual data sets.
–0.2
0.0
0.2
0.4
0.5
Tren
d (°
C/d
ecad
e)
1901–1930
1931–1960
1961–1990 1991-2019
AfricaAsiaSouth AmericaNorth AmericaOceaniaEurope
–0.1
0.1
0.3
Figure 3. Surface annual air temperature anomalies (°C) for 2019 with respect to the 1981–2010 average Source: European Centre for Medium-Range Weather Forecasts ERA5 data, Copernicus Climate Change Service
–10 –5 –3 –2 –1 –0.5 0 0.5 1 2 3 5 10 °C

7
Islands, and in some regions of Madagascar (Figure 4). Above-normal precipitation fell in northern and southern Madagascar, in East Africa, in much of the Sahel, between the Volta and Niger Rivers, north of the lower Congo River and in western Central Africa. Annual precipitation totals very much above average (above the 90th percentile) were observed in Central and East Africa. Very low annual precipitation totals (below the 10th percentile) were found in most of Southern Africa, east of the Gulf of Guinea, north-west of the High Atlas Mountains and on the Canary Islands.
Continued rainfall deficit and flooding in Southern Africa
Rainfall amounts during the 2018/2019 sea-son were below normal in Southern Africa, exacerbating an existing drought situation (see further details in the High impact events in 2019 section). In some parts of the region, this was the latest of two or more consecutive rainy seasons with below-normal precipi-tation. Later in 2019, after a delayed onset, heavy precipitation events led to flooding in some areas. The footprint of the heavy rain from Tropical Cyclone Idai, in March, and Tropical Cyclone Kenneth, in April, is visible in the annual precipitation anomalies despite below-normal precipitation totals in most of the other months in 2019.
Erratic rainfall in East Africa
In a normal year, the Greater Horn of Africa has two rainy seasons, one peaking from March to May, and the other from October to December. Precipitation in the early 2018 season was above normal, whereas the
two successive rainy seasons in late 2018 and early 2019 were drier than normal. This developing drought situation switched to a flood situation, however, as the second rainy season in late 2019 brought an excess of precipitation. Overall, above-normal pre-cipitation anomalies in the Greater Horn of Africa also extended westward into parts of West Africa.
SEA-SURFACE TEMPERATURES INFLUENCED PRECIPITATION AND OTHER CLIMATE FEATURES
Sea-surface temperatures (SSTs) were above average across large areas of the globe in 2019. Tropical Pacific SSTs briefly reached the threshold of El Niño conditions early in the year but reverted to neutral conditions thereafter (Niño 3.4 SST Index, Figure 5, left). The lack
0.0 0.2 0.4 0.6 0.8 1.0
Quantile
Figure 4. Annual total precipitation in 2019, expressed as a percentile of the 1951–2010 reference period, for areas that have been in the driest 20% (brown) and wettest 20% (green) of years during the reference period, with darker shades of brown and green indicating the driest and wettest 10%, respectively Source: Global Precipitation Climatology Centre (GPCC), Deutscher Wetterdienst, Germany
Figure 5. Values of the Niño 3.4 SST Index (left) and Indian Ocean Dipole (IOD) Index (right) from 2016 to early 2020 Source: Australian Bureau of Meteorology
2.5
2.0
1.5
1.0
0.5
0
–0.5
–1.0
(C) Copyright Commonwealth of Australia 2020, Bureau of Meteorology
Jan2016
Jul2016
Jan2017
Jul2017
Jan2018
Jul2018
Jan2019
Jul2019
Jan2020
Jul2020
Jan2021
2.5
2.0
1.5
1.0
0.5
0
–0.5
–1.0
–1.5
2016Jul
2016Jan2017
Jul2017
Jan2018
Jul2018
Jan2019
Jul2019
Jan2020
Jul2020
Jan2021
Latest weekly value = -0.69
IOD
inde
x (°
C)
Jan
Sea
-sur
face
tem
pera
ture
ano
mal
y (°
C)
Latest weekly value = -0.46
A reliable database of in situ observations is essential for the monitoring of precipitation as it provides the ground truth for indirect measurements from radar, microwave links, and satellites. In regions such as Africa with a relatively sparse precipitation network, there can be substantial divergence between different precipitation analyses.
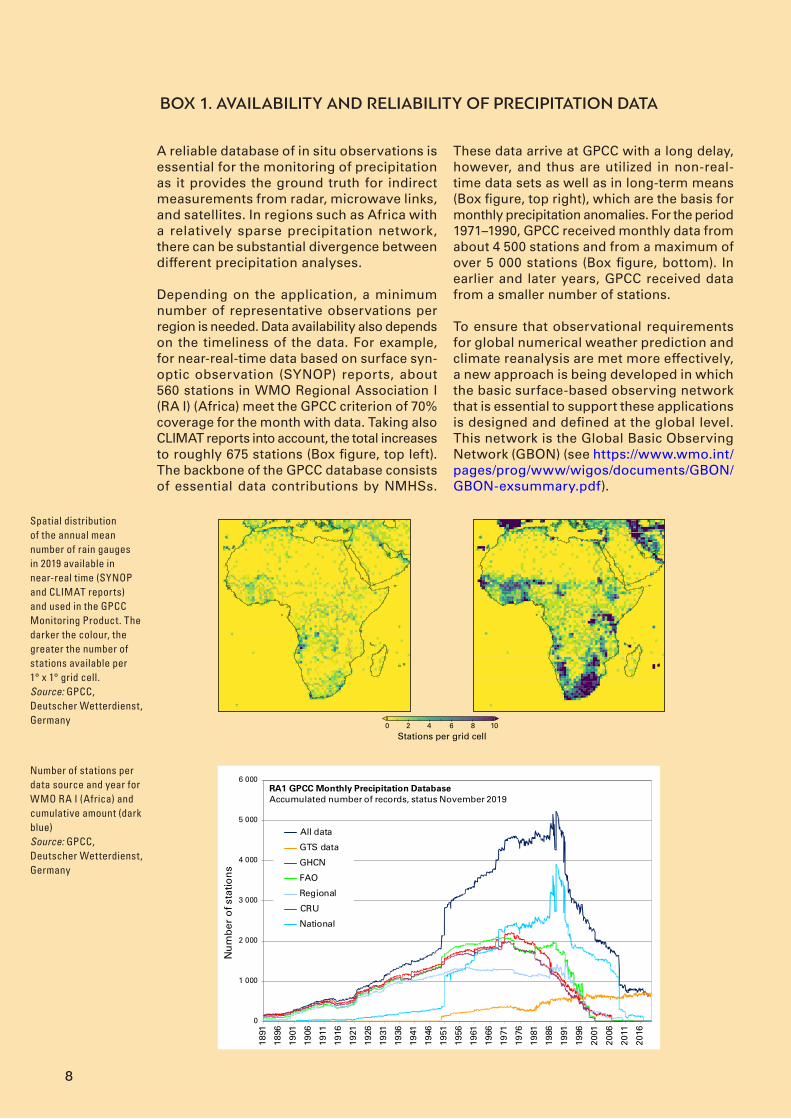
Depending on the application, a minimum number of representative observations per region is needed. Data availability also depends on the timeliness of the data. For example, for near-real-time data based on surface syn-optic observation (SYNOP) reports, about 560 stations in WMO Regional Association I (RA I) (Africa) meet the GPCC criterion of 70% coverage for the month with data. Taking also CLIMAT reports into account, the total increases to roughly 675 stations (Box figure, top left). The backbone of the GPCC database consists of essential data contributions by NMHSs.
These data arrive at GPCC with a long delay, however, and thus are utilized in non-real-time data sets as well as in long-term means (Box figure, top right), which are the basis for monthly precipitation anomalies. For the period 1971–1990, GPCC received monthly data from about 4 500 stations and from a maximum of over 5 000 stations (Box figure, bottom). In earlier and later years, GPCC received data from a smaller number of stations.
To ensure that observational requirements for global numerical weather prediction and climate reanalysis are met more effectively, a new approach is being developed in which the basic surface-based observing network that is essential to support these applications is designed and defined at the global level. This network is the Global Basic Observing Network (GBON) (see https://www.wmo.int/pages/prog/www/wigos/documents/GBON/GBON-exsummary.pdf).
BOX 1. AVAILABILITY AND RELIABILITY OF PRECIPITATION DATA
0 2 4 6 8 10Stations per grid cell
0
1 000
2 000
3 000
4 000
5 000
6 000
1891
1896
1901
1906
1911
1916
1921
1926
1931
1936
1941
1946
1951
1956
1961
1966
1971
1976
1981
1986
1991
1996
2001
2006
2011
2016
Num
ber
of s
tatio
ns
All data
GTS data
GHCN
FAO
Regional
CRU
National
RA1 GPCC Monthly Precipitation Database Accumulated number of records, status November 2019
Spatial distribution of the annual mean number of rain gauges in 2019 available in near-real time (SYNOP and CLIMAT reports) and used in the GPCC Monitoring Product. The darker the colour, the greater the number of stations available per 1° x 1° grid cell. Source: GPCC, Deutscher Wetterdienst, Germany
Number of stations per data source and year for WMO RA I (Africa) and cumulative amount (dark blue) Source: GPCC, Deutscher Wetterdienst, Germany
8

9
of a typical El Niño-like pattern in global precipitation was consistent with the rela-tively weak SST El Niño signal. Above-normal precipitation in the Greater Horn of Africa and below-normal precipitation in Southern Africa in 2019 are both consistent with El Niño conditions, however.
Indian Ocean SSTs played an important role in the events of 2019 around the Indian Ocean basin. In the latter half of the year, warmer than average waters in the western Indian Ocean and cooler than average tempera-tures in the east of the basin along the west coast of Indonesia – a pattern characteristic of a very strong positive phase of the IOD (Figure 5, right) – were also associated with well above-average precipitation in parts of East Africa from October to December. The south-western Indian Ocean also saw much higher than average tropical cyclone activity during the 2018/2019 season. Over this region, there were positive SST anomalies, along with a neutral but positive phase of the El Niño–Southern Oscillation and positive IOD. These influences are associated with
more precipitation and cyclone activity over the western side of the Indian Ocean basin.
There were limited areas of cooler than av-erage SSTs, including off the coast of West Africa and along the west coast of South Africa and Namibia (Figure 6). The cool anomalies off West Africa were especially pronounced during the monsoon onset period and were associated with delays in the monsoon on-set over the westernmost Sahel, especially Senegal and Gambia. Sea-surface tempera-tures were much higher than average further north along the coast from Angola to Gabon, where sustained high temperatures indicated a “severe” marine heat wave.3 Below-average SSTs in the northern tropical Atlantic, north of around 5°N, and above-average SSTs south of 5°N are characteristic of the negative phase of the Tropical Atlantic Meridional
3 Hobday, A.J., E.C.J. Oliver, A. Sen Gupta, J.A. Benthuysen, M.T. Burrows, M.G. Donat, N.J. Holbrook, P.J. Moore, M.S. Thomsen, T. Wernberg and D.A. Smale, 2018: Cate-gorizing and naming marine heatwaves. Oceanography, 31(2):162–173, https://doi.org/10.5670/oceanog.2018.205.
Figure 6. SST anomalies for 2019 (relative to the 1981–2010 average, expressed in °C) from the HadSST3.1.1.0 data set Source: Met Office, United Kingdom
Anomaly di�erence (°C)
Longitude
90°N
60°N
30°N
0°
30°S
60°S
90°S
Latit
ude
-10.0 -5.0 -3.0 -1.0 -0.5 -0.2 0 0.2 0.5 1.0 3.0 5.0 10.0
180° 120° W 60° W 0° 60°E 120°E 180°
10
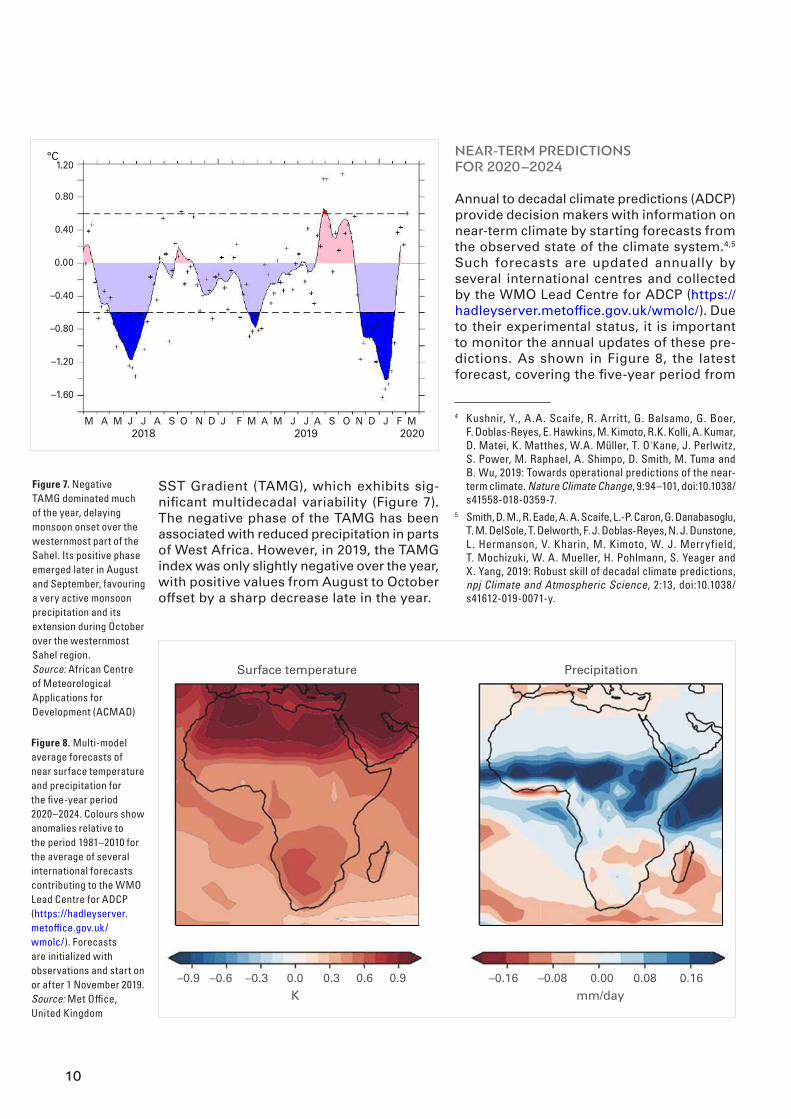
SST Gradient (TAMG), which exhibits sig-nificant multidecadal variability (Figure 7). The negative phase of the TAMG has been associated with reduced precipitation in parts of West Africa. However, in 2019, the TAMG index was only slightly negative over the year, with positive values from August to October offset by a sharp decrease late in the year.
NEAR-TERM PREDICTIONS FOR 2020–2024
Annual to decadal climate predictions (ADCP) provide decision makers with information on near-term climate by starting forecasts from the observed state of the climate system.4,5 Such forecasts are updated annually by several international centres and collected by the WMO Lead Centre for ADCP (https://hadleyserver.metoffice.gov.uk/wmolc/). Due to their experimental status, it is important to monitor the annual updates of these pre-dictions. As shown in Figure 8, the latest forecast, covering the five-year period from
4 Kushnir, Y., A.A. Scaife, R. Arrit t, G. Balsamo, G. Boer, F. Doblas-Reyes, E. Hawkins, M. Kimoto, R.K. Kolli, A. Kumar, D. Matei, K. Matthes, W.A. Müller, T. O'Kane, J. Perlwitz, S. Power, M. Raphael, A. Shimpo, D. Smith, M. Tuma and B. Wu, 2019: Towards operational predictions of the near-term climate. Nature Climate Change, 9:94–101, doi:10.1038/s41558-018-0359-7.
5 Smith, D. M., R. Eade, A. A. Scaife, L.-P. Caron, G. Danabasoglu, T. M. DelSole, T. Delworth, F. J. Doblas-Reyes, N. J. Dunstone, L. Hermanson, V. Kharin, M. Kimoto, W. J. Merryfield, T. Mochizuki, W. A. Mueller, H. Pohlmann, S. Yeager and X. Yang, 2019: Robust skill of decadal climate predictions, npj Climate and Atmospheric Science, 2:13, doi:10.1038/s41612-019-0071-y.
Figure 7. Negative TAMG dominated much of the year, delaying monsoon onset over the westernmost part of the Sahel. Its positive phase emerged later in August and September, favouring a very active monsoon precipitation and its extension during October over the westernmost Sahel region. Source: African Centre of Meteorological Applications for Development (ACMAD)
1.20
0.80
0.40
0.00
–0.40
–0.80
–1.20
–1.60
°C
M A M J J A S O N D J F M A M J J A S O N D J F M2018 2019 2020
Figure 8. Multi-model average forecasts of near surface temperature and precipitation for the five-year period 2020–2024. Colours show anomalies relative to the period 1981–2010 for the average of several international forecasts contributing to the WMO Lead Centre for ADCP (https://hadleyserver.metoffice.gov.uk/wmolc/). Forecasts are initialized with observations and start on or after 1 November 2019. Source: Met Office, United Kingdom
Surface temperature
K–0.16 –0.08 0.00 0.08 0.16
mm/day–0.9 –0.6 –0.3 0.0 0.3 0.6 0.9
Precipitation

11
2020 to 2024, shows continued warming especially over North and Southern Africa, with a dominant decreasing rainfall feature in both subregions and increased rainfall over the Sahel. These predictions are consistent with the amplified warming over land and at high northern latitudes expected from increased atmospheric concentrations of greenhouse gases6 and the northward shift of the Atlantic Intertropical Convergence Zone expected from warmer temperatures in the North Atlantic Ocean than in the South Atlantic Ocean.7
OCEAN HEAT CONTENT AND SEA LEVELS
OCEAN HEAT CONTENT
On timescales longer than about a year, the vast majority (more than 90%) of the Earth’s energy imbalance goes into heating the oceans. Ocean heat content (OHC) is a measure of the amount of heat in the ocean as a whole and is a more comprehensive measure of the amount of heat in the ma-rine part of the climate system than SST. As the oceans warm, they expand, resulting in both global and regional sea-level rise. Increased OHC accounts for about 40% of the observed global sea-level increase over the past 60 years.
The capacity to measure OHC in the upper layers of the ocean, particularly the upper-most 700 metres, has improved dramatically in the twenty-first century as a result of the
6 Collins, M., R. Knutti, J. Arblaster, J.-L. Dufresne, T. Fichefet, P. Friedlingstein, X. Gao, W.J. Gutowski, T. Johns, G. Krinner, M. Shongwe, C. Tebaldi, A.J. Weaver and M. Wehner, 2013: Long-term Climate Change: Projections, Commitments and Irreversibility. In: Intergovernmental Panel on Climate Change (IPCC), 2013: Climate Change 2013: The Physical Science Basis. Contribution of Working Group I to the Fifth Assessment Report of the Intergovernmental Panel on Climate Change (Stocker, T.F., D. Qin, G.-K. Plattner, M. Tignor, S.K. Allen, J. Boschung, A. Nauels, Y. Xia, V. Bex and P.M. Midgley, eds.). Cambridge and New York, Cambridge University Press.
7 Sheen, K. L., D. M. Smith, N. J. Dunstone, R. Eade, D. P. Rowell and M. Vellinga, 2017: Skilful prediction of Sahel summer rainfall on inter-annual and multi-year timescales. Nature Communications, 8:14966, DOI: 10.1038/ncomms14966.
deployment of the network of Argo profiling floats, which make regular profiles of the upper ocean across most of the world’s oceans. Tracking ocean temperatures and associated changes in OHC allows us to monitor variations in the Earth’s energy imbalance over time.
Global OHC reached new record highs in 2019. Atlantic OHC content also reached record highs in 2019, and the October–December 2019 value for the South Atlantic (3.698 x 10²² J above the 1955–2006 refer-ence period in the National Oceanic and Atmospheric Administration/National Centers for Environmental Information (NOAA/NCEI) data set) was a quarterly record. In the Indian Ocean, the annual OHC in 2019 was higher than in the previous three years but lower than that observed in 2015. OHC was above the average of the 1955–2006 reference period almost everywhere in the African region, apart from one area of near-average conditions which extended from south of Madagascar eastward towards Mauritius. An area of near-average conditions, which had existed near the coast of equatorial East Africa in 2018, warmed to well above average in 2019.
SEA LEVELS
The global mean sea level has risen since the early 1990s,8 with an average rate of 3.2 +/- 0.3 mm/year and an acceleration of ~0.1 mm/year2. However, the rate of rise is far from regionally uniform.9 In some areas of the oceans, the rate is between two and three times higher than the global mean as measured by satellite altimetry (Figure 9).
There is significant regional variability in sea-level trends around Africa. In the West African region, especially between 10°N and 10°S, the rate of sea-level rise is slightly above the global mean (3.5–4.0 mm/year).
8 World Climate Research Program (WCRP) Global Sea Level Budget Group, 2018: Global sea-level budget 1993-present. Earth Syst. Sci. Data, 10, 1551−1590, https://doi.org/10.5194/essd-10-1551-2018.
9 Hamlington B. D. et al., 2020. Understanding of Contemporary Regional Sea-level Change and the Implications for the Future. Review of Geophysics, doi: 10.1029/2019RG000672.

12
Some East African regions display higher trends (4.0–5.0 mm/year). These include north-eastern Africa (Egypt and the Nile Delta region) and countries along the Red Sea and Oman Gulf, as well as Mozambique and the Indian Ocean side of South Africa. Trends exceeding 5 mm/year have been ob-served in the south-western Indian Ocean
from Madagascar eastward towards and beyond Mauritius. These regional trends are mostly driven by non-uniform ocean thermal expansion, reflecting non-uniform heat storage in the upper ocean layers. In all other parts of the African region, sea-level trends are on the same order of magnitude as the global mean.
COASTAL DEGRADATION
Conventional satellite altimetry measures open ocean sea-level change up to ~10 km from the coast. However, dedicated pro-cessing methodologies applied to satellite altimetry allow the rate of sea-level change to be estimated very close to the coast (within 1 to 4 km). Recent results10 suggest that at some sites along African coastlines, the rate of sea-level rise can differ from the rate offshore. This is illustrated in Figure 10, which shows the differences in sea-level trends between 15 km offshore and within the first few kilometres of the coast for the period 2002–2018. This may result from a variety of small-scale coastal processes, for example, coastal currents, trends in waves, freshwater runoff in river estuaries, and so
10 Climate Change Initiative Coastal Sea Level Project (2019–2022)
mm
/yr
4
3
2
1
0
–1
–2
–3
–4
Longitude
30°N
15°N
0°
15°S
30°S
0° 30°E 60°E
Latit
ude
Figure 10. Differences in sea-level trends between the coastal zone (0–4 km) and offshore (15 km). Red/blue values correspond to coastal trends that are higher/lower than those offshore. Note that in many cases, there is no significant difference. Source: LEGOS, France
Mean Sea Level Trends (Jan 1993 — Oct 2019)
Longitude
90°
60°
30°
0°
–30°
–60°
–90°–180°W –120° W –60° W 0° 60°E 120°E 180°
Latit
ude
mm
/yr
10
8
6
4
2
0
–2
–4
–6
–8
–10
Figure 9. Sea-level trends for 1993–2019 based on satellite altimetry measurements Source: Laboratoire d’Etudes en Géophysique et Océanographie Spatiales (LEGOS), France

13
forth. Such coastal processes may either amplify or attenuate the regional trends observed offshore.
While the general impacts of climate-related sea-level rise are well known, the number of studies of the African continent is limited due to the lack of systematic in situ observations and modelling exercises. It has been report-ed11 that parts of the West African coasts currently experience accelerated degradation related to pluvial and fluvial floods, high winds and waves, storm surges, damages to critical ecosystems (mangroves, marine habitats) and human development along the coast. Coastal erosion, especially of low-lying
11 Luijendijk A., Hagenaars G, Ranasinghe R. et al., 2018. The state of the world beaches, Scientific Reports, 8, 6641, DOI:10.1038/s41598-018-24630-6.
sandy and muddy coasts, is widespread in this region and partly attributed to alongshore sediment transport resulting from changes in wave regime and human intervention such as the building of river dams and coastal urbanization. About 56% of the coastlines in Benin, Côte d’Ivoire, Senegal and Togo are eroding, at an average rate of 1.8 m/year.12 In all countries, the cost of erosion is expected to increase considerably in the future. While today, sea-level rise is not a dominant con-tributor to coastal erosion in West Africa, the expected acceleration in the rate of sea-level rise in the coming decades will combine with other factors to exacerbate the negative consequences of environmental changes.
12 West Africa Coastal Areas Management Program, World Bank, 2019
14
DESTRUCTIVE TROPICAL CYCLONES
The main tropical cyclone region affecting Africa is the south-western Indian Ocean region (west of 90°E), which encompasses the east coast of mainland Africa, Madagascar, and the other islands of the south-western Indian Ocean. Tropical cyclones in the North Indian Ocean occasionally affect the Greater Horn of Africa, especially Somalia. North Atlantic cyclones occasionally affect Cabo Verde. Landfalls on mainland North Africa
are very rare although developing cyclones offshore sometimes have indirect effects on the continent.
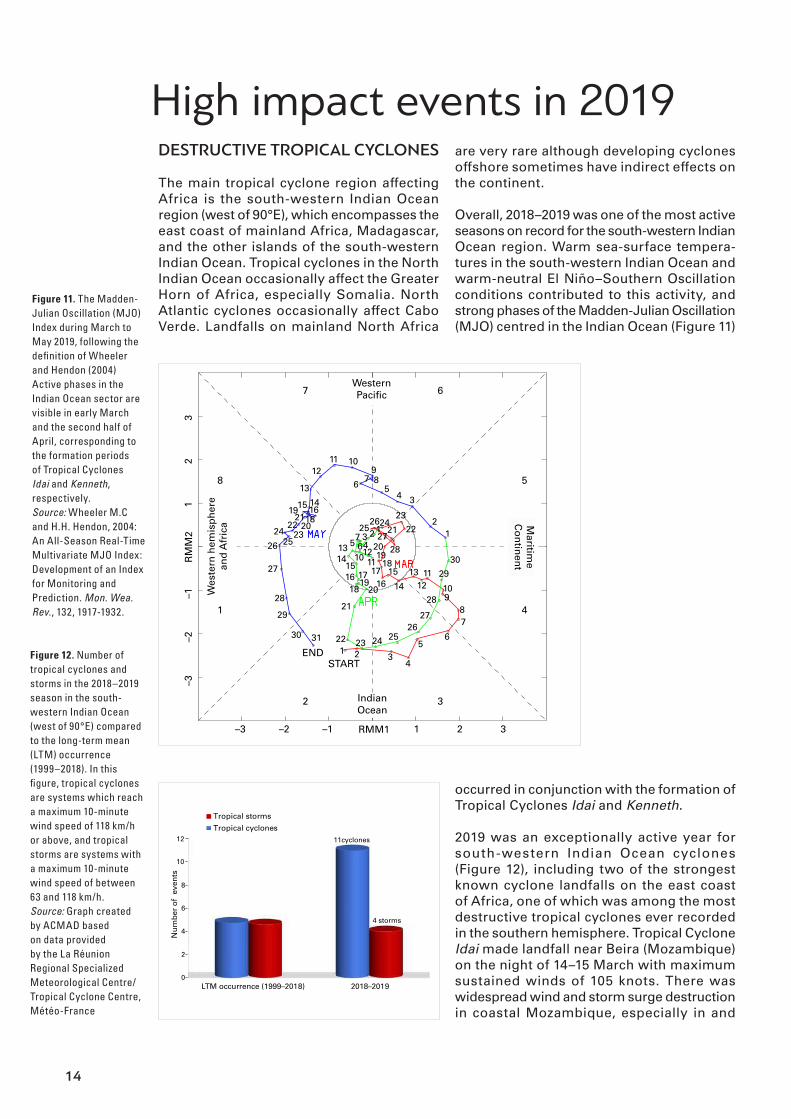
Overall, 2018–2019 was one of the most active seasons on record for the south-western Indian Ocean region. Warm sea-surface tempera-tures in the south-western Indian Ocean and warm-neutral El Niño–Southern Oscillation conditions contributed to this activity, and strong phases of the Madden-Julian Oscillation (MJO) centred in the Indian Ocean (Figure 11)
occurred in conjunction with the formation of Tropical Cyclones Idai and Kenneth.
2019 was an exceptionally active year for south-western Indian Ocean cyclones (Figure 12), including two of the strongest known cyclone landfalls on the east coast of Africa, one of which was among the most destructive tropical cyclones ever recorded in the southern hemisphere. Tropical Cyclone Idai made landfall near Beira (Mozambique) on the night of 14–15 March with maximum sustained winds of 105 knots. There was widespread wind and storm surge destruction in coastal Mozambique, especially in and
High impact events in 2019
27
4 3
21
2322
56 7 89
101112
131415 16
1819
2021
222324
2526
28
29
30 31
ENDSTART
1 2 34
22 23 24 255
678
2627
28 910
1112
2930
1314
1516
1718
1920
21
28
21
2019
181716
151413
3
111210
25 242612
45 67 27
67
58
1
2 3
4
WesternPacific
IndianOcean
Wes
tern
hem
isph
ere
and
Afr
ica M
aritime
Continent
–3 –2 –1 RMM1 1 2 3
–3–2
–1R
MM
21
23
Figure 11. The Madden-Julian Oscillation (MJO) Index during March to May 2019, following the definition of Wheeler and Hendon (2004) Active phases in the Indian Ocean sector are visible in early March and the second half of April, corresponding to the formation periods of Tropical Cyclones Idai and Kenneth, respectively. Source: Wheeler M.C and H.H. Hendon, 2004: An All-Season Real-Time Multivariate MJO Index: Development of an Index for Monitoring and Prediction. Mon. Wea. Rev., 132, 1917-1932.
LTM occurrence (1999–2018) 2018–2019
Tropical cyclonesTropical storms
Num
ber
of e
vent
s
0
2
4
6
8
10
12 11cyclones
4 storms
Figure 12. Number of tropical cyclones and storms in the 2018–2019 season in the south-western Indian Ocean (west of 90°E) compared to the long-term mean (LTM) occurrence (1999–2018). In this figure, tropical cyclones are systems which reach a maximum 10-minute wind speed of 118 km/h or above, and tropical storms are systems with a maximum 10-minute wind speed of between 63 and 118 km/h. Source: Graph created by ACMAD based on data provided by the La Réunion Regional Specialized Meteorological Centre/Tropical Cyclone Centre, Météo-France

15
around the city of Beira, and severe flooding from heavy rain (Figure 13, right) extended to inland regions of Mozambique, Malawi, and parts of Zimbabwe, especially the north-east. Over 1 200 deaths were attributed to the cyclone in Mozambique, Zimbabwe and Malawi, among the worst known casualties for a southern hemisphere cyclone.
Mozambique experienced a second major landfall on 25 April, when Tropical Cyclone Kenneth made landfall in the country’s north (Figure 13), having first passed through the Comoros. Kenneth’s intensity at landfall was 120 knots, making it even more intense than Idai, but it made landfall in a relatively sparsely populated region. In total, 53 deaths were attributed to Kenneth, 45 in Mozambique and 8 in the Comoros; damage from Kenneth was also reported in the United Republic of Tanzania. A third cyclone making landfall in Mozambique was Desmond, which reached the country as a tropical storm in January. Tropical Storm Eketsang contributed to signifi-cant flooding and landslides in Madagascar in late January, and the country was also affected by Tropical Cyclone Belna in December. The Mauritian island of Rodrigues was affected by three tropical cyclones during the season: Funani and Gelena in February and Joaninha in March. Tropical Cyclone Gelena had the greatest impact, with major damage to the island’s power grid.
The 2019 North Indian Ocean cyclone season was also exceptionally active, but only one cyclone affected Africa, Tropical Storm Pawan in December. This storm made landfall in the Puntland region of Somalia, exacerbating
existing flooding and contributing to at least six deaths. No North Atlantic storm directly impacted Africa in 2019 although some impacts were reported in Guinea from the offshore development of Hurricane Lorenzo to the west.
DROUGHT AFFECTS LARGE PARTS OF AFRICA
Drought is the natural hazard with perhaps the most widespread significance in Africa. Past droughts, particularly in areas with high vulnerability, such as the semi-arid regions of the Horn of Africa and the Sahel, have had very severe impacts, including contributing significantly to famine in some cases.
Drought affected several areas of Africa in 2019. Among the most significant drought ar-eas were those in Southern Africa, particularly the western half. Rainfall in the 2018–2019 southern rainy season was near or below 50% of the average in most of the western half of the continent south of 15°S, particularly affecting Namibia, Botswana and western South Africa (except for the far south-west). Another area with comparably low rainfall extended from southern Mozambique north through parts of Zimbabwe and Zambia. Most of these regions also had a poor start to the 2019–2020 rainy season, with low rainfall in the October–December period. This drought follows a protracted drought affecting many of the same areas from 2014 to 2016. Lake Kariba fell to less than 10% of capacity at
MozambiqueChannel
BeiraDondo
Chimoio
Z I M B A B W E
MALAWI
M O Z A M B I Q U E
100 km
Total rainfall (cm)
0 25 50
Figure 13. (Left) Tropical Cyclone Kenneth, shortly prior to landfall in northern Mozambique in April 2019. (Right) Rainfall accumulation from 13 March to 20 March 2019 resulting from Tropical Cyclone Idai. Many areas received as much as 50 cm (20 in) of rain. These data are remotely-sensed estimates that come from the Integrated Multi-Satellite Retrievals (IMERG), a product of the Global Precipitation Measurement (GPM) mission. Source: National Aeronautics and Space Administration (NASA), United States of America
16
the end of the year,13 the lowest level since 1995–1996, severely limiting electricity pro-duction and leading to shortages in Zambia and Zimbabwe.
13 Zambezi River Authority: ht tp: //www.zambezira.org/lake-levels-67
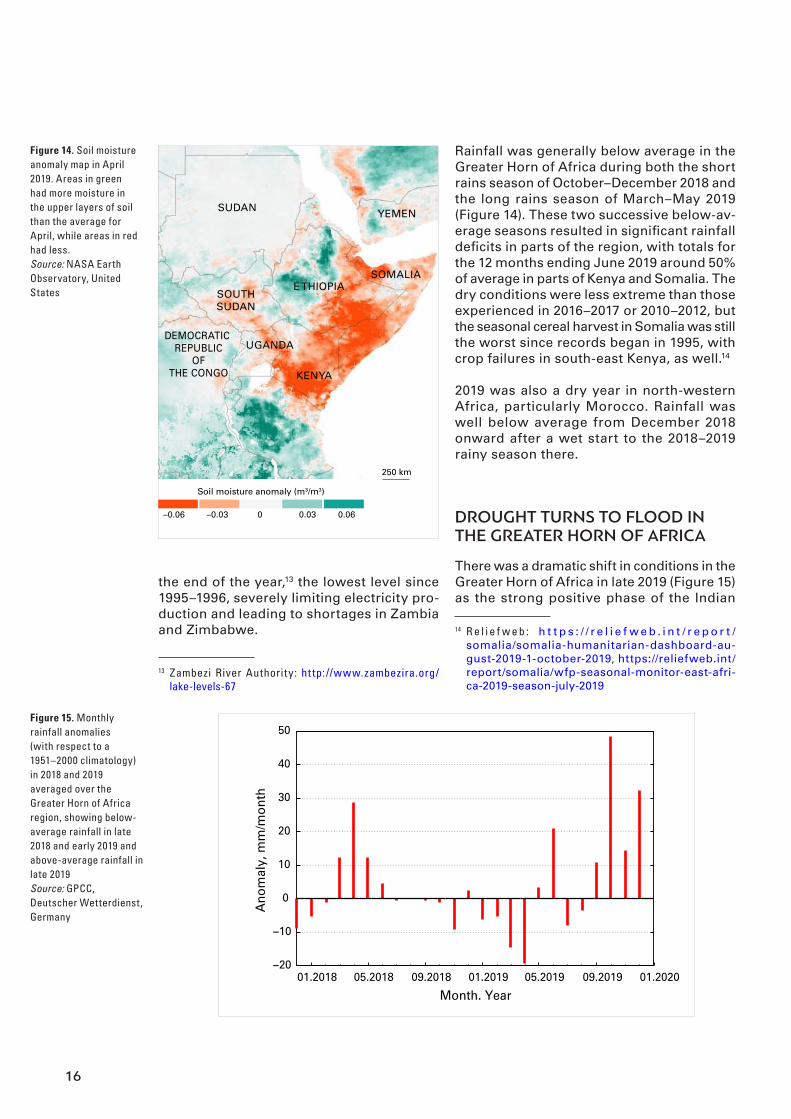
Rainfall was generally below average in the Greater Horn of Africa during both the short rains season of October–December 2018 and the long rains season of March–May 2019 (Figure 14). These two successive below-av-erage seasons resulted in significant rainfall deficits in parts of the region, with totals for the 12 months ending June 2019 around 50% of average in parts of Kenya and Somalia. The dry conditions were less extreme than those experienced in 2016–2017 or 2010–2012, but the seasonal cereal harvest in Somalia was still the worst since records began in 1995, with crop failures in south-east Kenya, as well.14
2019 was also a dry year in north-western Africa, particularly Morocco. Rainfall was well below average from December 2018 onward after a wet start to the 2018–2019 rainy season there.
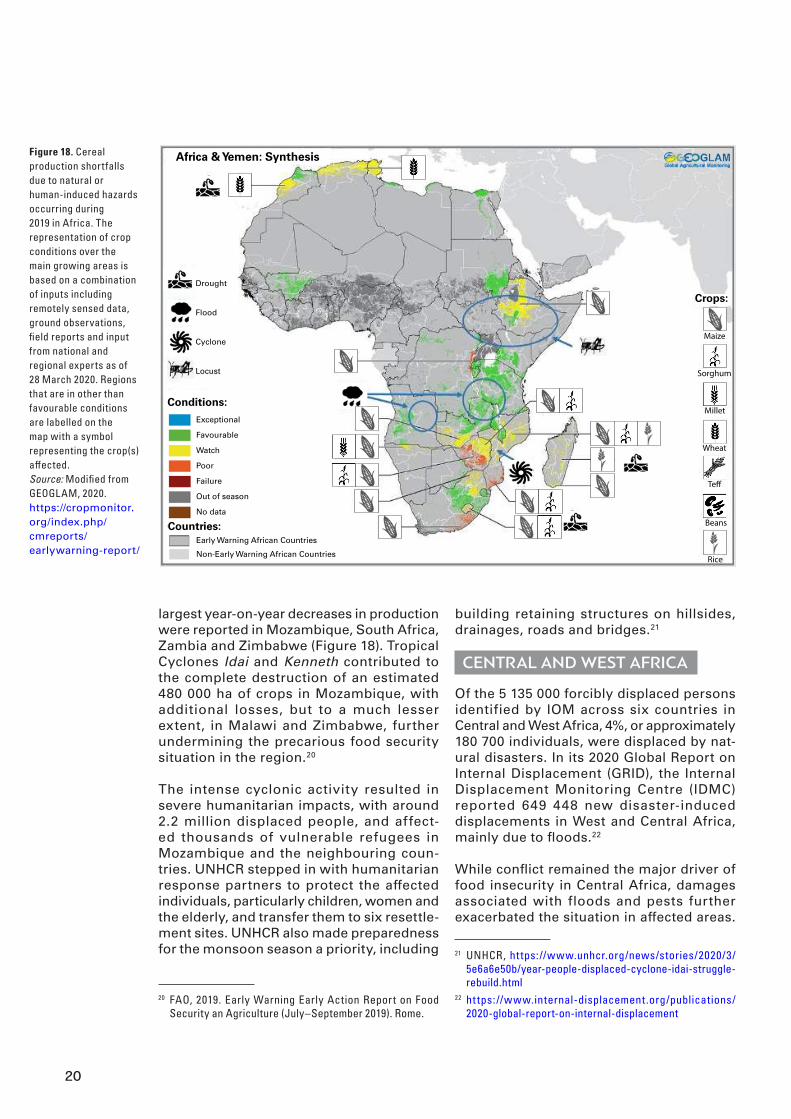
DROUGHT TURNS TO FLOOD IN THE GREATER HORN OF AFRICA
There was a dramatic shift in conditions in the Greater Horn of Africa in late 2019 (Figure 15) as the strong positive phase of the Indian
14 R e l i e f w e b : h t t p s : / / r e l i e f w e b . i n t / r e p o r t /somalia/somalia-humanitarian-dashboard-au-gust-2019-1-october-2019, https://reliefweb.int/report/somalia/wfp-seasonal-monitor-east-afri-ca-2019-season-july-2019
250 km
Soil moisture anomaly (m3/m3)
–0.06 –0.03 0 0.03 0.06
YEMENSUDAN
KENYA
SOUTHSUDAN
E THIOPIASOMALIA
UGANDADEMOCRATIC
REPUBLICOF
THE CONGO
Figure 14. Soil moisture anomaly map in April 2019. Areas in green had more moisture in the upper layers of soil than the average for April, while areas in red had less. Source: NASA Earth Observatory, United States
−20
−10
0
10
20
30
40
50
01.2018 05.2018 09.2018 01.2019 05.2019 09.2019 01.2020
Ano
mal
y, m
m/m
onth
Month. Year
Figure 15. Monthly rainfall anomalies (with respect to a 1951–2000 climatology) in 2018 and 2019 averaged over the Greater Horn of Africa region, showing below-average rainfall in late 2018 and early 2019 and above-average rainfall in late 2019 Source: GPCC, Deutscher Wetterdienst, Germany

17
Ocean Dipole contributed to above-average rainfall throughout the region. Most parts of the region, including Somalia, Kenya, Ethiopia and much of the United Republic of Tanzania, received at least double their average seasonal rainfall. Over 400 deaths were reported across the region in floods and landslides related to the heavy rainfall, impacting Uganda and Djibouti in addition to the above-mentioned countries. While the heavy rains assisted crop and pasture growth throughout the region, they also contributed to a locust plague, which started to affect the region at the end of 2019 and continued into 2020.
FLOODING AFFECTED MANY OTHER PARTS OF AFRICA
Flooding affected various parts of the Sahel and nearby areas during the period from May to October. Among the worst affected countries was Sudan, where seasonal rainfall in some areas was more than double the average and there were repeated flooding episodes between June and September. Seventy-eight deaths were reported, with more than 69 000 homes destroyed or damaged. Significant flooding also occurred in South Sudan, Chad and the Central African Republic.
Further west, while 2019 was not as wet as some recent years over the Niger River basin, seasonal rainfall was still generally above av-erage, with flooding reported at various times during the season in Nigeria, Mali and Niger, as well as in Senegal. Later in the season, flooding also affected Ghana, Cote d’Ivoire and later Benin in October (Figure 16). This extended to Central Africa in November, where the worst floods in a decade were associated with the displacement of 28 000 people in the Central African Republic according to the International Organization for Migration (IOM).
Severe local flooding affected the KwaZulu-Natal province of eastern South Africa from 21 to 25 April after rain totalling more than 150 mm fell in 24 hours in the Durban area. At least 70 deaths were attributed to the floods. Severe weather also affected parts of South Africa late in the year, with two significant tornadoes causing damage in KwaZulu-Natal in November and flash flooding occurring in Gauteng province in early December.
OTHER NOTABLE EXTREMES
Extreme heat affected various parts of Africa at times during 2019. Some of the most signif-icant heatwave activity occurred in Southern Africa in late October and November, with temperatures exceeding 45 °C in parts of South Africa, Zimbabwe and Mozambique. Another noteworthy feature of 2019 was the occurrence of a number of episodes of abnormal heat on the west coast of Southern Africa during the winter, with temperatures exceeding 40 °C locally on the coast of Namibia and near 35 °C at some South African sites.
As in most years, the highest temperatures of the year occurred in the Sahara. The highest temperature observed in 2019 was 50.0 °C on 14 July at Ouargla (Algeria) although this was lower than extremes observed in the region in other recent years.
A significant cold spell affected parts of North Africa in mid-January. In Algeria, snow depths reached 55 cm at Souk Ahras, while tempera-tures fell to between -7 °C and -9 °C at some sites. Heavy snow also fell at higher elevations in north-west Tunisia from 23 to 25 January.
0 50 100 150 200
Figure 16. Percentage of normal precipitation for October 2019 with respect to the 1951–2010 reference period, showing high precipitation across tropical Africa and low precipitation across the extra-tropics. Source: GPCC, Deutscher Wetterdienst, Germany

18
In addition to conflicts, instability and eco-nomic crises, climate variability and extreme weather and climate events are among the key drivers of the recent increase in global hunger. After decades of decline, food in-security and undernourishment are on the rise in almost all subregions of sub-Saharan Africa. In drought-prone sub-Saharan African countries, the number of undernourished people has increased by 45.6% since 2012 according to FAO. The year 2019 recorded a deteriorating food security situation in sub-Saharan Africa, as well as increased
population displacement (Figure 17) and the increased food insecurity of those displaced people. Refugee populations often reside in climate "hot spots", where they are exposed to and affected by slow and sudden-onset hazards, resulting in some cases in secondary displacements.
EAST AFRICA
In 2019, the food security situation steadily deteriorated in several areas of Ethiopia,
Risks and impacts on food security and population
The boundaries, names and the designations used on this map do not imply official endorsement or acceptance by IDMC.
5.1 m
Total number of IDPs as a result of disasters in 95 countries and territories as of 31 December 2019
3.8 m
10 countries and territories with the highest number of IDPs as of 31 December 2019
Other countries and territories
Due to rounding, some totals may not correspond with the sum of the separate figures.
India
1 198 000
South Sudan246 000
Iran180 000
Nigeria143 000
Ethiopia390 000
Afghanistan
590 000
168 000
Philippines364 000
China220 000
Sudan272 000
Countries and territories with less than 20 000 people displaced by order of magnitude:
Comoros, Pakistan, Malaysia, Australia, Ghana, Burundi, Papua New Guinea, Viet Nam, Canada, Mali, Peru, Rwanda, Lao PDR, Sri Lanka, Gambia, Russia, Syria, Sierra Leone, Cuba, Tajikistan, France, Bolivia, Korea, Chile, Colombia, United Kingdom, Brazil, Kenya, Madagascar, Guatemala, Cambodia, Tanzania, Angola, Uganda, Dem. People's Rep. Korea, Bahamas, Fiji, Liberia, Somalia, Taiwan, Côte d'Ivoire, Guinea-Bissau, Thailand, Yemen, Iraq, Venezuela, Ecuador, Israel, Lebanon, Azerbaijan, Barbados, Mauritius, Senegal, Turkey, Vanuatu, South Africa, Zambia, Panama, United Arab Emirates, Nicaragua, Dominican Republic, Guinea, Northern Mariana Islands, New Zealand, St. Lucia, Puerto Rico, French Polynesia and Trinidad and Tobago
Dem. Rep. Congo
More than 500 000100 001–500 000
20 001–100 00020 000 or less
AfghanistanIndia
EthiopiaPhilippines
SudanSouth Sudan
ChinaIran
Dem. Rep. CongoNigeria
1 198 000590 000390 000364 000272 000246 000220 000180 000168 000143 000
MozambiqueNiger
CongoIndonesia
Central African Rep.Bangladesh
JapanMalawi
ZimbabweHaiti
MyanmarUnited States
AlbaniaNepal
CameroonChad
Abyei Area
132 000121 000107 000104 00095 00088 00088 00054 00052 00051,00041 00037 00032 00029 00028 00027 00026 000
Figure 17. Total number of internally displaced persons Source: Global Report on Internal Displacement 2020, Internal Displacement Monitoring Centre (IDMC)

19
Somalia, Kenya and Uganda, mainly due to a poor March–May “long rains/Gu” rainy season, which followed the below-average “short rains/Deyr” rainy season from October to December 2018. Almost 12 million people in Ethiopia, Kenya and Somalia, many of them children, were estimated to be severely food insecure at the end of the year.15 In Somalia and Kenya, the number of people affected by food insecurity increased between late 2018 and late 2019 from 1.6 to 2.1 million and from 0.7 to 3.1 million, respectively.16
Heavy rains in the second half of the year, and especially during the October–December short rains/Deyr rainy season, triggered widespread floods, which resulted in loss of life, displacement, damage to crops and live-stock deaths, mainly in central and southern Somalia, south-eastern Ethiopia, northern and eastern Kenya and South Sudan. The heavy rains created conditions conducive to the severe desert locust outbreak, the worst in decades, that is currently affecting Somalia, Ethiopia, Kenya, and parts of Eritrea, Sudan, Uganda, United Republic of Tanzania and South Sudan.
According to data from the IOM Displacement Tracking Matrix (DTM) and the United Nations High Commissioner for Refugees (UNHCR), 60% of all internal displacements in the East and Horn of Africa region during 2019 were due to climate-induced disasters. One key demographic group, pastoralists, are highly vulnerable to the combined effects of drought, resource competition and conflict. As they become poorer following succes-sive droughts, they are often forced out of pastoralism and into displacement camps or urban centres to access food and livelihood opportunities.17
In Ethiopia, of the 1 556 000 people displaced in the country during 2019, at least 504 000 (32.4%) were primarily affected by disasters, and of those, approximately 131 000 were
15 FAO, 2019. Early Warning Early Action Report on Food Security and Agriculture (October-December 2019). Rome
16 FAO, 2019. Crop Prospects and Food Situation, December 201917 IDMC, 2020. Global Report on Internal Displacement 2020.
ht tps://www.internal-displacement.org/global-report /grid2020/
displaced by drought and 367 000 by floods.18 In Somalia, recurring high-impact climate events, especially drought, clearly illustrate the country’s growing vulnerability to climate change. Protracted internal displacement associated with prolonged drought remains present as the country is still recovering from the 2016–2017 drought. Flash and riverine floods along the Shabelle and Juba rivers affected and displaced many individuals who were already vulnerable because of drought and conflict, particularly in the Belet Weyne and Jalalaqsi districts of Hiran, the Johar and Balcad districts of Middle Shabelle, and the Berdale district of Bay.19
In Burundi, during 2019, the IOM DTM showed that 31 000 people had been displaced by climatic events. Torrential rains, strong winds and landslides accounted for 13 856 of those displaced people. The heavy rainfall experi-enced during 2019 also destroyed crops and adversely affected livelihoods. In April 2019, 15% of the Burundian population suffered from severe acute food insecurity.
As of 31 December 2019, the East Africa, Horn of Africa and Great Lakes regions hosted 4.6 million refugees and asylum seekers and over 7.7 million Internally Displaced Persons (IDPs). During 2019, refugees faced cuts in food and non-food assistance of up to 30% in some places in the various refugee sites in the region due to funding shortfalls. In addition, high levels of malnutrition among children aged 6 months to 59 months remains a key concern in Ethiopia, Kenya, Sudan, South Sudan and Uganda.
SOUTHERN AFRICA
In Southern Africa, the number of people in need of food assistance increased to 13.8 million, nearly three million more than in 2018. Due to rainfall deficits, the regional ag-gregate cereal output was about 28.7 million tons, 7% below the five-year average. The
18 IDMC, 2020. Global Report on Internal Displacement 2020. ht tps://www.internal-displacement.org/global-report /grid2020/
19 UN OCHA, Somalia Flood Response Snapshot (as of 5 Decem-ber 2019), December 2019. Available from https://reliefweb.int/report/somalia/somalia-flood-response-snapshot-5-de-cember-2019 (accessed 3 April 2020).
20
largest year-on-year decreases in production were reported in Mozambique, South Africa, Zambia and Zimbabwe (Figure 18). Tropical Cyclones Idai and Kenneth contributed to the complete destruction of an estimated 480 000 ha of crops in Mozambique, with additional losses, but to a much lesser extent, in Malawi and Zimbabwe, further undermining the precarious food security situation in the region.20
The intense cyclonic activity resulted in severe humanitarian impacts, with around 2.2 million displaced people, and affect-ed thousands of vulnerable refugees in Mozambique and the neighbouring coun-tries. UNHCR stepped in with humanitarian response partners to protect the affected individuals, particularly children, women and the elderly, and transfer them to six resettle-ment sites. UNHCR also made preparedness for the monsoon season a priority, including
20 FAO, 2019. Early Warning Early Action Report on Food Security an Agriculture (July–September 2019). Rome.
building retaining structures on hillsides, drainages, roads and bridges.21
CENTRAL AND WEST AFRICA
Of the 5 135 000 forcibly displaced persons identified by IOM across six countries in Central and West Africa, 4%, or approximately 180 700 individuals, were displaced by nat-ural disasters. In its 2020 Global Report on Internal Displacement (GRID), the Internal Displacement Monitoring Centre (IDMC) reported 649 448 new disaster-induced displacements in West and Central Africa, mainly due to floods.22
While conflict remained the major driver of food insecurity in Central Africa, damages associated with floods and pests further exacerbated the situation in affected areas.
21 UNHCR, ht tps: //www.unhcr.org/news/stories/2020/3/ 5e6a6e50b/year-people-displaced-cyclone-idai-struggle-rebuild.html
22 ht tps: //www.internal-displacement.org/publications/ 2020-global-report-on-internal-displacement
Africa & Yemen: Synthesis
Exceptional
Favourable
Watch
Poor
Failure
Out of season
No data
Countries:Early Warning African Countries
Non-Early Warning African Countries
Conditions:
Drought
Flood
Cyclone
Locust
Crops:
Wheat
Te�
Beans
Rice
Maize
Sorghum
Millet
Figure 18. Cereal production shortfalls due to natural or human-induced hazards occurring during 2019 in Africa. The representation of crop conditions over the main growing areas is based on a combination of inputs including remotely sensed data, ground observations, field reports and input from national and regional experts as of 28 March 2020. Regions that are in other than favourable conditions are labelled on the map with a symbol representing the crop(s) affected. Source: Modified from GEOGLAM, 2020. https://cropmonitor.org/index.php/cmreports/earlywarning-report/

21
These factors disrupted agricultural activities and triggered an increase in staple food prices, affecting livelihoods and constraining access to food across the region. Despite localized production shortfalls due to floods, pests and conflict, the aggregate regional production of cereals in 2019 was close to the previous five-year average of about five million tons.
West Africa was also hit by floods due to heavy precipitation in July and August. This resulted in localized crop and livestock losses and population displacement in several countries.
According to IOM, 66 800 people were dis-placed in Nigeria as a result of disasters as of January 2020, representing 3% of the 2 600 000 individuals displaced in the country.
NORTH AFRICA
In North Africa, poor rains in late 2018 and in 2019 affected cereal production in Morocco, where wheat production was over 30% be-low the average of the previous five years, while in Algeria and Tunisia, favourable rainy conditions resulted in higher than average crop yields.
November 2019 floods in the Central African Republic
Cre
dit:
Leo
Tore
ton
IOM
/CA
R
22
LONG-TERM PROJECTIONS
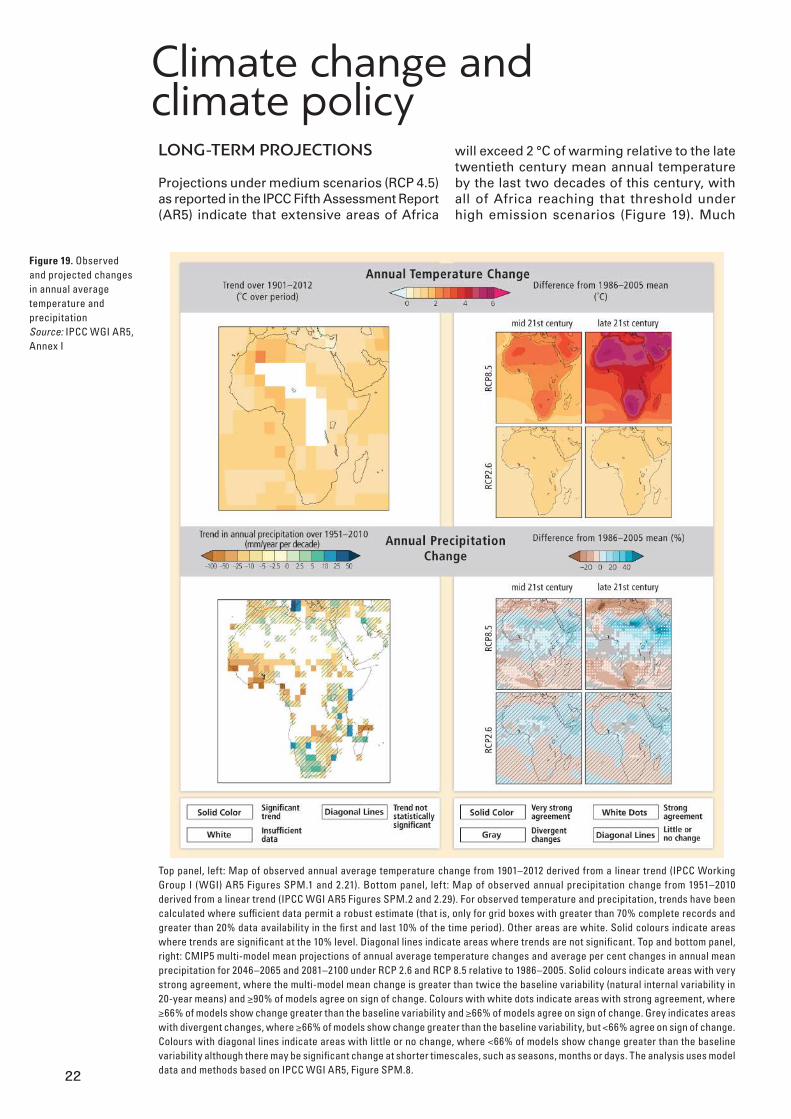
Projections under medium scenarios (RCP 4.5) as reported in the IPCC Fifth Assessment Report (AR5) indicate that extensive areas of Africa
will exceed 2 °C of warming relative to the late twentieth century mean annual temperature by the last two decades of this century, with all of Africa reaching that threshold under high emission scenarios (Figure 19). Much
Figure 19. Observed and projected changes in annual average temperature and precipitation Source: IPCC WGI AR5, Annex I
Climate change and climate policy
Top panel, left: Map of observed annual average temperature change from 1901–2012 derived from a linear trend (IPCC Working Group I (WGI) AR5 Figures SPM.1 and 2.21). Bottom panel, left: Map of observed annual precipitation change from 1951–2010 derived from a linear trend (IPCC WGI AR5 Figures SPM.2 and 2.29). For observed temperature and precipitation, trends have been calculated where sufficient data permit a robust estimate (that is, only for grid boxes with greater than 70% complete records and greater than 20% data availability in the first and last 10% of the time period). Other areas are white. Solid colours indicate areas where trends are significant at the 10% level. Diagonal lines indicate areas where trends are not significant. Top and bottom panel, right: CMIP5 multi-model mean projections of annual average temperature changes and average per cent changes in annual mean precipitation for 2046–2065 and 2081–2100 under RCP 2.6 and RCP 8.5 relative to 1986–2005. Solid colours indicate areas with very strong agreement, where the multi-model mean change is greater than twice the baseline variability (natural internal variability in 20-year means) and ≥90% of models agree on sign of change. Colours with white dots indicate areas with strong agreement, where ≥66% of models show change greater than the baseline variability and ≥66% of models agree on sign of change. Grey indicates areas with divergent changes, where ≥66% of models show change greater than the baseline variability, but <66% agree on sign of change. Colours with diagonal lines indicate areas with little or no change, where <66% of models show change greater than the baseline variability although there may be significant change at shorter timescales, such as seasons, months or days. The analysis uses model data and methods based on IPCC WGI AR5, Figure SPM.8.
23
of Africa has already warmed by more than 1 °C since 1901. According to the IPCC Special Report on Managing the Risks of Extreme Events and Disasters to Advance Climate Change Adaptation (SREX) issued in 2012,23 heat waves and warm spell durations will increase, suggesting an increased persistence of hot days (90th percentile) towards the end of the century. A reduction in precipitation is likely over North Africa and the south-western parts of South Africa by the end of the century. The projection of these indicators will have a strong influence on agriculture, water and human health.
IMPLICATIONS FOR AGRICULTURE AND FOOD SECURITY
Africa faces significant challenges in address-ing climate change risks, including increasing temperature, changing precipitation patterns, rising sea levels and more frequent extreme weather and climate events. These risks are becoming more severe as the environment is rapidly warming and have a pronounced effect on the agricultural sector. Agriculture is the backbone of Africa’s economy and accounts for the majority of livelihoods across the continent. Africa is therefore a vulnerability "hot spot” for the impacts of climate variability and change.
Key risks to agriculture include reduced crop productivity associated with heat and drought stress and increased pest damage, disease damage and flood impacts on food system infrastructure, resulting in serious adverse effects on food security and on livelihoods at the regional, national and individual household levels. These risks and their con-sequent effects have been identified with “high confidence”, and the level of risk has been identified as “very high” if the global mean temperature increases 2 °C and 4 °C above pre-industrial levels by 2080–2100.24
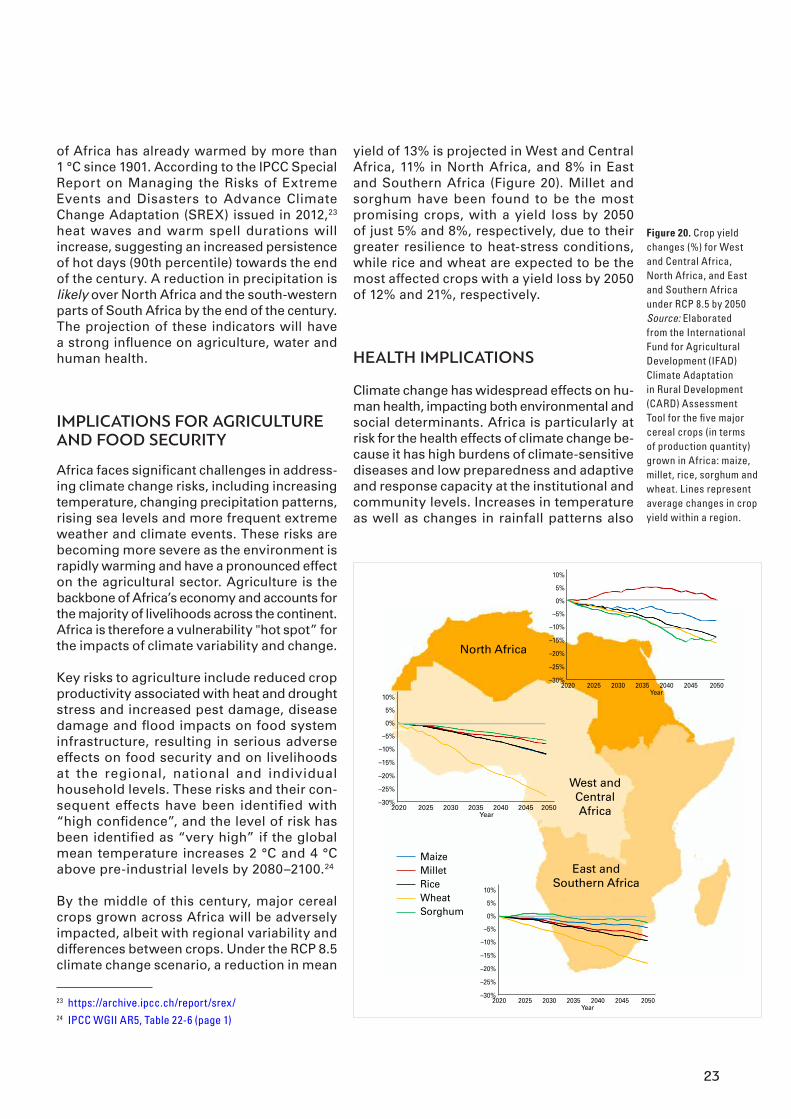
By the middle of this century, major cereal crops grown across Africa will be adversely impacted, albeit with regional variability and differences between crops. Under the RCP 8.5 climate change scenario, a reduction in mean
23 https://archive.ipcc.ch/report/srex/24 IPCC WGII AR5, Table 22-6 (page 1)
yield of 13% is projected in West and Central Africa, 11% in North Africa, and 8% in East and Southern Africa (Figure 20). Millet and sorghum have been found to be the most promising crops, with a yield loss by 2050 of just 5% and 8%, respectively, due to their greater resilience to heat-stress conditions, while rice and wheat are expected to be the most affected crops with a yield loss by 2050 of 12% and 21%, respectively.
HEALTH IMPLICATIONS
Climate change has widespread effects on hu-man health, impacting both environmental and social determinants. Africa is particularly at risk for the health effects of climate change be-cause it has high burdens of climate-sensitive diseases and low preparedness and adaptive and response capacity at the institutional and community levels. Increases in temperature as well as changes in rainfall patterns also
10%
5%
0%
–5%
–10%
–15%
–20%
–25%
–30%2020 2025 2030 2035 2040 2045 2050
Year10%
5%
0%
–5%
–10%
–15%
–20%
–25%
–30%2020 2025 2030 2035 2040 2045 2050
Year
10%
5%
0%
–5%
–10%
–15%
–20%
–25%
–30%2020 2025 2030 2035 2040 2045 2050
Year
North Africa
West and Central Africa
East and Southern Africa
MaizeMilletRiceWheatSorghum
Figure 20. Crop yield changes (%) for West and Central Africa, North Africa, and East and Southern Africa under RCP 8.5 by 2050 Source: Elaborated from the International Fund for Agricultural Development (IFAD) Climate Adaptation in Rural Development (CARD) Assessment Tool for the five major cereal crops (in terms of production quantity) grown in Africa: maize, millet, rice, sorghum and wheat. Lines represent average changes in crop yield within a region.

24
contribute to infectious disease transmission across Africa. Warmer temperatures and high-er rainfall increase suitability for habitats of biting insects and transmission of vector-borne diseases such as dengue fever, malaria and yellow fever. In addition, new diseases are emerging in African regions where they were previously not present. In 2017, an estimated 93% of global malaria deaths occurred in Africa;25 children are the most vulnerable to this disease, and pregnant women are another high-risk group. Malaria epidemics often occur after periods of unusually heavy rainfall, such as those associated with El Niño events in parts of East Africa. In addition, warming in the East African highlands is allowing malar-ia-carrying mosquitoes to survive at higher altitudes, endangering new populations that were previously less affected by and are less resistant to the disease.
IMPLICATIONS FOR ECONOMIC GROWTH
The International Monetary Fund (IMF) World Economic Outlook published in October 201726 indicates that adverse consequences
25 WHO Global Health Observatory, https://www.who.int/gho/malaria/epidemic/deaths/en/
26 International Monetary Fund. 2017. Seeking Sustainable Growth: Short-Term Recovery, Long-Term Challenges. Washington, DC, October.
of climate change are concentrated in regions with relatively hot climates, where a dispro-portionately large number of low-income countries are located. In these countries, a rise in temperature lowers per capita out-put in both the short and medium term by reducing agricultural output, suppressing the productivity of workers exposed to heat, slowing investment and damaging health. In countries with high average temperatures, such as African countries, an increase in temperature dampens economic activity. For a median low-income developing country with an annual average temperature of 25 °C, the effect of a 1 °C increase in temperature is a drop in growth of 1.2%.27
According to the African Climate Policy Centre (ACPC), it is expected that the GDP in the five African subregions would suffer a significant decrease as a result of a global temperature increase (Table 1). For scenarios ranging from a 1 °C to a 4 °C increase relative to pre-industrial levels, the continent’s overall GDP is expected to decrease by 2.25% to 12.12%. West, Central and East Africa exhibit a higher adverse impact than Southern and North Africa.
27 Natural Ear th: ht tps: //www.naturalear thdata.com/; ScapeToad: http://scapetoad.choros.place/; United Nations World Population Prospects: The 2015 Revision: https://population.un.org/wpp/Publications/Files/WPP2015_Meth-odology.pdf; World Bank Group Cartography Unit; IMF Staff calculations
Table 1. Long-term impacts of climate change on Africa’s GDP (% change/year) according to four global temperature increase scenarios for the five subregions and for the whole of Africa.
SubregionsGDP (% Change/Year)
1° C 2° C 3° C 4° C
North (n = 7) –0.76 ± 0.16 –1.63 ± 0.36 –2.72 ± 0.61 –4.11 ± 0.97
West (n = 15) –4.46 ± 0.63 –9.79 ± 1.35 –15.62 ± 2.08 –22.09 ± 2.78
Central (n = 9) –1.17 ± 0.45 –2.82 ± 1.10 –5.53 ± 1.56 –9.13 ± 2.16
East (n = 14) –2.01 ± 0.20 –4.51 ± 0.34 –7.55 ± 0.63 –11.16 ± 0.85
Southern (n = 10) –1.18 ±0.64 –2.68 ± 1.54 –4.40 ± 2.56 –6.49 ± 3.75
Whole of Africa (n = 55) –2.25 ± 1.52 –5.01 ± 3.30 –8.28 ± 5.12 –12.12 ± 7.04
Source: Adapted from Economic growth, development and climate change in Africa, published by the African Climate Policy Centre (ACPC) of the United Nations Economic Commission for Africa (UNECA)

25
AFRICAN CLIMATE POLICY: GAPS AND OPPORTUNITIES
LIMITATIONS IN THE NATIONALLY DETERMINED CONTRIBUTIONS TO THE PARIS AGREEMENT
Africa’s Agenda 2063, which was concluded in 2013, recognizes climate change as a major challenge for the continent’s development. The priorities of Aspiration 1, Goal 7 of Agenda 2063 include, inter alia, climate re-silience and natural disaster preparedness and prevention, and renewable energy.28 However, climate change is already negatively affect-ing the ability of many African countries to achieve any of the United Nations Sustainable Development Goals (SDGs) or Agenda 2063 aspirations. The reasons for this include:
a) The impacts of climate change on GDP;
b) The impacts of climate events on national budgets;
c) Climate impacts on livelihoods and communities;
d) Climate impacts on infrastructure;
e) Climate change impacts on finance;
f) The costs of adaptation.
Since 2015, Nationally Determined Contri-butions (NDCs) to the Paris Agreement have become the main instrument guiding the policy response in all countries which have ratified the Paris Agreement. Fifty-two (52) African countries have submitted their first NDCs29 and are now in the process of sub-mitting revised NDCs in 2020.
The NDCs of African countries predominantly focus on adaptation although most also include mitigation actions. The proposed adaptation actions cover a wide sectoral spectrum,30 including agriculture, disaster risk
28 African Union: Goals and Priority Areas of Agenda 2063 https://au.int/en/agenda2063
29 NDC Registry - https://www4.unfccc.int/sites/ndcstaging/Pages/Home.aspx
30 https://www.climatewatchdata.org/ndcs/country/ZWE
management (DRM), energy, environment, social development, water, coastal zones, transport, land use, land use change, and forestry (LULUCF), health, urban and water. Many of these sectors are also affected in the proposed mitigation actions of Africa’s NDCs. Most mitigation actions are in the areas of energy, transport, industry (including min-ing) and building (including waste sectors). However, because the bulk of emissions are from land use, the agriculture and forestry sectors feature prominently in the mitigation actions.31
The first generation of Africa’s NDCs suf-fers from some major weaknesses, largely because these contributions were hurriedly constructed, with limited information, little or no cross sectoral consultation, even less consultation with other stakeholders such as the private sector, labour and communities, and largely assumed the availability of inter-national finance for their implementation.32,33
CAPACITY LIMITATIONS
Limited resources (human and financial), a shortage of relevant expertise and skills, and competing priorities constrain the ability of most African governments to generate and implement fully integrated climate policies and strategies. This situation is exacerbated by the growing complexity of work involved in designing and implementing sectoral and multisector decarbonization and resilience policies. These challenges are more acute at sub-national levels. Crucial gaps in weather and climate information also constrain the elaboration of coherent policies. Capacity gaps relating to the provision of climate services in Africa and in small island devel-oping States (SIDS) need to be addressed as soon as possible.34 SIDS have not developed comprehensive climate finance strategies to
31 FAO (2017). Regional analysis of the Nationally Determined Contributions of Eastern Africa: http://www.fao.org/3/a-i8165e.pdf
32 GAP ANALYSIS REPORT: African Nationally Determined Contributions (NDCs) African Development Bank
33 African Climate Policy Centre, UNECA34 World Meteorological Organization, 2019: 2019 State of
Climate Services: Agriculture and Food Security, https://library.wmo.int/doc_num.php?explnum_id=10089
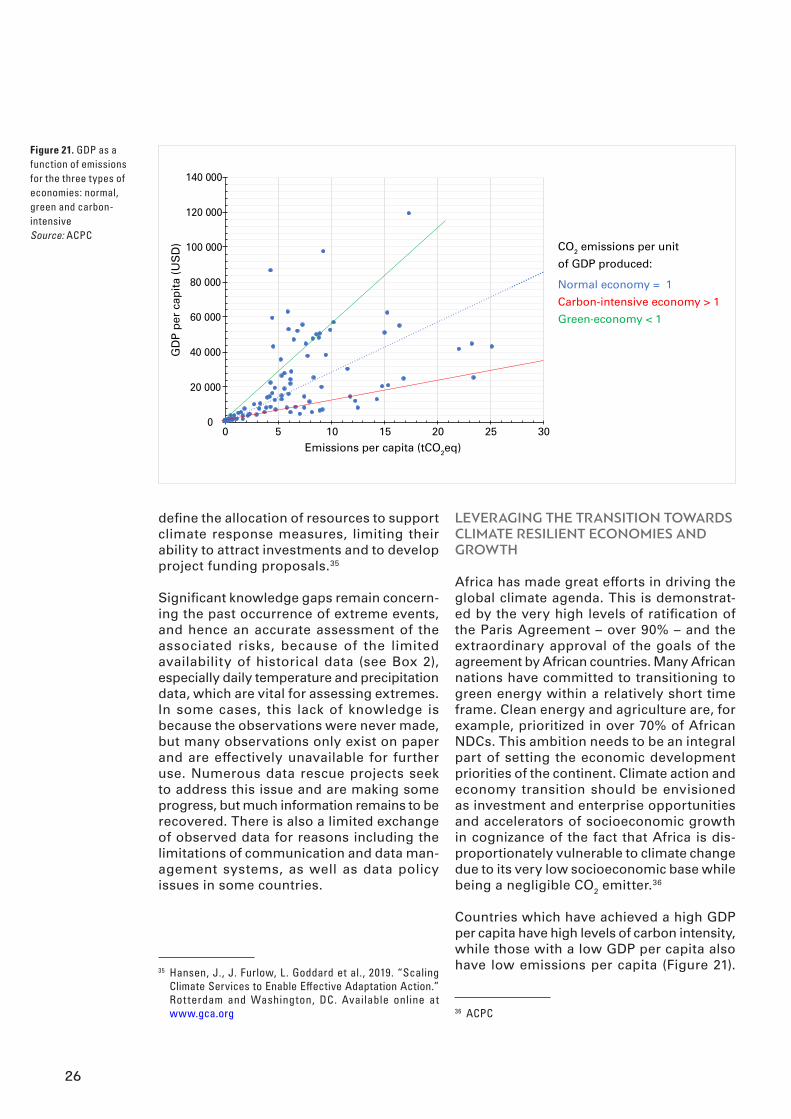
define the allocation of resources to support climate response measures, limiting their ability to attract investments and to develop project funding proposals.35
Significant knowledge gaps remain concern-ing the past occurrence of extreme events, and hence an accurate assessment of the associated risks, because of the limited availability of historical data (see Box 2), especially daily temperature and precipitation data, which are vital for assessing extremes. In some cases, this lack of knowledge is because the observations were never made, but many observations only exist on paper and are effectively unavailable for further use. Numerous data rescue projects seek to address this issue and are making some progress, but much information remains to be recovered. There is also a limited exchange of observed data for reasons including the limitations of communication and data man-agement systems, as well as data policy issues in some countries.
35 Hansen, J., J. Furlow, L. Goddard et al., 2019. “Scaling Climate Services to Enable Effective Adaptation Action.” Rot terdam and Washington, DC. Available online at www.gca.org
LEVERAGING THE TRANSITION TOWARDS CLIMATE RESILIENT ECONOMIES AND GROWTH
Africa has made great efforts in driving the global climate agenda. This is demonstrat-ed by the very high levels of ratification of the Paris Agreement – over 90% – and the extraordinary approval of the goals of the agreement by African countries. Many African nations have committed to transitioning to green energy within a relatively short time frame. Clean energy and agriculture are, for example, prioritized in over 70% of African NDCs. This ambition needs to be an integral part of setting the economic development priorities of the continent. Climate action and economy transition should be envisioned as investment and enterprise opportunities and accelerators of socioeconomic growth in cognizance of the fact that Africa is dis-proportionately vulnerable to climate change due to its very low socioeconomic base while being a negligible CO2 emitter.36
Countries which have achieved a high GDP per capita have high levels of carbon intensity, while those with a low GDP per capita also have low emissions per capita (Figure 21).
36 ACPC
26
Emissions per capita (tCO2eq)
GD
P pe
r ca
pita
(US
D)
140 000
120 000
100 000
80 000
60 000
40 000
20 000
00 5 10 15 20 25 30
CO2 emissions per unit of GDP produced:
Normal economy = 1 Carbon-intensive economy > 1Green·economy < 1
Figure 21. GDP as a function of emissions for the three types of economies: normal, green and carbon-intensive Source: ACPC

Most of the economies of sub-Saharan Africa, with the exception of South Africa, rank among the lowest in GDP per capita as well as in emissions per capita. The low levels of economic development also account for the greater vulnerability of Africa to climate variability and change. In order to reduce this vulnerability and adapt to climate change, the continent needs to continue pursuing transformational development policies. Economic growth needs to be promoted as part of the green growth trajectory, ensuring an increase in GDP per capita in order to meet the continent’s SDGs, while avoiding unsustainable increases in emissions.
INVESTING IN CLEAN ENERGY FOR THE DEVELOPMENT OF SUSTAINABLE AND PRODUCTIVE AGRICULTURE
Clean energy and sustainable agriculture are priorities for driving climate action.37 These are economically inclusive sectors that drive both mitigation and adaptation goals and hence offer the continent the shortest route to accelerated socioeconomic growth to build intrinsic resilience. According to FAO, through value addition, increased productivity in the agriculture sector, which employs over 60% of Africa’s population, is reported to be capable of reducing poverty two to four times faster
37 FAO. 2019. Energy in and from agriculture in the African Nationally Determined Contributions (NDC) - A review. Rome: http://www.fao.org/3/ca6359en/ca6359en.pdf
27
In November 2019, floods in the Central African Republic displaced over 28 000 persons.
Cre
dit:
Leo
Tore
ton
(IO
M/C
AR
)
28
Africa and the small island developing States are the two regions facing the largest capacity gaps with regard to climate services according to the 2019 State of Climate Services report.1 Forty-one per cent of countries in Africa provide services at capacity levels classified as “basic” or “less than basic”.
Despite covering a fifth of the world’s total land area, Africa has the least developed land-based observation network of all con-tinents, and one that is in a deteriorating state, amounting to only one eighth of the minimum density required by WMO, with only 22% of stations fully meeting Global Climate Observing System (GCOS) reporting requirements (down from 57% in 2011).2
The region faces increasing challenges re-garding the density of the observing network and the frequency of reporting observations that are essential for generating products and data needed for adaptation in climate-sensi-tive sectors. Basic systems, including data and data management, are significantly lagging compared to the global average. Though gaps exist in several regions, Africa has the highest percentage of stations established to supply timely data to global modelling centres that are non-reporting; this is the case even for basic meteorological data such as temperature, pressure and precipitation.3
Despite the fact that Africa is one of the regions receiving the highest share of climate
1 World Meteorological Organization, 2019: 2019 State of Climate Services: Agriculture and Food Security (WMO-No. 1242). Geneva. https://library.wmo.int/doc_num.php?explnum_id=10089
2 Ibid.3 Ibid.
adaptation funding, gaps still remain in var-ious components in the climate information and services value chain. Fit-for-purpose financial support that can help enhance the global-regional-national operational hydro-meteorological system is needed to support country-level service delivery.4 Priorities include strengthening sustainable observing networks, careful planning and resource allocation for maintenance and consumables, staff development, training and retention, planning for equipment replacement, data archiving, and data dissemination.5 See the box figure for an overview of climate services capacities in Africa, broken down by value chain component.
Supporting agricultural production, transition-ing to clean but climate-sensitive renewable energy systems, reducing recurrent disaster losses, ensuring adequate water availability, and protecting human health in the face of ongoing climate variability and change will require dramatic increases in the capacity of African climate services. Climate information products and services of proven value that Africa will require to meet these and other development objectives are being gener-ated in other regions worldwide, yet their availability in Africa remains limited. Further investments in climate information systems will address this gap and ensure that plans and decisions in climate-sensitive contexts are supported by the best available climate information and science.
4 Ibid.5 GCOS, WIGOS, UNFCCC Regional workshop in Uganda, 2019.
BOX 2. CLIMATE SERVICES STILL WEAK DESPITE ENHANCED FINANCE OPPORTUNITIES

29
74 56 64 61 71 25
0%
10%
20%
30%
40%
50%
60%
70%
80%
90%
100%
GovernanceBasic
systems User
interfaceCapacity
development
Provision and
application of CS M&E
Overview
59 57 50 36
0%
10%
20%
30%
40%
50%
60%
70%
80%
90%
100%
Basic Essential Full Advanced
Observing networks
76 45 51 36
0%
10%
20%
30%
40%
50%
60%
70%
80%
90%
100%
Basic Essential Full Advanced
Data and data management
82 62 34 33
0%
10%
20%
30%
40%
50%
60%
70%
80%
90%
100%
Basic Essential Full Advanced
Climate monitoring
98 65 65 34
0%
10%
20%
30%
40%
50%
60%
70%
80%
90%
100%
Basic Essential Full Advanced
Forecasting systems
85 66 50 27
0%
10%
20%
30%
40%
50%
60%
70%
80%
90%
100%
Basic Essential Full Advanced
User interface
79 83 73 50
0%
10%
20%
30%
40%
50%
60%
70%
80%
90%
100%
Basic Essential Full Advanced
Provision and application of climate services
50 25 9 90%
10%
20%
30%
40%
50%
60%
70%
80%
90%
100%
Basic Essential Full Advanced
Monitoring and evaluation
Overview of climate services capacities in Africa, broken down by value chain component, for 22 WMO Members in Africa that have provided data. Green fill indicates the percentage of “yes” responses from Members to the “checklist for climate services implementation” in each functional group shown. Functional capacities in each area are further broken down into basic, essential, full, and advanced capacity levels. Basic systems capacities (top four panels) comprise observing networks, data and data management, monitoring and forecasting systems. Monitoring and evaluation functions (lower left) include routine evaluations of the use and benefits of the services provided. In the overview panel (lower right), governance capacities reflect the degree to which national governance mechanisms ensure coordination for climate services and enable NMHS contributions to national adaptation planning, and capacity development functions include technical advisory services and training to address capacity development needs for climate service provision and use.
Source: Compiled from World Meteorological Organization, 2019: 2019 State of Climate Services: Agriculture and Food Security (WMO-No. 1242). Geneva. https://library.wmo.int/doc_num.php?explnum_id=10089
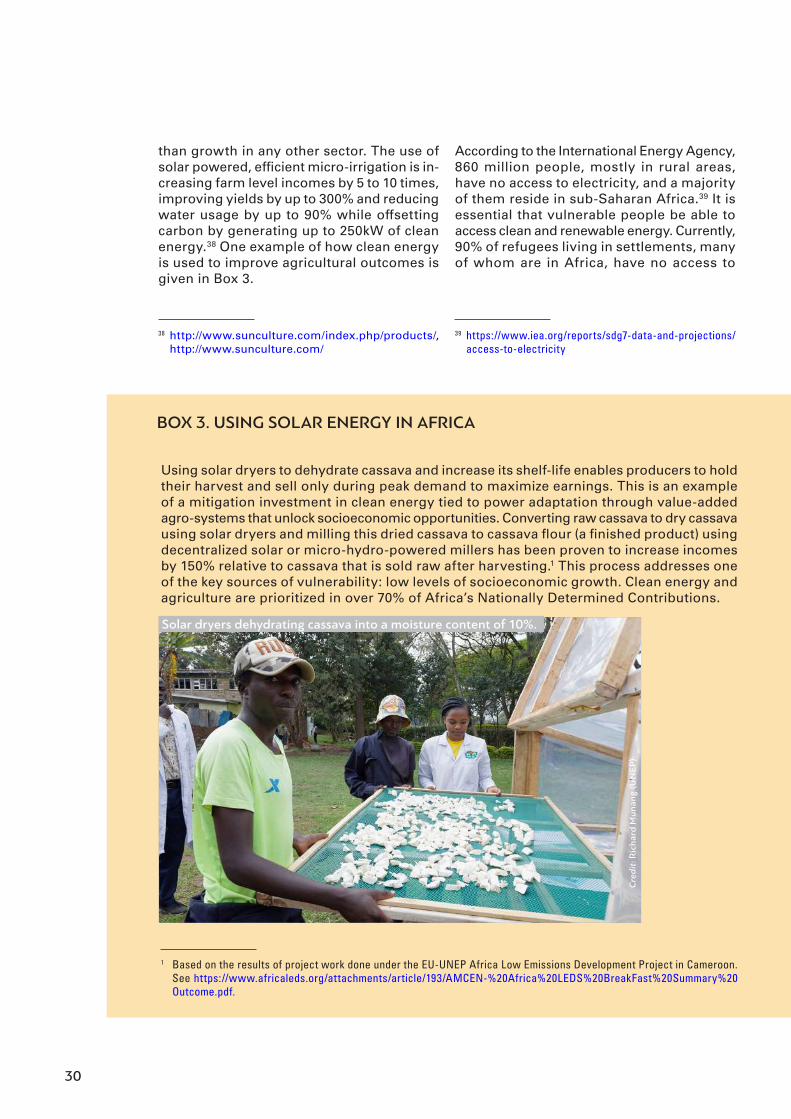
30
than growth in any other sector. The use of solar powered, efficient micro-irrigation is in-creasing farm level incomes by 5 to 10 times, improving yields by up to 300% and reducing water usage by up to 90% while offsetting carbon by generating up to 250kW of clean energy.38 One example of how clean energy is used to improve agricultural outcomes is given in Box 3.
38 http://www.sunculture.com/index.php/products/, http://www.sunculture.com/
According to the International Energy Agency, 860 million people, mostly in rural areas, have no access to electricity, and a majority of them reside in sub-Saharan Africa.39 It is essential that vulnerable people be able to access clean and renewable energy. Currently, 90% of refugees living in settlements, many of whom are in Africa, have no access to
39 https://www.iea.org/reports/sdg7-data-and-projections/access-to-electricity
Using solar dryers to dehydrate cassava and increase its shelf-life enables producers to hold their harvest and sell only during peak demand to maximize earnings. This is an example of a mitigation investment in clean energy tied to power adaptation through value-added agro-systems that unlock socioeconomic opportunities. Converting raw cassava to dry cassava using solar dryers and milling this dried cassava to cassava flour (a finished product) using decentralized solar or micro-hydro-powered millers has been proven to increase incomes by 150% relative to cassava that is sold raw after harvesting.1 This process addresses one of the key sources of vulnerability: low levels of socioeconomic growth. Clean energy and agriculture are prioritized in over 70% of Africa’s Nationally Determined Contributions.
1 Based on the results of project work done under the EU-UNEP Africa Low Emissions Development Project in Cameroon. See https://www.africaleds.org/attachments/article/193/AMCEN-%20Africa%20LEDS%20BreakFast%20Summary%20Outcome.pdf.
BOX 3. USING SOLAR ENERGY IN AFRICA
Solar dryers dehydrating cassava into a moisture content of 10%.C
redi
t: R
icha
rd M
unan
g (U
NEP
)

31
energy.40 Refugees and IDPs face health and protection risks when collecting firewood and using polluting cooking fuels, while host communities see their environment and livelihoods affected by deforestation when electricity and clean alternatives are not provided.
STRENGTHENING GENDER EQUALITY
Extreme weather events such as droughts and floods have a greater impact on the poor and most vulnerable, and a large percentage of the world’s poor are women. At the same time, about half of the women in the world are active in agriculture, 60% in developing countries and 70% in low-income food-deficit countries.41 It is therefore important to ensure that women have equitable access to weather and climate services in order to enhance their resilience and adaptive capacity.
It is also important that women be given the opportunity to play a meaningful role in tackling climate change-related risks and impacts by having access to leadership roles and capacity-building trainings, as well as the opportunity to be involved in decision-making within their communities.
PROTECTING DISPLACED PEOPLE
Given the scale of the impacts of climate change on people, there is no doubt that it is already having an effect on human mobility both internally and across the borders in Africa. Climate action should be encouraged to enhance the protection of displaced peo-ple through operations, research and policy engagement, legal advice and norm develop-ment. The ongoing partnership of UNHCR and IOM can be of particular use in this regard.
The Global Compact on Refugees (GCR) and the Global Compact on Migration (GCM) are important United Nations tools which can be used to strengthen guidance and
40 http://unitar.org/sites/default/files/media/file/gpa_frame-work_final-compressed.pdf
41 Conference on the gender dimensions of weather and climate services (WMO-No. 1148), https://library.wmo.int/doc_num.php?explnum_id=7893
provide protection and support for people who have been displaced due to the impact of environmental degradation and disasters. It is essential that this issue continue to be addressed through the Global Refugee Forum, the United Nations Network on Migration, human rights processes, and the 2030 Agenda for Sustainable Development.42
STRENGTHENING MULTI-HAZARD EARLY WARNING SYSTEMS
During 2019, in addition to crises such as conflicts and the lack of sustained economic development, several high-impact events affected the continent of Africa, causing loss and damage to vital aspects of communities and populations and resulting in issues relat-ing to food security, population displacement, and the safety, health and livelihoods of individuals.
Efforts should be pursued to enhance re-silience through appropriate prevention and risk management strategies, including a variety of structural and non-structural measures targeted at specific regions and populations. The devastation that resulted from Tropical Cyclone Idai is an example of why there is a critical need to improve the management of high-impact events. (Box 4 shows the gaps in one country’s approach to early warnings as revealed by this severe weather event.) According to WMO, Multi-hazard Early Warning Systems (MHEWS) are most effective only if they consist of the following five elements:
a) Disaster risk knowledge, based on the systematic collection of data and disaster risk assessments;
b) Detection, monitoring, analysis and forecasting of hazards and possible consequences, notably with respect to population safety, food security and displacement;
c) Dissemination of instruments/tools available and of authoritative, user needs-adjusted, timely, accurate and
42 UNHCR, Climate change and disaster displacement, https://www.unhcr.org/climate-change-and-disasters.html

Tropical Cyclone Idai revealed gaps in Mozambique’s approach to early warnings including:
1) An ineffective multi-hazard early warning system and the fact that people do not understand the terminology used (for example, 50 mm of rain and 150 km/h);
2) That there is a limited understanding of risks at the institutional, community and individual levels associated with the absence of hazard mapping (for example, flood mapping for the entire country), exposure and vulnerability assessments, effective land use planning and enforcement for efficient floodplain management;
3) The absence of effective disaster man-agement plans, including evacuation plans for cities;
4) Problems with the quality and accuracy of warnings, particularly for flooding in some river basins;
5) Building codes that are not suitable to withstand the impact of events of the magnitude of Tropical Cyclone Idai;
6) The absence of a communication system that can be used in case of failure of nor-mal communication means for warning and emergency operations;
7) Limited emergency response capacities, particularly for search and rescue pur-poses; and
8) Limited funding to allow meteorology, hydrology and disaster management institutions to carry out their mandatory functions and to better coordinate with each other.
BOX 4. TROPICAL CYCLONE IDAI AND MOZAMBIQUE
Tropical Cyclone Idai : Metop-B Infrared image on 14 March at 1848 UTC, shortly before landfallThe red star indicates the position of Beira.
Source: Eumetsat and Météo-France
32
33
actionable warnings and associated information on potential impacts by an officially designated source;
d) Preparedness at all levels to respond to the warnings issued and to have more effective recovery, rehabilitation and reconstruction phases; and
e) Prevention and anticipation of hazards through predictive analytics and resil-ience activities, such as reforestation projects, as well as actions to provide protection and assistance to people.43
Operationally, these elements should take the form of Standard Operating Procedures
43 https://www.wmo.int/pages/prog/drr/projects/Thematic/MHEWS/MHEWS_en.html#goodpractices
(SOPs) to guide operational aspects in a clear and consistent manner, prior to, during and after the disaster. SOPs should ensure that operations are consistent, that data and information are shared, that NMHSs and other government agencies responsible for disaster management and dealing with emergency sit-uations and humanitarian issues have clearly defined roles and responsibilities, and that information for users is understandable and provided in timely manner. There is an urgent need to improve warning communications. Warning messages need to be user-oriented and targeted to various audiences, clearly indicating potential impacts. For MHEWS to be effective, it is necessary to educate the public and increase awareness about hazards.
34
Global average temperatures were calculated by each agency according to its own methods. Each global temperature series was converted to a pre-industrial baseline by subtracting the average of the global mean tempera-ture anomalies for the period 1850–1900 or 1880–1900, depending on when the data set began. Reanalyses which did not extend back to the nineteenth century were aligned with traditional in situ data sets over the period 1981–2010. Five data sets were used, including three in situ data sets – HadCRUT.4.6.0.0, NOAAGlobalTemp v4 and GISTEMP v4 – and two reanalyses – ERA5 and JRA-55. (See below for details.)
For global land temperatures, three data sets were used: CRUTEM.4.6.0.0, GHCN v4 and GISTEMP v4. (See below for details.) Global mean series were processed as for global temperatures.
For continental average temperatures, grid-ded data from the three in situ data sets were converted to anomalies from the 1981–2010 average by subtracting the average anom-aly (relative to the baseline originally used for that data set) for that base period for each grid cell and calendar month. The data sets were then regridded onto a regular 1° latitude × 1° longitude grid, and gridboxes falling outside the continental area were discarded. An area-weighted average of the remaining 1° × 1° grid boxes was taken. The non-missing monthly anomalies were averaged to annual anomalies.
DATA SETS
HadCRUT – Morice, C.P., J.J. Kennedy, N.A. Rayner and P.D. Jones, 2012: Quanti-fying uncertainties in global and regional temperature change using an ensemble of observational estimates: The HadCRUT4 dataset. J. Geophys. Res., 117, D08101, doi:10.1029/2011JD017187.
CRUTEM – Jones, P. D., D. H. Lister, T. J. Osborn, C. Harpham, M. Salmon, and C. P. Morice, 2012: Hemispheric and large-scale land surface air temperature variations: An extensive revision and an update to 2010. J. Geophys. Res., 117, D05127, doi:10.1029/2011JD017139.
NOAAGlobalTemp – Zhang, H.-M., B. Huang, J. Lawrimore, M. Menne, T.M. Smith: NOAA Global Surface Temperature Dataset (NOAAGlobalTemp), Version 5. NOAA National Centers for Environmental Information, doi:10.25921/9qth-2p70 [2020-01-08].
GISTEMP – GISTEMP Team, 2019: GISS Surface Temperature Analysis (GISTEMP), version 4, NASA Goddard Institute for Space Studies. Lenssen, N., G. Schmidt, J. Hansen, M. Menne, A. Persin, R. Ruedy, and D. Zyss, 2019: Improvements in the GISTEMP uncertainty model, J. Geophys. Res. Atmos., 124, no. 12, 6307-6326, doi:10.1029/2018JD029522.
ERA5 – Hersbach, H., B. Bell, P. Berrisford, A. Horányi, J. Muñoz-Sabater, J. Nicolas, C. Peubey, R. Radu, I. Rozum, D. Schepers, A. Simmons, C. Soci, F. Vamborg, S. Abdalla, G. Balsamo, P. Bechtold, J. Bidlot, M. Bonavita, G. De Chiara, P. Dahlgren, D. Dee, R. Dragani, M. Diamantakis, J. Flemming, R. Forbes, A. Geer, E. Hólm, L. Haimberger, R. Hogan, M. Janisková, P. Laloyaux, P. Lopez, P. de Rosnay, J.-N. Thépaut, S. Villaume et al, 2019: The ERA5 global reanalysis. Under review at Quart. J. Roy. Meteor. Soc.
JRA-55 – Kobayashi, S., Y. Ota, Y. Harada, A. Ebita, M. Moriya, H. Onoda, K. Onogi, H. Kamahori, C. Kobayashi, H. Endo and K. Miyaoka, 2015: The JRA-55 reanalysis: General specifications and basic characteris-tics, Journal of the Meteorological Society of Japan. Ser. II, 93(1), pp. 5-48. Monthly global mean temperature data were provided by the Japan Meteorological Agency.
OSTIA – Donlon, C.J., M. Martin, J. Stark, J. Roberts-Jones, E. Fieldler and W. Wimmer, 2012: The operational sea surface temperature and sea ice analysis (OSTIA) system. Remote Sensing of Environment, 116, pp. 140–158. Data were provided by the UK Met Office.
GHCN – Menne, M.J., C.N. Williams, B.E. Gleason, J.J Rennie and J.H. Lawrimore, 2018: The Global Historical Climatology Network Monthly Temperature Dataset, Version 4. J. Climate, https://doi.org/10.1175/JCLI-D-18-0094.1.
Methods and data for state of the climate indicators
JN 2
0552
For more information, please contact:
World Meteorological Organization7 bis, avenue de la Paix – P.O. Box 2300 – CH 1211 Geneva 2 – Switzerland
Strategic Communications Office Cabinet Office of the Secretary-General
Tel: +41 (0) 22 730 83 14 – Fax: +41 (0) 22 730 80 27
Email: [email protected]
public wmo int
AUTO
RITÉ INTERGOUVERNEMENTALE POUR L
E DEV
ÉLOP
PEMEN
T