state of the australian grains industry 2016 · 2018-01-11 · sydney level 19, 1 market street...
TRANSCRIPT
STATE OF THE
AUSTRALIAN GRAINS INDUSTRY 2016
SYDNEYLevel 19, 1 Market Street Sydney, 2000P.O Box Q1355, Queen Victoria Building, NSW, 1230T: (02) 9286 2000
CANBERRALevel 2, 53 Blackall Street, Barton, ACT, 2600T: (02) 6173 6400
W: www.graingrowers.com.auTwitter: @GrainGrowersLtdFacebook: @GrainGrowers
About GrainGrowersGrainGrowers is an independent and technically resourced, grain grower representative organisation with 17,500 members across Australia.
GrainGrowers’ goal is a more efficient, sustainable and profitable grain production sector that benefits all Australia grain growers and the wider grains industry.
GrainGrowers has three divisions which work cooperatively to achieve improved grain industry outcomes: 1) National Policy & Innovation, 2) National Capability Development and 3) Industry Services.
AcknowledgmentsLead author: Dr Cheryl Kalisch Gordon
Contributing writers:GrainGrowers policy staff: David McKeon, Carmen Whiteley, Dr Michael Southan and Christopher Price, Emeritus Professor Dr Gordon MacAulay
Editor: Catriona Nicholls Graphic design: Megan Hele
Cover image courtesy Rural Photos
DisclaimerThe professional analysis and advice in this report has been prepared by GrainGrowers for the exclusive use of the party or parties to whom it is addressed (the addressee) and for the purposes specified in it. This report is supplied in good faith and reflects the knowledge, expertise and experience of the consultants involved. The report must not be published, quoted or disseminated to any other party without GrainGrowers’ prior written consent. GrainGrowers accepts no responsibility whatsoever for any loss occasioned by any person acting or refraining from action as a result of reliance on the report, other than the addressee. In conducting the analysis in this report GrainGrowers has endeavoured to use what it considers is the best information available at the date of publication, including information supplied by the addressee. Unless stated otherwise, GrainGrowers does not warrant the accuracy of any forecast or prediction in the report. Although GrainGrowers exercises reasonable care when making forecasts or predictions, factors in the process, such as future market behaviour, are inherently uncertain and cannot be forecast or predicted reliably. GrainGrowers shall not be liable in respect of any claim arising out of the failure of a client investment to perform to the advantage of the client or to the advantage of the client to the degree suggested or assumed in any advice or forecast given by GrainGrowers.
About the State of the Australian Grains Industry report The State of the Australian Grains Industry 2016 report was first published by GrainGrowers in 2011. The purpose of the Report was to review the industry post the deregulation of wheat export marketing and to outline the priority actions required to advance the interests of growers in an internationally competitive market. The report also successfully established a basis for evaluating the industry and opportunities in future reports. Five years on, the 2016 edition builds on the original report by reflecting on progress towards capturing the opportunities outlined in 2011 and identifying the challenges faced by Australia’s contemporary grains industry. Although developed by GrainGrowers, it is intended that the report be used industry wide, as a useful ready-reckoner to our great grains industry.
LEAD AUTHORDr Cheryl Kalisch GordonSenior Economist and Manager Trade & Market Access — GrainGrowersE: [email protected]: (02) 6173 6400
MEDIA CONTACTLaureta WallacePublic Affairs Manager — GrainGrowersE: [email protected]: (02) 6173 6415M: 0457 589 703
GRAIN GROWERS LIMITED STATE OF THE AUSTRALIAN GRAIN INDUSTRY 2016
Agriculture is at the heart of the Australian economy and underpins the social fabric of our nation. Agriculture directly contributes to Australia’s social, economic and environmental sustainability, especially across our rural heartland.
Australian broadacre cropping directly contributed $13.9 billion to the national economy (2014-15), and that’s just the value at the farm gate. With such as strong production base of wheat, barley, canola, oats, sorghum and pulses; the grains sector continues to be one of the most important agricultural contributors to the Australian economy.
Beyond the farm gate, grain production also underpins other important agricultural sectors, including the livestock, domestic milling, baking and malting. Grain ultimately delivers something on our plates at every meal and the beer at the end of the day.
Australian grain farmers are among world leaders in productivity. We produce an average of 45 million tonnes of grain per annum. This is enough to not only satisfy Australia’s domestic needs but also to make us a significant grain exporting nation in the world. About 65% of our grain is exported (including up to 90% in Western Australia and South Australia).
Australia’s grains sector has undergone significant change during the past decade. In 2008, the wheat export system was deregulated through the abolition of the single trading desk. In terms of production and exports, wheat is our most significant grain so it is important to keep track of how the industry has adjusted and progressed since deregulation.
In the deregulated environment, the grains industry is responsible for driving its own future. This report is an important step forward in this regard. It provides a comprehensive environmental scan of the changing world that the Australian grains sector operates in. The State of Australian Grains Industry Report explores existing and emerging opportunities and challenges, such as the need to increase digital agriculture capacity and increasing competitiveness in the international market place.
Through the development of this report, GrainGrowers has laid the groundwork for inclusive, industry-wide discussion and direction setting to progress the Australian grains sector. I encourage participants from across the entire grain supply chain to take this opportunity to work together to ensure the grains sector continues to grow and remain profitable into the future.
Hon Barnaby Joyce MPDEPUTY PRIME MINISTER MINISTER FOR AGRICULTURE AND WATER RESOURCES
FOREWORD
IIIGRAIN GROWERS LIMITED STATE OF THE AUSTRALIAN GRAIN INDUSTRY 2016
Image courtesy Ben White

IV GRAIN GROWERS LIMITED STATE OF THE AUSTRALIAN GRAIN INDUSTRY 2016IV GRAIN GROWERS LIMITED STATE OF THE AUSTRALIAN GRAIN INDUSTRY 2016
ABARES: Australian Bureau of Agricultural and Resource Economics and Sciences
ACCC: Australian Competition and Consumer Commission
AEGIC: Australian Export Grains Innovation Centre
AFIA: Australian Fodder Industry Association
AGEA: Australian Grain Exporters Association
AGIC: Australian Grains Industry Conference
AGIDG: Australian Grains Industry Discussion Group
AMA: Australian Mungbean AssociationANIC: Australian Nut Industry CouncilANZFTA: Australia-New Zealand Free Trade Agreement
AOF: Australian Oilseeds FederationAPVMA: Australian Pesticide and Veterinary Medicines Authority
ASEAN: Association of South East Asian Nations
ASF: Australian Seed FederationASX: Australian stock exchangeAWB: Australian Wheat BoardBA: Barley AustraliaBoM: Bureau of MeteorologyBRI: Bread Research InstituteCAGR: Compound average growth rateCER: Clean Energy RegulatorCFI: Carbon Farming InitiativeChAFTA: China Australia Free Trade Agreement
CIGI: Canadian International Grains Institute
CIS: Commonwealth of Independent States
CSG: Coal seam gasCSIRO: Commonwealth Scientific and Industrial Research Organisation
EPPR: Emergency Plant Pest ResponseERF: Emissions Reduction FundEU: European Union
FAO: United Nations Food and Agriculture Organisation
FAS: USDA Foreign Agriculture ServiceFIRB: Foreign Investment Review BoardFMD: Farm Management DepositsFOB: Free on BoardDAWR: Australian Government Department of Agriculture and Water Resources
DAFWA: Department of Agriculture and Food, Western Australia
GCC: Gulf Cooperation CouncilGDP: Gross domestic productGFC: Global financial crisisGFR: Gross farm receiptsGIMAF: Grains Industry Market Access Forum
GIWA: Grain Industry Association of Western Australia
GLNC: Grains and Legumes Nutrition Council
GM: Genetically modifiedGPA: Grain Producers AustraliaGPPEICC: Grain and Plant Product Export Industry Consultative Committee
GPS: Global positioning systemGPSA: Grain Producers South AustraliaGrainGrowers: Grain Growers LimitedGRDC: Grains Research and Development Corporation
GSR: Growing season rainfallGTA: Grain Trade Australia GVP: Gross value of productionIA-CEPA: Indonesia-Australia Comprehensive Economic Partnership Agreement
IOC: Industry owned companyIQ: In quotaJAPEA: Japanese Australia Economic Partnership Agreement
KAFTA: Korea Australia Free Trade Agreement
MAA: Maize Association of Australia MCPI: Multi-peril crop insuranceMENA: Middle East and North Africa
NFF: National Farmers Federation NWPGP: National Working Party on Grain Protection
NBN: National Broadband NetworkNRS: National Residue SurveyOECD: Organisation for Economic Co-operation and Development
OGTR: Office of the Gene Technology Regulator
OOQ: Out of quotaPA: Pulse AustraliaPGA: Pastoralists and Graziers Association of Western Australia
PHA: Plant Health AustraliaPIRD Act: Primary Industries Research and Development Act 1989
PSE: Producer support estimateR&D: Research and developmentRCEP: Regional Comprehensive Economic Partnership
RD&E: Research, development and extension
RDC: Research and Development Corporation
RGA: Ricegrowers’ Association of Australia
SFO: State farming organisationTFP: Total factor productivityTPP: Trans Pacific PartnershipUAE: United Arab EmiratesUN: United NationsUS: United StatesUSDA: United States Department of Agriculture
VFF: Victorian Farmers FederationWAFarmers: Western Australia Farmers Federation
WEA: Wheat Exports AustraliaWIAT: Wheat Industry Advisory TaskforceWIS Account: Wheat Industry Special Account
WQA: Wheat Quality AustraliaWTO: World Trade OrganisationWUE: Water use efficiency
ACRONYMS
Image courtesy Ben White
1. T//////
VGRAIN GROWERS LIMITED STATE OF THE AUSTRALIAN GRAIN INDUSTRY 2016
1. A new global era for Australia’s grains industry ........... 1
Beyond deregulation .......................................... 1 An important and growing sector ................. 2 Shaping the future ............................................ 4
2. Grains grown across the nation ........................................... 5
The grains in the mix........................................... 5 A national industry .............................................. 5 Wheat .....................................................................10 Coarse grains .......................................................12 Pulses ......................................................................15 Oilseeds ..................................................................16 Genetically modified grains ...........................17 The future of the grains mix ...........................20
3. The businesses of growing grain ................................. 21
Consolidation continues ..................................21 Mostly positive returns .....................................21 A family affair ......................................................22 Costs continue to increase ..............................23 Prices in a global market .................................25 Government support .........................................26 Managing water and climate .........................28 Future grain farm fortunes ............................30
4. Where Australian grain goes ......................................... 31
Exports are critical .............................................31 Australians using grain .....................................31 International markets .......................................35 Market maintenance and growth .................40
5. Getting grain to market ........... 41 Australia’s grain freight network ..................41 Grain storage patterns ......................................42 Rail versus road ...................................................44 Port terminals and competition .....................44 Grain shipping .....................................................46 Efficiency key to competitiveness .................46
6. Government and grains ........... 49 Post deregulation policy .................................49 The issues ..............................................................50 Partnerships the key to an
international future ..........................................54
7. Grains industry coordination .................................... 55
The post-deregulation horizon ......................55 Closer collaboration required .........................57 Missing link in competitiveness ...................57
8. Going forward ................................ 61 The strengths ......................................................61 The challenges ....................................................61 The opportunities ..............................................62
Appendices ..................................... 64 Appendix 1: Wheat Quality Australia
— classes ..............................................................64
Appendix 2: Trade agreement status update for grains ...............................................66
Appendix 3: Glossary of entities and acronyms ..............................................................70
Appendix 4: Wheat Industry Advisory Taskforce ...............................................................73
Appendix 5: References ..................................76
CONTENTS
VGRAIN GROWERS LIMITED STATE OF THE AUSTRALIAN GRAIN INDUSTRY 2016
1 GRAIN GROWERS LIMITED STATE OF THE AUSTRALIAN GRAIN INDUSTRY 2016
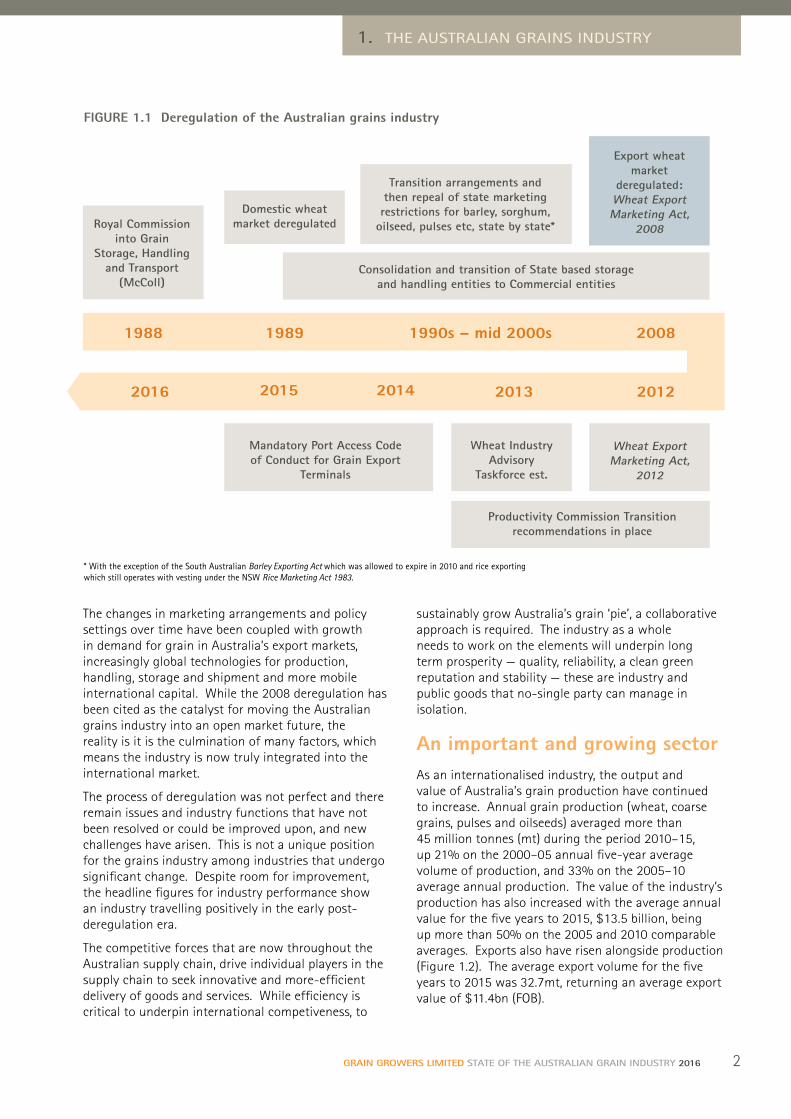
Beyond deregulation The removal of the single desk for wheat during 2008 was a significant structural change following a long period of deregulation for the Australian grains sector (Figure 1.1). In this process of deregulation a significant milestone, and arguably for many the most significant, was the 1988 McColl Royal Commission into Grain Storage, Handling and Transport. The McColl Royal Commission triggered, among other adjustments, the deregulation of the domestic marketing of most Australian grain. The 2008 removal of the single desk for wheat was the logical final step in the list of changes prompted by the McColl Royal Commission and was significant in that it thrust the Australian grains industry into a global open market environment.
The cornerstone of Australia’s single desk for wheat exports was the Commonwealth Wheat Marketing Act (1989) which vested monopoly wheat export rights with AWB International (AWBI), and the Australian Wheat Board (AWB) before that. Since the repeal of this act in 2008 and the subsequent removal of export rights for wheat from AWB International, a number of major
commodity marketers with overseas and domestic origins have played an increasingly active role in the accumulation, movement and marketing of Australian wheat for export. The market for wheat exports from Australia is now well advanced as a multi participant, oligopolistic structure.
In 2016, the Australian grains industry finds itself completely immersed in the vagaries and opportunities of the international market. Competitive forces are characteristic of the supply chain, from on-farm production, which long ago came out from the shelter of price supports, subsidies and tariffs, through to contestable domestic grain trading and international exports.
During December 2015, World Trade Organisation (WTO) members agreed in Nairobi to increased scrutiny on state export trading enterprises. If the vested export powers of the Australian Wheat Board (AWB) remained, it would now be facing increased scrutiny on activities, likely increased pressure on its single desk export marketing and an uncertain time ahead. Instead, the Australian grains industry has moved beyond deregulation and the uncertainty the pre-deregulation environment held.
In 2016, the Australian grains industry finds itself in a vastly different landscape than pre-2008, and even 2011 when the State of the Australian Grains industry was last assessed. The deregulation of the single desk for wheat exports during 2008 was the final chapter in a long process of deregulation that prompted a changed, and truly internationalised, landscape for the Australian grains industry.
1. A NEW GLOBAL ERA FOR AUSTRALIA’S GRAINS INDUSTRY
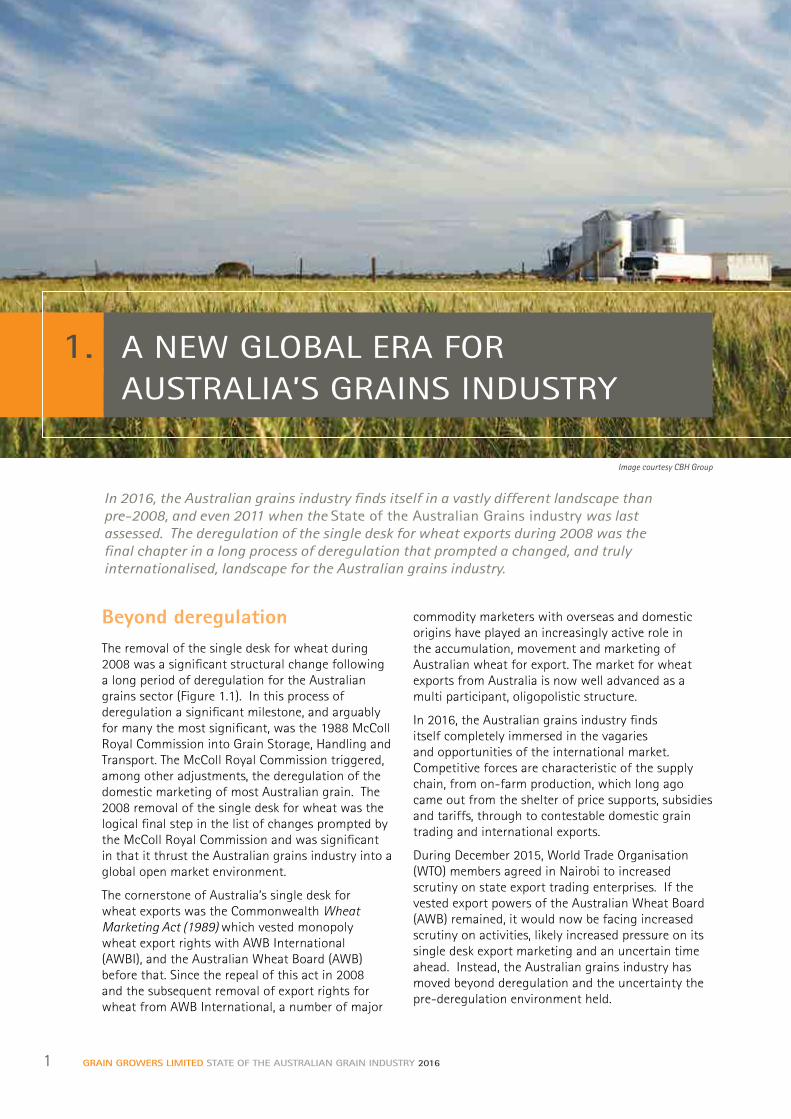
Image courtesy CBH Group
1. T//////
2GRAIN GROWERS LIMITED STATE OF THE AUSTRALIAN GRAIN INDUSTRY 2016
1. THE AUSTRALIAN GRAINS INDUSTRY
sustainably grow Australia’s grain ‘pie’, a collaborative approach is required. The industry as a whole needs to work on the elements will underpin long term prosperity — quality, reliability, a clean green reputation and stability — these are industry and public goods that no-single party can manage in isolation.
An important and growing sectorAs an internationalised industry, the output and value of Australia’s grain production have continued to increase. Annual grain production (wheat, coarse grains, pulses and oilseeds) averaged more than 45 million tonnes (mt) during the period 2010–15, up 21% on the 2000–05 annual five-year average volume of production, and 33% on the 2005–10 average annual production. The value of the industry’s production has also increased with the average annual value for the five years to 2015, $13.5 billion, being up more than 50% on the 2005 and 2010 comparable averages. Exports also have risen alongside production (Figure 1.2). The average export volume for the five years to 2015 was 32.7mt, returning an average export value of $11.4bn (FOB).
The changes in marketing arrangements and policy settings over time have been coupled with growth in demand for grain in Australia’s export markets, increasingly global technologies for production, handling, storage and shipment and more mobile international capital. While the 2008 deregulation has been cited as the catalyst for moving the Australian grains industry into an open market future, the reality is it is the culmination of many factors, which means the industry is now truly integrated into the international market.
The process of deregulation was not perfect and there remain issues and industry functions that have not been resolved or could be improved upon, and new challenges have arisen. This is not a unique position for the grains industry among industries that undergo significant change. Despite room for improvement, the headline figures for industry performance show an industry travelling positively in the early post-deregulation era.
The competitive forces that are now throughout the Australian supply chain, drive individual players in the supply chain to seek innovative and more-efficient delivery of goods and services. While efficiency is critical to underpin international competiveness, to
FIGURE 1.1 Deregulation of the Australian grains industry
Royal Commission into Grain
Storage, Handling and Transport
(McColl)
19891988 20081990s – mid 2000s
Domestic wheat market deregulated
Transition arrangements and then repeal of state marketing restrictions for barley, sorghum,
oilseed, pulses etc, state by state*
Consolidation and transition of State based storage and handling entities to Commercial entities
2013 2012201420152016
Export wheat market
deregulated: Wheat Export Marketing Act,
2008
Wheat Industry Advisory
Taskforce est.
Mandatory Port Access Code of Conduct for Grain Export
Terminals
Productivity Commission Transition recommendations in place
Wheat Export Marketing Act,
2012
* With the exception of the South Australian Barley Exporting Act which was allowed to expire in 2010 and rice exporting which still operates with vesting under the NSW Rice Marketing Act 1983.

The growing volume and value of Australian grain production and exports indicates, as a whole, the industry is in a strong position. Underlying the superior 2015 five-year average production figures are some highly-productive years, across most grain-growing regions, relative to variable and sometimes extremely dry conditions of the decade to 2010 and stable-to-strong domestic and international demand.
In increasing its value and volume, the grains industry continues to be a mainstay of the Australian economy and the Australian agricultural landscape. The industry’s main outputs — wheat, barley, canola,
sorghum, oats and a range of pulses — together consistently account for more than 25% of the value of Australian agricultural production (Figure 1.3) and an even greater proportion of Australian agricultural exports (averaging 30% during 2010-15). The grains industry also contributes to a further 40% of the value of Australian agriculture through the provision of feed grain rations to the intensive livestock sectors (primarily cattle, poultry, pigs and dairy). The importance of this collective contribution is underscored by the expanding gross value of total Australian agricultural production — more than $53bn for 2015 (ABS, 2016).
FIGURE 1.2 Australian grain production and exports (five-year average volumes and values)
45.8mt produced
32.7mt exported
0
5
10
15
20
25
30
35
40
45
50
2005
Aus
tral
ian
grai
n vo
lum
e (m
t)
and
valu
e ($
b)
2010 2015
Volume produced (mt)
Volume exported (mt) Value of production ($b)
Value of exports ($b FOB)
$13.5b gross value
$11.4b of export earnings
Data source: ABARES (2016)
3 GRAIN GROWERS LIMITED STATE OF THE AUSTRALIAN GRAIN INDUSTRY 2016
Image courtesy Ben White

1. T//////
4GRAIN GROWERS LIMITED STATE OF THE AUSTRALIAN GRAIN INDUSTRY 2016
1. THE AUSTRALIAN GRAINS INDUSTRY
Shaping the futureThe state of Australia’s grains industry is, however, much more than the headline figures alone. It is about profitability and sustainability. It is about long-term competitiveness in an increasingly competitive international market. It is about the many growers, traders, end-users and service providers that make up the industry. For that reason, it is important to examine the industry through its components to ensure value is being created, and returned, and the industry has in place systems mechanisms and relationships to underpin its competitiveness into the future.
The Australian grains industry is characterised by a number of dynamics that shape the strengths of the industry, the capacity of the industry to capture the opportunities presented and to the meet the challenges of the future.
This State of the Australian Grains Industry, 2016 contains an analysis of the Australian grains industry supply chain as a whole, and its components, as it stands in 2016. As well, medium-term changes since 2010 and the longer-term trends that pre-date deregulation are considered.
FIGURE 1.3 Contribution of the Australian grains industry to Australian agriculture (2014–15)
Hay 3%
Nursery 2%
Fruit and nuts (inc grapes) 9%
Vegetables 6%
Animal products 15%(Wool, milk, eggs...)
Sheep and lamb 6%
Cattle 22%
Pigs 2%
Poultry 5%
Other livestock 0.3%
Cotton 2% Sugar cane 2.4%
Grains, pulses and oilseeds 26%
Wheat AU$7,124m
Oats AU$300m
Barley AU$2,417mMaize AU$163mRice AU$273mTriticale AU$37mOther cereals AU$50m
Sorghum AU$666m
Pulses AU$906m
Canola AU$1,782m
Other 0.2%
Data source: ABS, 2016

5 GRAIN GROWERS LIMITED STATE OF THE AUSTRALIAN GRAIN INDUSTRY 2016
2. GRAINS GROWN ACROSS THE NATION
Australia’s grains industry is national but varies by state and region in terms of crops grown and agronomic practices deployed. In any one year a grain farmer may grow a mix of wheat, coarse grains, oilseeds and pulses. The cropping program will be influenced by biophysical factors, market opportunities, including substitution to livestock production, and regulatory constraints.
The grains in the mixWhat a grain grower decides to sow in any given year depends on a complex mix of elements. Biophysical factors, largely soil and climate, of any given location will guide a basic set of crop options (Figure 2.1) and be the major components of the decision, followed by expected price. Other elements that guide crop selection include expected rainfall and its timing, crop rotational considerations related to pests, weeds and disease, and soil conditions, local markets, receival site options, prevailing livestock prices and risk management.
A national industryThe Australian grains industry is significant to the agricultural landscapes of New South Wales (NSW), Victoria, South Australia (SA), Western Australia (WA) and Queensland, and in some regions of Tasmania. Grain crops are grown in the ‘cropping belt’ of Australia, which comprises some 45 million hectares (mha). This ‘belt’ starts in central Queensland and wraps itself inland down through NSW, Victoria, Tasmania and along the bottom edge of SA through the south-west to central WA. Newer, smaller, areas of grain production have been also been developing in northern WA, and northern Qld.
The total number of hectares of grain sown annually has remained relatively stable, at between 22 and 25mha during the past decade (Figure 2.2). The difference between the total size of the cropping belt and annual area cropped reflects seasonal variability and the incorporation of grazing and fallow/resting in crop rotations, and alternative uses for cropping land. There has been some growth in the area sown, with the average area sown closer to 23.5mha for the past five years. This growth has been led by an increase in the area under crop in WA and, to a lesser extent, Victoria.
The Australian grains industry comprises a sophisticated supply chain, which includes input suppliers, traders, bulk handlers, port operators, processors and other allied service providers. The industry collectively accounts for more than 170,000 jobs across Australia from farm to export dock. At the heart of the grains industry is an Australian-wide grain production sector.
Image courtesy Tania Bahnisch Currawong-Yelarbon, Qld

1. T//////
6GRAIN GROWERS LIMITED STATE OF THE AUSTRALIAN GRAIN INDUSTRY 2016
2. GRAINS GROWN ACROSS THE NATION
NorthernTerritory (NT)
SouthAustralia (SA)
WesternAustralia (WA)
Queensland (Qld)
Tasmania (Tas)
New South Wales (NSW)
PERTHDUBBO
DALBY
EMERALD
MOREE
CEDUNA
SYDNEY
HOBART
ALBANY
BROOM
DARWIN
MILDURA
MITCHELL
GRIFFITH
BRISBANE
CANBERRAADELAIDEESPERANCE
GERALDTON
LAUNCESTON
KALGOORLIE
MOUNT GAMBIER MELBOURNE
ALBURY
CAIRNS
Victoria (Vic)
Source: Adapted from AEGIC
FIGURE 2.1 Australian agro-ecological zones and crops grown by zone
Agroecological zone Season Dominant crops grownWA Northern Winter Wheat, barley, oats, triticale, lupins, field peas, canola, faba beans, chickpeas
WA Central Winter Wheat, barley, oats, triticale, cereal rye, lupins, field peas, canola, faba beans, chickpeas
WA Eastern Winter Wheat, barley, oats, triticale, lupins, field peas, canola, faba beans, chickpeas
WA Sandplain and Mallee
Winter Wheat, barley, oats, triticale, lupins, field peas, canola, faba beans, chickpeas
SA Mid-north – Lower Yorke, Eyre
Winter Wheat, barley, oats, triticale, lupins, field peas, canola, chickpeas, faba beans, vetch, safflower
SA - Victoria Mallee Winter Wheat, barley, oats, triticale, cereal rye, lupins, vetch, canola, field peas, chickpeas, faba beans, safflower
SA - Victoria Border – Wimmera
Winter Wheat, barley, oats, triticale, lupins, field peas, canola, chickpeas, faba beans, vetch, lentils, safflower
Victoria High Rainfall Winter Wheat, barley, oats, triticale, lupins, field peas, canola
NSW - Victoria Slopes Winter Wheat, barley, oats, triticale, lupins, field peas, canola
NSW Central Winter Wheat, barley, oats, chickpeas, triticale, faba beans, lupins, field peas, canola, safflower
Summer Sorghum, sunflowers, maize, mungbeans, soybeans, cotton
NSW North West - Qld South West
Winter Wheat, barley, oats, chickpeas, triticale, faba beans
Summer Sorghum, sunflowers, maize, mungbeans, soybeans, cotton
NSW North East - Qld South East
Winter Wheat, barley, oats, chickpeas, triticale, faba beans, millet/panicum, safflower, linseed
Summer Sorghum, sunflowers, maize, mungbeans, soybeans, peanuts, cotton
Qld Central Winter Wheat, barley, oats, chickpeas
Summer Sorghum, sunflowers, maize, mungbeans, soybeans, cotton
Tasmania Winter Wheat, barley, oats, triticale, lupins, field peas, canola
Data source: AEGIC

7 GRAIN GROWERS LIMITED STATE OF THE AUSTRALIAN GRAIN INDUSTRY 2016
Australian grain production is dominated by winter crops, sown between March and June depending on geographical location and the timing of rainfall.
Winter production is supplemented by summer grain production across Queensland and northern, and increasingly more widely into southern, NSW. Most cropping regions across Australia can only produce one crop per year, but some areas can produce both a summer and winter crop each year due to favourable soil types and climate.
Wheat is the mainstay of the Australian grains industry (accounting for 56% of total grain tonnes produced), followed by barley (18%), canola (8%), sorghum (4%), oats (3%) and a range of pulses (collectively 5%).
This proportionate share between the different crops is typical of Australian grain production over the long term, although the relative proportion of canola and pulses has increased more recently — total grain production also has increased and averages more
FIGURE 2.2 Area of grains sown by state and season
25
20
15
10
5
0
2005
–06
2006
–07
2007
–08
2008
–09
2009
–10
2010
–11
2011
–12
2012
–13
2013
–14
2014
–15
2015
–16
Are
a so
wn
to g
rain
s (m
ha)
SA
WA
Vic
Qld (winter)
Qld (summer)
NSW (winter)
NSW (summer)
386874072969966645
5593776
414164773082808545
5671338
413172653375873791
6312398
3979789934921208746
6295402
3783827134881173514
6106381
3821771534571217790
6158713
3838825234111205783
5969757
3776809734571222687
5852711
3448824932841105559
5314568
3426828931811048727
5389439
3568841832631134759
5674468
Area per state sown to grains (’000ha)
Data source: ABARES (2016)
than 45mt. Production has increased as a result of increased yields (up 33% for winter crops and 14% for summer crops, on the previous five years), and increased area sown to grains (up 2.5% on five years to 2010). This increase in area sown to grains is not necessarily a net increase in agricultural land areas, rather a resumption of cropping on land that was not cropped, or used instead for livestock grazing, during the previous five years.
The increase in average production in the five years leading up to 2015 needs to be considered in the context of the drier-than-average conditions experienced during the decade leading up to 2010. Output is higher compared with the long-term averages. However the large increases of the immediate past periods reflect a return to long-term trends. On the basis of long-term production (Figure 2.4), the yield of winter crops, such as wheat, have only increased at a rate of 1% annually (0.94%), and the average annual rate of yield increase has slowed during the past 20 years. The oft-quoted
8GRAIN GROWERS LIMITED STATE OF THE AUSTRALIAN GRAIN INDUSTRY 2016
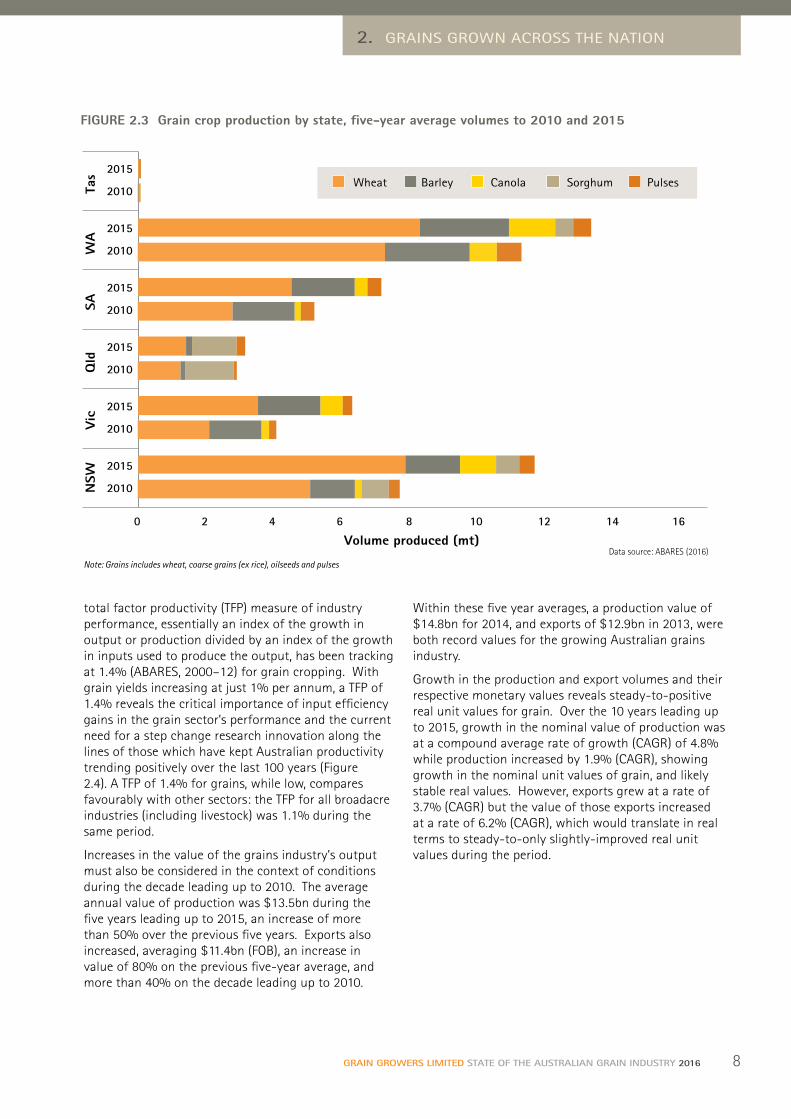
FIGURE 2.3 Grain crop production by state, five-year average volumes to 2010 and 2015
16 0 2 4 6 8 10 12 14
2010
2015
2010
2015
2010
2015
2010
2015
2010
2015
2010
2015
NSW
Vic
Q
ld
SA
WA
Ta
s
Volume produced (mt)
Wheat Barley Canola Sorghum Pulses
2. GRAINS GROWN ACROSS THE NATION
Data source: ABARES (2016) Note: Grains includes wheat, coarse grains (ex rice), oilseeds and pulses
total factor productivity (TFP) measure of industry performance, essentially an index of the growth in output or production divided by an index of the growth in inputs used to produce the output, has been tracking at 1.4% (ABARES, 2000–12) for grain cropping. With grain yields increasing at just 1% per annum, a TFP of 1.4% reveals the critical importance of input efficiency gains in the grain sector’s performance and the current need for a step change research innovation along the lines of those which have kept Australian productivity trending positively over the last 100 years (Figure 2.4). A TFP of 1.4% for grains, while low, compares favourably with other sectors: the TFP for all broadacre industries (including livestock) was 1.1% during the same period.
Increases in the value of the grains industry’s output must also be considered in the context of conditions during the decade leading up to 2010. The average annual value of production was $13.5bn during the five years leading up to 2015, an increase of more than 50% over the previous five years. Exports also increased, averaging $11.4bn (FOB), an increase in value of 80% on the previous five-year average, and more than 40% on the decade leading up to 2010.
Within these five year averages, a production value of $14.8bn for 2014, and exports of $12.9bn in 2013, were both record values for the growing Australian grains industry.
Growth in the production and export volumes and their respective monetary values reveals steady-to-positive real unit values for grain. Over the 10 years leading up to 2015, growth in the nominal value of production was at a compound average rate of growth (CAGR) of 4.8% while production increased by 1.9% (CAGR), showing growth in the nominal unit values of grain, and likely stable real values. However, exports grew at a rate of 3.7% (CAGR) but the value of those exports increased at a rate of 6.2% (CAGR), which would translate in real terms to steady-to-only slightly-improved real unit values during the period.

9 GRAIN GROWERS LIMITED STATE OF THE AUSTRALIAN GRAIN INDUSTRY 2016
FIGURE 2.5 Australia’s contribution to world wheat production
Data source: USDA (2016)
FIGURE 2.4 Historical Australian wheat yields
2.5
2.0
1.5
1.0
0.5
0
Yiel
d (t
/ha)
Average annual yield
Average dicennial yield
1880 1890 1900 1910 1920 1930 1940 1950 1960 1970 1980 1990 2000 2010
Nutrientexhaustion
Superphosphate, fallowing, newvarieties
Better rotations,legume nitrogen,mechanisation,N fertiliser
Semi-dwarf cultivars, selective herbicides
No-tillfarming
Milleniumdrought
Acknowledgement: The CM Donald Australian Wheat Yield diagram (Williams, 1990) has been updated with data sourced from ABS and ABARES.
25
20
15
10
5
0
800
700
600
500
400
300
200
100
0
Shar
e of
wor
ld w
heat
pro
duct
ion
(%)
Wor
ld w
heat
pro
duct
ion
(mt)
2011 2012 2013 2014 2015 2016
European UnionChinaIndia
UkrainePakistanAustralia
TurkeyIranKazakhstan
Argentina
World wheat production (RH axis)
RussiaUnited StatesCanada
est

10GRAIN GROWERS LIMITED STATE OF THE AUSTRALIAN GRAIN INDUSTRY 2016
Wheat Australia’s annual wheat production has averaged close to 25mt in recent years (compared with 18.5mt during the five years leading up to 2010); accounting for 56% of Australian grain production. This volume makes Australia a small producer in the global context (Figure 2.5), accounting for just 3–4% of annual international wheat production. However, accounting for 10–15% of global wheat exports, with variability dependent on domestic supply, Australia is an important player in the global wheat trade.
Australian wheat is sought after for its high flour extraction rates, bright white flour colour, low moisture content, white seed coat, fit-for-purpose protein levels and starch qualities. Together these attributes mean Australian wheat produces quality flour with versatility
to suit a wide variety of end-uses. Domestically Australian wheat meets almost 100% of Australia’s wheat needs. Internationally, Australian wheat is sought for Asian noodles, pasta, bread and other baked goods, pastries, cakes and biscuits. Importantly, high extraction rates provides purchasers of Australian wheat with value for money, while low moisture levels also ensure Australian wheat can be stored for long periods without spoiling.
Export demand for Australian grain, including wheat, has been building for most of the past decade. The total value of Australian wheat exports more than doubled since the mid-2000s to now be some $6 billion per annum. This reflects increased export volumes as well as firm prices.
Growth in output of wheat in Australia is due to increases in the area of wheat planted annually, rather than long term yield increases (Figure 2.6).
FIGURE 2.6 Area and yield of Australian wheat
18
16
14
12
10
8
6
4
2
0
4.5
4.0
3.5
3.0
2.5
2.0
1.5
1.0
0.5
0
Are
a so
wn
(mha
)
Yiel
d (t
/ha)
Area sown (LH axis) Yield (RH axis)
1991
1992
1993
1994
1995
1996
1997
1998
1999
2000
2001
2002
2003
2004
2005
2006
2007
2008
2009
2010
2011
2012
2013
2014
2015
Data source: ABARES
2. GRAINS GROWN ACROSS THE NATION
Images courtesy AEGIC and Ben WhiteABOVE: Wheat
11 GRAIN GROWERS LIMITED STATE OF THE AUSTRALIAN GRAIN INDUSTRY 2016
This is contrary to the global picture where yield increases have been important in increasing world production. The slow per-unit increase in wheat productivity in Australia reflects increasing environmental production challenges, but also an absence of step-change innovation in grains production (Figure 2.4).
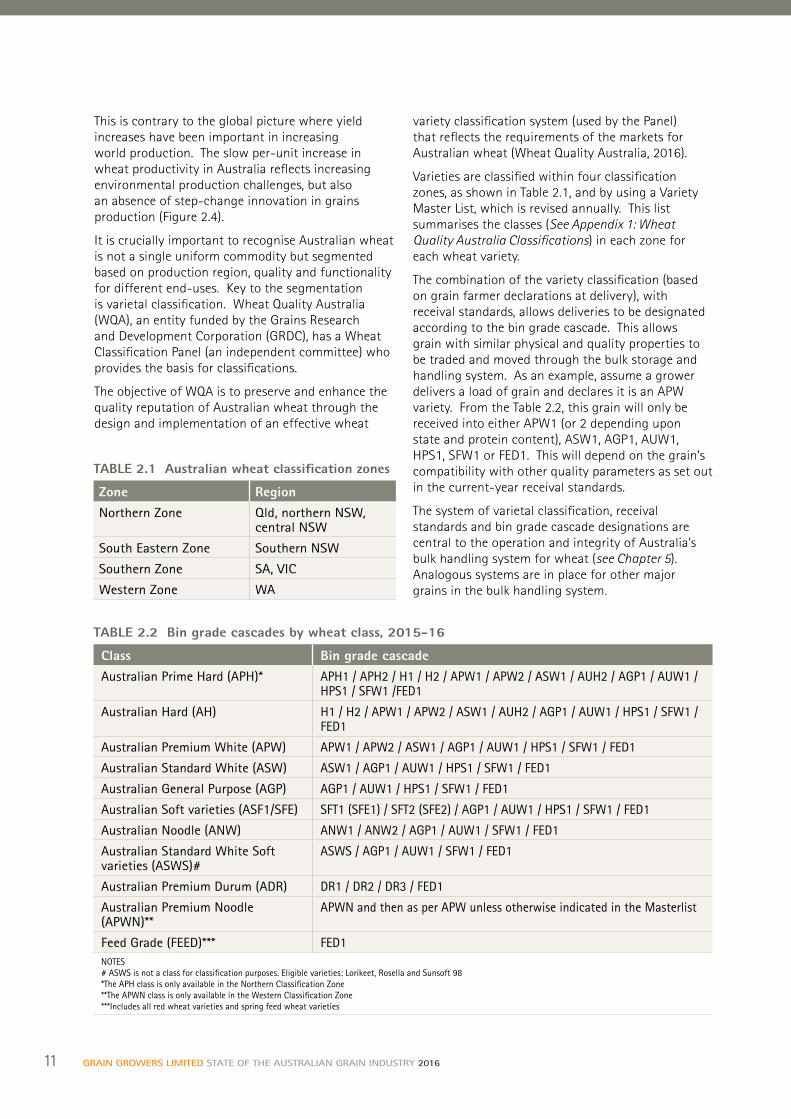
It is crucially important to recognise Australian wheat is not a single uniform commodity but segmented based on production region, quality and functionality for different end-uses. Key to the segmentation is varietal classification. Wheat Quality Australia (WQA), an entity funded by the Grains Research and Development Corporation (GRDC), has a Wheat Classification Panel (an independent committee) who provides the basis for classifications.
The objective of WQA is to preserve and enhance the quality reputation of Australian wheat through the design and implementation of an effective wheat
variety classification system (used by the Panel) that reflects the requirements of the markets for Australian wheat (Wheat Quality Australia, 2016).
Varieties are classified within four classification zones, as shown in Table 2.1, and by using a Variety Master List, which is revised annually. This list summarises the classes (See Appendix 1: Wheat Quality Australia Classifications) in each zone for each wheat variety.
The combination of the variety classification (based on grain farmer declarations at delivery), with receival standards, allows deliveries to be designated according to the bin grade cascade. This allows grain with similar physical and quality properties to be traded and moved through the bulk storage and handling system. As an example, assume a grower delivers a load of grain and declares it is an APW variety. From the Table 2.2, this grain will only be received into either APW1 (or 2 depending upon state and protein content), ASW1, AGP1, AUW1, HPS1, SFW1 or FED1. This will depend on the grain’s compatibility with other quality parameters as set out in the current-year receival standards.
The system of varietal classification, receival standards and bin grade cascade designations are central to the operation and integrity of Australia’s bulk handling system for wheat (see Chapter 5). Analogous systems are in place for other major grains in the bulk handling system.
TABLE 2.2 Bin grade cascades by wheat class, 2015-16
Class Bin grade cascade
Australian Prime Hard (APH)* APH1 / APH2 / H1 / H2 / APW1 / APW2 / ASW1 / AUH2 / AGP1 / AUW1 / HPS1 / SFW1 /FED1
Australian Hard (AH) H1 / H2 / APW1 / APW2 / ASW1 / AUH2 / AGP1 / AUW1 / HPS1 / SFW1 / FED1
Australian Premium White (APW) APW1 / APW2 / ASW1 / AGP1 / AUW1 / HPS1 / SFW1 / FED1
Australian Standard White (ASW) ASW1 / AGP1 / AUW1 / HPS1 / SFW1 / FED1
Australian General Purpose (AGP) AGP1 / AUW1 / HPS1 / SFW1 / FED1
Australian Soft varieties (ASF1/SFE) SFT1 (SFE1) / SFT2 (SFE2) / AGP1 / AUW1 / HPS1 / SFW1 / FED1
Australian Noodle (ANW) ANW1 / ANW2 / AGP1 / AUW1 / SFW1 / FED1
Australian Standard White Soft varieties (ASWS)#
ASWS / AGP1 / AUW1 / SFW1 / FED1
Australian Premium Durum (ADR) DR1 / DR2 / DR3 / FED1
Australian Premium Noodle (APWN)**
APWN and then as per APW unless otherwise indicated in the Masterlist
Feed Grade (FEED)*** FED1NOTES# ASWS is not a class for classification purposes. Eligible varieties: Lorikeet, Rosella and Sunsoft 98*The APH class is only available in the Northern Classification Zone **The APWN class is only available in the Western Classification Zone ***Includes all red wheat varieties and spring feed wheat varieties
TABLE 2.1 Australian wheat classification zones
Zone Region
Northern Zone Qld, northern NSW, central NSW
South Eastern Zone Southern NSW
Southern Zone SA, VIC
Western Zone WA

12GRAIN GROWERS LIMITED STATE OF THE AUSTRALIAN GRAIN INDUSTRY 2016
FIGURE 2.7 Value of coarse grain production in Australia
Val
ue (
$b)
3.0
2.5
2.0
1.5
1.0
0.5
0
1991
1992
1993
1994
1995
1996
1997
1998
1999
2000
2001
2002
2003
2004
2005
2006
2007
2008
2009
2010
2011
2012
2013
2014
2015
Barley$568m
Barley$2453m
Grain sorghum$977m
Grain sorghum$647m
Oats$209m
Oats$256m
Triticale$168m
Triticale$55m
Data source: ABARES
Coarse grainsCoarse grains are cereal grains other than wheat and rice, and are generally distinguished into the category on the basis of their primary end use (in developed countries), for example animal feed or brewing. In Australia the main coarse grains grown are: barley, sorghum, oats and triticale.
The value of coarse grain has increased dramatically in recent years, driven by stronger export demand and buoyant demand from the domestic livestock sector. The total value of Australia’s barley crop increased dramatically from $1.04bn during 2006–07 to a record high of $2.45bn in 2013–14. The value of Australia’s sorghum crop has also increased during this period
and is currently running at an average of just less than $0.5bn. The value of the sorghum crop is well under the record 2006–07 crop, which was valued at close to $1bn.
Despite a marked increase in the value (Figure 2.7) of Australia’s coarse grain crop, planted area has not responded to increased demand. Wheat and oilseed production have expanded significantly under similar demand scenarios but similar expansion is not yet evident for coarse grains (Figure 2.8).
Barley
Barley is subject to a similar classification to wheat, where barley varieties are allocated to grades based on malting qualities. The classification process aims to deliver grain of consistent physical quality, processing
2. GRAINS GROWN ACROSS THE NATION
Images courtesy Megan Hele and AEGICABOVE: Barley

13 GRAIN GROWERS LIMITED STATE OF THE AUSTRALIAN GRAIN INDUSTRY 2016
performance and end-product quality to customers and end-users. Barley Australia (BA) manages the malting barley variety classification and a barley variety list is generated annually, which identifies all of the varieties acceptable for delivery into malt, food or feed grades.
Despite Australian barley production of 8.2mt per annum, representing just 5% of global production, Australia is the world’s largest exporter of barley representing more than 30% of the malting barley trade and about 20% of global feed barley trade. Malting barley is used primarily to produce
alcohol (beer and distilled spirits such as Shochu, a Japanese distilled spirit), and food products including confectionary, snack foods, breakfast cereals, miso and barley tea.
Oats
Oats are grown for both human consumption, where they are readily incorporated in a range of breakfast foods, bakery goods, baby foods, beverages and health foods, and are also a valuable feed grain, especially in the horse racing industry. The demand for oats has risen during recent years due to
FIGURE 2.8 Area of coarse grains planted in AustraliaA
rea
sow
n (m
ha)
8
6
4
2
0
100
90
80
70
60
50
Barl
ey a
s a
prop
orti
on o
f co
arse
gra
ins
(%)
2007
2008
2009
2010
2011
2012
2013
2014
2015
2016
Other coarse grains
Barley
Barley as a proportion of coarse grains (RH axis)
est
Data source: ABARES
13 GRAIN GROWERS LIMITED STATE OF THE AUSTRALIAN GRAIN INDUSTRY 2016
Images courtesy AEGICABOVE: Oats
14
increased recognition of the health properties of the grain (the Grains and Legume Nutrition Council (GLNC) cites research that demonstrates oats role in assisting to lower blood cholesterol levels, and reducing the risk factors for heart disease). Production of oats, on the other hand, has been static and is yet to be stimulated into expansion. In fact, the 1.15mt of oats grown in Australia during 2014–15 is consistent with the short-term average, and down on long-term production volumes. Internationally, Australia has a reputation as a world leader in growing high-quality milling oats for the export market, with Australian oats valued for their health and nutritional benefits, low moisture, ease of processing, grain colour and brightness and the clean, green environment in which they are grown.
During 2014–15, Australia exported 270,000t of oats, pushing the five-year average close to 200,000t, which is some 50,000t ahead of the average during the five years leading up to 2010.
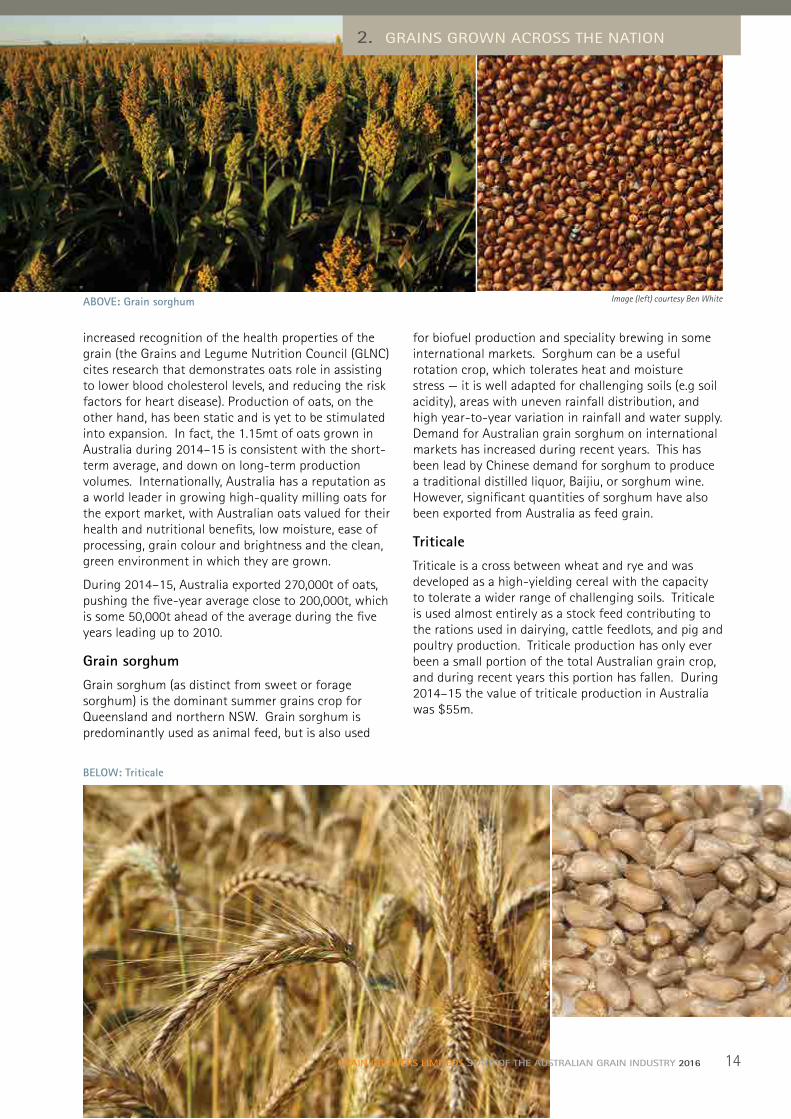
Grain sorghum
Grain sorghum (as distinct from sweet or forage sorghum) is the dominant summer grains crop for Queensland and northern NSW. Grain sorghum is predominantly used as animal feed, but is also used
for biofuel production and speciality brewing in some international markets. Sorghum can be a useful rotation crop, which tolerates heat and moisture stress — it is well adapted for challenging soils (e.g soil acidity), areas with uneven rainfall distribution, and high year-to-year variation in rainfall and water supply. Demand for Australian grain sorghum on international markets has increased during recent years. This has been lead by Chinese demand for sorghum to produce a traditional distilled liquor, Baijiu, or sorghum wine. However, significant quantities of sorghum have also been exported from Australia as feed grain.
Triticale
Triticale is a cross between wheat and rye and was developed as a high-yielding cereal with the capacity to tolerate a wider range of challenging soils. Triticale is used almost entirely as a stock feed contributing to the rations used in dairying, cattle feedlots, and pig and poultry production. Triticale production has only ever been a small portion of the total Australian grain crop, and during recent years this portion has fallen. During 2014–15 the value of triticale production in Australia was $55m.
GRAIN GROWERS LIMITEDS STATE OF THE AUSTRALIAN GRAIN INDUSTRY 2016
2. GRAINS GROWN ACROSS THE NATION
Image (left) courtesy Ben WhiteABOVE: Grain sorghum
BELOW: Triticale

15 GRAIN GROWERS LIMITED STATE OF THE AUSTRALIAN GRAIN INDUSTRY 2016
Pulses‘Pulses’ is the collective term used to describe leguminous broadacre crops harvested for their dry grains. The five major pulses grown in Australia are: chickpeas, field peas, lentils, lupins and faba beans. Smaller, or niche, crops include mungbeans, broad beans, azuki (adzuki) beans, navy beans, cow peas and pigeon peas. About 2mt of pulses are produced annually in Australia (Figure 2.9). This represents around 3% of world production, which is dominated by India (24% of world production). Australian pulse exports have averaged 1.8mt in recent years, double that of pulse exports in the period ending 2010. This has been driven by a surge in chickpea production and export, and for a range of less-widely planted
pulses. This has been prompted primarily by more buoyant and consistent world prices for pulses in recent years on the back of a couple of failed monsoons in India.
The Australian pulse industry’s growth is one of the keys to the future sustainability of the whole Australian grains industry because of its importance in enhancing cereal cropping systems. In 2016 Australia’s pulse industry joined in celebrations associated with the International Year of Pulses — a year aimed at raising awareness of the nutritional benefits and culinary diversity of pulses.
Pulses can provide a profitable cropping option and add to the success of the whole farm enterprise as part of a longer-term cropping rotation. When included in cereal and oilseed rotations, pulses contribute to improved soil fertility through their
3.0
2.5
2.0
1.5
1.0
0.5
0
Ann
ual p
ulse
pro
duct
ion
2007-08 2008–09 2009–10 2010-11 2011-12 2012-13 2013-14 2014-15
Production (mt)
Area planted (mha)
Gross value of production ($b)
Data source: ABARES (2015)
FIGURE 2.9 Australian pulse production
Image (left) courtesy AEGICABOVE: Lupins

16
ability to fix nitrogen, can provide a disease break and support more effective weed and pest control through integrated management strategies.
Pulses are used in both the human food and livestock feed grain markets. In many human consumption markets, pulses are used unprocessed and consumed whole or split.
OilseedsCanola is the third-most valuable crop to the Australian grains industry, with production increasing dramatically during recent years so that the average annual production was 3.4mt for the five years to 2015. A record 4.1mt were produced in 2012–13 (Figure 2.10).
Between 2009–10 and 2012–13 the export value of the Australian canola crop increased almost four-fold, reaching nearly $2.1bn.
Increased production is driven by increased grower plantings of genetically modified (GM) varieties of canola, especially in WA, and to a lesser, though still a significant extent across NSW, Victoria and Queensland (Figure 2.11).
Cottonseed is the second-most important oilseed grown in Australia, and is a joint-product of cotton production. Increased production of cottonseed is therefore a supply response due to higher cotton prices during 2010–11 and the opening up of new areas for cotton production across southern NSW.
GRAINGROWERS STATE OF THE AUSTRALIAN GRAIN INDUSTRY 2016
FIGURE 2.10 Oilseed production in Australia
4.5
4.0
3.5
3.0
2.5
2.0
1.5
1.0
0.5
0
Oils
eed
prod
ucti
on (
mt)
Canola
Other (includes linseed, sunflowers, peanuts, safflower and soybeans)
Cottonseed
1999–2000 2001–02 2003–04 2009–102007–08 2011-122005–06 2013-14
4.14mt
1.73mt
Data source: ABARES
2. GRAINS GROWN ACROSS THE NATION
Image (right) courtesy AEGICABOVE: Canola

17 GRAIN GROWERS LIMITED STATE OF THE AUSTRALIAN GRAIN INDUSTRY 2016
Other oilseeds grown in Australia include: sunflower, safflower, linseed and peanuts. Australia also produces small quantities of the world’s largest oilseed crop — soybeans.
These lesser-grown oilseeds are primarily grown as summer crops in Queensland and northern NSW, whereas canola is grown as a winter crop across all winter cropping zones of Australia.
Genetically modified grainsGenetically modified crops contain a modified genome following the incorporation of genetic material. This genetic material is incorporated into the plant because it codes for desirable traits, such as resistance to biotic (e.g. pests) and abiotic (e.g. herbicides, salinity, drought) stresses, and enhanced nutritional value and end-product aesthetics. To date, the most prevalent GM crops contain single GM-derived traits for herbicide or pest resistance. However, the development of GM crops has progressed towards complex additions of multiple, ‘stacked’ traits within a single GM crop variety.
The status quo
Canola and cotton are the only commercially-grown GM crops in Australia. GM cotton crops were planted soon after they became commercially available in 1996. Since then, uptake of GM cotton in Australia has been strong — driven by significant agronomic benefits associated with the technology. More than 99% of planted cotton in Australia is GM1.
While GM canola was approved for commercialisation in Australia during 2003, the first plantings did not occur until 2008. This delay was mostly attributable to the industry taking time to develop a comprehensive supply chain management system to segregate GM canola.
Adoption of GM canola in Australia has been modest relative to worldwide trends; however, the rate of adoption has increased during recent years, especially in WA (Figure 2.11). By 2015 GM canola accounted for 30% of canola plantings by area in WA, and 13% and 11% in Victoria and NSW respectively. South Australia and Tasmania maintain a moratorium on the commercial cultivation of GM food crops (Figure 2.12).
FIGURE 2.11 Adoption of GM canola by state
400
300
200
100
0
35
30
25
20
15
10
5
0
Tota
l are
a pl
ante
d (’00
0ha)
Prop
orti
on s
own
to G
M c
anol
a (%
)
NSWVicWANational
NSWVicWANational
Proportion sown toGM canola (RH axis)
Area sown to canola (LH axis)
2009 2010 2011 2012 2013 2014 2015
Data source: Australian Oilseeds Federation and Monsanto
1Note: GM cotton is of interest to the grains industry because cottonseed is an oilseed. Cottonseed oil is used widely by the commercial food industry due to its superior deep frying properties. Cottonseed meal may also be used as part of animal feed rations.

18GRAIN GROWERS LIMITED STATE OF THE AUSTRALIAN GRAIN INDUSTRY 2016
2. GRAINS GROWN ACROSS THE NATION
FIGURE 2.12 State and territory regulation of GM crops
NorthernTerritory
SouthAustralia
WesternAustralia
Queensland
Victoria
Tasmania
New South Wales
ACT
Source: Adapted from ABCA (2015)
NORTHERN TERRITORYn Gene Technology Act 2004
– No GM crop moratorium
– No commercial cultivation of GM crops
WESTERN AUSTRALIAn Gene Technology Act 2006n Genetically Modified Crop
Free Areas Act 2003– Moratorium on commercial
cultivation of GM crops
– Whole-of-state designated GM-free area
– Exemptions for commercial production of approved GM cotton since 2008 and GM canola since 2010
SOUTH AUSTRALIA
n Gene Technology Act 2001n Genetically Modified Crops
Management Act 2004– Moratorium on
commercial cultivation and transport of GM food crops and/or seed
– Whole-of-state designated GM free area
– Exemptions granted for field trials under specific conditions
VICTORIA
n Gene Technology Act 2001n Control of GM Crops Act 2004
– No current orders in place
– Commercial cultivation of GM canola since 2008
NEW SOUTH WALES
n Gene Technology (NSW) Act 2003
n Gene Technology (GM Crop Moratorium) Act 2003– Moratorium on
commercial cultivation of GM food crops
– GM cotton exempt from moratorium and commercially cultivated
– Exemptions for commercial cultivation of GM canola granted in 2008
TASMANIA
n Gene Technology (Tasmania) Act 2012n Genetically Modified Organisms Control
Act 2004– Moratorium on commercial cultivation of
all GM crops
– Whole-of-state designated GM free area
QUEENSLANDn Gene Technology Act 2001
– No GM crop moratorium
– Large-scale commercial cultivation of GM cotton
AUSTRALIAN CAPITAL TERRITORYn Gene Technology
(GM Crop Moratorium) Act 2004– Moratorium on
commercial cultivation of GM crops
– Exemptions for commercial cultivation of GM canola granted in 2008

19 GRAIN GROWERS LIMITED STATE OF THE AUSTRALIAN GRAIN INDUSTRY 2016
2Note: The Western Australian State Government has also announced that the state’s Genetically Modified Crop Free Areas Act 2003 will be repealed prior to the state election in March 2017.
Adoption of GM canola has been limited by variable economic returns, compared to additional costs, and regulatory restrictions. The decision to grow GM canola is based on more than potential annual returns, although there is evidence that having the option to grow GM canola does benefit Australian grain growers — GM canola growers report benefits such as more effective weed control, reduced overall pesticide use and improved farming practices (such as enhanced conservation tillage), lower risk of developing herbicide resistance and a lower environmental footprint (GRDC, 2014).
Future GM production
There has been an increase in the number of GM field trials carried out in Australia across a range of crops including: wheat, barley, safflower and canola, though most research interest has been in developing GM wheat. GM traits observed in field trials include: nutrient and water use efficiency, resistance to abiotic and biotic stress, improved grain quality and modified oils, such as super-high oleic acid and omega 3 for improved human health outcomes.
Potential commercial release of varieties with these GM traits could be as soon as 2018 with releases more likely for new GM canola varieties than the other grains. Timing for release of GM cereals remains uncertain due to technical challenges and potential lack of acceptance from some markets. Before adopting new GM grain options, the Australian industry will need to consider market needs on a case by case basis — some of Australia’s largest export markets maintain supply and price as their highest priority for grain imports, while others are sensitive to GM food products.
In Australia, national regulatory oversight of GM crops is provided for under the Gene Technology Act 2000, administered by an independent statutory office holder, known as the Gene Technology Regulator, and supported by the Office of the Gene Technology Regulator (OGTR). The OGTR oversees GM crop field trials and commercialisation on a national basis and state and territory governments contribute additional and variable layers of regulation to Australia’s GM regulatory framework (Figure 2.12).
South Australia is currently the only of the major grain-producing states to have a complete ban on commercial GM grain crop production, although exemptions are given for GM crop field trials. This ban is scheduled for review during 2019.
Western Australia, NSW and Victoria all have current moratoria legislation, however, commercial GM crop production is allowed in these states, as WA2 and NSW have specific ministerial exemptions and Victoria allowed the order made under their GM regulation legislation to expire.
GM canola is treated as a separate commodity to non-GM canola in production and supply chain management in Australia. In consideration of market and regulatory requirements, the grains industry has developed canola supply chain protocols and processes, and technical principles and practices. In the possible event of a GM segregation failure through the supply chain, the Australian grains industry has developed measures to prevent the grain trade from being compromised. Through the Grain Trade Australia (GTA) GM Grain Industry Consultative Committee, the industry maintains an agreed cross-sector process detailing notifications, industry-wide response options and communication strategies to be adopted should there be an unapproved GM event. This is especially important given some of Australia’s key domestic and export grain markets are sensitive to GM products.
In recent years, a range of new breeding techniques3 have been developed that can produce desired traits in a crop using only the genetic material that occurs naturally within the genome of that crop and related species. These new techniques differ significantly from traditional GM technology in that they do not require the introduction of foreign genetic material (transgenes) to express a desired trait. In this way, the new techniques effectively speed up the breeding process to achieve a desired crop line in a shorter time than would otherwise be achievable through traditional breeding methods.
20GRAIN GROWERS LIMITED STATE OF THE AUSTRALIAN GRAIN INDUSTRY 2016
2. GRAINS GROWN ACROSS THE NATION
The OGTR is yet to classify the new breeding techniques as GM or non-GM. If classified as GM, crops developed using the techniques will be subject to the same regulations as traditional GM crops. The OGTR’s legal determination on the GM/non-GM status of the new plant breeding techniques will influence their adoption and impact the associated regulatory, economic and trade implications.
The market for GM seed has become increasingly concentrated and dominated by multinational corporations over the past few decades. Between 1985 and 1996, the global market share of the top nine seed companies increased modestly from 12.7% to 16.7%, and a multinational (a company operating in several countries) owned only one of these companies. By 2009, however, three seed companies (i.e. Monsanto, Du Pont-Pioneer, and Syngenta — all of which are operated by multinationals) accounted for more than half of the global seed market. The concentration of the seed market (in terms of the number of available GM seed suppliers) and the increase in the share of multinationals can be attributed to a trend of multinationals acquiring small-to-medium-sized seed companies. In addition, as these large multinationals pursue vertical integration strategies (such that they own the companies undertaking GM research and development and hold GM seed patents, as well as the companies distributing the seed), GM crop research has become increasingly privatised and concentrated among these large patent-holding multinational companies, rather than universities, smaller companies or public organisations (Howard, 2009).
While market concentration has led to economies of scale for GM research and seed distribution, it has also reduced competition in the market and there is concern this has negative price implications for growers. In addition, there are concerns the dominance of private research is leading to a concentration of GM research for short-term profit objectives on a limited range of crops. Although these concerns have largely been raised in the context of the United States, it highlights the importance of maintaining competition in the Australian market for GM seed supply and research, not only to ensure fair pricing for farmers but also to ensure longer-term basic GM research is undertaken.
The future grains mixThe Australian grains industry relies on multiple grain crops and within each grain type, multiple varieties. The capacity to substitute grain crops and varieties is fundamental to managing risk in grain-growing businesses and supporting the capacity to respond to increased exposure to global market dynamics that comes with an internationally exposed industry.
Achieving the balance between the grains mix that meets and manages the environmental challenges into the future, as well as maintaining competitiveness on the international stage will be increasingly difficult. Key to achieving this balance will be the development of new and improved varieties, and enhanced production methods. Navigating the future of GM technologies for grain production will be just one, albeit likely fundamental, piece of this puzzle for the Australian grains industry as a whole and for the farm businesses that produce Australia’s grain.
3These new techniques include targeted mutagenesis, cisgenesis, intragenesis and gene silencing.
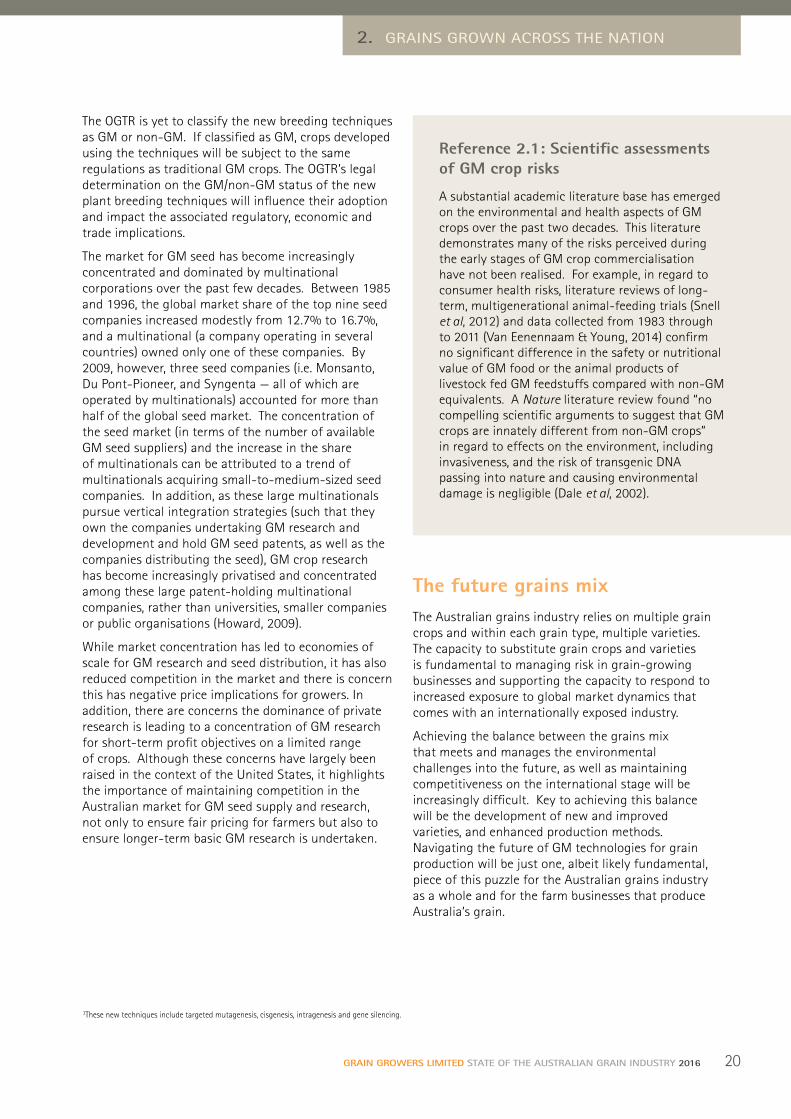
Reference 2.1: Scientific assessments of GM crop risks
A substantial academic literature base has emerged on the environmental and health aspects of GM crops over the past two decades. This literature demonstrates many of the risks perceived during the early stages of GM crop commercialisation have not been realised. For example, in regard to consumer health risks, literature reviews of long-term, multigenerational animal-feeding trials (Snell et al, 2012) and data collected from 1983 through to 2011 (Van Eenennaam & Young, 2014) confirm no significant difference in the safety or nutritional value of GM food or the animal products of livestock fed GM feedstuffs compared with non-GM equivalents. A Nature literature review found “no compelling scientific arguments to suggest that GM crops are innately different from non-GM crops” in regard to effects on the environment, including invasiveness, and the risk of transgenic DNA passing into nature and causing environmental damage is negligible (Dale et al, 2002).
21 GRAIN GROWERS LIMITED STATE OF THE AUSTRALIAN GRAIN INDUSTRY 2016
3. THE BUSINESS OF GROWING GRAIN
Consolidation continuesThe trend of consolidation in grain production has continued during the five years leading up to 2015, as farmers pursue economies of scale. The number of farms growing grain as their primary, or a significant component of, agricultural output is 20,7004, down by close to 2500 since 2010. The average size of farms focusing on growing grain has increased from 2510ha in 2010 to 2607ha in the five years to 2015 (ABARES, 2016). In 1990 there were close to 30,000 farms growing grain and the average farm size of grain farms was 1082ha (ABARES).
Consolidation in production has been a feature across Australian agriculture, but the trend is most marked in grain production. Concentration, measured as the rate of increase in average size of operations adjusted for net growth in the total industry as reported in ABARES survey data
(ABARES, 2016), in grain production outstripped that of beef production by a factor of six during the period since 2000. Moreover, since 2010 the rate of consolidation in grain production has increased by a factor of 1.5 over the long-term trend. Meanwhile, concentration in livestock production has slowed, and in some cases, such as for sheep farms, some disaggregation has occurred.
Mostly positive returnsHigher average cash incomes for specialist grain farms, especially during the past five years, has no doubt been a result of increased returns following expansion in scale but also supported by an increased impetus to concentrate on grain production through relative price shifts. A further factor for many grain farmers will be the increasing sophistication of their marketing and risk management strategies. Average farm cash incomes for specialist grain farms
Improved seasons, lower growth in costs and partial buffering from global price declines has improved the fortunes of Australian grain farm businesses, on the whole, over the past five years. Consolidation and the resulting economies of scale have assisted in delivering productivity gains. Interestingly this consolidation has not necessarily led to the relinquishing of family businesses to corporate entities. Regardless of ownership, size and short-term returns, the challenge of international competitiveness is constant.
4ABARES reports there to be 9200 farms where wheat and other crops account for more than 70% of production activity, and 11,500 farms classified as mixed farms producing wheat and other crops, as well as livestock. ABARES estimates of farm numbers vary from the Australian Bureau of Statistics Agricultural Census because the ABS includes all entities with an estimated annual value of operations greater than $5000. ABARES counts an establishment as a farm business if it has an estimated annual value of agricultural operations of $40,000 or more.
Image courtesy Rural Photos

22GRAIN GROWERS LIMITED STATE OF THE AUSTRALIAN GRAIN INDUSTRY 2016
A family affairThe value of family farm ownership in the cropping sector has been revealed over the period with large family grain farms achieving rates of return close to 5.5% and corporate large grain farms achieving just less than 3.5% (ABARES). Family farm ownership continues to dominate grain production with more than more than 95% of grain farms being family owned and operated. The owner-operator model is expected to continue to dominate and while there will be ongoing interest from different types of capital, these investors need to be conscious of the strengths the family farm model can bring to grain production and agriculture more broadly. Increasingly, especially as education and off-farm experience is brought to bear in family operations, the strengths of a corporate model are being incorporated in family-owned and managed operations.
increased by almost 50% during 2015 over the previous decade, while the average increase for all broadacre farms was just less than 30%, and from a lower base (Figure 3.1).
A more readily-comparable picture of the relative performance of grain farm businesses is given by rates of return on capital for farm operations (excluding capital appreciation) (Figure 3.2). ABARES reports that while the rate of return for all of agriculture improved from 0.48% during the five years to 2010, to an average of 1.73% during the five years to 2015, the average rate of return for cropping enterprises improved from 1.82% to 4.23% over the same periods; confirming both the improved performance of cropping enterprises, as well as the continuing above-average performance of cropping enterprises in agriculture. However, this is dominated by the rates of return by cropping enterprises with turnover greater than $1 million (from 4.37% to 6.14% over the period). The rates of return for grain cropping enterprises with less than $0.5 million turnover during the five years leading up to 2010 remain negative on average.
3. THE BUSINESS OF GROWING GRAIN
FIGURE 3.1 Average farm cash incomes by commodity (2015–16 dollars)
Ave
rage
ann
ual c
ash
inco
me
($’0
00)
Wheat and other cropsAll broadacre industriesBeef Dairy
400
350
300
250
200
150
100
50
0
1995
–96
1997
–98
1999
–00
2001
–02
2003
–04
2005
–06
2007
–08
2009
–10
2011
–12
2013
–14
2015
–16
Data source: ABARES

23 GRAIN GROWERS LIMITED STATE OF THE AUSTRALIAN GRAIN INDUSTRY 2016
FIGURE 3.2 Rate of return on total opening capital (excluding capital appreciation) to Australian grain farming
7
6
5
4
3
2
1
0
-1
-2
-3
Rate
of
retu
rn (
%)
Average of five years to 2010Average of five years to 2015
0.48
1.82
-1.83
1.32
4.37
1.73
4.23
-0.34
3.02
6.14
All farms and industries
Grain farms – all
Grain farms – turnover of up
to $0.5m
Grain farms – turnover of
$0.5–1m
Grain farms – turnover of
over $1m
Data source: ABARES
Costs continue to increaseDespite more favourable rates of return during recent years, margins on grain production remain narrow, and increasing input costs continue to put pressure on farm profits and returns. On average, grain businesses have experienced an increase in their larger variable cost items including: fertiliser, oil and fuel, and chemicals. This trend stands despite the increasing size of these operations. The costs of these inputs have increased on a per farm basis (Figure 3.3a) and a per hectare basis (Figure 3.3b). These inputs are almost entirely imported, so the cost base for grain production is highly dependent on dynamics in the key input supply regions of the world, such as the Middle East and China, and the Australian dollar ($AUD) exchange rate.
The depreciation of the $AUD, which peaked (on an average monthly basis) at US$1.10 during 2011 has been fortuitous in softening the effect of declining world grain prices over the same period. This depreciation also increased the cost of the inputs
fuel, fertiliser and chemicals, as well as capital items, such as tractors and headers. The often slower, or incomplete, responsiveness of input price decline in response to an appreciating dollar, compared with favourable grain price improvements and input price increase in relation to a depreciating dollar, mitigates the capacity of Australian grain growers to completely net out the impacts of exchange rate fluctuations. A range of factors including the extent of inventories, hedging and potential market power in the supply chain will all feed into the dynamics of the impact of exchange rate movement on input costs and farm returns.
While these key input costs have increased both on a whole farm and per hectare basis, the cost of interest is a notable exception to the trend. The cost of interest to grain businesses has fallen since 2011 and in real terms has almost fallen to 2005 levels on a per hectare basis. The low interest rate environment of recent times, coupled with declining growth in debt for grain businesses during the past five years, have jointly led to this declining average cost.

24GRAIN GROWERS LIMITED STATE OF THE AUSTRALIAN GRAIN INDUSTRY 2016
FIGURE 3.3 Costs of grain production — per farm (a) and per hectare (b), 2005–15 (2015-16 dollars)
(a)
Cost
of
prod
ucti
on (
$'0
00/f
arm
)
120
100
80
60
40
20
0
Crop and pasture chemicals
200720062005 2008 2009 2010 2011 2012 2013 2014 2015
Advisory services
Contract services
Fertiliser
Fuel oil and lubricants
Interest paid
Seed
Freight
Payment to sharefarmers
Cost
of
prod
ucti
on (
$/h
a)
50
45
40
35
30
25
20
15
10
5
0
Crop and pasture chemicals
200720062005 2008 2009 2010 2011 2012 2013 2014 2015
Advisory services
Contract services
Fertiliser
Fuel oil and lubricants
Interest paid
Seed
Freight
Payment to sharefarmers
Data source: ABARES
3. THE BUSINESS OF GROWING GRAIN
(b)

25 GRAIN GROWERS LIMITED STATE OF THE AUSTRALIAN GRAIN INDUSTRY 2016
However, average debt levels have still continued to rise, just at a slower rate, so grain growers may be exposed in a higher interest rate environment.
Observed increases in contract services, declines in share farming payments and a minor increase in payments for advisor services reflect changes in grain farmers’ approach to operations over time. Increases in the use of contract services, such as harvesting, spraying and planting, as well as in advisory services illustrate the greater reliance on specialised services and professional inputs to profitable operations. Outsourcing key activities is consistent with the labour demands of the aging population of owner/operators in grain businesses (average age of grain growers was 57 years in 2015, up from 54 in 2010), as well as increased scale.
Prices in a global marketGiven the Australian grain industry’s high dependence on export markets (60% or more in most years), the primary influence on Australian domestic grain prices is the prevailing world price for each commodity, and of substitute grains in the market. Global grain prices have been trending downward during the past five years (Figure 3.4) as supply has increased and the rate of growth in demand in key markets has tempered. The net result is that international grain stocks have built up, and prices will remain soft in the foreseeable future. The Australian grains industry has, however, been fortunate to date that a lower $AUD and consistent domestic demand growth have softened the decline in farm gate prices received for most grains (Figure 3.5).
FIGURE 3.4 World grain price indices (Jan 2000 = base period)
Gra
in a
nd o
ilsee
d in
dex
of p
rice
s
Grain and oilseedWheatBarleyRiceMaize
450
400
350
300
250
200
150
100
50
0
July
Oct
Jan
Apr
July
Oct
Jan
Apr
July
Oct
Jan
Apr
July
Oct
Jan
Apr
July
Oct
Jan
Apr
July
Oct
Jan
Apr
July
Oct
Jan
Apr
July
Oct
Jan
Apr
July
Oct
Jan
Apr
July
Oct
Jan
Apr
2010-11 2011-12 2012-13 2013-14 2014-152005-06 2007-082006-07 2008-09 2009-10
Data source: IGC (2016)

26GRAIN GROWERS LIMITED STATE OF THE AUSTRALIAN GRAIN INDUSTRY 2016
3. THE BUSINESS OF GROWING GRAIN
FIGURE 3.5 Index of farm gate prices received (1997–98 = 100)
Inde
x of
pri
ces
All grainsWheatBarleyCanolaGrain sorghum
250
200
150
100
50
02003-04 2011-12 2013-14 2014–152005-06 2007-082001-02 2009-10
Data source: ABARES
Government supportGlobal grain prices, which drive the prices received by Australian grain growers, are not only a matter of supply and demand. Domestic support (through various financial subsidies and domestic regulations) for grain growers in major exporting nations, such as the European Union (EU), Canada and the US distort market signals and encourage additional supply in the international market, and at a price lower than real cost of production. Despite the de-coupling, for the most part, of support payments in these nations, significant levels of de-coupled support continue to underpin agricultural production. Government intervention in large grain-consuming nations, such as minimum pricing of some grains in the case of China, and input subsidies and minimum pricing in the case of India, reduce their demand for imports. Both these dynamics apply downward pressure on international grain prices, and hence Australian farm gate prices for grain.
Image courtesy Sheree Spora, Gulargambone NSW
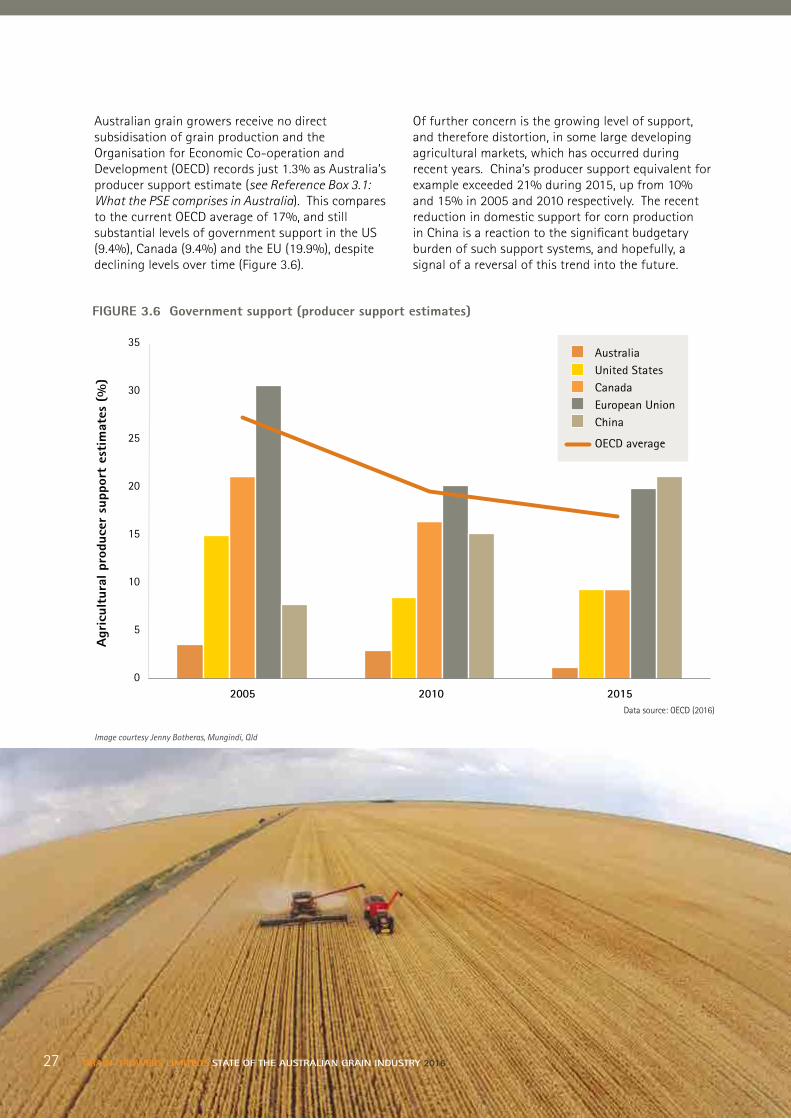
27 GRAIN GROWERS LIMITED STATE OF THE AUSTRALIAN GRAIN INDUSTRY 2016
Australian grain growers receive no direct subsidisation of grain production and the Organisation for Economic Co-operation and Development (OECD) records just 1.3% as Australia’s producer support estimate (see Reference Box 3.1: What the PSE comprises in Australia). This compares to the current OECD average of 17%, and still substantial levels of government support in the US (9.4%), Canada (9.4%) and the EU (19.9%), despite declining levels over time (Figure 3.6).
Of further concern is the growing level of support, and therefore distortion, in some large developing agricultural markets, which has occurred during recent years. China’s producer support equivalent for example exceeded 21% during 2015, up from 10% and 15% in 2005 and 2010 respectively. The recent reduction in domestic support for corn production in China is a reaction to the significant budgetary burden of such support systems, and hopefully, a signal of a reversal of this trend into the future.
FIGURE 3.6 Government support (producer support estimates)
Agr
icul
tura
l pro
duce
r su
ppor
t es
tim
ates
(%
)
35
30
25
20
15
10
5
02005 2010 2015
Australia
Canada United States
European UnionChina
OECD average
Data source: OECD (2016)
27 GRAIN GROWERS LIMITEDS STATE OF THE AUSTRALIAN GRAIN INDUSTRY 2016
Image courtesy Jenny Botheras, Mungindi, Qld

28GRAIN GROWERS LIMITED STATE OF THE AUSTRALIAN GRAIN INDUSTRY 2016
3. THE BUSINESS OF GROWING GRAIN
Reference 3.1 Support Estimates and what they are comprised of
The OECD percentage Producer Support Estimate (%PSE) measures government policy-based support for agricultural producers at the farm gate, expressed as a share of gross farm receipts. Types of support included in the %PSE include market price support, budgetary payments and any revenue foregone by the government and other economic agents to the benefit of the agriculture sector.
Australia is a world leader in regard to %PSE reduction. From its already low levels in 1986–88, Australia has continued to reduce its %PSE to the current level of 1.3%, which is the lowest in the world as a proportion of GDP. The reforms Australia has pursued for %PSE reduction cover both the level and composition of support provided to agriculture. Reforms have included the elimination of market price support, targeting of direct payments and increased representation of general services in support. General services support includes investment in agricultural knowledge and innovation systems and inspection and control. Australia’s current %PSE represents non-market distorting support through general services, targeted risk management and environmental conservation.
Australia’s approach to national drought policy and prevailing climatic conditions can have a significant impact on Australia’s %PSE. During 2006–08, Australia’s %PSE jumped to 5% due to expenditure on drought support. However, Australia’s drought policies have generally trended towards increasing resilience and preparedness, rather than reactive assistance. Recent policy developments during 2014 brought about a concessional loan program that provides Australian farmers with concessional interest rates. However, even with this policy in place, Australia has maintained %PSE at world-leading levels.
Many mistakenly consider the diesel fuel rebate to be a subsidy to Australian agricultural production. However, the diesel fuel rebate is repayment of a tax farmers are not liable to pay. The Australian Government fuel excise is levied on fuel for the purpose of building and maintaining road infrastructure. As such, it does not apply to the off-farm activities of farmers. The excise has been repaid on a documented claim basis since 1982, rather than not applied in the first instance, due to administrative difficulties with the exemption certification approach used previously.
Managing water and climateThe most significant physical constraints on rates of return in grain farming are water, climate variability and soil quality. The impact of limited water availability is, in part, demonstrated by Australia’s average yields being less than 60% of the international average, and falling (down from 70% in 2000) as Australia’s average yields have increased only marginally and a supply region such as the EU has had an annual yield increase 160% higher than Australia’s (Figure 3.7).
Water use efficiency (WUE) is the measure of a cropping system’s capacity to convert water into plant biomass or grain. It includes both the use of water stored in the soil and rainfall during the growing season (GSR). Widespread appreciation for the magnitude of the impact of sub-optimal WUE has prompted increased research efforts into the issue during recent years, some of which has already improved the capacity of grain growers to manage limited water availability (see Reference 3.2: The water use efficiency initiative).
However, limited water availability is a lesser pressure on grain farm business performance than climate variability (that is, changes in temperature, rainfall and other measures). Analysis of Australian wheat and barley yields illustrates the increasing trend in grain yield variability (Figure 3.8). Increasing production variability further complicates a grain growers’ decision making. In any given season a farmer can choose not to plant a crop — thereby negating the risk of wasted inputs costs (seed, fertiliser, fuel, herbicides, labour) if the crops fails due to unseasonal climate events but also foregoing the opportunity for return on assets from a crop produced.
As climate variability increases, the value and requirement for information to reduce uncertainty grows. In the absence of accurate climate information, the opportunity costs of not growing a crop, or the direct losses of input costs, will also grow. Growth in the use of information and communication technologies, supported by adequate climate and biophysical data and connectivity in regional areas, is a key opportunity to mitigate the impacts of increased climate variability.

29 GRAIN GROWERS LIMITED STATE OF THE AUSTRALIAN GRAIN INDUSTRY 2016
FIGURE 3.7 Average world wheat yields
FIGURE 3.8 Yield variability for Australian wheat and barley (1999–2013)
Yiel
d (t
/ha)
6
5
4
3
2
1
0
European Union
Ukraine
Russia
North America
Australia
2000 2002 2004 2006 2008 2010 2012 2014 2016 est
World
Coef
fici
ent
of v
aria
tion
Covariance – wheat yieldCovariance – barley yield
Variance – wheat yieldVariance – barley yield
0.30
0.25
0.20
0.15
0.10
0.05
0
1999
–00
2000
–01
2001
–02
2002
–03
2003
–04
2004
–05
2005
–06
2006
–07
2007
–08
2008
–09
2009
–10
2010
–11
2011
–12
2012
–13
Data source: USDA (2016)
Data source: Analysed using FAO data

30GRAIN GROWERS LIMITED STATE OF THE AUSTRALIAN GRAIN INDUSTRY 2016
3. THE BUSINESS OF GROWING GRAIN
Reference 3.2 The water use efficiency initiative
A five-year, $17.6m WUE initiative was established in 2008 to challenge growers and researchers to lift the WUE of grain-based production systems by 10% across Australia’s southern and western cropping regions. Sixteen research groups submitted proposals they believed would achieve the required lift in productivity and WUE. Research sites were established across the Southern and Western GRDC growing regions and covered high and low-rainfall areas in all states. The CSIRO coordinated the projects.
Summer fallow management emerged as a major driver of WUE, particularly in cropping systems that increasingly rely on out-of-season rainfall to grow winter grain crops. The CSIRO research indicated the 10% improvement in WUE to be achievable — with rain during the summer fallow contributing an average of 33% of grain yield in some seasons.
Conserving this valuable resource via effective weed control, stubble retention and minimum tillage can mean the difference between a profitable and unprofitable winter crop. In other research, early sowing of slow-maturing wheat varieties into stored soil moisture generated impressive yield gains of between one and two tonnes per hectare in some seasons. Used as part of a mix with faster-maturing varieties, these slow-maturing wheats can help extend the sowing window and reduce production risks by as much as 40%.
South Australian research highlighted the WUE and yield benefits of matching fertiliser inputs to soil type.
Increasing nitrogen (N) inputs on sandy soils in the Mallee, while lowering those on heavier soils, has led to significant increases in crop yields and returns. In the GRDC Western Region, impressive improvements in WUE from gypsum application were achieved on southern coast soils, while whole-farm benchmarking proved valuable in assessing the soils most likely to generate a cropping return from amelioration and fertiliser inputs.
A central message from the WUE Initiative was the importance of tending to the pre-crop period to lift the WUE of farming systems. It is this period — months to years before a crop — that sets the potential for a soil to capture, store and retain water for a subsequent crop. More than two-thirds of the WUE of a farming system is generated by management practices during the pre-crop period, with a further third attributed to in-crop management practices, such as sowing date and nitrogen management. When combined with the correct wheat variety, the pre-crop and in-crop management practices work in synergy to lift WUE beyond what is possible from any of the variety choices or practices implemented in isolation. New genotypes, such as the long coleoptile wheat variety, and those with other WUE traits being developed by the CSIRO as part of their pre-breeding research program, have the potential to provide further increases in productivity and WUE by facilitating early sowing into stored summer fallow soil moisture.
Source: GRDC (2013)
Future grain farm fortunes The returns for grain-growing businesses in Australia have improved in the five years leading up to 2015, over the previous five years. Further, the performance of grain production has, as a whole, continued to be above other agricultural enterprises. This is due primarily to the more favourable weather conditions more recently, but also buffering from lower international prices by exchange rate movements, lower interest rates and the consolidation of grain businesses so growers are achieving the benefits of economies of scale.
It is notwithstanding that in some parts of Australia, continued dry and unseasonal weather continues to create significant challenges to grain-growing businesses and climatic variability is introducing more challenging production environments overall.
Research and development will be key to mitigating the impact of limited water availability and climatic variability, with the possible strategies ranging from plant breeding to paddock and systems management, to increasingly powerful information and communication technologies.
Competitiveness of Australian growers’ grain in international markets will continue to be dampened by high, and in some cases increasing, levels of government support for agricultural production in competing countries. However, much closer to home the competitiveness of Australian grain is highly shaped by the supply chain that moves Australian grain beyond the farm gate to the range of domestic and international markets that the Australian grains industry services.

31 GRAIN GROWERS LIMITED STATE OF THE AUSTRALIAN GRAIN INDUSTRY 2016
4. WHERE AUSTRALIAN GRAIN GOES
Exports are critical Typically, 40% of all grain grown in Australia is consumed domestically, but this varies by year and by grain type. In particular the proportion of total grain production consumed by the domestic market increases significantly in years of low production. During recent years the proportion of grain production consumed domestically has averaged closer to 30% (Figure 4.1).
Australia’s grains industry is predominantly export focused. The industry’s largest production crop, wheat, is also the most highly export dependent. Typically, 75% of wheat production is exported, which has increased just marginally during recent years (Figure 4.2).
Other Australian grains are less export-dependent than wheat. Typically, about 50% of sorghum is exported, 65% of barley and just 17% of oats. This means about 60% of the volume of grains produced in Australia is exported. This balance varies by state across Australia, with WA being the most export-dependent state. Wheat, for example, accounts for 70% of WA’s cereal production, and more than 80% of wheat grown in WA is exported.
Meanwhile, the east-coast states are significantly less export dependent due to the more readily-accessible domestic end-use markets
Australians using grain The Australian grains industry is fortunate to have a solid domestic market for its grains. Indeed, Australia is the industry’s largest single grains market. The domestic market comprises a human consumption market, a feed grain market and a small industrial market — primarily ethanol. These markets are almost entirely supplied with domestically-grown grain. For example, wheat imports, which are between 1000 and 2000t annually, represent less than 0.1% of wheat used in Australia in any given year.
Domestic milling and domestic feed wheat are estimated to have accounted for 9% and 12% of Australian wheat supply in the five years leading up to 2015 (Figure 4.2), which is down and up respectively from the average of 10% each in the previous five-year period. This reflects the relatively faster growth of the domestic feed market, than the domestic milling sector, a trend reflected across most major grains used in Australia.
The Australian grains industry services a range of domestic and international markets. These markets use Australian grain for an array of human, animal and industrial end-uses. The importance of the various markets, particularly export markets, has changed over time; what remains important is there is a range of robust markets to suit the variety of production environments and seasonal variability in Australia, but also for risk management in an uncertain global market.
Image courtesy CBH Group
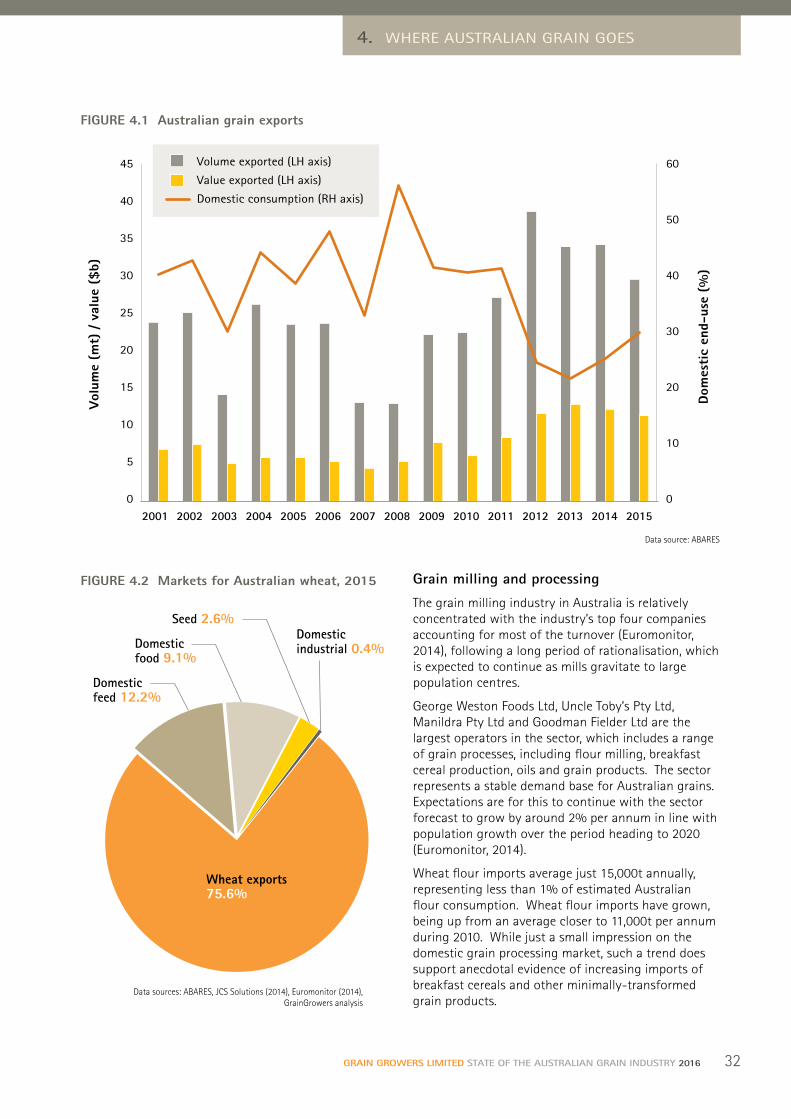
32GRAIN GROWERS LIMITED STATE OF THE AUSTRALIAN GRAIN INDUSTRY 2016
4. WHERE AUSTRALIAN GRAIN GOES
Grain milling and processing
The grain milling industry in Australia is relatively concentrated with the industry’s top four companies accounting for most of the turnover (Euromonitor, 2014), following a long period of rationalisation, which is expected to continue as mills gravitate to large population centres.
George Weston Foods Ltd, Uncle Toby’s Pty Ltd, Manildra Pty Ltd and Goodman Fielder Ltd are the largest operators in the sector, which includes a range of grain processes, including flour milling, breakfast cereal production, oils and grain products. The sector represents a stable demand base for Australian grains. Expectations are for this to continue with the sector forecast to grow by around 2% per annum in line with population growth over the period heading to 2020 (Euromonitor, 2014).
Wheat flour imports average just 15,000t annually, representing less than 1% of estimated Australian flour consumption. Wheat flour imports have grown, being up from an average closer to 11,000t per annum during 2010. While just a small impression on the domestic grain processing market, such a trend does support anecdotal evidence of increasing imports of breakfast cereals and other minimally-transformed grain products.
FIGURE 4.1 Australian grain exports
FIGURE 4.2 Markets for Australian wheat, 2015
45
40
35
30
25
20
15
10
5
0
60
50
40
30
20
10
0
Vol
ume
(mt)
/ v
alue
($b)
Dom
esti
c en
d-us
e (%
)
2001 2002 2003 2004 2005 2006 2007 2008 2009 2010 2011 2012 2013 2014 2015
Volume exported (LH axis)
Value exported (LH axis)
Domestic consumption (RH axis)
Domesticfeed 12.2%
Domesticfood 9.1%
Domesticindustrial 0.4%
Seed 2.6%
Wheat exports 75.6%
Data source: ABARES
Data sources: ABARES, JCS Solutions (2014), Euromonitor (2014), GrainGrowers analysis

33 GRAIN GROWERS LIMITED STATE OF THE AUSTRALIAN GRAIN INDUSTRY 2016
Australian’s are increasingly demanding products free from gluten, dairy, raw eggs, peanuts and sesame seeds, so the sector will need to continue addressing opportunities to meet these market demands. A recent CSIRO survey found as many as one in 10 Australian adults (approximately 1.8 million people) are avoiding or limiting their wheat consumption CSIRO (2015). Few among this group (5·7%) claimed a formally diagnosed intolerance or allergy requiring avoidance of wheat-based foods.
Similarly, whole-food trends are enhancing demand for whole grains and pulses. The demographic group behind this trend is also a leader in the trend toward food provenance and safety.
Beer consumption (the primary ingredient being barley) continues to follow a long-term downward trend domestically, due to displacement by wine consumption and, more recently, an increase in the popularity of cider (Figure 4.3).
Growth in the domestic human consumption sector of the grains industry is anticipated to remain limited due to only steady population growth and the relatively low income elasticity of demand for grain products in Australia.
Feed industry
The domestic animal feed industry includes beef and dairy cattle, layer and poultry chickens, pigs, sheep, horses, aquaculture and a number of smaller industries, with the bulk of feed grains consumed by the beef and dairy cattle, and chicken industries (Table 4.1).
During 2013–14 an estimated 12.2mt of raw materials were used by the domestic feed grain industry with 8.8mt consisting of raw grains, such as wheat, barley, sorghum, triticale, oats, maize, lupins, field peas, faba beans and whole oilseeds, including canola. The balance of the grains industry contribution was vegetable protein meals from oilseed processing (canola, soy, sunflower, safflower).
FIGURE 4.3 Per capita Australian beer consumption
12
10
8
6
4
2
0
Cons
umpt
ion
(L/y
ear)
1990
–91
1991
–92
1992
–93
1993
–94
1994
–95
1995
–96
1996
–97
1997
–98
1998
–99
1999
–00
2000
–01
2001
–02
2002
–03
2003
–04
2004
–05
2005
–06
2006
–07
2007
–08
2008
–09
2009
–10
2010
–11
2011
–12
2012
–13
Beer
Spirits and ready-to-drink mixers Wine
Cider
Data source: ABS (2013)
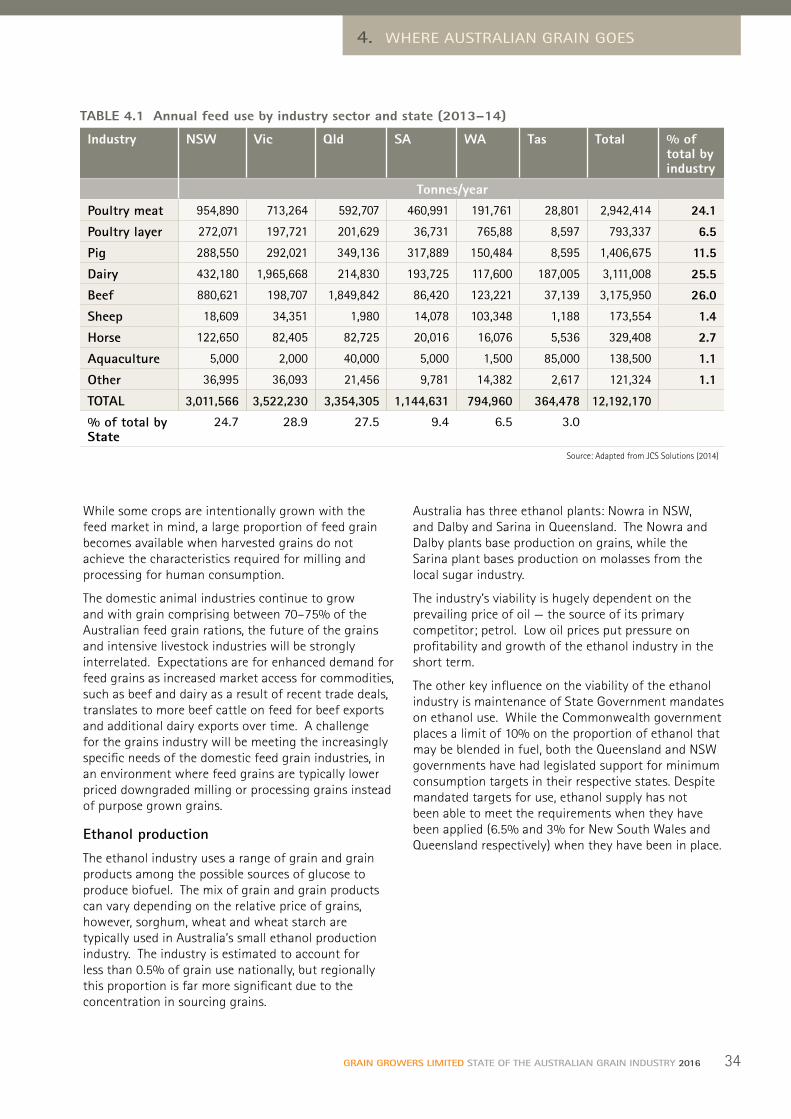
34GRAIN GROWERS LIMITED STATE OF THE AUSTRALIAN GRAIN INDUSTRY 2016
4. WHERE AUSTRALIAN GRAIN GOES
While some crops are intentionally grown with the feed market in mind, a large proportion of feed grain becomes available when harvested grains do not achieve the characteristics required for milling and processing for human consumption.
The domestic animal industries continue to grow and with grain comprising between 70–75% of the Australian feed grain rations, the future of the grains and intensive livestock industries will be strongly interrelated. Expectations are for enhanced demand for feed grains as increased market access for commodities, such as beef and dairy as a result of recent trade deals, translates to more beef cattle on feed for beef exports and additional dairy exports over time. A challenge for the grains industry will be meeting the increasingly specific needs of the domestic feed grain industries, in an environment where feed grains are typically lower priced downgraded milling or processing grains instead of purpose grown grains.
Ethanol production
The ethanol industry uses a range of grain and grain products among the possible sources of glucose to produce biofuel. The mix of grain and grain products can vary depending on the relative price of grains, however, sorghum, wheat and wheat starch are typically used in Australia’s small ethanol production industry. The industry is estimated to account for less than 0.5% of grain use nationally, but regionally this proportion is far more significant due to the concentration in sourcing grains.
Australia has three ethanol plants: Nowra in NSW, and Dalby and Sarina in Queensland. The Nowra and Dalby plants base production on grains, while the Sarina plant bases production on molasses from the local sugar industry.
The industry’s viability is hugely dependent on the prevailing price of oil — the source of its primary competitor; petrol. Low oil prices put pressure on profitability and growth of the ethanol industry in the short term.
The other key influence on the viability of the ethanol industry is maintenance of State Government mandates on ethanol use. While the Commonwealth government places a limit of 10% on the proportion of ethanol that may be blended in fuel, both the Queensland and NSW governments have had legislated support for minimum consumption targets in their respective states. Despite mandated targets for use, ethanol supply has not been able to meet the requirements when they have been applied (6.5% and 3% for New South Wales and Queensland respectively) when they have been in place.
TABLE 4.1 Annual feed use by industry sector and state (2013–14)
Industry NSW Vic Qld SA WA Tas Total % of total by industry
Tonnes/year
Poultry meat 954,890 713,264 592,707 460,991 191,761 28,801 2,942,414 24.1
Poultry layer 272,071 197,721 201,629 36,731 765,88 8,597 793,337 6.5
Pig 288,550 292,021 349,136 317,889 150,484 8,595 1,406,675 11.5
Dairy 432,180 1,965,668 214,830 193,725 117,600 187,005 3,111,008 25.5
Beef 880,621 198,707 1,849,842 86,420 123,221 37,139 3,175,950 26.0
Sheep 18,609 34,351 1,980 14,078 103,348 1,188 173,554 1.4
Horse 122,650 82,405 82,725 20,016 16,076 5,536 329,408 2.7
Aquaculture 5,000 2,000 40,000 5,000 1,500 85,000 138,500 1.1
Other 36,995 36,093 21,456 9,781 14,382 2,617 121,324 1.1
TOTAL 3,011,566 3,522,230 3,354,305 1,144,631 794,960 364,478 12,192,170
% of total by State
24.7 28.9 27.5 9.4 6.5 3.0
Source: Adapted from JCS Solutions (2014)

35 GRAIN GROWERS LIMITED STATE OF THE AUSTRALIAN GRAIN INDUSTRY 2016
FIGURE 4.4 Composition of Australian grain exports, five-year average values to 2010 and 2015
Canola 6%
Other coarse grains 5%
Grain sorghum 3% Other oilseeds 1%
Other pulses 6%
Chickpeas 3%
2010: $6.0 billion (FOB)
Wheat 59%
Barley 20%
Other oilseeds 1%
Other pulses 6%
Chickpeas 3%
2015: $11.5 billion (FOB)
Wheat 53%
Barley 16%
Canola 13%
International marketsAustralia is a small player in the global grain market. It is even smaller when considered in the context of some of the large grain crops grown internationally such as rice, maize and soybeans. While Australia does not compete directly with these large crops for most of our exports, the substitutability of these grains, with our major exports of wheat, barley, canola and sorghum means the supply and demand for these crops has considerable influence on the Australian industry.
Wheat dominates Australia’s grain exports, consistently accounting for more than 50% of all grain export value, followed by barley (16%) and canola (13%). As compared to the five years to 2010, the relative contribution of canola and sorghum has increased during 2010–2015, and that of wheat and barley fallen (Figure 4.4).
From one international wheat exporter before the removal of the single desk in 2008, there are currently 10 large grain marketers and a range of medium and small marketers exporting wheat from Australia. The larger marketers include the WA grower cooperative, Co-operative Bulk Handling Limited (CBH), the Australian stock exchange (ASX)
listed GrainCorp, and marketers such as Glencore Grain Pty Ltd, Cargill Australia Limited, Emerald Grain Pty Limited, Nidera Australia Pty Ltd, CHS Trading Company Australia, Louis Dreyfus Company Australia Pty Ltd and Bunge Agribusiness Australia Pty Ltd, all of which are part of multi-national companies in some way. Each of these marketers trade a range of different grains, although some may have more interest in some grains than others. These large marketers, who trade from 1mt to more than 7mt each annually, are accompanied by an estimated 24 second-tier marketers, and a competitive fringe of more than 200 other traders across Australia, who may or may not export consistently. The number of second-tier traders and the competitive fringe has increased since 2010, up from an estimated 11 and 160 respectively.
Australia’s most important grain markets are in South East Asia, North Asia, and the Middle East and North Africa regions (MENA). These markets are supplemented by important, though smaller, specific markets such as the European market for canola, the South Asian market for pulses and the Oceania markets, including New Zealand.
Australia’s key international grain markets are driven by freight advantage and often based on long-established supply relationships. Two of the world’s
Data source: ABARES (2011 and 2016)

36GRAIN GROWERS LIMITED STATE OF THE AUSTRALIAN GRAIN INDUSTRY 2016
4. WHERE AUSTRALIAN GRAIN GOES
largest grain importing regions, the Asia region (North and South East) and the Middle East (Figure 4.5) are typically freight competitive for Australian grain and have a growing demand for Australia’s wheat, coarse grains and canola. Demand for grains in these regions has been growing at more than 6% (CARG) and 5% (CARG) respectively per annum during the past decade. At the other end of the scale, Oceania is only a small grains market, but Australia is almost entirely responsible for the supply of grain to the region. Growth in Oceania’s grain demand has averaged less than 4% (CARG) during the past decade.
South East Asia
Wheat dominates Australian grain exports to the Association of South East Asian Nations (ASEAN) region, with Indonesia leading the way as Australia’s largest individual international market for wheat and indeed the largest individual market for any Australian grain. During the past five years, the Indonesian market alone has accounted for 20% of Australian wheat exports, followed in the region by Vietnam (9%). The region also includes long-established markets for Australian wheat, including Singapore, Malaysia, Thailand and the Philippines. Other nations, including
FIGURE 4.5 World wheat and coarse grain imports and Australian supply*
South Asia 2% of world imports– Australia supplies 1% of imports, which is 0.3% of Australia’s exports
Europe 8% of world imports– Australia supplies 0.5% of imports, which is 0.5% of Australia’s exports
Russian Commonwealth of Independent States 3% of world imports– No Australian supply
North Africa 14% of world imports– Australia supplies 1% of imports, which is 1.5% of Australia’s exports
Oceania 0.34% of world imports– Australia supplies 93% of imports, which is 4% of Australia’s exports
South America 9% of world imports– Australia supplies 0.1% of imports, which is 0.1% of Australia’s exports
Middle East 17% of world imports– Australia supplies 10% of imports, which is 22% of Australia’s exports
North Asia 20% of world imports– Australia supplies 14% of imports, which is 34% of Australia’s exports
South East Asia 9% of world imports– Australia supplies 26% of imports, which is 29% of Australia’s exports
Sub-Saharan African 7% of world imports– Australia supplies 10% of imports which is 8.5% of Australia’s exports
North America 8% of world imports– Australia supplies 0.3% of imports, which is 0.3% of Australia’s exports
Central America 3% of world imports– No Australian supply
Data source: International Grains Council (2014) * Does not include rice and oilseeds
Cambodia, Laos and Myanmar are not currently important markets for Australian wheat, or any Australian grains, however, with time these countries could be expected to increase their demand for non-rice grains as their development follows that of more the advanced nations in the region, such as Malaysia and Indonesia.
Total Australian grain exports to the ASEAN region averaged 7.3mt, valued at $2.7bn over recent years (Figure 4.6). Exports of wheat to Indonesia alone account for an average of $1.3bn per annum.
The South East Asian region represents an incredible growth market on Australia’s doorstep. Indonesian wheat demand alone has been growing at about 10% per annum and the nation is anticipated to import 10mt by 2020, overtaking Egypt as the world’s largest importer of wheat. This estimate is based on both population growth and increasing westernisation of South East Asian diets. The growing milling sector in Indonesia also indicates potential for growth into this market. This growth is not only to service domestic Indonesian flour and flour products consumption, but also drive a growing export noodle and baked good sectors.
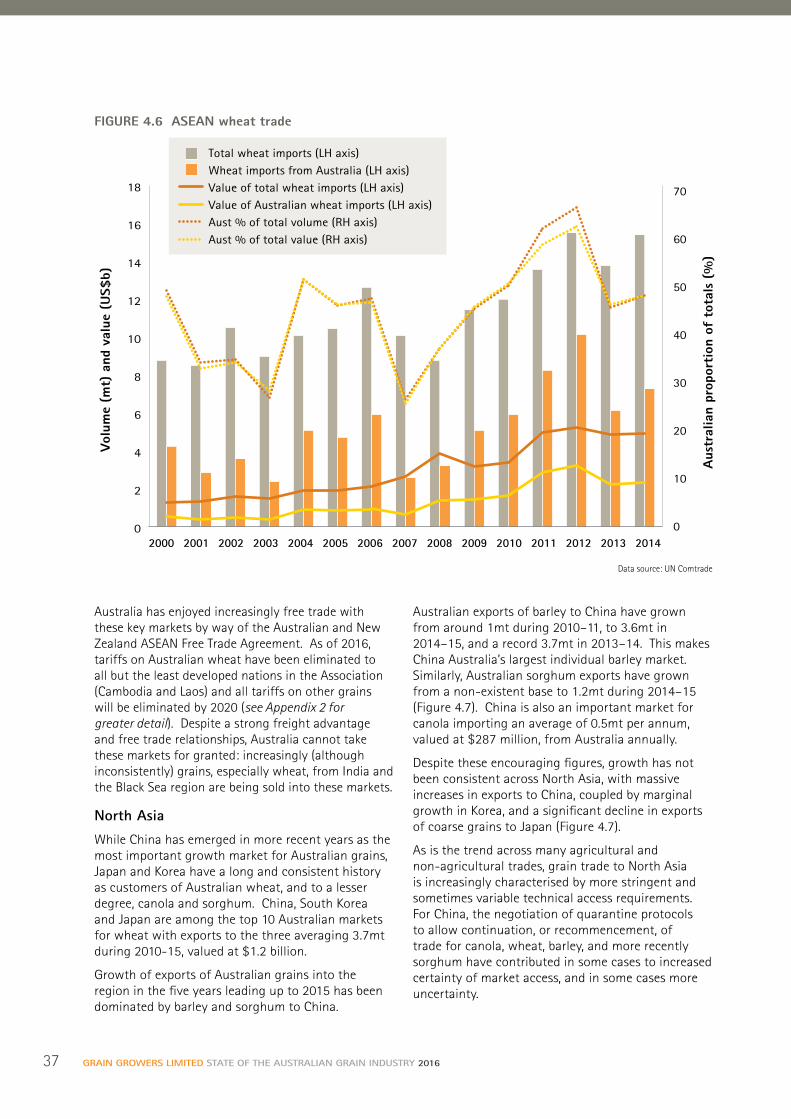
37 GRAIN GROWERS LIMITED STATE OF THE AUSTRALIAN GRAIN INDUSTRY 2016
Australia has enjoyed increasingly free trade with these key markets by way of the Australian and New Zealand ASEAN Free Trade Agreement. As of 2016, tariffs on Australian wheat have been eliminated to all but the least developed nations in the Association (Cambodia and Laos) and all tariffs on other grains will be eliminated by 2020 (see Appendix 2 for greater detail). Despite a strong freight advantage and free trade relationships, Australia cannot take these markets for granted: increasingly (although inconsistently) grains, especially wheat, from India and the Black Sea region are being sold into these markets.
North Asia
While China has emerged in more recent years as the most important growth market for Australian grains, Japan and Korea have a long and consistent history as customers of Australian wheat, and to a lesser degree, canola and sorghum. China, South Korea and Japan are among the top 10 Australian markets for wheat with exports to the three averaging 3.7mt during 2010-15, valued at $1.2 billion.
Growth of exports of Australian grains into the region in the five years leading up to 2015 has been dominated by barley and sorghum to China.
Australian exports of barley to China have grown from around 1mt during 2010–11, to 3.6mt in 2014–15, and a record 3.7mt in 2013–14. This makes China Australia’s largest individual barley market. Similarly, Australian sorghum exports have grown from a non-existent base to 1.2mt during 2014–15 (Figure 4.7). China is also an important market for canola importing an average of 0.5mt per annum, valued at $287 million, from Australia annually.
Despite these encouraging figures, growth has not been consistent across North Asia, with massive increases in exports to China, coupled by marginal growth in Korea, and a significant decline in exports of coarse grains to Japan (Figure 4.7).
As is the trend across many agricultural and non-agricultural trades, grain trade to North Asia is increasingly characterised by more stringent and sometimes variable technical access requirements. For China, the negotiation of quarantine protocols to allow continuation, or recommencement, of trade for canola, wheat, barley, and more recently sorghum have contributed in some cases to increased certainty of market access, and in some cases more uncertainty.
18
16
14
12
10
8
6
4
2
0
Vol
ume
(mt)
and
val
ue (
US$
b)
Aus
tral
ian
prop
orti
on o
f to
tals
(%
)
70
60
50
40
30
20
10
0
Total wheat imports (LH axis)Wheat imports from Australia (LH axis)Value of total wheat imports (LH axis)Value of Australian wheat imports (LH axis)Aust % of total volume (RH axis)Aust % of total value (RH axis)
2001 2002 2003 2004 2005 2006 2007 2008 2009 2010 2011 2012 2013 2014 2000
Data source: UN Comtrade
FIGURE 4.6 ASEAN wheat trade
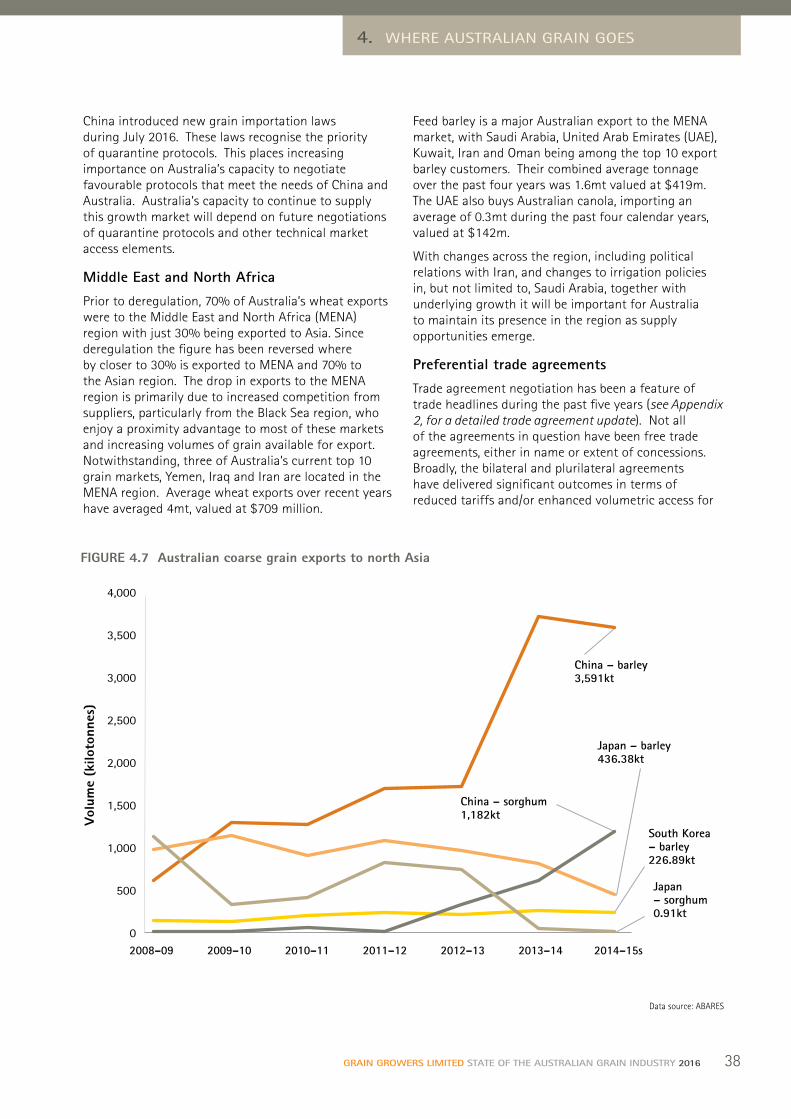
38GRAIN GROWERS LIMITED STATE OF THE AUSTRALIAN GRAIN INDUSTRY 2016
4. WHERE AUSTRALIAN GRAIN GOES
China introduced new grain importation laws during July 2016. These laws recognise the priority of quarantine protocols. This places increasing importance on Australia’s capacity to negotiate favourable protocols that meet the needs of China and Australia. Australia’s capacity to continue to supply this growth market will depend on future negotiations of quarantine protocols and other technical market access elements.
Middle East and North Africa
Prior to deregulation, 70% of Australia’s wheat exports were to the Middle East and North Africa (MENA) region with just 30% being exported to Asia. Since deregulation the figure has been reversed where by closer to 30% is exported to MENA and 70% to the Asian region. The drop in exports to the MENA region is primarily due to increased competition from suppliers, particularly from the Black Sea region, who enjoy a proximity advantage to most of these markets and increasing volumes of grain available for export. Notwithstanding, three of Australia’s current top 10 grain markets, Yemen, Iraq and Iran are located in the MENA region. Average wheat exports over recent years have averaged 4mt, valued at $709 million.
Feed barley is a major Australian export to the MENA market, with Saudi Arabia, United Arab Emirates (UAE), Kuwait, Iran and Oman being among the top 10 export barley customers. Their combined average tonnage over the past four years was 1.6mt valued at $419m. The UAE also buys Australian canola, importing an average of 0.3mt during the past four calendar years, valued at $142m.
With changes across the region, including political relations with Iran, and changes to irrigation policies in, but not limited to, Saudi Arabia, together with underlying growth it will be important for Australia to maintain its presence in the region as supply opportunities emerge.
Preferential trade agreements
Trade agreement negotiation has been a feature of trade headlines during the past five years (see Appendix 2, for a detailed trade agreement update). Not all of the agreements in question have been free trade agreements, either in name or extent of concessions. Broadly, the bilateral and plurilateral agreements have delivered significant outcomes in terms of reduced tariffs and/or enhanced volumetric access for
FIGURE 4.7 Australian coarse grain exports to north Asia
Vol
ume
(kilo
tonn
es)
4,000
3,500
3,000
2,500
2,000
1,500
1,000
500
0
China – barley3,591kt
China – sorghum1,182kt
Japan – barley436.38kt
Japan – sorghum0.91kt
South Korea – barley226.89kt
2008–09 2009–10 2010–11 2011–12 2012–13 2013–14 2014–15s
Data source: ABARES

39 GRAIN GROWERS LIMITED STATE OF THE AUSTRALIAN GRAIN INDUSTRY 2016
agriculture. The most significant outcomes have been for the livestock sectors; however, this is also a result of the often extremely high pre-existing tariffs. Typically, major grains have faced tariffs of less than 10% within quota access arrangements under the World Trade Organisation (WTO).
ChAFTA
Given the high volume, thin margin trade associated with grains in most cases, tariff cuts of even small percentages are significant. The China Australia Free Trade Agreement (ChAFTA), for example, delivered tariff elimination for Australia’s barley, oats and sorghum sectors. At 2015 trade volumes, this elimination was worth a combined annual close to $50 million.
JAPEA
Improvements in access to Japan under the Japanese Australia Economic Partnership Agreement (JAPEA) were welcomed by the Australian grains industry, however, concessions on major grains were minor.
KAFTA
The Korea Australia Free Trade Agreement (KAFTA) delivered broad-ranging cuts and tariff elimination schedules for Australian grain and grain products. As such, it comes closest to meeting its free-trade nomenclature, but extended tariff elimination schedules mean it will be 2028 before it truly is a free-trade agreement.
Despite the North Asian trade agreements not being comprehensively free for grains, growth in the region and the proportion of world grain trade the region accounts for, means there is no doubt the ‘trifecta’ of agreements is important for the Australian grains industry.
TPP
The Trans Pacific Partnership (TPP) is the other headline trade agreement established during the past five years. The TPP was signed by the 12 negotiating countries in January 2016 but is yet to enter into force. In practical terms, implementation relies on the ratification of the agreement by the US and Japan. The TPP does not stand to deliver significant benefits to the Australian grains industry, in and of itself, due to Australia’s existing trade agreements with key countries in the group. However, if the agreement does proceed, Australia stands to be at a significant disadvantage to grain supply competitors — Canada and the US — who will obtain significant access gains to the Japanese and Vietnamese markets. This would be exacerbated if Indonesia and South Korea subsequently join the TPP, as they recently indicated they are interested in doing.
ASEAN-ANZFTA
Less in the headlines of recent years, the Australia–New Zealand Free Trade Agreement with the ASEAN group of nations (ASEAN-ANZFTA) came into force during 2010. ASEAN–ANZFTA builds on the preferential access afforded to Australian grains under previous Australian FTAs with Malaysia, New Zealand, Singapore and Thailand, and importantly includes the important markets of Indonesia and Vietnam. As of 2016 Australia’s major grains are traded tariff free around the ASEAN region, and by 2020 will trade tariff free into even the less-developed countries in ASEAN (Laos, Cambodia and Myanmar). As shown in Figure 4.6, the implementation of ASEAN–ANZFTA has coincided with continued growth in Australia’s wheat exports to the region. The demand dynamics in the region underpin this growth and the removal of tariffs will certainly provide another competitive edge to Australian grain during the period.
RCEP and IA-CEPA
Potentially important trade negotiations currently underway are are the Regional Comprehensive Economic Partnership (RCEP) and Indonesia-Australia Economic Partnership Agreement (IA-CEPA). The opportunities in both of these agreements are less about reducing tariffs, although there are some opportunities, and increasing quantitative access and more about developing industry cooperation and streamlining operational and technical elements of market access, because Australia has existing agreements with most of the counterparts.
RCEP is an ASEAN-lead initiative for a regional agreement between ASEAN and its existing trade agreement partners, which are Australia, New Zealand, China, India, South Korea and Japan. This group of countries accounts for 65% of Australia’s grain exports, a range of grains and some of the largest growth markets in the world (Figure 4.8). As such, this is the single-most important trade opportunity currently being negotiated. There may be some further tariff reductions possible in an RCEP agreement but the most important prospect is to include measures to manage technical market access issues. If the agreements give clarity and certainty to the technical market access areas, such as sanitary and phytosanitary requirements and the operational elements of trade, this agreement has the potential to deliver significant value to both Australia and the grain importing nations in the group.
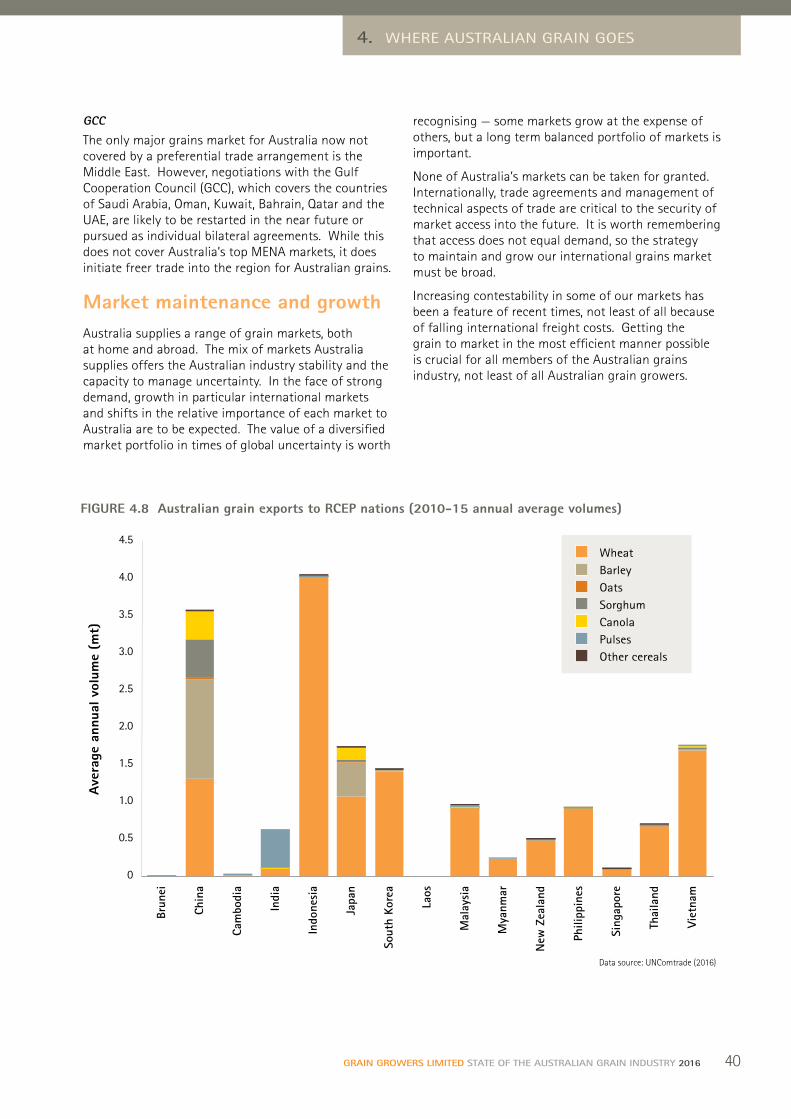
40GRAIN GROWERS LIMITED STATE OF THE AUSTRALIAN GRAIN INDUSTRY 2016
4. WHERE AUSTRALIAN GRAIN GOES
GCC
The only major grains market for Australia now not covered by a preferential trade arrangement is the Middle East. However, negotiations with the Gulf Cooperation Council (GCC), which covers the countries of Saudi Arabia, Oman, Kuwait, Bahrain, Qatar and the UAE, are likely to be restarted in the near future or pursued as individual bilateral agreements. While this does not cover Australia’s top MENA markets, it does initiate freer trade into the region for Australian grains.
Market maintenance and growthAustralia supplies a range of grain markets, both at home and abroad. The mix of markets Australia supplies offers the Australian industry stability and the capacity to manage uncertainty. In the face of strong demand, growth in particular international markets and shifts in the relative importance of each market to Australia are to be expected. The value of a diversified market portfolio in times of global uncertainty is worth
recognising — some markets grow at the expense of others, but a long term balanced portfolio of markets is important.
None of Australia’s markets can be taken for granted. Internationally, trade agreements and management of technical aspects of trade are critical to the security of market access into the future. It is worth remembering that access does not equal demand, so the strategy to maintain and grow our international grains market must be broad.
Increasing contestability in some of our markets has been a feature of recent times, not least of all because of falling international freight costs. Getting the grain to market in the most efficient manner possible is crucial for all members of the Australian grains industry, not least of all Australian grain growers.
FIGURE 4.8 Australian grain exports to RCEP nations (2010-15 annual average volumes)
Ave
rage
ann
ual v
olum
e (m
t)
4.5
4.0
3.5
3.0
2.5
2.0
1.5
1.0
0.5
0
Brun
ei
Chin
a
Cam
bodi
a
Indi
a
Indo
nesi
a
Japa
n
Sout
h Ko
rea
Laos
Mal
aysi
a
Mya
nmar
New
Zea
land
Phili
ppin
es
Sing
apor
e
Thai
land
Viet
nam
Wheat
OatsBarley
SorghumCanolaPulsesOther cereals
Data source: UNComtrade (2016)

41 GRAIN GROWERS LIMITED STATE OF THE AUSTRALIAN GRAIN INDUSTRY 2016
5. GETTING GRAIN TO MARKET
Ownership in the supply chain has changed considerably over time with corporate and international ownership now characteristic of the sector. Efficiencies can result from corporatisation and the new investment international ownership can bring. Estimates that place the cost of the movement of grain to port at 30% of the port price (AEGIC, 2014), prompt questions about the structure of, and investment in, the supply chain.
Australia’s grain freight networkGetting up to 45mt of grain to market each year is a substantial task, engaging a network of rail and road freight, on-farm and regional up-country storages and metropolitan and port storages. More than 60% of Australian grain is exported and many domestic milling and processing facilities are concentrated in coastal metropolitan areas, so the movement of grain from farm, to country storages and to the coast is a dominant feature of the entire Australian grain supply chain (Figure 5.1).
For the most part, and certainly for wheat and barley, the movement of grain in Australia is characterised by peak load movement during harvest and the following two to three months. This is in contrast to the systems in some competitor nations (e.g. Canada) where there is more on-farm storage and the movement of grain to port occurs over extended periods.
This Australian system is based around delivery of grain into a bulk handling system operated by regional monopolies and characterised by a small number of segregations for each grain type at each delivery point and co-mingling of farmer deliveries, to a stack average based on receival standards (Reference 5.1). Grain accumulators, either independent marketing companies or marketing arms of the bulk handlers, or growers, can maintain ownership of their grain throughout the bulk handling system based on adherence of the system to the receival standards. Storage and handling of grain in Australia is currently dominated by four regional players, GrainCorp, CBH, Viterra and Cargill’s Grainflow, and characterised by increasing international ownership (Figure 5.2).
Supply-chain partners to the Australian grain-production sector play a critical role in the competitiveness of the industry and in determining profitability at the farm gate. Properly-planned, well-maintained and cost-efficient transport, grain handling and storage facilities are required to deliver the lowest-cost pathways to our market.
Image courtesy CBH Group

42GRAIN GROWERS LIMITED STATE OF THE AUSTRALIAN GRAIN INDUSTRY 2016
5. GETTING GRAIN TO MARKET
Grain storage patternsAustralian grain growers are tending to store an increasing proportion of their grain on farm. On-farm grain stocks, as at June 30, were estimated to have averaged around 3mt in 1996 and had increased to an annual average of 4.5mt by 2014 (Figure 5.3).
Total on-farm storage capacity was estimated to be 14.3mt for 2010 (ABARES, 2010). On-farm storage capacity is now estimated to be in excess of more than 15mt (AEGIC, 2014).
Grain growers have increased on-farm storage to expand their marketing options, cater to different freight modes and adjust to seasonal variability. This also includes catering to the domestic market, which is characterised by a greater proportion of direct sales with delivery direct to the end-user.
*Domestic grain port onlyNew infrastructure investment post 2011
ARDROSSAN*
KWINANAWALLAROO
MACKAY
THEVENARD
GEELONGPORTLAND
PORT PIRIE*
PORT GILES
GLADSTONE
PORT LINCOLN
BUNBURY
PORT KEMBLA
NEWCASTLE
PORT ADELAIDE
Grain portsGrain receival sitesRailGrain growing belt
DALBY
ALBANY
BRISBANE
ESPERANCE
GERALDTON
MELBOURNEData source: Compiled by GrainGrowers
FIGURE 5.1 The Australian grain bulk handling network
Image courtesy Kerry Tighe, Moree, NSW

43 GRAIN GROWERS LIMITED STATE OF THE AUSTRALIAN GRAIN INDUSTRY 2016
FIGURE 5.2 Internationalisation of the bulk handling network20
1620
0020
10
Gra
in E
leva
tors
Bo
ard
Vict
oria
Gra
in H
andl
ing
Aut
hority
N
SW
Sout
h A
ustr
alia
n
Co-o
pera
tive
Bul
k H
andl
ing
Co-o
pera
tive
Bul
k H
andl
ing
(Wes
tern
Aus
tral
ia)
Bulk
Gra
ins
Que
ensl
and
NSW
Bar
ley
Boar
d N
SW O
ats
Mar
keti
ng B
oard
N
SW S
orgh
um B
oard
NSW
Oils
eeds
Boa
rd
Cent
ral Q
ueen
slan
d So
rghu
m B
oard
Stat
e W
heat
Boa
rd (
Qld
)Q
ueen
slan
d Ba
rley
Boa
rd
Aus
tral
ian
Barley
Boa
rd
Gra
in P
ool P
ty L
td
Land
mar
k
Aus
tral
ian
Whe
at B
oard
Vicg
rain
19
95
Aus
tral
ian
Bulk
A
llian
ce
2000
Aus
Bulk
2000
ABB
Gra
in19
99
AW
B Lt
d19
99
AW
B Lt
d20
03
Emer
ald
Gra
in
Sum
itom
o 50
%
201
3
Emer
ald
Gra
in
Sum
itom
o 10
0%
201
4
Gra
inCo
rp
1992
NSW
Gra
ins
Boar
d
1991
Gra
inCo
19
92
ABB
2004
CBH
Gro
up
2002
Vite
rra
20
10
Sum
itom
o
2010
Bung
e
2013
Gra
inCo
rp
1999
Gra
inCo
rp
2003
Gra
inCo
20
00
1990
Agr
ium
2010
Carg
ill
(AW
B/G
rain
flow
)
2011Vi
terr
a
Gle
ncor
e 10
0%
2012
Bulk
han
dler
Mar
kete
r
Inte
rnat
iona
l ow
ners
hip
Dua
l fun
ctio
n
(mar
keti
ng a
nd b
ulk
hand
ling)
Ackn
owle
dgem
ent:
This
cha
rt h
as b
een
adap
ted
and
upda
ted
from
Pro
duct
ivity
Com
mis
sion
(201
0)

44GRAIN GROWERS LIMITED STATE OF THE AUSTRALIAN GRAIN INDUSTRY 2016
5. GETTING GRAIN TO MARKET
FIGURE 5.3 On-farm grain stocks at 30 June across Australia (1996–2014)
Mill
ion
tonn
es
7
6
5
4
3
2
1
0
WheatOats
Grain sorghumOilseedsPulsesOther grains
Barley
1997
1998
1999
2000
2001
2002
2003
2004
2005
2006
2007
2008
2009
2010
2011
2012
2013
2014
Data source: ABARES
Rail versus roadReliance on road transport for moving grain is increasing as freight train branch rail lines, which service smaller up-country storage facilities, close as receival sites consolidate and close on a seasonal basis. Consolidation and seasonal closures have increased over recent years, with the greatest fall in site numbers occurring in Victoria and NSW (Figure 5.4). Road transport is now estimated to account for 50% of all grain movements on a total kilometre-tonne basis (AEGIC, 2014). Investment has also occurred in some parts of the bulk-handling network in conjunction with consolidation. This investment is planned to result in greater efficiencies in the network, with the aim of sharing efficiencies with grain growers, who in many cases now have longer delivery distances. In reality, given the monopolised nature of these regional networks, these efficiencies may not be shared with growers even though it is in the long-term interests of both the operators and the growers, to do so.
The inefficiency of rail infrastructure also contributes to the reliance on road transport for grains. Most Australian grain trains are run on low-efficiency lines
with 16–19t axle loads carrying 2000–3000 net tonnes of grain per train compared with Canadian trains of 23t axle loads carrying 11,000t of grain (AEGIC, 2014, 2015). This inefficiency is demonstrated by a comparison of the average per kilometre per tonne grain movement. The cost for grain movement in Canada is $0.03 compared with $0.11 in Australia — some 270% higher.
The result of inefficiency in the transport of grain in Australia puts huge pressure on Australian grain’s competitiveness internationally.
Port terminals and competitionThe nature of port access granted for bulk wheat exports has changed considerably since 2010–11. A port access code has been put in place and requires port operators to demonstrate to the Australian Competition and Consumer Commission (ACCC) there is sufficient competition in the port zone to be exempt from Parts 3 to 6 of the code5. CBH was given an automatic exemption on the basis of its cooperative structure and during the past 12 months the ACCC has exempted 11 other port operators (Table 5.1).
5These parts relate to obligations to provide non-discriminatory access, resolution of access disputes through prescribed processes, obtaining ACCC approval for capacity allocation systems and publishing certain information. Exempt providers are still obliged to deal with exporters in good faith and publish information about how capacity is allocated and the current state of the shipping stem.

45 GRAIN GROWERS LIMITED STATE OF THE AUSTRALIAN GRAIN INDUSTRY 2016
Num
ber
of s
ites
in u
se
QueenslandNew South WalesVictoriaSouth AustraliaWestern Australia
250
200
150
100
50
0
Harvest season
2009–10 2010-11 2011-12 2012-13 2013-14 2014-15 2015-16
Data source: GTA (2016)
Such wide spread exemption indicates the ACCC’s view that bulk handlers can come to fair commercial terms with traders using their port facilities and the export grain market is starting to self-regulate; not requiring the ACCC to mandate terms on port access. National port capacity has increased during the past five years, with new investment at Newcastle and
TABLE 5.1 Ports and service providers granted exemption from Parts 3 to 6 of the port access code
Port location (service provider) Date exemption was granted
Port Kembla (GrainCorp) 1 April 2016
Port Kembla (Quattro) 1 April 2016
Adelaide (Patrick) 1 April 2016
Brisbane (GrainCorp) 24 September 2015
Brisbane (Queensland Bulk Terminals) 24 September 2015
Bunbury (WAPRES) 30 September 2015
Newcastle (NAT) 30 July 2015
Newcastle (Qube) 30 July 2015
Melbourne (Emerald) 25 June 2015
Geelong (GrainCorp) 25 June 2015
Newcastle (GrainCorp) 30 September 2014
Port Kembla in NSW, Bunbury in WA, Portland in Victoria, Port Giles in South Australia and Brisbane either completed or in planning. Total port capacity is now estimated at more than 40mt, which is in excess of the needs of the export task in the foreseeable future.
FIGURE 5.4 Up-country grain receival sites in the bulk handling system

46GRAIN GROWERS LIMITED STATE OF THE AUSTRALIAN GRAIN INDUSTRY 2016
5. GETTING GRAIN TO MARKET
Excess capacity in the bulk handling system is however not necessarily reflective of excess investment because excess capacity is necessary to facilitate a) growth in the Australian crop, b) operational flexibility and c) segmentation of grains in the system and delivery of quality grains (see Reference 5.1 The importance of excess capacity in the bulk handling system).
Grain shippingShipping costs have dramatically fallen over the past 5–7 years, from highs just prior to the global financial crisis (GFC) to 30-year lows as a result of extensive ship building during the late 2000s. This has heightened competition in Australia’s close international grain markets because with lower freight rates they are more contestable for a wider range of suppliers.
For example, the freight cost for grains exported from Australia to South Korea has fallen from highs in 2008 of close to $60 per tonne, to between $25–30 per tonne in 2010, and then down to just under $15 per tonne in 2015 (Figure 5.5). The differential between this freight route and the Pacific North West during this time moved from positive to negative, illustrating that not only have freight costs fallen significantly, but other more substantial efficiencies in bulk shipping must be delivering increased competitiveness to grain from the US and Canada in the South Korean market.
By contrast, while the cost of freight to Saudi Arabia has also fallen significantly for all suppliers, the differentials between shipping routes show Australia still enjoys an advantage over shipping from the Pacific North West to the Gulf states, but Australia has lost an advantage over EU origin grains to the Middle East during more recent years.
Only a small proportion of Australian grain is exported by shipping container — about 15% and in some years closer to 20% — an increase from less than 10% during the early 2000s. This is a result of: greater competition in the market, as there is a larger number of smaller exporters (including farmers); container rates being reasonable, due to high volumes of back-loading into Asian markets; and containers suiting the infrastructure of some markets experiencing increased demand. Pulses, for example, are most often sold in container-sized consignments, while in some markets there are limitations on bulk grain receival.
Efficiency key to competitivenessIn many respects the future and competitiveness of Australian grain is in the hands of the supply chain partners. The multinational perspective of many of these partners, both in grain movement and in marketing, distracts from the task of selling Australian grain well. This is in contrast to the interests of Australian
FIGURE 5.5 Shipping freight costs to South Korea — Australia versus United States
70
60
50
40
30
20
10
0
6.25
5.00
3.75
2.50
1.25
0
-1.25
-2.50
Frei
ght
cost
s (U
S$/t
)
Frei
ght
cost
dif
fere
ntia
l (U
S$/t
)
2006 2007 2008 2009 2010 2011 2012 2013 2014 2015
Australian freight advantage overPacific North West (RH axis)
Australia to South Korea (LH axis)
$2.53
$4.97
-$0.26-$0.50
-$2.25 -$0.83
Data source: IGC (2016)

47 GRAIN GROWERS LIMITED STATE OF THE AUSTRALIAN GRAIN INDUSTRY 2016
grain growers, who are with one aim — a prosperous Australian grains industry over the long term.
Grain transport, storage and network systems vary significantly around the globe, with elements of some systems highlighting potential efficiencies for Australia’s system. Other systems demonstrate where their gains will be made into the future. Investment is critical to meet these competitor challenges.
While expectations are for international freight costs to increase in the medium to long term, particularly as vessels are retired, new bulk handling ships will continue
Reference 5.1 The importance of excess capacity in the bulk handling system
Excess capacity is an important feature of the Australian grain bulk handling system mainly because it can facilitate a greater number of grain segregations. Multiple segregations allow bulk handlers to separate and preserve grains according to their type and their quality. The greater the number of segregations, the more closely the needs of customers can be met, and more closely can the prices paid to grain farmers reflect the attributes they have delivered.
In the absence of segregations, grains of a wider range of qualities are co-mingled to provide an average quality of product and growers then tend to be paid an average price reflecting the co-mingled quality of their product: an average quality system. Such a system does not deliver product to meet the finely specified needs of customers and it does not incentivise grain farmers to respond to customer demands. If finer segregations can be conveyed in the bulk system, they make possible a more efficient market exchange and an increase to the overall value and international competitiveness for Australian grains.
However, there is a trade-off between the cost increases involved in finer segregations in the bulk handing system and the extent to which the value of the grains is increased. Separating grains by type and quality presents the potential problem of under-utilising storage facilities and can result in significant opportunity costs for the bulk handler. For example, if a 5000 tonne bulk silo is used for storing 1000 tonnes of a particular variety of malting barley, the opportunity cost for the bulk handler is not being able to capture 4000 tonnes of handling revenue from that
silo. If the remaining 4000 tonnes of unused capacity was utilised by taking delivery of another variety of malting barley or a different quality grade of the same variety, the co-mingled grain from that silo may not meet the needs of the end user. So when bulk handlers make decisions around what grain types to handle for customers, there are very clear trade-offs.
As total annual production approaches the capacity of the bulk handling system over time, the number of segregations will become limited, so investment in some excess capacity is desirable. Just as important, however, is the composition of available capacity. If a number of smaller silos, for example, are replaced by a smaller number of larger storage silos, the ability of the Australian grains industry to deliver to specific customer needs will be reduced. Greater use of containerised exports and on farm storage may be required to underpin Australia’s quality proposition into the future. In itself, this is not necessarily an adverse outcome, however, the diversion of grain out of the bulk handling system undermines the system’s efficiency potential. So there is an underlying incentive, perhaps not always recognised in short term planning horizons, for bulk handling facilities to maintain excess capacity, and a greater number of segregations.
A greater number of smaller segregations results in total storage losses and higher costs per tonne; fewer large storages results in cheaper storage and lower overall capital cost of storage per tonne. These conflicting short and long-term drivers of commercial and industry performance underline the need for high level and coordinated strategic planning in the industry
to become larger and more efficient forcing downward pressure on freight costs into the future. Shipping costs, just as much as domestic supply and transport costs, drive Australia’s competitiveness in international markets. Where domestic costs can be reduced, it is in the interests of the industry and the Australian economy, to make improvements. Where costs, such as shipping freight rates, are without Australian influence, it is crucial the whole industry ensures the supply proposition of Australian grain to our international buyers, is about much more than price.
48GRAIN GROWERS LIMITED STATE OF THE AUSTRALIAN GRAIN INDUSTRY 2016
5. GETTING GRAIN TO MARKET
Reference 5.2 Grain receival standards
Grain receival standards describe the particular qualities and characteristics of specific grades of various grain commodities with reference to common characteristics, such as protein, moisture and screenings, and also defective characteristics or contaminants. The use of agreed or defined standards facilitates contracting by providing common reference points on which stakeholders can base negotiations. Standards are principally intended to be ‘trade standards’ (e.g. for use in domestic contracts between trade and trade, trade and producer, and trade and end-user).
While receival standards are voluntary, they are widely accepted based on their use across the bulk handling system.
The standards that apply to grain are developed for each commodity (and reviewed annually) by a ‘standards committee’ comprising the range of stakeholders with expertise in grain quality and/or analysis, and are based on a range of factors. These include but are not limited to:
n market requirements
n regulations for quality or quarantine of the importing country government
n relevant food safety laws
n requirement to improve quality of grain supplies
n competitor grades and quality
n available quality of grain given restrictions of varieties, growing and harvesting conditions, pest and disease resistance of the crop
n international protocols, such as those developed by Cartagena and the Codex Alimentarius Commission
n ability of the storage system to segregate or commingle grain
n land protection and quarantine laws.
Within each grain type there may be a number of different receival standards reflecting the various grades for that commodity, such as No.1 milling, No.2 milling or feed. Not all grain types have the same range of grades.
n Milling grades are generally higher-priced grades delivering grain suitable for the high-quality end of the market. Frequently the grain or processed product is destined for the human consumption market.
n Feed or ‘off-grade’s are traditionally created as a poorer quality segregation due to a defect or contamination issue associated with a milling grade. However, while these grades may be created, feed users may require a higher quality than these feed or off-grades. In some cases, many of the quality specifications are equal to the main milling grade. Thus feed grades can comprise either: grain that did not meet the milling grade specifications, or grades destined for stockfeed or industrial uses. Increasingly feed grade grains are being bred or designed specifically to create a quality suited for the feed market.
For some commodities, the standard to apply at receival does not apply at out-turn of the grain to the marketplace. The differences may relate to the inability to maintain the quality during storage, or the potential for contamination n during storage and transport. For many pulse crop,s such as faba beans, there is a receival standard and an export standard due to the tendency of these grains to split during storage and handling and so they have a higher defective grain count on out-turn than at receival.
All GTA standards are published for application as of 1 August each year.
Source: Adapted from A GUIDE TO GTA GRAIN TRADING STANDARDS 2015/16 SEASON
Image courtesy Roz Brownvillie, Condamine, Qld
49 GRAIN GROWERS LIMITED STATE OF THE AUSTRALIAN GRAIN INDUSTRY 2016
6. GOVERNMENT AND GRAINS
In the context of specific post deregulation government initiatives, the Australian Government’s approach has been largely consistent with ongoing minimal market intervention. While industry and supply chains continue to adjust to a post-deregulation environment, a number of government reviews and initiatives have merely tweaked the policy settings that relate to the Australian grains industry.
This is also consistent with the approach across agriculture, and economy-wide initiatives more broadly. Economy-wide initiatives, such as competition policy and taxation reform, are slow to progress, while agriculture-sector-specific initiatives, such as the National Food Plan and Agricultural Competitiveness White Paper have delivered some policy outcomes likely to encourage growth in the grains industry.
Areas where the Australian Government invests in specifically supporting the agricultural sector include: tax concessions (such as Farm Management Deposits (FMD), which allow income averaging), drought assistance (such as farm household assistance, concessional loans), natural resource management (such as Landcare), and research development and extension (such as through the
GRDC). Each of these measures are valid in a market economy based on their consistency with spill-overs to industry, the environment and the generation of social benefits. Further, they are in accordance with WTO commitments as they are de-coupled from market volumes and prices. Beyond investment and industry coordination endeavours, the Australian Government has achieved a variety of policy outcomes through regulation.
Post deregulation policyA number of government reviews have been undertaken in recent years to work through the remaining transitional elements of deregulation in the Australian wheat export industry. The most significant review process occurred through the Wheat Industry Advisory Taskforce (WIAT), which was established during 2013 to examine and make recommendations to industry and government on issues that may affect the efficient operation of the wheat export industry supply chain.
The WIAT undertook specific inquiries into grain pools as financial products, wheat stocks information and wheat export quality management. These inquiries, which were completed in 2014, concluded there was little case for government intervention or
Following deregulation there was a range of inquiries specifically aimed at addressing the transition of the wheat industry to a fully-exposed international sector. For the most part these, and subsequent recommendations, have been brought to bear, to the mixed satisfaction of industry.
Image courtesy CBH Group

50GRAIN GROWERS LIMITED STATE OF THE AUSTRALIAN GRAIN INDUSTRY 2016
6. GOVERNMENT AND GRAINS
involvement. The most significant recommendation from WIAT was for a voluntary wheat stocks reporting scheme to be established. The Australian Government endorsed this recommendation, which resulted in the eventual commissioning of the Australian Export Grains Innovation Centre (AEGIC) to undertake a pilot reporting scheme, following an earlier project, funded by GrainGrowers Ltd, for ABARES and the ABS to extend previous reporting. However, reporting on wheat stocks is a divisive topic in the Australian grains industry and the pilot scheme was not endorsed by industry.
In addition to the inquiries, the WIAT also recommended appropriate use of the funds held in the Wheat Industry Special Account (WIS Account). The WIS Account contained surplus money held by Wheat Exports Australia (WEA) at the time of its wind-up in 20126. The WIAT recommendations in this regard noted the WIS Account funds should be used to fund the voluntary stocks reporting scheme and that remaining funds should only be used as per the intentions stipulated in legislation for the WIS Account (i.e. for the good of the wheat export industry or a sector of the industry).
As of July 2016, $3.41m remained of the WIS Account funds. As the account was dissolved following the introduction of the Port Terminal Access (Bulk Wheat) Code of Conduct (the Code) in September 2014, the funds are now held by the GRDC under the provision they can only be used as per their original intentions. The Australian Grains Industry Discussion Group (AGIDG) is actively working through options for use of the funds, including the opportunity for developing an overarching Grains Industry Strategy.
Introducing the Code was a significant step in deregulating the Australian grain export sector. The Code changed governance of port access arrangements from a system of access undertakings with the ACCC to a mandatory Code under general competition law. The Port Terminal Access Code provides flexibility and opportunity for reduced regulatory requirements based on market situations, while retaining base level transparency requirements for all port operators. The Minister for Agriculture and the ACCC have decision-making roles under the Code to exempt particular ports from the more onerous provisions of the Code (i.e. Parts 3–6). The ACCC has provided most ports with exemptions from Parts 3–6 of the Code, following competition assessments (see Table 5.1). Due to provisions under the Code for special consideration of cooperative-owned port terminal service providers, the Minister for Agriculture provided an exemption to CBH from Parts 3–6 of the Code.
The issuesTrade and market access
An area where government has clearly changed its approach during recent years has been in the negotiation of preferential trade agreements. While the current Coalition government has been successful in sealing agreements with Korea, Japan and China, this has partly been due to their approach in prioritisation and making trade-offs between industries and commodities. It could be argued the gains made for industries such as red meat and dairy, have been at the expense of other sectors, such as grains. This heightens the need for the Australian grains industry to have a strong presence in the trade policy arena. A need for a close working relationship with government is further highlighted by the increasing prevalence of tighter technical trade barriers to importing nations. Technical requirements, such as quarantine, can only be managed through government-to-government dialogue, but must be driven by industry experience. To ensure the ongoing benefit of international markets and growth in them, it will be important increased policy effort focuses on addressing these technical trade barriers, including a strong government-industry partnership.
Freight infrastructure challenge
The government’s role in investing directly, or through public-private partnerships, in road and rail infrastructure remains underdeveloped when compared internationally. Key areas for upcoming focus are likely to include road pricing reform, improving the effectiveness of transport regulatory systems (such as the National Heavy Vehicle Regulator), and the development of public-private-partnership investment models specifically for rural infrastructure projects.
Foreign investment
On the back of higher food prices internationally, and growing concerns about food security, there has been increasing interest in the purchase of agricultural land and agribusinesses in Australia, including in the grains industry. Foreign investment in Australian agriculture is not new and has, in fact, been an important part of developing sectors of Australian agriculture.
Increased interest has led to foreign investment and related regulatory approaches receiving enhanced focus from policy makers during recent years. This has resulted in the introduction of a register to monitor ownership of various agricultural asset classes and the lowering of the threshold for the level of investment required before Foreign Investment Review Board (FIRB) scrutiny is applied. With recent changes, investors
6 Surplus funds were accumulated by Wheat Exports Australia through the Wheat Export Charge (charged at 22c/tonne of wheat exported).
51 GRAIN GROWERS LIMITED STATE OF THE AUSTRALIAN GRAIN INDUSTRY 2016
are required to apply to the FIRB for approval if the investment is more than than $15m (for agricultural land), $55m (for agribusinesses) and any value for cumulative investment by foreign government investors.7 The 2014 rejection of ADM’s proposed takeover of GrainCorp was on the basis of failure to be in the national interest.
Risk management
Risk management in terms of production and price remain a key focus for the Australian grains industry and this trend is likely to increase in importance in the face of an increasingly variable climate. In recognition of the high level of variability of the Australian climate and exposure of farm businesses, governments across Australia deliver a range of policy instruments to help manage this risk, especially in response to drought.
Following a number of reviews, the Commonwealth Government removed the Exceptional Circumstances framework and Interest Rate Subsidies in 2012. Since that time, drought policy has been operating within a Commonwealth-State Inter-governmental Agreement, focusing support towards encouraging drought preparedness and resilience. The Agreement maintains a focus on: farm household allowance; farm management deposits and taxation measures; a national approach to farm business training; a coordinated, collaborative approach to the provision of social support services; and tools and technologies to better inform farmer decision making.
While the Agreement remains in place, specific programs delivered within this Agreement continue to evolve. The taxation system also provides a range of instruments to smooth fluctuating incomes and these are regularly updated to keep pace with the changing nature of farm businesses.
Through the Agricultural Competitiveness White Paper, the Commonwealth Government announced the delivery of programs to support growers to better manage drought and other adverse seasonal conditions through:
n improved seasonal forecasting through the Bureau of Meteorology (BoM)
n accelerated depreciation schedules for investment in some preparedness assets
n enhanced funding for social and community support
n extension and improvements to the drought concessional loan program
n improvements to the FMD schemen funding to manage weeds and pest animals in
drought-affected areas.
An increase in the number and size of FMD used by the grain sector (Figure 6.1) is driven by increased cash receipts over the past 5 years but will also be, in part, due to improvements to the program.
The Agricultural Competitiveness White Paper also saw the announcement of funding towards risk management grants, with the aim of encouraging growers to consider multi-peril crop insurance (MPCI) products. The commercial MPCI market is slowly developing in Australia, with growers being offered the choice of a number of products for the 2016 winter cropping season. As the market evolves, there is a variety of views on the role of government in stimulating the development of the market and encouraging uptake of MPCI products.
Finding a balance between government adequately supporting growers through drought, and promoting growth of a productive, resilient and self-reliant sector is likely to remain a challenge for Australian agricultural policy makers.
Environment and natural resources
The challenges posed by a variable climate and the related international level of greenhouse gas emissions has provoked a variety of domestic policy responses in recent years. The role Australia will play in international efforts to reduce greenhouse gas emissions, and more specifically the role of agriculture, have been points of contention and difference between major political parties. The current Government’s approach centres on an Emissions Reduction Fund (ERF), which for the agriculture sector allows land managers to store carbon or reduce greenhouse gas emissions on their land to earn credits, which can then be sold to people or businesses who wish to offset their emissions. The ERF subsumed the previous Carbon Farming Initiative (CFI) during late 2014 and changed the way landholders could engage with the program. The Clean Energy Regulator (CER), who purchases emissions reductions identified as the lowest cost through a reverse auction process, operates the ERF.
During late 2015, as part of a combined international agreement agreed at the Paris United Nations Climate Conference, the Commonwealth Government committed to a target of 26–28% less than 2005 emission levels by 2030. Recent reporting by the Commonwealth Government indicates Australia will already meet, in cumulative abatement terms, the Government’s previous target of a 5% reduction in emissions on year 2000 levels by 2020. However, debate is still open as to whether the policy settings in place will deliver the new commitments to emissions reduction.
7 These thresholds are varied for some nations as a result of trade agreement negotiations.
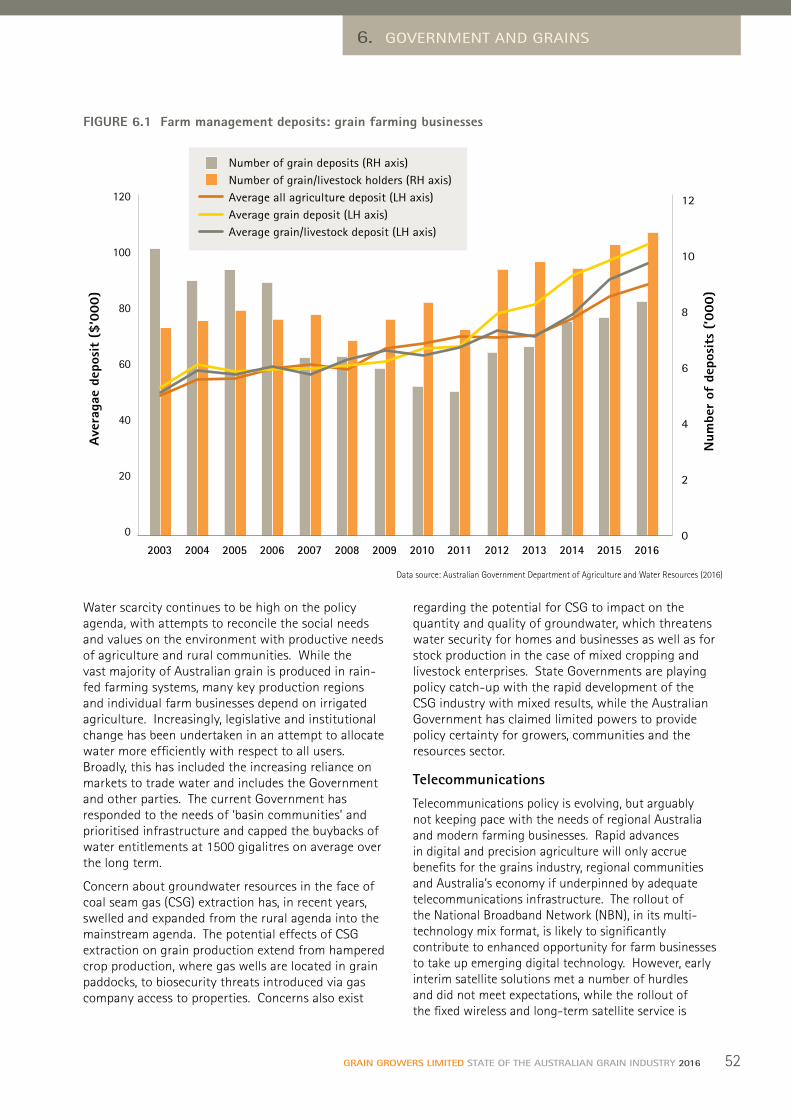
52GRAIN GROWERS LIMITED STATE OF THE AUSTRALIAN GRAIN INDUSTRY 2016
6. GOVERNMENT AND GRAINS
Water scarcity continues to be high on the policy agenda, with attempts to reconcile the social needs and values on the environment with productive needs of agriculture and rural communities. While the vast majority of Australian grain is produced in rain-fed farming systems, many key production regions and individual farm businesses depend on irrigated agriculture. Increasingly, legislative and institutional change has been undertaken in an attempt to allocate water more efficiently with respect to all users. Broadly, this has included the increasing reliance on markets to trade water and includes the Government and other parties. The current Government has responded to the needs of ‘basin communities’ and prioritised infrastructure and capped the buybacks of water entitlements at 1500 gigalitres on average over the long term.
Concern about groundwater resources in the face of coal seam gas (CSG) extraction has, in recent years, swelled and expanded from the rural agenda into the mainstream agenda. The potential effects of CSG extraction on grain production extend from hampered crop production, where gas wells are located in grain paddocks, to biosecurity threats introduced via gas company access to properties. Concerns also exist
regarding the potential for CSG to impact on the quantity and quality of groundwater, which threatens water security for homes and businesses as well as for stock production in the case of mixed cropping and livestock enterprises. State Governments are playing policy catch-up with the rapid development of the CSG industry with mixed results, while the Australian Government has claimed limited powers to provide policy certainty for growers, communities and the resources sector.
Telecommunications
Telecommunications policy is evolving, but arguably not keeping pace with the needs of regional Australia and modern farming businesses. Rapid advances in digital and precision agriculture will only accrue benefits for the grains industry, regional communities and Australia’s economy if underpinned by adequate telecommunications infrastructure. The rollout of the National Broadband Network (NBN), in its multi-technology mix format, is likely to significantly contribute to enhanced opportunity for farm businesses to take up emerging digital technology. However, early interim satellite solutions met a number of hurdles and did not meet expectations, while the rollout of the fixed wireless and long-term satellite service is
FIGURE 6.1 Farm management deposits: grain farming businesses
120
100
80
60
40
20
0
Ave
raga
e de
posi
t ($
‘000
)
Num
ber
of d
epos
its
(’00
0)
12
10
8
6
4
2
0
Number of grain deposits (RH axis)Number of grain/livestock holders (RH axis)Average all agriculture deposit (LH axis)Average grain deposit (LH axis)Average grain/livestock deposit (LH axis)
2003 2004 2005 2006 2007 2008 2009 2010 2011 2012 2013 2014 2015 2016
Data source: Australian Government Department of Agriculture and Water Resources (2016)

53 GRAIN GROWERS LIMITED STATE OF THE AUSTRALIAN GRAIN INDUSTRY 2016
just starting to see results. To further close the gap on telecommunications services, the Australian Government has started co-investing in expanding mobile coverage, which is critical to underpin connectivity of farming operations in the paddock.
Access to chemicals
Grain businesses require safe access to a full range of effective chemicals to manage the weeds, pests and diseases that undermine farm profitability. While the Australian grains industry is a major exporter, it is a relatively small producer, and as a result is only a small agricultural chemical market on the global stage. Together with strict regulatory requirements, a small market often means insufficient incentive for chemical manufacturers to develop and register new products for use in Australia. This places Australian grain growers at a disadvantage to growers in competitor nations who have superior access to new and improved chemicals with greater efficacy. The Australian grains industry will need to play a proactive role to ensure safe and effective products are available into the future. The Australian Government’s agricultural and veterinary chemical reform agenda, along with investments in minor use programs play a much-needed role in this area. With the current cost of weeds alone to the grains industry in Australia, estimated at almost $3.3 billion a year (Llewellyn et al, 2016) and also the second-highest number of herbicide-resistant weeds in the world, it is critical further progress is made to develop collaborative partnerships with industry, government and research institutions, along with ongoing farming systems research to continue delivering non-chemical solutions for weeds, pests and diseases.
Research, development and extension
The basic architecture of a rural research and development corporation (RDC) has remained largely stable in recent years (see Reference 6.1: The RDC model and grains) although the threat of the Government removing its matching contributions remains real.
During 2013, minor legislative changes provided statutory RDCs some of the flexibility and accountability capabilities of those commodities
established as industry-owned companies. One of the key changes was to provide the opportunity for statutory RDCs to undertake marketing functions.
Due to an expanding grains industry and a levy model based on an ad valorem rate, funds available to the GRDC have increased significantly during recent years (Table 6.1). Overall, Australia has had little growth in real agricultural R&D investment since the mid-1970s. Analysis has shown a time lag of several decades for the impact of R&D investment to show up in agricultural productivity (Sheng, et al, 2011). Going forward it is important industry and government regularly monitor the level of investment in RD&E to ensure Australia remains internationally competitive.
In addition to the total quantum of investment, it is also important to monitor the balance of investment to ensure both the needs of strategic research, applied research, and extension and adoption are taken into account.
The Grains Industry National RD&E Strategy contributes to building a more coordinated and collaborative approach to Australia’s RD&E activities through increased stakeholder (grower, industry and government) engagement across public and private sector organisations. National research programs form the core of the Strategy and aims to improve the efficiency of the existing national research effort across the universities, the regional development and extension networks, other research providers and GRDC by increasing information flow, maintaining funding and reducing fragmentation and duplication of effort. A key goal of the National RD&E Strategy is grains industry Total Factor Productivity (TFP) growth of more than 2.5 per cent per annum (within a decade) while sustaining the resource base and improving market position.
In 2015 the GRDC announced an update of their research investment portfolios to account for these needs (GRDC, 2015). However, further work is still required to ensure this balance is underpinned with a sound quantification of grower benefits from each area and that industry considers the variety of possible options for levy investment (such as market promotion and support).
TABLE 6.1 Levy payer and government contributions to the GRDC
2000–01 2004–05 2010–11 2011–12 2012–13 2013–14 2014–15
$millions/year
Grain farmer levy 48.9 64.2 104.5 97.7 118.2 120.2 117.5
Government 34.5 35.7 53.4 55.9 62.8 68.6 68.0
Data source: GRDC Annual Reports

54GRAIN GROWERS LIMITED STATE OF THE AUSTRALIAN GRAIN INDUSTRY 2016
6. GOVERNMENT AND GRAINS
Significant commentary and research exists into the ‘unravelling’ of the agricultural extension system in Australia (for example, Hunt et al, 2012). However, little policy change has been enacted at a national level to address the current and emerging issues. It is important the evolution of agricultural extension systems is closely monitored in Australia with a broadening gap between leading and low-performing farm businesses.
Partnerships the key to an international futureThe Australian grains production sector directly contributes $13.5bn to the Australian economy annually and generates more than 170,000 jobs across the country and exports of $11.5 billion. On their own, these metrics offer sufficient cause for the government to work collaboratively with the industry to help assist it to succeed: the losses the economy faces
from the sector not operating at its full potential are substantial, and the flow-on effects are significant. The government must continue to support this industry, which underpins rural and regional communities across Australia. Policy settings that generate an environment conducive to the industry’s success, and with recognition of the spill-over benefits the industry generates across the supply chain, and across the economy, are imperative.
As an industry, coordination is integral to facilitating the necessary working relationships with government and to drive the coordinated activities and functions to support the production and trade that will make or break the future of the industry in this internationalised era.
Reference 6.1 The RDC model and grains
Features of the agriculture sector that contribute to market failure in RD&E and marketing include:
n a large number of small businesses without the scale to undertake significant research and development of marketing activities in their own right
n the lack of incentive and capacity for individual businesses to invest in marketing and R&D on their own
n the ‘free rider’ effect
n the spill-over benefits of rural R&D that are captured by the broader community.
In the absence of the Government and Industry RDC partnership intervention, this situation would result in severe under investment in RD&E and marketing, which would have a detrimental impact on the rural sector and the Australian economy more broadly. Recognising this, for more than 25 years, the Australian Government and Australian farmers have co-invested in agricultural RDCs to deliver R&D and marketing services for industry and community benefits.
There are currently 15 RDCs in Australia. Of these, five operate under a statutory RDC governance model (including the GRDC) and 10 operate under an industry-owned corporation (IOC) model. The RDCs are funded primarily by statutory R&D levies on
various commodities. To expand Australia’s rural R&D efforts, government matches eligible R&D expenditure, up to 0.5% of the determined industry gross value of production (GVP). RDCs are accountable to both industry and government.
The levies specified for the purpose of the GRDC are accompanied by other special-purpose levies mandated under the Plant Health Australia (PHA) Funding Act 2002 (PHA levy and the Emergency Plant Pest Response [EPPR] levy) and the National Residue Survey (Excise) Levy Act 1998 (National Residue Survey [NRS] levy).
The GRDC has helped the continual shift of the technological frontier and provided growers with the tools to enhance their productivity. Successive governments and levy payers have continued to support the rural RDC system, recognising the important benefits delivered for growers, their communities and the broader Australian economy.
Currently, discussions are progressing within the Australian grains industry regarding the most appropriate model to serve grains RD&E (and potentially marketing) services into the future. As grains industry representative organisations (appointed as per the PIRD Act), Grain Growers Limited and Grain Producers Australia are actively considering whether the shift to an IOC model may deliver better outcomes for grain levy payers and the breeder industry.
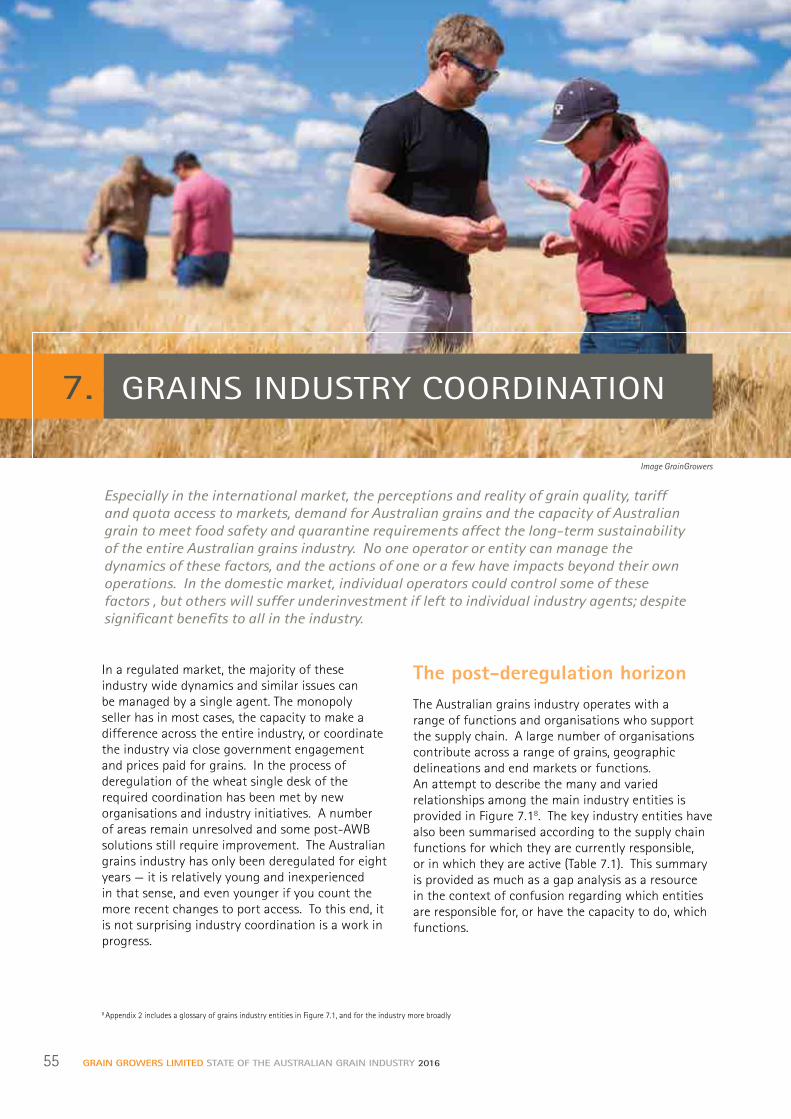
55 GRAIN GROWERS LIMITED STATE OF THE AUSTRALIAN GRAIN INDUSTRY 2016
7. GRAINS INDUSTRY COORDINATION
In a regulated market, the majority of these industry wide dynamics and similar issues can be managed by a single agent. The monopoly seller has in most cases, the capacity to make a difference across the entire industry, or coordinate the industry via close government engagement and prices paid for grains. In the process of deregulation of the wheat single desk of the required coordination has been met by new organisations and industry initiatives. A number of areas remain unresolved and some post-AWB solutions still require improvement. The Australian grains industry has only been deregulated for eight years — it is relatively young and inexperienced in that sense, and even younger if you count the more recent changes to port access. To this end, it is not surprising industry coordination is a work in progress.
The post-deregulation horizonThe Australian grains industry operates with a range of functions and organisations who support the supply chain. A large number of organisations contribute across a range of grains, geographic delineations and end markets or functions. An attempt to describe the many and varied relationships among the main industry entities is provided in Figure 7.18. The key industry entities have also been summarised according to the supply chain functions for which they are currently responsible, or in which they are active (Table 7.1). This summary is provided as much as a gap analysis as a resource in the context of confusion regarding which entities are responsible for, or have the capacity to do, which functions.
Especially in the international market, the perceptions and reality of grain quality, tariff and quota access to markets, demand for Australian grains and the capacity of Australian grain to meet food safety and quarantine requirements affect the long-term sustainability of the entire Australian grains industry. No one operator or entity can manage the dynamics of these factors, and the actions of one or a few have impacts beyond their own operations. In the domestic market, individual operators could control some of these factors , but others will suffer underinvestment if left to individual industry agents; despite significant benefits to all in the industry.
8 Appendix 2 includes a glossary of grains industry entities in Figure 7.1, and for the industry more broadly
Image GrainGrowers

56GRAIN GROWERS LIMITED STATE OF THE AUSTRALIAN GRAIN INDUSTRY 2016
7. GRAINS INDUSTRY COORDINATION
FIGURE 7.1 Australian grains industry entities — primary relationships
GTA
Commonwealth Government (and statutory/department functions eg. APVMA, NRS, OGTR)
State governments and agencies
PHALevies and matched
contribution
GRDC
Misc corporates, merchants and
service providers
R&D
Lev
y
Dee
d si
gnat
ory
PIRD
Act
Res
pons
ibili
ties
NRS
Lev
y
PHA
Lev
y
AOF*
PA*BA
AGEA
GLNC WQA AEGIC NWPGP Industry fora
AGIDGAGEA
GrainGrowersGPAGTAPA
AOF
GIMAFBoard: GPA,
AGEA, PA, AOF, ASF, AFIA
GPPEICCDAWRAFPA
GrainGrowersAFIAAGEAAMAANICAOFASFPA
RGAGPA
GTABulk Handlers
and Port Operators (Western, Southern, Eastern)
NFF
Commodity associations, eg.
MAA*
Several SFOs and state merchant/
supply chain associations
Grain trading, export and processing, and storage companies
GPA
Gra
inG
row
ers
Growers of cereals, oilseeds and pulses (25 leviable crops)
State farming/grain organisations
PIRD Act Responsibilities
Commercial food and
industry partners
DAFWA GTA
DAWR BA Grain Export program
Formal relationships
Memberships
$ Flow
* Commodity association membership generally comprises across the supply chain members including agronomists, processors, traders etc.
GIWA
57 GRAIN GROWERS LIMITED STATE OF THE AUSTRALIAN GRAIN INDUSTRY 2016
Closer collaboration required There is clearly duplication of effort across a number of areas and the possibility exists to consolidate functions within more sustainable entities with real efficiency gains and closer industry collaboration.
The overhaul, and in some cases establishment, of functions and industry interactions following removal of the wheat single desk, has been followed by a period of unease where some functions have not been filled, coordination is inadequate, and others have been managed unsustainably. This is not characteristic of the entire grains industry and progress has been made since 2010. For example, the Australian Oilseeds Federation (AOF) and Pulse Australia (PA) have considered the coordination of operational functions to deliver efficiencies, and GrainGrowers transferred its analytical and technical services (formerly the Bread Research Institute (BRI)) division to AEGIC during late 2015. Similarly, incorporation of WQA and the Grain and Legume Nutrition Council (GLNC) within other agencies has been discussed to deliver efficiencies both in terms of overheads and best utilising and coordinating technical capacities.
Some important cross-industry functions are funded, mostly through the GRDC, by the levies on grain production and matching government funding. The trade sector has no comparable funding base on which to support cooperative industry RD&E.
At this point in time, the Australian grains industry has no sustainable funding base or agreed structure to support market-facing activities, such as promotion and technical support9. For the production sector this is primarily limited because the GRDC has not been given the mandate to undertake such activities, even though the Primary Industries Research and Development (PIRD) Act has been amended with the intention to allow statutory research and development corporations, like the GRDC, the latitude to do so at the request of levy payers10.
Some industry-wide issues are currently addressed via the Australian Grains Industry Discussion Group (AGIDG), which represents interests across grain crops and the supply chain (Figure 7.1). This unincorporated forum is not necessarily sustainable, as it is operated with rotating secretariat responsibility among the members and has no
funding base or binding commitments. The AGIDG has been working on matters such as the strategic allocation of the WIS Account residual funds. The balance, and bulk of industry-wide issues, are dealt with via a range of committees, forums and disconnected entities.
Missing link in competitivenessWhile there are number of areas supporting the Australian supply of grain to end-users that could benefit from improved coordination and resourcing, a key area of concern is that since deregulation there has been no coordinated international marketing and support for Australian wheat sales.
This is a considerable missed opportunity when assessment of United States Department of Agriculture (USDA)/Foreign Agriculture Service (FAS) market development spending, including for grains, has found significant benefits for their international marketing and promotion. The estimated benefit cost return to USDA market development spending is 14.6:1 for government expenditure and 6.7:1 for government and industry expenditure (IHS Global Insights, 2010).
Some private companies have dabbled in this space, such as the former Bread Research Institute (BRI) and GGL, through industry-coordinated conference events like AGIC-Asia and the government has contributed via Austrade, but there is no coordinated and continuous whole-of-supply-chain effort.
US Wheat Associates, the US Grains Council and the Canadian International Grains Institute (CIGI) each coordinate international marketing, promotion and technical support for their respective industries. The equivalent of up to 50c per tonne of cereal and coarse grains exported from North America is spent on these industry-wide services (Table 7.2). Funding is from compulsory check-off payments, government funding and other income, which includes funds from supply chain partners.
A coordinated whole-of-supply-chain approach to supporting the international presence and reputation of Australian grains is needed to prevent the market failure that prevails in the absence of coordination. If an individual firm or sector of the supply chain undertakes industry marketing, international support or promotion in isolation, efforts will be subject to market failure effects. That is, under-promotion will
9 The Australian Grains Export Innovation Centre (AEGIC) is a GRDC and DAFWA initiative, which provides research and analysis relating to the international markets, however, it does not include promotion and technical support per se.10 A recent move to apply this in the Australian fisheries sector revealed the amendments were not comprehensive. Current adjustments to the legislation are in train to facilitate the full intentions of the earlier amendment and allow statutory RDCs the ability to undertake marketing activities.

58GRAIN GROWERS LIMITED STATE OF THE AUSTRALIAN GRAIN INDUSTRY 2016
7. GRAINS INDUSTRY COORDINATION
TABLE 7.1 Grain industry entities and supply chain functions
Supply chain functions Grain industry entities responsible for the relevant functionsProduction, practices and pre-breeding R&D
The GRDC, state departments of agriculture, CSIRO, commercial providers
Variety breeding 20 different consortia with a mix of private, university, government and industry investors
Seed production More than 100 registered seed grower members, Australian Oilseeds Federation
Variety classification Wheat Quality Australia, Barley Australia
Chemical and other farm inputs
Competitive market dominated by international manufacturers, and distributed through a small number of regional farm suppliers
Production 20,700 grain farm businesses
Production reporting ABARES at the request of, and funded by, the GRDC
Grower representation GrainGrowers, Grain Producers Australia, State Farming Organisations, National Farmers Federation
Contracts and arbitration
Grain Trade Australia and private contracts, with Grain Trade Australia or common law arbitration
Transport Road accounts for 50% of transport and is entirely privately operated. Rail is commercially operated above rail, and infrastructure is a combination of private and public partnerships and regional arrangements.
Trading (receival) standards
A range of entities manage receival standards: for wheat and barley, it is Grain Trade Australia, for oilseeds it is Australian Oilseeds Federation and Pulses it is Pulse Australia. Western Australia has developed its own receival standards for all grains through the Grains Industry Association of WA.
Accumulation Commercial operators
Storage and handling Bulk storage and handling is dominated by the regional oliogopolies of CBH, Viterra, Cargill and GrainCorp.
Stocks information Post deregulation this was undertaken by ABARES/ABS funded with production sector funds, including from GrainGrowers, on a trial basis. Currently no comprehensive timely provision.
Export standards (phytosanitary and quarantine compliance)
The Australian Government Department of Agricultural and Water Resources Plant Export Operations Unit, the National Residue Survey and the Grain and Plant Product Export Industry Consultative Committee.
Export quality Managed by export marketers and bulk handlers with reference to national grades.
Ports and services Commercial operators with a combination of ownership and lease arrangements.
Sales Approximately nine large exporters, 24 medium exporters, and some 200 traders, brokers, assemblers and packers, that may or may not export consistently.
Trade and marketers representation
Australian Grain Exporters Association, Grain Trade Australia, Australian Oilseeds Federation, Pulse Australia
Shipping International commercial operators
Trade and market access strategy
GrainGrowers, Australian Government DAWR Trade and Market Access Division, DFAT, some state departments of primary industries
Technical market access
Grains Industry Market Access Forum working together with the Australian Government Department of Agricultural and Water Resources Export Operations Unit and the Grain and Plant Product Export Industry Consultative Committee reference committee.
Supply chain and markets analysis and reporting
Australian Export Grains Innovation Centre, a number of agribusiness banks, and some commercial firms.
Market technical support
Commercial entities and Australian Export Grains Innovation Centre.
Promotion and market development
Commercial export marketers do company promotion, with some providing technical support. The Australian Grains Industry Conference Asia provides industry wide promotion in key markets on an annual conference basis. Australian Export Grains Innovation Centre provides market development research.
Biosecurity Australian Government Department of Agriculture and Water Resources, Plant Health Australia and state departments of agriculture.
Aus
tral
ian
Gra
ins
Indu
stry
Sup
ply
Chai
n

59 GRAIN GROWERS LIMITED STATE OF THE AUSTRALIAN GRAIN INDUSTRY 2016
TABLE 7.2 International commodity promotion and market support for grains
US Grains Council US Wheat Associates Canadian International Grains Institute
Locations Domestic headquarters, Country Offices in China, Egypt, Japan, Korea, Mexico, Taiwan and Tanzania, Regional Offices in Tunis, Kuala Lumpur and Panama City plus 18 other representatives located internationally.
Domestic headquarters, Country offices in Phillipines, Japan, South Korea, China and Hong Kong and Nigeria and Regional offices in Mexico City, Santiago, Singapore, Rotterdam, Moscow, Cairo, Casablanca, Taipei, Cape Town
Domestic headquarters, Morocco
Funding mechanisms
2013Check-off/memberships (US$5.7m)Govt (US$13.1m)Other Income (US$8.1m)
Total: US$28.1m
2010Check-off (US$4.7m)Govt (US$12.2m)Other income (US$0.1m)
Total: US$17.0m
2014Check-off (C$3.4m)Govt (C$4.0m)Other income (C$2.6m)
Total: C$10.0m
Metrics US$0.08/t producedUS$0.50/t exported
US$0.28/t producedUS$0.47/t exported
C$0.20/t producedC$0.36/t exported
NOTES: Analysis undertaken using data and information sourced from www.uswheat.org, www.grains.org, https://cigi.ca and publically available government reports.
occur because of the significant positive benefits to others or externalities (benefits will accrue to the whole supply chain and economy, not just to the firm or organisation that incurred the cost). This type of market failure warrants whole-of-supply-chain coordination, which would include exporters and growers of Australian grain. In the case of increasing globalisation of the grain handling and marketing chain, contribution by all sectors is even more important than ever.
Two further sources of externality lead to market failure and may warrant government support in the coordination of a supply chain approach. The first is the ‘halo effect’ that results in benefits for other agricultural products (or Australian products more generally) that are exported internationally. The second is that the benefits of a more competitive and profitable grain and farming sector leads to increasing growers’ prices and the higher tax revenue that follows, reduced government farm support payments, and improved returns for input suppliers. If these extra benefits are felt by the wider agricultural industry and Australian economy there will be compelling public interest in supporting international marketing efforts.
Prior to deregulation, maximisation of profit across the supply chain was the common or shared goal and market signals were transferred via the monopoly agent as prices through the supply chain. In a deregulated market each agent along the supply chain aims to maximise profit through competitive behaviour at their ‘functional’ point in the supply chain. Such competition leads to efficiencies, which impact the grains industry’s short-term competitiveness on international markets. However, where there is unequally distributed market power between supply chain partners (a function of grains supply chains which rely on natural monopolies for infrastructure provision) or in the international market place, the price mechanism fails to transfer the appropriate market signals, either: a) completely; or b) in a timely fashion. In this case, coordination of market signals is required. A common and valuable market proposition for Australian grains is key to coordinating market signals and operators in a way that grows the long-term value of the Australian grains ‘pie’.
Coordination is important not only for improving the market position of Australian grains, but even just maintaining the market position, whether that be against a slow erosion of position over time, or in the case of a serious market threat, such as a disease outbreak.
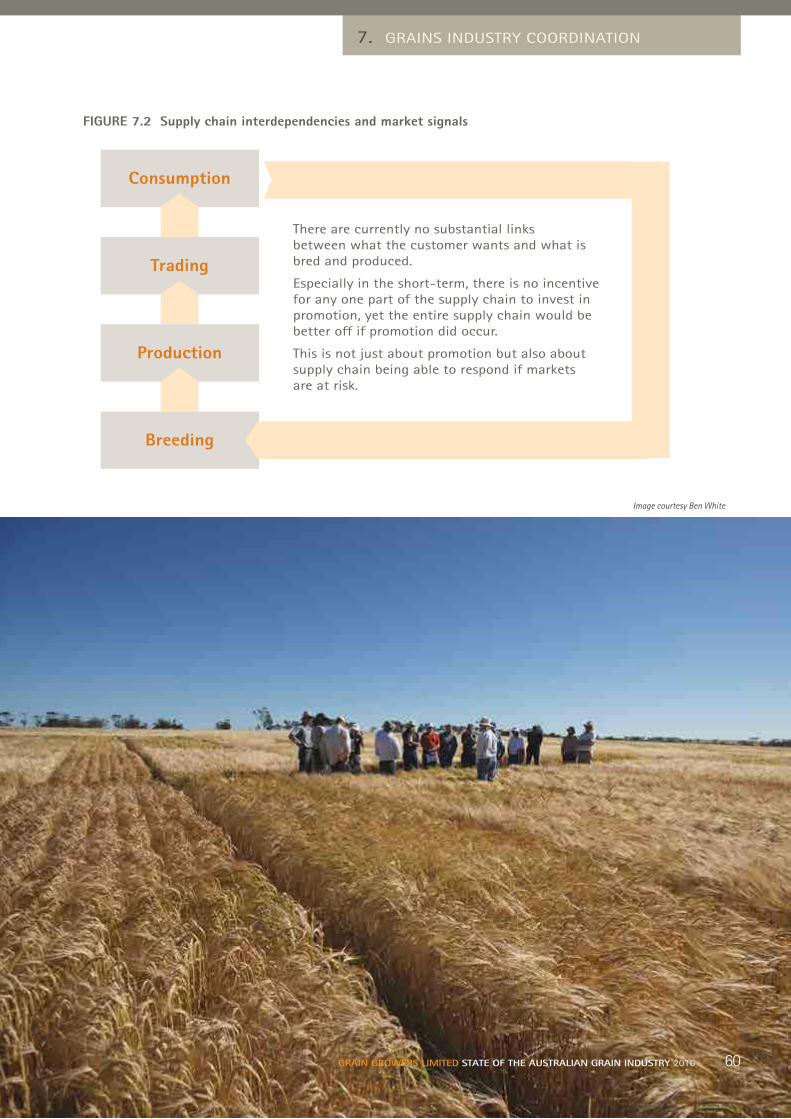
60GRAIN GROWERS LIMITED STATE OF THE AUSTRALIAN GRAIN INDUSTRY 2016
7. GRAINS INDUSTRY COORDINATION
FIGURE 7.2 Supply chain interdependencies and market signals
Consumption
Trading
Production
Breeding
There are currently no substantial links between what the customer wants and what is bred and produced.
Especially in the short-term, there is no incentive for any one part of the supply chain to invest in promotion, yet the entire supply chain would be better off if promotion did occur.
This is not just about promotion but also about supply chain being able to respond if markets are at risk.
60GRAIN GROWERS LIMITED STATE OF THE AUSTRALIAN GRAIN INDUSTRY 2016
Image courtesy Ben White

61 GRAIN GROWERS LIMITED STATE OF THE AUSTRALIAN GRAIN INDUSTRY 2016
8. GOING FORWARD
The strengthsUnderpinned by innovative and expanding farming businesses, the Australian grains industry has grown from a production value of $9bn to almost $13.5bn during the past five years. This growth has been in the face of an increasingly variable climate in the already dry Australian environment.
The Australian grains industry has been a clear leader in terms of productivity gains among broadacre agricultural activities. Advances in cropping technology have supported industry-wide productivity growth. At the farm level, more efficient farming systems, new crop varieties, digital technologies and conservation farming techniques have increased yields and sustainability while reducing costs.
Despite the relative success of Australia’s broadacre cropping industries, compared with other broadacre industries, the challenge of lifting annual productivity gains to those of earlier times remains. It is, in large part, this challenge that will determine
our place among our competitors in competing for space in the growing international food-supply system.
A market-oriented production sector and supply chain, with an international reputation for quality, fit for purpose, safe and reliable grains, and with minimal government intervention, provides the basis for a responsive and internationally-competitive industry into the future.
The challengesWhile productivity growth in Australian grain production has slowed during recent years, international competitors have seen rapid advancements. Ultimately, with the reduction in cost of production and improvements in supply chain efficiencies, competitors such as the Black Sea countries may erode Australia’s market share in key international markets, such as Indonesia.
An increasingly variable climate will require close monitoring and adaptation of the predominately rain-fed farming systems across Australia. Without
The Australian grains industry has experienced a period of improved returns and growth on the back of difficult decade leading up to 2010. This report highlights the importance of this growing sector and provides a review of industry dynamics from farm gate through the supply chain partners and on to the end-user. The review reveals the strengths of the industry, but also the challenges it faces in securing long-term sustainability. The Australian grains industry cannot ignore the opportunities to respond to these challenges and optimise its sustainability into the future.
Image GrainGrowers
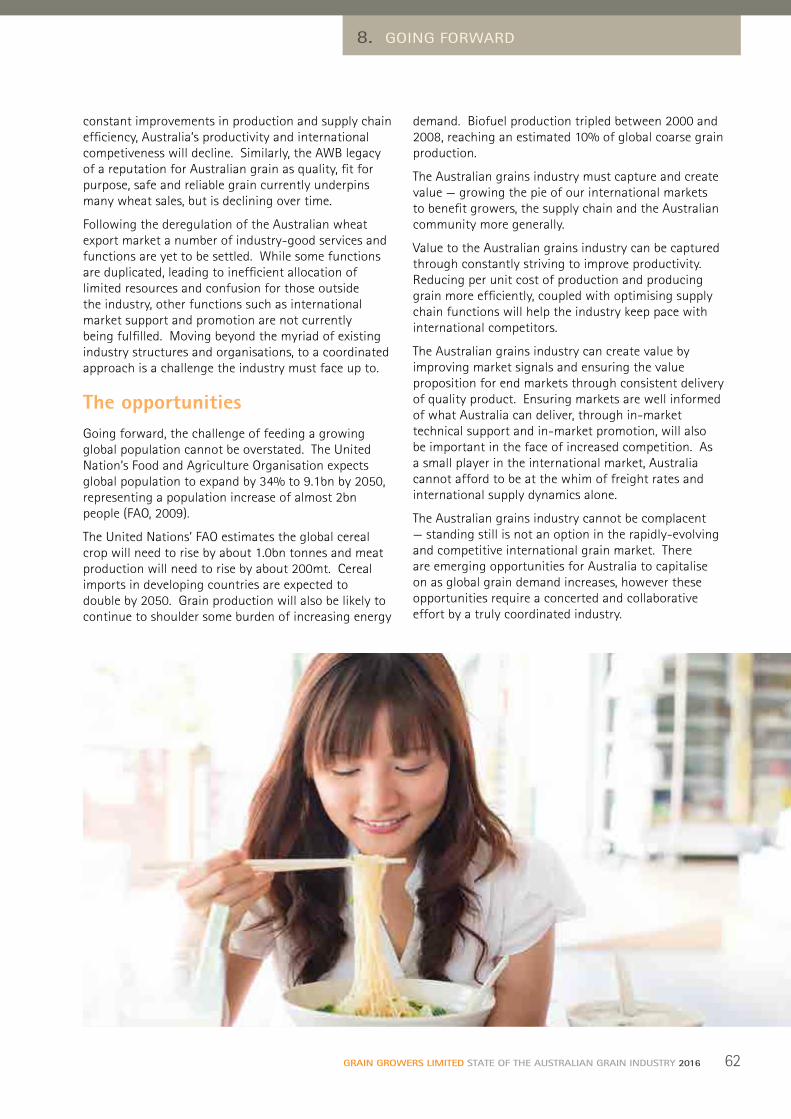
62GRAIN GROWERS LIMITED STATE OF THE AUSTRALIAN GRAIN INDUSTRY 2016
8. GOING FORWARD
constant improvements in production and supply chain efficiency, Australia’s productivity and international competiveness will decline. Similarly, the AWB legacy of a reputation for Australian grain as quality, fit for purpose, safe and reliable grain currently underpins many wheat sales, but is declining over time.
Following the deregulation of the Australian wheat export market a number of industry-good services and functions are yet to be settled. While some functions are duplicated, leading to inefficient allocation of limited resources and confusion for those outside the industry, other functions such as international market support and promotion are not currently being fulfilled. Moving beyond the myriad of existing industry structures and organisations, to a coordinated approach is a challenge the industry must face up to.
The opportunitiesGoing forward, the challenge of feeding a growing global population cannot be overstated. The United Nation’s Food and Agriculture Organisation expects global population to expand by 34% to 9.1bn by 2050, representing a population increase of almost 2bn people (FAO, 2009).
The United Nations’ FAO estimates the global cereal crop will need to rise by about 1.0bn tonnes and meat production will need to rise by about 200mt. Cereal imports in developing countries are expected to double by 2050. Grain production will also be likely to continue to shoulder some burden of increasing energy
demand. Biofuel production tripled between 2000 and 2008, reaching an estimated 10% of global coarse grain production.
The Australian grains industry must capture and create value — growing the pie of our international markets to benefit growers, the supply chain and the Australian community more generally.
Value to the Australian grains industry can be captured through constantly striving to improve productivity. Reducing per unit cost of production and producing grain more efficiently, coupled with optimising supply chain functions will help the industry keep pace with international competitors.
The Australian grains industry can create value by improving market signals and ensuring the value proposition for end markets through consistent delivery of quality product. Ensuring markets are well informed of what Australia can deliver, through in-market technical support and in-market promotion, will also be important in the face of increased competition. As a small player in the international market, Australia cannot afford to be at the whim of freight rates and international supply dynamics alone.
The Australian grains industry cannot be complacent — standing still is not an option in the rapidly-evolving and competitive international grain market. There are emerging opportunities for Australia to capitalise on as global grain demand increases, however these opportunities require a concerted and collaborative effort by a truly coordinated industry.

63 GRAIN GROWERS LIMITED STATE OF THE AUSTRALIAN GRAIN INDUSTRY 201663 GRAIN GROWERS LIMITED STATE OF THE AUSTRALIAN GRAIN INDUSTRY 2016
64GRAIN GROWERS LIMITED STATE OF THE AUSTRALIAN GRAIN INDUSTRY 2016
APPENDICES
1. WHEAT QUALITY AUSTRALIA — CLASSES
TABLE 1. Wheat Quality Australia — classes
Zone Class CategoryAll zones Australian Hard (AH) Premium Hard
All zones Australian Premium White (APW) Premium Hard
Australian Standard White (ASW) Multi-purpose
Australian Premium Durum (ADR) Specialty
All zones Australian Soft (ASFT) Specialty
Australian Standard Noodle Wheat (ANW) Specialty
Australian Feed (FEED) Specialty
WA zone only Australian Premium White Noodle (APWN) Speciality
Northern and South Eastern zone only
Australian Prime Hard (APH) Premium Hard
Source: Wheat Quality Australia (2016)
Premium Hard
Australian Prime Hard (APH): APH is a high protein milling wheat, comprising selected white, hard-grained wheat varieties. APH is ideally suited for high-volume European breads, yellow alkaline noodles, fresh ramen noodles, dry noodles and wonton skins. APH can also be blended with lower-protein wheats to enhance flour quality. APH has traditionally been segregated in NSW and Queensland and was expanded to southern NSW during the late 1990s.
Australian Hard (AH): AH consists of specific white, hard-grained wheat varieties with high-quality protein and strong dough characteristics. This wheat has excellent milling qualities, high flour extraction, low flour ash levels and high water absorption. AH produces strong, balanced dough with stable dough traits that give an advantage in countries with difficult processing environments, including heat and humidity. AH has high flour paste viscosity values, making it ideal for a wide range of Asian breads and noodle products,
including instant and fresh yellow alkaline noodles and dry white salted noodles. This wheat class is ideal for European-style pan and hearth breads, Middle Eastern-style flat breads and Chinese steamed products due to its specific colour, texture, appearance and taste traits. AH wheat varieties are grown throughout the Australian wheatbelt and can be supplied from most ports. AH is generally segregated at minimum protein levels of 11.5% (H2) and 13% (H1).
Australian Premium White (APW): Mid-protein hard white wheats, APW is ideal for producing a variety of noodle types, including Hokkien, instant and fresh noodles, and Middle Eastern and sub-continental flat breads and Chinese steamed bread. APW wheat is also widely used as a blending wheat in a range of baking processes internationally and is the mainstay of the domestic baking industry.
Left: Image courtesy Ben White

65 GRAIN GROWERS LIMITED STATE OF THE AUSTRALIAN GRAIN INDUSTRY 2016
Multi-purpose
Australian Standard White (ASW): ASW is a highly-versatile medium- to low-protein white wheat representing excellent value for straight milling or blending purposes. This multi-purpose wheat is used to produce a wide range of products including Middle Eastern, sub-continental flat breads, European-style breads and rolls and Chinese steamed bread.
Speciality
Australian Premium Durum (ADR): ADR is ideal for a wide range of wet and dry pasta products with excellent colour and shelf life and is also used to produce North African and Middle Eastern products, such as couscous, hearth and flat breads.
Australian Soft (ASFT): ASFT produced on the east coast of Australia is principally used for domestic biscuit and cake production, where the traditional quality requirements are low protein content, low water absorption, low dough strength and over-extensibility for the protein content. ASFT produced on the west coast, however, is used primarily in export markets for a range of Asian steamed products. For these products the domestic biscuit specifications are less relevant, with white, bright and speck-free flour being of much more important.
Australian Noodle (ANW): Varieties in this class are particularly suited for manufacturing the Japanese Udon-style noodle. For Udon manufacture, flours are generally milled to a patent flour extraction to produce a maximum ash level of 0.36–0.40% with minimal bran contamination, as bran specks result in a visually unappealing final product. While produced largely in WA, ANW is also segregated in the eastern states.
Australian Premium Noodle (APWN): APWN is mainly used in an export blend with ANW for a range of white salted and instant noodle types in specific Asian markets but its inherent processing characteristics are fully compatible with those of APW. APWN is currently grown only in WA.
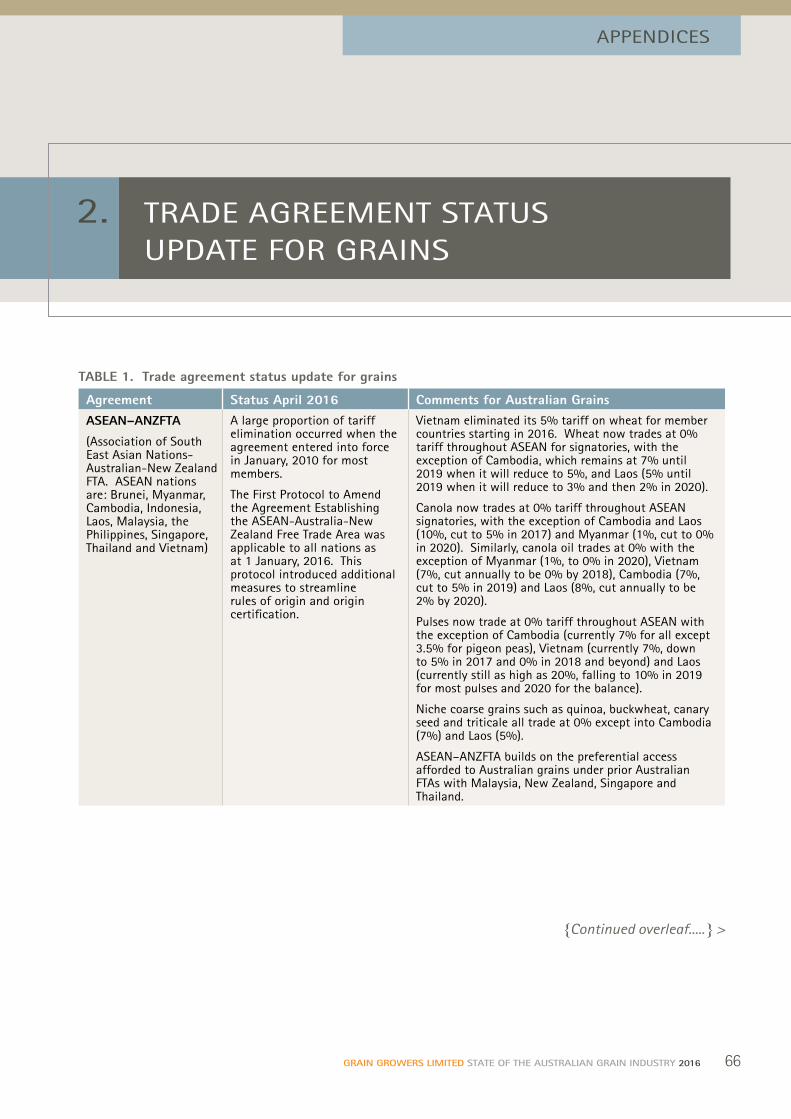
66GRAIN GROWERS LIMITED STATE OF THE AUSTRALIAN GRAIN INDUSTRY 2016
APPENDICES
2. TRADE AGREEMENT STATUS UPDATE FOR GRAINS
TABLE 1. Trade agreement status update for grains
Agreement Status April 2016 Comments for Australian GrainsASEAN–ANZFTA
(Association of South East Asian Nations-Australian-New Zealand FTA. ASEAN nations are: Brunei, Myanmar, Cambodia, Indonesia, Laos, Malaysia, the Philippines, Singapore, Thailand and Vietnam)
A large proportion of tariff elimination occurred when the agreement entered into force in January, 2010 for most members.
The First Protocol to Amend the Agreement Establishing the ASEAN-Australia-New Zealand Free Trade Area was applicable to all nations as at 1 January, 2016. This protocol introduced additional measures to streamline rules of origin and origin certification.
Vietnam eliminated its 5% tariff on wheat for member countries starting in 2016. Wheat now trades at 0% tariff throughout ASEAN for signatories, with the exception of Cambodia, which remains at 7% until 2019 when it will reduce to 5%, and Laos (5% until 2019 when it will reduce to 3% and then 2% in 2020).
Canola now trades at 0% tariff throughout ASEAN signatories, with the exception of Cambodia and Laos (10%, cut to 5% in 2017) and Myanmar (1%, cut to 0% in 2020). Similarly, canola oil trades at 0% with the exception of Myanmar (1%, to 0% in 2020), Vietnam (7%, cut annually to be 0% by 2018), Cambodia (7%, cut to 5% in 2019) and Laos (8%, cut annually to be 2% by 2020).
Pulses now trade at 0% tariff throughout ASEAN with the exception of Cambodia (currently 7% for all except 3.5% for pigeon peas), Vietnam (currently 7%, down to 5% in 2017 and 0% in 2018 and beyond) and Laos (currently still as high as 20%, falling to 10% in 2019 for most pulses and 2020 for the balance).
Niche coarse grains such as quinoa, buckwheat, canary seed and triticale all trade at 0% except into Cambodia (7%) and Laos (5%).
ASEAN–ANZFTA builds on the preferential access afforded to Australian grains under prior Australian FTAs with Malaysia, New Zealand, Singapore and Thailand.
{Continued overleaf.....} >
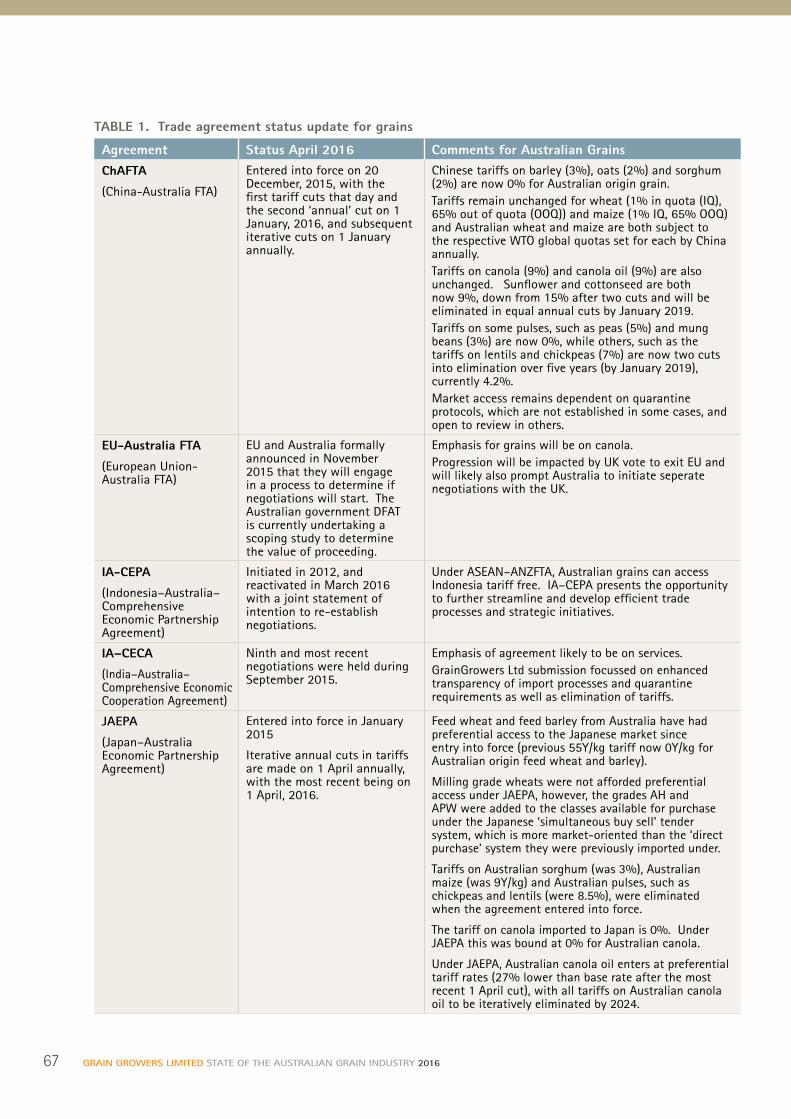
67 GRAIN GROWERS LIMITED STATE OF THE AUSTRALIAN GRAIN INDUSTRY 2016
TABLE 1. Trade agreement status update for grains
Agreement Status April 2016 Comments for Australian GrainsChAFTA
(China-Australia FTA)
Entered into force on 20 December, 2015, with the first tariff cuts that day and the second ‘annual’ cut on 1 January, 2016, and subsequent iterative cuts on 1 January annually.
Chinese tariffs on barley (3%), oats (2%) and sorghum (2%) are now 0% for Australian origin grain. Tariffs remain unchanged for wheat (1% in quota (IQ), 65% out of quota (OOQ)) and maize (1% IQ, 65% OOQ) and Australian wheat and maize are both subject to the respective WTO global quotas set for each by China annually. Tariffs on canola (9%) and canola oil (9%) are also unchanged. Sunflower and cottonseed are both now 9%, down from 15% after two cuts and will be eliminated in equal annual cuts by January 2019.Tariffs on some pulses, such as peas (5%) and mung beans (3%) are now 0%, while others, such as the tariffs on lentils and chickpeas (7%) are now two cuts into elimination over five years (by January 2019), currently 4.2%.Market access remains dependent on quarantine protocols, which are not established in some cases, and open to review in others.
EU-Australia FTA
(European Union-Australia FTA)
EU and Australia formally announced in November 2015 that they will engage in a process to determine if negotiations will start. The Australian government DFAT is currently undertaking a scoping study to determine the value of proceeding.
Emphasis for grains will be on canola. Progression will be impacted by UK vote to exit EU and will likely also prompt Australia to initiate seperate negotiations with the UK.
IA-CEPA
(Indonesia–Australia–Comprehensive Economic Partnership Agreement)
Initiated in 2012, and reactivated in March 2016 with a joint statement of intention to re-establish negotiations.
Under ASEAN–ANZFTA, Australian grains can access Indonesia tariff free. IA–CEPA presents the opportunity to further streamline and develop efficient trade processes and strategic initiatives.
IA–CECA
(India–Australia–Comprehensive Economic Cooperation Agreement)
Ninth and most recent negotiations were held during September 2015.
Emphasis of agreement likely to be on services.GrainGrowers Ltd submission focussed on enhanced transparency of import processes and quarantine requirements as well as elimination of tariffs.
JAEPA
(Japan–Australia Economic Partnership Agreement)
Entered into force in January 2015
Iterative annual cuts in tariffs are made on 1 April annually, with the most recent being on 1 April, 2016.
Feed wheat and feed barley from Australia have had preferential access to the Japanese market since entry into force (previous 55Y/kg tariff now 0Y/kg for Australian origin feed wheat and barley).
Milling grade wheats were not afforded preferential access under JAEPA, however, the grades AH and APW were added to the classes available for purchase under the Japanese ‘simultaneous buy sell’ tender system, which is more market-oriented than the ‘direct purchase’ system they were previously imported under.
Tariffs on Australian sorghum (was 3%), Australian maize (was 9Y/kg) and Australian pulses, such as chickpeas and lentils (were 8.5%), were eliminated when the agreement entered into force.
The tariff on canola imported to Japan is 0%. Under JAEPA this was bound at 0% for Australian canola.
Under JAEPA, Australian canola oil enters at preferential tariff rates (27% lower than base rate after the most recent 1 April cut), with all tariffs on Australian canola oil to be iteratively eliminated by 2024.
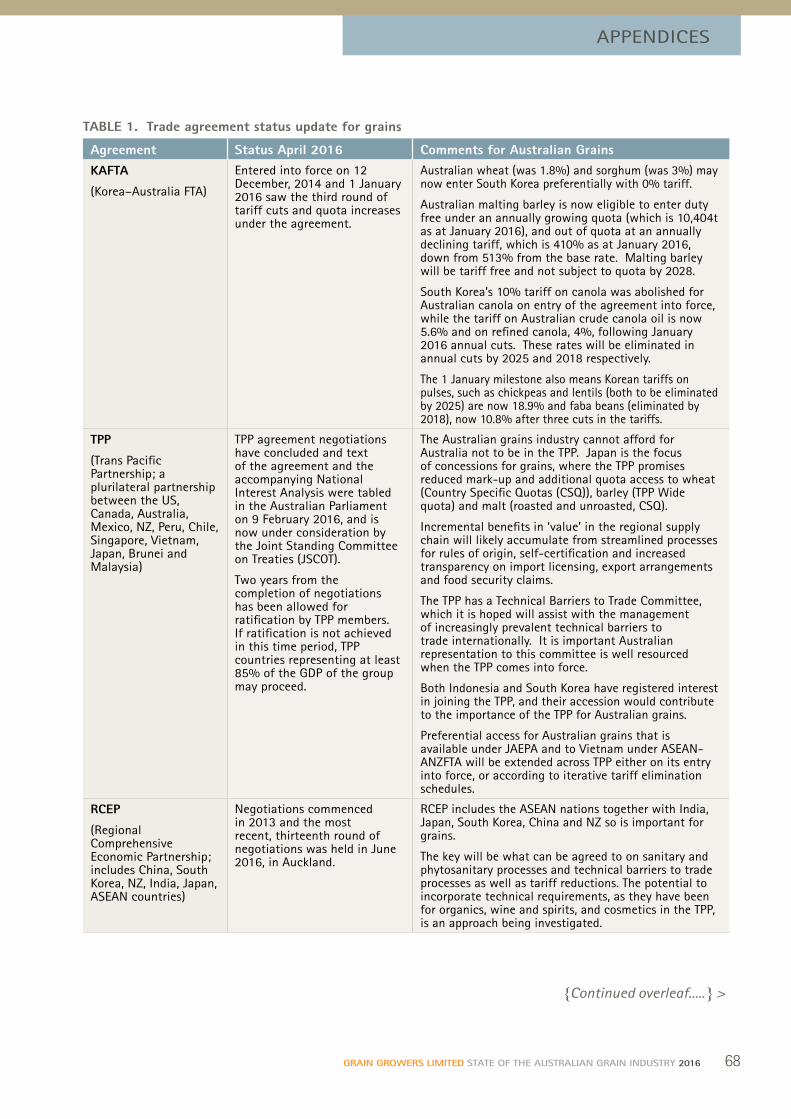
68GRAIN GROWERS LIMITED STATE OF THE AUSTRALIAN GRAIN INDUSTRY 2016
APPENDICES
TABLE 1. Trade agreement status update for grains
Agreement Status April 2016 Comments for Australian GrainsKAFTA
(Korea–Australia FTA)
Entered into force on 12 December, 2014 and 1 January 2016 saw the third round of tariff cuts and quota increases under the agreement.
Australian wheat (was 1.8%) and sorghum (was 3%) may now enter South Korea preferentially with 0% tariff.
Australian malting barley is now eligible to enter duty free under an annually growing quota (which is 10,404t as at January 2016), and out of quota at an annually declining tariff, which is 410% as at January 2016, down from 513% from the base rate. Malting barley will be tariff free and not subject to quota by 2028.
South Korea’s 10% tariff on canola was abolished for Australian canola on entry of the agreement into force, while the tariff on Australian crude canola oil is now 5.6% and on refined canola, 4%, following January 2016 annual cuts. These rates will be eliminated in annual cuts by 2025 and 2018 respectively.
The 1 January milestone also means Korean tariffs on pulses, such as chickpeas and lentils (both to be eliminated by 2025) are now 18.9% and faba beans (eliminated by 2018), now 10.8% after three cuts in the tariffs.
TPP
(Trans Pacific Partnership; a plurilateral partnership between the US, Canada, Australia, Mexico, NZ, Peru, Chile, Singapore, Vietnam, Japan, Brunei and Malaysia)
TPP agreement negotiations have concluded and text of the agreement and the accompanying National Interest Analysis were tabled in the Australian Parliament on 9 February 2016, and is now under consideration by the Joint Standing Committee on Treaties (JSCOT).
Two years from the completion of negotiations has been allowed for ratification by TPP members. If ratification is not achieved in this time period, TPP countries representing at least 85% of the GDP of the group may proceed.
The Australian grains industry cannot afford for Australia not to be in the TPP. Japan is the focus of concessions for grains, where the TPP promises reduced mark-up and additional quota access to wheat (Country Specific Quotas (CSQ)), barley (TPP Wide quota) and malt (roasted and unroasted, CSQ).
Incremental benefits in ‘value’ in the regional supply chain will likely accumulate from streamlined processes for rules of origin, self-certification and increased transparency on import licensing, export arrangements and food security claims.
The TPP has a Technical Barriers to Trade Committee, which it is hoped will assist with the management of increasingly prevalent technical barriers to trade internationally. It is important Australian representation to this committee is well resourced when the TPP comes into force.
Both Indonesia and South Korea have registered interest in joining the TPP, and their accession would contribute to the importance of the TPP for Australian grains.
Preferential access for Australian grains that is available under JAEPA and to Vietnam under ASEAN-ANZFTA will be extended across TPP either on its entry into force, or according to iterative tariff elimination schedules.
RCEP
(Regional Comprehensive Economic Partnership; includes China, South Korea, NZ, India, Japan, ASEAN countries)
Negotiations commenced in 2013 and the most recent, thirteenth round of negotiations was held in June 2016, in Auckland.
RCEP includes the ASEAN nations together with India, Japan, South Korea, China and NZ so is important for grains.
The key will be what can be agreed to on sanitary and phytosanitary processes and technical barriers to trade processes as well as tariff reductions. The potential to incorporate technical requirements, as they have been for organics, wine and spirits, and cosmetics in the TPP, is an approach being investigated.
{Continued overleaf.....} >

69 GRAIN GROWERS LIMITED STATE OF THE AUSTRALIAN GRAIN INDUSTRY 2016
TABLE 1. Trade agreement status update for grains
Agreement Status April 2016 Comments for Australian GrainsAustralia–GCC FTA
(Australia–Gulf Co-operation Council, FTA; includes Saudi Arabia, Oman, Kuwait, Bahrain, Qatar and the UAE)
Commenced in 2007 with four rounds of negotiations taking place before the CGG suspended all FTA negotiations. The GCC has approved the resumption of FTA negotiations, but no announcement on when negotiations would resume has been made, though the Australian Government is advocating strongly for a resumption of negotiations.
This will be important for Australian grains, especially given the increasingly strong competition for Middle Eastern markets by the EU and Black Sea grains industries.
WTO MC 10
(World Trade Organisation 10th Ministerial Conference)
Nairobi Package agreed to on 18 December, 2015.
Four elements (all within the Export Competition Pillar of the WTO agriculture negotiations):
1. increased transparency on state export trading enterprises
2. commitments to eliminate export subsidies (marketing and transport), immediately for developed countries, over three years for developing countries and by 2030 for LDCs and net food importing developing countries;
3. export credit programs — increased transparency and constraints on the terms
4. closer framework around food aid — e.g. cannot be monetised, cannot be re-exported.
The third element is the most promising change with it limiting the terms of subsidised finance that can be offered to countries purchasing grain. Terms are currently uncapped but under the agreement, credit terms will be limited to 18 months.

70GRAIN GROWERS LIMITED STATE OF THE AUSTRALIAN GRAIN INDUSTRY 2016
3. GLOSSARY OF ENTITIES
APPENDICES
AEGIC (Australian Export Grains Innovation Centre): The GRDC and the Western Australian State Government established AEGIC in 2012 to support the trade and use of Australian grains around the world through innovation in grain quality and processing technology and market research.
Australian Fodder Industry Association (AFIA): The AFIA is the peak body for the Australian fodder industry, connecting all sectors of the supply chain from seed to feed.
Australian Grain Exporters Association (AGEA): AGEA is an association of Australian grain exporters. And advocate for Australia’s export grains sector. Claiming it is a first point of contact for customers, government and industry, and provides exporter input into commodity groups and other industry organisations.
Agforce: AgForce Queensland is the state farming representative organisation for Queensland.
Australian Grains Industry Discussion Group (AGIDG): AGIDG was established to provide a forum for national representative groups to discuss issues relevant to the Australian grains industry, develop overarching industry strategies and polices that promote and enhance a competitive and efficient.
Current members are AO, AGEA, GrainGrowers, GPA, Pulse Australia and GTA.
Australian Mungbean Association (AMA): AMA is a non-profit organisation comprising all sectors of the Australian mungbean industry including plant breeders, research agronomists, grain traders, seed graders and packers, crop consultants and representatives from a range of other government agencies and private sector enterprises. The primary objective of the association is to consolidate and build a profi table and sustainable industry for all sectors of the supply chain.
Australian Nut Industry Council (ANIC): ANIC is the federation representing the seven Australian commercial tree nut industries.
Australian Oilseeds Federation (AOF): AOF is the peak industry body for the Australia oilseeds supply chain and includes members from across the oilseed supply chain including input providers, research, development and extension agencies, growers’ representative bodies, traders and marketers (domestic and export), and processors (crushers, refiners, manufacturers).
Australian Pesticide and Veterinary Medicines Authority (APVMA): The APVMA is the Australian government statutory authority established to centralise the registration of all agricultural and veterinary chemical products into the Australian marketplace.
Australian Seed Federation (ASF): ASF is the peak industry body for the Australian seed industry. The ASF represents its members nationally, and internationally, as a member of the International Seed Federation (ISF) and the Asia Pacific Seed Association (APSA). ASF includes grass, grain and horticulture seed production and breeding interests.
Barley Australia (BA): Barley Australia is an industry body for barley, established in early 2005, and seeks to represent the interest of all stakeholders of Australia’s barley industry. Barley Australia is supported and wholly funded by the following companies: Australian Grain Technologies, Barrett Burston Malting, Cargill Malt, Carlton and United Breweries, CBH Grain, GrainCorp Operations Ltd, Lion - Beer, Spirits and Wine Australia, Malteurop, Syngenta and The University of Adelaide
BRI Australia (BRI): Formerly the Bread Research Institute, BRI was an independent centre of expertise in grains, grain processing, milling and baking. In 2008 BRI was acquired by, and operated under the name of GrainGrowers and this continued until late 2015 when its activities were consolidated with those of AEGIC.
71 GRAIN GROWERS LIMITED STATE OF THE AUSTRALIAN GRAIN INDUSTRY 2016
Grains Industry Market Access Forum (GIMAF): GIMAF comprises membership of AGEA, AFIA, AOF, the ASF, PA and GPA, and in partnership with the Australian Government, works to manage technical market access. GIMAF hosts a forum, which is attended by the wider industry including representatives of port handlers, marketers, GGL, GTA and AMA among others. GIMAF is funded until 2017 by the GRDC and the Department of Agriculture Biosecurity Grain Export Program.
Grain Industry Association of Western Australia (GIWA): GIWA represents the interests of those in the Western Australian grain supply chain. GIWA has seven Councils including GIWA Wheat Council, GIWA Barley Council, GIWA Trade Council, GIWA Oilseeds Council, GIWA Pulse Council, GIWA Oat Council and GIWA AGI Council. The key focus is to provide industry leadership, improve communications and nurture capacity building within the industry. GIWA is the custodian of Grain Standards for Western Australia.
Grain Growers Limited (GrainGrowers): GrainGrowers is an independent and technically resourced, grain grower representative organisation with 17,500 members across Australia. GrainGrowers’ goal is a more efficient, sustainable and profitable grain production sector that benefits all Australia grain growers and the wider grains industry. GrainGrowers has three divisions which work cooperatively to achieve improved grain industry outcomes: 1) National Policy & Innovation, 2) National Capability Development, 3) Industry Services. GrainGrowers is a joint designated grower representative organisation in the context of the PIRD Act.
Grains and Legumes Nutrition Council (GLNC): GLNC provides a platform for organisations from across the grains and legumes value chain that have a pre-competitive interest in promoting the health and nutrition benefits of grains, grain-based foods and legumes in Australia. As an independent authority on the nutrition and health benefits of grains and legumes, GLNC’s mission is to promote grains and legumes nutrition as part of a balanced diet through evidence-based information cultivating good health.
Grain Producers Australia (GPA): GPA represents grain producers at the national level. Grain Producers Australia is a joint designated grower representative organisation in the PIRD Act and is also the signatory to the Plant Health Australia (PHA) industry deed.
Grain Producers SA (GPSA): GPSA is a state grain grower representative organisation for SA.
Grain and Plant Product Export Industry Consultative Committee (GPPEICC): GPPEICC is the principal forum for the Department of Agriculture and Water Resources to consult with grain, fodder, nuts, seed and timber industries on export inspection and certification, export market access and other relevant issues, that the department has statutory responsibility for under the Export Control Act 1982 and its subordinate legislation. GPPEICC membership includes representatives from the Australian Fodder Industry Association, Australian Forest Products Association, the Australian Grain Exporters’ Association, the Australian Mungbean Association, Australian Nut Industry Council, Australian Oilseed Federation, Australian Seed Federation, Pulse Australia, Ricegrowers’ Association of Australia, Grain Growers Ltd, Grain Producers Australia , Grain Trade Australia, Eastern bulk handlers and port operators, southern bulk handlers and port operators and western bulk handlers and port operators.
Grains Research and Development Corporation (GRDC): The GRDC is the RD&E service provider to the grains industry, funded by grower levies and government contribution under the PIRD Act. The GRDC, is a statutory body, is accountable to industry through the Representative Organisations, and to government.
Grain Trade Australia (GTA): GTA is a membership organisation that provides services to facilitate commercial activities across the grain supply chain, including development and publishing of grain trading standards and contracts, conduct of an arbitration process and provision of training and development programs. GTA also represents and advocates to government on behalf of its members. GTA members are predominantly traders/marketers but also include merchant and grower association members.
Maize Association of Australia (MAA): MAA is a peak association comprising members who are researchers, growers, merchants and corporate entities with an interest in the maize industry.
National Working Party on Grain Protection (NWPGP): NWPGP is an industry forum responsible for: a) providing management and leadership to industry in the areas of post-harvest storage, chemical use, market requirements and chemical regulations (including an annual conference); and b) coordinating and liaising with industry and Government on chemical in use on grain and associated products.
72GRAIN GROWERS LIMITED STATE OF THE AUSTRALIAN GRAIN INDUSTRY 2016
APPENDICES
National Farmers’ Federation (NFF): NFF is the peak national body representing farmers and, more broadly, agriculture across Australia; through a structure of state, commodity and agribusiness members. The NFF focuses effort on national, cross-commodity issues. NFF members recently agreed to progress an updated ‘Australian Farmers’ model for agricultural representation in Australia.
National Residue Survey (NRS): NRS facilitates the testing of animal and plant products for pesticide and veterinary medicine residues, and environmental contaminants. Testing is undertaken through either random or specifically designed sampling protocols. Other programs within the NRS, such as laboratory evaluation and business activities, support the core work of residue testing. NRS is an agency within the Department of Agriculture & Water Resources and is entirely funded by industry via producer levies and some contract arrangements.
NSW Farmers Association: State farming representative organisation for NSW.
Office of the Gene Technology Regulator (OGTR): The OGTR supports the Regulator who is an independent statutory office holder responsible for administering the Gene Technology Act 2000 (the Act) and corresponding state and territory laws. In administering the gene technology regulatory system, the Regulator has specific responsibility to protect the health and safety of people, and to protect the environment, by identifying risk posed by or as a result of gene technology, and by managing those risks through regulating certain dealings with genetically modified organisms (GMOs).
Pulse Australia (PA): Pulse Australia is a peak industry body that represents all sectors of the pulse industry in Australia, from growers and agronomists through to researchers, merchants, traders and exporters.
Pastoralists and Graziers of WA (PGA): PGA is a state farming representative organisation for WA.
Plant Health Australia (PHA): PHA is the national coordinator of the government-industry partnership for plant biosecurity in Australia and works with federal, state and territory governments and industry representative bodies to promote strong biosecurity practices and strategy that minimises plant pest impacts on Australia, enhances market access and contributes to industry and community sustainability.
Ricegrowers’ Association of Australia Inc (RGA): RGA is the peak body for Australian rice growers.
Victorian Farmers Federation (VFF): A state farming representative organisation for Victoria.
Western Australia Farmers Federation Inc (WAFarmers): A state farming representative organisation for WA.
Wheat Quality Australia (WQA): WQA is responsible for maintaining and growing the reputation of Australian wheat as a high-quality product, by using its accountable, transparent and sustainable wheat classification system. The WQA Wheat Variety Classification Panel assesses new wheat varieties to determine their processing and end product suitability (for qualities such as milling extraction, dough balance, baking performance and noodle colour and texture), to meet key market requirements. The WQA Classification
Council represents the entire value chain of wheat production in Australia, and uses this engagement to constantly improve the classification system in response to the needs of the market. The Wheat Variety Master List, is the primary output of the classification system and is the foundation for wheat quality management in Australia.
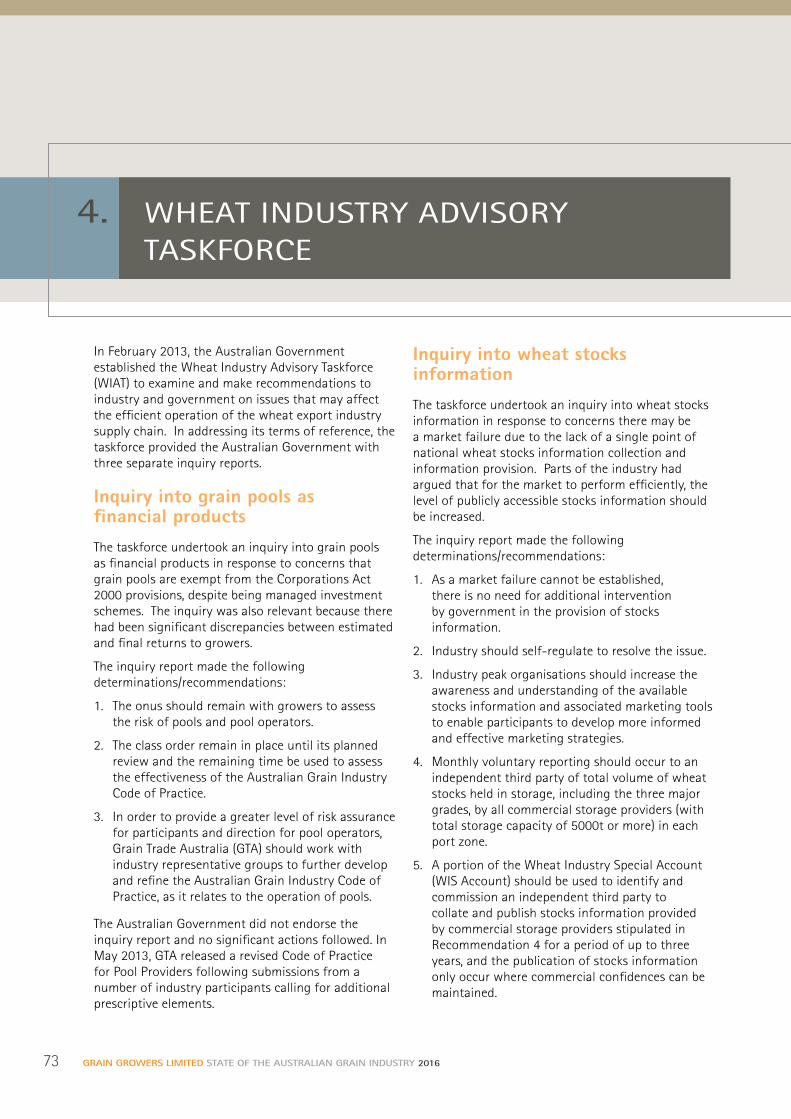
73 GRAIN GROWERS LIMITED STATE OF THE AUSTRALIAN GRAIN INDUSTRY 2016
4. WHEAT INDUSTRY ADVISORY TASKFORCE
In February 2013, the Australian Government established the Wheat Industry Advisory Taskforce (WIAT) to examine and make recommendations to industry and government on issues that may affect the efficient operation of the wheat export industry supply chain. In addressing its terms of reference, the taskforce provided the Australian Government with three separate inquiry reports.
Inquiry into grain pools as financial products
The taskforce undertook an inquiry into grain pools as financial products in response to concerns that grain pools are exempt from the Corporations Act 2000 provisions, despite being managed investment schemes. The inquiry was also relevant because there had been significant discrepancies between estimated and final returns to growers.
The inquiry report made the following determinations/recommendations:
1. The onus should remain with growers to assess the risk of pools and pool operators.
2. The class order remain in place until its planned review and the remaining time be used to assess the effectiveness of the Australian Grain Industry Code of Practice.
3. In order to provide a greater level of risk assurance for participants and direction for pool operators, Grain Trade Australia (GTA) should work with industry representative groups to further develop and refine the Australian Grain Industry Code of Practice, as it relates to the operation of pools.
The Australian Government did not endorse the inquiry report and no significant actions followed. In May 2013, GTA released a revised Code of Practice for Pool Providers following submissions from a number of industry participants calling for additional prescriptive elements.
Inquiry into wheat stocks information
The taskforce undertook an inquiry into wheat stocks information in response to concerns there may be a market failure due to the lack of a single point of national wheat stocks information collection and information provision. Parts of the industry had argued that for the market to perform efficiently, the level of publicly accessible stocks information should be increased.
The inquiry report made the following determinations/recommendations:
1. As a market failure cannot be established, there is no need for additional intervention by government in the provision of stocks information.
2. Industry should self-regulate to resolve the issue.
3. Industry peak organisations should increase the awareness and understanding of the available stocks information and associated marketing tools to enable participants to develop more informed and effective marketing strategies.
4. Monthly voluntary reporting should occur to an independent third party of total volume of wheat stocks held in storage, including the three major grades, by all commercial storage providers (with total storage capacity of 5000t or more) in each port zone.
5. A portion of the Wheat Industry Special Account (WIS Account) should be used to identify and commission an independent third party to collate and publish stocks information provided by commercial storage providers stipulated in Recommendation 4 for a period of up to three years, and the publication of stocks information only occur where commercial confidences can be maintained.
74GRAIN GROWERS LIMITED STATE OF THE AUSTRALIAN GRAIN INDUSTRY 2016
APPENDICES
6. The most appropriate service provider should be identified through a tender process to aggregate and publish stocks information as per Recommendation 4 and 5.
The Minister for Agriculture responded positively to this report, accepting all recommendations. Funds from the WIS Account were consequently provided to the Australian Export Grains Innovation Centre (AEGIC) in 2015 to develop a pilot project for the collation of stocks data consistent with determinations. As of July 2016 $51,159 had been allocated to AEGIC for this project. However, progress on this project was stalled at the time of publishing due to low participation rates. This was the second attempt at returning stocks reporting following GrainGrowers’ earlier support of the ABS and ABARES trial in 2011–2012.
Inquiry into wheat export quality management practices
The taskforce undertook an inquiry into wheat export quality management practices in response to concerns raised by some buyers that, since 2008, Australian wheat has not consistently met customer-milling requirements, which has the potential to harm Australia’s reputation as a reliable supplier of high quality wheat.
The inquiry report made the following determinations/recommendations:
1. The Grains Research and Development Corporation (GRDC) should fund the classification system through existing revenue streams to reduce transaction costs along the supply chain.
2. Appropriate governance arrangements need to be in place to manage any conflict of interest issues that may arise from a GRDC-led funding model for the wheat classification system.
3. A one-off injection of funds into Wheat Quality Australia (WQA) from the WIS Account is not required because there are sufficient incentives for industry bodies to fund classification.
4. Additional research is needed to develop improved technologies and processes for the identification of wheat varieties, particularly at the point of delivery.
5. Grain receival companies should consider the use of statutory declarations to increase the incentive for varieties to be declared correctly at the point of delivery.
6. Subject to the privacy rights of authorised officers, a list of all registered authorised officers should be published on a public website with relevant accreditation and primary employer details to increase transparency in the phytosanitary assessment process.
7. All supply chain participants should be aware of and comply with the Maximum Residue Limits (MRL) set by importing countries to ensure market access is maintained.
8. Industry should develop a central portal to capture and disseminate wheat quality information.
9. As a market failure cannot be established in regard to wheat quality management and that industry self-regulation is effective, there is no need for additional intervention by government in the provision of wheat export quality management.
The Australian Government did not publically endorsed this inquiry report, however, some actions did follow. The GRDC continued funding of the Wheat Classification System in the absence of other funding from industry. In addition, the Department of Agriculture and Water Resources commenced work towards establishing a public list of authorised officers. However, an output from this work is yet to be delivered.
Use of Wheat Industry Special Account Funds
The terms of reference for the taskforce also required it to provide recommendations for appropriate use of the funds held in the Wheat Industry Special Account (WIS Account). The WIS Account contained surplus money that had been held by Wheat Exports Australia at the time of its wind up in 201210.
In this regard, the taskforce made the following recommendations:
1. A portion of the WIS Account should be used to identify and commission an independent third party to collate and publish certain stocks information provided by commercial storage providers as stipulated in the An Inquiry into Wheat Stocks Information Final Report.
2. Funds held in the WIS Account should only be approved for activities which are consistent with the following guidelines/principles:
10 Surplus funds were accumulated by Wheat Exports Australia through the Wheat Export Charge (charged at 22c/tonne of wheat exported).

75 GRAIN GROWERS LIMITED STATE OF THE AUSTRALIAN GRAIN INDUSTRY 2016
a. The activity will assist the wheat export industry, or a sector of that industry.
b. The activity must have broad industry support, including relevant industry representative organisations from sectors across the supply chain.
c. Preference should be given to measures and programs that will equitably distribute benefits across the wheat export supply chain and further the long-term development of the industry.
d. Preference should be given to activities, which address market failure or potential market failure as identified by the Wheat Industry Advisory Taskforce (WIAT).
e. The activity must include appropriate governance arrangements for the use of the funds, including measures for transparency and accountability to the industry and the Australian Government.
f. A request for funding is made in writing to the Minister for Agriculture. The request must include detailed information about the proposed activity including benefits of the proposal, affected parties, level of industry support and consistency with the WIS Account guidelines.
g. Funding should not be used for activities involving lobbying or for political purposes.
As of July 2016, $3.41m remained of the WIS Account funds. As the Account was dissolved following the introduction of the Mandatory Wheat Port Code, the funds are now held by the GRDC under the provision they can only be used as per the original intentions of the special account. The Australian Grains Industry Discussion Group is actively working through further options for use of the funds, including the opportunity for development of an overarching Grains Industry Strategy.

76GRAIN GROWERS LIMITED STATE OF THE AUSTRALIAN GRAIN INDUSTRY 2016
5. REFERENCES
APPENDICES
ABARES (2011) Australian Commodity Statistics. Australian Bureau of Agricultural and Resource Economics and Sciences, Canberra.
ABARES (2015) Australian Commodity Statistics. Australian Bureau of Agricultural and Resource Economics and Sciences, Canberra.
ABARES (2016a) Australian crop report series, Australian Bureau of Agricultural and Resource Economics and Sciences, Canberra, February. Accessed at www.agriculture.gov.au/abares, March 2016.
ABARES (2016b) Agricultural commodities: June quarter 2016, Australian Bureau of Agricultural and Resource Economics and Sciences, Canberra. Accessed at www.agriculture.gov.au/abares, July 2016.
ABCA (2015) The Official Australian Reference Guide to Agricultural Biotechnology and GM Crops, 2nd edition, Agricultural Biotechnology Council of Australia, Melbourne.
ABS (2011) Historical Selected Agriculture Commodities, by State (1861 to Present), Catalogue No. 7124.0, Australian Bureau of Statistics, Canberra.
ABS (2015) Apparent Consumption of Alcohol, Australia, 2012-13, Catalogue No. 4307.0.55.001, Australian Bureau of Statistics, Canberra.
ABS (2016) Value of Agricultural Commodities Produced, Australia, 2014-15. Catalogue No. 7503.0, Australian Bureau of Statistics, Canberra.
AEGIC (2014) The cost of Australia’s bulk grain export supply chains. A report prepared by the Australian Export Grains Innovation Centre, Perth.
AEGIC (2015) The puck stops here! Canada challenges Australia’s grain supply chains. A report prepared by Australian Export Grains Innovation Centre, Perth.
CSIRO (2015) Motivations for avoiding wheat consumption in Australia: results from a population survey. J. Public Health Nutrition. 18:3. pp 490-499.
Dale, P J, Clarke B and Fontes EM (2002) ‘Potential for the environmental impact of transgenic crops.’ Nature biotechnology 20(6): 567-574.
DFAT (2015) Composition of trade Australia 2015. Accessed at www.dfat.gov.au, March 2016.
Donald, CM (1962) In search of yield. J. Aust. Inst. Agric. Science 28: 171-178.
Euromonitor (2014) Grain Mill Products in Australia: ISIC 1531. Euromonitor International, January 2014.
FAO (2009) ‘How to feed the world in 2050’, Expert Paper prepared for the United Nations Food Agriculture Organisation, Rome. Accessed at www.fao.org
GRDC (2013) Ground Cover Water Use Efficiency Supplement March-April, 2013. Grains Research and Development Corporation, Canberra.
GRDC (2014) GM Canola Impact Survey: Information for Growers, Advisers and Industry – New South Wales & Victoria: Final Report 2008-2010, BCG and GRDC, Canberra.
GRDC (2015) ‘2015 GRDC Restructure, research investments and contacts’, Accessed on 30 May 2016 at http://www.grdc.com.au/Media-Centre/Media-News/National/2015/09/2015-GRDC-restructure-research-investments-and-contacts
GTA (2015) Wheat Trading Standards 2015/16 Season. Accessed April 2016. https://www.graintrade.org.au/sites/default/files/file/Commodity%20Standards/2015_2016/Section%2002%20-%20Wheat%20Trading%20Standards%20201516%20Final.pdf
GTA (2016) Personal Communication J Dean and G Honey, Grain Trade Australia, April 2016
Howard, P (2009) Visualizing Consolidation in the Global Seed Industry: 1996–2008. Sustainability, 1(4), 1266–1287.

77 GRAIN GROWERS LIMITED STATE OF THE AUSTRALIAN GRAIN INDUSTRY 2016
Hunt, W, Birch, C, Coutts, J and Vanclay, F (2012) ‘The many turnings of agricultural extension in Australia’, The Journal of Agricultural Education and Extension, 18(1), 9-26.
IGC (2016) International Grains Council Grain & Oilseed Indices. www.igc.int Accessed April 2016.
IHS Global Insight (2010) A Cost-Benefit Analysis of USDA’s International Market Development Programs. A special report development by IHS Global Insight, Pennsylvania.
JCS Solutions (2014) Australian Feed Grain Supply and Demand Report 2013/14. Prepared by JCS Solutions for the Feed Grain Partnership.
Llewellyn, R, Ronning, D, Clarke, M, Mayfield, A, Walker, S and Ouzman, J (2016) Impact of Weeds on Australian Grain Production. Report for the Grains Research and Development Corporation, March 2016.
Mewett, J, Paplinska, J, Kelley, G, Lesslie, R, Pritchard, P and Atyeo, C (2013) Towards National Reporting on Agricultural Land Use Change in Australia, ABARES Technical Report 13.06, Canberra.
Potard, G and Keogh M (2015) ‘Labour utilisation trends in Australian agriculture’. Farm Policy Journal, Vol. 12 No. 2, Australian Farm Institute, Sydney.
Productivity Commission (2010) Wheat Export Marketing Arrangements, Report no. 51, Canberra.
Sheng, Y., Gray, E., Mullen, J., & Davidson, A. (2011). Public investment in agricultural R&D and extension: an analysis of the static and dynamic effects on Australian broadacre productivity. Australian Bureau of Agricultural and Resource Economics and Sciences, Canberra, September.
Snell, C, A. Bernheim, J.-B. Bergé, M. Kuntz, G. Pascal, A. Paris and A. E. Ricroch (2012). “Assessment of the health impact of GM plant diets in long-term and multigenerational animal feeding trials: a literature review.” Food and Chemical Toxicology 50(3): 1134-1148.
Van Eenennaam, A and A. Young (2014). ‘Prevalence and impacts of genetically engineered feedstuffs on livestock populations.’ Journal of Animal Science 92(10): 4255-4278.
USDA (2016) Production, Supply and Distribution Online, Foreign Agriculture Service, Washington. Accessed at https://apps.fas.usda.gov/psdonline/, April, 2016.
Williams, D.B. (1990), Agriculture in the Australian Economy, 3rd ed., Sydney University Press and Oxford University Press, South Melbourne.
WQA (2016) Wheat Quality Australia, http://wheatquality.com.au/. Accessed April, 2016.
Right: Image courtesy Gail Schultz, Millmerran Qld
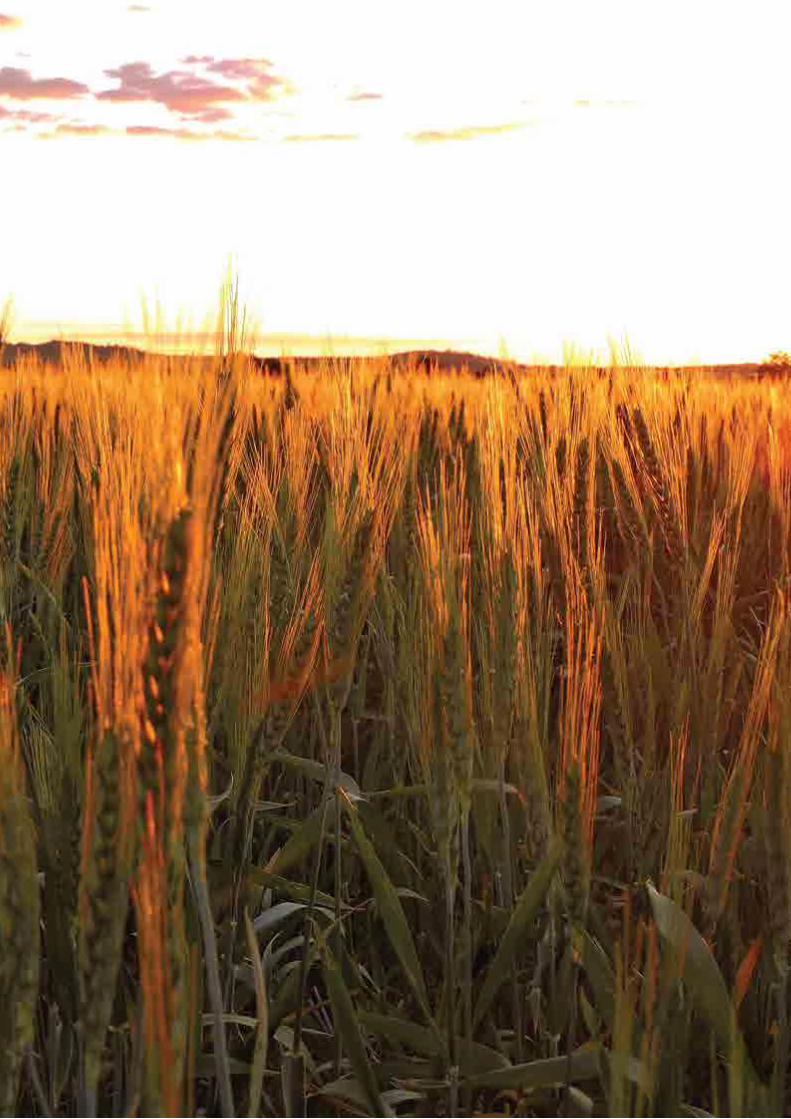
78GRAIN GROWERS LIMITED STATE OF THE AUSTRALIAN GRAIN INDUSTRY 2016
FEDERAL ELECTION2016
GrainGrowersPRIORITIES
About GrainGrowers policy development framework
GrainGrowers’ policy priorities are developed through the operation of the National Policy Group policy development process. The NPG is consists of 15 grain growers from each of Australia’s grain growing regions come together regularly to bring forward and debate issues and decisions that affect them. The National Policy Group (NPG) members are elected by GrainGrowers’ members. This group plays an important role in representing growers.
Grain growers can bring issues to GrainGrowers’ Policy Group by speaking with an NPG member or a member of GrainGrowers regional team or attending a Local Grain Farmer Forum or by submitting feedback on our website. The NPG and GrainGrowers expert policy staff determine the best course of action to take to get a positive outcome on an issue.
www.graingrowers.com.au
July 2016
SYDNEYLevel 19, 1 Market Street Sydney, 2000P.O Box Q1355, Queen Victoria Building, NSW, 1230T: (02) 9286 2000
CANBERRALevel 2, 53 Blackall Street, Barton, 2600T: (02) 6173 6400
Twitter: @GrainGrowersLtdFacebook: @GrainGrowers