state of indiana 2015 annual report 1 - in.gov of indiana 2015 annual report 3 table of contents...
TRANSCRIPT

1 State of Indiana 2015 Annual Report

2 State of Indiana 2015 Annual Report
FISCAL YEAR 2015 ANNUAL REPORT
PREPARED FOR:
U.S. DEPARTMENT OF TRANSPORTATION
NATIONAL HIGHWAY TRAFFIC SAFETY ADMINISTRATION
PREPARED BY:
THE INDIANA CRIMINAL JUSTICE INSTITUTE
EXECUTIVE DIRECTOR
DAVID R. MURTAUGH
TRAFFIC SAFETY DIVISION
JUSTIN PHILLIPS, DIRECTOR
JOHN BODEKER, CRASH RECORDS & MOTORCYCLE PROGRAM MANAGER
KAREN RITCHE, OCCUPANT PROTECTION PROGRAM MANAGER
JOHN VON ARX, IMPAIRED DRIVING PROGRAM MANAGER
KACI WRAY, CHILD PASSENGER & YOUNG DRIVER PROGRAM MANAGER
RESEARCH DIVISION
JOSHUA ROSS, DIRECTOR
ASHLEY AIKEN, RESEARCH ASSOCIATE
COMMUNICATIONS DIVISION
ADAM BAKER, COMMUNICATIONS DIRECTOR

3 State of Indiana 2015 Annual Report
Table of Contents Table of Contents .......................................................................................................................................... 3
Table of Figures ............................................................................................................................................ 4
Introduction................................................................................................................................................... 5
Performance Measures and Targets ............................................................................................................. 6
Data .............................................................................................................................................................. 7
Occupant Protection ..................................................................................................................................... 8
Program Management ............................................................................................................................... 9
Traffic Occupant Protection Strategies (TOPS) ........................................................................................ 9
Operation Pull Over ................................................................................................................................ 10
Rural Demonstration Project ................................................................................................................... 10
Looking Beyond the Ticket .................................................................................................................. 10
State Traffic Safety Information System Improvements (Traffic Records) .................................................. 10
Program Management ............................................................................................................................. 11
Indiana University Public Policy Institute .............................................................................................. 11
Center for Road Safety ............................................................................................................................ 11
Traffic Records Improvement ................................................................................................................. 11
Automated Reporting Information Exchange (ARIES) ....................................................................... 11
Trauma Registry Project ..................................................................................................................... 11
Electronic Citation and Warning System (eCWS) .............................................................................. 12
Racial Profiling ................................................................................................................................... 12
Impaired Driving ........................................................................................................................................ 12
Program Management ............................................................................................................................. 13
DUI Task Force....................................................................................................................................... 13
Indiana State Police – Underage Drinking Programs ............................................................................. 13
Standardized Field Sobriety Testing & Drug Recognition Expert Programs ......................................... 14
Traffic Safety Resource Prosecutor ........................................................................................................ 14
Judicial Outreach Liaison ....................................................................................................................... 15
Operation Centipede (Five Percent Report) ............................................................................................ 15
Motorcycle Safety ........................................................................................................................................ 16
Program Management ............................................................................................................................. 16
Programs ................................................................................................................................................. 17
Motorcycle Media / Public Awareness Campaign .................................................................................. 17
Child Passenger Safety ............................................................................................................................... 18
Program Management ............................................................................................................................. 18
Automotive Safety Program.................................................................................................................... 18
Automotive Safety Program Additions and Highlights ....................................................................... 19
Child Restraint Distribution Grant .......................................................................................................... 19
Young Drivers ............................................................................................................................................. 20
Program Management ............................................................................................................................. 20
Indiana Students Against Destructive Decisions .................................................................................... 20
Rule the Road Indiana ............................................................................................................................. 21
Ford Driving Skills for Life .................................................................................................................... 21
Driving Simulator ................................................................................................................................... 21

4 State of Indiana 2015 Annual Report
Pedestrian/Bicycles ..................................................................................................................................... 22
Program Management ............................................................................................................................. 22
SAFE KIDS ............................................................................................................................................ 22
Safety Programs ...................................................................................................................................... 23
Police Traffic Services ................................................................................................................................ 23
Program Management ............................................................................................................................. 23
Statewide Traffic Safety Training ........................................................................................................... 23
Indiana State Police ................................................................................................................................. 23
Paid Media and Communications ............................................................................................................... 24
Child Passenger Safety / October 2014 ................................................................................................... 24
Drive Now. Text L8R. ............................................................................................................................ 24
Safe Family Travel / Blitz 81 / November 2014 ..................................................................................... 24
Drive Now. Text Later Social Media Contest / April 2015 .................................................................... 24
Motorcycle Safety Awareness / May – June 2015 .................................................................................. 25
Click It or Ticket / Blitz 82 / May 2015 .................................................................................................. 25
Drive Sober or Get Pulled Over / Blitz 83 / August – September 2015 ................................................. 26
Speed (Dangerous Driving/Texting) ........................................................................................................... 26
Texting While Driving ............................................................................................................................ 26
Safe Communities/Community Traffic Safety Programs (Services) ............................................................ 26
Law Enforcement Liaison Program (LEL) ............................................................................................. 26
Media and Communications Division ..................................................................................................... 27
Financial Information ................................................................................................................................. 28
Table of Figures Figure 1:Performance Targets and Current Figures ...................................................................................... 6
Figure 2: Citations During Grant Funded Enforcement Activities, FY 2015 ............................................... 8
Figure 3: Unrestrained Passenger Vehicle Occupant Fatalities (All Seat Positions) 2006-2015 .................. 8
Figure 4: Seat Belt Usage Rates 2004-2015 ................................................................................................. 9
Figure 5: Fatalities Involving Driver or Motorcycle Operator with .08 BAC or Above 2006-2015 .......... 12
Figure 6: Total Motorcycle Fatalities 2006-2015 ....................................................................................... 16
Figure 7: Unhelmeted Motorcycle Fatalities 2006-2015 ............................................................................ 16
Figure 8: Children Aged 15 and Under Killed in Traffic Collisions 2006-2015 ........................................ 18
Figure 9: Drivers Aged 20 and Under Involved in Fatal Crashes 2006-2015 ............................................. 20
Figure 10: Pedestrian Fatalities 2006-2015 ................................................................................................ 22
Figure 11: Bicyclists and Other Cyclists Fatalities 2006-2015 ................................................................... 22
Figure 12: FY 2015 Traffic Safety Expenditures ........................................................................................ 28
Figure 13: Federal Expenditures Summary by Program Area .................................................................... 29
Figure 14: Federal Expenditures Summary by Program Area ( percent) .................................................... 29

5 State of Indiana 2015 Annual Report
Introduction
The Indiana Criminal Justice Institute (ICJI) Traffic Safety Division (TSD) manages federal funds allocated
throughout Indiana to support programs designed to fulfill its mission:
“To reduce death, injury, property damage and economic cost
associated with traffic crashes on Indiana’s roadways.”
By using up-to-date crash data, ICJI is able to implement countermeasures in specific areas, thus reducing
collisions throughout the state.
TSD is comprised of a Division Director who coordinates the efforts of the support staff, including an
Impaired Driving Program Manager, a Motorcycle Safety and Traffic Records Program Manager, a Traffic
Safety Research Associate, an Occupant Protection Program Manager, a Young Driver and Child Passenger
Program Manager, and six Law Enforcement Liaisons (LELs), located regionally across Indiana. ICJI
utilizes its Statistical Analysis Center (SAC) to assist in preparing and analyzing the data collected. ICJI
also utilizes the resources and expertise of the Public Policy Institute within the Indiana University-Purdue
University of Indianapolis’ School of Public and Environmental Affairs (PPI), the Center for Road Safety
(CRS) located at Purdue University, the Governor’s Council on Impaired and Dangerous Driving (Council),
and the Traffic Records Coordinating Committee (TRCC).
ICJI promotes traffic safety initiatives on state and local roadways through the implementation of a
comprehensive Highway Safety Plan (HSP). The HSP is a major component and requirement of the
Highway Safety Improvement Program (23 U.S.C. § 148). The HSP is a statewide-coordinated, data-driven,
multi-year comprehensive plan that provides the overall framework for reducing highway fatalities and
serious injuries on all public roads. It further establishes statewide goals, objectives, and key emphasis
areas, while integrating the four E's of highway safety – engineering, education, enforcement and
emergency medical services (EMS). The HSP allows highway safety programs and partners in the State to
work together in an effort to align goals, leverage resources and collectively address the State's safety
challenges.
In addition to the HSP, the Annual Report (AR) is an account of the previous fiscal year’s activities and
accomplishments in response to the targets set forth in the HSP. The performance plan explains the
evaluation process and whether the targets were reached. Each program report section details the targets
and achievements, project details, and evaluation (where applicable) for each program area. This is followed
by sections on paid media and communications, LEL highlights, and finally the fiscal summaries. Our target
is to not only illustrate the activities of FY 2015 to those outside of ICJI, but also that this document is
utilized internally as a tool for reflection and help to stimulate ideas and improvements that can be made in
FY 2016 and years to come.

6 State of Indiana 2015 Annual Report
Performance Measures and Targets Figure 1: Performance Targets and Current Figures
Sources: U.S. Department of Transportation and NHSTA Traffic Safety Facts: Indiana 2008-2012, 2007-2011, 2006-2010,
OPO Database, Indiana University Public Policy Institute (PPI), Purdue University Center for Road Safety (CRS), Indiana
Bureau of Motor Vehicles (BMV), Indiana Department of Transportation (INDOT), daily Fatality Analysis Reporting System
(FARS) Indiana Fatality Report, United States Census Bureau (US Census), Federal Highway Administration Highway Statistics
2013, and the Indiana State Police Automated Reporting Information Exchange System (ARIES).
Note (1): Where "Date Source 2015" is noted as "Projected", data was pulled for January 1, 2015 through November 30, 2015
and retrieved December 11, 2015. These 11 months of data were used to project 2015 annual figures.
* Denotes a federal fiscal year statistic
^ 2015 Targets taken from FY 2015 HSP unless otherwise noted
**A change in reporting methodology implemented during October 2014, resulted in a large increase in Incapacitating Injury
crash counts starting in 2014.
^^Calculated using INDOT VMT data for 2014
*^Targets are based on U.S. Department of Transportation national targets for the preceding three years.
^*Adjusted from motorcycle fatalities per 10,000 registrations to motorcycle fatalities per 100,000 registrations
***Projected based on number of motorcycle registrations as of November 30, 2015
2006 2007 2008 2009 2010 2011 2012 2013 2014 2015Targets
2015^
Data Source
2006-2014Data Source 2015
C-1 Traffic Fatalities 902 898 820 693 754 751 781 783 746 829 717 FARS FARS Projected
C-2 Incapacitating Injuries 3,807 3,661 3,382 3,179 3,449 3,414 3,816 3,441 5,493** 18,647** 3,344 PPI ARIES Projected
C-3Fatalities Per 100 Million Vehicle Miles
Traveled1.27 1.23 1.11 0.90 1.00 0.98 0.99 1.00 0.92^^ 1.01^^ 1.01^^ FARS
FARS/INDOT
Projected
C-4Unrestrained Passenger Vehicle
Occupant Fatalities (All Seat Positions)309 291 267 206 208 192 214 201 190 250 193 FARS ARIES Projected
C-5Fatalities Involving Driver or Motorcycle
Operator with .08 BAC or Above245 224 206 207 194 207 230 198 205 180 197 FARS
FARS/PPI
Projected
C-6 Speeding-Related Fatalities 195 199 250 174 190 153 185 217 204 215 166 FARS ARIES Projected
C-7 Total Motorcycle Fatalities 110 122 131 111 111 118 152 114 124 108 120 FARS ARIES Projected
C-8 Unhelmeted Motorcycle Fatalities 81 95 95 84 88 95 116 82 89 63 94 FARS ARIES Projected
C-9Drivers Aged 20 and Under Involved in
Fatal Crashes180 157 147 116 125 100 130 104 87 52 111 FARS ARIES Projected
C-10 Pedestrian Fatalities 73 59 54 50 62 62 59 77 78 95 57 FARS ARIES Projected
B-1 Observed Seatbelt Usage Rate (%) 84.3 87.9 91.2 92.6 92.4 93.2 93.6 93.1 90.2 91.9 88*^ CRS CRS
12*Number of Seat Belt Citations During
Grant Funded Enforcement68,968 72,115 108,956 113,577 105,746 99,077 82,961 71,993 64,586 52,704 N/A OPO OPO
13
*Number of Impaired Driving Citations
and Arrest During Grant Funded
Enforcement
8,137 6,947 8,157 8,975 8,257 7,907 7,950 6,983 5,823 4,069 N/A OPO OPO
14
*Number of Speeding Citations and
Arrests During Grant Funded
Enforcement
18,003 18,282 66,394 100,230 107,151 86,702 56,181 59,872 44,436 41,643 N/A OPO OPO
15Fatalities Per 100 Million Vehicle Miles
Traveled - Rural1.47 1.77 1.80 1.46 1.67 1.66 1.78 1.83 1.61 1.64 1.60 FARS
FARS/PPI
Projected
16Fatalities Per 100 Million Vehicle Miles
Traveled - Urban1.05 0.81 0.65 0.57 0.59 0.57 0.52 0.50 0.56 0.55 0.53 FARS
FARS/PPI
Pojected
17Motorcycle Fatalities per 100k
Registrations^*74.55 82.69 63.91 54.15 54.15 57.73 68.13 52.14 55.98 49.67*** 61*^ FARS
ARIES/BMV
Projected
18
Rate of .08+ BAC Impaired Driving
Fatalities per 100 Million Vehicle Miles
Traveled
0.34 0.31 0.28 0.27 0.26 0.27 0.29 0.25 0.25^^ .22^^ 0.35*^ FARSFARS/PPI
Projected
19Children Aged 15 and Under Killed in
Traffic Collisions 48 49 47 35 33 38 30 40 33 40 32 PPI ARIES Projected
20 Bicyclists and Other Cyclists Fatalities 21 15 18 7 13 11 15 14 12 9 12 FARS ARIES Projected
Outcome Measure
NH
TS
A C
OR
E M
EA
SU
RE
S
ANNUAL STATISTICS FOR TRAFFIC SAFETY PERFORMANCE MEASURES
Annual Figures Sources

7 State of Indiana 2015 Annual Report
Data
The data sources used for each year, 2006-2015, are noted in Figure 1 above. Several of TSD’s data partners
house, track, compile/analyze the data used by TSD to make programmatic decisions. To determine
calendar year 2015 data projections, all Indiana State Police (ISP) Automated Reporting Information
Exchange System (ARIES), and Fatality Analysis Reporting System (FARS) supplied data was pulled in
December 2015, for January 1, 2015 through November 30, 2015. The data for this period was divided by
11 (period of time covered in the data) and the resulting quotient was added to the original 11 month figure
to achieve the projected 2015 figure.
The data compiled in Figure 2. Citations During Grant Funded Enforcement Activities, FY 2015 were taken
from the Operation Pull Over (OPO) database. Law enforcement agencies report grant funded activities
directly into this database.
It should be noted a methodological change in the reporting of incapacitating injuries, beginning on October
15, 2014, has resulted in a moderate increase in 2014, and a large increase in 2015 of incapacitating injuries,
compared with historic figures. Prior to October 15, 2014, law enforcement officer’s exercised discretion
when classifying an injury or injuries as incapacitating based on the following definition in the ARIES 5
User Manual:
“A non-fatal injury that prevents the injured person from walking, driving or normally
continuing the activities the person was capable of performing before the injury occurred.
Hospitalization is usually required. Examples are: severe lacerations, broken limbs, skull
fracture, crushed chest, internal injuries, etc.”
Beginning October 15, 2014, injuries were to be classified as incapacitating if an individual was transported
from the crash scene for immediate medical treatment.
Data sources, figures, and methodology are shared and discussed with the Indiana Department of
Transportation (INDOT). This approach continues the coordination of the agencies required for the
Highway Safety Plan (HSP), Strategic Highway Safety Plan (SHSP), and Highway Safety Improvement
Plan (HSIP).

8 State of Indiana 2015 Annual Report
Figure 2: Citations During Grant Funded Enforcement Activities, FY 2015
Note: The first of four scheduled blitzes did not occur due to late award of funding.
Source: OPO database
*First year of funding
Occupant Protection
The occupant protection program was designed to increase seat belt usage by educating the public about
the proper use of seat belts and child restraint systems, coupled with law enforcement efforts to enforce the
occupant protection laws in Indiana.
Figure 3: Unrestrained Passenger Vehicle Occupant Fatalities (All Seat Positions) 2006-2015
Source: FARS and Indiana State Police crash data
Note: 2015 figure is projected
Citations Seat Belt Patrols Sobriety Checkpoints Impaired Driving
Patrols Other Patrols Total 2015
Seat Belt 44,074 61 4,808 3,761 52,704
Child Restraint 1,236 87 391 212 1,926
Misdemeanor DUI 261 144 3,024 63 3,492
Felony DUI 48 9 506 14 577
Underage Alcohol 32 13 344 8 397
Suspended License 3,318 152 2,853 980 7,303
Speed 15,335 27 12,171 14,110 41,643
Motorcycle Permit/
License Violation 211 13 215 96 535
*HVE (High
Visibility
Enforcement)
0 0 0 56 56
Criminal
Misdemeanor 1,237 147 1,994 230 3,608
Criminal Felony 331 21 525 56 933
Texting 49 0 60 128 237
All Others 11,792 581 15,698 7,260 35,331
Grand Total 77,924 1,255 42,589 26,974 148,742
Citations During Grant Funded Enforcement Activities, FY 2015

9 State of Indiana 2015 Annual Report
In 2015, there were 250 unrestrained passenger vehicle fatalities. The number of unrestrained passenger
fatalities in 2015 increased 31.6 percent, from 2014. However, overall, there has been a 23.6 percent
decrease in unrestrained passenger vehicle fatalities since 2006.
Figure 4: Seat Belt Usage Rates 2004-2015
Source: CRS
In June 2015, the LELs conducted an observational seat belt survey to determine usage rates for drivers and
passengers of all vehicles. Starting in 2013, seat belt usage rates were calculated using a new formula and
a new set of survey sites. In addition, new observers were used for the 2014 survey. It is likely these factors
played a large role in recent decrease from the 2012 observation rate of 93.6 percent to the 2015 rate of
91.9 percent. Historically, seat belt usage rates of pickup truck occupants have been lower than cars;
therefore, one of ICJI’s primary focuses was targeting this class of occupants. Utilizing the new formula,
survey sites, and observers the survey results found pickup truck occupant usage rates for 2015 at 83.1
percent, which is significantly lower than that of cars, which was 94.8 percent. However, truck seat belt
usage rates increased 4 percent from 2014 to 2015, therefore efforts to increase truck usage rates seem to
have had a positive effect.
Program Management In FY 2015, the Occupant Protection Program Manager coordinated and oversaw occupant protection
initiatives. The Program Manager’s responsibilities included monitoring subgrantee compliance and
performance, and promoting education and enforcement of occupant protection laws. The Program
Manager also oversaw the Rural Demonstration Project (RDP) and Operation Pull Over (OPO). Occupant
Protection funds cover the program manager’s salary, benefits, and travel costs to conferences and trainings.
Traffic Occupant Protection Strategies (TOPS) Officers working overtime enforcement under OPO and Driving Under the Influence (DUI) grants through
the Traffic Safety Division are required to complete the Traffic Occupant Protection Strategies (TOPS)
Course. In FY 2013, ICJI created the TOPS online, four-hour certified course to replace the instructor-led
version that previously encompassed an entire day. This increased efficiency and improved tracking for
compliance. Since its inception in July 2013 through December 1, 2015, the TOPS online course has
certified 1,544 officers. This figure will continue to grow as new agencies join the OPO program.

10 State of Indiana 2015 Annual Report
Operation Pull Over (OPO) ICJI continued working toward increasing Indiana’s seat belt usage rate by funding overtime enforcement
during the OPO enforcement program. During FY 2015, there were a total of 231 participating agencies
and 41 Traffic Safety Partnerships.
OPO agencies averaged 3.31 contacts per hour and issued 1.50 seat belt/child restraint (SB/CR) citations
per hour. Although impaired driving was not a priority for these programs, OPO agencies arrested an
impaired driver every 12.69 hours. OPO officers working enforcement programs worked a total of
55,881.44 hours and issued 151,594 citations and warnings, of which 69 percent were citations.
Rural Demonstration Project (RDP) RDP increased seat belt and proper child restraint enforcement in rural areas with high unrestrained fatality
and injury rates. During the twenty-one day enforcement period, April 5 to April 25, 2015, 18 law
enforcement agencies and ISP increased patrols in rural areas that have consistently low seat belt usage
rates. As a result, 1,592.50 patrol hours were worked with 1,673 seat belt and 35 child restraint citations
issued. In addition, 81 criminal misdemeanor and felony arrests were made during the enforcement period.
Looking Beyond the Ticket Law enforcement agencies reported the following significant events that occurred while working occupant
protection enforcement programs:
During Blitz 83, Marion County Traffic Safety Partnership made 41 arrests, including fleeing,
resisting law enforcement, gun possession by a serious violent felon, multiple drug arrests, and
seven DUI arrests with children in the vehicle, battery on an officer, and a police-action shooting.
While working impaired driving enforcement, Hammond Police Department assisted Munster
Police Department taking a suspect into custody after just committing robbery, carjacking, and the
kidnapping of several people in a vehicle.
While enforcing a seat belt violation, Lake Station Police Department engaged in a vehicle and foot
pursuit involving a vehicular crash. The driver was captured and charged with five felonies and a
misdemeanor, and was in possession of large amounts of marijuana, controlled pills, heroin, and
dealing equipment.
During Blitz 82, Tippecanoe County Traffic Safety Partnership wrote 432 seat belt violations and
eight child restraint violations. They additionally made three DUI arrests, HTV, DWS as well as
warrant arrests.
During Blitz 82, the Evansville-Vanderburgh Traffic Safety Partnership issued more than 300 seat
belt and child restraint citations and more than 400 other moving violation citations.
State Traffic Safety Information System Improvements (Traffic Records)
The target of the Traffic Records program is to create an integrated traffic records system through a
collaboration of all local, state and federal entities responsible for motor vehicle safety. This collaboration
includes coordination with the SHSP and the Indiana Department of Transportation (INDOT) to improve
traffic information systems across the state. The program was designed to improve the timeliness, accuracy,
completeness, uniformity, integration and accessibility of state data that is needed to identify priorities for
national, state and local roadway and traffic safety programs.

11 State of Indiana 2015 Annual Report
ICJI depends on the accuracy and timeliness of crash reports submitted into the crash database for program
decisions, resource allocation, and requests for statewide and local crash statistics. As of November 30,
2015, 91 percent of all crash reports for the year were submitted within five days of the accident.
Program Management In FY 2015, the Traffic Records Coordinator was responsible for managing Indiana’s crash records system,
recruiting agencies to report crashes electronically, and instituting initiatives to improve the timeliness and
accuracy of crash records. The program coordinator utilized the 2013 Indiana Crash Records assessment as
a guide to improve data quality in 2015. The 2013 Indiana Crash Records assessment will be referenced
until a new assessment is conducted. Similar to other years, in FY 2015 the program coordinator followed
a strategic timeline, which outlined when each improvement activity would be conducted. Traffic Records
funds cover the program manager’s salary, benefits, and travel costs to traffic record related conferences
and training seminars.
Indiana University Public Policy Institute In FY 2015, funds supported services provided by the Public Policy Institute (PPI), including the
identification of motor vehicle crash trends and the creation of Indiana traffic trend fact sheets. Fact sheets
contain traffic-related data for each of the following categories: motorcycles, young drivers, dangerous
driving, occupant protection, children, trucks, and alcohol. In addition, the Center publishes an annual
Indiana crash fact book and county profiles publication covering each of Indiana’s 92 counties. TSD utilizes
this information to help inform performance measures, inform media requests, and distributes it to
subgrantees to incorporate in their grant applications.
Center for Road Safety In FY 2015, Purdue University’s Center for Road Safety (CRS) conducted various data analysis for ICJI.
The CRS released two publications regarding crash, EMS, and hospital inpatient/outpatient databases. The
CRS also analyzes results from the observational seat belt usage surveys (91.9 percent seat belt rate in
2015). This was an increase of 1.7 percent from 2014. For more information regarding the seat belt survey,
please reference the Occupant Protection section of this report.
Traffic Records Improvement
Automated Reporting Information Exchange (ARIES) Through November 2015, 100 percent of all crash reports were electronically submitted by law enforcement
agencies in Indiana’s newest electronic vehicle crash program, ARIES version 5.1. ICJI’s Traffic Safety
research continues to work with Appriss to identify data problems, possible querying improvements, and
other issues to help further improve data validity and access.
Trauma Registry Project The Indiana Trauma Registry (ITR) is the foundation component of the Indiana trauma system, providing
the means to monitor the system for efficiency and effectiveness in hopes of improving injury data
submitted by hospitals for those involved in a traffic crash. During FY 2015, the number of submitting
hospitals decreased from 101 to 100. With the increase in submitting trauma centers, the number of trauma
patient records available for analysis continues to increase. The number of patient records increased from
128,029 in 2014 to 177,160 in 2015. For FY 2015, the number of days from the incident to entry in the
Trauma Registry increased from 51 days to 107 days.

12 State of Indiana 2015 Annual Report
Electronic Citation and Warning System (eCWS) The Indiana Supreme Court’s Division of State Court Administration accepted the role of designing an
electronic traffic citation system. The purpose of this project was to provide a statewide end-to-end solution
for the electronic transmission of a traffic violation. This program also brings together systems that will
build on a statewide case management system, Odyssey, which will include information sharing between
Indiana’s court, clerks, Indiana BMV, and law enforcement agencies.
As of September 30, 2015 there have been 230 courts in 54 of the 92 counties trained on and using the
Odyssey case management system. In FY 2015, a total of 374 law enforcement agencies have been trained
in the eCWS (or e-ticket) system. Furthermore, the number of uniformed citations found in the eCWS
central repository for analysis increased from 6,925,185 at the end of FY 2014 to 7,912,717 at the end of
FY 2015.
Racial Profiling In FY 2015, funds were used for agencies to purchase the necessary scanners and printers needed to utilize
eCWS to help increase the access to citations in the Odyssey Case Management System. Additionally,
funding was used to train representatives from the agencies on how to use the equipment. To date, eCWS
stores approximately 76 percent of all traffic infraction and ordinance stops in the State of Indiana. The
ticketing software has the ability to collect numerous data elements for each driver or passenger for any
given traffic stop. Race is one data element that is collected. In FY 2015, the project continued training
officers and collected data to later be analyzed. This analysis should allow ICJI to determine whether racial
profiling occurred in regard to traffic infractions and stops. It should be noted that FY 2015 will be the final
year of funding for this grant.
Impaired Driving Figure 5: Fatalities Involving Driver or Motorcycle Operator with .08 BAC or Above 2006-2015
Source: FARS and Indiana State Police crash data
Note: 2015 figure is projected
Reducing impaired driving continued being one of ICJI’s primary focuses. Although Indiana has
historically had a lower percentage of overall fatalities as a result of impaired driving than that of the
national level, during 2015, ICJI continued implementing enforcement efforts and public information
campaigns to reduce impaired driving crashes, injuries, and fatalities. In 2015, ICJI, local law enforcement
and statewide LEL’s made an increased effort to promote and support HVE in the form of sobriety
checkpoints, sign boards, and patrol car signage to help spread a general deterrent for impaired driving
prevention.

13 State of Indiana 2015 Annual Report
In 2015, there were 180 alcohol-impaired fatalities. Based on the number of alcohol-related fatal collisions,
the 2015 rate of alcohol-related fatalities per 100M VMT of 0.22 did meet the 0.35 target. ISP and local
law enforcement agencies conducted 71 sobriety checkpoints in 2015 using 405D Impaired Driving funds;
51 of which were conducted by DUI Task Forces. In the last seven years, 962 sobriety checkpoints have
been conducted.
Program Management In FY 2015, the Impaired Driving Program Manager coordinated and monitored impaired driving
countermeasure projects. The Program Manager responsibilities included monitoring subgrantee
compliance and performance, collaborating with local, state, and community organizations in developing
and implementing impaired driving awareness campaigns, and promoting enforcement of Indiana’s
impaired driving laws. In 2015, the Impaired Driving Program Manager participated in all of ICJI’s traffic
safety update meetings in Indiana, which consist of roadshows around the state meeting with local law
enforcement about upcoming funding availability. Impaired Driving funds paid for the program manager’s
salary, benefits, and travel costs to impaired driving related conferences and training seminars.
DUI Task Force FY 2015 was another important year in the DUI Task Force program in Indiana. With a continued focus on
general deterrence, Task Force agencies stepped up their enforcement with highly visible and sustained
strategies in order to change behaviors of those willing to drink and drive. Thirty-two counties comprised
the DUI Task Force program supplemented with 14 regional ISP districts throughout the state. These
agencies, strategically located in areas of the state with the highest representations of alcohol-related
crashes, were provided overtime funding for officers to detect and arrest impaired drivers utilizing HVE
efforts such as sobriety checkpoints. In FY 2015, utilizing 405 funds, the DUI Task Force program issued
27,132 citations/arrests. DUI Taskforce Indiana was also instrumental in implementing NHTSA
recommended HVE techniques, by conducting 71 sobriety checkpoints, resulting in 719 arrests/citations.
With the renewed efforts in HVE, ICJI saw new agencies participate in sobriety checkpoints. In conjunction
with programmatic staff, ICJI’s regional LEL network, and the state’s Traffic Safety Resource Prosecutor,
Indiana was able to saturate new markets with HVE and general deterrent traffic enforcement.
Indiana State Excise Police – Underage Drinking Programs The Indiana State Excise Police (Excise), the law enforcement division of the Indiana Alcohol & Tobacco
Commission, has full police powers to enforce alcohol and tobacco laws. During FY 2015, Excise received
funding from ICJI to conduct three enforcement initiatives; Stop Underage Drinking and Sales (SUDS),
Cops in Shops (CIS), and Intensified College Enforcement (ICE), which focused on reducing the
availability of alcoholic beverages to persons who cannot legally possess, consume, transport, or purchase
alcohol.
Data does not exist on how many minors are deterred from possessing, consuming, driving impaired, or
acquiring alcoholic beverages by persons under the age of 21. However, during the 132 SUDS details in
FY 2015, juveniles/minors were prevented from further consuming and possessing alcoholic beverages
illegally. Over 1,400 arrests/warnings being issued. SUDS details are conducted at large events where
underage drinking often occurs. Such events include Indiana University’s Little 500, the Indianapolis 500,
concerts at Klipsch Music Center, White Rive State Park, the Madison Regatta, Terre Haute Scheid Diesel,
Evansville’s West Side Nut Club Fall Festival, and many more.
CIS allows officers to work one-on-one with alcoholic beverage establishment employees on how to
recognize false identifications. Because of this one-on-one time, store employees are able to prevent minors

14 State of Indiana 2015 Annual Report
from purchasing when officers are not present. In FY 2015 Excise conducted 67 details resulting in over
100 citations and warnings being issued.
ICE was a new program in FY 2015 in which officers were able to increase their enforcement efforts in and
around six of the major college campuses in Indiana. Specifically targeted were Indiana University, Purdue
University, Ball State University, Notre Dame, Indiana State University, and Butler. Excise conducted 98
ICE details in FY2015. Approximately 1,880 citations, arrests, or warning tickets were issued as a result of
these details.
Standardized Field Sobriety Testing & Drug Recognition Expert Programs The Standardized Field Sobriety Testing (SFST) program, under direction of the Indiana Law Enforcement
Academy (ILEA), continued training officers in best practices for identifying alcohol and drug impaired
drivers in 2015. Officers were trained in SFST at ILEA in conjunction with rules for basic officer
certification by the Law Enforcement Training Board. Officers were trained at various sites in Advanced
Roadside Impaired Driving Enforcement (ARIDE). Some agencies required all of their patrol officers to be
trained in ARIDE. Officers were trained in the Drug Evaluation and Classification program at two off-site
trainings, Ft Wayne in the spring and Lawrenceburg in the fall. While some of the officers have completed
their training requirements for certification, training for other officers is ongoing. Upon completion of the
training, officers become certified Drug Recognition Experts (DREs). As of December 2015, there are 150
certified DREs throughout the State of Indiana covering 40 counties, 69 departments, and four state
agencies.
Traffic Safety Resource Prosecutor Chris Daniels serves as the Traffic Safety Resource Prosecutor (TSRP) for Indiana. As the TSRP,
Prosecutor Daniels provided comprehensive training to prosecutors and law enforcement officers about the
most effective methods of investigating and prosecuting impaired drivers and other traffic-related offenders.
During FY 2015, the TSRP hosted four statewide conferences teaching the following courses: Train the
Trainer, SFST and OWI, Legal and Ethical Update, and Trial Advocacy. In addition, the TSRP presented
at the IPAC Winter, Spring, and Summer conferences, as well as several regional trainings. These trainings
provided over 75 hours of legal continuing education hours. The first of a series of ongoing webinars was
also instituted in 2015, allowing greater reach to a wider array of audiences.
In addition, the TSRP joined with ICJI LELs to help set up Sobriety Checkpoint training across the state
and aided various police departments in setting up their own successful sobriety checkpoint programs.
In 2015, the TSRP spoke at numerous law enforcement trainings, including the ILEA Academy, ISP
ARIDE class, DRE Instructor Course, the DRE Academy, the SFST Instructor Refresher course, the Chiefs
of Police, and numerous regional law enforcement agencies, providing training on case law updates, cops
in court, trial strategy, and OWI enforcement.
During the 2015 legislative session, the TSRP worked closely with law enforcement, defense attorneys,
members of the legislature, and other prosecutors on various legislative matters. Primarily the TSRP
focused on the criminal code rewrite, in which he worked on applying the new sentencing plan to the
Indiana traffic code and helped plan trainings for the transition to the new code as well as other matters
such as ignition interlock, highway work-zones, and motor driven bicycles.
The TSRP continues to be a member of several work groups and community organizations such as MADD,
the Bureau of Motor Vehicles, Department of Toxicology, and other agencies working closely with traffic
safety.

15 State of Indiana 2015 Annual Report
Judicial Outreach Liaison In September of 2012, ICJI was awarded a $50,000 competitive grant from NHTSA over a 30 month period
to help pay for a part-time Judicial Outreach Liaison (JOL). In FY 2015, ICJI continued to contract with
Judge Tim Oakes as a part time JOL. The JOL assists in establishing stronger relationships between judicial
entities and the Indiana State Highway Safety Office (SHSO).
During this year the JOL has provided Continuing Legal Education seminars for lawyers involved in
Impaired Driving cases for the ICLEF. Three main topics were presented: 1) NHTSA’s push for Specialized
OVWI Courts; 2) NHTSA’s push for Ignition Interlock; and 3) the impact, issues, and concerns regarding
the science of convictions on OVWI involving marijuana.
In addition the JOL partnered with the Indiana Prosecuting Attorney’s Council (IPAC) to conduct four
specialized OVWI Court trainings to include participation from law enforcement and prosecutors.
Earlier in the year the JOL hosted the regional JOL, Judge Phyllis McMillian from Michigan, for an
introduction and explanation to criminal court colleagues at Marion County Criminal Term meeting.
These and other activities, including regular conference calls with the Traffic Safety Division Director and
the Indiana Traffic Safety Resource Prosecutor, Chris Daniels, have helped TSD delve more deeply into
the issues surrounding impaired driving including ignition interlock and DWI courts.
Operation Centipede (Five Percent Report) The FHWA Five Percent Report program, completed in 2012, resulted in an Indiana procedure for
identifying high-crash locations in the road network. This report expands the original screening criteria by
identifying roads (intersections and segments) that experience high frequency of specific types of crashes
including: high-severity crashes on segments resulting in fatality or incapacitating injury (KA crashes),
intersection crashes that involved vehicles arriving from different intersection legs, and crashes that
involved commercial vehicles 10,000 pounds or heavier. The first and second types of crashes can be linked
with unsafe behavior of drivers. The first type of crash may indicate excessive speeding while the second
is most likely caused by violation of either the intersection control or the priority rule. In reconciling the
need for targeted enforcement coupled with funding restrictions, ICJI further refined these segments to
those experiencing crashes involving alcohol. Implementing this approach, the Traffic Safety Division
utilized carry forward funding to provide local, county, and state police the resources to conduct extra HVE
patrols and DUI checkpoints in these geo-targeted areas to reduce fatalities and injuries.
The project funded additional enforcement efforts for the most dangerous roadways in Indiana. Data was
provided by Purdue University’s Center for Road Safety (CRS) and encompassed annual collision data for
2010 through 2012. After acquiring additional data from CRS, 54 segments or intersections in 19 counties
accounting for 418 alcohol-related collisions were identified. Operation Centipede was designed to focus
enforcement on these locations
In 2015, TSD implemented the 5 percent report, targeting Indiana’s most dangerous road segments and
intersections with the highest propensity for alcohol involved collisions. Unfortunately, the enforcement
results were inconclusive as they relate to impaired driving arrests and stops. However, there was
considerable activity along these segments for speeding, red light running, and following too closely. Here
are a few significant enforcement results of Indiana’s 5 percent Report during the summer months of 2015:
8481 total speed related citations across Indiana
121 texting citations
6 sobriety checkpoints that netted a total of 154 separate arrests/citations to the driver

16 State of Indiana 2015 Annual Report
Motorcycle Safety
Figure 6: Total Motorcycle Fatalities 2006-2015
Source: FARS and Indiana State Police crash data
Note: 2015 figure is projected
The motorcycle program is designed to increase the general motoring public’s awareness of motorcycles
on the roadway. This program also serves to educate riders of training opportunities on how to improve
their riding skills, become properly licensed, and the importance of protective gear.
In 2015, there were 108 motorcycle fatalities in Indiana; therefore, the target of reducing the number of
motorcycle fatalities to 120 in 2015 was achieved. With a rate of 49.67, ICJI successfully met its target rate
of 61, decreasing the rate of motorcycle fatalities per 100,000 motorcycle registrations in 2015.
Indiana law does not require helmets to be worn by motorcyclists with a motorcycle endorsement, if they
are over the age of 18. However, ICJI would like to increase motorcycle helmet usage across the state,
which will contribute to a decrease in total motorcycle fatalities. In 2015, 63 of the 108 motorcycle or
moped operators and passengers involved in fatal collisions were not wearing helmets; therefore, 58 percent
of motorcycle operators or passengers were not helmeted at the time of the fatal collision.
Figure 7: Unhelmeted Motorcycle Fatalities 2006-2015
Source: FARS and Indiana State Police crash data
Note: 2015 figure is projected
Program Management In FY 2015, the Motorcycle Safety Program Manager, in coordination with ICJI’s Communications
Director, coordinated and oversaw motorcycle safety initiatives. The Program Manager’s responsibilities
included monitoring subgrantee compliance and performance, and promoting education and enforcement

17 State of Indiana 2015 Annual Report
of motorcycle laws. Traffic Records funds paid for the program manager’s salary, benefits, and travel costs
to conferences and trainings.
Programs In FY 2015, the focus of ICJI’s motorcycle program emphasized reducing alcohol impaired riding, motorist
awareness of motorcycles, promoting formal rider training, and increasing the percentage of motorcycle
riders who were properly licensed.
Informational brochures outlining how to become properly licensed, rider training course information, and
recommended proper protective motorcycle gear were distributed at events heavily attended by riders.
These events included the Riley Hospital for Children Miracle Ride, and the Motorcycle Awareness Month
Kickoff. Posters featuring Moto GP Rider Nicky Hayden promoted the message to riders to wear protective
gear.
In 2015, ICJI continued an impaired riding crackdown project, in which law enforcement agencies were
encouraged to participate. The purpose of this project was to increase high visibility enforcement in areas
that were identified with high impaired motorcycle rider fatalities, and where there was a heavy
concentration of motorcycle traffic associated with establishments that catered to motorcyclists. Five
impaired motorcycle HVE events were conducted in 2015 in Portage, Ft. Wayne, Lawrence County,
Vanderburgh County, and Clark County. Additional events are being planned for FY 2016.
Started in 2013 and continuing in 2015, ICJI contracted with Purdue University to work in conjunction with
ABATE of Indiana, Inc. to develop a database that would be able to cross reference crash involved
motorcyclists with ABATE’s records on motorcycle rider course participants. ABATE had a state contract
to conduct motorcycle training courses through the Indiana Motorcycle Operator Safety Education Program
from 1987-2014. ABATE has trained over 90 percent of the people taking a rider education course over
this period.
ICJI now has the capability to cross reference any crash involved motorcyclist with ABATE rider course
records going back as far as 2000. This will provide ICJI with the ability to measure what correlation rider
training courses have on future crash involvement. Not only can the new database identify if a crash
involved rider has ever taken a training class, but it can also provide information as to where that course
took place, the individual’s license status at the time, and whether the individual passed or failed the course.
It is hoped that this new capability will help measure the effectiveness of rider training courses, and provide
insight on how to improve the training courses.
Motorcycle Media / Public Awareness Campaign TSD partnered with ABATE to promote motorcycle safety awareness at a statewide kick-off event in
Indianapolis in early May. For the third year, TSD was a title sponsor for the Miracle Ride for Riley Hospital
for Children. This is one of the largest motorcycle fundraising events in the state – with more than 7,000
riders. Our messages of “Get Legal. Get Licensed.” and “Ride Sober or Get Pulled Over.” were visible at
the event and were published in multiple editions of the Hoosier Motorcyclist Magazine and several other
motorcycle publications, reaching over 150,000 riders.

18 State of Indiana 2015 Annual Report
Child Passenger Safety
Figure 8: Children Aged 15 and Under Killed in Traffic Collisions 2006-2015
Source: Indiana State Police crash data
Note: 2015 figure is projected
Children ages 15 and younger killed in traffic collisions increased from 33 in 2014 to 40 in 2015, which
did not meet the target of 32 or less. ICJI continues its collaboration with law enforcement agencies and
Automotive Safety Program (ASP) to reduce child fatalities and incapacitating injuries.
Program Management In FY 2015, the Child Passenger Safety Program Manager coordinated and oversaw child passenger safety
initiatives. The Program Manager’s responsibilities included monitoring subgrantee compliance and
performance, and promoting education and enforcement of child passenger laws. Child Passenger Safety
funds paid for the program manager’s salary, benefits, and travel costs to conferences and trainings.
Automotive Safety Program During FY 2015, ICJI continued to support the Automotive Safety Program (ASP) at the Indiana University
School of Medicine, which sought to reduce injuries and fatalities resulting from motor vehicle crashes in
Indiana. The primary focus of the ASP was to design and promote traffic safety initiatives for children in
Indiana. The ASP provided statewide public information and education programs to increase the correct
use of child restraints. To do this, ASP oversaw a network of 103 permanent fitting stations, including 25
satellite sites with locations in 53 counties. These sites offered child safety seat inspections and education
throughout the year. Forty sites reported they offer services to Spanish speaking families; thirty by means
of an interpreter; five by means of bilingual a Child Passenger Safety Technician (CPST), and five by means
of language lines. In addition to the permanent fitting stations, ASP funded 90 child safety seat clinics
throughout the state.
In FY 2015, ASP utilized the National Child Passenger Safety Curriculum to conduct 20 CPST certification
classes throughout Indiana. These classes were held in the following cities; Fort Wayne (2), Terre Haute
(2), Indianapolis (4), Columbus, Richmond, South Bend, Muncie, Seymour, Avon, St. John, Newburgh,
Greenwood, Lebanon, LaPorte, and Bedford. By conducting these classes, the ASP was able to add 193
new technicians, 29 of which were law enforcement officers. As of the end of FY 2015, there were a total
of 1,115 Child Passenger Safety Technicians and Instructors in Indiana.
The addition of these new technicians aided ASP’s effort to increase the number of child safety seats
provided to the public. Throughout FY 2015, with funding from ASP, 10,538 car seats were inspected in
Indiana. Of those inspected, 4,487 were deemed defective or unsafe and were replaced.

19 State of Indiana 2015 Annual Report
ASP also continued to administer Project L.O.V.E. (Law Officer Voucher and Enforcement). This program
was designed specifically for law enforcement to provide families with education on the proper use and
installation of child restraints. The ASP provided law enforcement officers with vouchers they could
distribute during a traffic stop, at the scene of a crash, or during an OPO event to parents or caregivers who
were traveling with children who were not properly restrained in a child safety seat. In FY 2015, Project
L.O.V.E. vouchers were made part of E-citations. When an officer gave a citation for improper child
restraint, a voucher automatically printed with the ticket. Parents and caregivers could redeem the vouchers
at the Permanent Fitting Station nearest to their home where they were provided with education on the
proper use and installation of child safety seats as well as a new seat, if deemed necessary. In FY 2015,
officers issued 3,848 vouchers; of which 185 were redeemed.
ASP continued outreach to minority populations in an effort to educate immigrant families on child
passenger safety, focusing primarily on the increasing Hispanic population. From October 1, 2014-
September 30, 2015 the Latino Project Manager conducted a total of 199 Hispanic/Latino office
appointment inspections. These inspections served 104 families, of which 15 were Project L.O.V.E.
recipients and 57 were expectant women. The Latino Project Manager distributed 157 new car seats to
Hispanic/Latino families.
Automotive Safety Program Additions and Highlights The Safe Kids Project Manager and the Automotive Safety Program created a new program
directed at 8-12 year olds called Belt Abouts. They have created 2 versions for younger and older
students, a letter for the parent or caregiver, and extra storyboard sheets.
The Automotive Safety Program have a partnership with RecycleForce. They are able to recycle
used car seats from ASP and other organizations throughout Indiana. ASP collected child restraints
from car seat appointments and car seat clinics throughout the grant year and dropped them off to
RecycleForce’s downtown location. ASP recycled a total of 164 child restraints this FY.
ASP attempts to maintain the number of CPSTs by providing annual refresher courses which aid
the CPSTs in their recertification process. The recertification rate in Indiana for CPST in FY15 was
59.5 percent. This is a 9 percent increase from FY14 and above the national average of 58.4 percent.
The 10th Annual Indiana Injury Prevention Conference was held during the month of June in
Indianapolis and attended by ASP staff. The conference provides up to date information on child
passenger safety and other pertinent traffic safety related injury prevention initiatives. The
conference concluded on the first day with a car seat clinic at the Indianapolis Zoo. The event was
staffed by 79 child passenger safety technicians. A total of 187 inspections were completed and
140 car seats distributed.
Child Restraint Distribution Grant As a result of the Indiana Child Restraint law that requires children to ride in child restraints until they turn
eight years of age, a state child restraint system account was created. Funds generated from fines collected
as judgments for violations, appropriations from the General Assembly, grants, gifts, donations, and interest
are granted by ICJI to private and public organizations for the purpose of purchasing and distributing child
restraints to those who may not be able to afford proper child restraints. Between January 1, 2014 and June
30, 2015 a total of 2,478 child safety seats were distributed to families in need as a result of this fund. This
fund also provided 84 special needs car seats loaned to children in hip casts at Riley Hospital for Children.
In addition, 8 child passenger safety technicians training occurred resulting in 105 new Child Passenger
Safety Technicians in the state of Indiana.

20 State of Indiana 2015 Annual Report
Young Drivers
Figure 9: Drivers Aged 20 and Under Involved in Fatal Crashes 2006-2015
Source: FARS and Indiana State Police crash data
Note: 2015 figure is projected
During FY 2015, ICJI focused efforts toward reducing young driver fatalities. The target was to reduce the
number of fatal crashes for this age group. In 2015, 52 young drivers were involved in a fatal crash, meeting
our target of 111.
Program Management In FY 2015, the Young Driver Program Manager coordinated and oversaw young driver safety initiatives.
The Program Manager’s responsibilities included monitoring subgrantee compliance and performance, and
promoting education and enforcement of young driver laws, including the Graduated Driver’s License
(GDL) program. Young Driver Safety funds paid for the program manager’s salary, benefits, and travel
costs to conferences and trainings.
Indiana Students Against Destructive Decisions Indiana Students Against Destructive Decisions' (Indiana SADD) mission is to provide students with the
best prevention tools possible to deal with the issues of underage drinking, other drug use, risky and
impaired driving, and other destructive decisions. Starting with 80 chapters in 2000, Indiana SADD
continues to expand the number of SADD chapters in high schools from 252 in FY 2014 to 255 in FY 2015.
Indiana SADD was able to reach 71 schools who participated in seat belt use and underage drinking
campaigns in the fall and spring.
By meeting with nearly 30 chapters at regional meetings in the fall and 46 chapters at the annual Indiana
SADD one-day conference (SADD Celebration), the organization provided education and resources to
chapters and allowed them to network to gain new ideas, renew passion, and a sense of the "bigger picture"
of making an impact at the state level.
Indiana SADD had the privilege of working with some fantastic students as part of their Student Leadership
Council. One of these students, Derek Sims, was named to the SADD National Student Leadership Council.
Finally, Indiana SADD was able to add some new and exciting programs to help increase awareness. In
March 2015 they worked with the Pacers to hold the second Indiana SADD Night. Indiana SADD also
partnered with SADD National to offer SADD Shines Day to chapters across Indiana. They also created
some smaller activities and opportunities such as “Be a Blessing” project in December and “Celebrate
Yourself” in February. Indiana SADD started “monthly giveaways” on the Indiana SADD Facebook page
to draw more Facebook fans.
21 State of Indiana 2015 Annual Report
Rule the Road Indiana In FY 2015, ICJI continued the Rule the Road (RTR) teen driving initiative which targets youth ages 15
through 18 and teaches safe driving skills. RTR events are supported by ICJI, Indiana SADD, and local law
enforcement. The events provide young drivers hands-on driving experience with the assistance of certified
emergency vehicle operators.
State Farm Insurance awarded ICJI a grant of $10,000 to assist with cost of RTR events. There were three
RTR events across the state in FY 15. The Vanderburgh County Traffic Safety Partnership in conjunction
with Roberts Park, Mater Dei High School, and Reitz Memorial High School conducted the first RTR event
on May 7, 2015. This event had 36 student participants. Scott County, in conjunction with John Jones
Automotive Dealership, Austin High School, and Scottsburg High School, conducted the second RTR on
September 2, 2015. This event had 57 student participants. The Seymour Police Department, in conjunction
with Freeman Field Air Base, Seymour High School, and trained EVO officers from several local police
agencies, held the last RTR event on October 29, 2015. With 58 student participants in the final event,
altogether RTR provided hands-on experience and expert instruction to over 150 young drivers. All of these
events received excellent media coverage and student participants’ evaluations gave very high marks for
the event.
Ford Driving Skills for Life In FY15, ICJI received over $15,000.00 in grant funds from Ford Driving Skills for Life to conduct a teen
driving conference. The conference was held in October 2015 at the Indiana State Fairgrounds. ICJI
partnered with Indiana SADD, Hamilton County Traffic Safety Partnership, Marion County Traffic Safety
Partnership, Indiana Bureau of Motor Vehicles, Tom Wood Ford, AAA Hoosier Motor Club, ABATE,
Indiana Motor Truck Association, and Indiana Bicycle Coalition Inc. to provide teens with a comprehensive
one day event. Twenty teens from area schools were able to come to the event. While there, they learned
information regarding the graduated driver’s licensing laws, sharing the road with motorcycles, pedestrians,
bicyclists, and large trucks. Teens were also given hands on experience driving police cars with trained
emergency vehicle operators through evasive maneuvering, controlled braking, and SKID car courses.
Finally Tom Wood Ford provided information regarding maintaining your vehicle with proper oil changes,
checking tire pressure, and checking tire tread. The evaluations of the event showed that the teens really
enjoyed the event and that it made a positive impact on the participants’ knowledge of vehicle maintenance
and safety.
Driving Simulator ICJI provides interactive education on the dangers of texting and driving using an all-in-one portable, table
top driving simulator. The simulator is used at various events across the state. These events include Rule
the Road Teen Driving Events, numerous school events, driver’s education classes, and The Indiana State
Fair. The simulator was available at 29 events throughout the state of Indiana in FY15 and was used by
over 850 people ages 14 to 65.
22 State of Indiana 2015 Annual Report
Pedestrian/Bicycles
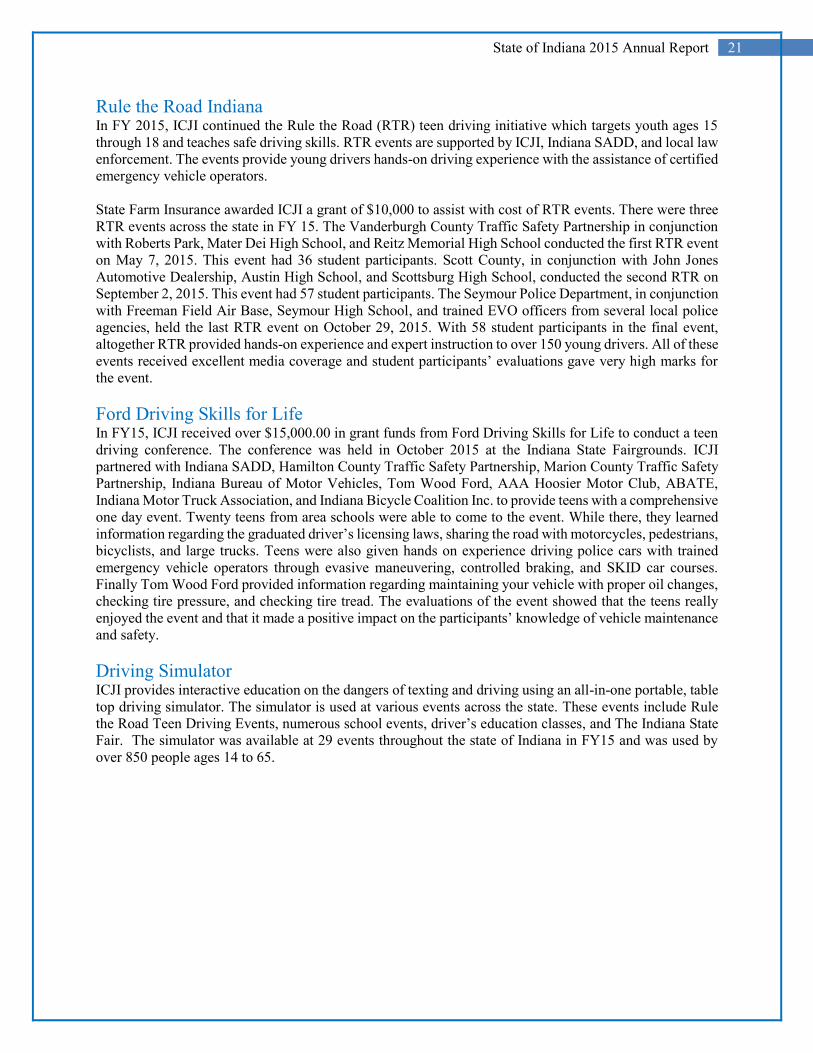
Figure 10: Pedestrian Fatalities 2006-2015
Source: FARS and Indiana State Police crash data
Note: 2015 figure is projected
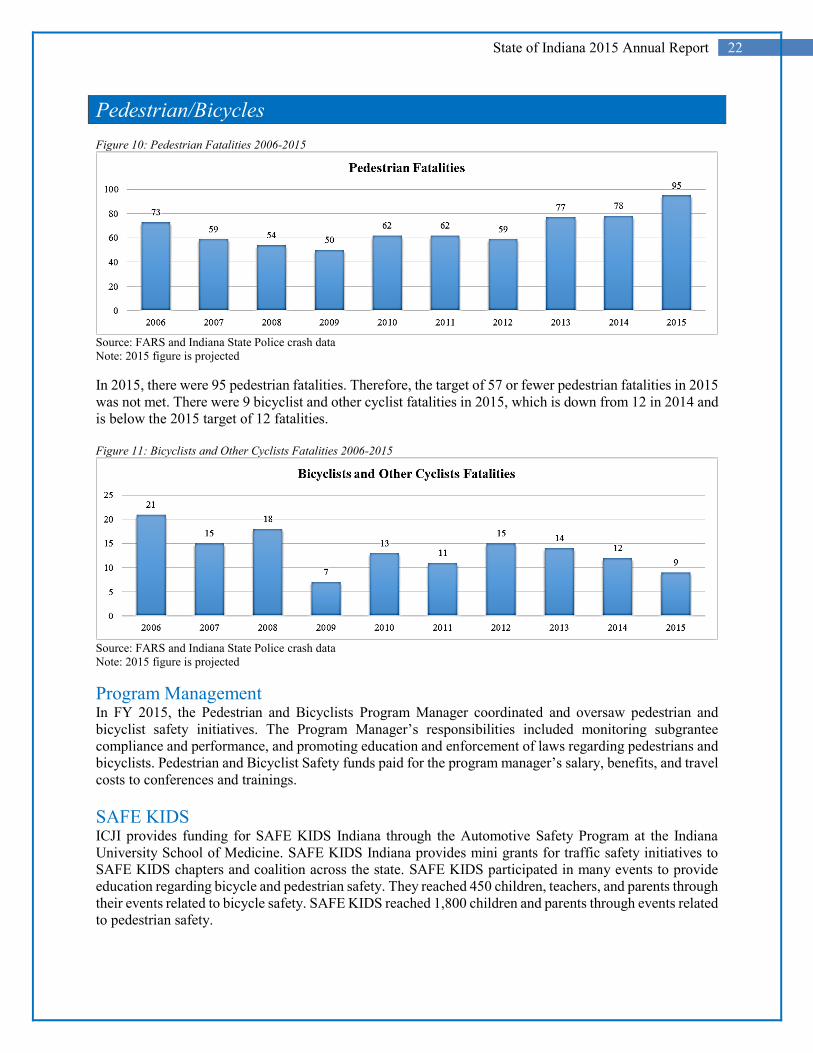
In 2015, there were 95 pedestrian fatalities. Therefore, the target of 57 or fewer pedestrian fatalities in 2015
was not met. There were 9 bicyclist and other cyclist fatalities in 2015, which is down from 12 in 2014 and
is below the 2015 target of 12 fatalities.
Figure 11: Bicyclists and Other Cyclists Fatalities 2006-2015
Source: FARS and Indiana State Police crash data
Note: 2015 figure is projected
Program Management In FY 2015, the Pedestrian and Bicyclists Program Manager coordinated and oversaw pedestrian and
bicyclist safety initiatives. The Program Manager’s responsibilities included monitoring subgrantee
compliance and performance, and promoting education and enforcement of laws regarding pedestrians and
bicyclists. Pedestrian and Bicyclist Safety funds paid for the program manager’s salary, benefits, and travel
costs to conferences and trainings.
SAFE KIDS ICJI provides funding for SAFE KIDS Indiana through the Automotive Safety Program at the Indiana
University School of Medicine. SAFE KIDS Indiana provides mini grants for traffic safety initiatives to
SAFE KIDS chapters and coalition across the state. SAFE KIDS participated in many events to provide
education regarding bicycle and pedestrian safety. They reached 450 children, teachers, and parents through
their events related to bicycle safety. SAFE KIDS reached 1,800 children and parents through events related
to pedestrian safety.

23 State of Indiana 2015 Annual Report
Safety Programs In FY2015, ICJI funded six pedestrian and bicycle safety programs. Two of those programs were Hammond
Police Department and Princeton Police Department. These agencies worked to keep pedestrians and
bicyclists safe through presence and enforcement of traffic laws. ICJI funded the city of Bloomington for a
project they called Civil Streets. This program looked at engineering changes throughout the city, educating
the public through numerous avenues, and working with the Bloomington Police Department to enforce
pedestrian and bicyclist laws. IndyCog and Indiana Bicycle Coalition were both funded for their efforts in
bicycle safety. Indiana Bicycle Coalition strives to include consistent education regarding bicycle safety in
all driver’s education programs. IndyCog provided educational materials, reflectors, and bicycle lights as
well as conducting bicycle education safety classes. Finally, Alliance for Health Promotion was funded for
their efforts in pedestrian safety. They analyzed crash data from the Indianapolis area finding the most
dangerous intersections for pedestrians. With this information, three pedestrian safety zones were
completed.
Police Traffic Services
Program Management The program manager funded under Police Traffic Services oversaw the Automotive Safety Program,
Excise, Indiana SADD, pedestrian, pedalcyclist, and teen driver programs in FY 2015. This included
organizing and being responsible for the three Rule the Road events and one Ford Driving Skills for Life
event held in FY 2015.
Statewide Traffic Safety Training In FY 2015, TSD conducted three annual traffic safety updates to inform subgrantees about upcoming grant
solicitations and current crash trends. At these meetings, TSD sought input from subgrantees regarding
types of training they deem necessary to better implement occupant protection enforcement, drug and
alcohol recognition and testing, child passenger safety, and legal traffic stops. Expectations of the
subgrantees during the fiscal year were also reiterated. Funding paid for training facilities, travel costs, and
training materials.
Indiana State Police In FY 2015, Indiana State Police (ISP) officers conducted saturation patrols and sobriety checkpoints to
combat dangerous driving, seat belt violations, and impaired driving. ISP is required to participate in all
four OPO blitzes and must conduct at least 30 percent of their seat belt enforcement at night. ISP
concentrated their efforts in areas of the state having few, if any, agencies participating in ICJI traffic
safety funded programs in FY 2015. ISP also participated in RDP. The 406 funds were used for the
purchase of crash data retrieval equipment for troopers in each region. Other funding paid for law
enforcement officers’ salaries, training, and travel.

24 State of Indiana 2015 Annual Report
Paid Media and Communications
Child Passenger Safety / October 2014 Media Focus: Make Sure Your Car Seat is Properly Installed
ICJI partnered with ASP to hold child seat safety clinics across Indiana. ICJI provided boilerplate press
releases, media contact lists, speaking points, and a two-week planning guide on how to hold a successful
media/special event. Press conferences were held in the large media markets highlighting the importance
of proper car seat installation and checkup events. During the CPS Week events a total of 357 child
restraints were checked for proper installation, 206 seats were replaced for families in over seven separate
events.
Media also focused on ICJI website, www.childseat.in.gov, for parents and primary care givers. The
website lists permanent fitting stations across Indiana and provides key phone numbers and other
information about car seats and booster seats.
Budget: $100,000
Drive Now. Text L8R. GRAD Magazine
ICJI placed an ad in GRAD Magazine encouraging college students not to text and drive. The magazine is
delivered to every college junior and senior at public and private universities in Indiana. Nearly 80,000
magazines are distributed through this initiative which is strongly supported by every university and college
president.
Distribution: 80,000 pieces distributed directly to all juniors and seniors at every Indiana college and
university.
Budget: $9,000
Safe Family Travel / Blitz 81 / November 2014 Media Focus: Drive Sober or Get Pulled Over
ICJI’s Communication’s Division provided boilerplate media releases, speaking points, and media contact
lists for the local Traffic Safety Partnerships (TSP). TSPs added local information to make their
announcement more relevant and likely to be picked up by local reporters. In the major media markets
(South Bend, Fort Wayne, Terre Haute, Indianapolis, Evansville, Louisville), TSPs engaged their local,
regional, and state partners at press conferences.
Indiana has a strong network of traffic safety partnerships and just as in years past the TSPs were able to
gain media recognition during the first blitz of 2014. Press conferences were held in the large media markets
and small local papers produced articles to raise awareness.
Drive Now. TXT L8R Social Media Contest / April 2015 Media Focus: High school and college students

25 State of Indiana 2015 Annual Report
ICJI partnered with Indiana Lt. Governor Sue Ellspermann, Indiana State Police, Indiana Department of
Transportation, Indiana Bureau of Motor Vehicles, and Indiana Department of Labor to sponsor a social
media contest, in April, to encourage Hoosiers not to text while driving.
Students worked individually, or in teams of up to three people, to create messages and videos for their
Twitter, Instagram, and Vine accounts. Students were encouraged to use “Drive Now. TXT L8R” in their
posts and the #TXTL8RIN hash tag. There were high school and college divisions – with awards for each
platform (Twitter, Vine, Instagram). There also was a “most creative” award given for each platform.
The student or team with the greatest number of likes, favorites, and forwards each received a $5,000
scholarship for their post-secondary studies. The funds were deposited into their 529 accounts.
Thirty students received awards from Lt. Governor Ellspermann at a summer ceremony at the Indiana
Statehouse. The competition led to thousands of posts and generated a lot of social media traffic during
April – which is Distracted Driving Awareness Month.
Budget: $150,000
Motorcycle Safety Awareness / May – June 2015 Media Focus: Get Legal. Get Licensed. & Ride Sober of Get Pulled Over
ICJI partnered with ABATE, the Indiana State Police, the Indiana Bureau of Motor Vehicles, and numerous
law enforcement agencies for a kick-off event at the Circle in downtown Indianapolis.
Along with radio, traditional, and digital media, ICJI partnered with the Miracle Ride for Riley Hospital.
This is one of the largest motorcycle fundraising events in the state. ICJI was a title sponsor in the three day
event which reaches more than 7,000 riders statewide.
Indiana statistics show that unlicensed motorcycle riders are substantially overrepresented in accidents,
injuries, and deaths. Our messages are: “Get Legal. Get Licensed.” and “Ride Sober or Get Pulled Over.”
Visibility for our sponsorship included:
Ads in Hoosier Motorcyclist Magazine for four months. (150,000 circulation)
Title sponsorship of two motorcycles given away at the end of the Miracle Ride. The bikes had a
custom appliqués applied with our messages.
One-time use of a mailing list of every Miracle Ride participant (approximately 7,000 names).
“Get Legal. Get Licensed” and “Ride Sober or Get Pulled Over.” logo on all participant tee shirts.
“Get Legal. Get Licensed” and “Ride Sober or Get Pulled Over.” banners and materials distributed
at the poker run events that start at approximately seven locations throughout the state. These runs
are held on the day before the Miracle Ride and lead to Indianapolis for the big event on Sunday.
Prominent mentions by presenters during the awards ceremony at the completion of the ride.
Budget: $135,000
Click It or Ticket / Blitz 82 / May 2015 Along with using a statewide saturation of radio, traditional, and digital media, ICJI targeted the top 10
counties which had the lowest seat belt usage rate (primarily in southern Indiana). In addition, law
enforcement in these counties used speaking points ICJI provided to get the message out through local radio
talk shows and newspapers.
26 State of Indiana 2015 Annual Report
Budget: $150,000
Drive Sober or Get Pulled Over / Blitz 83 / August – September 2015 Based on the earned media success with the “Safe Family Travel” and “Click It or Ticket” campaigns, ICJI
provided local law enforcement with a boilerplate press release, speaking points, and media lists for this
initiative. Local reporters are writing longer and better stories about the dangers of drinking and driving
when they receive the information from local law enforcement. The local agencies are also using Twitter
and Facebook to announce checkpoints and to announce the number of arrests during the blitz period. Local
law enforcement are taking much greater ownership and the results are very positive.
ICJI saturated the Indiana market with radio, traditional, and digital media. Our target audience was males
between 21 and 44. ICJI also placed special emphasis on counties with the highest rate of alcohol accidents.
Budget: $150,000
Speed (Dangerous Driving/Texting)
In FY 2015, ICJI did not focus any resources on speeding. Instead, a focused media effort was undertaken
to reduce and create awareness around the dangers of texting while driving.
Texting While Driving As stated in the Paid Media and Communications, ICJI partnered with Indiana Lt. Governor Sue
Ellspermann, Indiana State Police, Indiana Department of Transportation, Indiana Bureau of Motor
Vehicles, and Indiana Department of Labor to sponsor a social media contest. Occurring in April 2015, the
contest encouraged Hoosiers not to text while driving.
Students worked individually, or in teams of up to three people, to create messages and videos for their
Twitter, Instagram, and Vine accounts. Students were encouraged to use “Drive Now. TXT L8R” in their
posts and the #TXTL8RIN hash tag. There were high school and college divisions – with awards for each
platform (Twitter, Vine, Instagram). There also was a “most creative” award given for each platform.
The student or team with the greatest number of likes, favorites, and forwards each received a $5,000
scholarship for their post-secondary studies. The funds were deposited into their 529 accounts.
Eighteen students received awards from Lt. Governor Ellspermann at a summer ceremony at the Indiana
Statehouse. The competition led to thousands of posts and generated a lot of social media traffic during
April – which is Distracted Driving Awareness Month.
Safe Communities/Community Traffic Safety Programs (Services)
Law Enforcement Liaison Program (LEL) One method of reducing traffic fatalities is by encouraging active law enforcement participation in traffic
safety enforcement programs. ICJI participates in the two national blitz campaigns (Click It or Ticket and
Drive Sober or Get Pulled Over) and active law enforcement participation is imperative to the success of
these federally required programs. A proven method of increasing law enforcement participation is the
utilization of Law Enforcement Liaisons (LEL).
In FY 2015, each LEL developed their own traffic safety plan for the assigned region. LELs were
responsible for meeting with representatives from law enforcement agencies to assist in developing,

27 State of Indiana 2015 Annual Report
administering, and monitoring effective traffic safety programs and policies. Each year, LELs monitor their
assigned law enforcement agencies’ compliance with state and federal guidelines. The LELs also help their
assigned agencies by coordinating media events during blitz periods as well as distributing media kits to
promote traffic safety messaging. In addition, the six LELs, with some assistance from contracted persons,
were able to successfully administer the annual observational seat belt survey to 224 survey sites across the
state.
Media and Communications Division TSD contracts with an advertising/public relations agency to assist in develop and distributing campaign
materials. Funding is used to create campaigns that target law enforcement and the public. Media is
conducted for all four blitz periods as well as targets bicycle, pedestrian, and motorcycle safety, teenage
seat belt usage, impaired driving, dangerous and distracted driving, and child passenger safety. Campaigns
also highlight local law enforcement efforts to help develop community support for traffic safety initiatives.
Additionally, funding provides for traffic safety planning kits for local communities, athletic events,
seasonal activities, special enforcement projects, communications staff, and educational brochures for
public distribution.
In FY 2015, TSD utilized radio, traditional, and digital media for all campaigns. These platforms allowed
us to target our audience in today’s fast paced world where people are always on their digital devices, and
always on the go.

28 State of Indiana 2014 Annual Report
Financial Information
Figure 12: FY 2015 Traffic Safety Expenditures

29 State of Indiana 2014 Annual Report
Figure 13: Federal Expenditures Summary by Program Area
Figure 14: Federal Expenditures Summary by Program Area ( percent)
402 405D 405B 405F 405C 164 Alcohol 405 Pt. 4
GeneralImpaired
Driving
Child
Pass/Seat
Belts
MotorcycleTraffic
RecordsPenalty Funds 1906 Profiling
P&A 320,000.00 320,000.00
Occupancy Protection 2,347,830.00 1,020,000.00 3,367,830.00
Alcohol 37,000.00 1,015,875.00 1,749,125.00 2,802,000.00
Police Traffic Services 1,093,000.00 640,000.00 1,733,000.00
Community Traffic Services 1,065,000.00 200,000.00 1,265,000.00
Traffic Records/Research 350,000.00 795,252.00 350,557.00 1,495,809.00
Motorcycles 150,000.00 150,000.00
Dangerous Roadways 500,000.00 500,000.00
First Responders 1,975,937.00 1,215,600.00 3,191,537.00
TOTAL 7,188,767.00 2,355,875.00 2,235,600.00 150,000.00 795,252.00 1,749,125.00 350,557.00 14,825,176.00
Federal Expenditures
Summary by Program
Area
Total Federal
Funds
P&A, 2%
Occupancy Protection,
23%
Alcohol, 19%
Police Traffic Services,
12%
Community Traffic …
Traffic
Records/Research, 10%
Motorcycles, 1%
Dangerous Roadways,
3%