indiana healthy indiana plan 2.0: interim evaluation … table of contents executive summary 1...
TRANSCRIPT
HEALTHCARE AND HUMAN SERVICES POLICY, RESEARCH, AND CONSULTING―WITH REAL-WORLD PERSPECTIVE.
Indiana Healthy Indiana Plan 2.0: Interim Evaluation Report
Prepared for: Indiana Family and Social Services Administration (FSSA)
Submitted by: The Lewin Group, Inc.
July 6, 2016
i
Table of Contents
EXECUTIVE SUMMARY ........................................................................................................................ 1
INTRODUCTION & BACKGROUND ................................................................................................ 6
DATA SOURCES AND ANALYTIC APPROACH .......................................................................... 13
GOAL 1: REDUCE THE NUMBER OF UNINSURED LOW-INCOME INDIANA RESIDENTS AND INCREASE ACCESS TO HEALTHCARE SERVICES.......................... 17
GOAL 2: PROMOTE VALUE-BASED DECISION MAKING AND PERSONAL HEALTH RESPONSIBILITY .......................................................................................................................... 61
GOAL 3: PROMOTE DISEASE PREVENTION AND HEALTH PROMOTION TO ACHIEVE BETTER HEALTH OUTCOMES.................................................................................................. 91
GOAL 4: PROMOTE PRIVATE MARKET COVERAGE AND FAMILY COVERAGE OPTIONS TO REDUCE NETWORK AND PROVIDER FRAGMENTATION WITHIN FAMILIES ....................................................................................................................................... 105
GOAL 5: PROVIDE HIP MEMBERS WITH OPPORTUNITIES TO SEEK JOB TRAINING AND STABLE EMPLOYMENT TO REDUCE DEPENDENCE ON PUBLIC ASSISTANCE ................................................................................................................................ 108
NEXT STEPS IN DATA COLLECTION AND ANALYSIS .......................................................... 110
1
Executive Summary
The purpose of this report is to evaluate the progress of the Healthy Indiana Plan (HIP) 2.0 made in the first year of a three-year demonstration period that runs February 1, 2015 through January 31, 2018, as required by the Centers for Medicare & Medicaid Services (CMS).1 HIP 2.0 affords health insurance coverage to most non-disabled Indiana adults ages 19 to 64 whose family income is at or below 138 percent of the federal poverty level (FPL) and who are not eligible for other Medicaid programs or Medicare. HIP 2.0 has several cost-sharing features more characteristic of commercial plans than of traditional Medicaid products, the goals of which are to incentivize members to seek preventive care and to be cost-conscious and health-conscious when seeking all types of healthcare.
The program provides coverage through a high-deductible health plan, administered by a Managed Care Entity (MCE), paired with a Personal Wellness and Responsibility (POWER) Account valued at $2,500, which operates similarly to an HSA. Under HIP 2.0, members who consistently make required contributions to their POWER Account, called POWER Account Contributions (PACs), are enrolled in HIP Plus – a plan that includes enhanced benefits such as dental and vision coverage.2 Members with income below percent the (Federal Poverty Level) FPL who do not make PACs are placed in the HIP Basic plan, a more limited benefit plan that does not include coverage for dental services, vision services, bariatric surgery or temporomandibular joint (TMJ) treatment, and that requires co-payments for most services.
HIP 2.0 also introduced HIP Link and Gateway to Work (GTW). HIP Link provides enrolled individuals with a defined contribution to help pay for the costs of employer sponsored insurance (ESI). Under HIP Link, each member receives a POWER Account valued at $4,000, which they can use to pay for ESI premiums, deductibles, co-payments and co-insurance. GTW is a free and voluntary program for eligible HIP members, which connects members with job training and job search resources.
This interim evaluation report is based on data available as of June 2016. This includes utilization and enrollment data for the first 12 months of the program, during which 64 percent enrolled of members were enrolled for 6 months or longer. About one quarter of members enrolled during the first demonstration year were enrolled for a full 12 months. Survey respondents had up to 10 months of program experience on which to base their responses. Due to the unavailability or inadequacy of certain data at the time of this report, preliminary findings are available for many but not all of the evaluation questions formulated in the Final Evaluation Plan agreed to by Indiana and CMS. The Final Evaluation Report to be submitted to CMS in 2018 will address a wider range of questions using data from three years of program experience. This report presents preliminary findings based on the data available for the first demonstration year.
1 HIP 2.0 Special Terms and Conditions, Section XIII. Evaluation, paragraph 9, pg.50. Retrieved April 2, 2016 from https://www.medicaid.gov/Medicaid-CHIP-Program-Information/By-Topics/Waivers/1115/downloads/in/Healthy-Indiana-Plan-2/in-healthy-indiana-plan-support-20-ca.pdf.
2 Native American and pregnant women are exempt from POWER Account Contributions.
2
Key Findings
Goal 1: Reduce the Number of Uninsured Low-income Indiana Residents and Increase Access to Healthcare Services
A fundamental objective of HIP 2.0 is to insure low-income adults who are not eligible for other coverage. In the first year, 407,746 Indiana residents were enrolled in HIP 2.0 for at least one month. This is the equivalent of nearly 73 percent of the population of 559,000 Indiana residents who were projected to be eligible for HIP 2.0 at the time of its inception.3 By the end of the first demonstration year, about 60 percent of HIP 2.0 members were previously uninsured or underinsured, or experienced an income change that made them eligible for HIP 2.0. About 40 percent of HIP 2.0 members were previously insured through Hoosier Healthwise or HIP 1.0.
Approximately 61,500 members (15 percent) disenrolled from HIP Plus or HIP Basic in the first year. A survey of people leaving the program showed the primary reasons for disenrollment were a change in income or having secured insurance from another source.
Over 90 percent of Plus members made their POWER Account Contributions (PACs) and remained in HIP Plus. HIP Plus members with incomes below 100 percent of the FPL are transitioned to HIP Basic when they do not pay the PAC. In the first year, about eight percent of members who had already made at least one PAC payment to be in HIP Plus did not make a subsequent required PAC payment, and thus moved from HIP Plus to HIP Basic. Over 80 percent of HIP Basic members indicated other reasons aside from affordability for not making PACs. When HIP Plus members with incomes above the poverty level do not pay their PAC, they are disenrolled from HIP 2.0 and are not eligible to re-enroll for six months. Six percent of HIP Plus enrollees with incomes above poverty were disenrolled from HIP 2.0 for not making a PAC.
PAC contributions were never or rarely a concern for 52 percent of HIP Plus members , whereas 16 percent always worried about being able to afford their PAC payment and another 29 percent worried usually or sometimes. Nonetheless, a large majority of enrollees reported they would pay more to remain enrolled in HIP 2.0. Almost 90 percent of HIP Basic and about 80 percent of HIP Plus members reported that they would be willing to pay $5 more a month to retain their health insurance. A majority of each would be willing to pay $10 more a month.
To reduce gaps in coverage, individuals have the option to enroll in temporary coverage immediately through presumptive eligibility (PE), and may pay a premium at the time of application to expedite the start of HIP coverage – an option called Fast Track payments. In the first year, 208 PE providers (about 62 percent of potentially qualifying providers) made a PE eligibility determination. Surveyed PE providers found the process either very or somewhat effective at eliminating gaps in healthcare coverage. In total, 111,224 individuals had a PE benefit segment during the first demonstration year, 77 percent of whom completed a full Medicaid application. Of these, 26,606 members were approved for and enrolled in full Medicaid coverage. Nearly 31,000 members made a Fast Track payment to start their coverage faster.
3 Milliman. 2014. 1115 Waiver—Healthy Indiana Plan Expansion Proposal.
3
To assess access to needed care, member survey results and self-reported data on MCEs‘ network adequacy was reviewed. Current members reported having a greater likelihood of accessing routine care, specialist care and prescription drugs, compared to respondents who were disenrolled or never enrolled. Current HIP 2.0 members reported rates of satisfaction with access comparable to national Medicaid Consumer Assessment of Healthcare Providers and Systems (CAHPS) reports.4 All three MCEs satisfied the network standards for PMPs, dental and vision services. The MCEs also met the requirements for most specialist types.
A majority of survey respondents (80 percent) were either very satisfied or somewhat satisfied with their experience with HIP 2.0. Plus members were more likely to be very or somewhat satisfied than Basic members (86 percent of Plus members, compared to 71 percent of Basic members).5 Further, 93 percent of surveyed members reported that they would choose to re-enroll in HIP if they left but then became eligible again.
Goal 2: Promote Value-based Decision Making and Personal Health Responsibility
HIP 2.0 has financial incentives for members to be prudent managers of their POWER Account funds and their health. Participation in HIP Plus is encouraged by the state’s additional benefits, and a favorable rollover of the account to subsequent years. Failing to contribute to the POWER Account can result in either movement to Basic with its lower value or disenrollment from HIP 2.0 for those whose income is above the poverty level.
According to a current member survey, 60 percent of respondents reported hearing of the HIP POWER Account. The proportion was higher for members required to make PACs—i.e., Plus members (66 percent). About 72 percent of HIP Plus members and 76 percent of HIP Basic members who reported hearing of the POWER Account also reported having one. Among members who reported having a POWER Account, 40 percent of HIP Plus and 30 percent of HIP Basic members reported checking their POWER Account balance monthly. A previous survey of members in HIP 1.0, which also required PACs, also asked about POWER Account awareness. In that survey, which was conducted after the HIP 1.0 program had been implemented for several years, 77 percent of respondents reported hearing about the POWER Account. At the time of the HIP 2.0 survey, many members had only been in the program for a few months, which may explain some of the difference.
Over 90 percent of members maintained their PAC payments. Also a large majority of Plus members surveyed indicated that they were aware that if they did not make payments they would be disenrolled from HIP or required to make co-payments.
Preventive care is provided at no cost to members; members are not required to make co-payments or use POWER Account funds to pay for services. Members who enroll in HIP Plus
4 National CAHPS baselines were generated using the AHRQs online CAHPS database. Retrieved May 16, 2016 from https://www.cahpsdatabase.ahrq.gov/cahpsidb/
5 Under HIP 1.0, 94.7 percent of members were either very or somewhat satisfied with their overall experience in HIP. Note that the members surveyed under HIP 1.0 likely had more program experience compared to HIP 2.0 members surveyed. Also, to remain enrolled, HIP 1.0 members were required to pay POWER Account contributions. Source: Healthy Indiana Plan Section 1115 Demonstration 2013 Annual Report and Interim Evaluation. Indiana Office of Medicaid Policy and Planning. October 2014.
4
and have a preventive care visit receive a POWER Account rollover, which reduces the amount of required member contributions during the next benefit period. While many members do get preventive care (see Goal 3), a majority of those surveyed are unaware it is provided at no cost to the member. The lack of awareness of preventive care coverage is not unique to HIP 2.0. Previous surveys, such as the HIP 1.0 member survey as well as the survey of non-group health insurance enrollees, have found similarly large proportions of members with a lack of awareness about rules for coverage regarding preventive services.6
Incentives are anticipated to steer sicker patients to HIP Plus where total costs to the patient may be lower compared to costs in HIP Basic. Preliminarily, members appear to follow the more cost-effective path and enroll in Plus, regardless of income. Plus members with incomes below poverty were more likely to have physical and/or behavioral health conditions compared to Plus members above poverty, Basic members, and individuals who moved from Plus to Basic. Utilization was higher for the lower-income Plus members, regardless of whether members had chronic physical or behavioral health conditions. Basic members were generally the lowest utilizers of care, with the exception of emergency services. Basic members show higher rates of Emergency Department (ED) use overall and non-emergency use of the ED, compared to Plus members. In addition, Plus members demonstrated greater medication adherence than Basic members. This may be due to differential prescription drug benefits in Plus compared to Basic (including coverage for longer day supplies and mail order drugs), as well as greater need and use of care by Plus members.
HIP Plus members are paying attention to the cost of care. More than one in four HIP Plus members surveyed (27 percent) reported asking their provider about the cost of care. About one percent of Plus members and two percent of Basic members reported missing appointments due to cost.
Goal 3: Promote Disease Prevention and Health Promotion to Achieve Better Health Outcomes
Goal 3 further examines the use of healthcare services and the potential impact of benefit plan incentives, specifically rollover incentives. Members have until the end of their benefit period (a full 12 months) to obtain preventive care and qualify for rollover incentives. Only 25 percent of members enrolled during the first demonstration year (105,361 members) were enrolled for a full 12 months. Over three-quarters of these members received a qualifying preventive care service according to the available claims data. By completing preventative care, these members would be able to rollover POWER Account funds to reduce required PACs the following year (for members who subsequently enroll in HIP Plus).7
6 Healthy Indiana Plan Section 1115 Demonstration 2013 Annual Report and Interim Evaluation. Indiana Office of Medicaid Policy and Planning. October 2014. Survey of Non-Group Health Insurance Enrollees, Wave 3, conducted February 9–March 26, 2015; the Kaiser Family Foundation. Retrieved May 19, 2016 from http://kff.org/health-reform/poll-finding/survey-of-non-group-health-insurance-enrollees-wave-3/
7 Basic members are able to rollover funds to reduce future contributions only if they receive a qualifying preventive service. Plus members are able to rollover their share of leftover funds whether or not they receive qualifying services, and are able to double the amount of the rollover if they receive a qualifying preventive service.
5
When looking at all members enrolled during the first demonstration year, those that enrolled in HIP Plus were approximately 42 percent more likely to utilize preventive care services than HIP Basic members. The analysis of risk scores also reveals that chronic conditions are more prevalent in HIP Plus than HIP Basic members. Members with chronic conditions in either HIP Plus or HIP Basic were more likely to use preventive and primary care services than were healthier members. Medically frail members (a benefit category related to screening for illness/disability) also exhibited a relatively high likelihood of obtaining preventive care (82 percent) in comparison to the overall HIP 2.0 population.
Goal 4: Promote Private Market Coverage and Family Coverage Options to Reduce Network and Provider Fragmentation within Families
HIP Link is intended to assist HIP-eligible workers to be able to afford employer-sponsored coverage, if it is available to them. In the first year, the state developed supports for employer participation including an approval process for employer participation and employer health plan reviews. The first year has been a pilot test of the process, and enrollment data is not available for evaluation.
Goal 5: Provide HIP Members with Opportunities to Seek Job Training and Stable Employment to Reduce Dependence on Public Assistance
The Gateway to Work program is intended to assist low-income adults to secure new or better employment. Marketing began in May 2015 and a targeted mailing to HIP 2.0 members was sent in January 2016. The Gateway to Work call center has received 3,277 inquiries to date. There have been over 500 individual counselling sessions with job seekers held to date.
6
Introduction & Background
The purpose of this report – Indiana Healthy Indiana Plan 2.0 Interim Evaluation – is to evaluate the progress made in the first year of a three-year demonstration period that runs February 1, 2015 through January 31, 2018, as required by the Centers for Medicare & Medicaid Services (CMS).8
CMS granted the original HIP 1115 Waiver Demonstration in 2007 with enrollment beginning in 2008. On January 27, 2015, CMS approved a new waiver, “HIP 2.0,” which took effect on February 1, 2015. The Special Terms and Conditions (STCs) for Indiana’s 1115 Demonstration require that Indiana submit an Interim Evaluation Report by June 30, 2016, and a Final Evaluation Report within 60 days after the expiration of the demonstration. Indiana Family and Social Services Administration (FSSA) hired the Lewin Group as an independent evaluator to conduct the HIP 2.0 evaluation.
Indiana utilized the original 1115 Waiver to expand Medicaid coverage to otherwise ineligible populations, while testing a new program structure. The original expansion initiative, HIP 1.0, offered low-income Indiana residents a High Deductible Health Plan (HDHP) paired with the Personal Wellness and Responsibility (POWER) Account, which operates similarly to a Health Savings Account (HSA). As the nation’s first HDHP with HSA model for Medicaid recipients, the aim was to encourage members to be more active purchasers of their healthcare services.
Upon enactment of the Patient Protection and Affordable Care Act (ACA), Indiana opted to renew its 1115 Waiver and create the HIP 2.0 program, aiming to cover all non-disabled adults between the ages of 19 and 64 with income at or below 138 percent of the federal poverty level (FPL). With this change, the state also opened HIP enrollment to Section 1931 parents and caretaker relatives and low-income 19 and 20 year olds who were previously eligible for Hoosier Healthwise (HHW), the state’s more traditional Medicaid managed care program covering pregnant women and children. Section 1931 parents and caretaker relatives and low-income 19 and 20 year olds enrolled in HHW as of January 2015 were transitioned into HIP 2.0 when the program began in February 2015.
HIP 2.0 maintains the consumer-driven principles of the original program while expanding its eligibility criteria and building out its structure. Specifically, the waiver goals are:
1. Reduce the number of uninsured low-income Indiana residents and increase access to healthcare services
2. Promote value-based decision-making and personal health responsibility 3. Promote disease prevention and health promotion to achieve better health outcomes 4. Promote private market coverage and family coverage options to reduce network and
provider fragmentation within families
8 HIP 2.0 Special Terms and Conditions, Section XIII. Evaluation, paragraph 9, pg.50. Retrieved April 2, 2016 from https://www.medicaid.gov/Medicaid-CHIP-Program-Information/By-Topics/Waivers/1115/downloads/in/Healthy-Indiana-Plan-2/in-healthy-indiana-plan-support-20-ca.pdf.
7
5. Provide HIP members with opportunities to seek job training and stable employment to reduce dependence on public assistance
6. Assure state fiscal responsibility and efficient management of the program (not included in this report; to be evaluated by the state)
HIP 2.0 is administered by Indiana’s Family and Social Services Administration (FSSA). Under CMS’ requirements for the HIP 2.0 program, FSSA is required to provide the public an opportunity to comment on the program within six months of the demonstration’s implementation.9 To fulfill this requirement, FSSA held a Medicaid Advisory Committee (MAC) meeting on July 9, 2015. The meeting summarized the innovation driving HIP 2.0, program highlights, rollout events, and goals for the future. Below, we summarize comments made during the meeting, based on meeting notes provided by FSSA.
In attendance was Matt Brooks (Chair of Indiana’s Medicaid Advisory Committee), Joe Moser (Director of the Indiana Medicaid Program), as well as representatives from various organizations, including: Indiana Hospital Association, Insurance Interests, Indiana State Department of Health, Indiana Minority Health Coalition, National Alliance on Mental Illness, Indiana University Health, Indiana Rural Health Association, Indiana Primary Health Care Association, Covering Kids and Families, Franciscan Alliance, Open Door Health Policies, Anthem, Managed Health Services (MHS), and MDwise.
The majority of comments were positive. Participants identified the consumer outreach efforts, marketing strategies, commercials, and bulletin systems which provided alerts and information about the program, that contributed to a successful program roll-out. Participants commended the “unique features,” including helping members attain and sustain financial sustainability, access case management, enroll through Presumptive Eligibility (PE), and get support from navigators.
In addition, participants noted increased consumer satisfaction, increased access to care, and reduction of gaps in coverage. They recognized an increased level of involvement and engagement among consumers in HIP 2.0, citing the ease with which they are able to make POWER Account contributions, the click-rates of people looking at benefit options online, excitement about vision and dental coverage, and not having to make co-payments.
Criticisms focused on the internal program “complexities,” but participants noted that the launch of the program was smooth despite these complexities. Recommendations on areas for future improvement included: (1) case management and consumer management, which are likely to become more complex post-enrollment when individuals need payment and resolution assistance; (2) presumptive eligibility enrollment training; (3) the number of assisters, particularly in-person, which may be increasingly important for future participants; and (4) data availability and analysis necessary to understand shifts and trends.
9 Per section III, paragraph 10 of the STCs, “Within six months of the demonstration’s implementation, and annually thereafter, the state shall afford the public with an opportunity to provide meaningful comment on the progress of the demonstration. […] The state must also include the summary in its annual report.”
8
Program Overview
HIP 2.0, a three-year demonstration implemented under an 1115(a) waiver, began accepting applications on January 27, 2015 for coverage beginning February 1, 2015. HIP 2.0 offers coverage through two plans with different benefit packages and cost sharing arrangements to encourage members to take an active role in their personal health management.
HIP 2.0 provides coverage through a High Deductible Health Plan (HDHP), administered by a Managed Care Entity (MCE), paired with a Personal Wellness and Responsibility (POWER) Account, which operates similarly to an HSA. Under HIP 2.0, members who consistently make required contributions to their POWER Account, called POWER Account Contributions (PACs), are enrolled in HIP Plus – a plan that includes enhanced benefits such as dental and vision coverage. 10 Members with income under 100 percent of the FPL who do not make PACs are placed in the HIP Basic plan, a more limited benefit plan that does not include coverage for dental services, vision services, bariatric surgery or temporomandibular joint (TMJ) treatment.
HIP Basic, unlike HIP Plus, requires co-payments for most services and is available to individuals with income of less than 100 percent of FPL. If an individual with income above 100 percent of the FPL never makes a PAC, he/she is not enrolled in HIP 2.0. Individuals with income above 100 percent of the FPL who make at least one PAC, but subsequently stop making required PACs are disenrolled and cannot re-enroll for six months.11
Both HIP Plus and HIP Basic members use their POWER Accounts to pay for covered services. POWER Accounts are funded up to a ceiling of $2,500. For members who are required to make a PAC, i.e. Plus members, this amount is a combination of member and state contributions. Members contribute two percent of their household income or at least one dollar, while the state contributes the difference.
POWER Accounts are used to pay for the first $2,500 of covered services. Services thereafter are covered by the member’s MCE. Members may rollover a portion of unused funds from the account (depending on how much the member contributed to the account) to the next benefit year to reduce future contributions.
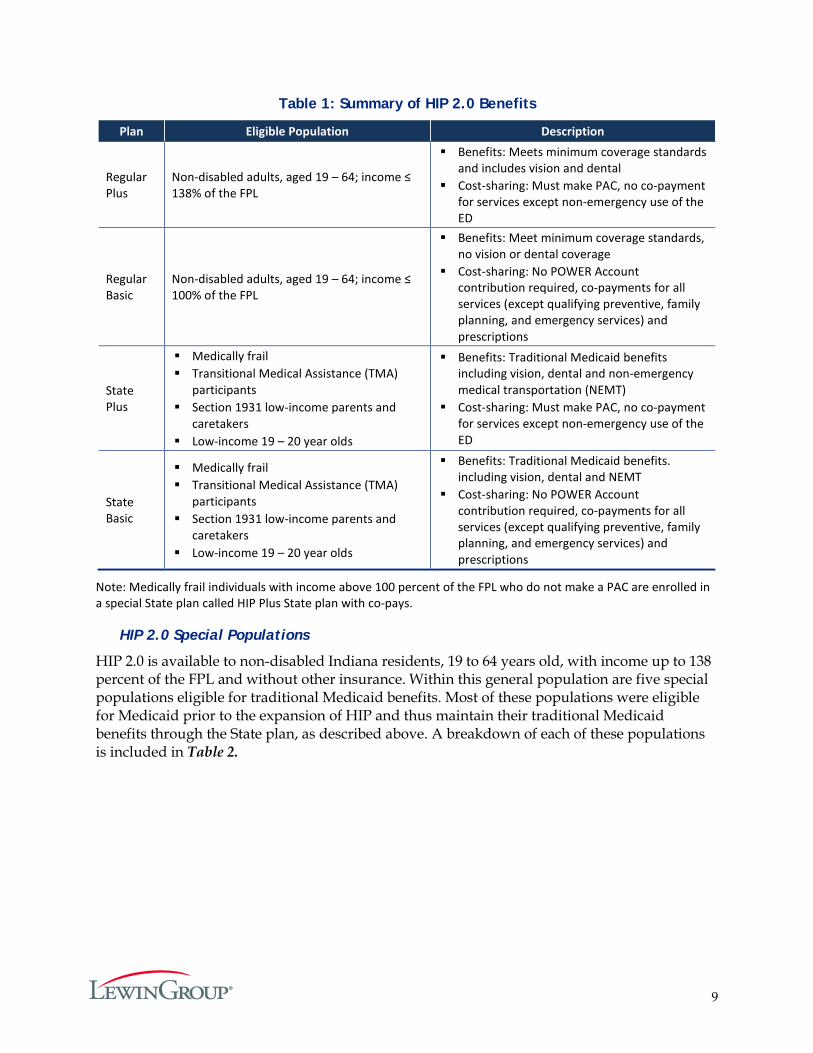
HIP 2.0 also maintains a traditional Medicaid benefits package, referred to as the “State plan,” for some of HIP’s more vulnerable populations, described in the HIP 2.0 Special Populations section below. Members in the State plan are subject to the same cost-sharing incentives as Regular plan members, e.g. POWER Account Contributions are required for Plus members and Basic members pay co-payments for most services.12 However, all State plan members, regardless of whether they are enrolled in Basic or Plus, are eligible for enhanced coverage, including dental and vision benefits. Table 1 summarizes the eligible populations, benefit packages and cost-sharing requirements for the Regular and State, Plus and Basic plans.
10 Native American and pregnant women are exempt from POWER Account contributions. 11 Certain populations are exempt from disenrollment even if their income is above 100 percent FPL: medically frail
and Transitional Medical Assistance (TMA) participants, and individuals experiencing a qualifying event. 12 Pregnant women and Native Americans are exempt from cost-sharing, as described in Table 2 below.
9
Table 1: Summary of HIP 2.0 Benefits
Plan Eligible Population Description
Regular Plus
Non-disabled adults, aged 19 – 64; income ≤ 138% of the FPL
Benefits: Meets minimum coverage standards and includes vision and dental
Cost-sharing: Must make PAC, no co-payment for services except non-emergency use of the ED
Regular Basic
Non-disabled adults, aged 19 – 64; income ≤ 100% of the FPL
Benefits: Meet minimum coverage standards, no vision or dental coverage
Cost-sharing: No POWER Account contribution required, co-payments for all services (except qualifying preventive, family planning, and emergency services) and prescriptions
State Plus
Medically frail Transitional Medical Assistance (TMA)
participants Section 1931 low-income parents and
caretakers Low-income 19 – 20 year olds
Benefits: Traditional Medicaid benefits including vision, dental and non-emergency medical transportation (NEMT)
Cost-sharing: Must make PAC, no co-payment for services except non-emergency use of the ED
State Basic
Medically frail Transitional Medical Assistance (TMA)
participants Section 1931 low-income parents and
caretakers Low-income 19 – 20 year olds
Benefits: Traditional Medicaid benefits. including vision, dental and NEMT
Cost-sharing: No POWER Account contribution required, co-payments for all services (except qualifying preventive, family planning, and emergency services) and prescriptions
Note: Medically frail individuals with income above 100 percent of the FPL who do not make a PAC are enrolled in a special State plan called HIP Plus State plan with co-pays.
HIP 2.0 Special Populations
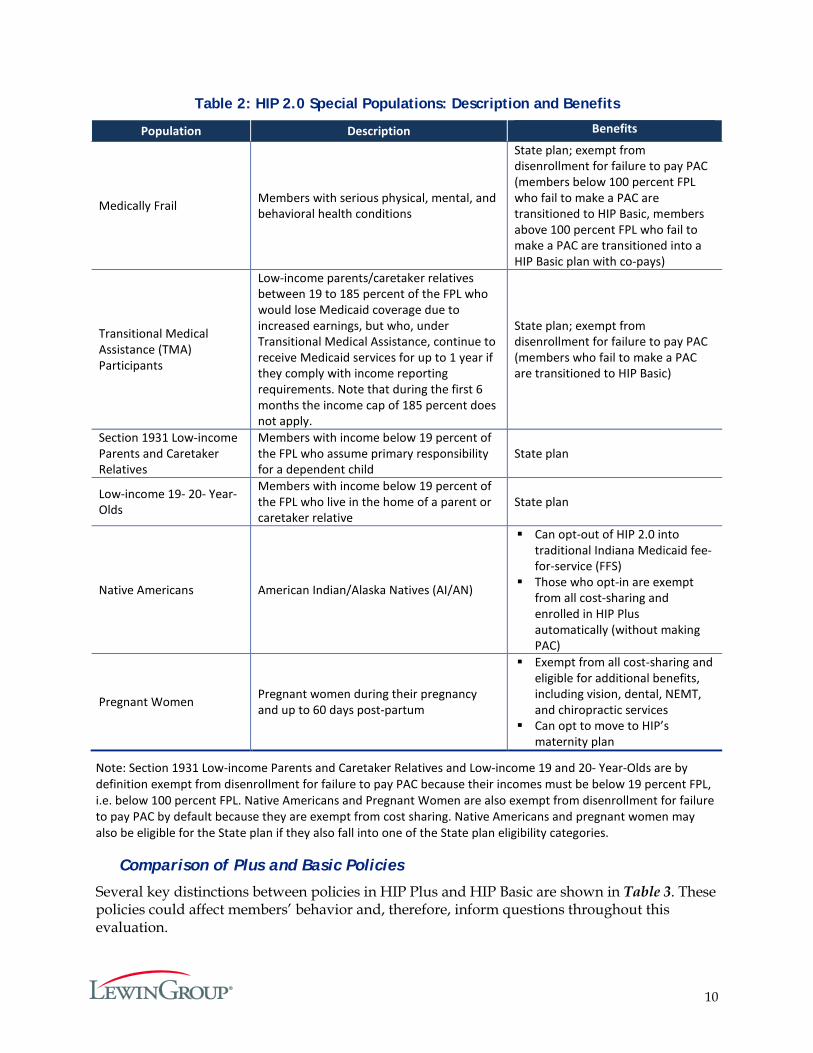
HIP 2.0 is available to non-disabled Indiana residents, 19 to 64 years old, with income up to 138 percent of the FPL and without other insurance. Within this general population are five special populations eligible for traditional Medicaid benefits. Most of these populations were eligible for Medicaid prior to the expansion of HIP and thus maintain their traditional Medicaid benefits through the State plan, as described above. A breakdown of each of these populations is included in Table 2.
10
Table 2: HIP 2.0 Special Populations: Description and Benefits
Population Description Benefits
Medically Frail Members with serious physical, mental, and behavioral health conditions
State plan; exempt from disenrollment for failure to pay PAC (members below 100 percent FPL who fail to make a PAC are transitioned to HIP Basic, members above 100 percent FPL who fail to make a PAC are transitioned into a HIP Basic plan with co-pays)
Transitional Medical Assistance (TMA) Participants
Low-income parents/caretaker relatives between 19 to 185 percent of the FPL who would lose Medicaid coverage due to increased earnings, but who, under Transitional Medical Assistance, continue to receive Medicaid services for up to 1 year if they comply with income reporting requirements. Note that during the first 6 months the income cap of 185 percent does not apply.
State plan; exempt from disenrollment for failure to pay PAC (members who fail to make a PAC are transitioned to HIP Basic)
Section 1931 Low-income Parents and Caretaker Relatives
Members with income below 19 percent of the FPL who assume primary responsibility for a dependent child
State plan
Low-income 19- 20- Year-Olds
Members with income below 19 percent of the FPL who live in the home of a parent or caretaker relative
State plan
Native Americans American Indian/Alaska Natives (AI/AN)
Can opt-out of HIP 2.0 into traditional Indiana Medicaid fee-for-service (FFS)
Those who opt-in are exempt from all cost-sharing and enrolled in HIP Plus automatically (without making PAC)
Pregnant Women Pregnant women during their pregnancy and up to 60 days post-partum
Exempt from all cost-sharing and eligible for additional benefits, including vision, dental, NEMT, and chiropractic services
Can opt to move to HIP’s maternity plan
Note: Section 1931 Low-income Parents and Caretaker Relatives and Low-income 19 and 20- Year-Olds are by definition exempt from disenrollment for failure to pay PAC because their incomes must be below 19 percent FPL, i.e. below 100 percent FPL. Native Americans and Pregnant Women are also exempt from disenrollment for failure to pay PAC by default because they are exempt from cost sharing. Native Americans and pregnant women may also be eligible for the State plan if they also fall into one of the State plan eligibility categories.
Comparison of Plus and Basic Policies
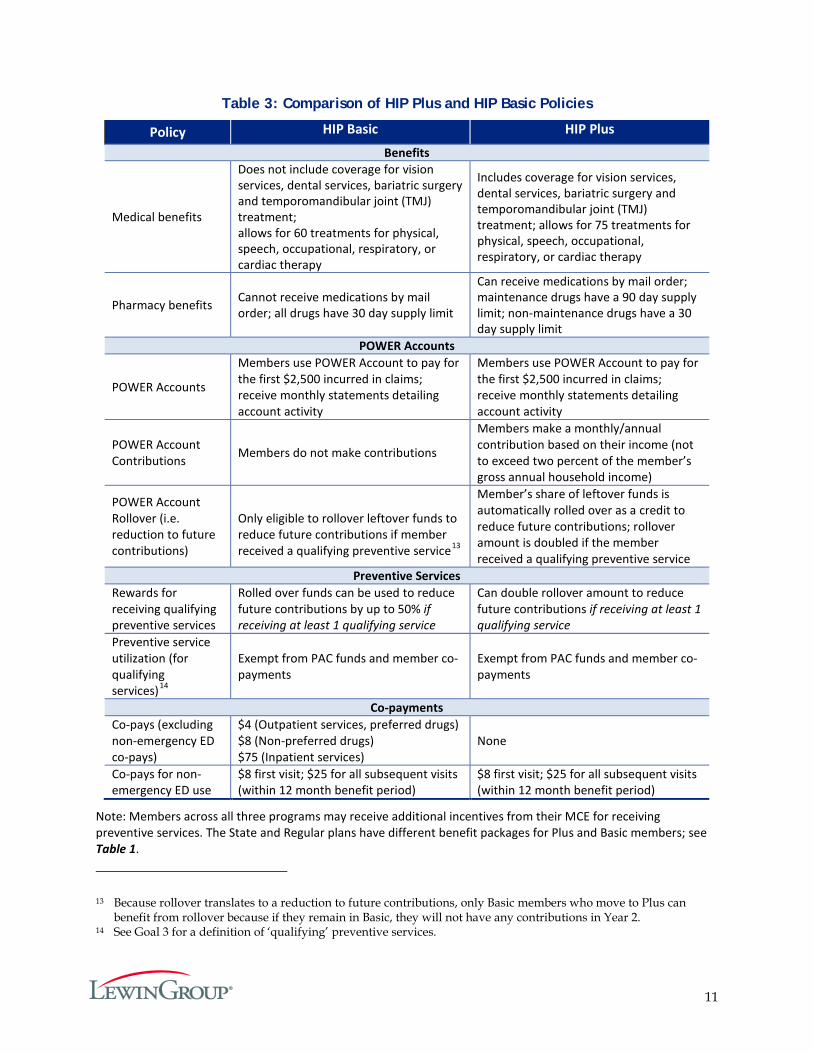
Several key distinctions between policies in HIP Plus and HIP Basic are shown in Table 3. These policies could affect members’ behavior and, therefore, inform questions throughout this evaluation.
11
Table 3: Comparison of HIP Plus and HIP Basic Policies
Policy HIP Basic HIP Plus
Benefits
Medical benefits
Does not include coverage for vision services, dental services, bariatric surgery and temporomandibular joint (TMJ) treatment; allows for 60 treatments for physical, speech, occupational, respiratory, or cardiac therapy
Includes coverage for vision services, dental services, bariatric surgery and temporomandibular joint (TMJ) treatment; allows for 75 treatments for physical, speech, occupational, respiratory, or cardiac therapy
Pharmacy benefits Cannot receive medications by mail order; all drugs have 30 day supply limit
Can receive medications by mail order; maintenance drugs have a 90 day supply limit; non-maintenance drugs have a 30 day supply limit
POWER Accounts
POWER Accounts
Members use POWER Account to pay for the first $2,500 incurred in claims; receive monthly statements detailing account activity
Members use POWER Account to pay for the first $2,500 incurred in claims; receive monthly statements detailing account activity
POWER Account Contributions Members do not make contributions
Members make a monthly/annual contribution based on their income (not to exceed two percent of the member’s gross annual household income)
POWER Account Rollover (i.e. reduction to future contributions)
Only eligible to rollover leftover funds to reduce future contributions if member received a qualifying preventive service13
Member’s share of leftover funds is automatically rolled over as a credit to reduce future contributions; rollover amount is doubled if the member received a qualifying preventive service
Preventive Services Rewards for receiving qualifying preventive services
Rolled over funds can be used to reduce future contributions by up to 50% if receiving at least 1 qualifying service
Can double rollover amount to reduce future contributions if receiving at least 1 qualifying service
Preventive service utilization (for qualifying services)14
Exempt from PAC funds and member co-payments
Exempt from PAC funds and member co-payments
Co-payments Co-pays (excluding non-emergency ED co-pays)
$4 (Outpatient services, preferred drugs) $8 (Non-preferred drugs) $75 (Inpatient services)
None
Co-pays for non-emergency ED use
$8 first visit; $25 for all subsequent visits (within 12 month benefit period)
$8 first visit; $25 for all subsequent visits (within 12 month benefit period)
Note: Members across all three programs may receive additional incentives from their MCE for receiving preventive services. The State and Regular plans have different benefit packages for Plus and Basic members; see Table 1.
13 Because rollover translates to a reduction to future contributions, only Basic members who move to Plus can benefit from rollover because if they remain in Basic, they will not have any contributions in Year 2.
14 See Goal 3 for a definition of ‘qualifying’ preventive services.
12
As explained in Table 3, there are a number of policies that may incentivize HIP Plus members to make varying decisions about their use of services and the management of their POWER Account. HIP Plus members contribute to their POWER Accounts and use their contributions (as well as state contributions) to pay for services. The contribution is an attempt to establish more active management and awareness by members of the resources available for their healthcare.
Plus members are also automatically eligible to rollover their share of unused funds to reduce future contributions. For example, if $1,000 is leftover, the required contribution would be reduced in the future by the member’s share of the $1,000.15 Moreover, if members receive preventive services recommended by their health plan, then the reduction to required future contributions is doubled. This provides an explicit incentive to use preventive care, and an implicit incentive to spend POWER Account funds efficiently.
Depending on the balance in the account, the rollover amount can significantly reduce or even eliminate required contributions in future plan years. For example, if a member has $1,400 leftover in her POWER Account from Year 1, and contributed 4.8 percent of the POWER Account (i.e. her PAC was $10 a month or $120 annually, so 120 ÷ 2,500 = .048) her rollover amount would be equal to $67.20 (.048 x 1,400 = 67.2). If this member received preventive services, the rollover amount would be equal to $134.40 (67.2 x 2= 134.4). If the member’s required annual contribution for the new plan year continues to be $10 a month, or $120 annually, the member would not need to make a required contribution in Year 2 because her rollover amount ($134.40) from Year 1 would exceed the amount of his annual contribution in Year 2 ($120).
HIP Basic members do not contribute to their POWER Accounts, so they may have fewer incentives than HIP Plus members to be cost-conscious with POWER Account funds. Instead, they have co-pays for each service received, including doctor visits and prescription drugs.16 Hence, they face a cost at the point of care, as opposed to Plus members. Although they do not contribute to the POWER Account, Basic members also pay for services using their POWER Accounts. Their use of the POWER Account funds to pay for services, plus the co-pays they pay, could encourage some cost-consciousness.
In addition, if Basic members have funds left over in their POWER Account and have received recommended preventive services they can reduce their future contributions if they enroll in HIP Plus in the next year. The reduction can be up to half of their required contribution amount. For example, if three quarters of a member’s POWER Account is leftover after 12 months and the member received recommended preventive services, then the member can get up to a 50 percent reduction in the cost of enrolling in HIP Plus. In addition, Basic members do not make co-pays for preventive care and family planning services, which could further incentivize preventive care use for Basic members.
15 The member’s share of the POWER Account is the percentage of the POWER Account that the member (rather than the state) contributed, plus any balance rolled over from previous terms.
16 Members cannot use POWER Account funds to pay co-pays.
13
Data Sources and Analytic Approach
Data Sources
The data sources used for this evaluation include:
Census and Coverage Data
Two nationally-representative, federal surveys were used to provide estimates of the number of people potentially eligible for HIP 2.0 members in Indiana, as well as the number of uninsured. They are: (1) the American Community Survey (ACS),17 sponsored jointly by the U.S. Census Bureau and the U.S. Department of Commerce.; and (2), the Current Population Survey, Annual Social and Economic Supplement (CPS-ASEC),18 which is sponsored jointly by the U.S. Census Bureau and the U.S. Bureau of Labor Statistics (BLS). Both surveys collect and produce information on demographic, social, economic, and health insurance coverage characteristics of the U.S. population each year. The ACS provides a more consistent measure of health insurance coverage pre- and post-2013. However, at the time of this evaluation, the CPS-ASEC had more recent data (relative to the ACS) available to estimate Indiana’s population; with an estimate as of March 2015. Therefore, CPS-ASEC was used to approximate the potential number of Indiana residents who could have been eligible for HIP 2.0, and ACS was used for data on uninsured populations.
Enrollment and Claims Data from FSSA
HIP 2.0 member enrollment and claims information was obtained from the Enterprise Data Warehouse (EDW), which is maintained by FSSA Division of Healthcare Strategies & Technology. The EDW is an enterprise-wide normalized repository of membership, provider, utilization, and financial data. Member enrollment is initially processed through the Indiana Client Eligibility System (ICES). Data are fed from ICES to the state’s Medicaid Management Information System (MMIS) and eventually to the EDW. Except for dental and pharmacy claims, all providers submit claims to the member’s selected MCE. Each individual MCE submits claim information to the MMIS, which feeds into the EDW. Additionally, the EDW also collects information associated with dental and pharmacy claims from each MCE and each dental or pharmacy benefit manager when one exists. Estimates using eligibility data and other information from ICES, including data used to estimate the number of disenrolled members, were developed using data from the Social Services Data Warehouse (SSDW).
Enrollment Data
Member enrollment data is used to understand the size and sociodemographic composition of the HIP 2.0 enrollee population. HIP 2.0 fully eligible members were identified based on four recipient aid category codes: RB (regular basic), RP (regular plus), SB (state basic) and SP (state plus). Membership data identifies and measures key enrollment metrics such as monthly and annual counts by a variety of socioeconomic factors such as income, age, gender and the length
17 United State Census Bureau. American Community Survey. Retrieved June 1, 2016 from https://www.census.gov/programs-surveys/acs/.
18 United State Census Bureau. Current Population Survey. Retrieved June 1, 2016 from http://www.census.gov/cps/.
14
of time individuals are enrolled in the program. Analyses regarding presumptively eligible (PE) and conditionally eligible individuals utilized different data, capturing information only for the specific population cohort. Analyses on the number of members disenrolled for failure to pay PAC utilize data on whether members made a PAC and when members were enrolled (from the EDW), combined with SSDW data identifying members who were closed out of the program. Data used in this report are from an extract as of May 2016.
Claims Data
Claims and encounter records are used to assess healthcare utilization patterns of all HIP 2.0 members. The data file provided by Indiana FSSA included all services incurred during the HIP 2.0 demonstration year 1 (DY1) timeframe (February 2015 through January 2016) and paid through April 2016. Additional data tables were provided that included all the header-level diagnoses and procedures on a claim by diagnosis (or procedure) position for members having utilization, which provided a source for secondary diagnosis and procedure codes. The secondary code data tables were used along with the detailed claims file to identify members having specific conditions of interest for this report.
Managed Care Entity Data
The three managed care entities (MCEs) in HIP – Anthem, Managed Health Service (MHS), and MDwise – also provided a variety of data for use in this evaluation. The data included information on each MCE’s provider network (whether the MCE met network accessibility standards), waiver and exemptions for members disenrolled for failure to pay PAC, disease management program participation, and Fast Track payment data.
Current Member, Leaver and Never-Member Survey Data
Current HIP 2.0 members, HIP 2.0 leavers, and never-members were surveyed in December 2015 and January 2016. Surveys were created through an iterative process that included Lewin, FSSA, and CMS. Copies of all of the surveys are included in Appendices A-F. The surveys cover a range of topics that address aspects such as access to care, affordability, and member understanding of the program.
Current Member Survey
A survey was administered to members that were currently enrolled in HIP 2.0 as of winter 2015. As such, survey respondents had up to 10 months of program experience on which to base their responses. Separate member surveys were administered to Plus and Basic members to accommodate differences in benefit designs. The survey design and collection process used a quota-based sample to approximate the universe of HIP 2.019 members in the HIP Plus and HIP Basic plans. Appendix G provides more detail on the sample size determination. Lewin also used a survey weight adjustment technique called raking to adjust the sampling weights by age, gender, and FPL so that responses better reflect the core demographics in the state. Details on the weighting process can be found in Appendix H. Table 4 describes the final distribution of
19 The sample was selected based on the HIP 2.0 population at a point in time in August 2015. References to universe of HIP 2.0 beneficiaries for any sample projections refer to this point in time population.
15
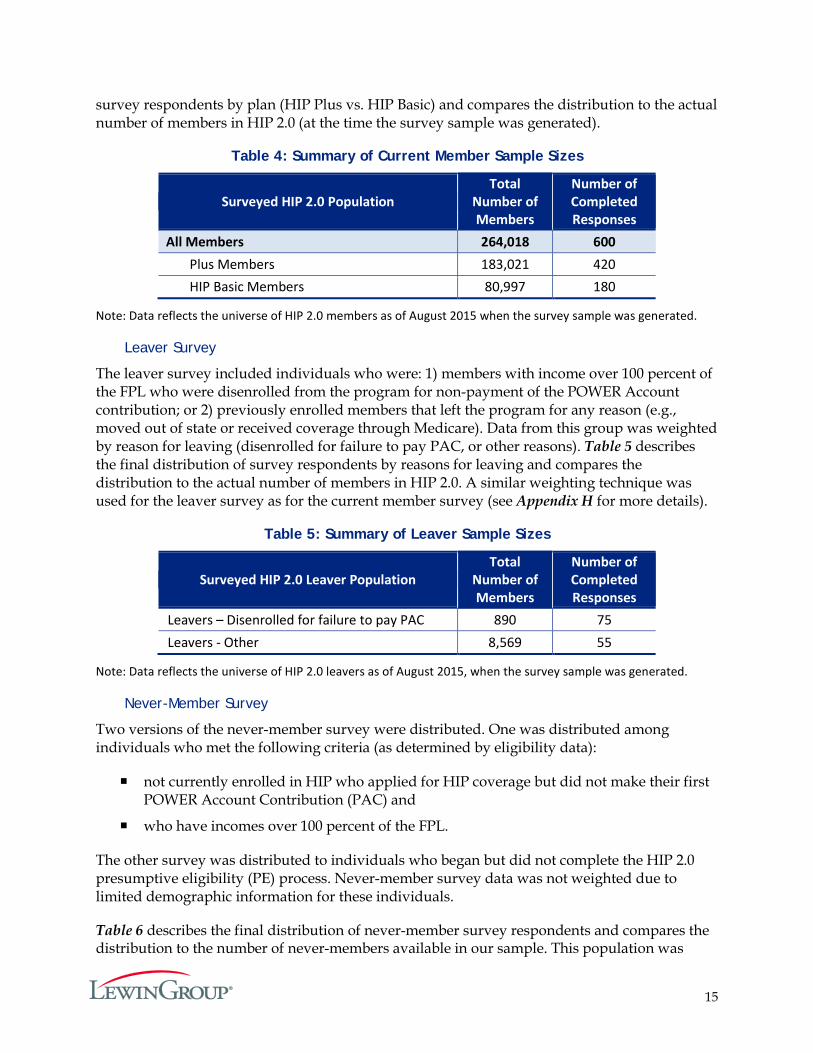
survey respondents by plan (HIP Plus vs. HIP Basic) and compares the distribution to the actual number of members in HIP 2.0 (at the time the survey sample was generated).
Table 4: Summary of Current Member Sample Sizes
Surveyed HIP 2.0 Population Total
Number of Members
Number of Completed Responses
All Members 264,018 600 Plus Members 183,021 420 HIP Basic Members 80,997 180
Note: Data reflects the universe of HIP 2.0 members as of August 2015 when the survey sample was generated.
Leaver Survey
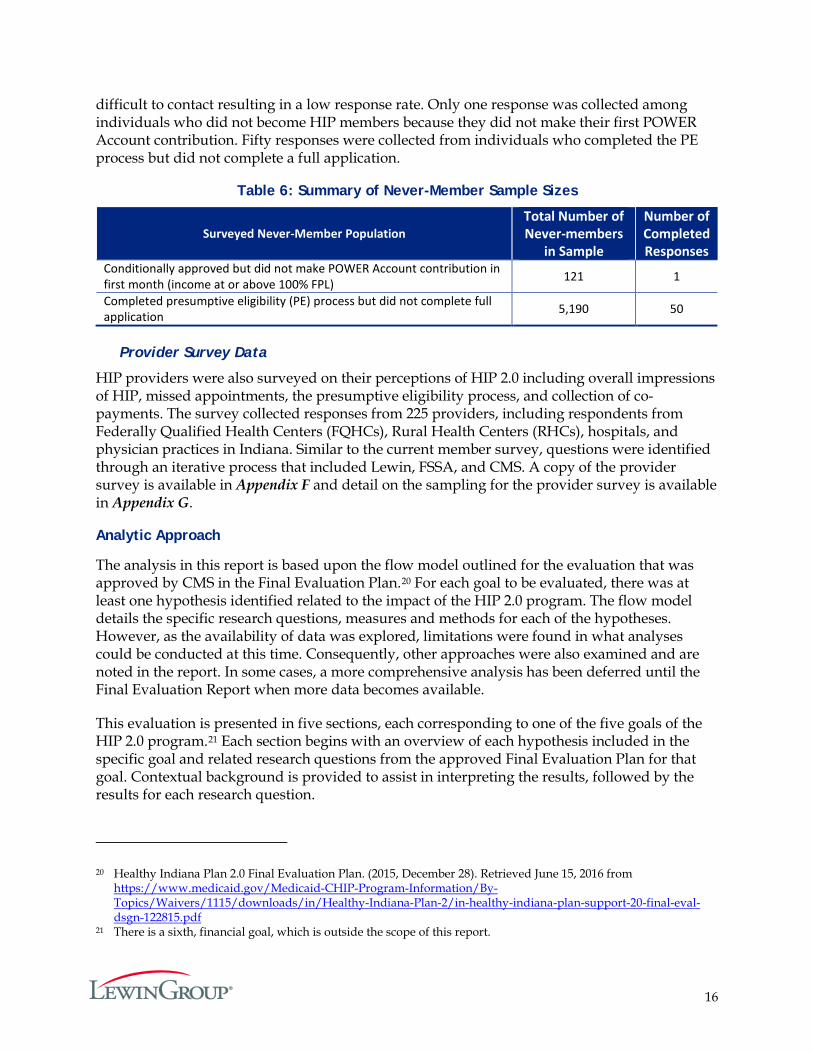
The leaver survey included individuals who were: 1) members with income over 100 percent of the FPL who were disenrolled from the program for non-payment of the POWER Account contribution; or 2) previously enrolled members that left the program for any reason (e.g., moved out of state or received coverage through Medicare). Data from this group was weighted by reason for leaving (disenrolled for failure to pay PAC, or other reasons). Table 5 describes the final distribution of survey respondents by reasons for leaving and compares the distribution to the actual number of members in HIP 2.0. A similar weighting technique was used for the leaver survey as for the current member survey (see Appendix H for more details).
Table 5: Summary of Leaver Sample Sizes
Surveyed HIP 2.0 Leaver Population Total
Number of Members
Number of Completed Responses
Leavers – Disenrolled for failure to pay PAC 890 75 Leavers - Other 8,569 55
Note: Data reflects the universe of HIP 2.0 leavers as of August 2015, when the survey sample was generated.
Never-Member Survey
Two versions of the never-member survey were distributed. One was distributed among individuals who met the following criteria (as determined by eligibility data):
not currently enrolled in HIP who applied for HIP coverage but did not make their first POWER Account Contribution (PAC) and
who have incomes over 100 percent of the FPL.
The other survey was distributed to individuals who began but did not complete the HIP 2.0 presumptive eligibility (PE) process. Never-member survey data was not weighted due to limited demographic information for these individuals.
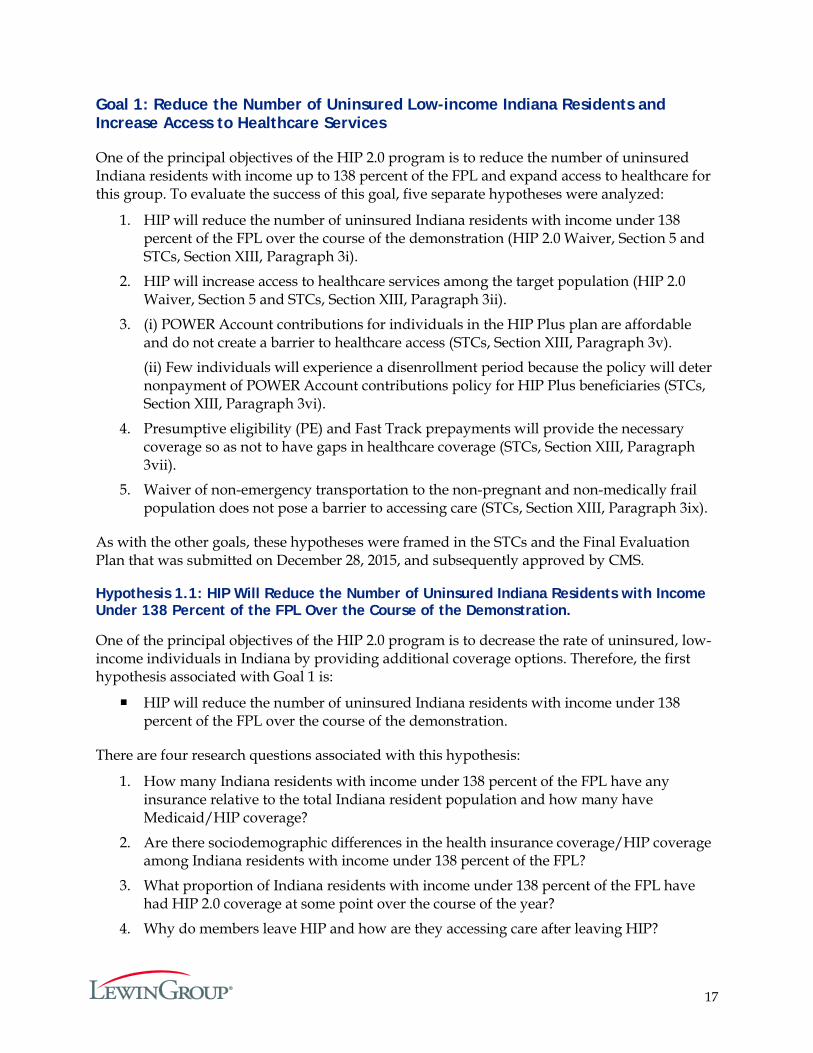
Table 6 describes the final distribution of never-member survey respondents and compares the distribution to the number of never-members available in our sample. This population was
16
difficult to contact resulting in a low response rate. Only one response was collected among individuals who did not become HIP members because they did not make their first POWER Account contribution. Fifty responses were collected from individuals who completed the PE process but did not complete a full application.
Table 6: Summary of Never-Member Sample Sizes
Surveyed Never-Member Population Total Number of Never-members
in Sample
Number of Completed Responses
Conditionally approved but did not make POWER Account contribution in first month (income at or above 100% FPL) 121 1
Completed presumptive eligibility (PE) process but did not complete full application 5,190 50
Provider Survey Data
HIP providers were also surveyed on their perceptions of HIP 2.0 including overall impressions of HIP, missed appointments, the presumptive eligibility process, and collection of co-payments. The survey collected responses from 225 providers, including respondents from Federally Qualified Health Centers (FQHCs), Rural Health Centers (RHCs), hospitals, and physician practices in Indiana. Similar to the current member survey, questions were identified through an iterative process that included Lewin, FSSA, and CMS. A copy of the provider survey is available in Appendix F and detail on the sampling for the provider survey is available in Appendix G.
Analytic Approach
The analysis in this report is based upon the flow model outlined for the evaluation that was approved by CMS in the Final Evaluation Plan.20 For each goal to be evaluated, there was at least one hypothesis identified related to the impact of the HIP 2.0 program. The flow model details the specific research questions, measures and methods for each of the hypotheses. However, as the availability of data was explored, limitations were found in what analyses could be conducted at this time. Consequently, other approaches were also examined and are noted in the report. In some cases, a more comprehensive analysis has been deferred until the Final Evaluation Report when more data becomes available.
This evaluation is presented in five sections, each corresponding to one of the five goals of the HIP 2.0 program.21 Each section begins with an overview of each hypothesis included in the specific goal and related research questions from the approved Final Evaluation Plan for that goal. Contextual background is provided to assist in interpreting the results, followed by the results for each research question.
20 Healthy Indiana Plan 2.0 Final Evaluation Plan. (2015, December 28). Retrieved June 15, 2016 from https://www.medicaid.gov/Medicaid-CHIP-Program-Information/By-Topics/Waivers/1115/downloads/in/Healthy-Indiana-Plan-2/in-healthy-indiana-plan-support-20-final-eval-dsgn-122815.pdf
21 There is a sixth, financial goal, which is outside the scope of this report.
17
Goal 1: Reduce the Number of Uninsured Low-income Indiana Residents and Increase Access to Healthcare Services
One of the principal objectives of the HIP 2.0 program is to reduce the number of uninsured Indiana residents with income up to 138 percent of the FPL and expand access to healthcare for this group. To evaluate the success of this goal, five separate hypotheses were analyzed:
1. HIP will reduce the number of uninsured Indiana residents with income under 138 percent of the FPL over the course of the demonstration (HIP 2.0 Waiver, Section 5 and STCs, Section XIII, Paragraph 3i).
2. HIP will increase access to healthcare services among the target population (HIP 2.0 Waiver, Section 5 and STCs, Section XIII, Paragraph 3ii).
3. (i) POWER Account contributions for individuals in the HIP Plus plan are affordable and do not create a barrier to healthcare access (STCs, Section XIII, Paragraph 3v).
(ii) Few individuals will experience a disenrollment period because the policy will deter nonpayment of POWER Account contributions policy for HIP Plus beneficiaries (STCs, Section XIII, Paragraph 3vi).
4. Presumptive eligibility (PE) and Fast Track prepayments will provide the necessary coverage so as not to have gaps in healthcare coverage (STCs, Section XIII, Paragraph 3vii).
5. Waiver of non-emergency transportation to the non-pregnant and non-medically frail population does not pose a barrier to accessing care (STCs, Section XIII, Paragraph 3ix).
As with the other goals, these hypotheses were framed in the STCs and the Final Evaluation Plan that was submitted on December 28, 2015, and subsequently approved by CMS.
Hypothesis 1.1: HIP Will Reduce the Number of Uninsured Indiana Residents with Income Under 138 Percent of the FPL Over the Course of the Demonstration.
One of the principal objectives of the HIP 2.0 program is to decrease the rate of uninsured, low-income individuals in Indiana by providing additional coverage options. Therefore, the first hypothesis associated with Goal 1 is:
HIP will reduce the number of uninsured Indiana residents with income under 138 percent of the FPL over the course of the demonstration.
There are four research questions associated with this hypothesis:
1. How many Indiana residents with income under 138 percent of the FPL have any insurance relative to the total Indiana resident population and how many have Medicaid/HIP coverage?
2. Are there sociodemographic differences in the health insurance coverage/HIP coverage among Indiana residents with income under 138 percent of the FPL?
3. What proportion of Indiana residents with income under 138 percent of the FPL have had HIP 2.0 coverage at some point over the course of the year?
4. Why do members leave HIP and how are they accessing care after leaving HIP?
18
The first three questions aim to understand the coverage of HIP 2.0 enrollment during the first year of the demonstration, and how coverage differs by socioeconomic group. The ultimate objective is to examine whether HIP 2.0 has succeeded in lowering the number of uninsured Indiana residents at or below 138 percent of the FPL. The final question under this hypothesis examines the reasons individuals leave the program and how they access healthcare post-HIP.
Research Question 1.1.1: How many Indiana residents with income under 138 percent of the FPL have any insurance relative to the total Indiana resident population and how many have Medicaid/HIP coverage?
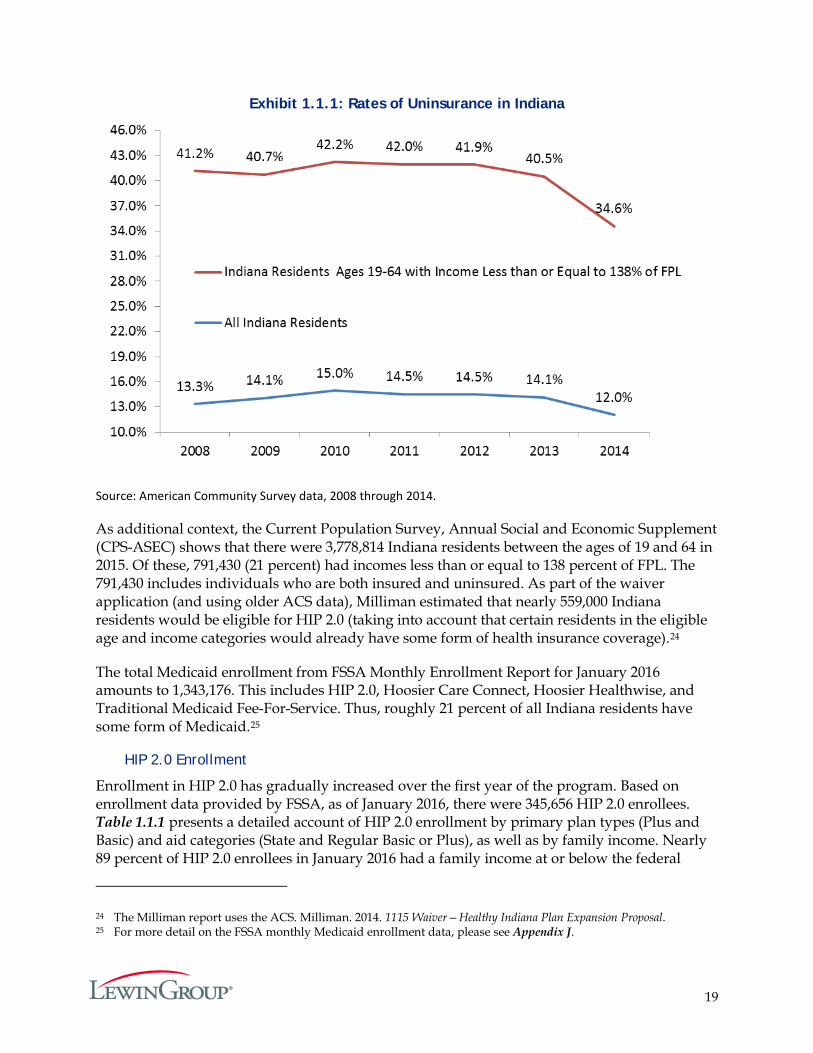
Information on insurance coverage rates is released by the Federal government approximately nine months after the end of the calendar year for which it is collected.22 Hence, insurance coverage data for 2015 will be released in the Fall of 2016, too late to be used in this report. In order to provide context for HIP 2.0 enrollment estimates provided in this report, estimates of the uninsured prior to the implementation of HIP 2.0 were used. According to the most recently available data of the American Community Survey (ACS), approximately 34.6 percent of the Indiana population with incomes up to 138 percent of the FPL did not have any insurance in 2014. Exhibit 1.1.1 shows the trend in uninsurance rates from 2008 through 2014 for the population that would be potentially HIP 2.0 eligible (i.e., those between 19 to 64 years old and with incomes up to 138 percent of the FPL) and for the overall Indiana population.
Prior to 2008, according to Current Population Survey (CPS) estimates,23 individuals 19 to 64 years old and with incomes up to 138 percent of the FPL had an uninsurance rate around 42.4 percent in 2005, which fell to about 36.5 percent in 2006 before rising again to 41.5 percent in 2007. Using estimates from ACS in Exhibit 1.1.1, the uninsurance rates from 2008 through 2010 continued to increase, likely due to external factors such as the national economic recession and high unemployment rates. From 2011, the rate of uninsurance began declining.
22 Background on the federal surveys are provided at: http://www.census.gov/programs-surveys/cps.html (United State Census Bureau, Current Population Survey) and http://www.census.gov/hhes/www/hlthins/data/index.html (Annual Social and Economic Supplement to the Current Population Survey). An example of the lag in survey results is presented in: United State Census Bureau, Current Population Survey. (September 16, 2015). “Income, Poverty and Health Insurance Coverage in the United States: 2014.” Retrieved June 3, 2016 from http://www.census.gov/newsroom/press-releases/2015/cb15-157.html.
23 ACS did not provide data on health insurance coverage prior to 2008. The three-year average uninsurance rate from CPS for all Indiana residents during 2005 through 2007 was approximately 12 percent. However, the ACS uninsured rate is a measure of the percentage of people who were uninsured at the time of the interview. The CPS uninsured rate, on the other hand, represents the percentage of people who had no health insurance coverage at any time during the previous calendar year.
19
Exhibit 1.1.1: Rates of Uninsurance in Indiana
Source: American Community Survey data, 2008 through 2014.
As additional context, the Current Population Survey, Annual Social and Economic Supplement (CPS-ASEC) shows that there were 3,778,814 Indiana residents between the ages of 19 and 64 in 2015. Of these, 791,430 (21 percent) had incomes less than or equal to 138 percent of FPL. The 791,430 includes individuals who are both insured and uninsured. As part of the waiver application (and using older ACS data), Milliman estimated that nearly 559,000 Indiana residents would be eligible for HIP 2.0 (taking into account that certain residents in the eligible age and income categories would already have some form of health insurance coverage).24
The total Medicaid enrollment from FSSA Monthly Enrollment Report for January 2016 amounts to 1,343,176. This includes HIP 2.0, Hoosier Care Connect, Hoosier Healthwise, and Traditional Medicaid Fee-For-Service. Thus, roughly 21 percent of all Indiana residents have some form of Medicaid.25
HIP 2.0 Enrollment
Enrollment in HIP 2.0 has gradually increased over the first year of the program. Based on enrollment data provided by FSSA, as of January 2016, there were 345,656 HIP 2.0 enrollees. Table 1.1.1 presents a detailed account of HIP 2.0 enrollment by primary plan types (Plus and Basic) and aid categories (State and Regular Basic or Plus), as well as by family income. Nearly 89 percent of HIP 2.0 enrollees in January 2016 had a family income at or below the federal
24 The Milliman report uses the ACS. Milliman. 2014. 1115 Waiver—Healthy Indiana Plan Expansion Proposal. 25 For more detail on the FSSA monthly Medicaid enrollment data, please see Appendix J.

20
poverty level. About 65 percent of enrollees were in the Plus plan, and among individuals with incomes under the federal poverty level, Plus membership accounted for approximately 62 percent of enrollment. Looking at the entire demonstration year, Plus membership was higher: 69 percent of the 407,746 ever-enrolled individuals were in Plus. Members with incomes under the federal poverty level who do not make contributions to their POWER Account default into the Basic program, which does not require any member contributions to the POWER Account, without any discontinuity in coverage. By making the POWER Account contributions, they remain eligible for Plus and its enhanced benefits.
Table 1.1.1: HIP 2.0 Enrollment as of January 2016
Percent FPL
Basic Plus
Total HIP Enrollment State Regular Basic
Total
Basic Enrollment
as a Percent of Total HIP Enrollment
for the Income Cohort
State Regular Plus Total
Plus Enrollment
as a Percent of Total HIP Enrollment
for the Income Cohort
0%-50% 56,072 35,165 91,237 40.0% 64,150 72,571 136,721 60.0% 227,958 51%-100% 4,839 19,968 24,807 30.9% 9,185 46,332 55,517 69.1% 80,324 101%-138% 1,424 2,603 4,027 11.9% 4,922 24,829 29,751 88.1% 33,778 >138%* 1,264 53 1,317 36.6% 1,926 353 2,279 63.4% 3,596
Total* 63,599 57,789 121,388 35.1% 80,183 144,085 224,268 64.9% 345,656
Source: Enrollment data from FSSA. *Individuals over 138 percent of the FPL may continue on the program due to participation in the Transitional Medical Assistance (TMA) program or appeal status.
There may be as many as 30,000 additional members who are conditionally enrolled in any given month. These are members who are eligible for the program but have not started coverage because they are within the 60-day payment period and have not yet made a PAC payment.26 Based on the enrollment data for the first year of the program, it appears that approximately two-thirds of the conditionally enrolled members eventually fully enroll in HIP by the end of the 60-day payment period.
There are differences between the state-reported number of enrolled individuals below 25 percent of the poverty level and estimates of the total number of Indiana residents under 25 percent of the poverty level using national survey data. According to the state, current monthly Modified Adjusted Gross Income (MAGI) is used as the basis for determining income eligibility for potential enrollees. MAGI is based on taxable components of income. In contrast, surveys such as the CPS-ASEC use annual estimates of income that can also incorporate non-taxable income sources (e.g., worker’s compensation, Veterans’ payments, Supplemental Security
26 Members below 100 percent of the FPL who do not make a PAC are automatically enrolled in Basic following the expiration of the 60-day payment period.
21
Income, public assistance or welfare payments, and child support).27 These differences may explain in part why state enrollment figures are higher in the population below 25 percent of the FPL, compared to projections based on national survey data.28
Transfer from Existing Medicaid Programs
One goal of HIP 2.0 is to reduce the number of uninsured Indiana residents. This section deconstructs HIP 2.0 enrollment into transfers from existing Medicaid programs versus enrollees who were presumably previously uninsured. A segment of HIP 2.0 members transitioned into HIP 2.0 from previously existing Medicaid programs, including:
1. HIP 1.0 enrollees;
2. Section 1931 low-income parents and caretaker relatives, enrolled in HHW – a program separate from HIP 1.0; and
3. Section 1931 19 and 20 year-olds, also enrolled in HHW.29
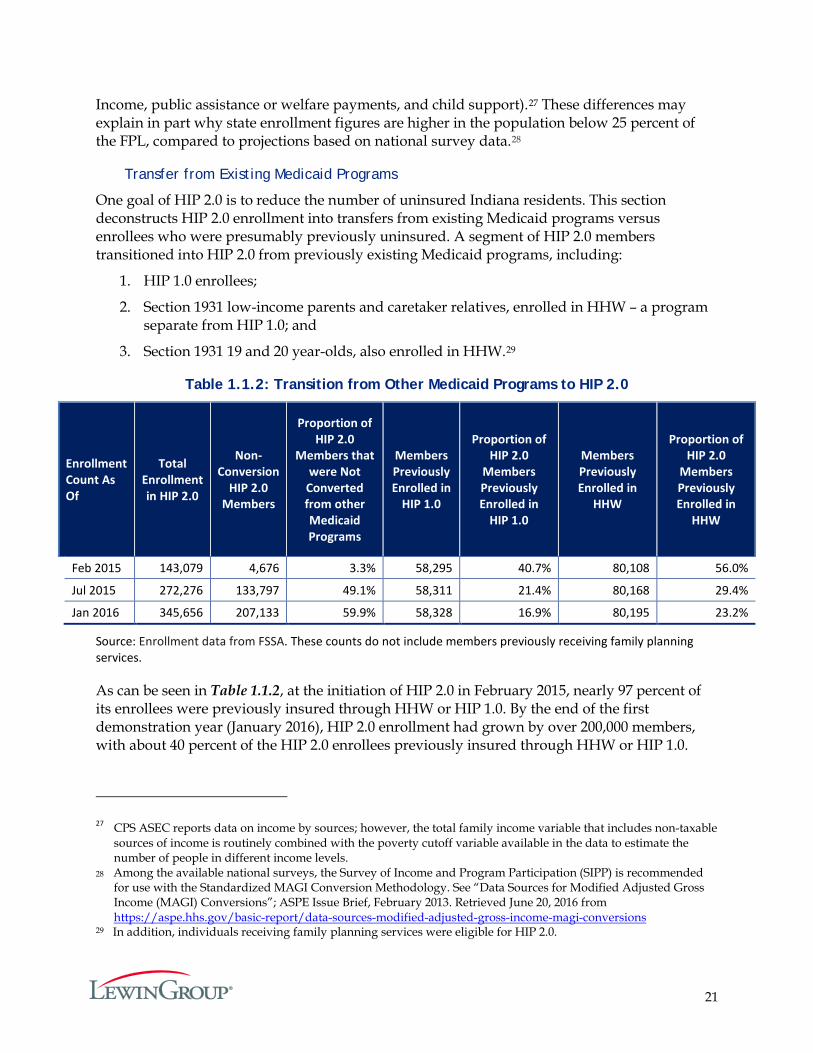
Table 1.1.2: Transition from Other Medicaid Programs to HIP 2.0
Enrollment Count As Of
Total Enrollment in HIP 2.0
Non- Conversion
HIP 2.0 Members
Proportion of HIP 2.0
Members that were Not
Converted from other Medicaid Programs
Members Previously Enrolled in
HIP 1.0
Proportion of HIP 2.0
Members Previously Enrolled in
HIP 1.0
Members Previously Enrolled in
HHW
Proportion of HIP 2.0
Members Previously Enrolled in
HHW
Feb 2015 143,079 4,676 3.3% 58,295 40.7% 80,108 56.0%
Jul 2015 272,276 133,797 49.1% 58,311 21.4% 80,168 29.4%
Jan 2016 345,656 207,133 59.9% 58,328 16.9% 80,195 23.2%
Source: Enrollment data from FSSA. These counts do not include members previously receiving family planning services.
As can be seen in Table 1.1.2, at the initiation of HIP 2.0 in February 2015, nearly 97 percent of its enrollees were previously insured through HHW or HIP 1.0. By the end of the first demonstration year (January 2016), HIP 2.0 enrollment had grown by over 200,000 members, with about 40 percent of the HIP 2.0 enrollees previously insured through HHW or HIP 1.0.
27 CPS ASEC reports data on income by sources; however, the total family income variable that includes non-taxable sources of income is routinely combined with the poverty cutoff variable available in the data to estimate the number of people in different income levels.
28 Among the available national surveys, the Survey of Income and Program Participation (SIPP) is recommended for use with the Standardized MAGI Conversion Methodology. See “Data Sources for Modified Adjusted Gross Income (MAGI) Conversions”; ASPE Issue Brief, February 2013. Retrieved June 20, 2016 from https://aspe.hhs.gov/basic-report/data-sources-modified-adjusted-gross-income-magi-conversions
29 In addition, individuals receiving family planning services were eligible for HIP 2.0.
22
Thus, HIP 2.0 has attracted Indiana residents with incomes up to 138 percent of the FPL who were not previously enrolled in other Medicaid programs.
HIP 2.0 Enrollment by County
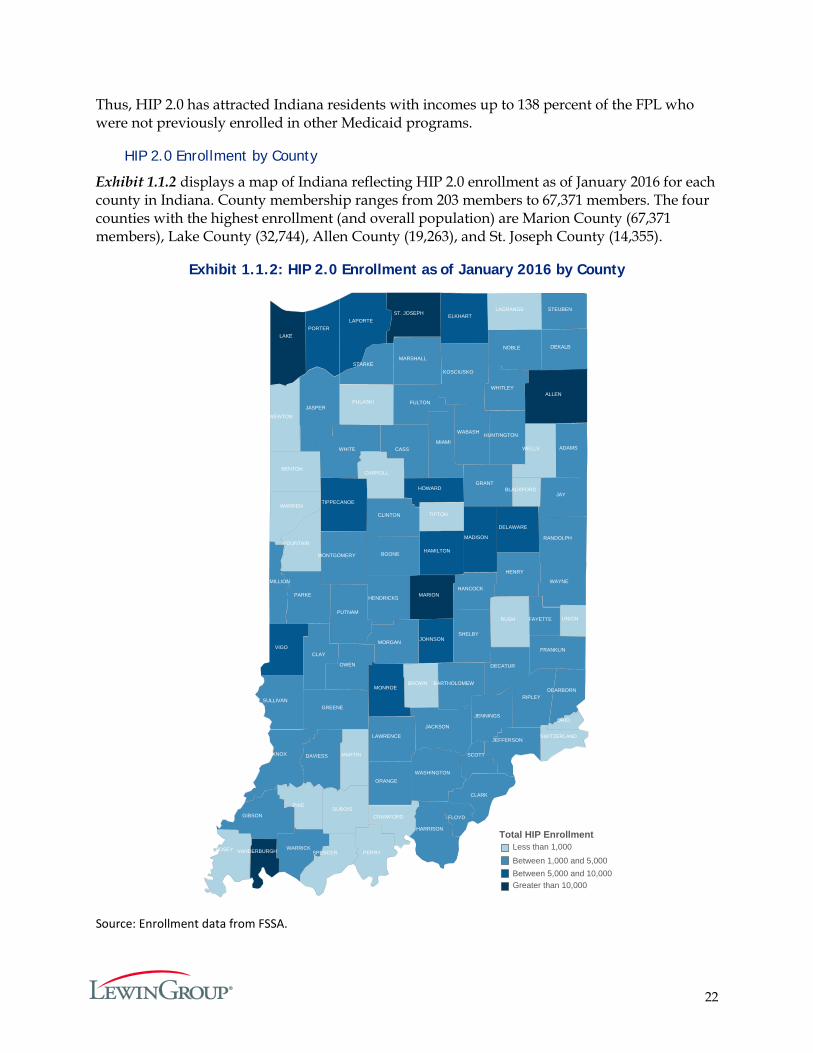
Exhibit 1.1.2 displays a map of Indiana reflecting HIP 2.0 enrollment as of January 2016 for each county in Indiana. County membership ranges from 203 members to 67,371 members. The four counties with the highest enrollment (and overall population) are Marion County (67,371 members), Lake County (32,744), Allen County (19,263), and St. Joseph County (14,355).
Exhibit 1.1.2: HIP 2.0 Enrollment as of January 2016 by County
Source: Enrollment data from FSSA.
VANDERBURGH
ST. JOSEPH
MARION
LAKE
ALLEN
VIGO
TIPPECANOE
PORTER
MONROE
MADISON
LAPORTE
JOHNSON
HOWARD
HAMILTON
ELKHART
DELAWARE
WHITLEY
WHITE
WAYNE
WASHINGTON
WARRICK
WABASH
VERMILLION
SULLIVAN
STEUBEN
STARKE
SHELBY
SCOTT
RIPLEY
RANDOLPH
PUTNAM
PARKE
OWEN
ORANGE
NOBLE
MORGAN
MONTGOMERY
MIAMI
MARSHALL
LAWRENCE
KOSCIUSKO
KNOX
JENNINGS
JEFFERSON
JAY
JASPER
JACKSON
HUNTINGTON
HENRY
HENDRICKS
HARRISON
HANCOCK
GREENE
GRANT
GIBSON
FULTON
FRANKLIN
FLOYD
FAYETTE
DEKALB
DECATUR
DEARBORN
DAVIESS
CLINTON
CLAY
CLARK
CASS
BOONE
BARTHOLOMEW
ADAMSWELLS
WARREN
UNION
TIPTON
SWITZERLAND
SPENCER
RUSH
PULASKI
POSEY
PIKE
PERRY
OHIO
NEWTON
MARTIN
LAGRANGE
FOUNTAIN
DUBOISCRAWFORD
CARROLL
BROWN
BLACKFORD
BENTON
Total HIP EnrollmentLess than 1,000
Between 1,000 and 5,000Between 5,000 and 10,000Greater than 10,000
23
Research Question 1.1.2: Are there socio-demographic differences in the health insurance coverage/HIP coverage among Indiana residents with income under 138 percent of the FPL?
Sociodemographic Differences in HIP 2.0 Enrollment
Though the Final Evaluation Plan called for an analysis of Indiana health insurance status by sociodemographic characteristics, census data that includes the time of HIP 2.0 activity will not be released until Fall 2016. Hence, this research question will be evaluated during the final evaluation cycle.
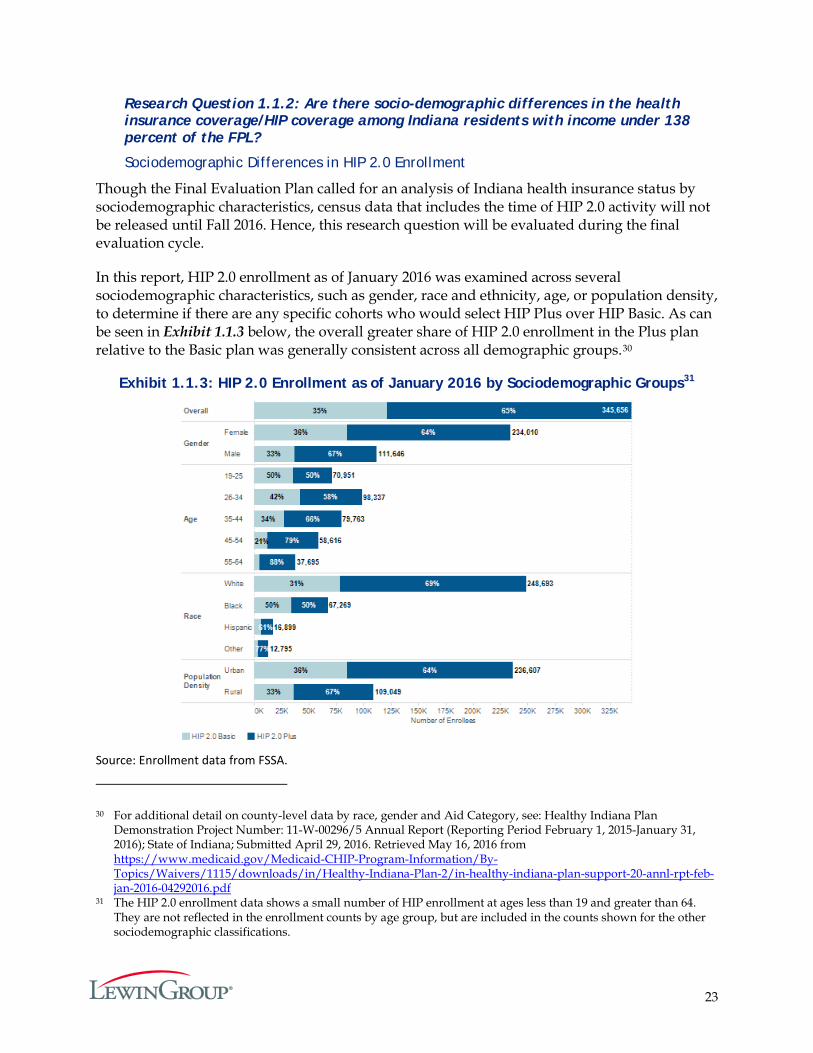
In this report, HIP 2.0 enrollment as of January 2016 was examined across several sociodemographic characteristics, such as gender, race and ethnicity, age, or population density, to determine if there are any specific cohorts who would select HIP Plus over HIP Basic. As can be seen in Exhibit 1.1.3 below, the overall greater share of HIP 2.0 enrollment in the Plus plan relative to the Basic plan was generally consistent across all demographic groups.30
Exhibit 1.1.3: HIP 2.0 Enrollment as of January 2016 by Sociodemographic Groups31
Source: Enrollment data from FSSA.
30 For additional detail on county-level data by race, gender and Aid Category, see: Healthy Indiana Plan Demonstration Project Number: 11-W-00296/5 Annual Report (Reporting Period February 1, 2015-January 31, 2016); State of Indiana; Submitted April 29, 2016. Retrieved May 16, 2016 from https://www.medicaid.gov/Medicaid-CHIP-Program-Information/By-Topics/Waivers/1115/downloads/in/Healthy-Indiana-Plan-2/in-healthy-indiana-plan-support-20-annl-rpt-feb-jan-2016-04292016.pdf
31 The HIP 2.0 enrollment data shows a small number of HIP enrollment at ages less than 19 and greater than 64. They are not reflected in the enrollment counts by age group, but are included in the counts shown for the other sociodemographic classifications.
24
Research Question 1.1.3: What proportion of Indiana residents with income under 138 percent of the FPL have had HIP 2.0 coverage at some point over the course of the year?
In the first demonstration year, 407,746 individuals enrolled in HIP 2.0. According to CPS ASEC 2015,32 there are an estimated 791,430 Indiana residents ages 19 to 64 with family income at or below 138 percent of the FPL. To estimate the population eligible for HIP, those individuals who are eligible for other insurance coverage such as Medicare and other Medicaid programs (aside from HIP 2.0) are set aside for purposes of this evaluation. For the waiver application, Milliman estimated that nearly 559,000 Indiana residents would be eligible for HIP (taking into account that certain residents in the eligible age and income categories would have coverage through other sources).33 Using Milliman’s estimation, roughly 73 percent of the eligible Indiana residents between 19 and 64 years old with family income at or below 138 percent of the FPL may have had HIP 2.0 coverage at some point over the demonstration year.
Research Question 1.1.4: Why do members leave HIP and how are they accessing care after leaving HIP?
As of the end of the first year of the demonstration, there were 61,572 total closures – i.e., members who left the HIP 2.0 program – including individuals who moved to another (non-HIP 2.0) Medicaid category or moved out of the Medicaid program altogether. About 16 percent of these were served in another Medicaid program. The closures amounted to about 15 percent of 407,746 unique ever-enrolled individuals.
FSSA reports the most common reason for closure is that income exceeds program eligibility standards.34 Other top reasons for closure included failing to comply with redetermination and failing to provide required supporting documentation.
In order to shed light on the reasons individuals leave HIP, results from the leaver survey were analyzed. The respondents for this survey included members who left the program for any reason (such as moving out of state), and members who had income over 100 percent of the FPL and left the program for non-payment of their POWER Account contribution. The sample of previous members included 130 individuals. Of these respondents, 14 were previous HIP Basic members, and 116 were previous HIP Plus members (see Appendix C for more details on the leaver survey).
32 United State Census Bureau. Current Population Survey. Retrieved April 1, 2016 from https://www.census.gov/cps/data/
33 Note that the Milliman report based their estimates off the ACS. Milliman. 2014. 1115 Waiver—Healthy Indiana Plan Expansion Proposal.
34 Healthy Indiana Plan Demonstration Project Number: 11-W-00296/5 Annual Report (Reporting Period February 1, 2015-January 31, 2016); State of Indiana; Submitted April 29, 2016. Retrieved May 16, 2016 from https://www.medicaid.gov/Medicaid-CHIP-Program-Information/By-Topics/Waivers/1115/downloads/in/Healthy-Indiana-Plan-2/in-healthy-indiana-plan-support-20-annl-rpt-feb-jan-2016-04292016.pdf
25
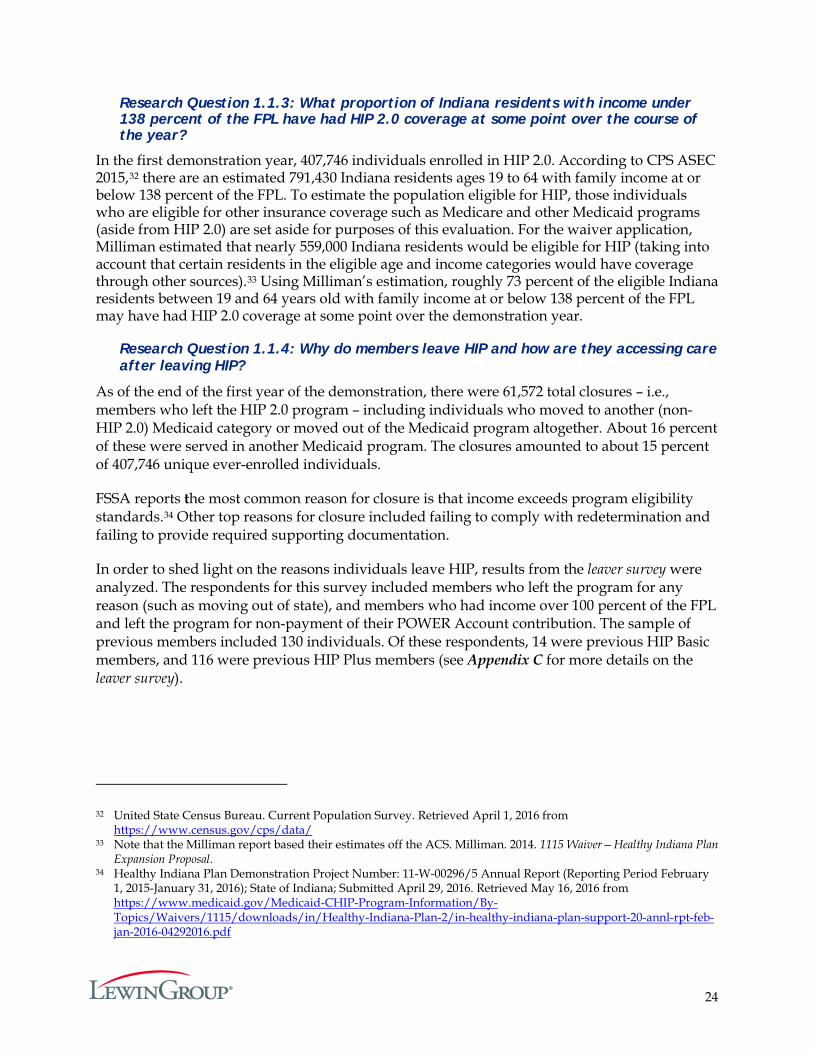
Exhibit 1.1.4: Reason for Leaving HIP 2.0 Surveyed Sample of Previous HIP 2.0 Members
Source: Leaver survey. “Other Insurance” includes individuals reporting that they acquired Medicare coverage, insurance from other source, Medicaid, or Veteran’s benefits. “Affordability” is indicative of responses that noted lack of money and cannot afford. The category “Other” encapsulates responses for miscellaneous/unrelated, don’t know/no reason, not enrolled in HIP, items not covered, incomplete paperwork, and pregnancy.
As depicted in Exhibit 1.1.4, the top two reasons cited for leaving HIP 2.0 were: (1) respondents had insurance through an alternate source (28 percent; n=42) and (2) there was a change in their income levels (24 percent; n=27). A change in income most likely results in the individuals no longer being eligible for HIP 2.0. According to survey respondents, affordability accounted for five percent (n=13) and non-payment another four percent (n=10) of exits. However, the sample size for this survey is small and may not be generalizable to the entire population.
Access to Care after Leaving HIP 2.0
The survey also asked whether respondents had health insurance coverage after they had left the program. Approximately 55 percent of the respondents (n=71) responded that they did.35
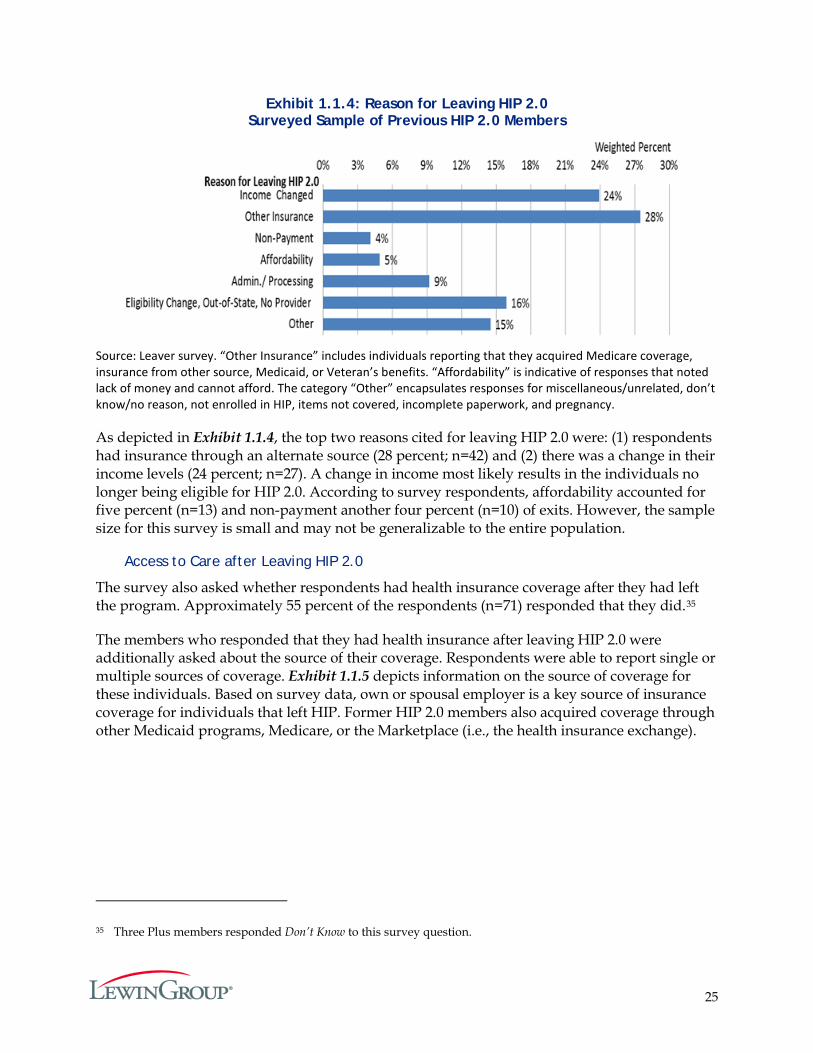
The members who responded that they had health insurance after leaving HIP 2.0 were additionally asked about the source of their coverage. Respondents were able to report single or multiple sources of coverage. Exhibit 1.1.5 depicts information on the source of coverage for these individuals. Based on survey data, own or spousal employer is a key source of insurance coverage for individuals that left HIP. Former HIP 2.0 members also acquired coverage through other Medicaid programs, Medicare, or the Marketplace (i.e., the health insurance exchange).
35 Three Plus members responded Don’t Know to this survey question.
26
Exhibit 1.1.5: Source of Health Insurance Coverage after Leaving HIP 2.0
Source: Leaver survey.36 HCC = Hoosier Care Connect. HHW = Hoosier Healthwise.
Hypothesis 1.2: HIP Will Increase Access to Healthcare Services Among the Target Population.
HIP 2.0 retains a number of program elements introduced to the HIP 1.0 program to increase access to healthcare services. For instance, HIP 2.0 maintains the reimbursement rates for providers under HIP 2.0 at the level of Medicare reimbursement rates or 130 percent of Medicaid reimbursement rates where a Medicare rate does not exist. 37,38 HIP 2.0 offers benefits such as maternity coverage without any cost sharing for all pregnant women, as well as dental and vision coverage, bariatric surgery and temporomandibular joint (TMJ) treatment for Regular Plus members, services that were already available to State plan members. Under HIP 2.0, transportation, vision, dental and chiropractic services are also available for pregnant women in the HIP Basic plan.39
There are four research questions associated with this hypothesis that are designed to assess the effectiveness of HIP 2.0 in expanding and ensuring access to healthcare services:
1. How do member perceptions of access to healthcare change before and after enrolling in HIP?
2. How does perceived access to care differ between HIP members and individuals who are eligible but have not applied and/or enrolled in HIP?
36 There was one Don’t know response for each of the questions on own employer plan, individual policy, Medicare, and Medicaid. There were two Don’t Know responses for the question on spousal employer plan.
37 Exception: Low Income Parent/Caretaker aid category members will be reimbursed based on the Medicaid Fee Schedule.
38 “IHCP Bulletin: Indiana Health Coverage Programs”; January 27, 2015. Retrieved June 17, 2016 from http://provider.indianamedicaid.com/ihcp/Bulletins/BT201503.pdf
39 “Healthy Indiana Plan 2.0: Introduction, Plan options, Cost sharing, and Benefits.” FSSA.
27
3. How does access to care differ between HIP 2.0 and HHW members?
4. Are there geographic areas in Indiana where HIP members lack access to primary or specialty care?
Research Question 1.2.1: How do member perceptions of access to healthcare change before and after fully enrolling in HIP?
Research Question 1.2.2: How does perceived access to care differ between HIP members and individuals who are eligible but have not applied and/or enrolled in HIP?
These questions focus on HIP 2.0 members’ perception of access to healthcare services. The surveys and evaluation were completed after the start of the program, so it was not possible to survey perception of access prior to members enrolling in the program. Instead, the questions regarding access to care that were asked of the three groups under three distinct surveys, namely, the current member survey, the never-member survey, and the leaver survey were used (Details on the survey design are available in Appendix G and on the survey questions in Appendices A through E).
Each of these three surveys asked respondents whether, in the past six months, individuals:
1. Made any appointment for a routine check-up at a doctor’s office or clinic,
2. Made any appointment to see a specialist, and
3. Acquired any prescription refill.
For each of these three questions, a follow-up question was asked to learn whether necessary services could be accessed as soon as needed during the previous six months. The responses to the first three questions across the three different surveys are depicted in Exhibit 1.2.1.
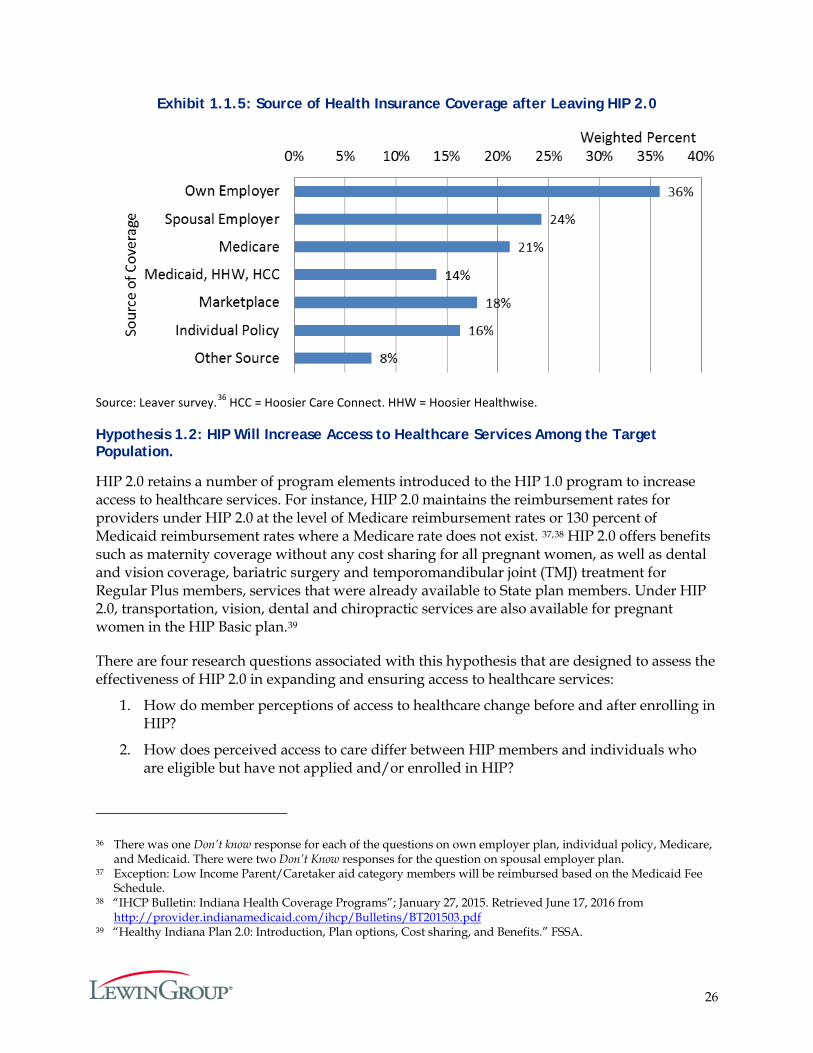
Exhibit 1.2.1: Proportion of Survey Respondents who Utilized Routine Care, Specialty Care and Prescription Drugs in the Past 6 Months
Source: Current member, leaver and never-member survey. Percentages are based on weighted responses, except for never-members.
28
Current members were more likely than leavers to access healthcare services (for all three domains of care) in the six months prior to being surveyed. Never-members were more likely to use care than leavers across all three domains (routine care, specialist care and prescription drugs).
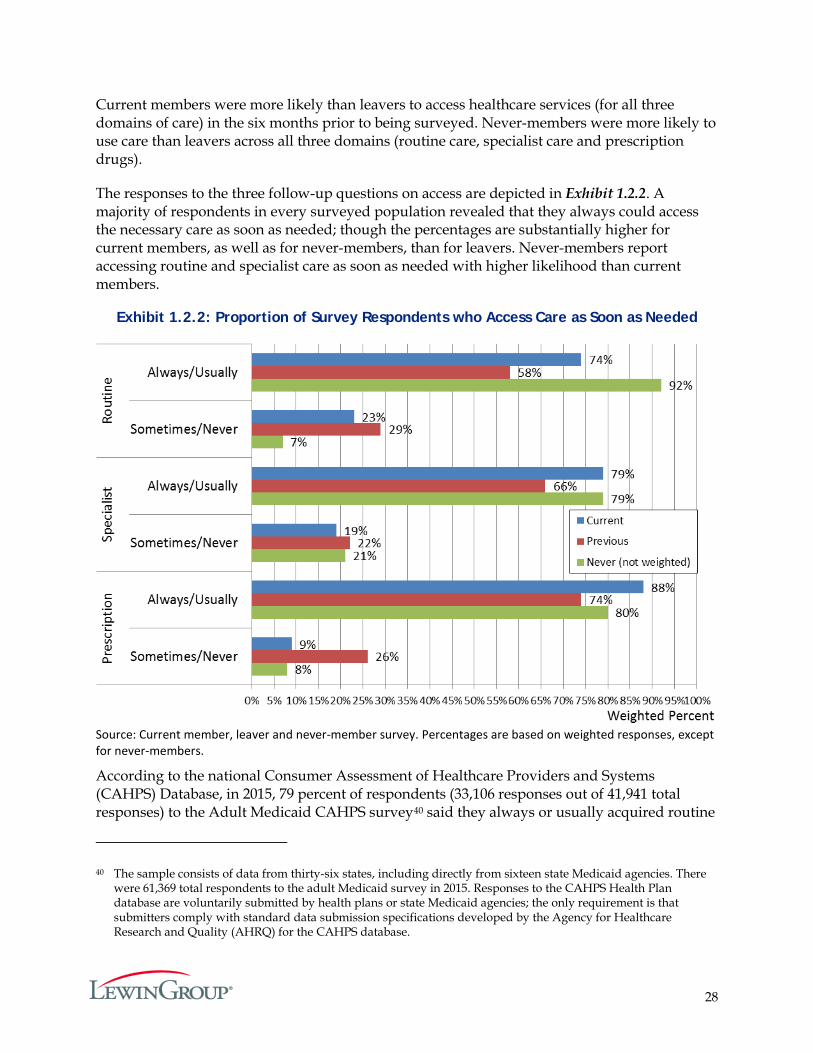
The responses to the three follow-up questions on access are depicted in Exhibit 1.2.2. A majority of respondents in every surveyed population revealed that they always could access the necessary care as soon as needed; though the percentages are substantially higher for current members, as well as for never-members, than for leavers. Never-members report accessing routine and specialist care as soon as needed with higher likelihood than current members.
Exhibit 1.2.2: Proportion of Survey Respondents who Access Care as Soon as Needed
Source: Current member, leaver and never-member survey. Percentages are based on weighted responses, except for never-members.
According to the national Consumer Assessment of Healthcare Providers and Systems (CAHPS) Database, in 2015, 79 percent of respondents (33,106 responses out of 41,941 total responses) to the Adult Medicaid CAHPS survey40 said they always or usually acquired routine
40 The sample consists of data from thirty-six states, including directly from sixteen state Medicaid agencies. There were 61,369 total respondents to the adult Medicaid survey in 2015. Responses to the CAHPS Health Plan database are voluntarily submitted by health plans or state Medicaid agencies; the only requirement is that submitters comply with standard data submission specifications developed by the Agency for Healthcare Research and Quality (AHRQ) for the CAHPS database.
29
appointments at a doctor’s office or clinic as soon as needed and 80 percent (19,430 responses out of 24,527 total responses) said they always or usually acquired appointments with specialists as soon as needed.41 These national baselines are very close to the 74 percent of current HIP 2.0 members who indicated they always or usually could access routine care as soon as needed and the 79 percent of current members who said they always or usually could access specialists as soon as needed.
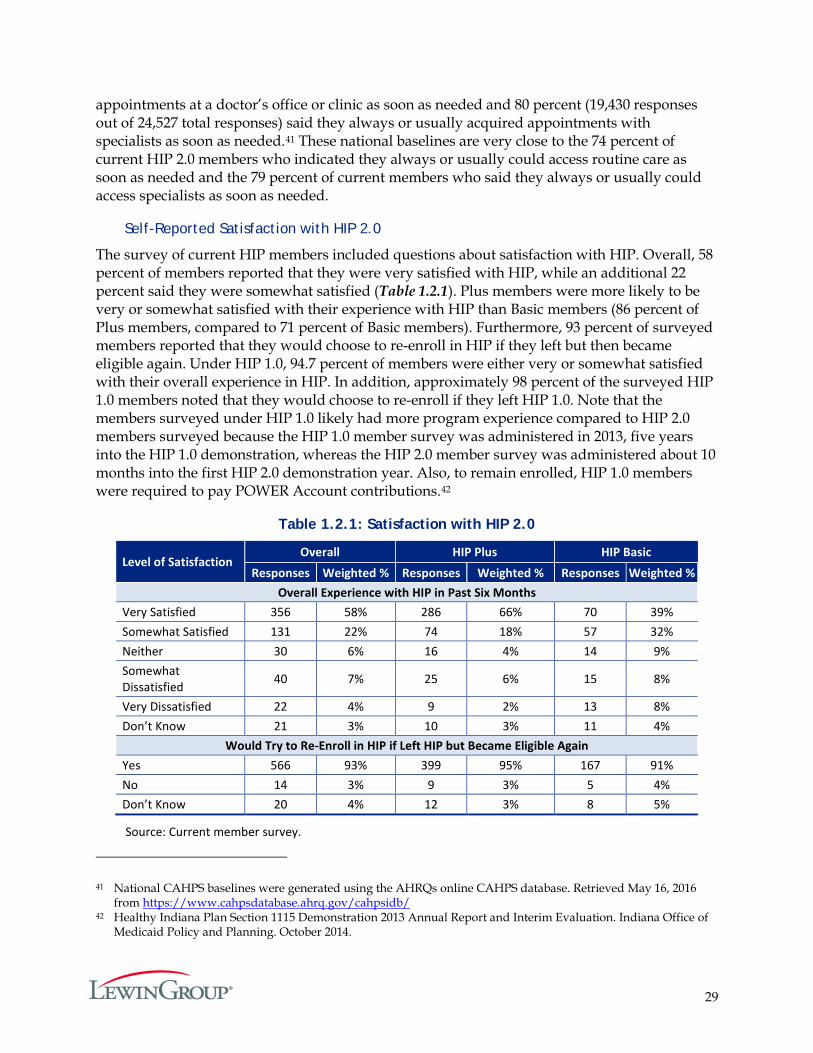
Self-Reported Satisfaction with HIP 2.0
The survey of current HIP members included questions about satisfaction with HIP. Overall, 58 percent of members reported that they were very satisfied with HIP, while an additional 22 percent said they were somewhat satisfied (Table 1.2.1). Plus members were more likely to be very or somewhat satisfied with their experience with HIP than Basic members (86 percent of Plus members, compared to 71 percent of Basic members). Furthermore, 93 percent of surveyed members reported that they would choose to re-enroll in HIP if they left but then became eligible again. Under HIP 1.0, 94.7 percent of members were either very or somewhat satisfied with their overall experience in HIP. In addition, approximately 98 percent of the surveyed HIP 1.0 members noted that they would choose to re-enroll if they left HIP 1.0. Note that the members surveyed under HIP 1.0 likely had more program experience compared to HIP 2.0 members surveyed because the HIP 1.0 member survey was administered in 2013, five years into the HIP 1.0 demonstration, whereas the HIP 2.0 member survey was administered about 10 months into the first HIP 2.0 demonstration year. Also, to remain enrolled, HIP 1.0 members were required to pay POWER Account contributions.42
Table 1.2.1: Satisfaction with HIP 2.0
Level of Satisfaction Overall HIP Plus HIP Basic
Responses Weighted % Responses Weighted % Responses Weighted % Overall Experience with HIP in Past Six Months
Very Satisfied 356 58% 286 66% 70 39% Somewhat Satisfied 131 22% 74 18% 57 32% Neither 30 6% 16 4% 14 9% Somewhat Dissatisfied 40 7% 25 6% 15 8%
Very Dissatisfied 22 4% 9 2% 13 8% Don’t Know 21 3% 10 3% 11 4%
Would Try to Re-Enroll in HIP if Left HIP but Became Eligible Again Yes 566 93% 399 95% 167 91% No 14 3% 9 3% 5 4% Don’t Know 20 4% 12 3% 8 5%
Source: Current member survey.
41 National CAHPS baselines were generated using the AHRQs online CAHPS database. Retrieved May 16, 2016 from https://www.cahpsdatabase.ahrq.gov/cahpsidb/
42 Healthy Indiana Plan Section 1115 Demonstration 2013 Annual Report and Interim Evaluation. Indiana Office of Medicaid Policy and Planning. October 2014.
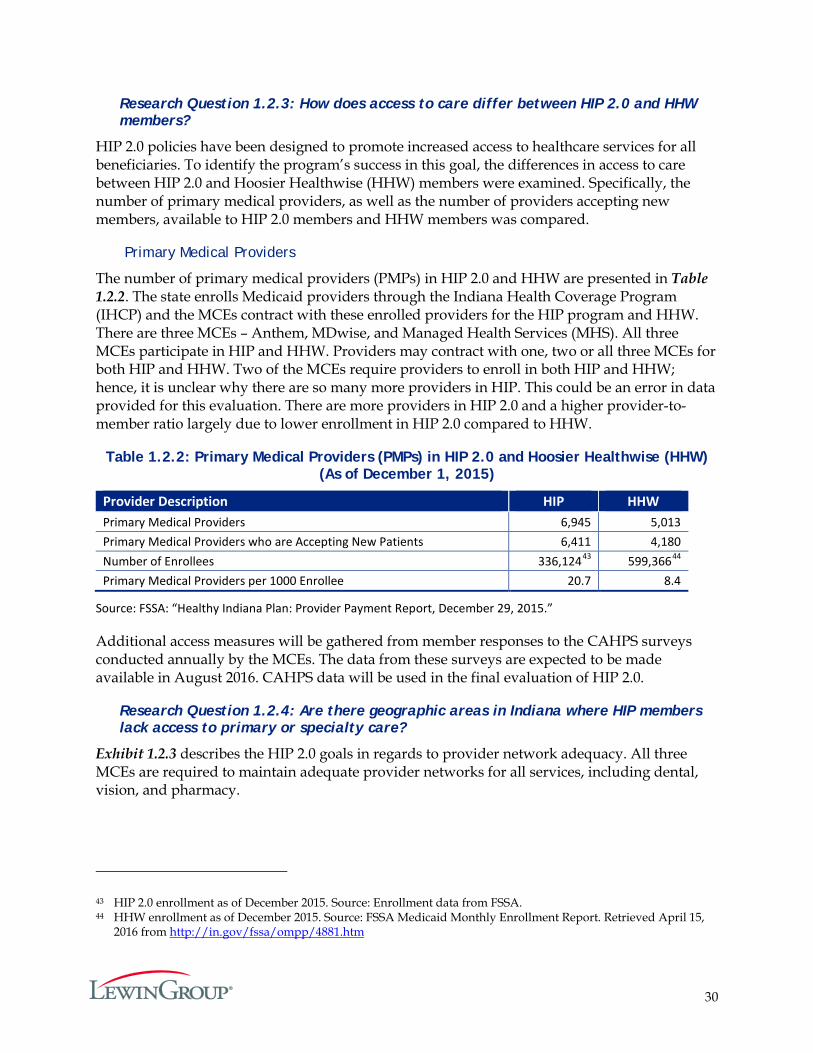
30
Research Question 1.2.3: How does access to care differ between HIP 2.0 and HHW members?
HIP 2.0 policies have been designed to promote increased access to healthcare services for all beneficiaries. To identify the program’s success in this goal, the differences in access to care between HIP 2.0 and Hoosier Healthwise (HHW) members were examined. Specifically, the number of primary medical providers, as well as the number of providers accepting new members, available to HIP 2.0 members and HHW members was compared.
Primary Medical Providers
The number of primary medical providers (PMPs) in HIP 2.0 and HHW are presented in Table 1.2.2. The state enrolls Medicaid providers through the Indiana Health Coverage Program (IHCP) and the MCEs contract with these enrolled providers for the HIP program and HHW. There are three MCEs – Anthem, MDwise, and Managed Health Services (MHS). All three MCEs participate in HIP and HHW. Providers may contract with one, two or all three MCEs for both HIP and HHW. Two of the MCEs require providers to enroll in both HIP and HHW; hence, it is unclear why there are so many more providers in HIP. This could be an error in data provided for this evaluation. There are more providers in HIP 2.0 and a higher provider-to-member ratio largely due to lower enrollment in HIP 2.0 compared to HHW.
Table 1.2.2: Primary Medical Providers (PMPs) in HIP 2.0 and Hoosier Healthwise (HHW) (As of December 1, 2015)
Provider Description HIP HHW Primary Medical Providers 6,945 5,013 Primary Medical Providers who are Accepting New Patients 6,411 4,180 Number of Enrollees 336,12443 599,36644 Primary Medical Providers per 1000 Enrollee 20.7 8.4
Source: FSSA: “Healthy Indiana Plan: Provider Payment Report, December 29, 2015.”
Additional access measures will be gathered from member responses to the CAHPS surveys conducted annually by the MCEs. The data from these surveys are expected to be made available in August 2016. CAHPS data will be used in the final evaluation of HIP 2.0.
Research Question 1.2.4: Are there geographic areas in Indiana where HIP members lack access to primary or specialty care?
Exhibit 1.2.3 describes the HIP 2.0 goals in regards to provider network adequacy. All three MCEs are required to maintain adequate provider networks for all services, including dental, vision, and pharmacy.
43 HIP 2.0 enrollment as of December 2015. Source: Enrollment data from FSSA. 44 HHW enrollment as of December 2015. Source: FSSA Medicaid Monthly Enrollment Report. Retrieved April 15,
2016 from http://in.gov/fssa/ompp/4881.htm
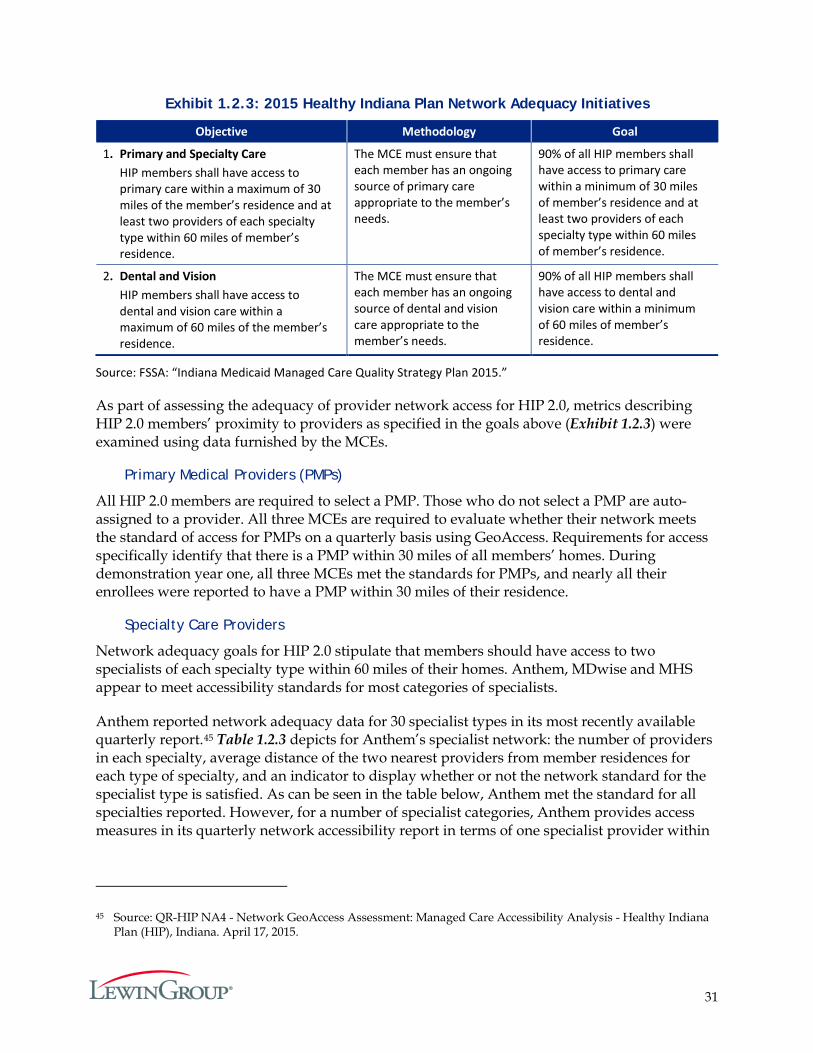
31
Exhibit 1.2.3: 2015 Healthy Indiana Plan Network Adequacy Initiatives
Objective Methodology Goal
1. Primary and Specialty Care HIP members shall have access to primary care within a maximum of 30 miles of the member’s residence and at least two providers of each specialty type within 60 miles of member’s residence.
The MCE must ensure that each member has an ongoing source of primary care appropriate to the member’s needs.
90% of all HIP members shall have access to primary care within a minimum of 30 miles of member’s residence and at least two providers of each specialty type within 60 miles of member’s residence.
2. Dental and Vision HIP members shall have access to dental and vision care within a maximum of 60 miles of the member’s residence.
The MCE must ensure that each member has an ongoing source of dental and vision care appropriate to the member’s needs.
90% of all HIP members shall have access to dental and vision care within a minimum of 60 miles of member’s residence.
Source: FSSA: “Indiana Medicaid Managed Care Quality Strategy Plan 2015.”
As part of assessing the adequacy of provider network access for HIP 2.0, metrics describing HIP 2.0 members’ proximity to providers as specified in the goals above (Exhibit 1.2.3) were examined using data furnished by the MCEs.
Primary Medical Providers (PMPs)
All HIP 2.0 members are required to select a PMP. Those who do not select a PMP are auto-assigned to a provider. All three MCEs are required to evaluate whether their network meets the standard of access for PMPs on a quarterly basis using GeoAccess. Requirements for access specifically identify that there is a PMP within 30 miles of all members’ homes. During demonstration year one, all three MCEs met the standards for PMPs, and nearly all their enrollees were reported to have a PMP within 30 miles of their residence.
Specialty Care Providers
Network adequacy goals for HIP 2.0 stipulate that members should have access to two specialists of each specialty type within 60 miles of their homes. Anthem, MDwise and MHS appear to meet accessibility standards for most categories of specialists.
Anthem reported network adequacy data for 30 specialist types in its most recently available quarterly report.45 Table 1.2.3 depicts for Anthem’s specialist network: the number of providers in each specialty, average distance of the two nearest providers from member residences for each type of specialty, and an indicator to display whether or not the network standard for the specialist type is satisfied. As can be seen in the table below, Anthem met the standard for all specialties reported. However, for a number of specialist categories, Anthem provides access measures in its quarterly network accessibility report in terms of one specialist provider within
45 Source: QR-HIP NA4 - Network GeoAccess Assessment: Managed Care Accessibility Analysis - Healthy Indiana Plan (HIP), Indiana. April 17, 2015.
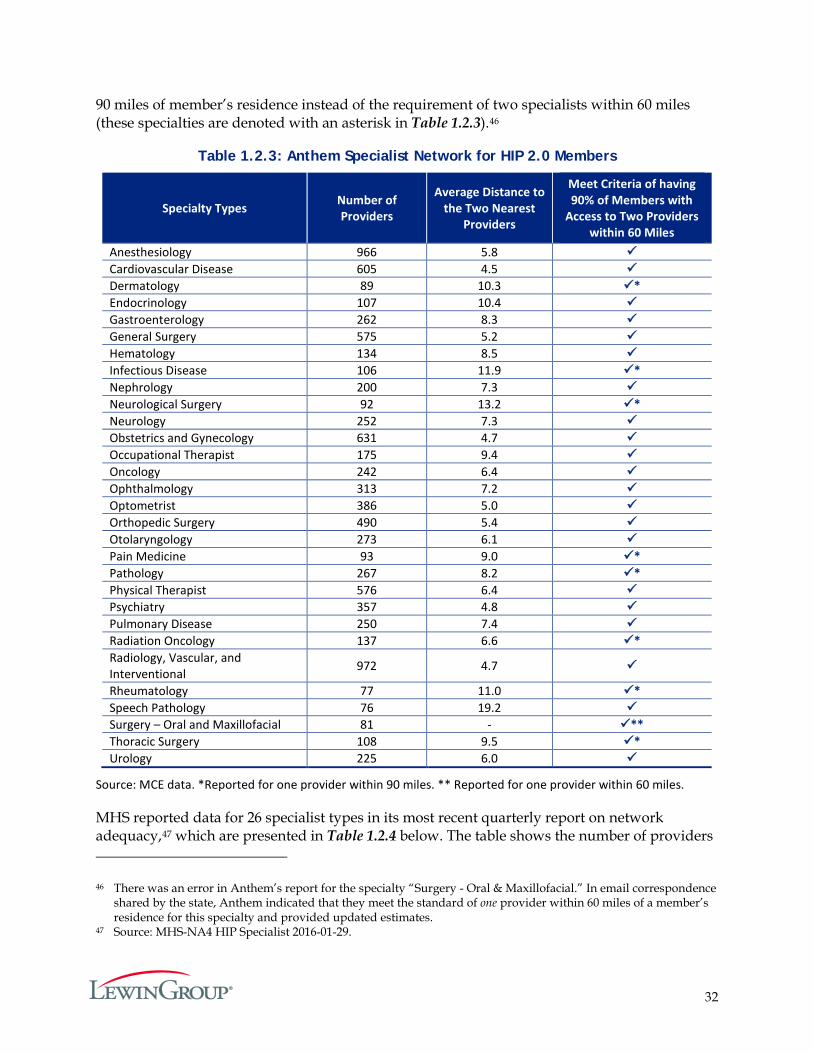
32
90 miles of member’s residence instead of the requirement of two specialists within 60 miles (these specialties are denoted with an asterisk in Table 1.2.3).46
Table 1.2.3: Anthem Specialist Network for HIP 2.0 Members
Specialty Types Number of Providers
Average Distance to the Two Nearest
Providers
Meet Criteria of having 90% of Members with
Access to Two Providers within 60 Miles
Anesthesiology 966 5.8 Cardiovascular Disease 605 4.5 Dermatology 89 10.3 * Endocrinology 107 10.4 Gastroenterology 262 8.3 General Surgery 575 5.2 Hematology 134 8.5 Infectious Disease 106 11.9 * Nephrology 200 7.3 Neurological Surgery 92 13.2 * Neurology 252 7.3 Obstetrics and Gynecology 631 4.7 Occupational Therapist 175 9.4 Oncology 242 6.4 Ophthalmology 313 7.2 Optometrist 386 5.0 Orthopedic Surgery 490 5.4 Otolaryngology 273 6.1 Pain Medicine 93 9.0 * Pathology 267 8.2 * Physical Therapist 576 6.4 Psychiatry 357 4.8 Pulmonary Disease 250 7.4 Radiation Oncology 137 6.6 * Radiology, Vascular, and Interventional 972 4.7
Rheumatology 77 11.0 * Speech Pathology 76 19.2 Surgery – Oral and Maxillofacial 81 - ** Thoracic Surgery 108 9.5 * Urology 225 6.0
Source: MCE data. *Reported for one provider within 90 miles. ** Reported for one provider within 60 miles.
MHS reported data for 26 specialist types in its most recent quarterly report on network adequacy,47 which are presented in Table 1.2.4 below. The table shows the number of providers
46 There was an error in Anthem’s report for the specialty “Surgery - Oral & Maxillofacial.” In email correspondence shared by the state, Anthem indicated that they meet the standard of one provider within 60 miles of a member’s residence for this specialty and provided updated estimates.
47 Source: MHS-NA4 HIP Specialist 2016-01-29.
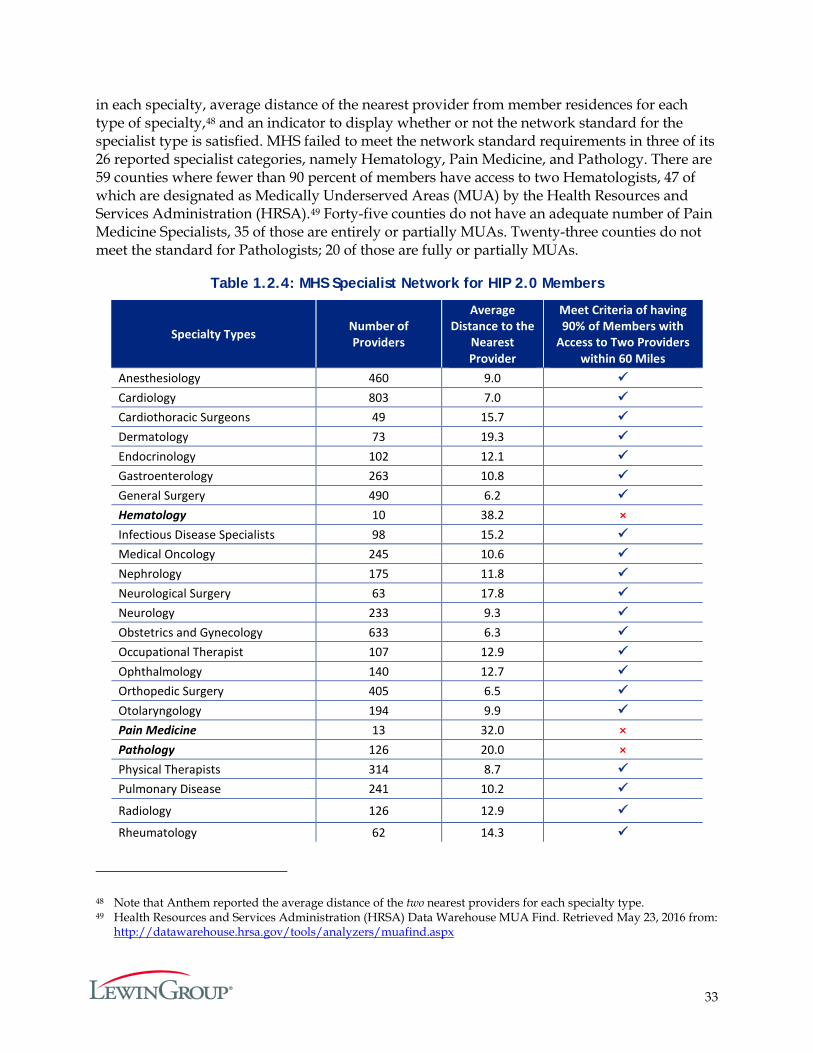
33
in each specialty, average distance of the nearest provider from member residences for each type of specialty,48 and an indicator to display whether or not the network standard for the specialist type is satisfied. MHS failed to meet the network standard requirements in three of its 26 reported specialist categories, namely Hematology, Pain Medicine, and Pathology. There are 59 counties where fewer than 90 percent of members have access to two Hematologists, 47 of which are designated as Medically Underserved Areas (MUA) by the Health Resources and Services Administration (HRSA).49 Forty-five counties do not have an adequate number of Pain Medicine Specialists, 35 of those are entirely or partially MUAs. Twenty-three counties do not meet the standard for Pathologists; 20 of those are fully or partially MUAs.
Table 1.2.4: MHS Specialist Network for HIP 2.0 Members
Specialty Types Number of Providers
Average Distance to the
Nearest Provider
Meet Criteria of having 90% of Members with
Access to Two Providers within 60 Miles
Anesthesiology 460 9.0 Cardiology 803 7.0 Cardiothoracic Surgeons 49 15.7 Dermatology 73 19.3 Endocrinology 102 12.1 Gastroenterology 263 10.8 General Surgery 490 6.2 Hematology 10 38.2 × Infectious Disease Specialists 98 15.2 Medical Oncology 245 10.6 Nephrology 175 11.8 Neurological Surgery 63 17.8 Neurology 233 9.3 Obstetrics and Gynecology 633 6.3 Occupational Therapist 107 12.9 Ophthalmology 140 12.7 Orthopedic Surgery 405 6.5 Otolaryngology 194 9.9 Pain Medicine 13 32.0 × Pathology 126 20.0 × Physical Therapists 314 8.7 Pulmonary Disease 241 10.2
Radiology 126 12.9
Rheumatology 62 14.3
48 Note that Anthem reported the average distance of the two nearest providers for each specialty type. 49 Health Resources and Services Administration (HRSA) Data Warehouse MUA Find. Retrieved May 23, 2016 from:
http://datawarehouse.hrsa.gov/tools/analyzers/muafind.aspx
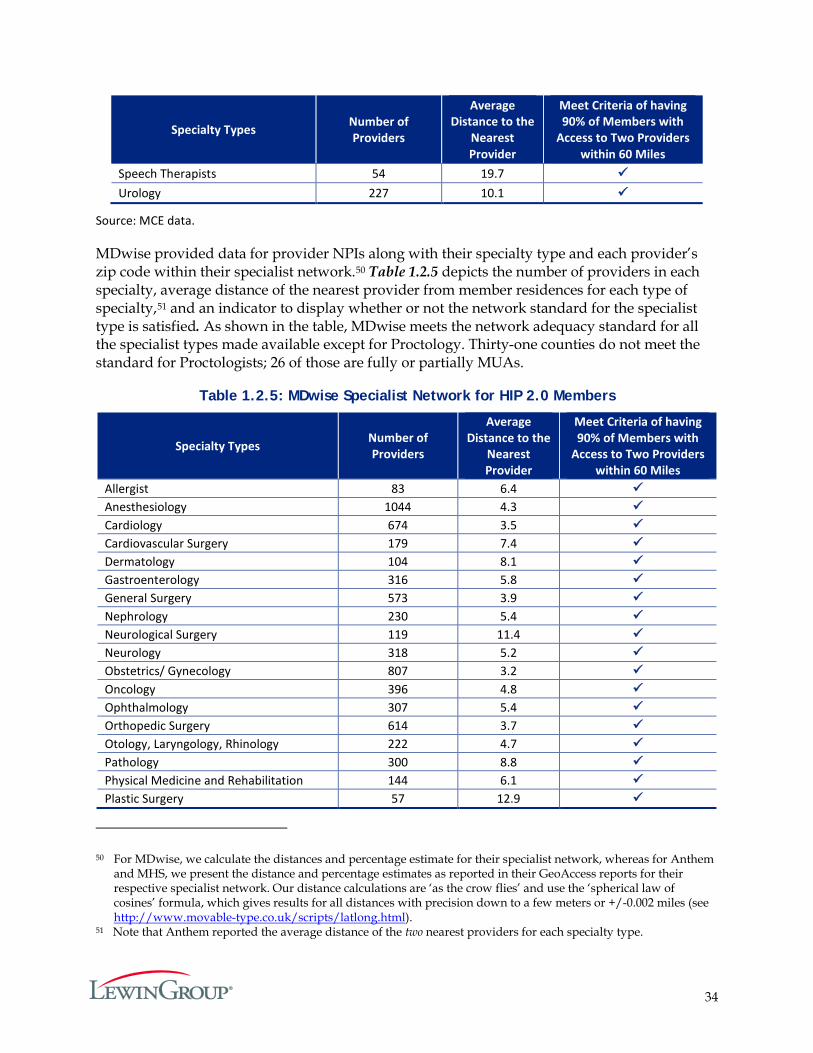
34
Specialty Types Number of Providers
Average Distance to the
Nearest Provider
Meet Criteria of having 90% of Members with
Access to Two Providers within 60 Miles
Speech Therapists 54 19.7 Urology 227 10.1
Source: MCE data.
MDwise provided data for provider NPIs along with their specialty type and each provider’s zip code within their specialist network.50 Table 1.2.5 depicts the number of providers in each specialty, average distance of the nearest provider from member residences for each type of specialty,51 and an indicator to display whether or not the network standard for the specialist type is satisfied. As shown in the table, MDwise meets the network adequacy standard for all the specialist types made available except for Proctology. Thirty-one counties do not meet the standard for Proctologists; 26 of those are fully or partially MUAs.
Table 1.2.5: MDwise Specialist Network for HIP 2.0 Members
Specialty Types Number of Providers
Average Distance to the
Nearest Provider
Meet Criteria of having 90% of Members with
Access to Two Providers within 60 Miles
Allergist 83 6.4 Anesthesiology 1044 4.3 Cardiology 674 3.5 Cardiovascular Surgery 179 7.4 Dermatology 104 8.1 Gastroenterology 316 5.8 General Surgery 573 3.9 Nephrology 230 5.4 Neurological Surgery 119 11.4 Neurology 318 5.2 Obstetrics/ Gynecology 807 3.2 Oncology 396 4.8 Ophthalmology 307 5.4 Orthopedic Surgery 614 3.7 Otology, Laryngology, Rhinology 222 4.7 Pathology 300 8.8 Physical Medicine and Rehabilitation 144 6.1 Plastic Surgery 57 12.9
50 For MDwise, we calculate the distances and percentage estimate for their specialist network, whereas for Anthem and MHS, we present the distance and percentage estimates as reported in their GeoAccess reports for their respective specialist network. Our distance calculations are ‘as the crow flies’ and use the ‘spherical law of cosines’ formula, which gives results for all distances with precision down to a few meters or +/-0.002 miles (see http://www.movable-type.co.uk/scripts/latlong.html).
51 Note that Anthem reported the average distance of the two nearest providers for each specialty type.
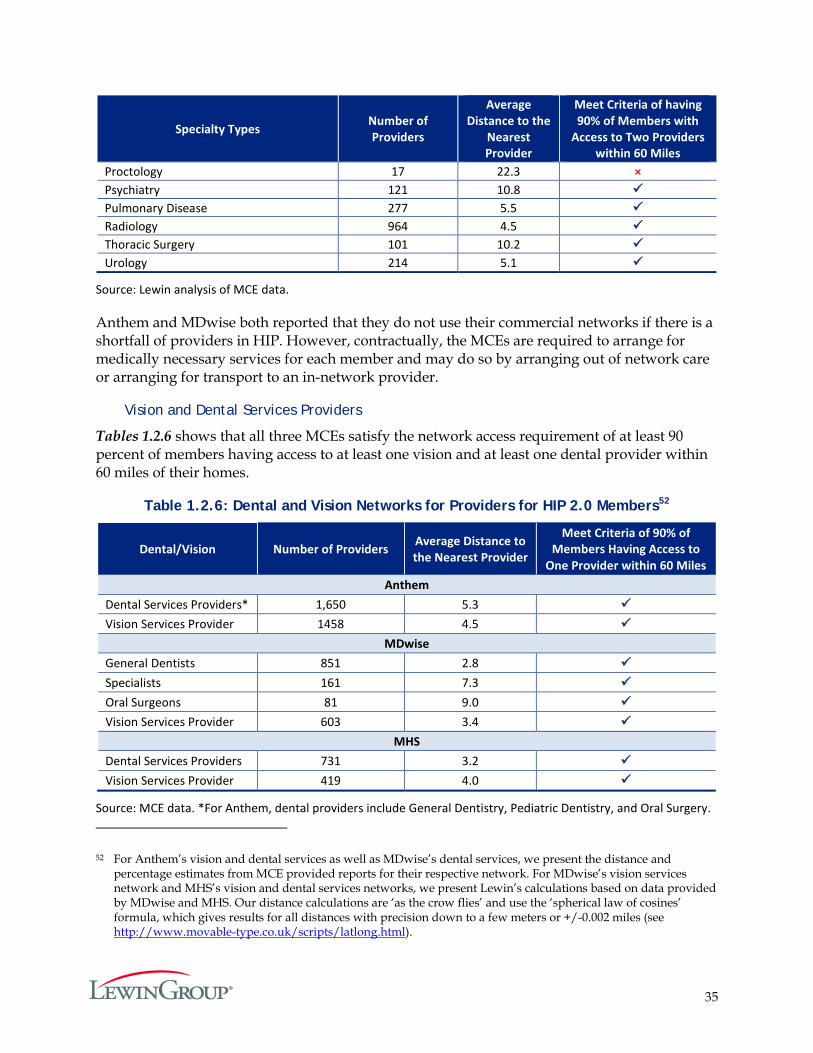
35
Specialty Types Number of Providers
Average Distance to the
Nearest Provider
Meet Criteria of having 90% of Members with
Access to Two Providers within 60 Miles
Proctology 17 22.3 × Psychiatry 121 10.8 Pulmonary Disease 277 5.5 Radiology 964 4.5 Thoracic Surgery 101 10.2 Urology 214 5.1
Source: Lewin analysis of MCE data.
Anthem and MDwise both reported that they do not use their commercial networks if there is a shortfall of providers in HIP. However, contractually, the MCEs are required to arrange for medically necessary services for each member and may do so by arranging out of network care or arranging for transport to an in-network provider.
Vision and Dental Services Providers
Tables 1.2.6 shows that all three MCEs satisfy the network access requirement of at least 90 percent of members having access to at least one vision and at least one dental provider within 60 miles of their homes.
Table 1.2.6: Dental and Vision Networks for Providers for HIP 2.0 Members52
Dental/Vision Number of Providers Average Distance to the Nearest Provider
Meet Criteria of 90% of Members Having Access to
One Provider within 60 Miles Anthem
Dental Services Providers* 1,650 5.3 Vision Services Provider 1458 4.5
MDwise General Dentists 851 2.8 Specialists 161 7.3 Oral Surgeons 81 9.0 Vision Services Provider 603 3.4
MHS Dental Services Providers 731 3.2 Vision Services Provider 419 4.0
Source: MCE data. *For Anthem, dental providers include General Dentistry, Pediatric Dentistry, and Oral Surgery.
52 For Anthem’s vision and dental services as well as MDwise’s dental services, we present the distance and percentage estimates from MCE provided reports for their respective network. For MDwise’s vision services network and MHS’s vision and dental services networks, we present Lewin’s calculations based on data provided by MDwise and MHS. Our distance calculations are ‘as the crow flies’ and use the ‘spherical law of cosines’ formula, which gives results for all distances with precision down to a few meters or +/-0.002 miles (see http://www.movable-type.co.uk/scripts/latlong.html).
36
The MCEs routinely review network gaps and develop provider recruitment plans to identify providers that can fill these needs and outreach to them. These can be new providers or current non-participating providers. The plans also work closely with hospitals to identify new service lines they may offer to include in existing contracts. Through medical and case management, the MCEs assist providers and members in seeking and approving referrals for services in which access gaps exist. Indeed, as mentioned previously, the survey findings suggest that a majority of respondents could access necessary care as soon as needed. Thus, overall, it appears that HIP members are accessing needed care within the available provider network.
Hypothesis 1.3:
1. POWER Account Contributions for Individuals in the HIP Plus Plan are Affordable and do not Create a Barrier to Healthcare Access.
2. Few Individuals will Experience a Six-Month Disenrollment Period because the Policy will Deter Non-payment of POWER Account Contributions for HIP Plus Beneficiaries.
POWER Accounts, designed after health savings accounts, play a key role in the HIP 2.0 program, and are intended to pay for the first $2,500 of covered services. The objective of this hypothesis is to assess whether POWER Account contributions are affordable and whether HIP 2.0 policies encourage beneficiaries to maintain required contributions.
There are eight research questions associated with this hypothesis:
1. How many members will be impacted by employers and not-for-profit organizations paying all or part of their POWER Account contributions?
2. How do HIP 2.0 enrollees perceive the affordability of the PAC and non-payment penalties?
3. Was the six-month disenrollment period a deterrent for individuals over 100% FPL to miss a PAC?
4. How many individuals were never fully enrolled in HIP due to non-payment of the PAC?
5. How many individuals lost HIP Plus coverage due to non-payment of the PAC?
6. How many individuals requested a waiver from the six-month disenrollment period?
7. How are individuals accessing healthcare if they are disenrolled due to non-payment of the PAC?
8. Do POWER Account contributions present a barrier to initial enrollment in the HIP program?
Designed to incentivize and empower individuals to manage their healthcare expenses, POWER Accounts cover the first $2,500 of covered services for HIP Plus members. Members are required to make a monthly or annual contribution towards their POWER Account to maintain Plus coverage, indexed to two percent of their household income with a minimum of a one dollar contribution and capped at $100/month. Individuals with income more than the federal poverty level are not eligible for HIP Basic; if an individual with income above 100 percent of
37
the FPL never makes a PAC, he/she is never enrolled in HIP 2.0. Individuals with income above 100 percent of FPL who make at least one PAC but subsequently stop making PAC are disenrolled from HIP 2.0 for six months. Individuals with income below 100 percent of the FPL are transferred from HIP Plus to HIP Basic rather than being disenrolled from the program if PACs are not made.
In HIP 1.0, there was a similar policy in place that disenrolled individuals for 12 months if they did not make a PAC, however the original policy did not distinguish between individuals’ with incomes over or under 100 percent of the FPL. HIP 2.0 decreased the exclusion period for individuals with incomes over 100 percent of the FPL from 12 months under HIP 1.0 to six months and replaced the disenrollment of members below poverty with the policy to shift them into a program with less co-payments and benefits.53 Individuals who submit a new application during their HIP disenrollment period will have their eligibility considered for other Medicaid categories but will not be eligible for HIP. Disenrollment periods do not apply to individuals who are medically frail or receiving TMA, or to individuals who apply for a waiver from the six-month disenrollment period due to a qualifying event (e.g., obtaining and subsequently losing private insurance coverage; experiencing a loss of income after disqualification due to increased income; taking up residence in another state and returning later; being a victim of domestic violence; or residing in a county subject to a disaster declaration made in accordance with IC 10-14-3-12 at the time of member termination for non-payment or at any time in the 60 calendar days prior to the date of member termination for non-payment).54
As of January 2016, there were 224,268 HIP Plus members among a total of 345,656 HIP 2.0 enrollees. Even though individuals with family income under 100 percent of the FPL automatically qualify for HIP Basic, roughly 86 percent of HIP Plus members had income less than 100 percent of the FPL. During year one of HIP 2.0, a large majority of HIP enrollees maintained their Plus membership from their initial month of enrollment until the end of the demonstration year; hence, maintaining their PAC payments during this time.
Exhibit 1.3.1 displays the percentage of HIP Plus members with incomes by FPL based on January 2016 enrollment data. As displayed in the figure, more than half of HIP Plus membership was comprised of members with income less than 23 percent of the FPL, while about 14 percent of the HIP Plus members had an income above 100 percent of the FPL.
53 “Healthy Indiana Plan POWER Account Contributions and Copayments Infrastructure Operational Protocol”. (February 26, 2015). Retrieved April 18, 2016 from: https://www.medicaid.gov/Medicaid-CHIP-Program-Information/By-Topics/Waivers/1115/downloads/in/Healthy-Indiana-Plan-2/in-healthy-indiana-plan-support-20-Pwr-acct-co-pay-prtcl-02262015.pdf
54 Medically frail individuals above 100 percent of the FPL who fail to make a PAC are transferred to the Basic plan with co-pays. TMA participants who fail to make a PAC are transitioned to the Basic plan.
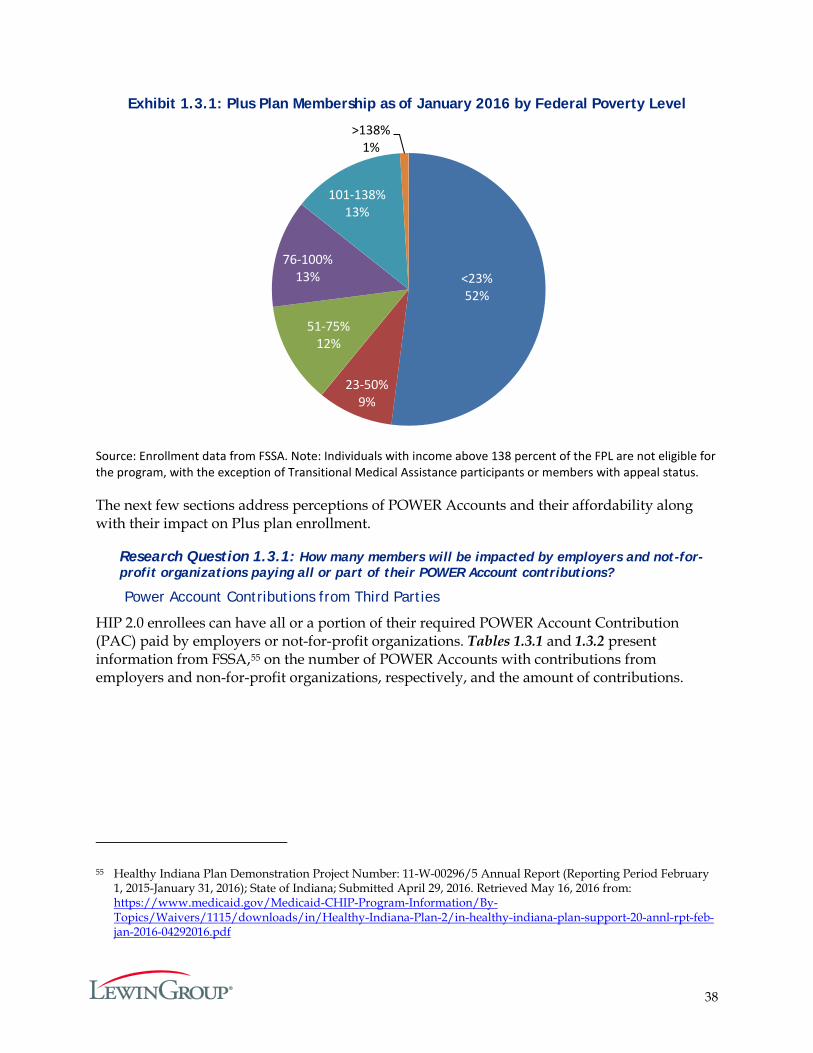
38
Exhibit 1.3.1: Plus Plan Membership as of January 2016 by Federal Poverty Level
Source: Enrollment data from FSSA. Note: Individuals with income above 138 percent of the FPL are not eligible for the program, with the exception of Transitional Medical Assistance participants or members with appeal status.
The next few sections address perceptions of POWER Accounts and their affordability along with their impact on Plus plan enrollment.
Research Question 1.3.1: How many members will be impacted by employers and not-for-profit organizations paying all or part of their POWER Account contributions?
Power Account Contributions from Third Parties
HIP 2.0 enrollees can have all or a portion of their required POWER Account Contribution (PAC) paid by employers or not-for-profit organizations. Tables 1.3.1 and 1.3.2 present information from FSSA,55 on the number of POWER Accounts with contributions from employers and non-for-profit organizations, respectively, and the amount of contributions.
55 Healthy Indiana Plan Demonstration Project Number: 11-W-00296/5 Annual Report (Reporting Period February 1, 2015-January 31, 2016); State of Indiana; Submitted April 29, 2016. Retrieved May 16, 2016 from: https://www.medicaid.gov/Medicaid-CHIP-Program-Information/By-Topics/Waivers/1115/downloads/in/Healthy-Indiana-Plan-2/in-healthy-indiana-plan-support-20-annl-rpt-feb-jan-2016-04292016.pdf
<23%52%
23-50%9%
51-75%12%
76-100%13%
101-138%13%
>138%1%
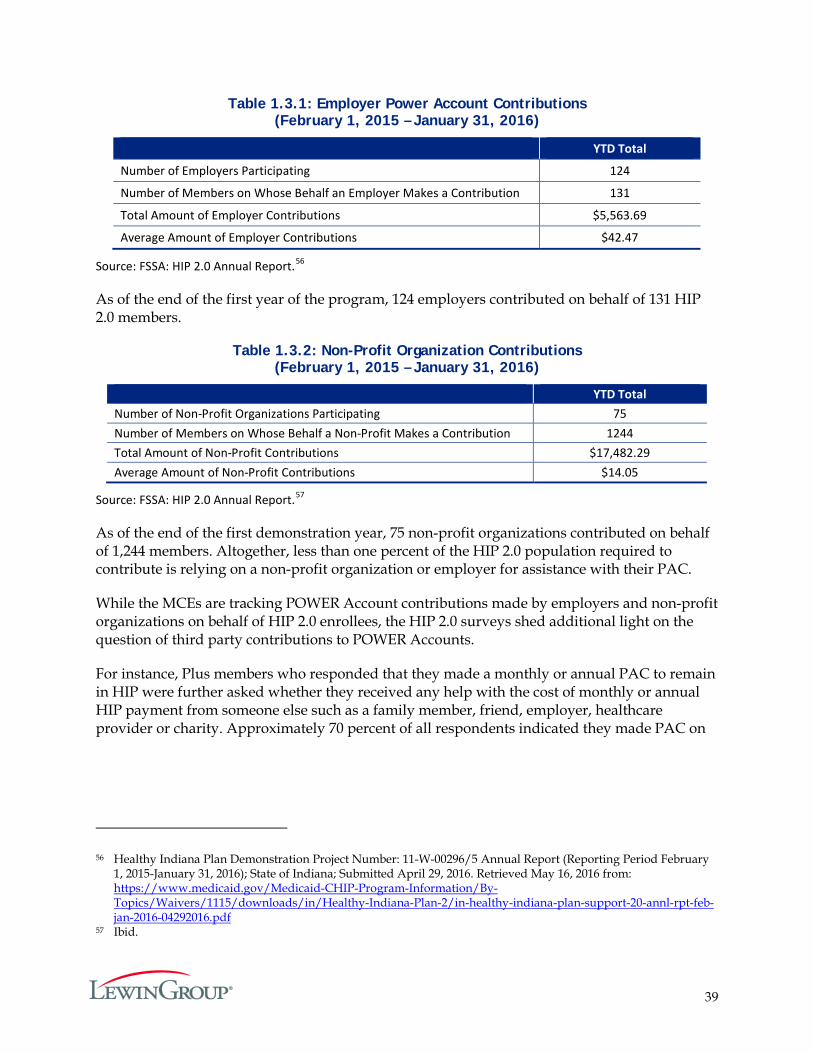
39
Table 1.3.1: Employer Power Account Contributions (February 1, 2015 – January 31, 2016)
YTD Total
Number of Employers Participating 124
Number of Members on Whose Behalf an Employer Makes a Contribution 131
Total Amount of Employer Contributions $5,563.69
Average Amount of Employer Contributions $42.47
Source: FSSA: HIP 2.0 Annual Report.56
As of the end of the first year of the program, 124 employers contributed on behalf of 131 HIP 2.0 members.
Table 1.3.2: Non-Profit Organization Contributions (February 1, 2015 – January 31, 2016)
YTD Total Number of Non-Profit Organizations Participating 75 Number of Members on Whose Behalf a Non-Profit Makes a Contribution 1244 Total Amount of Non-Profit Contributions $17,482.29 Average Amount of Non-Profit Contributions $14.05
Source: FSSA: HIP 2.0 Annual Report.57
As of the end of the first demonstration year, 75 non-profit organizations contributed on behalf of 1,244 members. Altogether, less than one percent of the HIP 2.0 population required to contribute is relying on a non-profit organization or employer for assistance with their PAC.
While the MCEs are tracking POWER Account contributions made by employers and non-profit organizations on behalf of HIP 2.0 enrollees, the HIP 2.0 surveys shed additional light on the question of third party contributions to POWER Accounts.
For instance, Plus members who responded that they made a monthly or annual PAC to remain in HIP were further asked whether they received any help with the cost of monthly or annual HIP payment from someone else such as a family member, friend, employer, healthcare provider or charity. Approximately 70 percent of all respondents indicated they made PAC on
56 Healthy Indiana Plan Demonstration Project Number: 11-W-00296/5 Annual Report (Reporting Period February 1, 2015-January 31, 2016); State of Indiana; Submitted April 29, 2016. Retrieved May 16, 2016 from: https://www.medicaid.gov/Medicaid-CHIP-Program-Information/By-Topics/Waivers/1115/downloads/in/Healthy-Indiana-Plan-2/in-healthy-indiana-plan-support-20-annl-rpt-feb-jan-2016-04292016.pdf
57 Ibid.
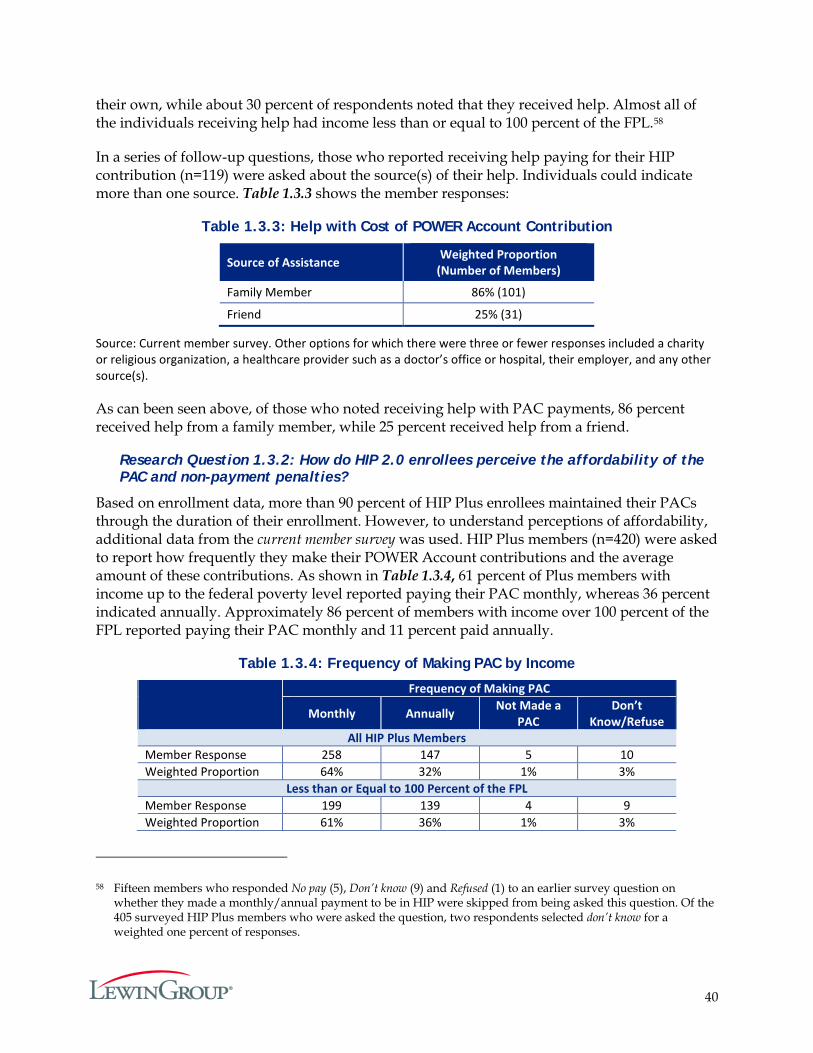
40
their own, while about 30 percent of respondents noted that they received help. Almost all of the individuals receiving help had income less than or equal to 100 percent of the FPL.58
In a series of follow-up questions, those who reported receiving help paying for their HIP contribution (n=119) were asked about the source(s) of their help. Individuals could indicate more than one source. Table 1.3.3 shows the member responses:
Table 1.3.3: Help with Cost of POWER Account Contribution
Source of Assistance Weighted Proportion (Number of Members)
Family Member 86% (101)
Friend 25% (31)
Source: Current member survey. Other options for which there were three or fewer responses included a charity or religious organization, a healthcare provider such as a doctor’s office or hospital, their employer, and any other source(s).
As can been seen above, of those who noted receiving help with PAC payments, 86 percent received help from a family member, while 25 percent received help from a friend.
Research Question 1.3.2: How do HIP 2.0 enrollees perceive the affordability of the PAC and non-payment penalties?
Based on enrollment data, more than 90 percent of HIP Plus enrollees maintained their PACs through the duration of their enrollment. However, to understand perceptions of affordability, additional data from the current member survey was used. HIP Plus members (n=420) were asked to report how frequently they make their POWER Account contributions and the average amount of these contributions. As shown in Table 1.3.4, 61 percent of Plus members with income up to the federal poverty level reported paying their PAC monthly, whereas 36 percent indicated annually. Approximately 86 percent of members with income over 100 percent of the FPL reported paying their PAC monthly and 11 percent paid annually.
Table 1.3.4: Frequency of Making PAC by Income
Frequency of Making PAC
Monthly Annually Not Made a PAC
Don’t Know/Refuse
All HIP Plus Members Member Response 258 147 5 10 Weighted Proportion 64% 32% 1% 3%
Less than or Equal to 100 Percent of the FPL Member Response 199 139 4 9 Weighted Proportion 61% 36% 1% 3%
58 Fifteen members who responded No pay (5), Don’t know (9) and Refused (1) to an earlier survey question on whether they made a monthly/annual payment to be in HIP were skipped from being asked this question. Of the 405 surveyed HIP Plus members who were asked the question, two respondents selected don’t know for a weighted one percent of responses.
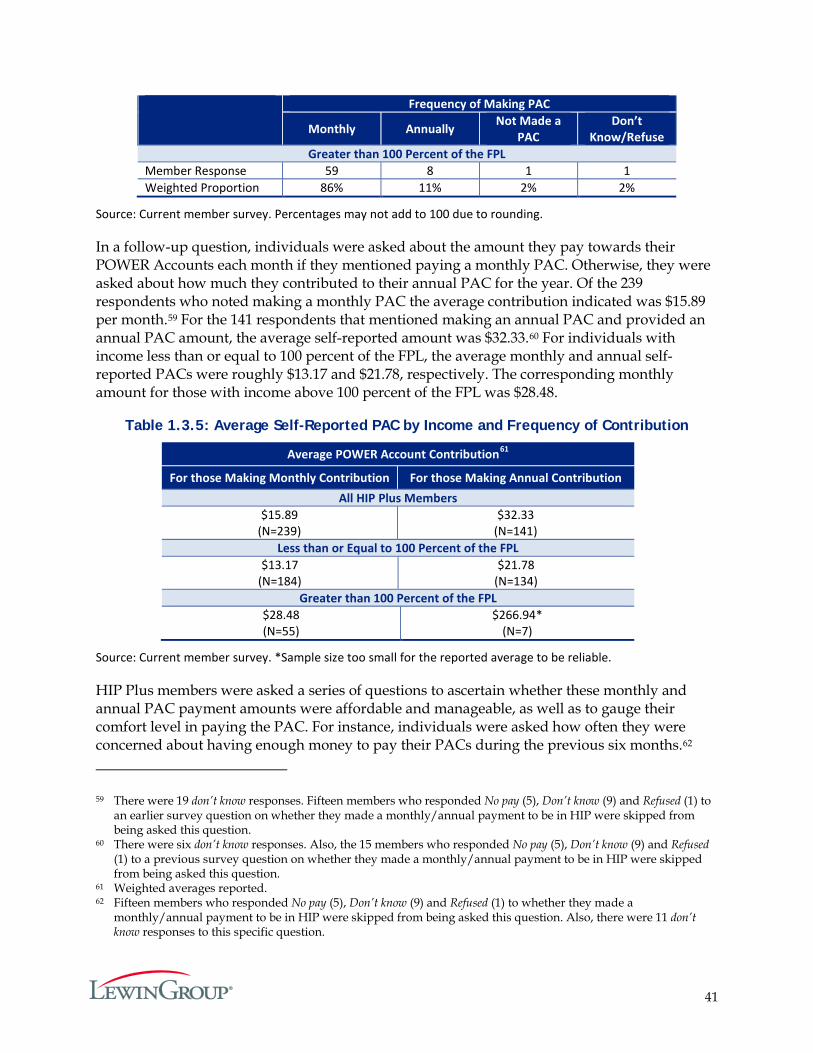
41
Frequency of Making PAC
Monthly Annually Not Made a PAC
Don’t Know/Refuse
Greater than 100 Percent of the FPL Member Response 59 8 1 1 Weighted Proportion 86% 11% 2% 2%
Source: Current member survey. Percentages may not add to 100 due to rounding.
In a follow-up question, individuals were asked about the amount they pay towards their POWER Accounts each month if they mentioned paying a monthly PAC. Otherwise, they were asked about how much they contributed to their annual PAC for the year. Of the 239 respondents who noted making a monthly PAC the average contribution indicated was $15.89 per month.59 For the 141 respondents that mentioned making an annual PAC and provided an annual PAC amount, the average self-reported amount was $32.33.60 For individuals with income less than or equal to 100 percent of the FPL, the average monthly and annual self-reported PACs were roughly $13.17 and $21.78, respectively. The corresponding monthly amount for those with income above 100 percent of the FPL was $28.48.
Table 1.3.5: Average Self-Reported PAC by Income and Frequency of Contribution
Average POWER Account Contribution61
For those Making Monthly Contribution For those Making Annual Contribution All HIP Plus Members
$15.89 (N=239)
$32.33 (N=141)
Less than or Equal to 100 Percent of the FPL $13.17
(N=184) $21.78
(N=134) Greater than 100 Percent of the FPL
$28.48 (N=55)
$266.94* (N=7)
Source: Current member survey. *Sample size too small for the reported average to be reliable.
HIP Plus members were asked a series of questions to ascertain whether these monthly and annual PAC payment amounts were affordable and manageable, as well as to gauge their comfort level in paying the PAC. For instance, individuals were asked how often they were concerned about having enough money to pay their PACs during the previous six months.62
59 There were 19 don’t know responses. Fifteen members who responded No pay (5), Don’t know (9) and Refused (1) to an earlier survey question on whether they made a monthly/annual payment to be in HIP were skipped from being asked this question.
60 There were six don’t know responses. Also, the 15 members who responded No pay (5), Don’t know (9) and Refused (1) to a previous survey question on whether they made a monthly/annual payment to be in HIP were skipped from being asked this question.
61 Weighted averages reported. 62 Fifteen members who responded No pay (5), Don’t know (9) and Refused (1) to whether they made a
monthly/annual payment to be in HIP were skipped from being asked this question. Also, there were 11 don’t know responses to this specific question.
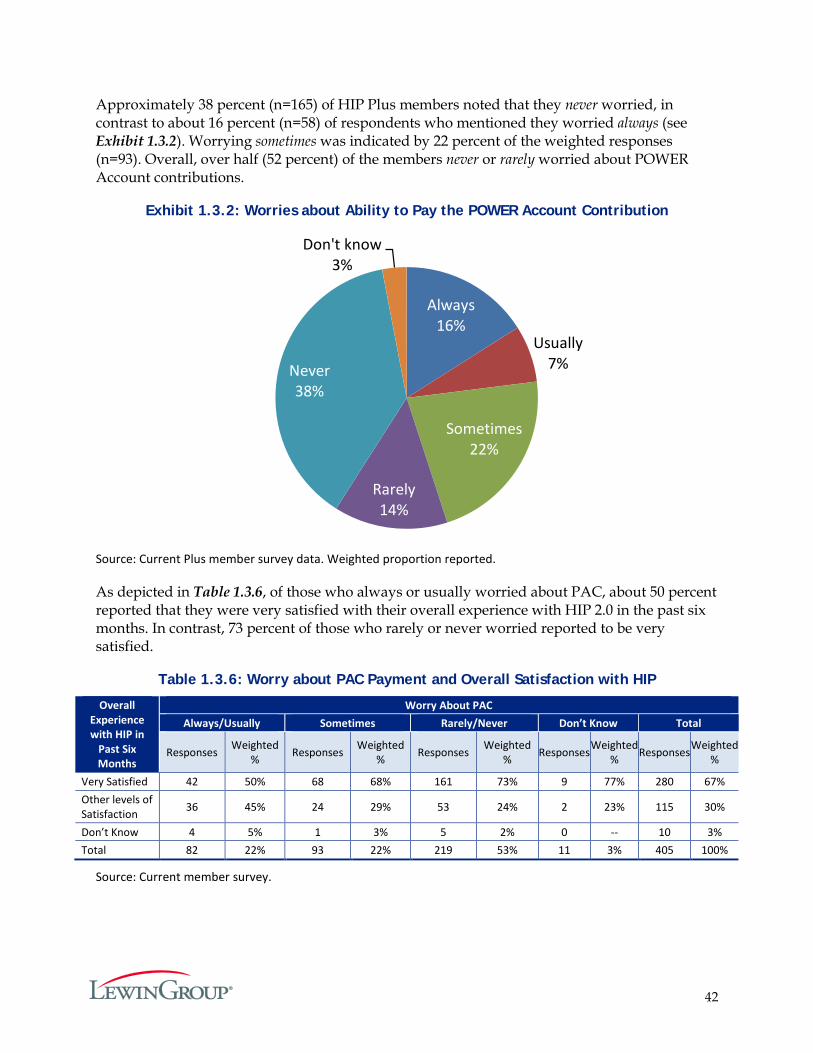
42
Approximately 38 percent (n=165) of HIP Plus members noted that they never worried, in contrast to about 16 percent (n=58) of respondents who mentioned they worried always (see Exhibit 1.3.2). Worrying sometimes was indicated by 22 percent of the weighted responses (n=93). Overall, over half (52 percent) of the members never or rarely worried about POWER Account contributions.
Exhibit 1.3.2: Worries about Ability to Pay the POWER Account Contribution
Source: Current Plus member survey data. Weighted proportion reported.
As depicted in Table 1.3.6, of those who always or usually worried about PAC, about 50 percent reported that they were very satisfied with their overall experience with HIP 2.0 in the past six months. In contrast, 73 percent of those who rarely or never worried reported to be very satisfied.
Table 1.3.6: Worry about PAC Payment and Overall Satisfaction with HIP
Overall Experience with HIP in
Past Six Months
Worry About PAC Always/Usually Sometimes Rarely/Never Don’t Know Total
Responses Weighted % Responses Weighted
% Responses Weighted % Responses Weighted
% Responses Weighted %
Very Satisfied 42 50% 68 68% 161 73% 9 77% 280 67% Other levels of Satisfaction 36 45% 24 29% 53 24% 2 23% 115 30%
Don’t Know 4 5% 1 3% 5 2% 0 -- 10 3% Total 82 22% 93 22% 219 53% 11 3% 405 100%
Source: Current member survey.
Always16%
Usually7%
Sometimes22%
Rarely14%
Never38%
Don't know3%
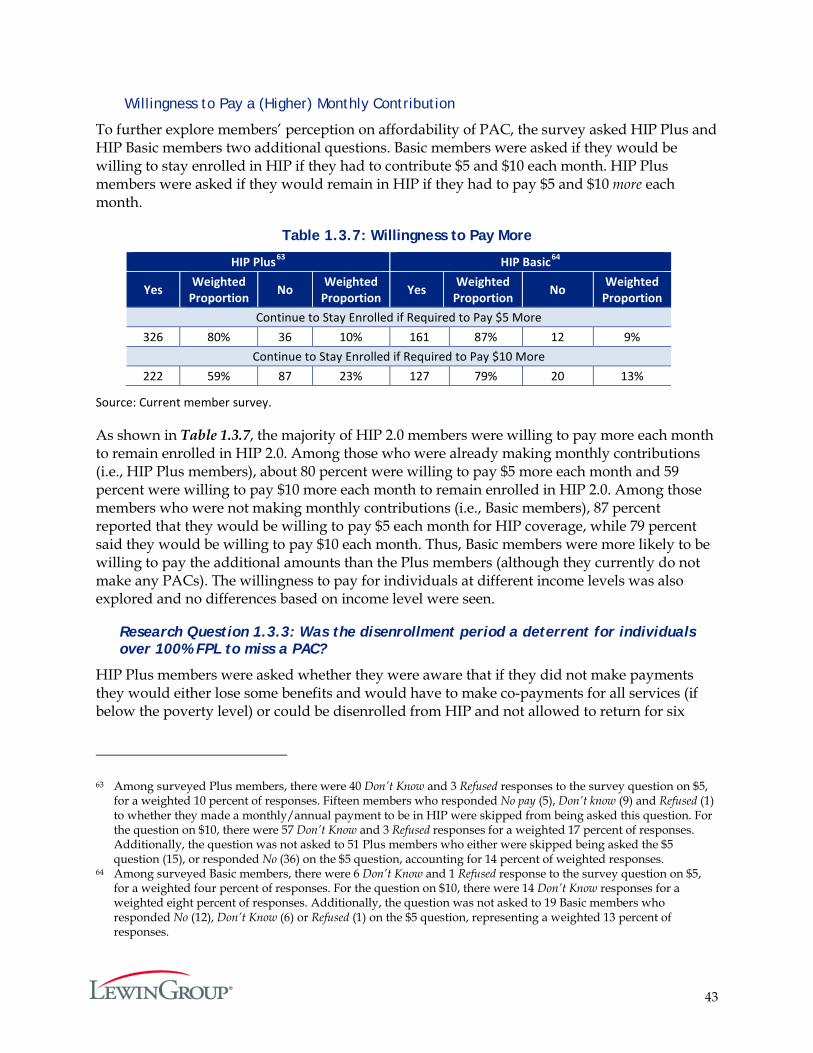
43
Willingness to Pay a (Higher) Monthly Contribution
To further explore members’ perception on affordability of PAC, the survey asked HIP Plus and HIP Basic members two additional questions. Basic members were asked if they would be willing to stay enrolled in HIP if they had to contribute $5 and $10 each month. HIP Plus members were asked if they would remain in HIP if they had to pay $5 and $10 more each month.
Table 1.3.7: Willingness to Pay More
HIP Plus63 HIP Basic64
Yes Weighted Proportion No Weighted
Proportion Yes Weighted Proportion No Weighted
Proportion Continue to Stay Enrolled if Required to Pay $5 More
326 80% 36 10% 161 87% 12 9% Continue to Stay Enrolled if Required to Pay $10 More
222 59% 87 23% 127 79% 20 13%
Source: Current member survey.
As shown in Table 1.3.7, the majority of HIP 2.0 members were willing to pay more each month to remain enrolled in HIP 2.0. Among those who were already making monthly contributions (i.e., HIP Plus members), about 80 percent were willing to pay $5 more each month and 59 percent were willing to pay $10 more each month to remain enrolled in HIP 2.0. Among those members who were not making monthly contributions (i.e., Basic members), 87 percent reported that they would be willing to pay $5 each month for HIP coverage, while 79 percent said they would be willing to pay $10 each month. Thus, Basic members were more likely to be willing to pay the additional amounts than the Plus members (although they currently do not make any PACs). The willingness to pay for individuals at different income levels was also explored and no differences based on income level were seen.
Research Question 1.3.3: Was the disenrollment period a deterrent for individuals over 100% FPL to miss a PAC?
HIP Plus members were asked whether they were aware that if they did not make payments they would either lose some benefits and would have to make co-payments for all services (if below the poverty level) or could be disenrolled from HIP and not allowed to return for six
63 Among surveyed Plus members, there were 40 Don’t Know and 3 Refused responses to the survey question on $5, for a weighted 10 percent of responses. Fifteen members who responded No pay (5), Don’t know (9) and Refused (1) to whether they made a monthly/annual payment to be in HIP were skipped from being asked this question. For the question on $10, there were 57 Don’t Know and 3 Refused responses for a weighted 17 percent of responses. Additionally, the question was not asked to 51 Plus members who either were skipped being asked the $5 question (15), or responded No (36) on the $5 question, accounting for 14 percent of weighted responses.
64 Among surveyed Basic members, there were 6 Don’t Know and 1 Refused response to the survey question on $5, for a weighted four percent of responses. For the question on $10, there were 14 Don’t Know responses for a weighted eight percent of responses. Additionally, the question was not asked to 19 Basic members who responded No (12), Don’t Know (6) or Refused (1) on the $5 question, representing a weighted 13 percent of responses.
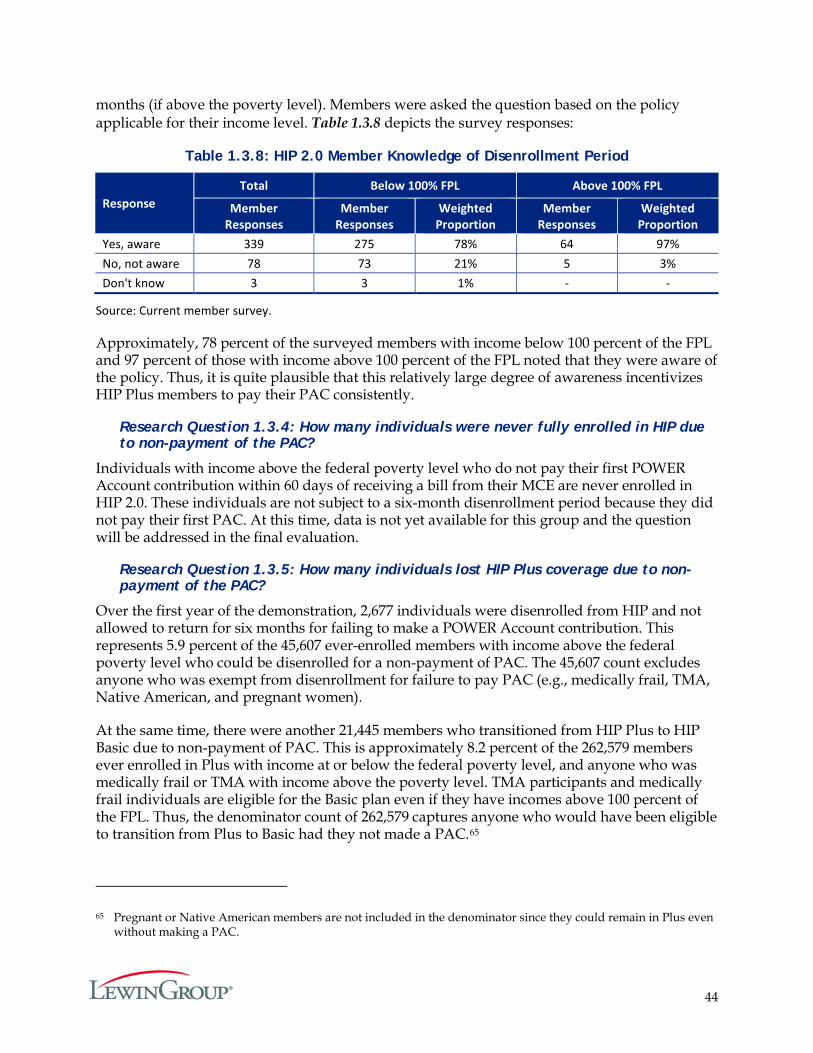
44
months (if above the poverty level). Members were asked the question based on the policy applicable for their income level. Table 1.3.8 depicts the survey responses:
Table 1.3.8: HIP 2.0 Member Knowledge of Disenrollment Period
Response Total Below 100% FPL Above 100% FPL
Member Responses
Member Responses
Weighted Proportion
Member Responses
Weighted Proportion
Yes, aware 339 275 78% 64 97% No, not aware 78 73 21% 5 3% Don't know 3 3 1% - -
Source: Current member survey.
Approximately, 78 percent of the surveyed members with income below 100 percent of the FPL and 97 percent of those with income above 100 percent of the FPL noted that they were aware of the policy. Thus, it is quite plausible that this relatively large degree of awareness incentivizes HIP Plus members to pay their PAC consistently.
Research Question 1.3.4: How many individuals were never fully enrolled in HIP due to non-payment of the PAC?
Individuals with income above the federal poverty level who do not pay their first POWER Account contribution within 60 days of receiving a bill from their MCE are never enrolled in HIP 2.0. These individuals are not subject to a six-month disenrollment period because they did not pay their first PAC. At this time, data is not yet available for this group and the question will be addressed in the final evaluation.
Research Question 1.3.5: How many individuals lost HIP Plus coverage due to non-payment of the PAC?
Over the first year of the demonstration, 2,677 individuals were disenrolled from HIP and not allowed to return for six months for failing to make a POWER Account contribution. This represents 5.9 percent of the 45,607 ever-enrolled members with income above the federal poverty level who could be disenrolled for a non-payment of PAC. The 45,607 count excludes anyone who was exempt from disenrollment for failure to pay PAC (e.g., medically frail, TMA, Native American, and pregnant women).
At the same time, there were another 21,445 members who transitioned from HIP Plus to HIP Basic due to non-payment of PAC. This is approximately 8.2 percent of the 262,579 members ever enrolled in Plus with income at or below the federal poverty level, and anyone who was medically frail or TMA with income above the poverty level. TMA participants and medically frail individuals are eligible for the Basic plan even if they have incomes above 100 percent of the FPL. Thus, the denominator count of 262,579 captures anyone who would have been eligible to transition from Plus to Basic had they not made a PAC.65
65 Pregnant or Native American members are not included in the denominator since they could remain in Plus even without making a PAC.
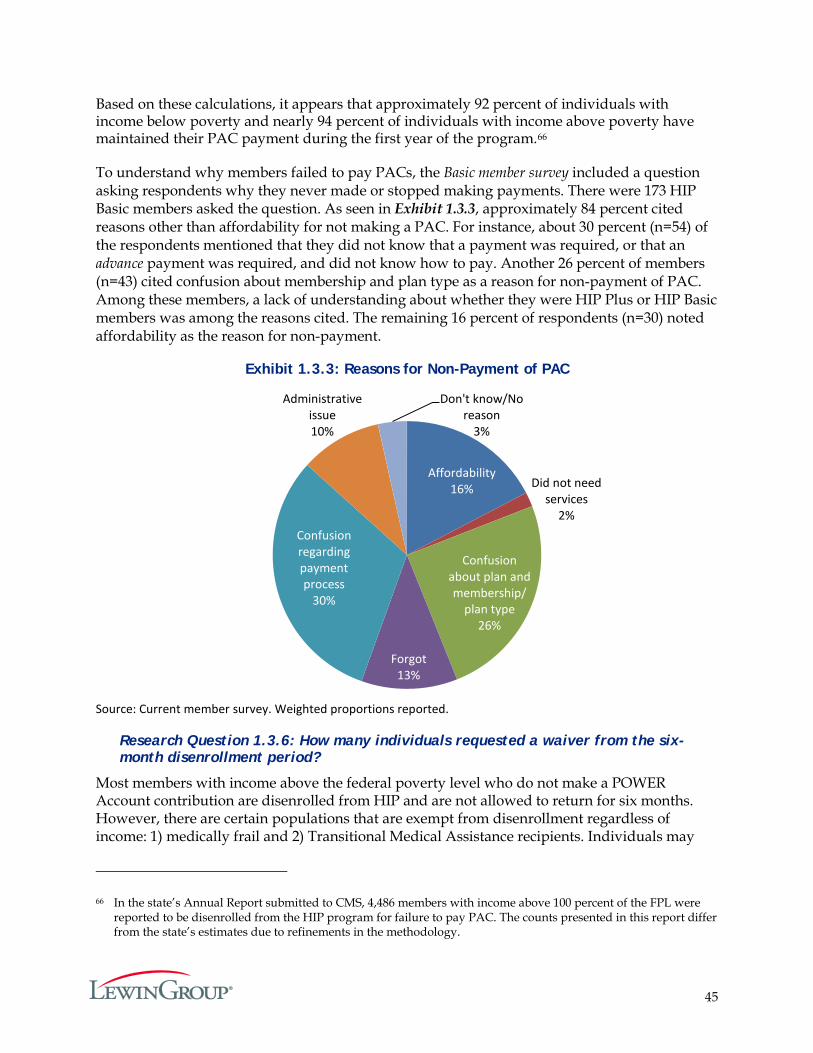
45
Based on these calculations, it appears that approximately 92 percent of individuals with income below poverty and nearly 94 percent of individuals with income above poverty have maintained their PAC payment during the first year of the program.66
To understand why members failed to pay PACs, the Basic member survey included a question asking respondents why they never made or stopped making payments. There were 173 HIP Basic members asked the question. As seen in Exhibit 1.3.3, approximately 84 percent cited reasons other than affordability for not making a PAC. For instance, about 30 percent (n=54) of the respondents mentioned that they did not know that a payment was required, or that an advance payment was required, and did not know how to pay. Another 26 percent of members (n=43) cited confusion about membership and plan type as a reason for non-payment of PAC. Among these members, a lack of understanding about whether they were HIP Plus or HIP Basic members was among the reasons cited. The remaining 16 percent of respondents (n=30) noted affordability as the reason for non-payment.
Exhibit 1.3.3: Reasons for Non-Payment of PAC
Source: Current member survey. Weighted proportions reported.
Research Question 1.3.6: How many individuals requested a waiver from the six-month disenrollment period?
Most members with income above the federal poverty level who do not make a POWER Account contribution are disenrolled from HIP and are not allowed to return for six months. However, there are certain populations that are exempt from disenrollment regardless of income: 1) medically frail and 2) Transitional Medical Assistance recipients. Individuals may
66 In the state’s Annual Report submitted to CMS, 4,486 members with income above 100 percent of the FPL were reported to be disenrolled from the HIP program for failure to pay PAC. The counts presented in this report differ from the state’s estimates due to refinements in the methodology.
Affordability 16% Did not need
services 2%
Confusion about plan and membership/
plan type26%
Forgot 13%
Confusion regarding payment process
30%
Administrative issue 10%
Don't know/No reason
3%
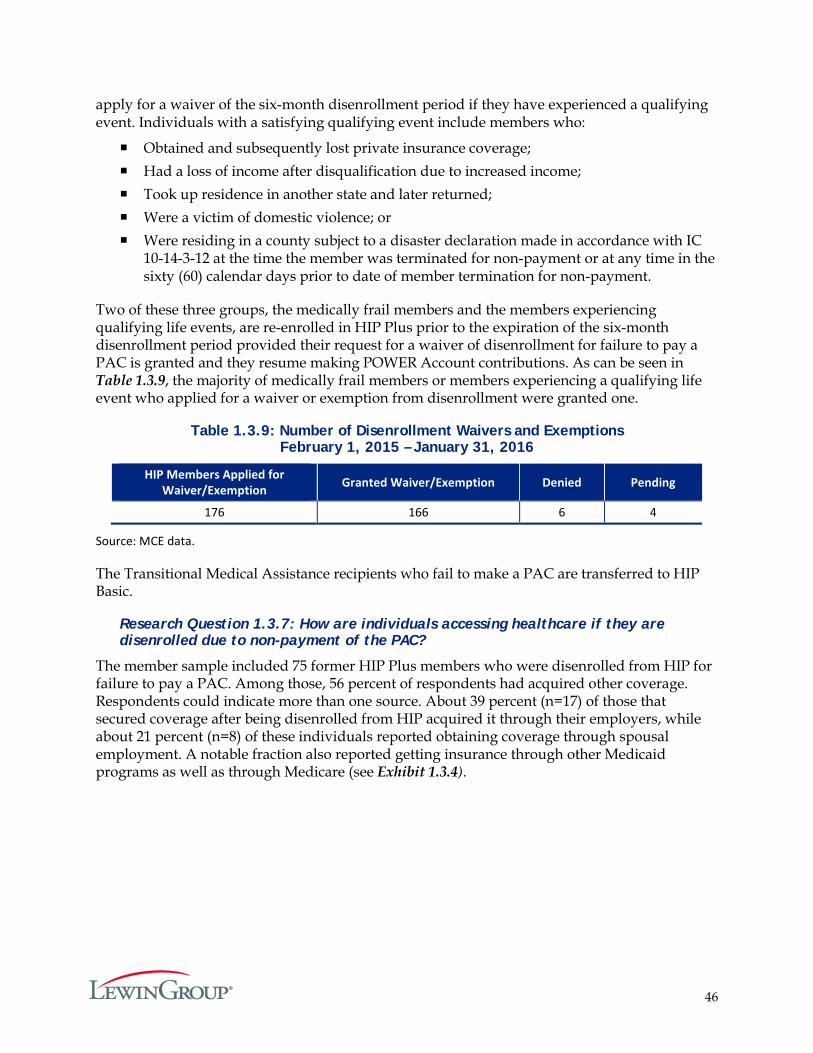
46
apply for a waiver of the six-month disenrollment period if they have experienced a qualifying event. Individuals with a satisfying qualifying event include members who:
Obtained and subsequently lost private insurance coverage; Had a loss of income after disqualification due to increased income; Took up residence in another state and later returned; Were a victim of domestic violence; or Were residing in a county subject to a disaster declaration made in accordance with IC
10-14-3-12 at the time the member was terminated for non-payment or at any time in the sixty (60) calendar days prior to date of member termination for non-payment.
Two of these three groups, the medically frail members and the members experiencing qualifying life events, are re-enrolled in HIP Plus prior to the expiration of the six-month disenrollment period provided their request for a waiver of disenrollment for failure to pay a PAC is granted and they resume making POWER Account contributions. As can be seen in Table 1.3.9, the majority of medically frail members or members experiencing a qualifying life event who applied for a waiver or exemption from disenrollment were granted one.
Table 1.3.9: Number of Disenrollment Waivers and Exemptions February 1, 2015 – January 31, 2016
HIP Members Applied for Waiver/Exemption Granted Waiver/Exemption Denied Pending
176 166 6 4
Source: MCE data.
The Transitional Medical Assistance recipients who fail to make a PAC are transferred to HIP Basic.
Research Question 1.3.7: How are individuals accessing healthcare if they are disenrolled due to non-payment of the PAC?
The member sample included 75 former HIP Plus members who were disenrolled from HIP for failure to pay a PAC. Among those, 56 percent of respondents had acquired other coverage. Respondents could indicate more than one source. About 39 percent (n=17) of those that secured coverage after being disenrolled from HIP acquired it through their employers, while about 21 percent (n=8) of these individuals reported obtaining coverage through spousal employment. A notable fraction also reported getting insurance through other Medicaid programs as well as through Medicare (see Exhibit 1.3.4).
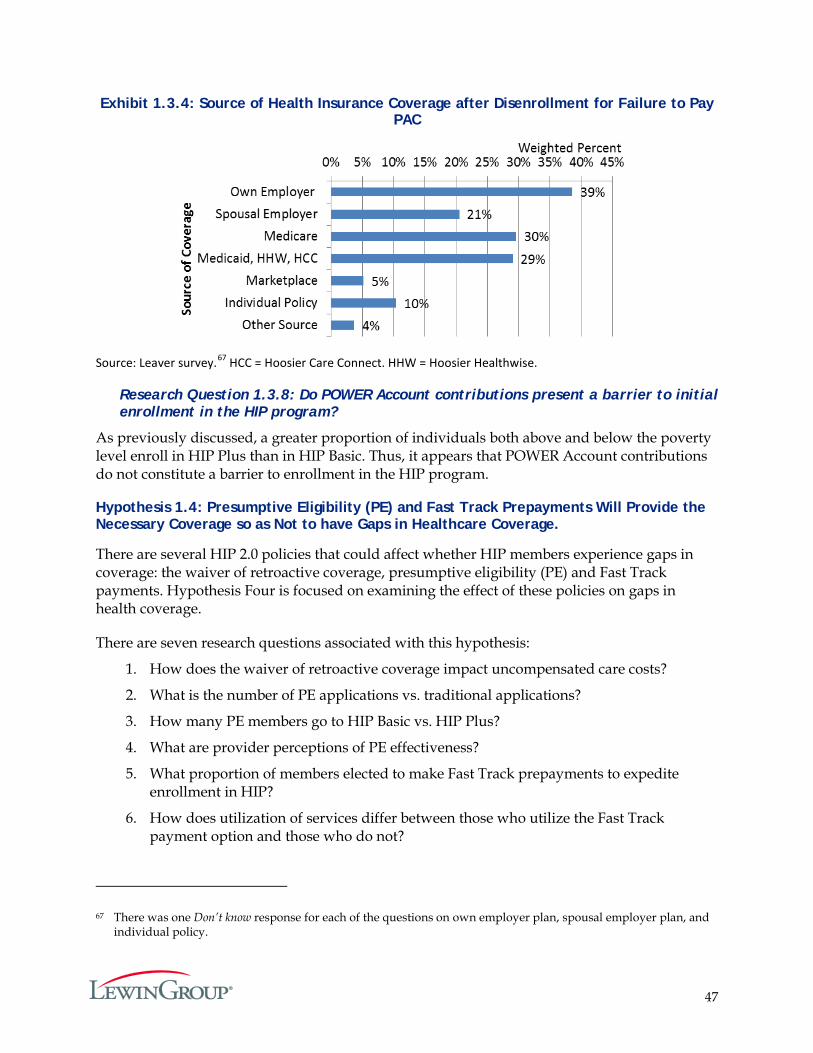
47
Exhibit 1.3.4: Source of Health Insurance Coverage after Disenrollment for Failure to Pay PAC
Source: Leaver survey.67 HCC = Hoosier Care Connect. HHW = Hoosier Healthwise.
Research Question 1.3.8: Do POWER Account contributions present a barrier to initial enrollment in the HIP program?
As previously discussed, a greater proportion of individuals both above and below the poverty level enroll in HIP Plus than in HIP Basic. Thus, it appears that POWER Account contributions do not constitute a barrier to enrollment in the HIP program.
Hypothesis 1.4: Presumptive Eligibility (PE) and Fast Track Prepayments Will Provide the Necessary Coverage so as Not to have Gaps in Healthcare Coverage.
There are several HIP 2.0 policies that could affect whether HIP members experience gaps in coverage: the waiver of retroactive coverage, presumptive eligibility (PE) and Fast Track payments. Hypothesis Four is focused on examining the effect of these policies on gaps in health coverage.
There are seven research questions associated with this hypothesis:
1. How does the waiver of retroactive coverage impact uncompensated care costs?
2. What is the number of PE applications vs. traditional applications?
3. How many PE members go to HIP Basic vs. HIP Plus?
4. What are provider perceptions of PE effectiveness?
5. What proportion of members elected to make Fast Track prepayments to expedite enrollment in HIP?
6. How does utilization of services differ between those who utilize the Fast Track payment option and those who do not?
67 There was one Don’t know response for each of the questions on own employer plan, spousal employer plan, and individual policy.
48
7. How many members are taking advantage of other policies that help prevent gaps in coverage, e.g. ex-parte determinations and prepopulated renewal forms?
To respond to the first research question, an analysis of the effect of the retroactive coverage waiver was completed. In the five subsequent research questions, HIP 2.0 policies aimed at reducing gaps in coverage are examined: PE in research questions two through four and Fast Track payments in research questions five and six. Each of these policies are described in detail below.
Presumptive Eligibility for HIP
PE allows qualified healthcare providers to screen for eligibility based on gross income and temporarily enroll individuals meeting thresholds in coverage. Individuals determined eligible through PE receive immediate access to healthcare coverage. The coverage lasts up to 60 days during which time individuals are expected to submit a full application. In the past, PE has been limited to select eligibility groups, such as pregnant women and children. The Affordable Care Act (ACA) required that PE be extended to adults, and expanded the role of hospitals in determining eligibility presumptively.
In 2014, Indiana opened enrollment for acute care hospitals interested in becoming ‘Qualified Providers’ – providers qualified to make PE determinations.68 Indiana also introduced a new aid category – ‘HPE Adult’ – that allows hospitals and certain providers to determine adults PE for HIP (PE was previously limited to pregnant women, infants, children, low-income parents and caretakers, former foster children, and individuals seeking family planning services). Individuals are only eligible for one PE period in a 12-month span. Individuals who are conditionally approved for HIP (i.e. members who have been determined eligible for HIP but have not made their first PAC) are not eligible for PE.
To assess whether an individual is presumptively eligible, designees from qualified PE entities work with individuals to complete an electronic Hospital Presumptive Eligibility (HPE) application that includes questions about the applicant’s identity, family size, and household income. Applicant responses are self-attested and providers are not permitted to ask for supporting documentation to verify the applicants’ eligibility.69 Enrollment is available 24 hours a day, seven days a week and there is a real-time response as to whether the individual is eligible. If determined eligible, HPE coverage begins the day that the provider determined the individual presumptively eligible.
Under HIP 2.0, HPE individuals receive HIP Basic coverage through an MCE. Members can choose an MCE or are automatically assigned to one. The PE Basic plan covers all benefits that
68 Enrollment opened for free-standing psychiatric hospitals, federally qualified health centers, rural health centers, community mental health centers, and local county health departments on April 1, 2015. See Presumptive Eligibility Web inter Change Training. (February 2015.) Available from http://provider.indianamedicaid.com/media/136435/presumptive%20eligibility%20web%20interchange%20training.pdf
69 Hospital Presumptive Eligibility Qualified Provider Manual. (2016, February 1). Retrieved February 22, 2016, from http://provider.indianamedicaid.com/ihcp/manuals/Hospital Presumptive Eligibility Qualified Provider Manual.pdf
49
the Basic plan covers; like non-PE HIP Basic, it does not cover dental or vision and requires co-pays for most services. HPE members do not have POWER Accounts.
Once an individual is assigned to an MCE, he/she is sent an invoice and is given the opportunity to make a Fast Track payment (described below) that would apply to their full Indiana Health Coverage Programs (IHCP) application. An HPE adult has until the end of the second month after approval for HPE to submit his/her full HIP application. After submitting an application, the individual continues to receive HPE coverage until an eligibility determination is made. If the application is denied, coverage ends the day after the denial is processed. If approved, PE coverage ends when HIP coverage begins, without a gap in coverage. For members who make a PAC, HIP Plus coverage begins the first of the month following the month in which the PAC was made, or the month in which the individual is found eligible, whichever is later. For individuals below 100 percent of the FPL who do not make a PAC, HIP Basic coverage begins the first of the month following the expiration of their payment period. Individuals above 100 percent of the FPL who do not make a PAC do not have continued coverage.
Fast Track Payments
Under HIP 2.0, HIP Plus coverage begins the first day of the month in which an individual makes their POWER Account contribution. If an individual’s income is above 100 percent of the FPL and does not make a POWER Account contribution within the 60-day deadline, the individual is not enrolled in coverage.70 If the individual’s income is below 100 percent of the FPL and does not make a PAC, he/she is placed into HIP Basic coverage, effective the first of the month in which the 60-day payment period ends.
For example, assume an individual receives her bill from her MCE on March 15, 2015. If she makes a PAC any day before March 31, 2015, her coverage will be effective March 1, 2015. If she does not make a payment within 60 days of March 15, 2015 (by May 15, 2015), and is under 100 percent of the FPL, her Basic coverage will begin May 1, 2015. If she does not make a payment within 60 days of March 15, 2015 (by May 15, 2015), and is above 100 percent of the FPL, she does not receive coverage.71
In April 2015, HIP 2.0 established a way for eligible HIP members to speed up this process – called Fast Track payments – which enables members to expedite the start of their coverage. Fast Track allows individuals to make a $10 payment at the time of application, after applying, or while the application is being processed.
70 The “60 day clock” starts the day the members receives a bill from his/her MCE. Also, if the individual previously made a PAC payment and is above 100 percent of the FPL, and fails to make a PAC, he/she will be disenrolled from HIP for six months. In other words, individuals above 100 percent of the FPL who make a payment and then stop making payments are disenrolled, whereas individuals above 100 percent of the FPL who never make a payment are not subject to disenrollment because they never effectuate their coverage.
71 Individuals who do not make their first PAC payment are not subject to the disenrollment period but must reapply to gain coverage.
50
Individuals can make the optional payment online via credit card during the application process. Individuals who do not apply online (or choose not to make a Fast Track payment when applying), are sent a Fast Track invoice from the MCE they selected.
The $10 payment is applied towards the member’s first POWER Account contribution. If the individual is not found eligible for HIP, the state will refund the payment. If a member makes a Fast Track payment and is determined eligible for HIP, his/her HIP Plus coverage begins the first of the month in which he/she made the Fast Track payment. If the member’s POWER Account contribution amount is less than $10 per month, the $10 payment is applied to their first coverage month, with the remaining amount applied to future months.
Passive Verification Renewal Process
HIP 2.0 members must have their eligibility reassessed and their coverage renewed on an annual basis. In accordance with the ACA and accompanying federal regulations, Indiana introduced a simpler process for Medicaid renewals that uses electronic data sources for verification rather than relying on the member to provide verification. Under the new procedures, redeterminations for certain eligibility categories (called ‘Assistance Groups’) are conducted through an automated batch process. The batch process runs during the first week of the month to process the eligibility categories that are due for redetermination in the following month.
The state then determines if the selected members qualify for automated redetermination. To qualify for automated redetermination, enough income and other data must exist for the state to be able to make a renewal determination. The members who are verified as eligible through automated redetermination will be renewed, and will be mailed a renewal notice. Members who are not verified as eligible or did not qualify for automated redetermination will retain their current redetermination date, and will be mailed a redetermination packet with a pre-populated re-enrollment form that the member must complete and return to remain enrolled in HIP. Once a member returns the form, the Division of Family Resources (DFR) will review his/her information and make a new eligibility determination.72
Because HIP eligibility lasts for one year (unless a verified income change occurs), there are no HIP redeterminations to report for the first demonstration year.73 Indiana began running the batch process described above in November 2015 for the first round of redeterminations for individuals whose eligibility ended on January 31, 2016. The results of this first round of redeterminations and subsequent rounds will be included in the Final Evaluation Report.
72 DFR also assesses eligibility for other Medicaid eligibility categories. Source: Healthy Indiana Plan 2.0: Enrollment, Redetermination, and Conversion. Retrieved March 2, 2016, from http://www.in.gov/idoi/files/HIP_2_0_Training_-_Enrollment_Redetermination_and_Conversion_-_1_21_15.pdf
73 For individuals who transitioned into HIP, their annual benefit period restarted with the beginning of HIP 2.0 in February 2015.
51
Research Question 1.4.1: How does the waiver of retroactive coverage impact uncompensated care costs?
As described above, HIP 2.0 does not provide retroactive coverage for most HIP members, with the exception of a limited program for certain Section 1931 parents and caretaker relatives. Section 1931 HIP members are eligible for retroactive coverage if they meet the following criteria:
Are new applicants, were not covered through HIP or Medicaid within the past two years,74 or experienced a qualifying life event;
Did not gain coverage through presumptive eligibility;
Received medical care within the 90 days prior to the effective date of eligibility; and
Submitted for reimbursement within 90 days of the individual’s receipt of the bill for such care.
Costs for this population receiving retroactive coverage are reported separately by the state, in the ‘Prior Claims Payment Program Report,’ submitted to CMS on October 27, 2015.75 This report, focuses on costs for the HIP population not receiving retroactive coverage.
Provider Perceptions Concerning Cost of Uncompensated Care
Uncompensated care refers to care provided for which no payment was received from the patient or from an insurer. It is comprised of two categories:
1. Charity Care: care that hospitals or doctors provide at no cost because the patient meets certain criteria, e.g. low-income, few assets; and
2. Bad Debt: bills that a provider is unable to obtain reimbursement for because a patient is either unable or unwilling to pay.
To understand provider perceptions of the cost of uncompensated care under HIP 2.0, the provider survey – administered in December 2015 and January 2016 – asked a series of questions about these two components of uncompensated care. Specifically, the survey, included in Appendix F, asked providers whether, since HIP 2.0 started in February 2015, they had seen a decline in a) the number of patients without insurance; b) the number of requests for charity care cases that the practice receives; and c) the instances of bad debt. It is important to note that the survey question does not specifically refer to changes brought about by HIP 2.0, but rather changes occurring since HIP 2.0 started. For this reason, provider perceptions of changes in charity care/ bad debt could reflect other, concurrent developments in the Indiana healthcare system unrelated to HIP 2.0.
74 Members residing in a domestic violence shelter or in a state declared disaster area are not subject to the two year stipulation. Source: MHS Member Handbook. Retrieved June 2, 2016 from http://www.mhsindiana.com/files/2013/03/HHW-HIP-Member-Handbook-July-2015-EN.pdf
75 Prior Claims Payment Program Report. (2015, October 27). Retrieved June 6, 2016 from https://www.medicaid.gov/Medicaid-CHIP-Program-Information/By-Topics/Waivers/1115/downloads/in/Healthy-Indiana-Plan-2/in-healthy-indiana-plan-support-20-prior-claims-pymt-rpt-10272015.pdf.
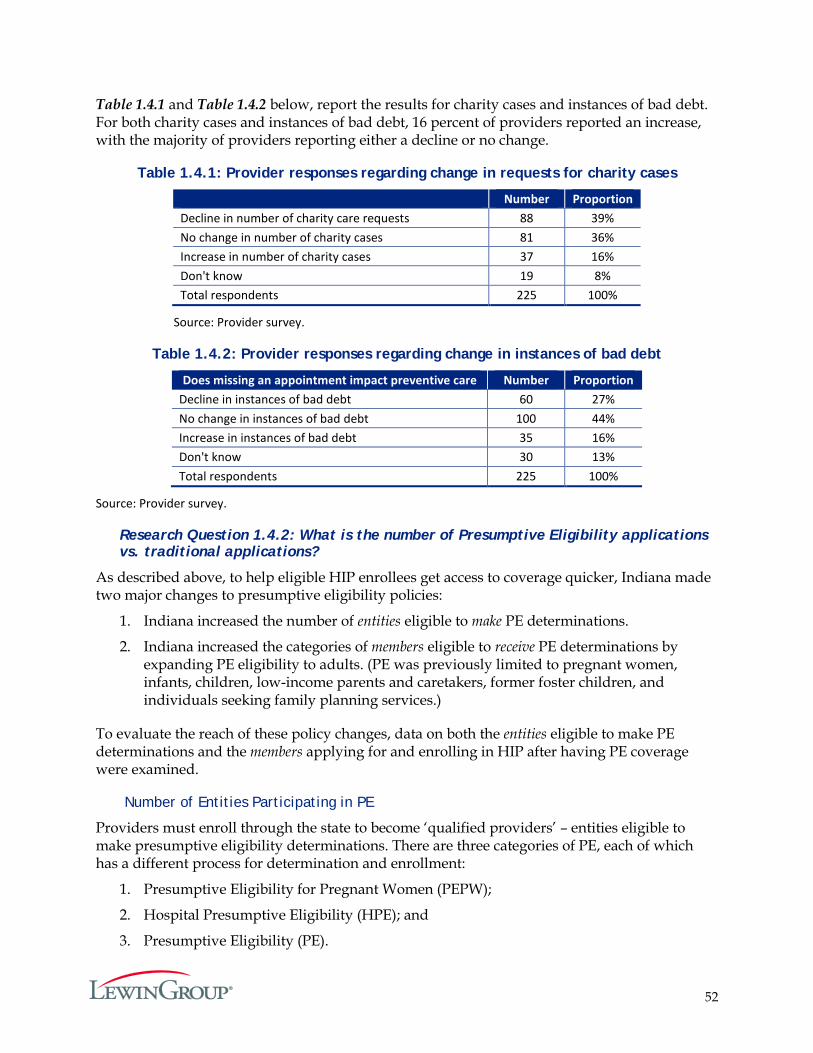
52
Table 1.4.1 and Table 1.4.2 below, report the results for charity cases and instances of bad debt. For both charity cases and instances of bad debt, 16 percent of providers reported an increase, with the majority of providers reporting either a decline or no change.
Table 1.4.1: Provider responses regarding change in requests for charity cases
Number Proportion
Decline in number of charity care requests 88 39% No change in number of charity cases 81 36% Increase in number of charity cases 37 16% Don't know 19 8% Total respondents 225 100%
Source: Provider survey.
Table 1.4.2: Provider responses regarding change in instances of bad debt
Does missing an appointment impact preventive care Number Proportion Decline in instances of bad debt 60 27% No change in instances of bad debt 100 44% Increase in instances of bad debt 35 16% Don't know 30 13% Total respondents 225 100%
Source: Provider survey.
Research Question 1.4.2: What is the number of Presumptive Eligibility applications vs. traditional applications?
As described above, to help eligible HIP enrollees get access to coverage quicker, Indiana made two major changes to presumptive eligibility policies:
1. Indiana increased the number of entities eligible to make PE determinations.
2. Indiana increased the categories of members eligible to receive PE determinations by expanding PE eligibility to adults. (PE was previously limited to pregnant women, infants, children, low-income parents and caretakers, former foster children, and individuals seeking family planning services.)
To evaluate the reach of these policy changes, data on both the entities eligible to make PE determinations and the members applying for and enrolling in HIP after having PE coverage were examined.
Number of Entities Participating in PE
Providers must enroll through the state to become ‘qualified providers’ – entities eligible to make presumptive eligibility determinations. There are three categories of PE, each of which has a different process for determination and enrollment:
1. Presumptive Eligibility for Pregnant Women (PEPW);
2. Hospital Presumptive Eligibility (HPE); and
3. Presumptive Eligibility (PE).
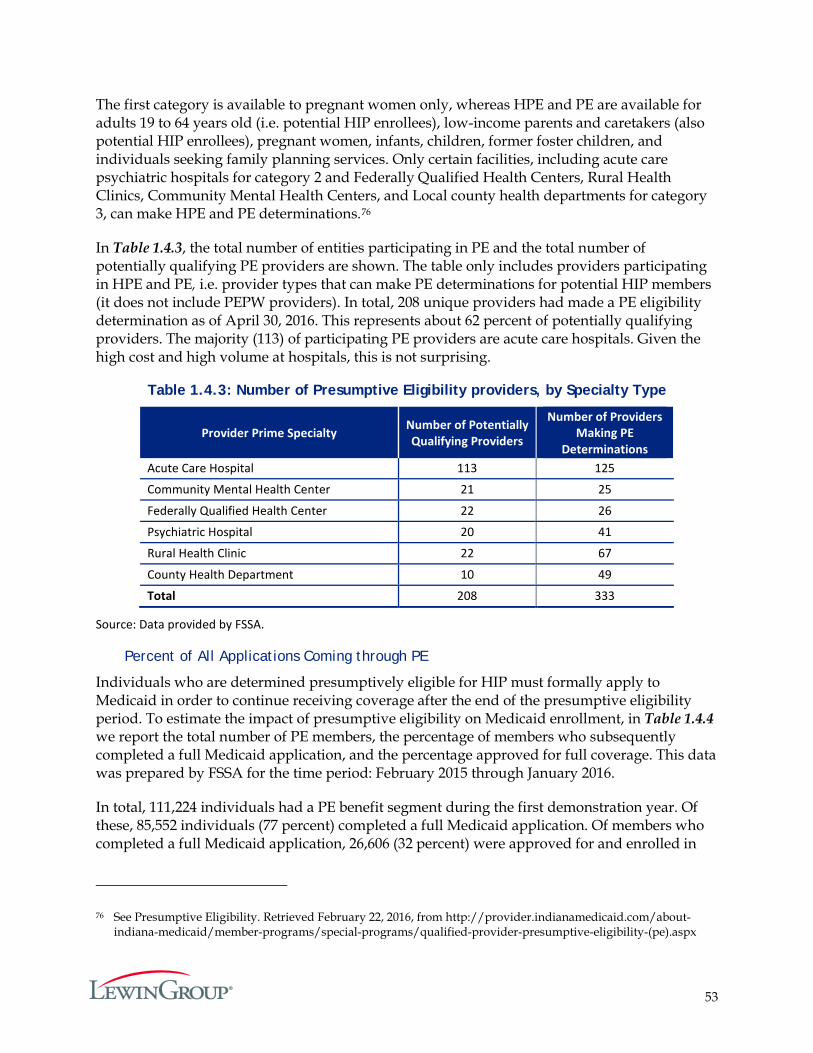
53
The first category is available to pregnant women only, whereas HPE and PE are available for adults 19 to 64 years old (i.e. potential HIP enrollees), low-income parents and caretakers (also potential HIP enrollees), pregnant women, infants, children, former foster children, and individuals seeking family planning services. Only certain facilities, including acute care psychiatric hospitals for category 2 and Federally Qualified Health Centers, Rural Health Clinics, Community Mental Health Centers, and Local county health departments for category 3, can make HPE and PE determinations.76
In Table 1.4.3, the total number of entities participating in PE and the total number of potentially qualifying PE providers are shown. The table only includes providers participating in HPE and PE, i.e. provider types that can make PE determinations for potential HIP members (it does not include PEPW providers). In total, 208 unique providers had made a PE eligibility determination as of April 30, 2016. This represents about 62 percent of potentially qualifying providers. The majority (113) of participating PE providers are acute care hospitals. Given the high cost and high volume at hospitals, this is not surprising.
Table 1.4.3: Number of Presumptive Eligibility providers, by Specialty Type
Provider Prime Specialty Number of Potentially Qualifying Providers
Number of Providers Making PE
Determinations Acute Care Hospital 113 125
Community Mental Health Center 21 25
Federally Qualified Health Center 22 26
Psychiatric Hospital 20 41
Rural Health Clinic 22 67
County Health Department 10 49
Total 208 333
Source: Data provided by FSSA.
Percent of All Applications Coming through PE
Individuals who are determined presumptively eligible for HIP must formally apply to Medicaid in order to continue receiving coverage after the end of the presumptive eligibility period. To estimate the impact of presumptive eligibility on Medicaid enrollment, in Table 1.4.4 we report the total number of PE members, the percentage of members who subsequently completed a full Medicaid application, and the percentage approved for full coverage. This data was prepared by FSSA for the time period: February 2015 through January 2016.
In total, 111,224 individuals had a PE benefit segment during the first demonstration year. Of these, 85,552 individuals (77 percent) completed a full Medicaid application. Of members who completed a full Medicaid application, 26,606 (32 percent) were approved for and enrolled in
76 See Presumptive Eligibility. Retrieved February 22, 2016, from http://provider.indianamedicaid.com/about-indiana-medicaid/member-programs/special-programs/qualified-provider-presumptive-eligibility-(pe).aspx
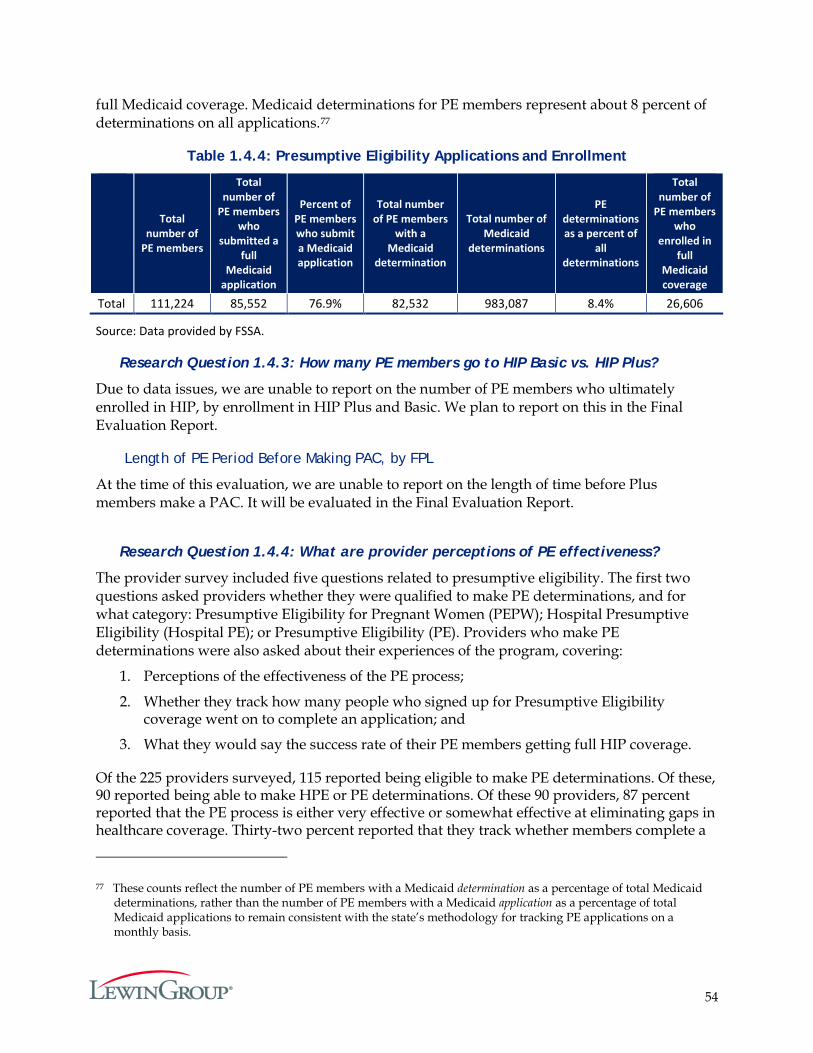
54
full Medicaid coverage. Medicaid determinations for PE members represent about 8 percent of determinations on all applications.77
Table 1.4.4: Presumptive Eligibility Applications and Enrollment
Total number of
PE members
Total number of
PE members who
submitted a full
Medicaid application
Percent of PE members who submit a Medicaid application
Total number of PE members
with a Medicaid
determination
Total number of Medicaid
determinations
PE determinations as a percent of
all determinations
Total number of
PE members who
enrolled in full
Medicaid coverage
Total 111,224 85,552 76.9% 82,532 983,087 8.4% 26,606
Source: Data provided by FSSA.
Research Question 1.4.3: How many PE members go to HIP Basic vs. HIP Plus?
Due to data issues, we are unable to report on the number of PE members who ultimately enrolled in HIP, by enrollment in HIP Plus and Basic. We plan to report on this in the Final Evaluation Report.
Length of PE Period Before Making PAC, by FPL
At the time of this evaluation, we are unable to report on the length of time before Plus members make a PAC. It will be evaluated in the Final Evaluation Report.
Research Question 1.4.4: What are provider perceptions of PE effectiveness?
The provider survey included five questions related to presumptive eligibility. The first two questions asked providers whether they were qualified to make PE determinations, and for what category: Presumptive Eligibility for Pregnant Women (PEPW); Hospital Presumptive Eligibility (Hospital PE); or Presumptive Eligibility (PE). Providers who make PE determinations were also asked about their experiences of the program, covering:
1. Perceptions of the effectiveness of the PE process;
2. Whether they track how many people who signed up for Presumptive Eligibility coverage went on to complete an application; and
3. What they would say the success rate of their PE members getting full HIP coverage.
Of the 225 providers surveyed, 115 reported being eligible to make PE determinations. Of these, 90 reported being able to make HPE or PE determinations. Of these 90 providers, 87 percent reported that the PE process is either very effective or somewhat effective at eliminating gaps in healthcare coverage. Thirty-two percent reported that they track whether members complete a
77 These counts reflect the number of PE members with a Medicaid determination as a percentage of total Medicaid determinations, rather than the number of PE members with a Medicaid application as a percentage of total Medicaid applications to remain consistent with the state’s methodology for tracking PE applications on a monthly basis.
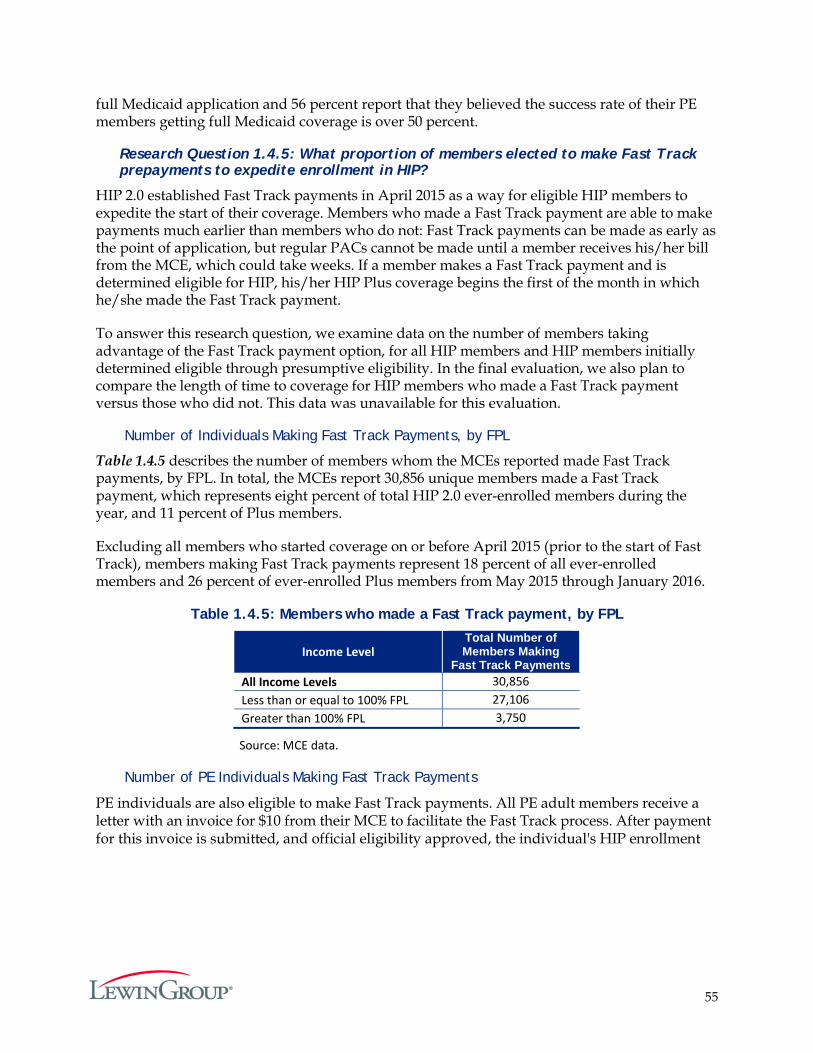
55
full Medicaid application and 56 percent report that they believed the success rate of their PE members getting full Medicaid coverage is over 50 percent.
Research Question 1.4.5: What proportion of members elected to make Fast Track prepayments to expedite enrollment in HIP?
HIP 2.0 established Fast Track payments in April 2015 as a way for eligible HIP members to expedite the start of their coverage. Members who made a Fast Track payment are able to make payments much earlier than members who do not: Fast Track payments can be made as early as the point of application, but regular PACs cannot be made until a member receives his/her bill from the MCE, which could take weeks. If a member makes a Fast Track payment and is determined eligible for HIP, his/her HIP Plus coverage begins the first of the month in which he/she made the Fast Track payment.
To answer this research question, we examine data on the number of members taking advantage of the Fast Track payment option, for all HIP members and HIP members initially determined eligible through presumptive eligibility. In the final evaluation, we also plan to compare the length of time to coverage for HIP members who made a Fast Track payment versus those who did not. This data was unavailable for this evaluation.
Number of Individuals Making Fast Track Payments, by FPL
Table 1.4.5 describes the number of members whom the MCEs reported made Fast Track payments, by FPL. In total, the MCEs report 30,856 unique members made a Fast Track payment, which represents eight percent of total HIP 2.0 ever-enrolled members during the year, and 11 percent of Plus members.
Excluding all members who started coverage on or before April 2015 (prior to the start of Fast Track), members making Fast Track payments represent 18 percent of all ever-enrolled members and 26 percent of ever-enrolled Plus members from May 2015 through January 2016.
Table 1.4.5: Members who made a Fast Track payment, by FPL
Income Level Total Number of Members Making
Fast Track Payments All Income Levels 30,856 Less than or equal to 100% FPL 27,106 Greater than 100% FPL 3,750
Source: MCE data.
Number of PE Individuals Making Fast Track Payments
PE individuals are also eligible to make Fast Track payments. All PE adult members receive a letter with an invoice for $10 from their MCE to facilitate the Fast Track process. After payment for this invoice is submitted, and official eligibility approved, the individual's HIP enrollment
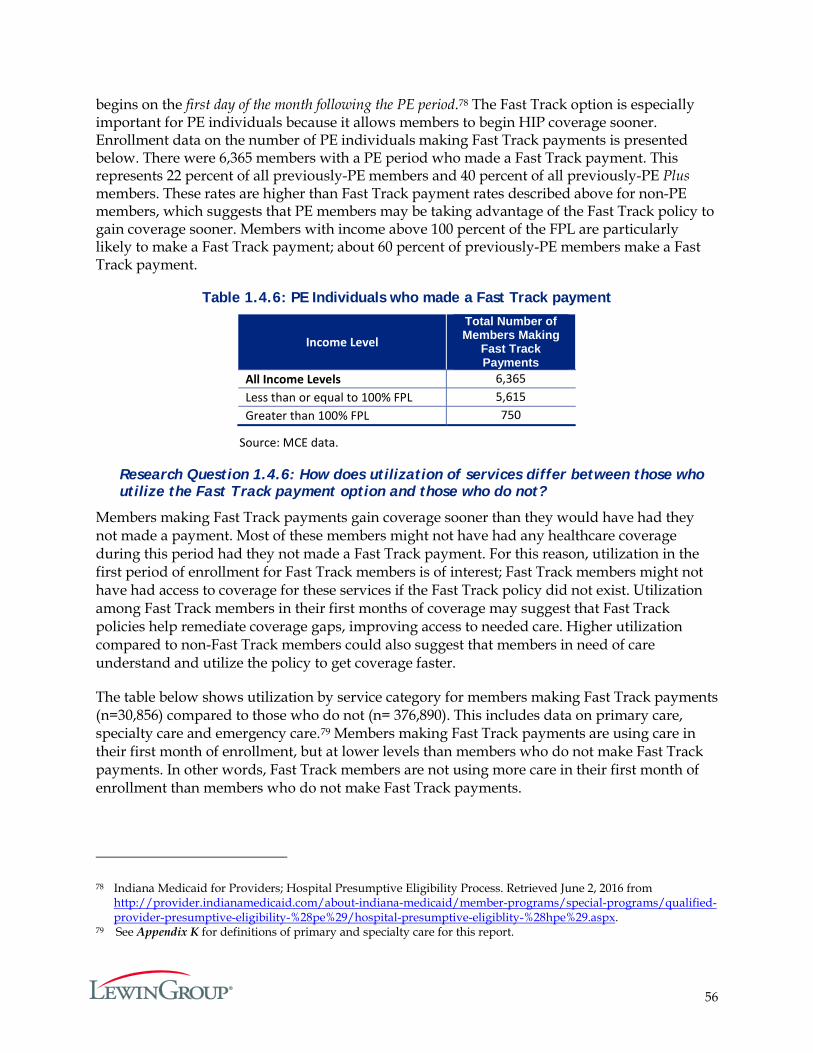
56
begins on the first day of the month following the PE period.78 The Fast Track option is especially important for PE individuals because it allows members to begin HIP coverage sooner. Enrollment data on the number of PE individuals making Fast Track payments is presented below. There were 6,365 members with a PE period who made a Fast Track payment. This represents 22 percent of all previously-PE members and 40 percent of all previously-PE Plus members. These rates are higher than Fast Track payment rates described above for non-PE members, which suggests that PE members may be taking advantage of the Fast Track policy to gain coverage sooner. Members with income above 100 percent of the FPL are particularly likely to make a Fast Track payment; about 60 percent of previously-PE members make a Fast Track payment.
Table 1.4.6: PE Individuals who made a Fast Track payment
Income Level
Total Number of Members Making
Fast Track Payments
All Income Levels 6,365 Less than or equal to 100% FPL 5,615 Greater than 100% FPL 750
Source: MCE data.
Research Question 1.4.6: How does utilization of services differ between those who utilize the Fast Track payment option and those who do not?
Members making Fast Track payments gain coverage sooner than they would have had they not made a payment. Most of these members might not have had any healthcare coverage during this period had they not made a Fast Track payment. For this reason, utilization in the first period of enrollment for Fast Track members is of interest; Fast Track members might not have had access to coverage for these services if the Fast Track policy did not exist. Utilization among Fast Track members in their first months of coverage may suggest that Fast Track policies help remediate coverage gaps, improving access to needed care. Higher utilization compared to non-Fast Track members could also suggest that members in need of care understand and utilize the policy to get coverage faster.
The table below shows utilization by service category for members making Fast Track payments (n=30,856) compared to those who do not (n= 376,890). This includes data on primary care, specialty care and emergency care.79 Members making Fast Track payments are using care in their first month of enrollment, but at lower levels than members who do not make Fast Track payments. In other words, Fast Track members are not using more care in their first month of enrollment than members who do not make Fast Track payments.
78 Indiana Medicaid for Providers; Hospital Presumptive Eligibility Process. Retrieved June 2, 2016 from http://provider.indianamedicaid.com/about-indiana-medicaid/member-programs/special-programs/qualified-provider-presumptive-eligibility-%28pe%29/hospital-presumptive-eligiblity-%28hpe%29.aspx.
79 See Appendix K for definitions of primary and specialty care for this report.
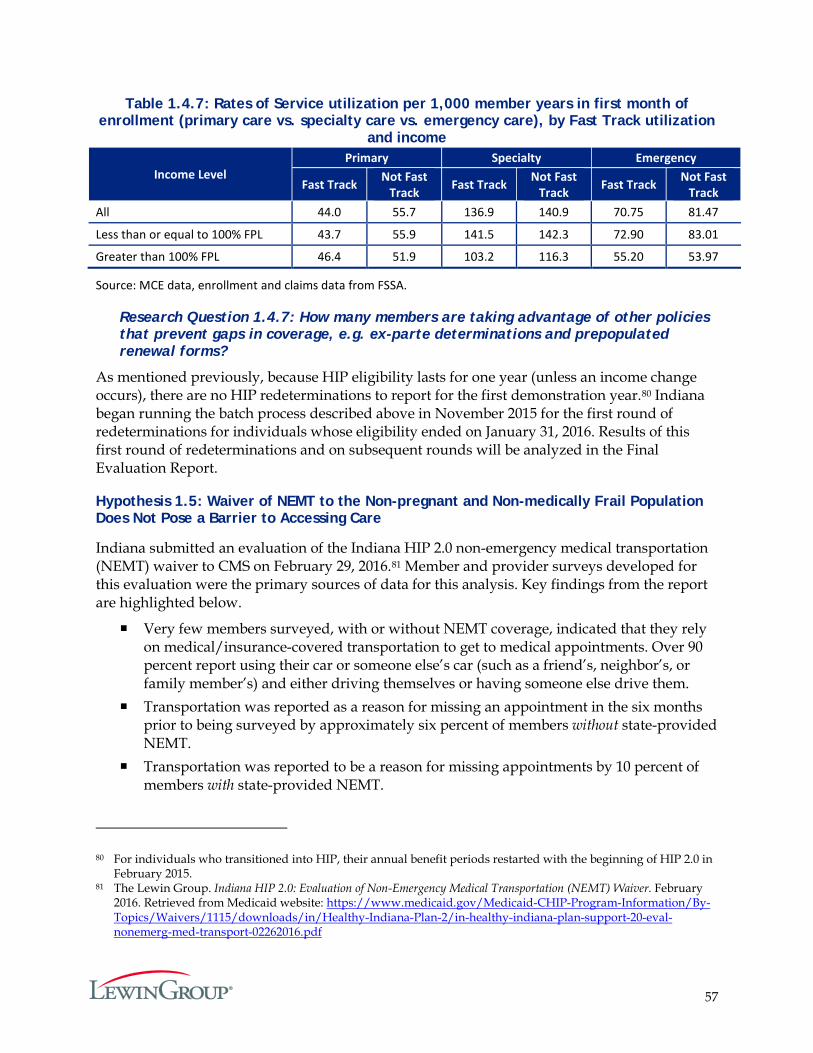
57
Table 1.4.7: Rates of Service utilization per 1,000 member years in first month of enrollment (primary care vs. specialty care vs. emergency care), by Fast Track utilization
and income
Source: MCE data, enrollment and claims data from FSSA.
Research Question 1.4.7: How many members are taking advantage of other policies that prevent gaps in coverage, e.g. ex-parte determinations and prepopulated renewal forms?
As mentioned previously, because HIP eligibility lasts for one year (unless an income change occurs), there are no HIP redeterminations to report for the first demonstration year.80 Indiana began running the batch process described above in November 2015 for the first round of redeterminations for individuals whose eligibility ended on January 31, 2016. Results of this first round of redeterminations and on subsequent rounds will be analyzed in the Final Evaluation Report.
Hypothesis 1.5: Waiver of NEMT to the Non-pregnant and Non-medically Frail Population Does Not Pose a Barrier to Accessing Care
Indiana submitted an evaluation of the Indiana HIP 2.0 non-emergency medical transportation (NEMT) waiver to CMS on February 29, 2016.81 Member and provider surveys developed for this evaluation were the primary sources of data for this analysis. Key findings from the report are highlighted below.
Very few members surveyed, with or without NEMT coverage, indicated that they rely on medical/insurance-covered transportation to get to medical appointments. Over 90 percent report using their car or someone else’s car (such as a friend’s, neighbor’s, or family member’s) and either driving themselves or having someone else drive them.
Transportation was reported as a reason for missing an appointment in the six months prior to being surveyed by approximately six percent of members without state-provided NEMT.
Transportation was reported to be a reason for missing appointments by 10 percent of members with state-provided NEMT.
80 For individuals who transitioned into HIP, their annual benefit periods restarted with the beginning of HIP 2.0 in February 2015.
81 The Lewin Group. Indiana HIP 2.0: Evaluation of Non-Emergency Medical Transportation (NEMT) Waiver. February 2016. Retrieved from Medicaid website: https://www.medicaid.gov/Medicaid-CHIP-Program-Information/By-Topics/Waivers/1115/downloads/in/Healthy-Indiana-Plan-2/in-healthy-indiana-plan-support-20-eval-nonemerg-med-transport-02262016.pdf
Income Level Primary Specialty Emergency
Fast Track Not Fast Track Fast Track Not Fast
Track Fast Track Not Fast Track
All 44.0 55.7 136.9 140.9 70.75 81.47
Less than or equal to 100% FPL 43.7 55.9 141.5 142.3 72.90 83.01
Greater than 100% FPL 46.4 51.9 103.2 116.3 55.20 53.97
58
The populations with and without state-provided NEMT are not readily comparable due to large differences in demographics and healthcare needs.
A subset of the population without state-provided NEMT did have NEMT benefits provided through their MCE, which appear very similar to those offered through the state. Given the similar proportions of members without state-provided NEMT who report transportation as a reason for missing an appointment for both those with MCE-provided NEMT (six percent) and those without any NEMT benefits (seven percent), having MCE-provided NEMT does not appear to influence whether members missed appointments for transportation-related reasons when compared to members who did not have access to NEMT. These findings also suggest that similar levels of transportation problems can occur for populations regardless of whether NEMT benefits are available.
There were statistically significant differences in the proportion of members that identified transportation as a reason for missing an appointment across income levels, and this pattern held for both members with and without state-provided NEMT. This is driven by differences between members below 25 percent of the FPL (10 percent and 12 percent in the populations without and with state-provided NEMT) and those between 25 percent and 100 percent of the FPL (three percent and four percent, respectively), indicating that those with the fewest resources are generally more likely to face access to care issues. Complicating the interpretation though is the similar proportions of members above 100 percent of the FPL (who are predominantly covered by HIP Plus) and below 25 percent of the FPL that reported missing an appointment regardless of the reason, with or without state-provided NEMT.
However, one quarter of members with the lowest poverty levels who were receiving state-provided NEMT had higher proportions of reporting various reasons, beyond just transportation problems, for missing appointments.
There was no evidence of significant differences in the proportion of all members surveyed without state-provided NEMT who missed appointments or reported transportation as a reason for missed appointments by rural/urban location, availability of public transportation, age, or gender. However, the sample sizes were relatively small at the levels of these subgroups, which may have limited the ability to capture statistically significant differences.
Results of a provider survey pointed to transportation as the most common perceived reason that members missed appointments. This was a view shared across provider types and regions. Provider survey respondents also viewed missed appointments as impactful on patients’ preventive care and overall quality of care, expressing concerns for detrimental effects. It is important to note that the provider survey respondents were not asked to limit their views to HIP 2.0 members, and the vast majority of respondents of the provider survey were administrative staff, rather than clinical staff, raising questions about their ability to evaluate clinical issues.
59
In sum, the current member survey shows a relatively small number of HIP 2.0 members missed appointments due to transportation-related issues. In addition, members without NEMT benefits did not appear to be substantially more likely to report transportation problems relative to those with MCE-provided or state-provided NEMT benefits.
Summary
A fundamental objective of HIP 2.0 is to provide low-income adults with health insurance coverage in order to reduce the number of uninsured in Indiana. In the first year, 407,746 Indiana residents were enrolled in HIP 2.0 for at least one month. This amounts to nearly three-fourths of the actuarial projections of the number of Indiana residents potentially eligible for HIP 2.0 during the first demonstration year.
By the end of the first demonstration year, there were approximately 61,500 members (representing about 15 percent of ever-enrolled members) who left HIP 2.0—either leaving Medicaid altogether or shifting to another Medicaid program. The primary reasons for disenrollment were a change in income or having secured insurance from another source. In addition, approximately 16 percent of “leavers” used services in another Medicaid program.
In terms of access to providers, current members reported having a greater likelihood of accessing routine care, specialist care and prescription drugs, compared to leavers and never-members. The current members were equally satisfied with their speed of access to care as nationally-reported numbers in Medicaid CAHPS reports. With respect to provider network adequacy, all three MCEs satisfied the network standards for PMPs, dental and vision services, and within specialist types, the MCEs met the access requirements for most.
HIP 2.0 also aims to ensure that the PACs are affordable for their members, while acting to incentivize them to manage their healthcare expenses. It appears that PACs are being maintained by the majority of members. Over the first year, non-payment of PAC resulted in about eight percent of members below poverty moving from HIP Plus to HIP Basic. About six percent of individuals required to make a PAC and with income above poverty were disenrolled for failing to make a POWER Account contribution.
Survey respondents were asked about whether they worried about making PACs. Over half (52 percent) of the members never or rarely worried about POWER Account contributions, whereas 16 percent always worried about being able to afford their PAC payment and another 29 percent worried usually or sometimes. Almost 90 percent of Basic members and about 80 percent of Plus members reported that they would be willing to pay $5 more a month for their health insurance. The majority of those would be willing to pay $10 more a month. Thus, even though a segment of surveyed members reported worrying about making PAC payments, overall perceptions of affordability of PAC were more favorable than not.
According to survey data, over 80 percent of HIP Basic members cited reasons other than affordability for not making a PAC. The primary reasons given for not making a required PAC payment were confusion about the payment process and the plan types.
Certain HIP 2.0 eligibility policies, such as PE and Fast Track payments are meant to reduce coverage gaps, while the waiver of retroactive coverage could potentially increase coverage
60
gaps. The net effect of these policy changes on gaps in coverage is difficult to measure with existing data. However, some providers are able to detect a decrease in the number of requests for charity care and in instances of bad debt. Also, providers who were engaged in presumptive eligibility determinations were finding that the PE process was either very effective or somewhat effective at eliminating gaps in healthcare coverage. In total, 208 unique providers had made a PE eligibility determination as of April 30, 2016, representing about 62 percent of potentially qualifying providers.
Finally, a sizable number of members were using the option of making Fast Track payments to start their coverage faster. In total, 30,856 unique members made a Fast Track payment as of January 31, 2016, which represents 18 percent of all ever-enrolled members during the time period when the fast-track payment option was available, and 26 percent of ever-enrolled Plus members during this timeframe. Fast Track payment rates are especially high among former PE members.
Overall, a majority of survey respondents (80 percent) were either very satisfied or somewhat satisfied with their experience with HIP. Plus members were more likely to be very or somewhat satisfied than Basic members (86 percent of Plus members, compared to 71 percent of Basic members).82 Further, 93 percent of surveyed members reported that they would choose to re-enroll in HIP if they left but then became eligible again.
82 Under HIP 1.0, 94.7 percent of members were either very or somewhat satisfied with their overall experience in HIP. Note that the members surveyed under HIP 1.0 likely had more program experience compared to HIP 2.0 members surveyed. Also, to remain enrolled, HIP 1.0 members were required to pay POWER Account contributions. Source: Healthy Indiana Plan Section 1115 Demonstration 2013 Annual Report and Interim Evaluation. Indiana Office of Medicaid Policy and Planning. October 2014.
61
Goal 2: Promote Value-Based Decision Making and Personal Health Responsibility
One of the principle goals of the HIP 2.0 program is to promote personal responsibility for positive health behaviors and healthcare spending. To evaluate the success of this goal, the following hypotheses were analyzed:
1. HIP policies will encourage member compliance with required contributions and provide incentives to actively manage Personal Wellness and Responsibility (POWER) Account funds (HIP 2.0 Waiver, Section 5); HIP policies surrounding rollover and preventive care will encourage beneficiaries’ compliance with required contributions and provide incentives to actively manage POWER Account funds (STCs, Section XIII, Paragraph 3viii).
2. HIP Plus members will exhibit more cost-conscious healthcare consumption behavior than: a) HIP Basic members; and b) traditional Hoosier Healthwise members in the areas of primary, specialty, and pharmacy service utilization without harming beneficiary health (HIP 2.0 Waiver, Section 5 and STCs, Section XIII, Paragraph 3iv).
3. HIP’s (i) graduated co-payments required for non-emergency use of the emergency department (ED), (ii) ED prior authorization process, and (iii) efforts to expand access to other urgent care settings will together effectively deter inappropriate ED utilization without harming beneficiary health (HIP 2.0 Waiver, Section 5).
• The graduated co-payment structure for non-emergency use of the emergency department will decrease inappropriate ED utilization without harming beneficiary health (STCs, Section XIII, Paragraph 3x).
• The prior authorization process for hospital emergency department use and efforts to expand access to other urgent care settings will decrease inappropriate ED utilization without harming beneficiary health (STCs, Section XIII, Paragraph 3xi).
As with the other goals, these hypotheses are based on evaluation requirements in the STCs and in the Final Evaluation Plan approved by CMS.
Hypothesis 2.1: HIP Policies Will Encourage Member Compliance with Required Contributions and Provide Incentives to Actively Manage POWER Account Funds; HIP Policies Surrounding Rollover and Preventive Care will Encourage Beneficiaries’ Compliance with Required Contributions and Provide Incentives to Actively Manage POWER Account Funds.
A principal focus in the design of the HIP program has been to support more consumer involvement in healthcare choices by offering its members a High Deductible Health Plan (HDHP) paired with a Personal Wellness and Responsibility (POWER) Account. This section examines whether awareness about the POWER Account and the policies surrounding it influences POWER Account management as well as members’ healthcare utilization.
Specifically, six research questions are related to this hypothesis:
1. What proportion of members make POWER Account payments on time? What proportion of members move from HIP Plus to HIP Basic due to non-payment?
2. How many members are subject to collection due to non-payment of PAC?
62
3. Are providers complying with HIP policies, e.g. charging co-payments to HIP Basic members?
4. Are members actively managing their POWER Accounts?
5. Are there differences in utilization and POWER Account management among members related to health status, (e.g., diabetes, or other chronic diseases)?
6. Are there differences in utilization and POWER Account management between individuals paying a PAC and those who do not? How are these variables impacted by member income level?
These questions were evaluated using enrollment and claims data as well as data collected from member and provider surveys. At this time, data are not yet available on PAC debt or rollover, as members are not eligible for rollover until they have been in the program for a full year. Many members were only enrolled for a few months during the first demonstration year. Also, MCEs typically need several months to fully process claims and other administrative information necessary in determining rollover eligibility. The Final Evaluation Report will be able to assess the effectiveness of the policies surrounding the POWER Account and rollover in active management of the POWER Accounts.
Policies to Encourage Member Compliance with Required Contributions (PAC) and Incentives to Actively Manage POWER Account Funds
HIP 2.0 policies include a strong incentive for member compliance with PAC for individuals with income over 100 percent of the FPL. Those who fail to make a POWER Account contribution are subject to a six-month disenrollment period from coverage after a 60-day non-payment grace period elapses. However, for individuals below 100 percent of the FPL, those who fail to make a PAC are moved from the HIP Plus plan to the HIP Basic plan after the 60-day grace period, rather than being disenrolled from HIP 2.0 altogether. However, disenrollment for failure to pay a PAC is not applicable to individuals who are medically frail or receiving TMA, or to individuals who apply for a waiver from the six-month disenrollment period due to a qualifying event (e.g., obtaining and subsequently losing private insurance coverage; experiencing a loss of income after disqualification due to increased income; taking up residence in another state and returning later; being a victim of domestic violence; or residing in a county subject to a disaster declaration made in accordance with IC 10-14-3-12 at the time the member was terminated for non-payment or at any time in the sixty calendar days prior to date of member termination for non-payment).83
To incentivize members to continue making their PAC and remain in HIP Plus, HIP Plus has several advantages over HIP Basic: an enhanced benefit package, no co-payments (except for non-emergency use of the Emergency Department) and additional rollover rewards for receiving preventive care. Refer to Table 3 of the Program Overview section for more details on benefits and incentives within Basic and Plus.
83 Medically frail individuals above 100 percent FPL who fail to make a PAC are transferred to a Basic plan with copays. TMA participants who fail to make a PAC are transitioned to the Basic plan.
63
Rollover rewards are of particular importance: both Basic and Plus members are potentially eligible to rollover their portion of unused funds to reduce future contributions in subsequent years. The potential to reduce future required contributions may encourage all members to manage their PAC funds. This aspect of the program will be expanded on in the Final Evaluation Report. Nonetheless, the efficacy of HIP 2.0 policies in POWER Account management and healthcare utilization was assessed within the scope of available data and information for this interim report.
Research Question 2.1.1: What proportion of members make POWER Account payments on time? What proportion of members move from HIP Plus to HIP Basic due to non-payment?
As discussed in Goal 1, during the first demonstration year, there were 281,471 unique members enrolled for at least one month in HIP Plus. This amounts to about 70 percent of all ever-enrolled members.
About 21,445 of these individuals transitioned from Plus to Basic during the year, representing approximately 8.2 percent of the 262,579 individuals who would have been eligible to transition from Plus to Basic, had they not made a PAC.
There were also 2,677 HIP Plus members who were disenrolled from the program during the first year due to non-payment of PAC. This represents approximately six percent of the 45,607 individuals with income above the federal poverty level who could be disenrolled for a non-payment of PAC.84 Thus, it appears that over 90 percent of members, whether above or below poverty, make their required PAC payments to stay in Plus. (See Goal One, Hypothesis Three, Research Question Five for additional detail on the estimates of members who left Plus due to PAC non-payment.)
Research Question 2.1.2: How many members are subject to collection due to non-payment of PAC?
Analysis of this question will be included in the Final Evaluation Report.
Research Question 2.1.3: Are providers complying with HIP policies, e.g. charging co-payments to HIP Basic members?
As noted previously, Basic members are required to make a co-payment each time they receive a healthcare service, such as going to the doctor, filling a prescription, or staying in the hospital. These payments may range from $4 to $8 per doctor visit or prescription filled, and may be as high as $75 per hospital stay.
To assess provider compliance with HIP policies on charging co-payments to HIP Basic members, data collected from a survey of HIP providers were analyzed. Providers were asked to report on a series of questions to gain an understanding about co-payment collection rates and co-payment collection policies in general, as well as to estimate metrics such as the percent
84 The 45,607 count excludes anyone who was exempt from disenrollment for failure to pay PAC, e.g., medically frail, TMA, Native American, and pregnant women.
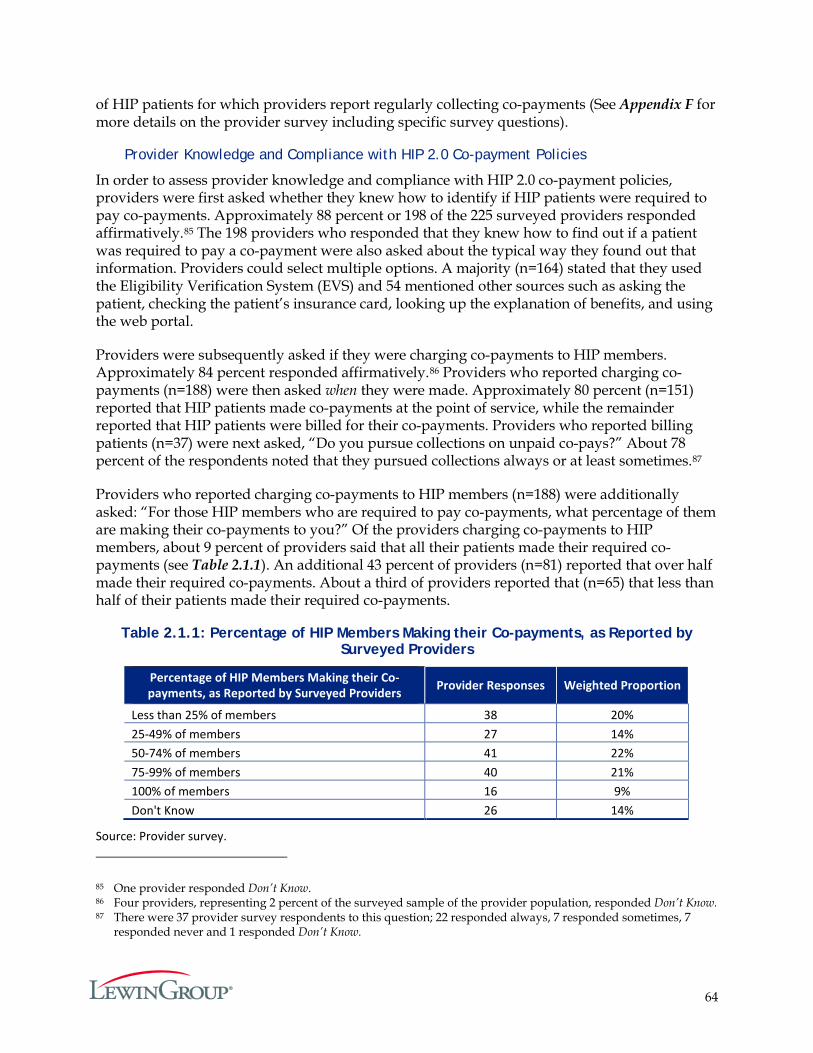
64
of HIP patients for which providers report regularly collecting co-payments (See Appendix F for more details on the provider survey including specific survey questions).
Provider Knowledge and Compliance with HIP 2.0 Co-payment Policies
In order to assess provider knowledge and compliance with HIP 2.0 co-payment policies, providers were first asked whether they knew how to identify if HIP patients were required to pay co-payments. Approximately 88 percent or 198 of the 225 surveyed providers responded affirmatively.85 The 198 providers who responded that they knew how to find out if a patient was required to pay a co-payment were also asked about the typical way they found out that information. Providers could select multiple options. A majority (n=164) stated that they used the Eligibility Verification System (EVS) and 54 mentioned other sources such as asking the patient, checking the patient’s insurance card, looking up the explanation of benefits, and using the web portal.
Providers were subsequently asked if they were charging co-payments to HIP members. Approximately 84 percent responded affirmatively.86 Providers who reported charging co-payments (n=188) were then asked when they were made. Approximately 80 percent (n=151) reported that HIP patients made co-payments at the point of service, while the remainder reported that HIP patients were billed for their co-payments. Providers who reported billing patients (n=37) were next asked, “Do you pursue collections on unpaid co-pays?” About 78 percent of the respondents noted that they pursued collections always or at least sometimes.87
Providers who reported charging co-payments to HIP members (n=188) were additionally asked: “For those HIP members who are required to pay co-payments, what percentage of them are making their co-payments to you?” Of the providers charging co-payments to HIP members, about 9 percent of providers said that all their patients made their required co-payments (see Table 2.1.1). An additional 43 percent of providers (n=81) reported that over half made their required co-payments. About a third of providers reported that (n=65) that less than half of their patients made their required co-payments.
Table 2.1.1: Percentage of HIP Members Making their Co-payments, as Reported by Surveyed Providers
Percentage of HIP Members Making their Co-payments, as Reported by Surveyed Providers Provider Responses Weighted Proportion
Less than 25% of members 38 20% 25-49% of members 27 14% 50-74% of members 41 22% 75-99% of members 40 21% 100% of members 16 9% Don't Know 26 14%
Source: Provider survey.
85 One provider responded Don’t Know. 86 Four providers, representing 2 percent of the surveyed sample of the provider population, responded Don’t Know. 87 There were 37 provider survey respondents to this question; 22 responded always, 7 responded sometimes, 7
responded never and 1 responded Don’t Know.
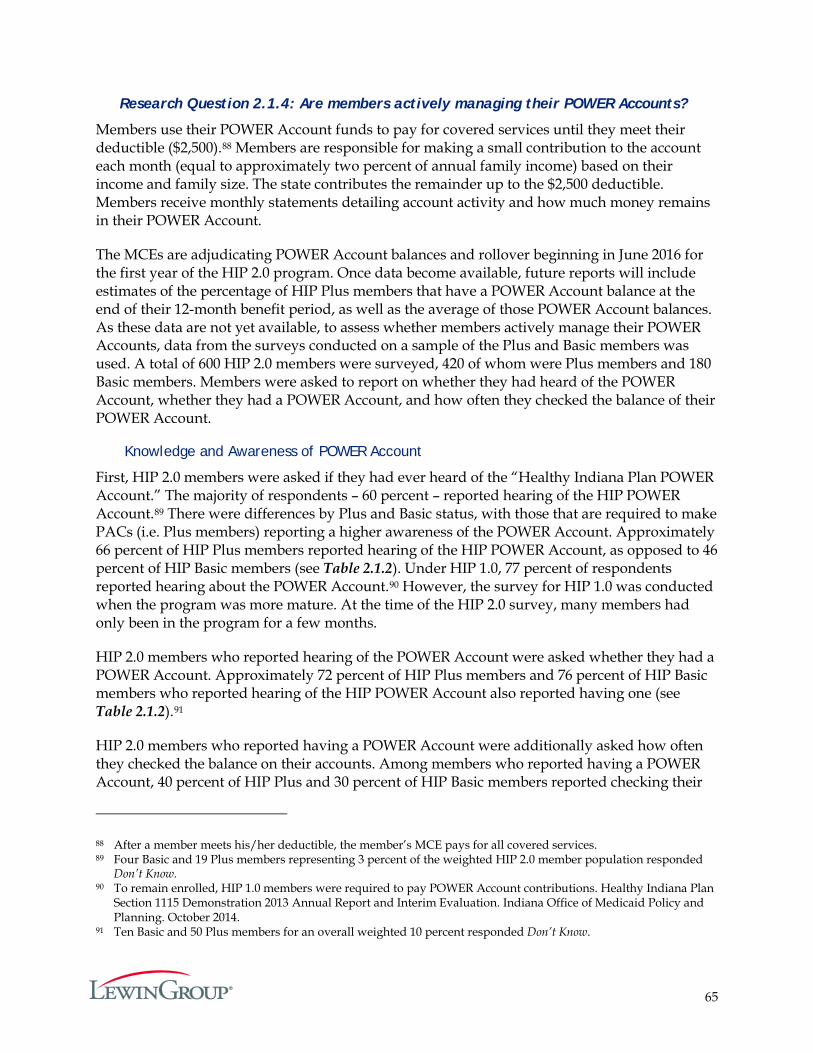
65
Research Question 2.1.4: Are members actively managing their POWER Accounts?
Members use their POWER Account funds to pay for covered services until they meet their deductible ($2,500).88 Members are responsible for making a small contribution to the account each month (equal to approximately two percent of annual family income) based on their income and family size. The state contributes the remainder up to the $2,500 deductible. Members receive monthly statements detailing account activity and how much money remains in their POWER Account.
The MCEs are adjudicating POWER Account balances and rollover beginning in June 2016 for the first year of the HIP 2.0 program. Once data become available, future reports will include estimates of the percentage of HIP Plus members that have a POWER Account balance at the end of their 12-month benefit period, as well as the average of those POWER Account balances. As these data are not yet available, to assess whether members actively manage their POWER Accounts, data from the surveys conducted on a sample of the Plus and Basic members was used. A total of 600 HIP 2.0 members were surveyed, 420 of whom were Plus members and 180 Basic members. Members were asked to report on whether they had heard of the POWER Account, whether they had a POWER Account, and how often they checked the balance of their POWER Account.
Knowledge and Awareness of POWER Account
First, HIP 2.0 members were asked if they had ever heard of the “Healthy Indiana Plan POWER Account.” The majority of respondents – 60 percent – reported hearing of the HIP POWER Account.89 There were differences by Plus and Basic status, with those that are required to make PACs (i.e. Plus members) reporting a higher awareness of the POWER Account. Approximately 66 percent of HIP Plus members reported hearing of the HIP POWER Account, as opposed to 46 percent of HIP Basic members (see Table 2.1.2). Under HIP 1.0, 77 percent of respondents reported hearing about the POWER Account.90 However, the survey for HIP 1.0 was conducted when the program was more mature. At the time of the HIP 2.0 survey, many members had only been in the program for a few months.
HIP 2.0 members who reported hearing of the POWER Account were asked whether they had a POWER Account. Approximately 72 percent of HIP Plus members and 76 percent of HIP Basic members who reported hearing of the HIP POWER Account also reported having one (see Table 2.1.2).91
HIP 2.0 members who reported having a POWER Account were additionally asked how often they checked the balance on their accounts. Among members who reported having a POWER Account, 40 percent of HIP Plus and 30 percent of HIP Basic members reported checking their
88 After a member meets his/her deductible, the member’s MCE pays for all covered services. 89 Four Basic and 19 Plus members representing 3 percent of the weighted HIP 2.0 member population responded
Don’t Know. 90 To remain enrolled, HIP 1.0 members were required to pay POWER Account contributions. Healthy Indiana Plan
Section 1115 Demonstration 2013 Annual Report and Interim Evaluation. Indiana Office of Medicaid Policy and Planning. October 2014.
91 Ten Basic and 50 Plus members for an overall weighted 10 percent responded Don’t Know.
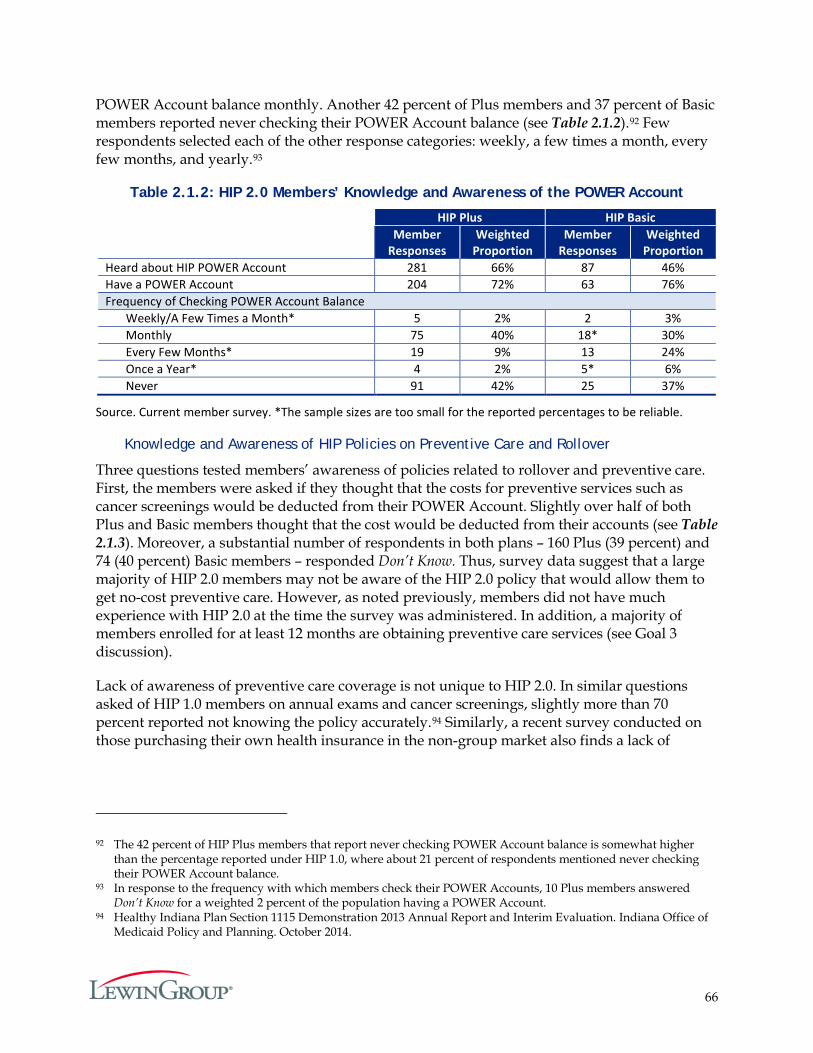
66
POWER Account balance monthly. Another 42 percent of Plus members and 37 percent of Basic members reported never checking their POWER Account balance (see Table 2.1.2).92 Few respondents selected each of the other response categories: weekly, a few times a month, every few months, and yearly.93
Table 2.1.2: HIP 2.0 Members’ Knowledge and Awareness of the POWER Account
HIP Plus HIP Basic Member
Responses Weighted
Proportion Member
Responses Weighted
Proportion Heard about HIP POWER Account 281 66% 87 46% Have a POWER Account 204 72% 63 76% Frequency of Checking POWER Account Balance
Weekly/A Few Times a Month* 5 2% 2 3% Monthly 75 40% 18* 30% Every Few Months* 19 9% 13 24% Once a Year* 4 2% 5* 6% Never 91 42% 25 37%
Source. Current member survey. *The sample sizes are too small for the reported percentages to be reliable.
Knowledge and Awareness of HIP Policies on Preventive Care and Rollover
Three questions tested members’ awareness of policies related to rollover and preventive care. First, the members were asked if they thought that the costs for preventive services such as cancer screenings would be deducted from their POWER Account. Slightly over half of both Plus and Basic members thought that the cost would be deducted from their accounts (see Table 2.1.3). Moreover, a substantial number of respondents in both plans – 160 Plus (39 percent) and 74 (40 percent) Basic members – responded Don’t Know. Thus, survey data suggest that a large majority of HIP 2.0 members may not be aware of the HIP 2.0 policy that would allow them to get no-cost preventive care. However, as noted previously, members did not have much experience with HIP 2.0 at the time the survey was administered. In addition, a majority of members enrolled for at least 12 months are obtaining preventive care services (see Goal 3 discussion).
Lack of awareness of preventive care coverage is not unique to HIP 2.0. In similar questions asked of HIP 1.0 members on annual exams and cancer screenings, slightly more than 70 percent reported not knowing the policy accurately.94 Similarly, a recent survey conducted on those purchasing their own health insurance in the non-group market also finds a lack of
92 The 42 percent of HIP Plus members that report never checking POWER Account balance is somewhat higher than the percentage reported under HIP 1.0, where about 21 percent of respondents mentioned never checking their POWER Account balance.
93 In response to the frequency with which members check their POWER Accounts, 10 Plus members answered Don’t Know for a weighted 2 percent of the population having a POWER Account.
94 Healthy Indiana Plan Section 1115 Demonstration 2013 Annual Report and Interim Evaluation. Indiana Office of Medicaid Policy and Planning. October 2014.
67
awareness about new rules for coverage regarding preventive services. 95 Fewer than half (47 percent) knew that preventive services were covered completely by their plans, and among those in high-deductible plans, awareness was even lower: 41 percent knew that preventive services were covered with no cost-sharing.
Table 2.1.3: HIP 2.0 Members’ Knowledge on Policies on Preventive Care and POWER Account Rollover
Question
HIP Plus HIP Basic Member
Responses (Yes/True)
Weighted Proportion
Member Responses (Yes/True)
Weighted Proportion
If you were to get preventive services such as a cancer screening, do you think the cost would be deducted from your POWER Account if you have enough money available in the account?
224 52% 94 51%
If you get preventive services suggested by your plan every year and have money left in your POWER Account, part of that money will be rolled over to your account for next year.
270 65% 95 57%
(Basic members) If you do not get the preventive care that your health plan recommends during the year and you have money left over in your POWER Account, you will not be able to reduce your monthly contributions if you move to HIP Plus.
70 35%
(Plus members) If you do not get the preventive care that your health plan recommends during the year and you have money left over in your POWER Account the amount that is rolled over will not be doubled.
215 52%
Source: Current member survey.
Another policy related question asked members whether they thought it was true that if they obtained preventive services suggested by their plan every year and had money left in their POWER Account, part of that money would be rolled over to their account for next year. Sixty-five percent of Plus members and 57 percent of the Basic members thought that it was true (see Table 2.1.3). Sizable segments96 of both groups of members also responded they didn’t know whether it was a true or false statement. This may not be surprising since rollover has not yet been experienced by HIP 2.0 members.
The last policy question also addressed the link between rollover, preventive care and reducing future POWER Account contributions. Basic members were asked if they thought it was true that if they did not get the preventive care that their health plan recommended during the year and they had money left over in their POWER Account, they would not be able to reduce their
95 Survey of Non-Group Health Insurance Enrollees, Wave 3, conducted February 9–March 26, 2015; the Kaiser Family Foundation. Retrieved May 19, 2016 from http://kff.org/health-reform/poll-finding/survey-of-non-group-health-insurance-enrollees-wave-3/
96 Sixty-seven Plus members (15 percent) and 40 Basic members (21 percent) responded Don’t Know.
68
monthly contributions if they moved to HIP Plus. A corollary question to Plus members asked if they thought it was true that if they did not receive the preventive care recommended by their plan and had money left over in their POWER Account, the amount that would be rolled over would not be doubled. Fifty-two percent of Plus members and 35 percent of Basic members thought that the applicable provision was true (see Table 2.1.3). Once again, there was a sizable response of Don’t Know in both membership groups.97
Nonetheless, HIP Plus plan members surveyed reflect greater awareness about policies on preventive services and their relationship to rollover and future POWER Account contributions in comparison to that of members under HIP 1.0, in which approximately one-quarter reported that getting preventive services would qualify them for a rollover.98 This is particularly notable because some HIP Plus respondents, specifically respondents who did not transition from HIP 1.0, may have never experienced rollover because the member survey was administered 10 months after the start of HIP 2.0, but rollover occurs after 12 months of enrollment.99 In comparison, as noted previously, the HIP 1.0 member survey was administered approximately five years after HIP 1.0 began, so HIP 1.0 survey respondents may have been more likely to have experienced rollover prior to being surveyed.
Research Question 2.1.5: Are there differences in utilization and POWER Account management among members related to health status (e.g., diabetes, or other chronic diseases)?
Research Question 2.1.6: Are there differences in utilization and POWER Account management between individuals paying a PAC and those who do not? How are these variables impacted by member income level?
The final two research questions associated with Hypothesis 1 under Goal 2 will be addressed together. Since the POWER Account balances are not adjudicated by the MCEs until after four months from the end of the benefit period, during this evaluation cycle, data is not yet available to address how POWER Account management and rollover are directly correlated with income, health, or healthcare utilization. However, it is of interest to examine whether utilization is associated with making a POWER Account contribution (proxied by membership in Plus100) and income level, controlling for members’ health conditions.
In order to analyze the healthcare utilization behavior among members with different income and health status, as well as members that differ in plan type, HIP 2.0 members were broken down into four distinct groups of HIP 2.0 members:
1. Exclusively Plus members with income greater than 100 percent of the FPL;
2. Exclusively Plus members with income up to 100 percent of the FPL;
3. Exclusively Basic members with income up to 100 percent of the FPL; and
97 90 Plus members (21 percent) and 58 Basic members (33 percent) responded Don’t Know. 98 Healthy Indiana Plan Section 1115 Demonstration 2013 Annual Report and Interim Evaluation. Indiana Office of
Medicaid Policy and Planning. October 2014. 99 Plus members who transitioned from HIP 1.0 may have experienced rollover during their enrollment in HIP 1.0. 100 Everyone in the Plus plan is required to pay a PAC to maintain membership, except for pregnant women and
Native Americans.
69
4. Plus to Basic switchers with income up to 100 percent of the FPL. 101
The exclusive concept is used to focus on members that stay in the specific plan type for the entire period of their enrollment; and are assumed to maintain the same income level. The aim is to help to isolate the effects of plan type and income on utilization patterns. While this section largely focuses on “exclusively” enrolled members, the discussion in Goal 3 reviews utilization statistics for the overall population of HIP 2.0 members in the first demonstration year.
For each of these four groups, four categories of health status were identified, represented by the number of each member’s physical and/or behavioral chronic disease conditions. Specifically, the four health status categories we use are:
1. At least one physical health condition; 2. At least one behavioral health condition; 3. At least one physical health and at least one behavioral health condition; or 4. More than two physical health or behavioral health conditions.
The analysis focused on seven physical health conditions: diabetes, congestive heart failure, coronary artery disease, asthma, chronic obstructive pulmonary disease, chronic kidney disease, and rheumatoid arthritis. Behavioral health is also represented by seven conditions: autism, depression, schizophrenia, bipolar disorder, other severe and persistent mental illness, attention deficit hyperactivity disorder, and substance abuse. These specific physical and behavioral health conditions are of particular interest since these are typically regarded as high priority conditions for Medicaid programs, and the MCEs offer disease management programs for most of these conditions.
In addition, the extent utilization differs across the four groups of members based on their medical frailty status was explored.102
To assess if healthcare utilization varies by income and POWER Account contribution, accounting for health status, five aspects of utilization among the four HIP membership groups were compared, including:
1. Use of at least one preventive service (Table 2.1.5); 2. Use of primary care services (Table 2.1.6); 3. Use of specialty care services (Table 2.1.7); 4. Use of emergency department services (Table 2.1.8); and 5. Use of prescription drugs (Table 2.1.9).
Table 2.1.4 displays the prevalence of health conditions and medical frailty for the four groups of HIP 2.0 members defined above. According to the claims data, exclusive Plus members with
101 HIP members’ overall utilization is described under Goal 3. 102 Individuals are considered medically frail in the analysis if they were indicated to be medically frail during any
month of their enrollment during the first demonstration year.
70
income up to 100 percent of the FPL were most likely to have chronic conditions – whether physical or behavioral – among the four groups. Medical frailty is also most prevalent among this group.
Members who switched from Plus to Basic also had a higher likelihood to be sicker, as well as medically frail, than their exclusive Basic counterparts, although less than the exclusive Plus members at the same income level (i.e., with income up to the poverty level). Exclusive Plus members with income greater than 100 percent of the FPL were less likely to have health conditions, or to be medically frail, than the exclusive Plus members with lower income.
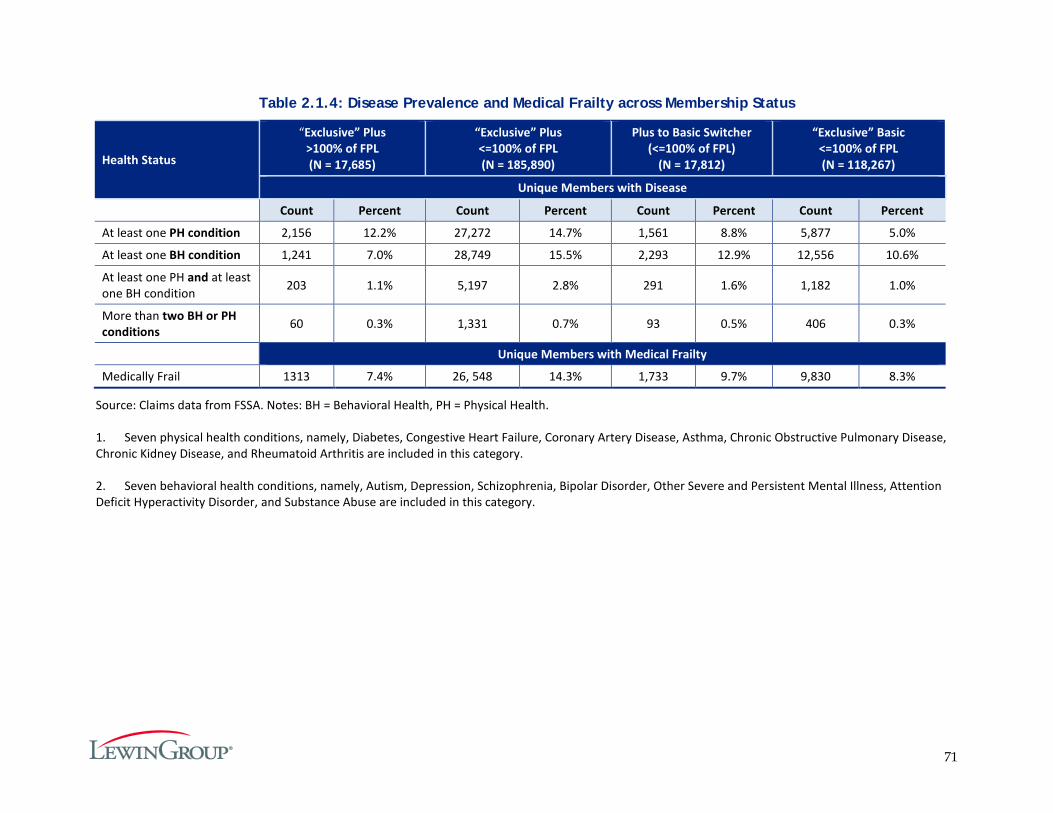
71
Table 2.1.4: Disease Prevalence and Medical Frailty across Membership Status
Health Status
“Exclusive” Plus >100% of FPL (N = 17,685)
“Exclusive” Plus <=100% of FPL (N = 185,890)
Plus to Basic Switcher (<=100% of FPL)
(N = 17,812)
“Exclusive” Basic <=100% of FPL (N = 118,267)
Unique Members with Disease
Count Percent Count Percent Count Percent Count Percent
At least one PH condition 2,156 12.2% 27,272 14.7% 1,561 8.8% 5,877 5.0%
At least one BH condition 1,241 7.0% 28,749 15.5% 2,293 12.9% 12,556 10.6%
At least one PH and at least one BH condition 203 1.1% 5,197 2.8% 291 1.6% 1,182 1.0%
More than two BH or PH conditions 60 0.3% 1,331 0.7% 93 0.5% 406 0.3%
Unique Members with Medical Frailty
Medically Frail 1313 7.4% 26, 548 14.3% 1,733 9.7% 9,830 8.3%
Source: Claims data from FSSA. Notes: BH = Behavioral Health, PH = Physical Health.
1. Seven physical health conditions, namely, Diabetes, Congestive Heart Failure, Coronary Artery Disease, Asthma, Chronic Obstructive Pulmonary Disease, Chronic Kidney Disease, and Rheumatoid Arthritis are included in this category.
2. Seven behavioral health conditions, namely, Autism, Depression, Schizophrenia, Bipolar Disorder, Other Severe and Persistent Mental Illness, Attention Deficit Hyperactivity Disorder, and Substance Abuse are included in this category.
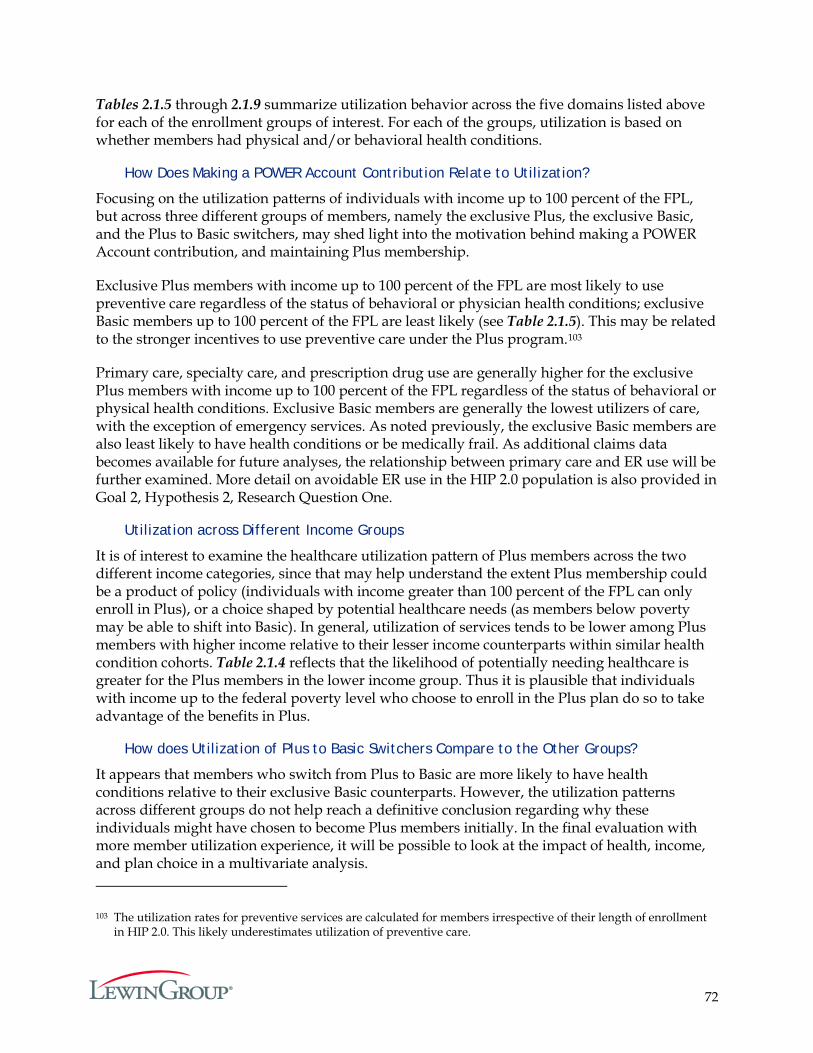
72
Tables 2.1.5 through 2.1.9 summarize utilization behavior across the five domains listed above for each of the enrollment groups of interest. For each of the groups, utilization is based on whether members had physical and/or behavioral health conditions.
How Does Making a POWER Account Contribution Relate to Utilization?
Focusing on the utilization patterns of individuals with income up to 100 percent of the FPL, but across three different groups of members, namely the exclusive Plus, the exclusive Basic, and the Plus to Basic switchers, may shed light into the motivation behind making a POWER Account contribution, and maintaining Plus membership.
Exclusive Plus members with income up to 100 percent of the FPL are most likely to use preventive care regardless of the status of behavioral or physician health conditions; exclusive Basic members up to 100 percent of the FPL are least likely (see Table 2.1.5). This may be related to the stronger incentives to use preventive care under the Plus program.103
Primary care, specialty care, and prescription drug use are generally higher for the exclusive Plus members with income up to 100 percent of the FPL regardless of the status of behavioral or physical health conditions. Exclusive Basic members are generally the lowest utilizers of care, with the exception of emergency services. As noted previously, the exclusive Basic members are also least likely to have health conditions or be medically frail. As additional claims data becomes available for future analyses, the relationship between primary care and ER use will be further examined. More detail on avoidable ER use in the HIP 2.0 population is also provided in Goal 2, Hypothesis 2, Research Question One.
Utilization across Different Income Groups
It is of interest to examine the healthcare utilization pattern of Plus members across the two different income categories, since that may help understand the extent Plus membership could be a product of policy (individuals with income greater than 100 percent of the FPL can only enroll in Plus), or a choice shaped by potential healthcare needs (as members below poverty may be able to shift into Basic). In general, utilization of services tends to be lower among Plus members with higher income relative to their lesser income counterparts within similar health condition cohorts. Table 2.1.4 reflects that the likelihood of potentially needing healthcare is greater for the Plus members in the lower income group. Thus it is plausible that individuals with income up to the federal poverty level who choose to enroll in the Plus plan do so to take advantage of the benefits in Plus.
How does Utilization of Plus to Basic Switchers Compare to the Other Groups?
It appears that members who switch from Plus to Basic are more likely to have health conditions relative to their exclusive Basic counterparts. However, the utilization patterns across different groups do not help reach a definitive conclusion regarding why these individuals might have chosen to become Plus members initially. In the final evaluation with more member utilization experience, it will be possible to look at the impact of health, income, and plan choice in a multivariate analysis.
103 The utilization rates for preventive services are calculated for members irrespective of their length of enrollment in HIP 2.0. This likely underestimates utilization of preventive care.
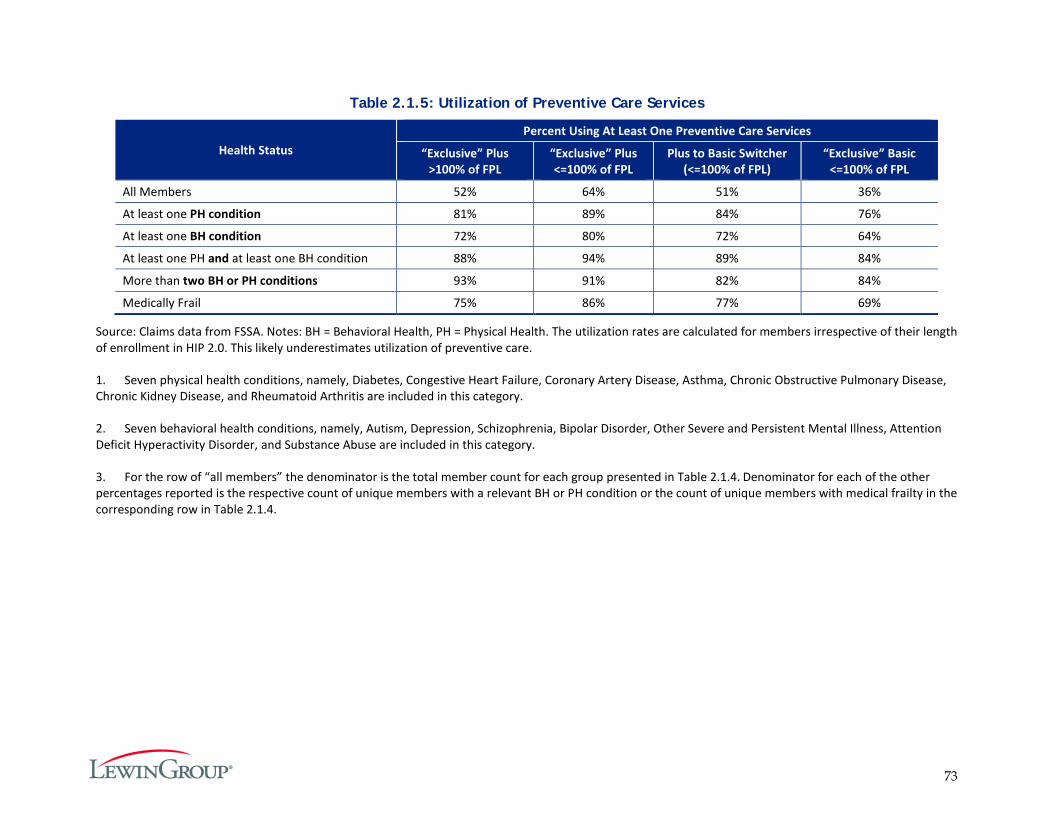
73
Table 2.1.5: Utilization of Preventive Care Services
Health Status Percent Using At Least One Preventive Care Services
“Exclusive” Plus >100% of FPL
“Exclusive” Plus <=100% of FPL
Plus to Basic Switcher (<=100% of FPL)
“Exclusive” Basic <=100% of FPL
All Members 52% 64% 51% 36%
At least one PH condition 81% 89% 84% 76%
At least one BH condition 72% 80% 72% 64%
At least one PH and at least one BH condition 88% 94% 89% 84%
More than two BH or PH conditions 93% 91% 82% 84%
Medically Frail 75% 86% 77% 69%
Source: Claims data from FSSA. Notes: BH = Behavioral Health, PH = Physical Health. The utilization rates are calculated for members irrespective of their length of enrollment in HIP 2.0. This likely underestimates utilization of preventive care.
1. Seven physical health conditions, namely, Diabetes, Congestive Heart Failure, Coronary Artery Disease, Asthma, Chronic Obstructive Pulmonary Disease, Chronic Kidney Disease, and Rheumatoid Arthritis are included in this category.
2. Seven behavioral health conditions, namely, Autism, Depression, Schizophrenia, Bipolar Disorder, Other Severe and Persistent Mental Illness, Attention Deficit Hyperactivity Disorder, and Substance Abuse are included in this category.
3. For the row of “all members” the denominator is the total member count for each group presented in Table 2.1.4. Denominator for each of the other percentages reported is the respective count of unique members with a relevant BH or PH condition or the count of unique members with medical frailty in the corresponding row in Table 2.1.4.

74
Table 2.1.6: Utilization of Primary Care
Health Status
“Exclusive” Plus >100% of FPL
“Exclusive” Plus <=100% of FPL
Plus to Basic Switcher (<=100% of FPL)
“Exclusive” Basic <=100% of FPL
Percent Using
Primary Care
Visits per 1,000
Member Years
Percent Using
Primary Care
Visits per 1,000
Member Years
Percent Using
Primary Care
Visits per 1,000
Member Years
Percent Using
Primary Care
Visits per 1,000
Member Years
All Members 23% 1,023 31% 1,314 26% 815 17% 622
At least one PH condition 43% 2,031 51% 2,333 49% 1,849 42% 1,644
At least one BH condition 40% 1,911 46% 2,091 42% 1,565 36% 1,295
At least one PH and at least one BH condition 50% 2,556 59% 3,075 54% 2,213 51% 2,065
More than two BH or PH conditions 45% 2,056 56% 2,757 49% 1,957 43% 1,748
Medically Frail 40% 1,891 49% 2,215 44% 1,651 37% 1,374
Source: Claims data from FSSA. Notes: BH = Behavioral Health, PH = Physical Health.
1. Seven physical health conditions, namely, Diabetes, Congestive Heart Failure, Coronary Artery Disease, Asthma, Chronic Obstructive Pulmonary Disease, Chronic Kidney Disease, and Rheumatoid Arthritis are included in this category.
2. Seven behavioral health conditions, namely, Autism, Depression, Schizophrenia, Bipolar Disorder, Other Severe and Persistent Mental Illness, Attention Deficit Hyperactivity Disorder, and Substance Abuse are included in this category.
3. For the row of “all members” the denominator is the total member count for each group presented in Table 2.1.4. Denominator for each of the other percentages reported is the respective count of unique members with a relevant BH or PH condition or the count of unique members with medical frailty in the corresponding row in Table 2.1.4.
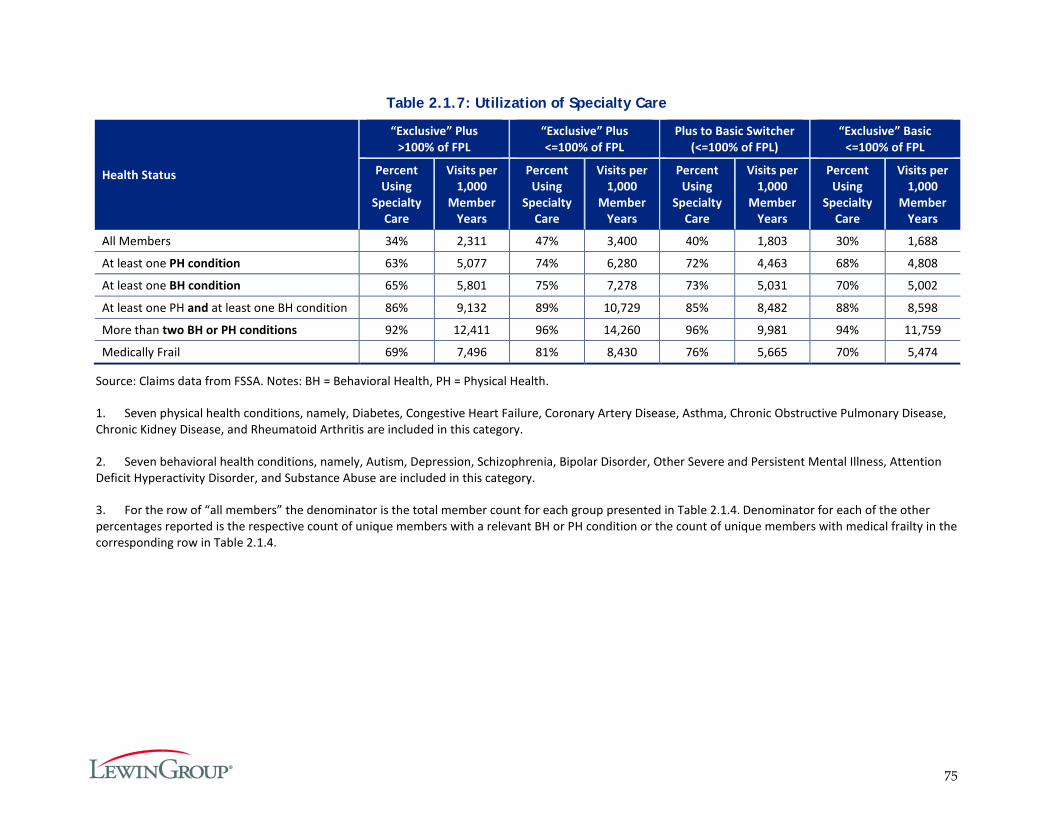
75
Table 2.1.7: Utilization of Specialty Care
Health Status
“Exclusive” Plus >100% of FPL
“Exclusive” Plus <=100% of FPL
Plus to Basic Switcher (<=100% of FPL)
“Exclusive” Basic <=100% of FPL
Percent Using
Specialty Care
Visits per 1,000
Member Years
Percent Using
Specialty Care
Visits per 1,000
Member Years
Percent Using
Specialty Care
Visits per 1,000
Member Years
Percent Using
Specialty Care
Visits per 1,000
Member Years
All Members 34% 2,311 47% 3,400 40% 1,803 30% 1,688
At least one PH condition 63% 5,077 74% 6,280 72% 4,463 68% 4,808
At least one BH condition 65% 5,801 75% 7,278 73% 5,031 70% 5,002
At least one PH and at least one BH condition 86% 9,132 89% 10,729 85% 8,482 88% 8,598
More than two BH or PH conditions 92% 12,411 96% 14,260 96% 9,981 94% 11,759
Medically Frail 69% 7,496 81% 8,430 76% 5,665 70% 5,474
Source: Claims data from FSSA. Notes: BH = Behavioral Health, PH = Physical Health.
1. Seven physical health conditions, namely, Diabetes, Congestive Heart Failure, Coronary Artery Disease, Asthma, Chronic Obstructive Pulmonary Disease, Chronic Kidney Disease, and Rheumatoid Arthritis are included in this category.
2. Seven behavioral health conditions, namely, Autism, Depression, Schizophrenia, Bipolar Disorder, Other Severe and Persistent Mental Illness, Attention Deficit Hyperactivity Disorder, and Substance Abuse are included in this category.
3. For the row of “all members” the denominator is the total member count for each group presented in Table 2.1.4. Denominator for each of the other percentages reported is the respective count of unique members with a relevant BH or PH condition or the count of unique members with medical frailty in the corresponding row in Table 2.1.4.
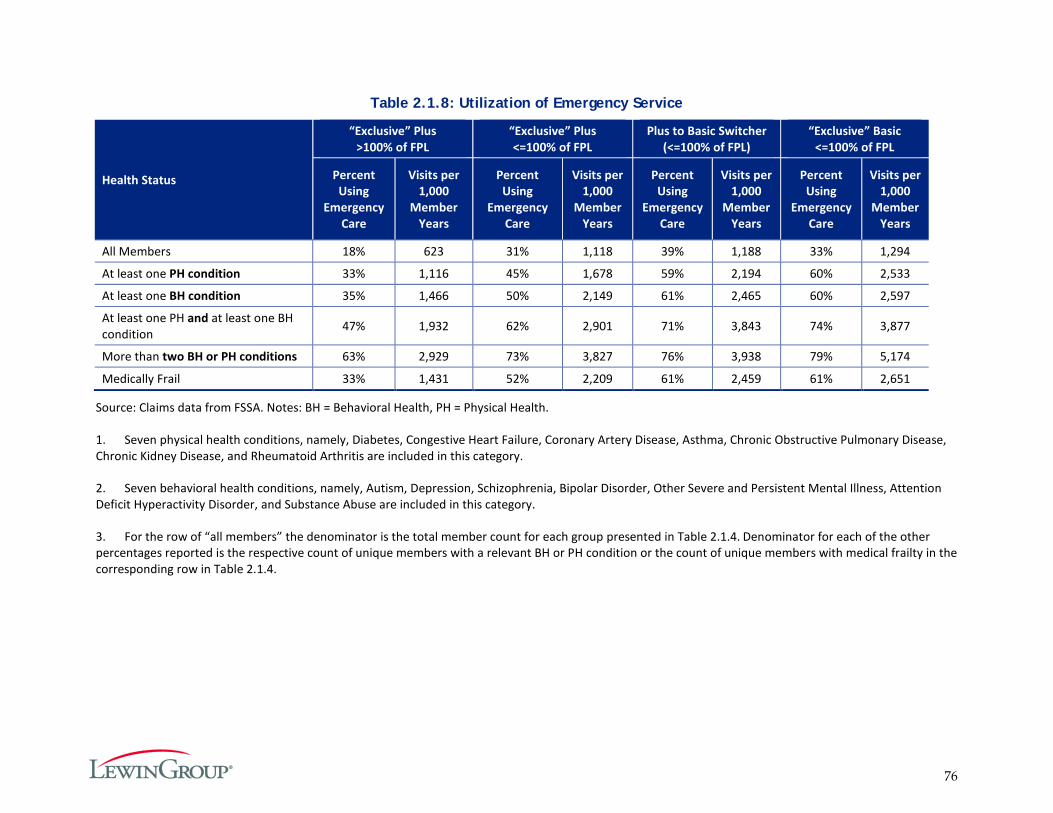
76
Table 2.1.8: Utilization of Emergency Service
Health Status
“Exclusive” Plus >100% of FPL
“Exclusive” Plus <=100% of FPL
Plus to Basic Switcher (<=100% of FPL)
“Exclusive” Basic <=100% of FPL
Percent Using
Emergency Care
Visits per 1,000
Member Years
Percent Using
Emergency Care
Visits per 1,000
Member Years
Percent Using
Emergency Care
Visits per 1,000
Member Years
Percent Using
Emergency Care
Visits per 1,000
Member Years
All Members 18% 623 31% 1,118 39% 1,188 33% 1,294
At least one PH condition 33% 1,116 45% 1,678 59% 2,194 60% 2,533
At least one BH condition 35% 1,466 50% 2,149 61% 2,465 60% 2,597
At least one PH and at least one BH condition 47% 1,932 62% 2,901 71% 3,843 74% 3,877
More than two BH or PH conditions 63% 2,929 73% 3,827 76% 3,938 79% 5,174
Medically Frail 33% 1,431 52% 2,209 61% 2,459 61% 2,651
Source: Claims data from FSSA. Notes: BH = Behavioral Health, PH = Physical Health.
1. Seven physical health conditions, namely, Diabetes, Congestive Heart Failure, Coronary Artery Disease, Asthma, Chronic Obstructive Pulmonary Disease, Chronic Kidney Disease, and Rheumatoid Arthritis are included in this category.
2. Seven behavioral health conditions, namely, Autism, Depression, Schizophrenia, Bipolar Disorder, Other Severe and Persistent Mental Illness, Attention Deficit Hyperactivity Disorder, and Substance Abuse are included in this category.
3. For the row of “all members” the denominator is the total member count for each group presented in Table 2.1.4. Denominator for each of the other percentages reported is the respective count of unique members with a relevant BH or PH condition or the count of unique members with medical frailty in the corresponding row in Table 2.1.4.
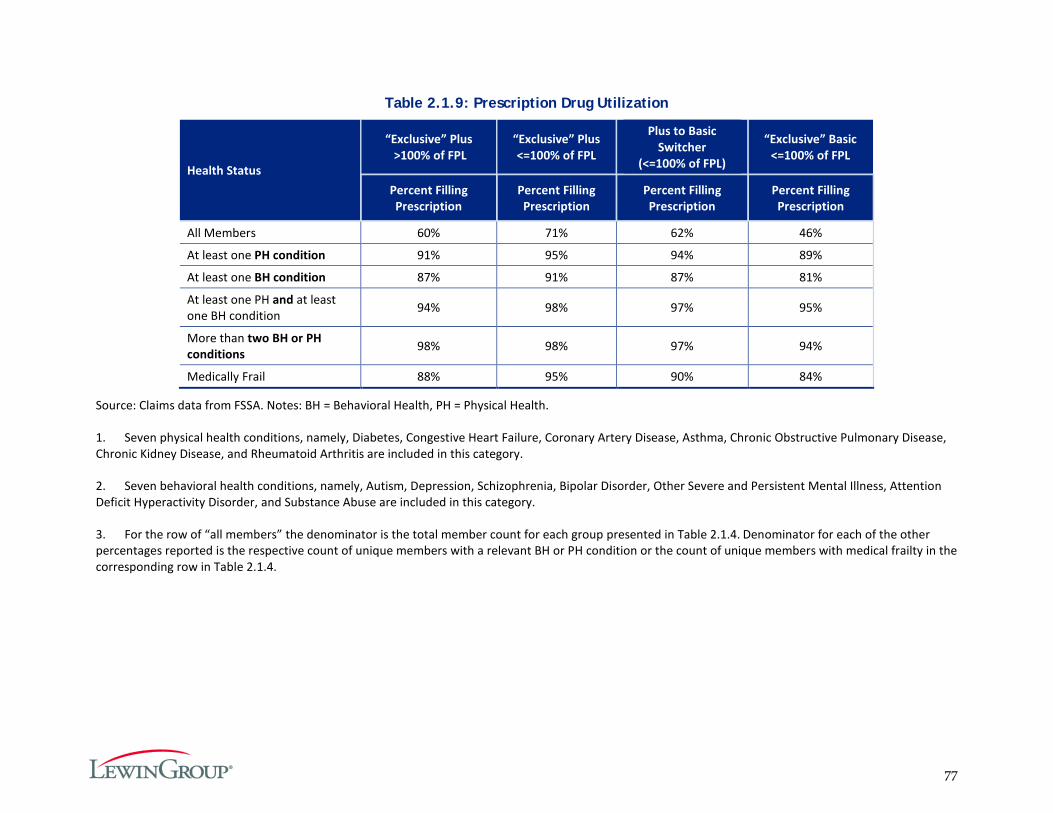
77
Table 2.1.9: Prescription Drug Utilization
Health Status
“Exclusive” Plus >100% of FPL
“Exclusive” Plus <=100% of FPL
Plus to Basic Switcher
(<=100% of FPL)
“Exclusive” Basic <=100% of FPL
Percent Filling Prescription
Percent Filling Prescription
Percent Filling Prescription
Percent Filling Prescription
All Members 60% 71% 62% 46%
At least one PH condition 91% 95% 94% 89%
At least one BH condition 87% 91% 87% 81%
At least one PH and at least one BH condition 94% 98% 97% 95%
More than two BH or PH conditions 98% 98% 97% 94%
Medically Frail 88% 95% 90% 84%
Source: Claims data from FSSA. Notes: BH = Behavioral Health, PH = Physical Health.
1. Seven physical health conditions, namely, Diabetes, Congestive Heart Failure, Coronary Artery Disease, Asthma, Chronic Obstructive Pulmonary Disease, Chronic Kidney Disease, and Rheumatoid Arthritis are included in this category.
2. Seven behavioral health conditions, namely, Autism, Depression, Schizophrenia, Bipolar Disorder, Other Severe and Persistent Mental Illness, Attention Deficit Hyperactivity Disorder, and Substance Abuse are included in this category.
3. For the row of “all members” the denominator is the total member count for each group presented in Table 2.1.4. Denominator for each of the other percentages reported is the respective count of unique members with a relevant BH or PH condition or the count of unique members with medical frailty in the corresponding row in Table 2.1.4.
78
Hypothesis 2.2: HIP Plus Members will Exhibit More Cost-conscious Healthcare Consumption Behavior than: a) HIP Basic Members; and b) Traditional Hoosier Healthwise Members in the Areas of Primary, Specialty, and Pharmacy Service Utilization without Harming Beneficiary Health.
HIP 2.0 policies are intended to encourage members, particularly HIP Plus members, to make cost-conscious healthcare decisions in the short term by managing their healthcare spending, and in the longer term by improving their health.104 To test this hypothesis, the analysis focuses on four research questions:
1. Do HIP Plus members exhibit cost-conscious consumption behavior, e.g. prescription drug adherence, primary care vs specialty care use, chronic disease management, appropriate use of the ED, and generic vs. brand name medication use? In what area(s)?
2. Do HIP Plus members ask about the cost of care before receiving the care?
3. Do HIP Plus members avoid getting needed care because of the cost of that care?
4. Are HIP Plus members less likely to reach the 5 percent of household income limit (threshold) on out-of-pocket costs?
To address the first research question, the healthcare consumption behavior of two populations with different incentives for cost-conscious behavior were compared: HIP Plus and HIP Basic members. Specifically, utilization between these two groups was compared for the following services:
Appropriate use of the Emergency Department;
Use of generic prescription drugs rather than brand name drugs;
Adherence to prescription drugs;
Completion of qualifying preventive services; and
Use of primary and specialty care for members with chronic diseases.
The Final Evaluation Report will compare utilization of services by Hoosier Healthwise members transitioning into HIP 2.0, before and after the transition. Due to data issues, we are unable to report on utilization for this population in this report.
Research questions two and three use data from the current member survey to explore whether HIP Plus members are more likely to report engaging in cost conscious behavior. Question two addresses whether HIP Plus members are more likely to report that they ask about the cost of care, suggesting that they are sensitive to the cost of services. Question three examines whether members report ever foregoing needed care because of the cost of care. Data is currently not available to address the fourth question on the likelihood of members reaching the 5 percent threshold on out-of-pocket costs.
104 See Table 3 in the Program Overview for a comparison of HIP Plus and HIP Basic policies that could affect healthcare utilization behavior.
79
Research Question 2.2.1: Are HIP Plus members more likely to exhibit cost-conscious consumption behavior, e.g. prescription drug adherence, primary care vs specialty care use, chronic disease management, appropriate use of the ED, and generic vs. brand name medication use? In what area(s)?
To estimate the effect of HIP policies on cost-conscious behavior, we compare the utilization of HIP Plus and HIP Basic members. For these analyses, where possible, any members transitioning between HIP Plus and HIP Basic during the year were excluded. Members moving between the two plans are subject to different incentives compared to exclusively HIP Plus or exclusively HIP Basic members and including them in the comparison could affect the results (as implied by the results discussed under Goal 2.1). The previous section (Goal 2.1) examines ‘switchers’ in depth, and Goal 3 provides a comparison of all Basic and Plus members.
Appropriate use of the Emergency Department
As described previously, both HIP Basic and HIP Plus members must pay a co-payment if they use the ED unnecessarily: $8 for the first non-emergency visit and $25 for each subsequent visit within the same 12 month benefit period. At the point of service, providers are responsible for determining whether a member is subject to the co-payment based on whether the member has an emergency condition meeting the ‘prudent layperson standard.’ All ED claims are then subject to additional review by the MCEs.
It is not possible to report on the percentage of visits deemed non-emergent by the MCEs, as there were some inconsistencies on how each MCE reported their data. These will be resolved for future reports. Instead, the New York University (NYU) Emergency Department algorithm was used to estimate the percent of ED visits that were non-emergent.105 The NYU algorithm uses diagnosis codes to assign a probability to whether a visit was non-emergent, primary care treatable, emergent but preventable, emergent but not preventable, or due to injury, mental health problems or alcohol or substance abuse. See Table 2.2.1 below for descriptions of each category. A weighted mean across all visits is then computed for each category, which serves as an estimate of the proportion of visits that are within that category.
Table 2.2.1: NYU Emergent Classification
Description
Non-emergent Immediate medical care was not required within 12 hours Emergent/Primary Care Treatable
Treatment was required within 12 hours, but care could have been provided effectively and safely in a primary care setting
Emergent - ED Care Needed - Preventable/Avoidable
Emergency department care was required based on the complaint or procedures performed/resources used, but the emergent nature of the condition was potentially preventable/avoidable if timely and effective ambulatory care had been received during the episode of illness
Emergent - ED Care Needed - Not Preventable/Avoidable
Emergency department care was required and ambulatory care treatment could not have prevented the condition
105 The algorithm was developed by the NYU Center for Health and Public Service Research in collaboration with a panel of experts. For a description of the methods, see NYU Background/Introduction. Retrieved June 20, 2016 from http://wagner.nyu.edu/faculty/billings/nyued-background.
80
Description
Injury Visit is the result of an injury Mental health problem Visit is the result of a mental health problem Alcohol or substance abuse Visit is the result of alcohol or substance abuse
Source: NYU Wagner Background/Introduction.106
The classification of each claim is based on the primary diagnosis code of the visit and does not take into account other factors such as age or comorbidities of the patient. For this reason, the NYU method differs fundamentally from the MCE’s method for determining non-emergency visits: the NYU method is based on the member’s discharge diagnosis whereas the MCE’s method is based on the member’s presenting complaint. A member’s presenting complaint does not correspond directly to the member’s discharge diagnosis: for example, a 65-year-old patient with diabetes may be discharged with the “non-emergency” diagnosis of gastroesophageal reflux after presenting with a chief complaint of chest pain; however, that patient still required an emergency evaluation to rule out acute coronary syndrome.”107 The NYU algorithm takes into account this uncertainty in its probability assignments, however because of this difference, NYU estimates of non-emergency use will differ from MCE-reported rates of non-emergency use.
Table 2.2.2 below presents data on the total number of ED visits and the percentage that are non-emergent by plan type. The analysis is restricted to ‘exclusive’ Plus and Basic members, i.e. members who did not switch between the two plans during the year.
Plus members demonstrated lower rates of ED use overall compared to Basic members, including lower rates of non-emergency use of the ED. Correspondingly, HIP Plus members are also more likely to use the ED for visits that were not preventable/avoidable. These trends are consistent with HIP Plus members using more preventive and primary care (discussed below).
Table 2.2.2: Emergency Department Utilization, by Plan Type
Emergency Department Utilization Basic Plus Total members 126,275 231,826 Total number of Emergency Department visits 80,233 115,168 Visits to ED per 1000 member years 1,033.6 775.4 Non-emergent visits to ED per 1000 members per year 262.6 182.6 Percent of visits non-emergent 25.4% 23.5% Percent of visits emergent/primary care treatable 24.0% 23.6% Percent of visits emergent - ED care needed - preventable/avoidable 6.0% 5.7% Percent of visits emergent - ED care needed - not preventable/avoidable 11.3% 13.2%
106 NYU Background/Introduction. Retrieved June 20, 2016 from http://wagner.nyu.edu/faculty/billings/nyued-background.
107 Raven, M., Lowe, R. A., Maselli, J., & Hsia, R. Y. (2013). Comparison of presenting complaint vs. discharge diagnosis for identifying “non-emergency” emergency department visits. JAMA : The Journal of the American Medical Association, 309(11), 1145–1153. Retrieved June 20, 2016 from http://doi.org/10.1001/jama.2013.1948
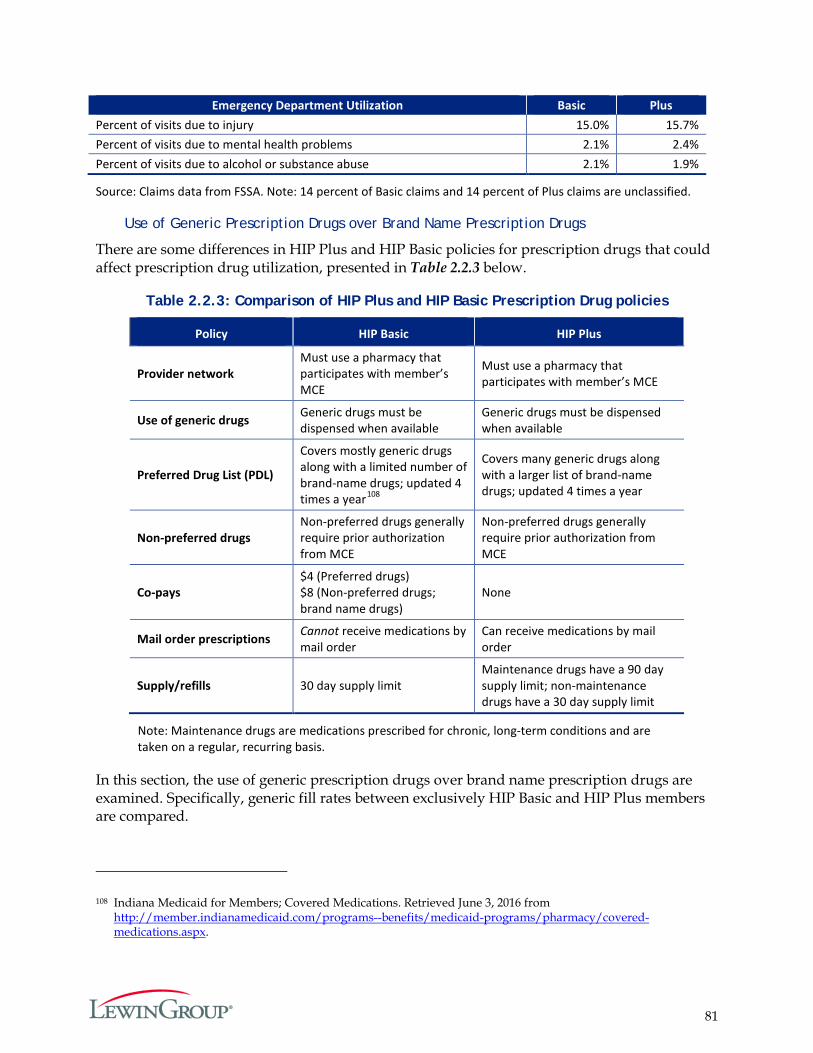
81
Emergency Department Utilization Basic Plus Percent of visits due to injury 15.0% 15.7% Percent of visits due to mental health problems 2.1% 2.4% Percent of visits due to alcohol or substance abuse 2.1% 1.9%
Source: Claims data from FSSA. Note: 14 percent of Basic claims and 14 percent of Plus claims are unclassified.
Use of Generic Prescription Drugs over Brand Name Prescription Drugs
There are some differences in HIP Plus and HIP Basic policies for prescription drugs that could affect prescription drug utilization, presented in Table 2.2.3 below.
Table 2.2.3: Comparison of HIP Plus and HIP Basic Prescription Drug policies
Policy HIP Basic HIP Plus
Provider network Must use a pharmacy that participates with member’s MCE
Must use a pharmacy that participates with member’s MCE
Use of generic drugs Generic drugs must be dispensed when available
Generic drugs must be dispensed when available
Preferred Drug List (PDL)
Covers mostly generic drugs along with a limited number of brand-name drugs; updated 4 times a year108
Covers many generic drugs along with a larger list of brand-name drugs; updated 4 times a year
Non-preferred drugs Non-preferred drugs generally require prior authorization from MCE
Non-preferred drugs generally require prior authorization from MCE
Co-pays $4 (Preferred drugs) $8 (Non-preferred drugs; brand name drugs)
None
Mail order prescriptions Cannot receive medications by mail order
Can receive medications by mail order
Supply/refills 30 day supply limit Maintenance drugs have a 90 day supply limit; non-maintenance drugs have a 30 day supply limit
Note: Maintenance drugs are medications prescribed for chronic, long-term conditions and are taken on a regular, recurring basis.
In this section, the use of generic prescription drugs over brand name prescription drugs are examined. Specifically, generic fill rates between exclusively HIP Basic and HIP Plus members are compared.
108 Indiana Medicaid for Members; Covered Medications. Retrieved June 3, 2016 from http://member.indianamedicaid.com/programs--benefits/medicaid-programs/pharmacy/covered-medications.aspx.
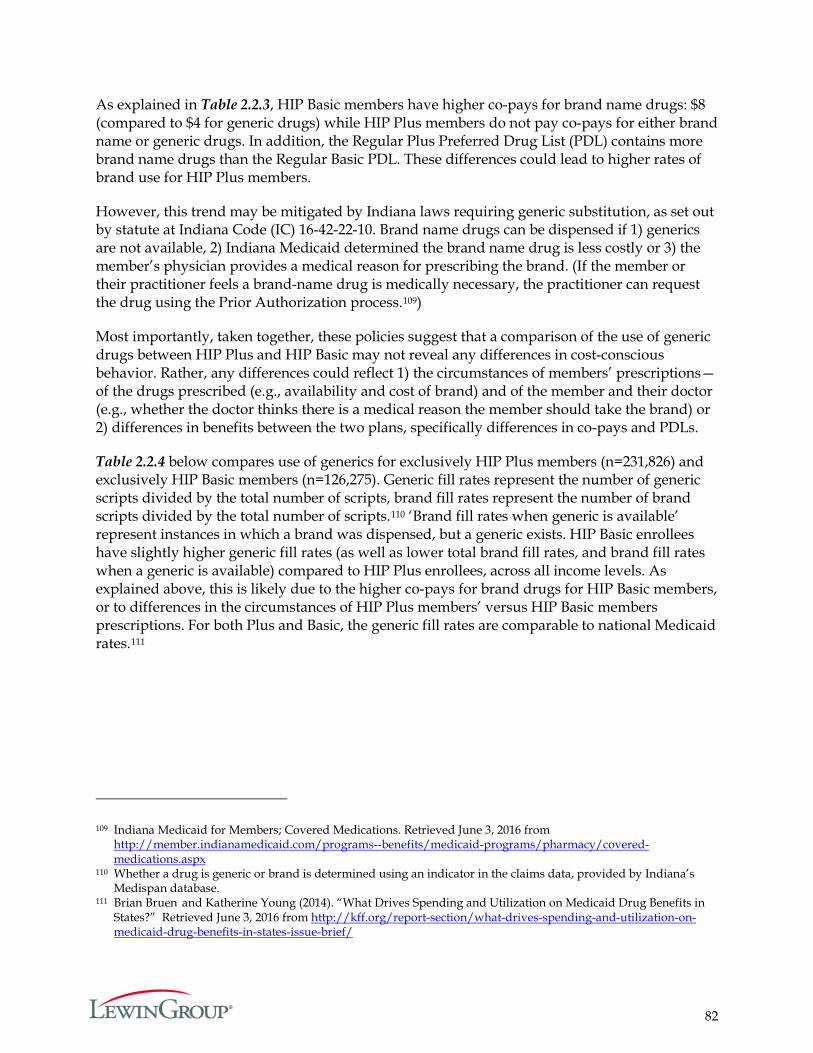
82
As explained in Table 2.2.3, HIP Basic members have higher co-pays for brand name drugs: $8 (compared to $4 for generic drugs) while HIP Plus members do not pay co-pays for either brand name or generic drugs. In addition, the Regular Plus Preferred Drug List (PDL) contains more brand name drugs than the Regular Basic PDL. These differences could lead to higher rates of brand use for HIP Plus members.
However, this trend may be mitigated by Indiana laws requiring generic substitution, as set out by statute at Indiana Code (IC) 16-42-22-10. Brand name drugs can be dispensed if 1) generics are not available, 2) Indiana Medicaid determined the brand name drug is less costly or 3) the member’s physician provides a medical reason for prescribing the brand. (If the member or their practitioner feels a brand-name drug is medically necessary, the practitioner can request the drug using the Prior Authorization process.109)
Most importantly, taken together, these policies suggest that a comparison of the use of generic drugs between HIP Plus and HIP Basic may not reveal any differences in cost-conscious behavior. Rather, any differences could reflect 1) the circumstances of members’ prescriptions—of the drugs prescribed (e.g., availability and cost of brand) and of the member and their doctor (e.g., whether the doctor thinks there is a medical reason the member should take the brand) or 2) differences in benefits between the two plans, specifically differences in co-pays and PDLs.
Table 2.2.4 below compares use of generics for exclusively HIP Plus members (n=231,826) and exclusively HIP Basic members (n=126,275). Generic fill rates represent the number of generic scripts divided by the total number of scripts, brand fill rates represent the number of brand scripts divided by the total number of scripts.110 ‘Brand fill rates when generic is available’ represent instances in which a brand was dispensed, but a generic exists. HIP Basic enrollees have slightly higher generic fill rates (as well as lower total brand fill rates, and brand fill rates when a generic is available) compared to HIP Plus enrollees, across all income levels. As explained above, this is likely due to the higher co-pays for brand drugs for HIP Basic members, or to differences in the circumstances of HIP Plus members’ versus HIP Basic members prescriptions. For both Plus and Basic, the generic fill rates are comparable to national Medicaid rates.111
109 Indiana Medicaid for Members; Covered Medications. Retrieved June 3, 2016 from http://member.indianamedicaid.com/programs--benefits/medicaid-programs/pharmacy/covered-medications.aspx
110 Whether a drug is generic or brand is determined using an indicator in the claims data, provided by Indiana’s Medispan database.
111 Brian Bruen and Katherine Young (2014). “What Drives Spending and Utilization on Medicaid Drug Benefits in States?” Retrieved June 3, 2016 from http://kff.org/report-section/what-drives-spending-and-utilization-on-medicaid-drug-benefits-in-states-issue-brief/
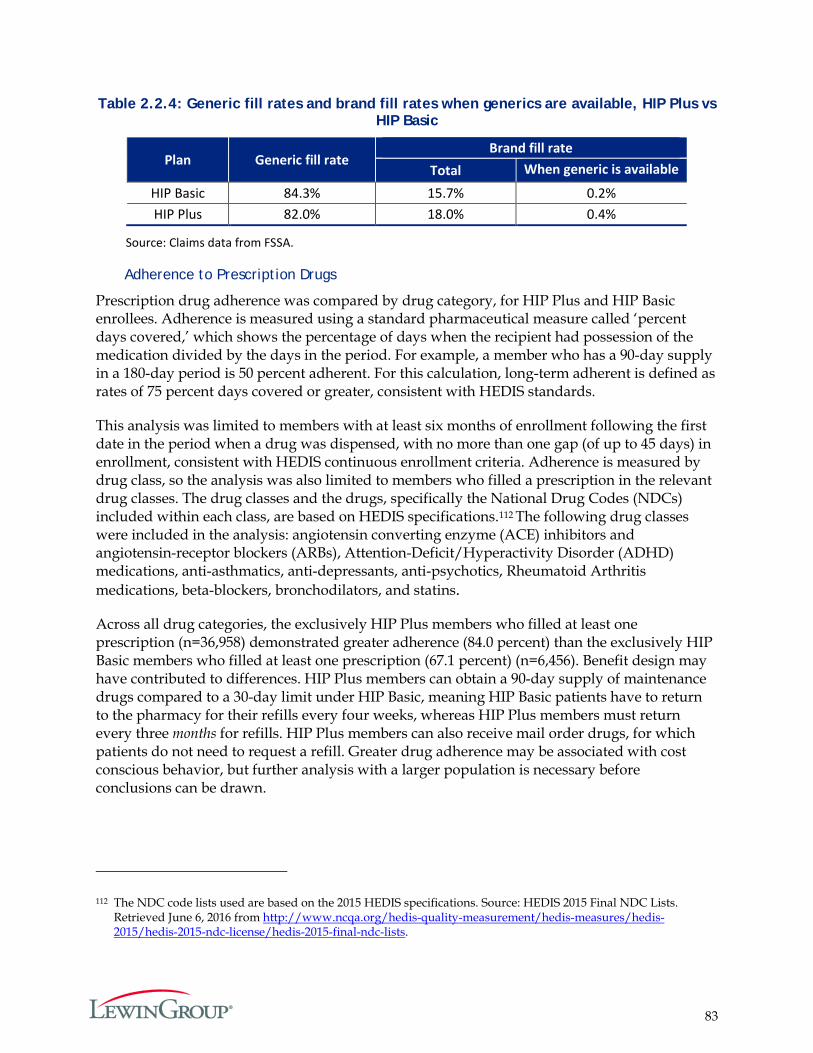
83
Table 2.2.4: Generic fill rates and brand fill rates when generics are available, HIP Plus vs HIP Basic
Plan Generic fill rate Brand fill rate
Total When generic is available
HIP Basic 84.3% 15.7% 0.2% HIP Plus 82.0% 18.0% 0.4%
Source: Claims data from FSSA.
Adherence to Prescription Drugs
Prescription drug adherence was compared by drug category, for HIP Plus and HIP Basic enrollees. Adherence is measured using a standard pharmaceutical measure called ‘percent days covered,’ which shows the percentage of days when the recipient had possession of the medication divided by the days in the period. For example, a member who has a 90-day supply in a 180-day period is 50 percent adherent. For this calculation, long-term adherent is defined as rates of 75 percent days covered or greater, consistent with HEDIS standards.
This analysis was limited to members with at least six months of enrollment following the first date in the period when a drug was dispensed, with no more than one gap (of up to 45 days) in enrollment, consistent with HEDIS continuous enrollment criteria. Adherence is measured by drug class, so the analysis was also limited to members who filled a prescription in the relevant drug classes. The drug classes and the drugs, specifically the National Drug Codes (NDCs) included within each class, are based on HEDIS specifications.112 The following drug classes were included in the analysis: angiotensin converting enzyme (ACE) inhibitors and angiotensin-receptor blockers (ARBs), Attention-Deficit/Hyperactivity Disorder (ADHD) medications, anti-asthmatics, anti-depressants, anti-psychotics, Rheumatoid Arthritis medications, beta-blockers, bronchodilators, and statins.
Across all drug categories, the exclusively HIP Plus members who filled at least one prescription (n=36,958) demonstrated greater adherence (84.0 percent) than the exclusively HIP Basic members who filled at least one prescription (67.1 percent) (n=6,456). Benefit design may have contributed to differences. HIP Plus members can obtain a 90-day supply of maintenance drugs compared to a 30-day limit under HIP Basic, meaning HIP Basic patients have to return to the pharmacy for their refills every four weeks, whereas HIP Plus members must return every three months for refills. HIP Plus members can also receive mail order drugs, for which patients do not need to request a refill. Greater drug adherence may be associated with cost conscious behavior, but further analysis with a larger population is necessary before conclusions can be drawn.
112 The NDC code lists used are based on the 2015 HEDIS specifications. Source: HEDIS 2015 Final NDC Lists. Retrieved June 6, 2016 from http://www.ncqa.org/hedis-quality-measurement/hedis-measures/hedis-2015/hedis-2015-ndc-license/hedis-2015-final-ndc-lists.
84
Completion of Qualifying Preventive Services
HIP Plus and HIP Basic members receive rollover benefits for receiving at least one qualifying preventive service. HIP Plus members can double their rollover amount if they receive at least one qualifying service (and have money leftover in the POWER Account), thereby reducing or eliminating future contributions. HIP Basic members are eligible for rollover if they receive at least one qualifying service, and can reduce future contributions for HIP Plus by up to 50 percent (if they move to HIP Plus).113
Members have a full 12 months to obtain a preventive service to qualify for rollover. As many members in HIP 2.0 have not yet reached 12 months of enrollment in the data available for this evaluation, the preventive service results are presented by the total number of months members were enrolled.
Exhibit 2.2.1 shows the percentage of HIP Plus and HIP Basic members who received a qualifying preventive care service (the discussion in Goal 3 provides more detail on what distinguishes a “qualifying” preventive care service) by number of months enrolled in the program. For this analysis, any members transitioning between HIP Plus and HIP Basic were excluded because these members are subject to different incentives than exclusively HIP Plus or HIP Basic members. HIP Plus members exhibit higher rates of preventive services at all durations of enrollment. For those enrolled during the full first demonstration year, about 86.5 percent of HIP Plus members compared to 61.7 percent of HIP Basic members received at least one qualifying preventive care service.
Exhibit 2.2.1: Percentage of members receiving at least 1 qualifying service, HIP Plus vs HIP Basic, by duration of enrollment
Source: Claims data from FSSA. These counts exclude any members who transitioned between Plus and Basic over the course of the demonstration year.
113 For more detail on preventive service use and rollover calculations, see Goal 3.
0%
20%
40%
60%
80%
100%
1 2 3 4 5 6 7 8 9 10 11 12
Perc
enta
ge re
ceiv
ing
qual
ified
se
rvic
es
Months Enrolled
Basic Plus
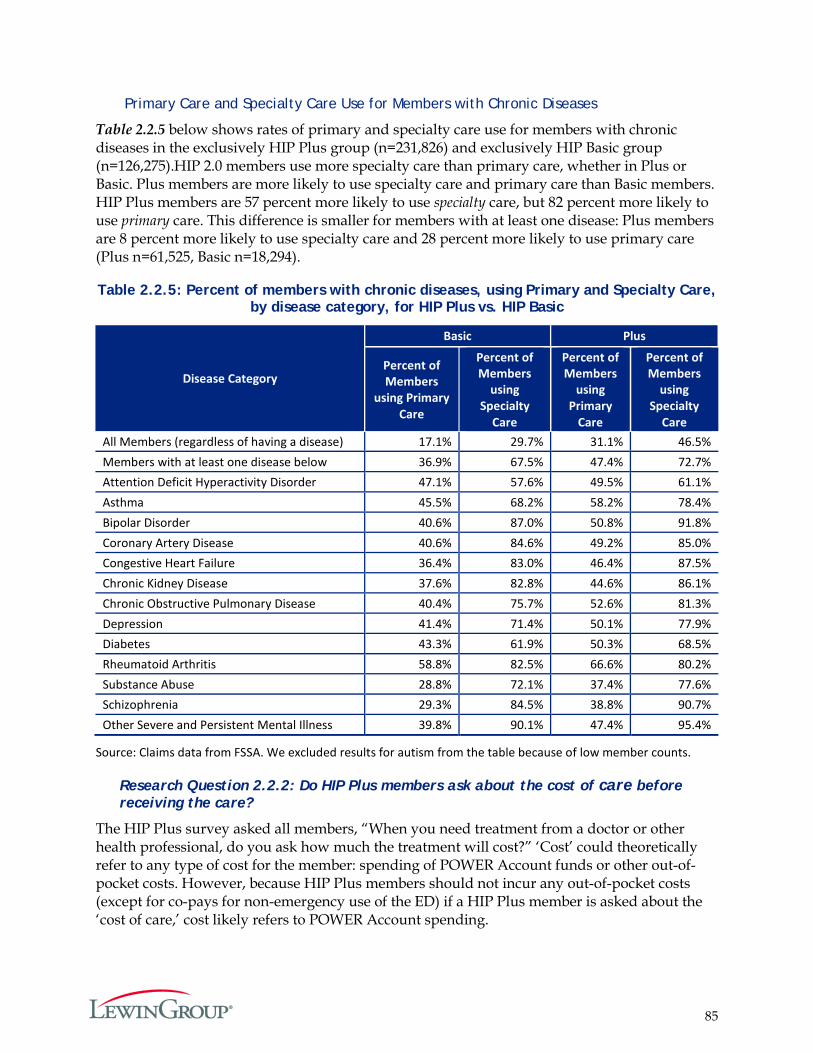
85
Primary Care and Specialty Care Use for Members with Chronic Diseases
Table 2.2.5 below shows rates of primary and specialty care use for members with chronic diseases in the exclusively HIP Plus group (n=231,826) and exclusively HIP Basic group (n=126,275).HIP 2.0 members use more specialty care than primary care, whether in Plus or Basic. Plus members are more likely to use specialty care and primary care than Basic members. HIP Plus members are 57 percent more likely to use specialty care, but 82 percent more likely to use primary care. This difference is smaller for members with at least one disease: Plus members are 8 percent more likely to use specialty care and 28 percent more likely to use primary care (Plus n=61,525, Basic n=18,294).
Table 2.2.5: Percent of members with chronic diseases, using Primary and Specialty Care, by disease category, for HIP Plus vs. HIP Basic
Disease Category
Basic Plus
Percent of Members
using Primary Care
Percent of Members
using Specialty
Care
Percent of Members
using Primary
Care
Percent of Members
using Specialty
Care All Members (regardless of having a disease) 17.1% 29.7% 31.1% 46.5% Members with at least one disease below 36.9% 67.5% 47.4% 72.7% Attention Deficit Hyperactivity Disorder 47.1% 57.6% 49.5% 61.1% Asthma 45.5% 68.2% 58.2% 78.4% Bipolar Disorder 40.6% 87.0% 50.8% 91.8% Coronary Artery Disease 40.6% 84.6% 49.2% 85.0% Congestive Heart Failure 36.4% 83.0% 46.4% 87.5% Chronic Kidney Disease 37.6% 82.8% 44.6% 86.1% Chronic Obstructive Pulmonary Disease 40.4% 75.7% 52.6% 81.3% Depression 41.4% 71.4% 50.1% 77.9% Diabetes 43.3% 61.9% 50.3% 68.5% Rheumatoid Arthritis 58.8% 82.5% 66.6% 80.2% Substance Abuse 28.8% 72.1% 37.4% 77.6% Schizophrenia 29.3% 84.5% 38.8% 90.7% Other Severe and Persistent Mental Illness 39.8% 90.1% 47.4% 95.4%
Source: Claims data from FSSA. We excluded results for autism from the table because of low member counts.
Research Question 2.2.2: Do HIP Plus members ask about the cost of care before receiving the care?
The HIP Plus survey asked all members, “When you need treatment from a doctor or other health professional, do you ask how much the treatment will cost?” ‘Cost’ could theoretically refer to any type of cost for the member: spending of POWER Account funds or other out-of-pocket costs. However, because HIP Plus members should not incur any out-of-pocket costs (except for co-pays for non-emergency use of the ED) if a HIP Plus member is asked about the ‘cost of care,’ cost likely refers to POWER Account spending.
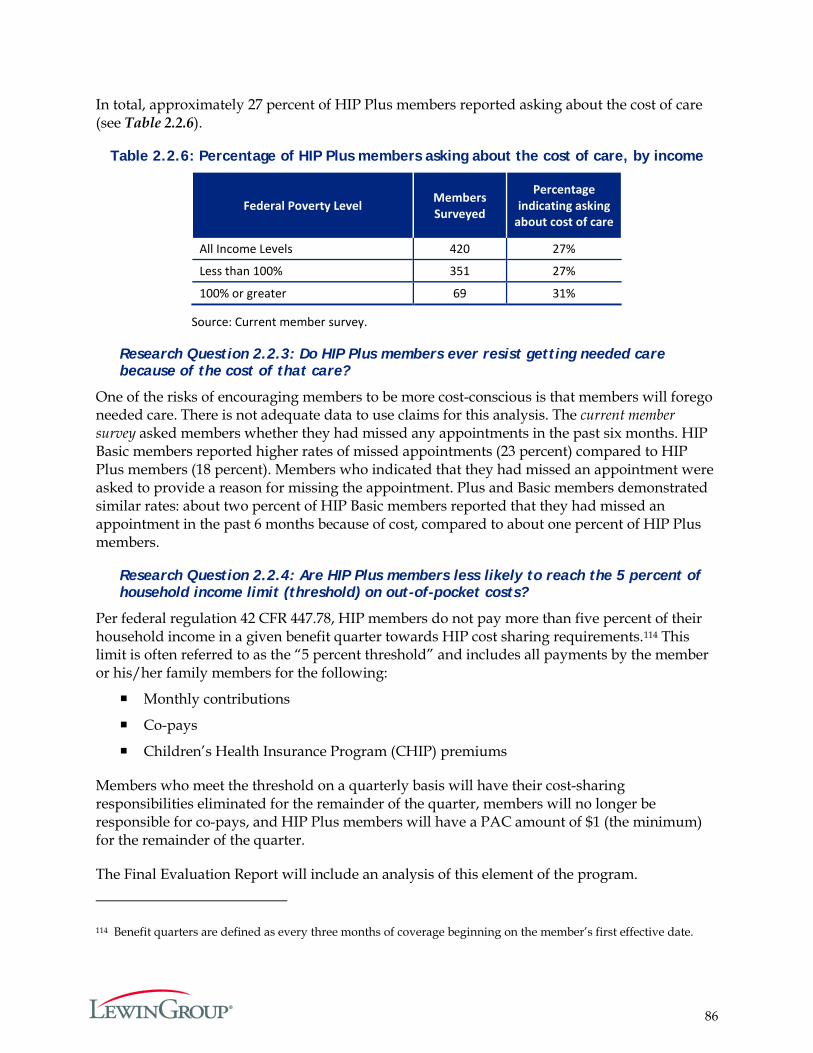
86
In total, approximately 27 percent of HIP Plus members reported asking about the cost of care (see Table 2.2.6).
Table 2.2.6: Percentage of HIP Plus members asking about the cost of care, by income
Federal Poverty Level Members Surveyed
Percentage indicating asking
about cost of care
All Income Levels 420 27%
Less than 100% 351 27%
100% or greater 69 31%
Source: Current member survey.
Research Question 2.2.3: Do HIP Plus members ever resist getting needed care because of the cost of that care?
One of the risks of encouraging members to be more cost-conscious is that members will forego needed care. There is not adequate data to use claims for this analysis. The current member survey asked members whether they had missed any appointments in the past six months. HIP Basic members reported higher rates of missed appointments (23 percent) compared to HIP Plus members (18 percent). Members who indicated that they had missed an appointment were asked to provide a reason for missing the appointment. Plus and Basic members demonstrated similar rates: about two percent of HIP Basic members reported that they had missed an appointment in the past 6 months because of cost, compared to about one percent of HIP Plus members.
Research Question 2.2.4: Are HIP Plus members less likely to reach the 5 percent of household income limit (threshold) on out-of-pocket costs?
Per federal regulation 42 CFR 447.78, HIP members do not pay more than five percent of their household income in a given benefit quarter towards HIP cost sharing requirements.114 This limit is often referred to as the “5 percent threshold” and includes all payments by the member or his/her family members for the following:
Monthly contributions
Co-pays
Children’s Health Insurance Program (CHIP) premiums
Members who meet the threshold on a quarterly basis will have their cost-sharing responsibilities eliminated for the remainder of the quarter, members will no longer be responsible for co-pays, and HIP Plus members will have a PAC amount of $1 (the minimum) for the remainder of the quarter.
The Final Evaluation Report will include an analysis of this element of the program.
114 Benefit quarters are defined as every three months of coverage beginning on the member’s first effective date.
87
Hypothesis 2.3: HIP’s (i) graduated co-payments required for non-emergency use of the emergency department (ED), (ii) the ED prior authorization process, and (iii) efforts to expand access to other urgent care settings will together effectively deter inappropriate ED utilization without harming beneficiary health. The graduated co-payment structure for non-emergency use of the emergency department will decrease inappropriate ED utilization without harming beneficiary health. The prior authorization process for hospital emergency department use and efforts to expand access to other urgent care settings will decrease inappropriate ED without harming beneficiary health.
Hypothesis 2.3 focuses on the effect of HIP policies intended to reduce inappropriate ED utilization among HIP members.
Three research questions are included in the Final Evaluation Plan for this hypothesis:
1. What is the rate of non-emergency use of the ED among individuals in the no-co-pay group vs. the graduated co-pay group?
2. What portion of individuals calling the Nurse Hotline are recommended to go to the ED and what portion of individuals use the ED in spite of the Nurse Hotline advising a different course of action?
3. What portion of individuals are accessing urgent care settings outside of the ED?
Each research question corresponds to a HIP policy aimed at deterring ED use.
Research Question 2.3.1: What is the rate of non-emergency use of the ED among individuals in the control group vs. the graduated co-pay group?
As decribed earlier (see discussion of Goal 2.2.1), to discourage non-emergency use of the emergency department (ED), the state established graduated co-payments for non-emergency use of the ED: $8 for the first non-emergency visit and $25 for each subsequent visit within the same 12 month benefit period. The co-pay cannot be paid through the member’s POWER Account. All HIP members in the Regular and State Basic and Plus plans, except pregnant women and Native Americans, are subject to the co-pay.
To test if applying a $25 co-payment for subsequent ED visits impacts member utilization when compared to a flat $8 co-payment, the state selected a control group that is not subject to the $25 ED co-payment. The control group represents a random sample of 5,000 HIP members who will only have the $8 co-pay obligation, regardless of the number of non-emergency ED visits. The state received approval of the ED co-payment protocol on February 4, 2016; the MCEs are currently working to identify members to be part of the control group.115 Results will be presented in the Final Evaluation Report.
115 HIP 2.0 ER Co-Payment Protocol. (2015, May 1). Retrieved June 27, 2016 from https://www.medicaid.gov/Medicaid-CHIP-Program-Information/By-Topics/Waivers/1115/downloads/in/Healthy-Indiana-Plan-2/in-healthy-indiana-plan-support-20-er-copay-protocol.pdf.
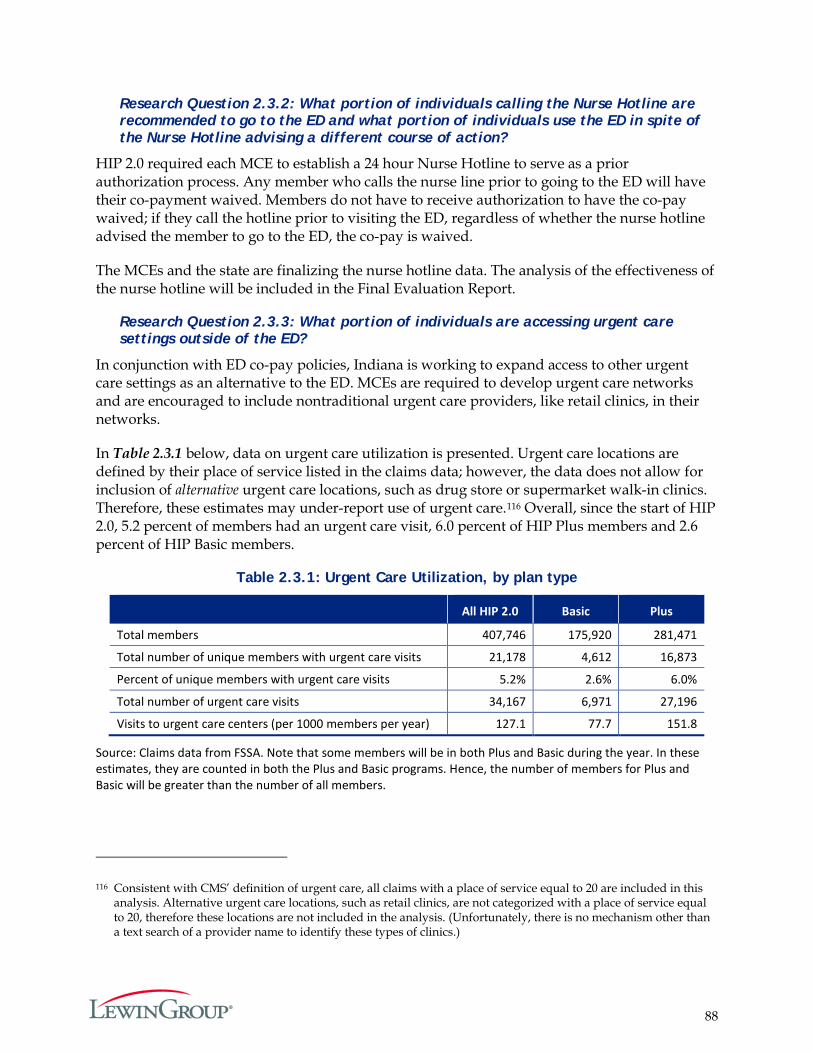
88
Research Question 2.3.2: What portion of individuals calling the Nurse Hotline are recommended to go to the ED and what portion of individuals use the ED in spite of the Nurse Hotline advising a different course of action?
HIP 2.0 required each MCE to establish a 24 hour Nurse Hotline to serve as a prior authorization process. Any member who calls the nurse line prior to going to the ED will have their co-payment waived. Members do not have to receive authorization to have the co-pay waived; if they call the hotline prior to visiting the ED, regardless of whether the nurse hotline advised the member to go to the ED, the co-pay is waived.
The MCEs and the state are finalizing the nurse hotline data. The analysis of the effectiveness of the nurse hotline will be included in the Final Evaluation Report.
Research Question 2.3.3: What portion of individuals are accessing urgent care settings outside of the ED?
In conjunction with ED co-pay policies, Indiana is working to expand access to other urgent care settings as an alternative to the ED. MCEs are required to develop urgent care networks and are encouraged to include nontraditional urgent care providers, like retail clinics, in their networks.
In Table 2.3.1 below, data on urgent care utilization is presented. Urgent care locations are defined by their place of service listed in the claims data; however, the data does not allow for inclusion of alternative urgent care locations, such as drug store or supermarket walk-in clinics. Therefore, these estimates may under-report use of urgent care.116 Overall, since the start of HIP 2.0, 5.2 percent of members had an urgent care visit, 6.0 percent of HIP Plus members and 2.6 percent of HIP Basic members.
Table 2.3.1: Urgent Care Utilization, by plan type
All HIP 2.0 Basic Plus
Total members 407,746 175,920 281,471
Total number of unique members with urgent care visits 21,178 4,612 16,873
Percent of unique members with urgent care visits 5.2% 2.6% 6.0%
Total number of urgent care visits 34,167 6,971 27,196
Visits to urgent care centers (per 1000 members per year) 127.1 77.7 151.8
Source: Claims data from FSSA. Note that some members will be in both Plus and Basic during the year. In these estimates, they are counted in both the Plus and Basic programs. Hence, the number of members for Plus and Basic will be greater than the number of all members.
116 Consistent with CMS’ definition of urgent care, all claims with a place of service equal to 20 are included in this analysis. Alternative urgent care locations, such as retail clinics, are not categorized with a place of service equal to 20, therefore these locations are not included in the analysis. (Unfortunately, there is no mechanism other than a text search of a provider name to identify these types of clinics.)
89
Summary
HIP 2.0 seeks to encourage prudent management of POWER Account funds and to promote responsibility for personal health. In order to achieve these objectives, HIP 2.0 has several incentives to encourage member compliance with required contributions and judicious use of healthcare services. For instance, depending on income level, members are either subject to a six-month disenrollment period or are transferred to the Basic plan if they fail to make a required PAC payment. There is also the potential to decrease future PAC requirements by rolling over funds left over in the POWER Account from the previous enrollment year.
According to a current member survey, 60 percent of the respondents reported hearing of the HIP POWER Account. The proportion was higher for members required to make PACs, i.e., Plus members (66 percent). About 72 percent of HIP Plus members and 76 percent of HIP Basic members who reported hearing of the POWER Account also reported having one. Among members who reported having a POWER Account, 40 percent of HIP Plus and 30 percent of HIP Basic members reported checking their POWER Account balance monthly. A previous survey of members in HIP 1.0, which also required PACs, also asked about POWER Account awareness. In that survey, which was conducted after the HIP 1.0 program had been implemented for several years, 77 percent of respondents reported hearing about the POWER Account. At the time of the HIP 2.0 survey, many members had only been in the program for a few months, which may explain some of the difference.
Despite relatively low levels of POWER Account awareness and monitoring, this analysis finds very high compliance with PAC payments at all income levels. Also a large majority of Plus members surveyed indicated that they were aware that if they did not make payments they would be disenrolled from the program or required to make co-payments.
Drawing on data from the current member survey, a majority of surveyed HIP 2.0 members were also not aware of the HIP policy that they could get no-cost preventive care; however, a majority of members have used such services. The lack of awareness of preventive care coverage is not unique to HIP 2.0. Previous surveys of commercial populations and HIP 1.0 members have found similarly large proportions of members with a lack of awareness about rules for coverage regarding preventive services.
Data from the provider survey suggest that providers were largely aware of and in compliance with policies regarding charging co-payments to Basic members. This is critical, since if co-payments are not appropriately charged for the Basic plan members, then PAC payments for Plus membership will appear disproportionately burdensome.
In exploring if health status and utilization varies among members by whether they make a PAC payment or not, as well as by income, exclusively Plus members with incomes up to the FPL were more likely to have physical and/or behavioral health conditions compared to the exclusively Plus members above the FPL, exclusively Basic members, and the Plus to Basic switchers. Utilization was also generally higher for the lower income Plus members. It appears that those with an option to move to Basic were strategically choosing Plus. Basic members were generally the lowest utilizers of care, with the exception of emergency services. Exclusively Basic members show higher rates of ED use overall, as well as for non-emergency use of the ED. In addition, HIP Plus members demonstrated greater medication adherence (84.0

90
percent) than HIP Basic members (67.1 percent). This may be due to differential prescription drug benefits in Plus compared to Basic (including coverage for longer day supplies and mail order drugs), as well as greater need and use of care by Plus members.
Cost did not appear to be a major barrier to care in data available for this evaluation. Approximately 27 percent of HIP Plus members surveyed reported asking about the cost of care. About one percent of Plus members and two percent of Basic members reported missing appointments due to cost.
91
Goal 3: Promote Disease Prevention and Health Promotion to Achieve Better Health Outcomes
The HIP 2.0 program includes incentives for members to use healthcare appropriately—with a specific focus on increasing the use of preventive care. These incentives aim to help achieve better outcomes for its members. In this section, we focus on the trends of preventive care use for all members ever-enrolled in HIP 2.0 during the first demonstration year.
Hypothesis 3.1: HIP Will Effectively Promote Member Use of Preventive, Primary, and Chronic Disease Management Care to Achieve Improved Health Outcomes.
There are two related research questions associated with this hypothesis:
Research Question 3.1: How do primary care, chronic disease management, and preventive care utilization vary among HIP members?
Research Question 3.2: How does primary care, chronic disease management, and preventive care utilization vary by population age, gender, benefit plan, FPL, etc.?
The second research question adds on sub-group analyses to the first. Hence, similar measures are utilized for each and both questions will be addressed together throughout this section. The measures and methods, as with the other goal analyses, are based on those outlined in the Final Evaluation Plan.
Background
As described in Table 3 of the Program Overview section above, Plus and Basic members face different incentives to use healthcare, particularly preventive care, more wisely. For both Basic and Plus members, preventive services are exempt from PAC funds and member co-payments, and both Basic and Plus members can potentially reduce the amount of future contributions if they receive recommended preventive services. In addition, because both Basic and Plus members are potentially eligible to rollover their share of unused POWER Account funds, both groups have an incentive to use healthcare judiciously. Plus members may have more of an incentive because they make contributions to the POWER Account and would have the ability to rollover a greater amount of any unused POWER Account funds.
Qualifying Preventive Services Exempt from PAC Funds and Eligible for Fulfilling the Rollover Incentive
Each HIP 2.0 member is enrolled in a managed care entity (MCE). Each member is assigned a PMP to help her or him navigate their healthcare needs. The MCEs are also required to educate members about recommended preventive services and the recommended frequencies. In practice, the PMPs are supposed to consult and recommend preventive services specific to each member’s risk factors and other circumstances.
Preventive services are exempt from PAC funds and can also qualify members for a PAC rollover. Although PMPs recommend specific preventive services to their members, MCEs cannot omit or limit credit towards the member’s rollover incentive for services based on age or risk factor guidelines.
92
For the analyses, qualifying preventive care services (for both the rollover and from exclusion of PAC funding) were identified according to the list of Current Procedure Terminology (CPT) and Healthcare Common Procedure Coding System (HCPCS) indicated by the Hoosier Healthwise and Healthy Indiana Plan MCE Policies and Procedures Manual.117 Procedural codes for vision and dental services were added to this list to reflect the state’s policy decision to add vision and dental services to the list of qualifying preventive services. However, it is important to note that HIP benefit packages in regards to vision and dental coverage did not change. Including these codes increased the overall percentage of preventive care users by about five percent; the relative proportions across plan types (i.e., Plus and Basic) and other cohorts remained similar.
Based on the rules for meeting the rollover criteria, no restrictions are placed on where the services need to be provided or which provider needs to deliver the services to the patient. In addition, there were no restrictions based on member circumstances, including diagnoses, age or gender. As long as one service from the list appeared on any of a member’s billed claims, the member would be considered as qualifying for the rollover.
Research Question Findings
Before discussing the results, it is important to note some limitations to the analysis in terms of being able to identify members that have received a qualifying preventive care visit.
Members have a full 12 months to obtain the requisite service for the rollover incentive (Note that estimates of HIP 1.0 members achieving the rollover would have been based on those meeting the 12 months criteria). As the HIP 2.0 program started in February 2015, many members did not have a full 12 months of experience.
Medicaid generally tends to have relatively high turnover, further limiting the number of members enrolled for a full 12 months.
Claims data were extracted in May 2016. Typically, the billing process can take several months to complete. This lag in billing processing may lead to underreporting of healthcare utilization. For the Final Evaluation Report, data will be available directly from MCEs on which members qualify for the rollover, as well as the amounts of the rollovers.
Based on the data received to date, about 36 percent of members were enrolled for six months or less between February 2015 through January 2016 (the first demonstration year). Exhibit 3.1.1 shows the percentage of members who received at least one qualifying preventive care service based on the number of months enrolled in HIP 2.0. As expected, those with more months of
117 The list of qualifying services is found here: Hoosier Healthwise and Healthy Indiana Plan MCE Policies and Procedures Manual. (2016, May 10). Retrieved May 23, 2016, from http://www.indianamedicaid.com/ihcp/HoosierHealthwise/content/MCO_QA/Hoosier%20Healthwise%20and%20HIP%20MCE%20Policies%20and%20Procedures%20Manual%20MC10009.pdf. Note however, that the way that qualifying services are counted for purposes of meeting the rollover criteria has been updated since this publication, which is reflected in this analysis. Specifically, the following dental and vision procedure codes were added to the list of qualifying preventive services: D0120, D0150, D0160, D1110, 92002, 92004, 92012, and 92014. Also, there are no requirements for any of the procedural codes to be accompanied by a diagnosis code on the claims in order to qualify for the rollover.
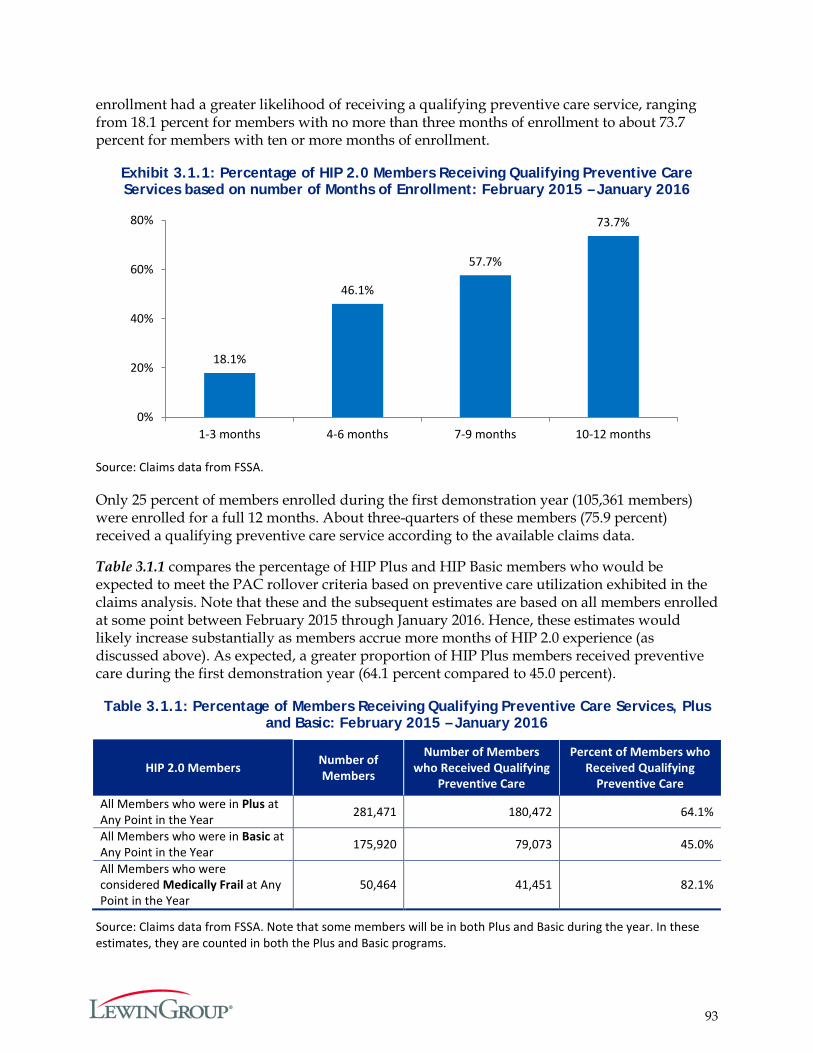
93
enrollment had a greater likelihood of receiving a qualifying preventive care service, ranging from 18.1 percent for members with no more than three months of enrollment to about 73.7 percent for members with ten or more months of enrollment.
Exhibit 3.1.1: Percentage of HIP 2.0 Members Receiving Qualifying Preventive Care Services based on number of Months of Enrollment: February 2015 – January 2016
Source: Claims data from FSSA.
Only 25 percent of members enrolled during the first demonstration year (105,361 members) were enrolled for a full 12 months. About three-quarters of these members (75.9 percent) received a qualifying preventive care service according to the available claims data.
Table 3.1.1 compares the percentage of HIP Plus and HIP Basic members who would be expected to meet the PAC rollover criteria based on preventive care utilization exhibited in the claims analysis. Note that these and the subsequent estimates are based on all members enrolled at some point between February 2015 through January 2016. Hence, these estimates would likely increase substantially as members accrue more months of HIP 2.0 experience (as discussed above). As expected, a greater proportion of HIP Plus members received preventive care during the first demonstration year (64.1 percent compared to 45.0 percent).
Table 3.1.1: Percentage of Members Receiving Qualifying Preventive Care Services, Plus and Basic: February 2015 – January 2016
HIP 2.0 Members Number of Members
Number of Members who Received Qualifying
Preventive Care
Percent of Members who Received Qualifying
Preventive Care All Members who were in Plus at Any Point in the Year 281,471 180,472 64.1%
All Members who were in Basic at Any Point in the Year 175,920 79,073 45.0%
All Members who were considered Medically Frail at Any Point in the Year
50,464 41,451 82.1%
Source: Claims data from FSSA. Note that some members will be in both Plus and Basic during the year. In these estimates, they are counted in both the Plus and Basic programs.
18.1%
46.1%
57.7%
73.7%
0%
20%
40%
60%
80%
1-3 months 4-6 months 7-9 months 10-12 months
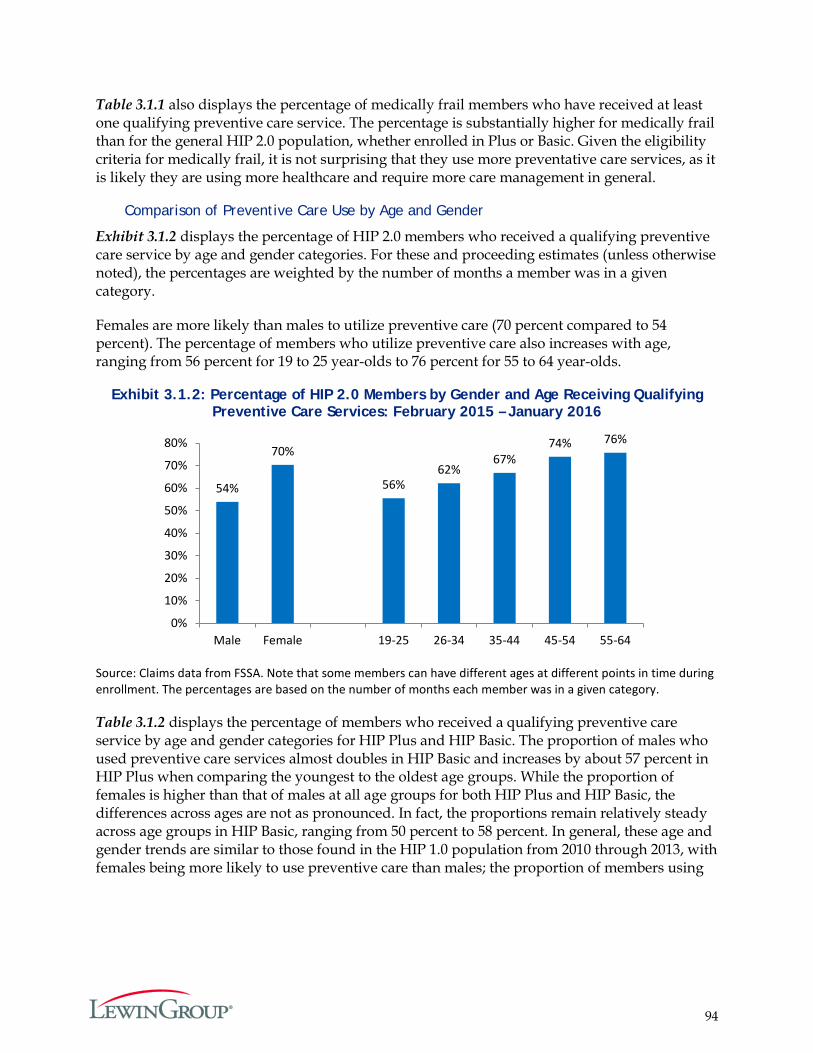
94
Table 3.1.1 also displays the percentage of medically frail members who have received at least one qualifying preventive care service. The percentage is substantially higher for medically frail than for the general HIP 2.0 population, whether enrolled in Plus or Basic. Given the eligibility criteria for medically frail, it is not surprising that they use more preventative care services, as it is likely they are using more healthcare and require more care management in general.
Comparison of Preventive Care Use by Age and Gender
Exhibit 3.1.2 displays the percentage of HIP 2.0 members who received a qualifying preventive care service by age and gender categories. For these and proceeding estimates (unless otherwise noted), the percentages are weighted by the number of months a member was in a given category.
Females are more likely than males to utilize preventive care (70 percent compared to 54 percent). The percentage of members who utilize preventive care also increases with age, ranging from 56 percent for 19 to 25 year-olds to 76 percent for 55 to 64 year-olds.
Exhibit 3.1.2: Percentage of HIP 2.0 Members by Gender and Age Receiving Qualifying Preventive Care Services: February 2015 – January 2016
Source: Claims data from FSSA. Note that some members can have different ages at different points in time during enrollment. The percentages are based on the number of months each member was in a given category.
Table 3.1.2 displays the percentage of members who received a qualifying preventive care service by age and gender categories for HIP Plus and HIP Basic. The proportion of males who used preventive care services almost doubles in HIP Basic and increases by about 57 percent in HIP Plus when comparing the youngest to the oldest age groups. While the proportion of females is higher than that of males at all age groups for both HIP Plus and HIP Basic, the differences across ages are not as pronounced. In fact, the proportions remain relatively steady across age groups in HIP Basic, ranging from 50 percent to 58 percent. In general, these age and gender trends are similar to those found in the HIP 1.0 population from 2010 through 2013, with females being more likely to use preventive care than males; the proportion of members using
54%
70%
56% 62%
67% 74% 76%
0%
10%
20%
30%
40%
50%
60%
70%
80%
Male Female 19-25 26-34 35-44 45-54 55-64
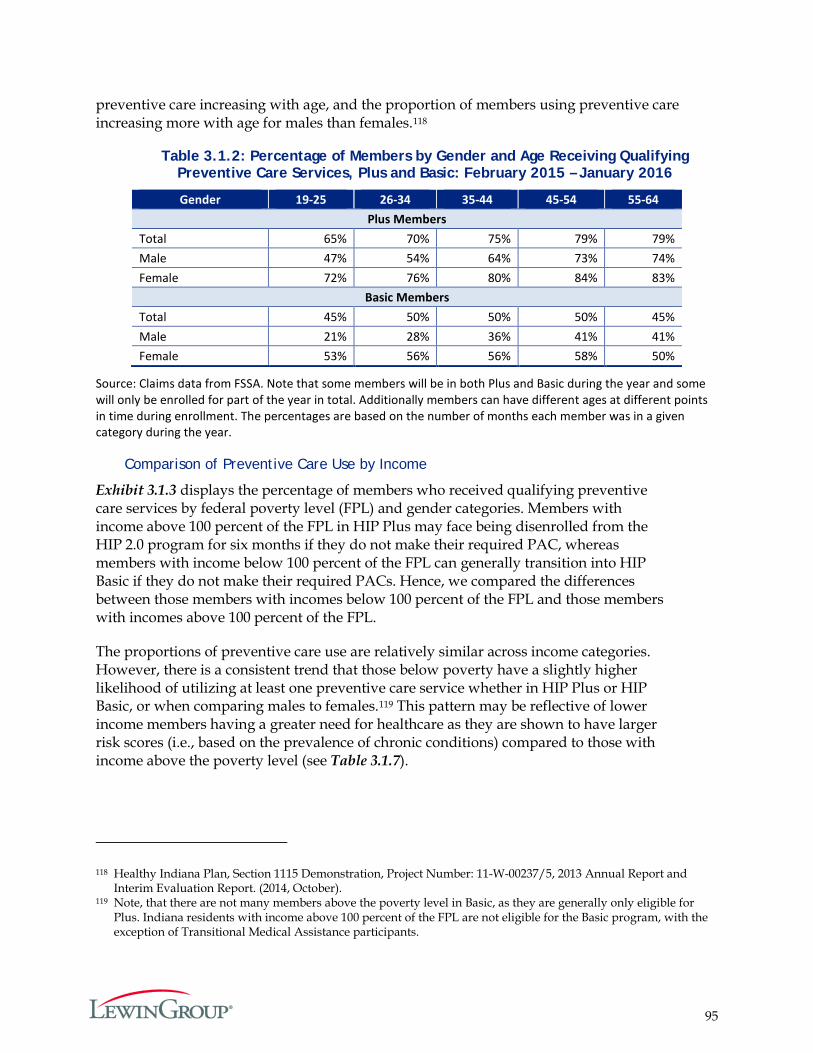
95
preventive care increasing with age, and the proportion of members using preventive care increasing more with age for males than females.118
Table 3.1.2: Percentage of Members by Gender and Age Receiving Qualifying Preventive Care Services, Plus and Basic: February 2015 – January 2016
Gender 19-25 26-34 35-44 45-54 55-64 Plus Members
Total 65% 70% 75% 79% 79% Male 47% 54% 64% 73% 74% Female 72% 76% 80% 84% 83%
Basic Members Total 45% 50% 50% 50% 45% Male 21% 28% 36% 41% 41% Female 53% 56% 56% 58% 50%
Source: Claims data from FSSA. Note that some members will be in both Plus and Basic during the year and some will only be enrolled for part of the year in total. Additionally members can have different ages at different points in time during enrollment. The percentages are based on the number of months each member was in a given category during the year.
Comparison of Preventive Care Use by Income
Exhibit 3.1.3 displays the percentage of members who received qualifying preventive care services by federal poverty level (FPL) and gender categories. Members with income above 100 percent of the FPL in HIP Plus may face being disenrolled from the HIP 2.0 program for six months if they do not make their required PAC, whereas members with income below 100 percent of the FPL can generally transition into HIP Basic if they do not make their required PACs. Hence, we compared the differences between those members with incomes below 100 percent of the FPL and those members with incomes above 100 percent of the FPL.
The proportions of preventive care use are relatively similar across income categories. However, there is a consistent trend that those below poverty have a slightly higher likelihood of utilizing at least one preventive care service whether in HIP Plus or HIP Basic, or when comparing males to females.119 This pattern may be reflective of lower income members having a greater need for healthcare as they are shown to have larger risk scores (i.e., based on the prevalence of chronic conditions) compared to those with income above the poverty level (see Table 3.1.7).
118 Healthy Indiana Plan, Section 1115 Demonstration, Project Number: 11-W-00237/5, 2013 Annual Report and Interim Evaluation Report. (2014, October).
119 Note, that there are not many members above the poverty level in Basic, as they are generally only eligible for Plus. Indiana residents with income above 100 percent of the FPL are not eligible for the Basic program, with the exception of Transitional Medical Assistance participants.
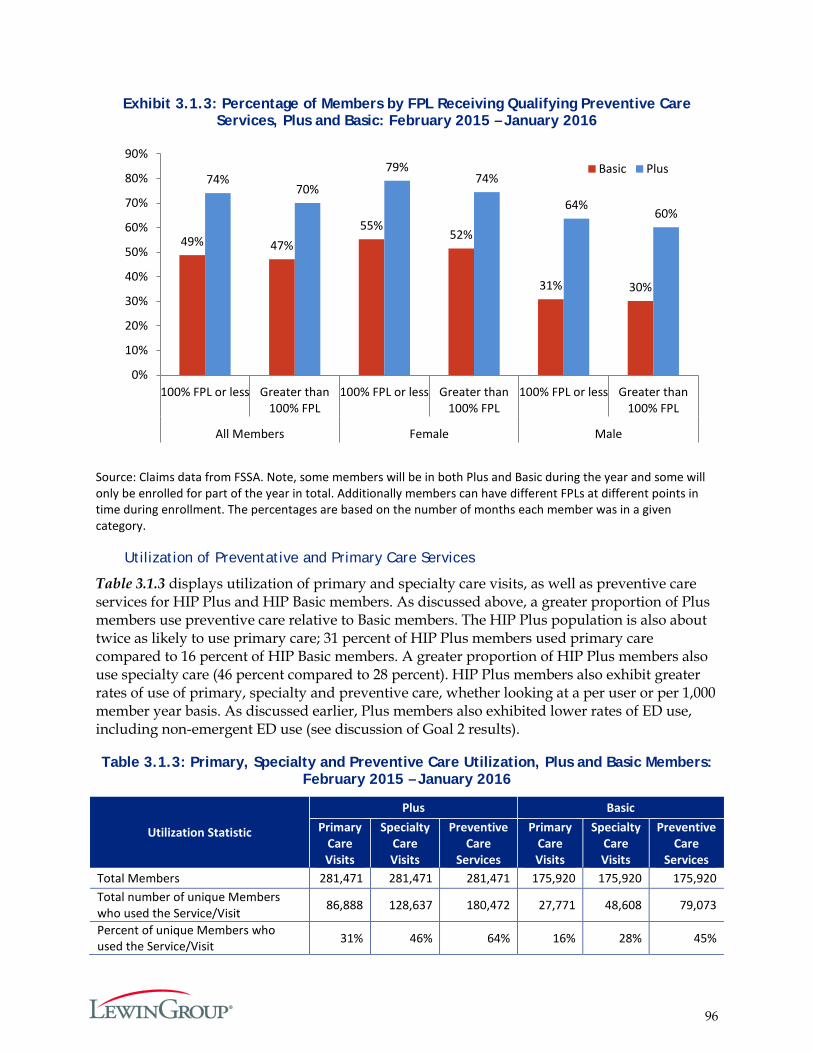
96
Exhibit 3.1.3: Percentage of Members by FPL Receiving Qualifying Preventive Care Services, Plus and Basic: February 2015 – January 2016
Source: Claims data from FSSA. Note, some members will be in both Plus and Basic during the year and some will only be enrolled for part of the year in total. Additionally members can have different FPLs at different points in time during enrollment. The percentages are based on the number of months each member was in a given category.
Utilization of Preventative and Primary Care Services
Table 3.1.3 displays utilization of primary and specialty care visits, as well as preventive care services for HIP Plus and HIP Basic members. As discussed above, a greater proportion of Plus members use preventive care relative to Basic members. The HIP Plus population is also about twice as likely to use primary care; 31 percent of HIP Plus members used primary care compared to 16 percent of HIP Basic members. A greater proportion of HIP Plus members also use specialty care (46 percent compared to 28 percent). HIP Plus members also exhibit greater rates of use of primary, specialty and preventive care, whether looking at a per user or per 1,000 member year basis. As discussed earlier, Plus members also exhibited lower rates of ED use, including non-emergent ED use (see discussion of Goal 2 results).
Table 3.1.3: Primary, Specialty and Preventive Care Utilization, Plus and Basic Members: February 2015 – January 2016
Utilization Statistic
Plus Basic Primary
Care Visits
Specialty Care Visits
Preventive Care
Services
Primary Care Visits
Specialty Care Visits
Preventive Care
Services Total Members 281,471 281,471 281,471 175,920 175,920 175,920 Total number of unique Members who used the Service/Visit 86,888 128,637 180,472 27,771 48,608 79,073
Percent of unique Members who used the Service/Visit 31% 46% 64% 16% 28% 45%
49% 47% 55%
52%
31% 30%
74% 70%
79% 74%
64% 60%
0%
10%
20%
30%
40%
50%
60%
70%
80%
90%
100% FPL or less Greater than100% FPL
100% FPL or less Greater than100% FPL
100% FPL or less Greater than100% FPL
All Members Female Male
Basic Plus
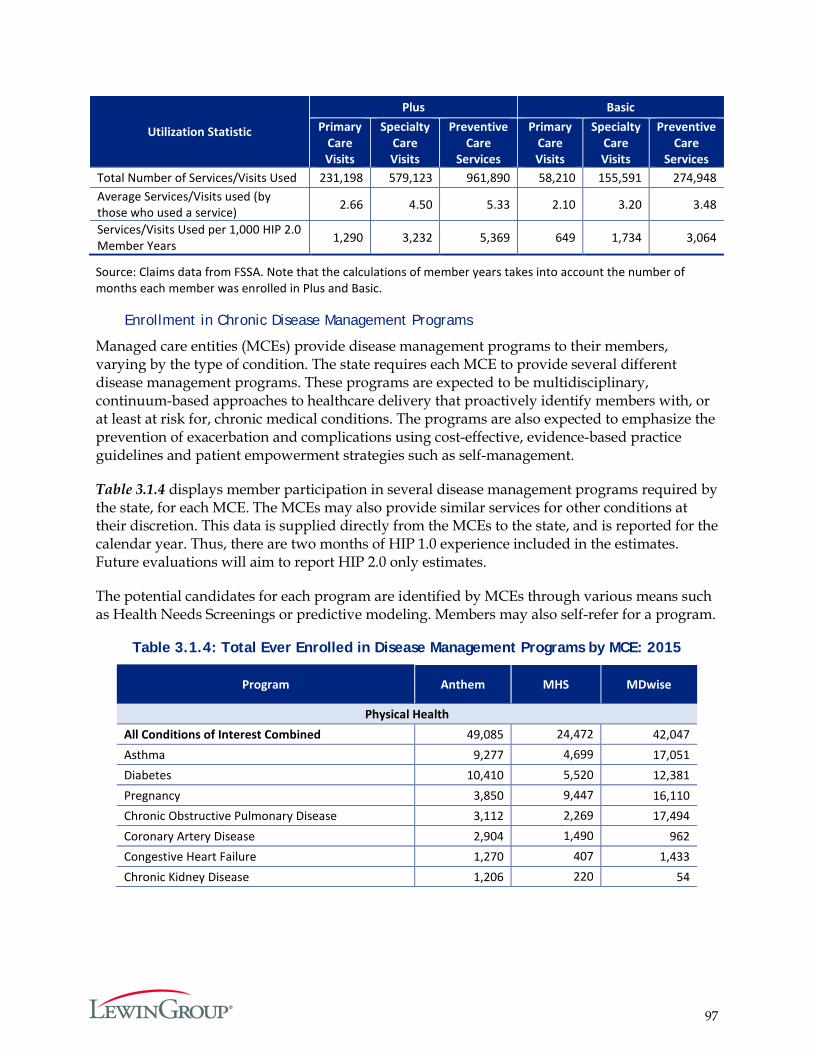
97
Utilization Statistic
Plus Basic Primary
Care Visits
Specialty Care Visits
Preventive Care
Services
Primary Care Visits
Specialty Care Visits
Preventive Care
Services Total Number of Services/Visits Used 231,198 579,123 961,890 58,210 155,591 274,948 Average Services/Visits used (by those who used a service) 2.66 4.50 5.33 2.10 3.20 3.48
Services/Visits Used per 1,000 HIP 2.0 Member Years 1,290 3,232 5,369 649 1,734 3,064
Source: Claims data from FSSA. Note that the calculations of member years takes into account the number of months each member was enrolled in Plus and Basic.
Enrollment in Chronic Disease Management Programs
Managed care entities (MCEs) provide disease management programs to their members, varying by the type of condition. The state requires each MCE to provide several different disease management programs. These programs are expected to be multidisciplinary, continuum-based approaches to healthcare delivery that proactively identify members with, or at least at risk for, chronic medical conditions. The programs are also expected to emphasize the prevention of exacerbation and complications using cost-effective, evidence-based practice guidelines and patient empowerment strategies such as self-management.
Table 3.1.4 displays member participation in several disease management programs required by the state, for each MCE. The MCEs may also provide similar services for other conditions at their discretion. This data is supplied directly from the MCEs to the state, and is reported for the calendar year. Thus, there are two months of HIP 1.0 experience included in the estimates. Future evaluations will aim to report HIP 2.0 only estimates.
The potential candidates for each program are identified by MCEs through various means such as Health Needs Screenings or predictive modeling. Members may also self-refer for a program.
Table 3.1.4: Total Ever Enrolled in Disease Management Programs by MCE: 2015
Program Anthem MHS MDwise
Physical Health All Conditions of Interest Combined 49,085 24,472 42,047 Asthma 9,277 4,699 17,051 Diabetes 10,410 5,520 12,381 Pregnancy 3,850 9,447 16,110 Chronic Obstructive Pulmonary Disease 3,112 2,269 17,494 Coronary Artery Disease 2,904 1,490 962 Congestive Heart Failure 1,270 407 1,433 Chronic Kidney Disease 1,206 220 54
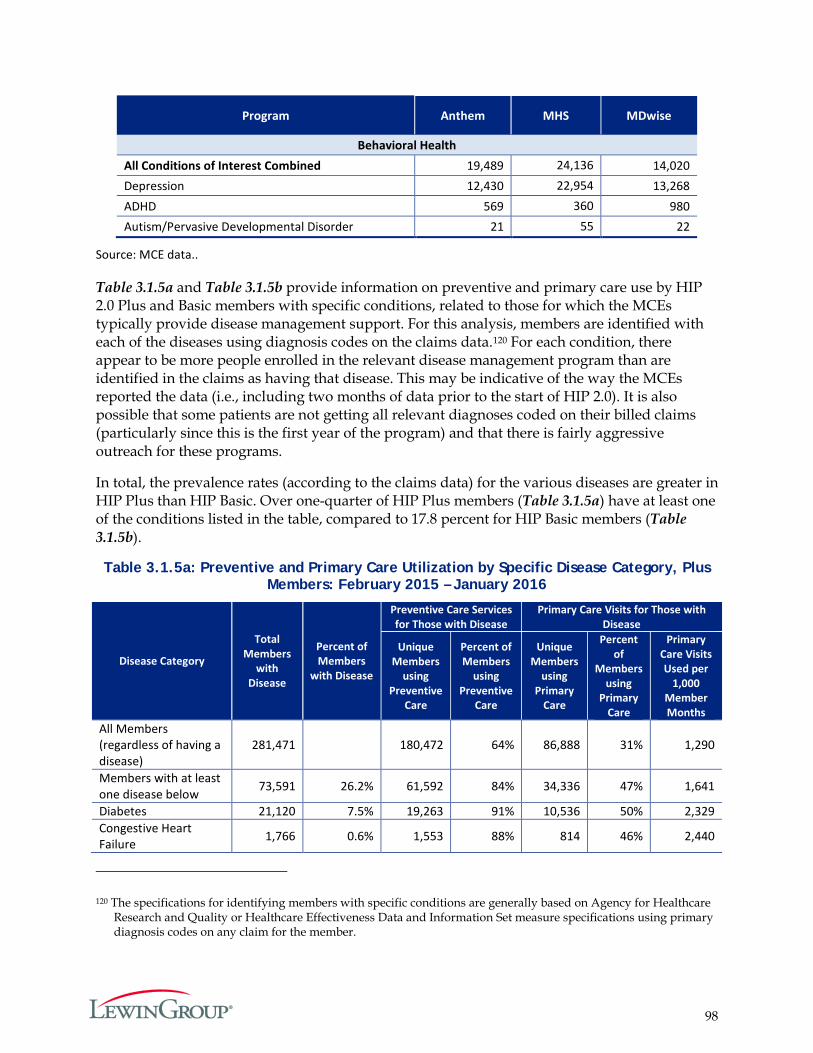
98
Program Anthem MHS MDwise
Behavioral Health All Conditions of Interest Combined 19,489 24,136 14,020 Depression 12,430 22,954 13,268 ADHD 569 360 980 Autism/Pervasive Developmental Disorder 21 55 22
Source: MCE data..
Table 3.1.5a and Table 3.1.5b provide information on preventive and primary care use by HIP 2.0 Plus and Basic members with specific conditions, related to those for which the MCEs typically provide disease management support. For this analysis, members are identified with each of the diseases using diagnosis codes on the claims data.120 For each condition, there appear to be more people enrolled in the relevant disease management program than are identified in the claims as having that disease. This may be indicative of the way the MCEs reported the data (i.e., including two months of data prior to the start of HIP 2.0). It is also possible that some patients are not getting all relevant diagnoses coded on their billed claims (particularly since this is the first year of the program) and that there is fairly aggressive outreach for these programs.
In total, the prevalence rates (according to the claims data) for the various diseases are greater in HIP Plus than HIP Basic. Over one-quarter of HIP Plus members (Table 3.1.5a) have at least one of the conditions listed in the table, compared to 17.8 percent for HIP Basic members (Table 3.1.5b).
Table 3.1.5a: Preventive and Primary Care Utilization by Specific Disease Category, Plus Members: February 2015 – January 2016
Disease Category
Total Members
with Disease
Percent of Members
with Disease
Preventive Care Services for Those with Disease
Primary Care Visits for Those with Disease
Unique Members
using Preventive
Care
Percent of Members
using Preventive
Care
Unique Members
using Primary
Care
Percent of
Members using
Primary Care
Primary Care Visits Used per
1,000 Member Months
All Members (regardless of having a disease)
281,471 180,472 64% 86,888 31% 1,290
Members with at least one disease below 73,591 26.2% 61,592 84% 34,336 47% 1,641
Diabetes 21,120 7.5% 19,263 91% 10,536 50% 2,329 Congestive Heart Failure 1,766 0.6% 1,553 88% 814 46% 2,440
120 The specifications for identifying members with specific conditions are generally based on Agency for Healthcare Research and Quality or Healthcare Effectiveness Data and Information Set measure specifications using primary diagnosis codes on any claim for the member.
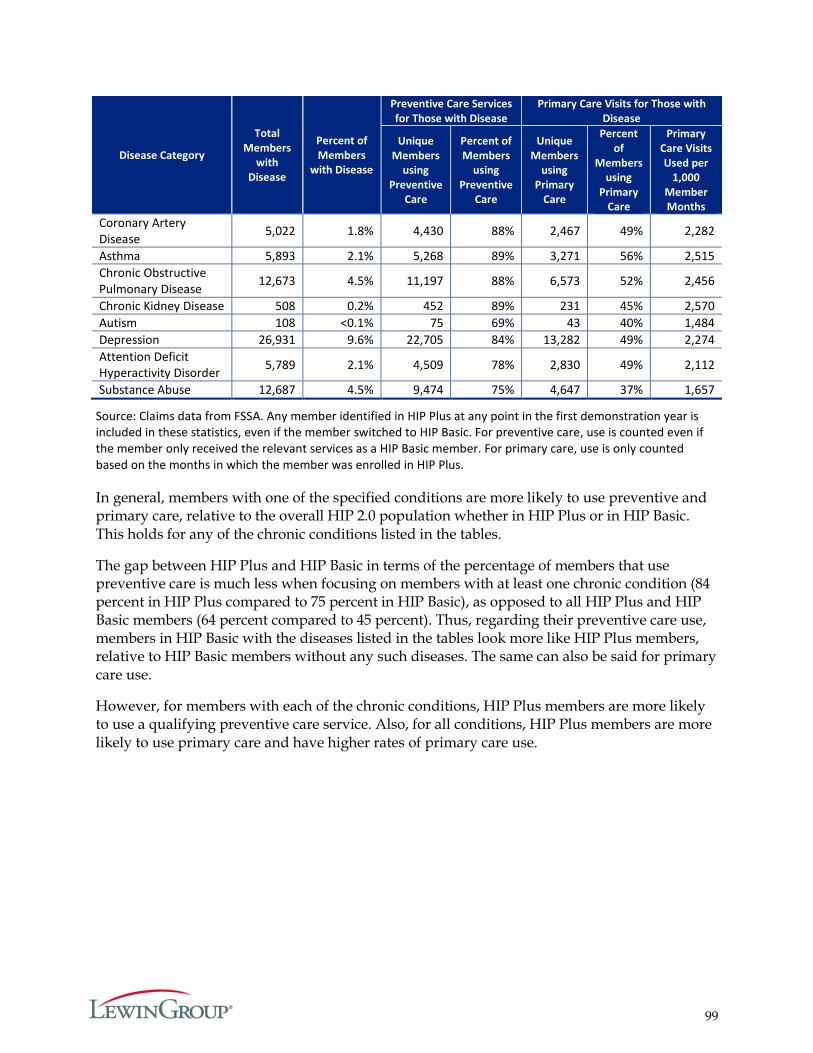
99
Disease Category
Total Members
with Disease
Percent of Members
with Disease
Preventive Care Services for Those with Disease
Primary Care Visits for Those with Disease
Unique Members
using Preventive
Care
Percent of Members
using Preventive
Care
Unique Members
using Primary
Care
Percent of
Members using
Primary Care
Primary Care Visits Used per
1,000 Member Months
Coronary Artery Disease 5,022 1.8% 4,430 88% 2,467 49% 2,282
Asthma 5,893 2.1% 5,268 89% 3,271 56% 2,515 Chronic Obstructive Pulmonary Disease 12,673 4.5% 11,197 88% 6,573 52% 2,456
Chronic Kidney Disease 508 0.2% 452 89% 231 45% 2,570 Autism 108 <0.1% 75 69% 43 40% 1,484 Depression 26,931 9.6% 22,705 84% 13,282 49% 2,274 Attention Deficit Hyperactivity Disorder 5,789 2.1% 4,509 78% 2,830 49% 2,112
Substance Abuse 12,687 4.5% 9,474 75% 4,647 37% 1,657
Source: Claims data from FSSA. Any member identified in HIP Plus at any point in the first demonstration year is included in these statistics, even if the member switched to HIP Basic. For preventive care, use is counted even if the member only received the relevant services as a HIP Basic member. For primary care, use is only counted based on the months in which the member was enrolled in HIP Plus.
In general, members with one of the specified conditions are more likely to use preventive and primary care, relative to the overall HIP 2.0 population whether in HIP Plus or in HIP Basic. This holds for any of the chronic conditions listed in the tables.
The gap between HIP Plus and HIP Basic in terms of the percentage of members that use preventive care is much less when focusing on members with at least one chronic condition (84 percent in HIP Plus compared to 75 percent in HIP Basic), as opposed to all HIP Plus and HIP Basic members (64 percent compared to 45 percent). Thus, regarding their preventive care use, members in HIP Basic with the diseases listed in the tables look more like HIP Plus members, relative to HIP Basic members without any such diseases. The same can also be said for primary care use.
However, for members with each of the chronic conditions, HIP Plus members are more likely to use a qualifying preventive care service. Also, for all conditions, HIP Plus members are more likely to use primary care and have higher rates of primary care use.
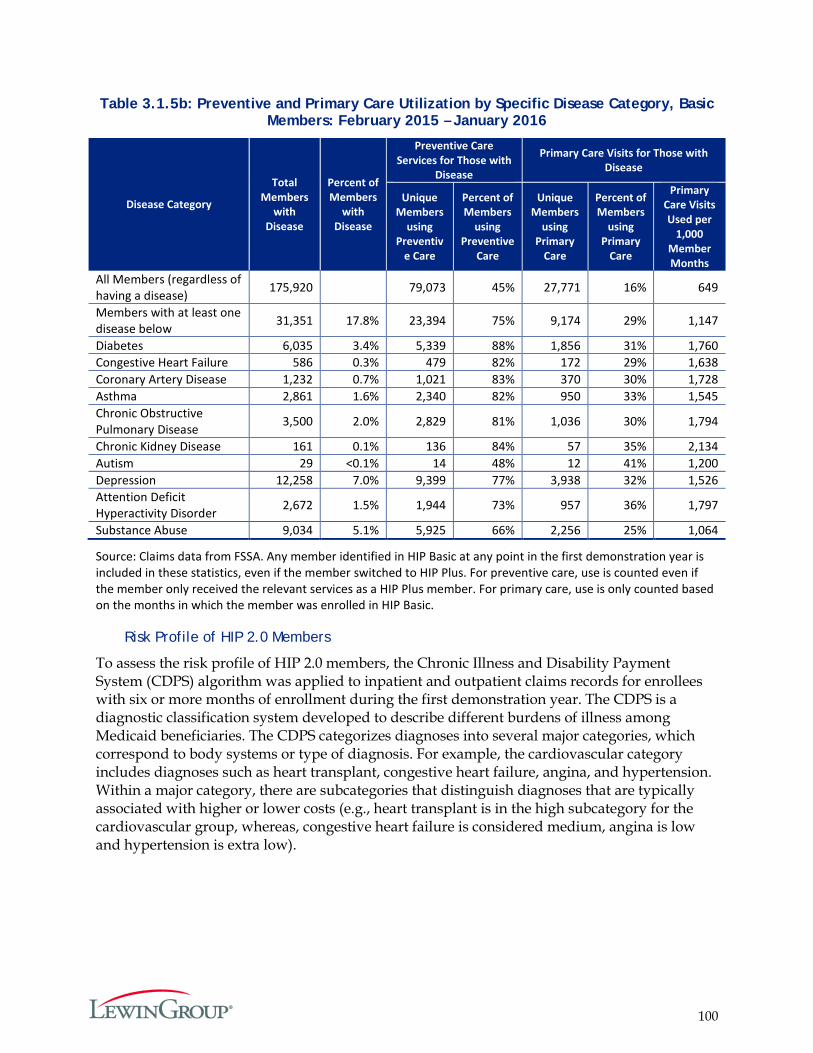
100
Table 3.1.5b: Preventive and Primary Care Utilization by Specific Disease Category, Basic Members: February 2015 – January 2016
Disease Category
Total Members
with Disease
Percent of Members
with Disease
Preventive Care Services for Those with
Disease
Primary Care Visits for Those with Disease
Unique Members
using Preventiv
e Care
Percent of Members
using Preventive
Care
Unique Members
using Primary
Care
Percent of Members
using Primary
Care
Primary Care Visits Used per
1,000 Member Months
All Members (regardless of having a disease) 175,920 79,073 45% 27,771 16% 649
Members with at least one disease below 31,351 17.8% 23,394 75% 9,174 29% 1,147
Diabetes 6,035 3.4% 5,339 88% 1,856 31% 1,760 Congestive Heart Failure 586 0.3% 479 82% 172 29% 1,638 Coronary Artery Disease 1,232 0.7% 1,021 83% 370 30% 1,728 Asthma 2,861 1.6% 2,340 82% 950 33% 1,545 Chronic Obstructive Pulmonary Disease 3,500 2.0% 2,829 81% 1,036 30% 1,794
Chronic Kidney Disease 161 0.1% 136 84% 57 35% 2,134 Autism 29 <0.1% 14 48% 12 41% 1,200 Depression 12,258 7.0% 9,399 77% 3,938 32% 1,526 Attention Deficit Hyperactivity Disorder 2,672 1.5% 1,944 73% 957 36% 1,797
Substance Abuse 9,034 5.1% 5,925 66% 2,256 25% 1,064
Source: Claims data from FSSA. Any member identified in HIP Basic at any point in the first demonstration year is included in these statistics, even if the member switched to HIP Plus. For preventive care, use is counted even if the member only received the relevant services as a HIP Plus member. For primary care, use is only counted based on the months in which the member was enrolled in HIP Basic.
Risk Profile of HIP 2.0 Members
To assess the risk profile of HIP 2.0 members, the Chronic Illness and Disability Payment System (CDPS) algorithm was applied to inpatient and outpatient claims records for enrollees with six or more months of enrollment during the first demonstration year. The CDPS is a diagnostic classification system developed to describe different burdens of illness among Medicaid beneficiaries. The CDPS categorizes diagnoses into several major categories, which correspond to body systems or type of diagnosis. For example, the cardiovascular category includes diagnoses such as heart transplant, congestive heart failure, angina, and hypertension. Within a major category, there are subcategories that distinguish diagnoses that are typically associated with higher or lower costs (e.g., heart transplant is in the high subcategory for the cardiovascular group, whereas, congestive heart failure is considered medium, angina is low and hypertension is extra low).

101
In this analysis, the CDPS data was supplemented with the Medicaid Rx (MRx) algorithm, which was designed to identify chronic conditions among beneficiaries who receive pharmacotherapy but do not have a qualifying CDPS diagnosis in their encounter records.121
Again, we see that the prevalence of chronic diseases, even when focusing on members with six months of enrollment, is greater for HIP Plus members than HIP Basic members. Among those enrolled in HIP 2.0 for at least six months during the first demonstration year, the most common chronic conditions classified by the CDPS algorithm were those associated with the psychiatric (22.2 percent), cardiovascular (20.5 percent), skeletal (14.2 percent), and gastrointestinal systems (12.8 percent) (Table 3.1.6).
The MRx algorithm identifies 4.8 percent of members who were treated with medications for cardiovascular conditions—these would be members in addition to the 20.5 percent identified with cardiovascular conditions using the CDPS data alone. The largest proportion of members that the MRx algorithm identified were those that filled a prescription for psychosis, bipolar disorder or depression (9.2 percent).
Table 3.1.6: Percent of HIP Enrollees with 6+ months of enrollment with Chronic Conditions
Category Scored Members
(6+ Member Months) Percent
All Basic Plus All Basic Plus CPDS
Psychiatric 63,490 16,688 46,802 22.2% 16.6% 25.2% Cardiovascular 58,613 11,739 46,874 20.5% 11.7% 25.3% Skeletal 40,741 8,767 31,974 14.2% 8.7% 17.2% Gastrointestinal 36,640 7,388 29,252 12.8% 7.3% 15.8 % Pulmonary 35,707 9,202 26,505 12.5% 9.1% 14.3% Diabetes 22,239 3,829 18,410 7.8% 3.8% 9.9% Substance Abuse 20,931 7,204 13,727 7.3% 7.2% 7.4% Skin 17,557 5,470 12,087 6.1% 5.4% 6.5% Nervous System 16,853 3,698 13,155 5.9% 3.7% 7.1% Pregnancy 13,772 7,174 6,598 4.8% 7.1% 3.6% Genital 12,377 3,699 8,678 4.3% 3.7% 4.7% Metabolic 12,075 2,891 9,184 4.2% 2.9% 5.0% Infectious Disease 8,397 2,081 6,316 2.9% 2.1% 3.4% Renal 7,245 1,272 5,973 2.5% 1.3% 3.2% Eye 6,520 506 6,014 2.3% 0.5% 3.2% Cancer 3,745 489 3,256 1.3% 0.5% 1.8% Hematological 3,140 771 2,369 1.1% 0.8% 1.3% Cerebrovascular 964 180 784 0.3% 0.2% 0.4% Developmental Disability 200 53 147 0.1% 0.1% 0.1%
MRx Psychosis/Bipolar/ Depression 26,454 6,366 20,088 9.2% 6.3% 10.8% Cardiac 13,716 3,115 10,601 4.8% 3.1% 5.7% Seizure disorders 11,904 2,394 9,510 4.2% 2.4% 5.1%
121 More information about the CDPS and MRx algorithm is available at: http://cdps.ucsd.edu/
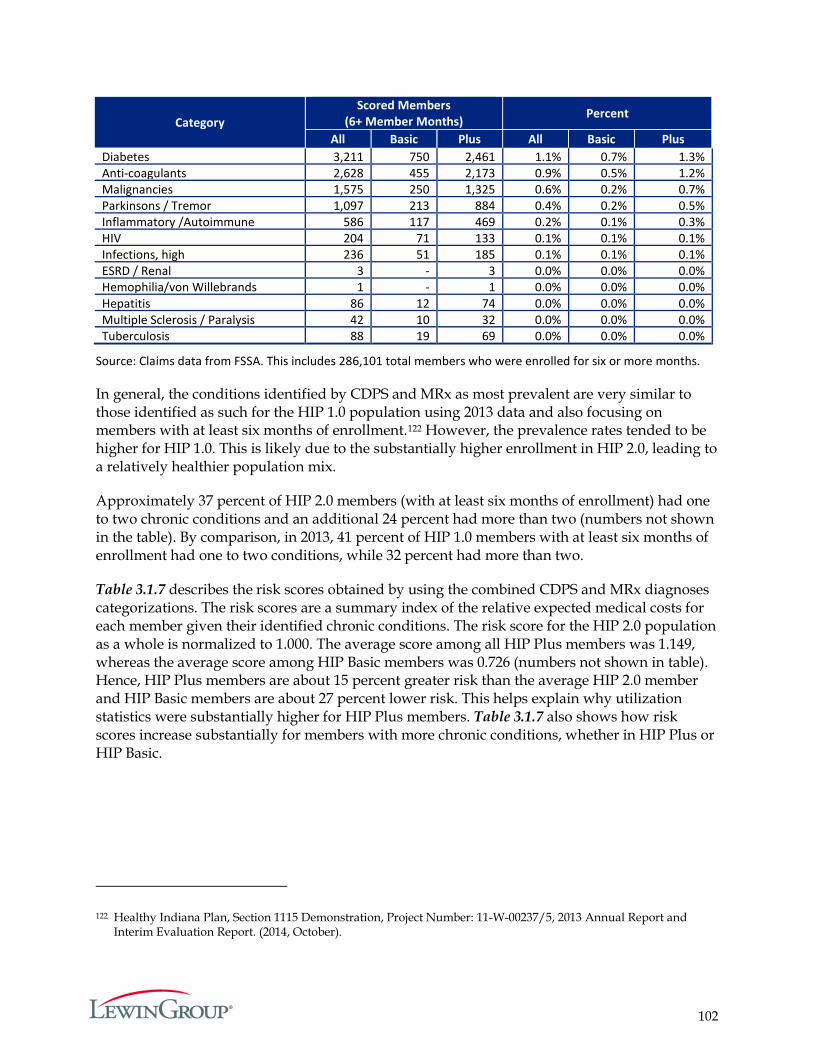
102
Category Scored Members
(6+ Member Months) Percent
All Basic Plus All Basic Plus Diabetes 3,211 750 2,461 1.1% 0.7% 1.3% Anti-coagulants 2,628 455 2,173 0.9% 0.5% 1.2% Malignancies 1,575 250 1,325 0.6% 0.2% 0.7% Parkinsons / Tremor 1,097 213 884 0.4% 0.2% 0.5% Inflammatory /Autoimmune 586 117 469 0.2% 0.1% 0.3% HIV 204 71 133 0.1% 0.1% 0.1% Infections, high 236 51 185 0.1% 0.1% 0.1% ESRD / Renal 3 - 3 0.0% 0.0% 0.0% Hemophilia/von Willebrands 1 - 1 0.0% 0.0% 0.0% Hepatitis 86 12 74 0.0% 0.0% 0.0% Multiple Sclerosis / Paralysis 42 10 32 0.0% 0.0% 0.0% Tuberculosis 88 19 69 0.0% 0.0% 0.0%
Source: Claims data from FSSA. This includes 286,101 total members who were enrolled for six or more months.
In general, the conditions identified by CDPS and MRx as most prevalent are very similar to those identified as such for the HIP 1.0 population using 2013 data and also focusing on members with at least six months of enrollment.122 However, the prevalence rates tended to be higher for HIP 1.0. This is likely due to the substantially higher enrollment in HIP 2.0, leading to a relatively healthier population mix.
Approximately 37 percent of HIP 2.0 members (with at least six months of enrollment) had one to two chronic conditions and an additional 24 percent had more than two (numbers not shown in the table). By comparison, in 2013, 41 percent of HIP 1.0 members with at least six months of enrollment had one to two conditions, while 32 percent had more than two.
Table 3.1.7 describes the risk scores obtained by using the combined CDPS and MRx diagnoses categorizations. The risk scores are a summary index of the relative expected medical costs for each member given their identified chronic conditions. The risk score for the HIP 2.0 population as a whole is normalized to 1.000. The average score among all HIP Plus members was 1.149, whereas the average score among HIP Basic members was 0.726 (numbers not shown in table). Hence, HIP Plus members are about 15 percent greater risk than the average HIP 2.0 member and HIP Basic members are about 27 percent lower risk. This helps explain why utilization statistics were substantially higher for HIP Plus members. Table 3.1.7 also shows how risk scores increase substantially for members with more chronic conditions, whether in HIP Plus or HIP Basic.
122 Healthy Indiana Plan, Section 1115 Demonstration, Project Number: 11-W-00237/5, 2013 Annual Report and Interim Evaluation Report. (2014, October).
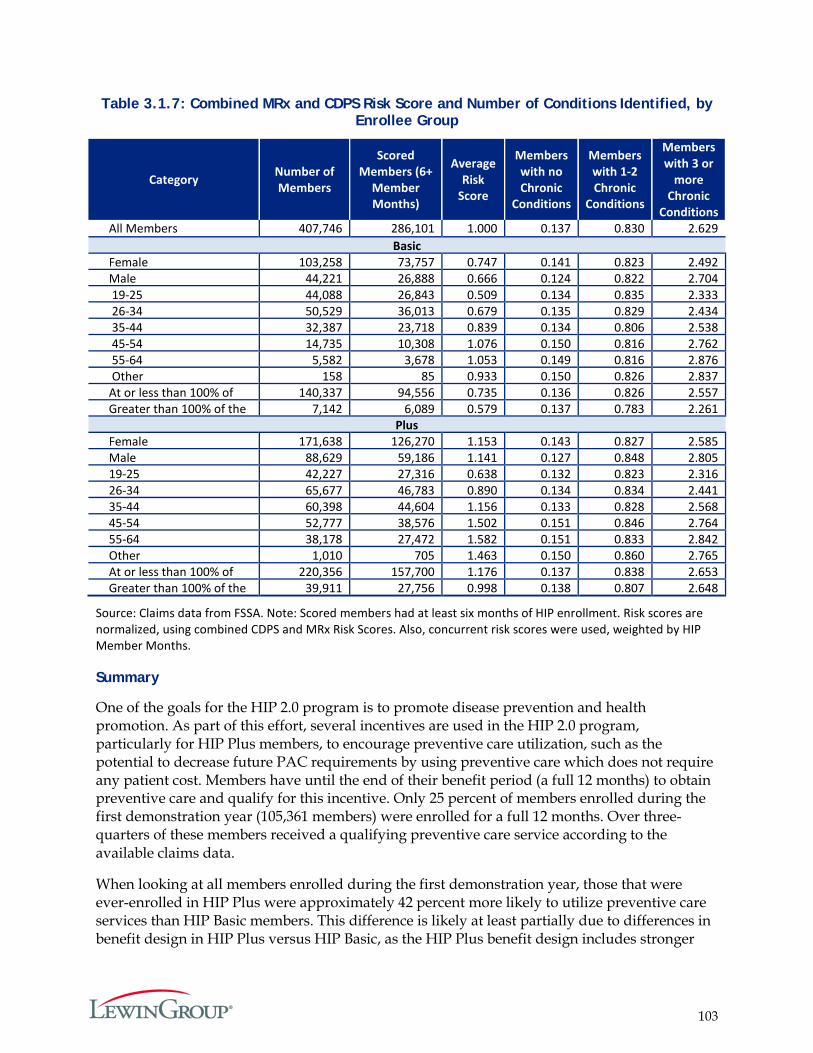
103
Table 3.1.7: Combined MRx and CDPS Risk Score and Number of Conditions Identified, by Enrollee Group
Category Number of Members
Scored Members (6+
Member Months)
Average Risk
Score
Members with no Chronic
Conditions
Members with 1-2 Chronic
Conditions
Members with 3 or
more Chronic
Conditions All Members 407,746 286,101 1.000 0.137 0.830 2.629
Basic Female 103,258 73,757 0.747 0.141 0.823 2.492 Male 44,221 26,888 0.666 0.124 0.822 2.704 19-25 44,088 26,843 0.509 0.134 0.835 2.333 26-34 50,529 36,013 0.679 0.135 0.829 2.434 35-44 32,387 23,718 0.839 0.134 0.806 2.538 45-54 14,735 10,308 1.076 0.150 0.816 2.762 55-64 5,582 3,678 1.053 0.149 0.816 2.876 Other 158 85 0.933 0.150 0.826 2.837 At or less than 100% of
140,337 94,556 0.735 0.136 0.826 2.557 Greater than 100% of the
7,142 6,089 0.579 0.137 0.783 2.261 Plus
Female 171,638 126,270 1.153 0.143 0.827 2.585 Male 88,629 59,186 1.141 0.127 0.848 2.805 19-25 42,227 27,316 0.638 0.132 0.823 2.316 26-34 65,677 46,783 0.890 0.134 0.834 2.441 35-44 60,398 44,604 1.156 0.133 0.828 2.568 45-54 52,777 38,576 1.502 0.151 0.846 2.764 55-64 38,178 27,472 1.582 0.151 0.833 2.842 Other 1,010 705 1.463 0.150 0.860 2.765 At or less than 100% of
220,356 157,700 1.176 0.137 0.838 2.653 Greater than 100% of the
39,911 27,756 0.998 0.138 0.807 2.648
Source: Claims data from FSSA. Note: Scored members had at least six months of HIP enrollment. Risk scores are normalized, using combined CDPS and MRx Risk Scores. Also, concurrent risk scores were used, weighted by HIP Member Months.
Summary
One of the goals for the HIP 2.0 program is to promote disease prevention and health promotion. As part of this effort, several incentives are used in the HIP 2.0 program, particularly for HIP Plus members, to encourage preventive care utilization, such as the potential to decrease future PAC requirements by using preventive care which does not require any patient cost. Members have until the end of their benefit period (a full 12 months) to obtain preventive care and qualify for this incentive. Only 25 percent of members enrolled during the first demonstration year (105,361 members) were enrolled for a full 12 months. Over three-quarters of these members received a qualifying preventive care service according to the available claims data.
When looking at all members enrolled during the first demonstration year, those that were ever-enrolled in HIP Plus were approximately 42 percent more likely to utilize preventive care services than HIP Basic members. This difference is likely at least partially due to differences in benefit design in HIP Plus versus HIP Basic, as the HIP Plus benefit design includes stronger
104
incentives for members to actively manage their care. The analysis of risk scores also reveals that chronic conditions are more prevalent in HIP Plus than HIP Basic, therefore HIP Plus members may also have a greater need for care. As higher users of care, HIP Plus members may achieve greater value from forgoing co-payments in return for a monthly PAC not to exceed two percent of their income.
Members with chronic conditions were more likely to use preventive and primary care services, for both HIP Plus and HIP Basic plans. Medically frail members also exhibited a relatively high likelihood of obtaining preventive care in comparison to the overall HIP 2.0 population. It would be expected that sicker members be more active users of preventive and primary care.
As expected, females were shown to be more likely to use preventive care, as well as older age groups. In contrast, there was not much difference in preventive care use by income levels.
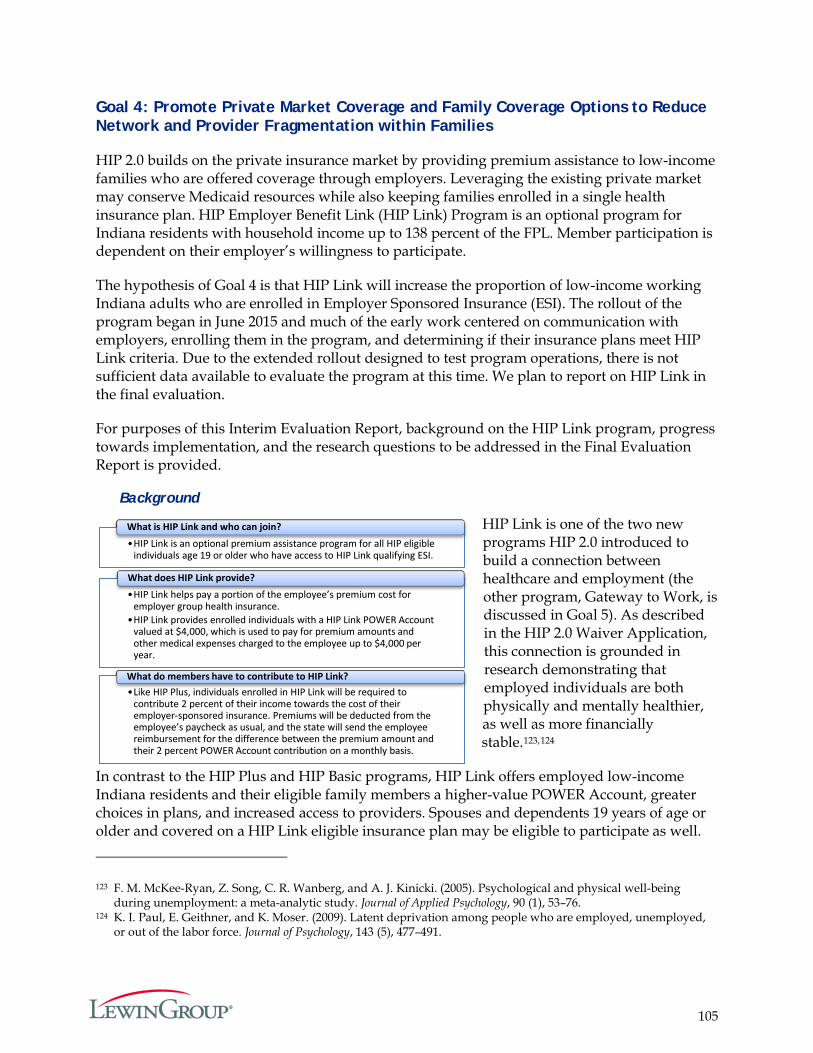
105
•HIP Link is an optional premium assistance program for all HIP eligible individuals age 19 or older who have access to HIP Link qualifying ESI.
What is HIP Link and who can join?
•HIP Link helps pay a portion of the employee’s premium cost for employer group health insurance.
•HIP Link provides enrolled individuals with a HIP Link POWER account valued at $4,000, which is used to pay for premium amounts and other medical expenses charged to the employee up to $4,000 per year.
What does HIP Link provide?
•Like HIP Plus, individuals enrolled in HIP Link will be required to contribute 2 percent of their income towards the cost of their employer-sponsored insurance. Premiums will be deducted from the employee’s paycheck as usual, and the state will send the employee reimbursement for the difference between the premium amount and their 2 percent POWER account contribution on a monthly basis.
What do members have to contribute to HIP Link?
•HIP Link is an optional premium assistance program for all HIP eligible individuals age 19 or older who have access to HIP Link qualifying ESI.
What is HIP Link and who can join?
•HIP Link helps pay a portion of the employee’s premium cost for employer group health insurance.
•HIP Link provides enrolled individuals with a HIP Link POWER Account valued at $4,000, which is used to pay for premium amounts and other medical expenses charged to the employee up to $4,000 per year.
What does HIP Link provide?
•Like HIP Plus, individuals enrolled in HIP Link will be required to contribute 2 percent of their income towards the cost of their employer-sponsored insurance. Premiums will be deducted from the employee’s paycheck as usual, and the state will send the employee reimbursement for the difference between the premium amount and their 2 percent POWER Account contribution on a monthly basis.
What do members have to contribute to HIP Link?
Goal 4: Promote Private Market Coverage and Family Coverage Options to Reduce Network and Provider Fragmentation within Families
HIP 2.0 builds on the private insurance market by providing premium assistance to low-income families who are offered coverage through employers. Leveraging the existing private market may conserve Medicaid resources while also keeping families enrolled in a single health insurance plan. HIP Employer Benefit Link (HIP Link) Program is an optional program for Indiana residents with household income up to 138 percent of the FPL. Member participation is dependent on their employer’s willingness to participate.
The hypothesis of Goal 4 is that HIP Link will increase the proportion of low-income working Indiana adults who are enrolled in Employer Sponsored Insurance (ESI). The rollout of the program began in June 2015 and much of the early work centered on communication with employers, enrolling them in the program, and determining if their insurance plans meet HIP Link criteria. Due to the extended rollout designed to test program operations, there is not sufficient data available to evaluate the program at this time. We plan to report on HIP Link in the final evaluation.
For purposes of this Interim Evaluation Report, background on the HIP Link program, progress towards implementation, and the research questions to be addressed in the Final Evaluation Report is provided.
Background
HIP Link is one of the two new programs HIP 2.0 introduced to build a connection between healthcare and employment (the other program, Gateway to Work, is discussed in Goal 5). As described in the HIP 2.0 Waiver Application, this connection is grounded in research demonstrating that employed individuals are both physically and mentally healthier, as well as more financially stable.123,124
In contrast to the HIP Plus and HIP Basic programs, HIP Link offers employed low-income Indiana residents and their eligible family members a higher-value POWER Account, greater choices in plans, and increased access to providers. Spouses and dependents 19 years of age or older and covered on a HIP Link eligible insurance plan may be eligible to participate as well.
123 F. M. McKee-Ryan, Z. Song, C. R. Wanberg, and A. J. Kinicki. (2005). Psychological and physical well-being during unemployment: a meta-analytic study. Journal of Applied Psychology, 90 (1), 53–76.
124 K. I. Paul, E. Geithner, and K. Moser. (2009). Latent deprivation among people who are employed, unemployed, or out of the labor force. Journal of Psychology, 143 (5), 477–491.
106
The funds available to eligible family members are pooled to help cover the costs of insurance with each member receiving a HIP Link POWER Account valued at $4,000. Gaining insurance in the private market is expected to reduces the risk of churn – moving on and off of Medicaid – should family income rise above 138 percent of the FPL.
HIP Link Program Activities to Date
In June 2015, the HIP Link program implemented an employer portal to receive employer applications for participation, which allowed the state to approve employers and employer health plans that offer HIP Link to their employees. In the first year of implementation, HIP Link enrolled 31 employers. The state initiated a slow rollout with a small set of members (“data users”) to test the program and to ensure smooth running operations. The rollout took place in diverse geographic regions and with employers of various sizes and types (e.g., private sector, public sector, schools, and car dealerships). During the testing period, HIP Link staff were in frequent communication with both employers and employees; daily one-on-one contact allowed for feedback which informed program improvements. Based on the findings from this test phase, the state has undertaken some modifications and is seeking CMS authorization to rollout the program more broadly.
According to the state’s Annual Report on HIP 2.0 submitted the CMS in April 2016, HIP Link accomplishments to date include:
The employer approval process began by phone and then extended to include onsite visits, which gives the option to discuss the program with eligible employees and facilitate enrollment.
Employer plans already approved by the Indiana Department of Insurance as meeting the essential health benefits were posted online as having pre-approved benefits for HIP Link.
The HIP 2.0 call center has activated a separate phone line for HIP Link tracking all calls to identify areas for improvement. The call center will also be handling employer-related questions regarding the application process.
Resources have been developed for employers and employees including a detailed handbook and a video tutorial about the program to assist with all aspects of enrollment from the application process to reimbursement.
Stakeholder engagement has involved outreach and presentations across the state. The state will continue to augment resources to promote the program and bring on new expertise for marketing purposes.
The state has also continued efforts to develop the HIP Link program by submitting a State Plan Amendment, adding benefit standards for employer-sponsored insurance to qualify as HIP Link-eligible. These Alternative Benefit Plan (ABP) standards are only for HIP Link enrollees, therefore ensuring that employers participating in HIP Link are providing comprehensive benefits comparable to a standard ABP.
107
Future Evaluation of HIP Link
The final evaluation of the HIP 2.0 demonstration will include an evaluation of the efficacy of HIP Link in increasing the proportion of low-income Indiana residents covered by employer-sponsored insurance. To that end, the number of Indiana residents under 138 percent of the FPL covered by employer-sponsored insurance before and after the implementation of the program will be examined. To understand the effects of HIP Link on employers and employees, among other metrics, the number of employers enrolled in HIP Link and the number of employees with an approved HIP Link employer enrolled in HIP Plus or Basic versus their employers’ sponsored insurance/HIP Link will be also be included in the Final Evaluation Report.
108
Goal 5: Provide HIP Members with Opportunities to Seek Job Training and Stable Employment to Reduce Dependence on Public Assistance
Indiana developed the Gateway to Work program in order to assist unemployed individuals and those working fewer than 20 hours a week in securing new or better employment. Research suggests that employed individuals experience better health compared to unemployed individuals,125 so assisting members to gain access to jobs may, in the long run, be an effective health improvement strategy. The program launched in May 2015, and as such, there is not sufficient data available to date to perform an evaluation of the initiative. The impact of the Gateway to Work program will be assessed in the Final Evaluation Report.
Background
The Gateway to Work program aims to improve health outcomes by encouraging and facilitating individuals to gain employment. Eligible HIP 2.0 members are referred to ResCare,126 a contractor that provides education and training services. In addition, ResCare helps connect HIP 2.0 members to potential employers and facilitate participation in the workforce.
To be eligible, HIP members cannot work more than 20 hours a week, be full-time students, nor referred to work training through SNAP (Supplemental Nutrition Assistance Program). The program is free to HIP 2.0 members. They are offered a variety of services including an initial assessment of their skills and abilities to achieve their employment goals. Non-participation in Gateway to Work does not affect HIP 2.0 coverage or benefits. Once engaged in the Gateway to Work program, members may receive case management services, participate in a structured job readiness program and receive help with their job search. The program also assists HIP members in completing job applications, creating resumes, practicing job interview skills, and researching job openings. Gateway to Work features tools to match participants experience and skills with employers who have job openings. Financial assistance may be available to pay for short term skills training for high-demand jobs. Services may also be available to help members overcome barriers including money for transportation or clothing required to start a new job.
Gateway to Work Program Accomplishments during Year One of Demonstration
The Gateway to Work call center opened on May 4, 2015. Since opening, there have been 3,277 calls received from HIP 2.0 recipients with questions or an interest in participating. As of
125 See, for example: "Stable Jobs = Healthier Lives". Culture of Health. Robert Wood Johnson Foundation, 14 January 2013. Retrieved May 26, 2016 from http://www.rwjf.org/en/culture-of-health/2013/01/stable_jobs_health.html. Goodman, Nanette. The Impact of Employment on the Health Status and Health Care Costs of Working-age People with Disabilities. Lead Center, Nov 2015. Retrieved May 26, 2016 from http://www.leadcenter.org/system/files/resource/downloadable_version/impact_of_employment_health_status_health_care_costs_0.pdf3. Fonseca, Daniel Andrés Pinzón. The Relationship between Health and Employment. Thesis. Erasmus University of Rotterdam, 2011. Rotterdam: Netspar, 2011. Retrieved May 26, 2016 from http://arno.uvt.nl/show.cgi?fid=122184. Work Matters for Health. Issue brief no. 4. Robert Wood Johnson Foundation, December 2008. Retrieved May 26, 2016 from http://www.commissiononhealth.org/PDF/0e8ca13d-6fb8-451d-bac8-7d15343aacff/Issue%20Brief%204%20Dec%2008%20-%20Work%20and%20Health.pdf
126 ResCare Workforce Services. Retrieved May 14, 2016 from http://www.rescare.com/education-and-training-services/
109
January 31, 2016, a total of 307,156 letters were mailed to inform HIP members of the Gateway to Work program. A total of 1,196 Gateway to Work orientations have been scheduled, with a total of 551 orientations attended.
Evaluation of the Gateway to Work Program
Over the next two years, the assessment of the Gateway to Work program will focus on the central hypothesis that referrals to ResCare employment resources help increase member employment rates over the course of the demonstration. More specifically, the evaluation of the goal will be structured around the following research questions:
1. What percent of members referred to ResCare become employed (part time vs. full time)?
2. How do referrals to ResCare impact member income and eligibility for HIP?
3. How many referred members stay in HIP and how many leave?
4. How do referrals to ResCare impact the number of Indiana residents enrolled in HIP Link?
In assessing the impact of providing HIP 2.0 members with opportunities to seek job training and employment through the Gateway to Work program, the number of HIP 2.0 members who participate in work search and job training programs, and compare rates of full and part-time employment among the HIP enrollees at specific intervals (e.g., after six months, one year, and two years into the program) will be examined. It will also be of interest to explore the extent to which change in employment status facilitates the transition of HIP members off of HIP 2.0 due to increased income. Ultimately, the answers to these research questions will provide a better understanding of the efficacy of the program and offer opportunities to tailor it to the needs of HIP 2.0 members.

110
Next Steps in Data Collection and Analysis
The data available for this interim evaluation report allowed for analysis of most measures identified in the Final Evaluation Plan submitted to CMS December 29, 2015. Because the Interim Evaluation is being conducted a little more than a year after the program’s inception, and members joined throughout the year, data does not exist to answer all the research questions or for all members. This is particularly the case for components of HIP 2.0 with later start dates such as the HIP Link and Gateway to Work programs. These components will be discussed in the Final Evaluation Report.
The Final Evaluation Report will also encompass longer enrollments and claims history, as well as a longer claims runout period. This will allow for more robust profiles of member health status to be developed and utilized in the analyses. As members remain in the program longer, it will be possible to measure more complete disease profiles for a larger cohort of members.
In addition, the state will have completed validation processes of certain administrative data related to PAC payments, eligibility status changes, MCE reporting, and other information that will allow for a more comprehensive evaluation in the Final Evaluation Report.
Data limitations that result from short enrollment periods and previously untested data are common problems of evaluations of new initiatives. However even with these limitations, this evaluation can provide an early indication of the progress and potential impacts of the HIP 2.0 programs. Many of these estimates will also act as baselines from which to gauge changes in HIP 2.0 over the duration of the waiver period.

Indiana Healthy Indiana Plan 2.0: Appendices
Prepared for:
Indiana Family and Social Services Administration (FSSA)
Submitted by:
The Lewin Group, Inc.
July 6, 2016
i
Appendices Table of Contents
APPENDIX A. CURRENT BASIC MEMBER SURVEY (FULL) .......................................................... 1
APPENDIX B. CURRENT PLUS MEMBER SURVEY (FULL) ........................................................... 12
APPENDIX C. LEAVER SURVEY (FULL) ........................................................................................... 17
APPENDIX D. NEVER MEMBER SURVEY - PRESUMPTIVE ELIGIBILITY (PE) (FULL) ........... 23
APPENDIX E. NEVER MEMBER SURVEY - DID NOT MAKE PAC (FULL) ................................ 29
APPENDIX F. PROVIDER SURVEY (FULL) ....................................................................................... 35
APPENDIX G. SURVEY SAMPLING APPROACH ........................................................................... 41
APPENDIX H. THE MEMBER AND LEAVER SURVEY WEIGHTING METHODOLOGY ........ 48
APPENDIX I. SURVEY NOTIFICATION LETTERS SENT TO MEMBERS AND PROVIDERS .. 52
APPENDIX J. ENROLLMENT IN STATE OF INDIANA SPONSORED HEALTHCARE PROGRAMS ...................................................................................................................................... 54
APPENDIX K. IDENTIFICATION OF PRIMARY AND SPECIALTY CARE SERVICES ............. 55

1
Appendix A. Current Basic Member Survey (Full)
DESCRIPTION: This survey applies to individuals currently enrolled in in HIP BASIC, per eligibility data.
CONFIRM AWARENESS OF ENROLLMENT IN HIP BASIC
Q1. The State of Indiana runs an insurance program called the Healthy Indiana Plan (or
HIP) for Hoosiers age 19 to 64. Are you enrolled in the “Healthy Indiana Plan” or “HIP” at this time? � YES � NO � DON’T KNOW
Q1a. Are you in HIP Basic or HIP Plus?
� BASIC CONTINUE WITH THE SURVEY, GO TO Q2 � PLUS CONTINUE WITH THE SURVEY, GO TO Q2 � REFUSED GO TO Q1B � DON’T KNOW GO TO Q1B
Q1b. Based on the information we have, it looks like you are in HIP Basic and pay
copayments for services. Is this correct? � YES CONTINUE WITH THE SURVEY, GO TO Q2 � NO � DON’T KNOW
SATISFACTION WITH HIP
The next set of questions will ask about your satisfaction with the Healthy Indiana Plan.
Q2. Thinking about your overall experience with the Healthy Indiana Plan in the past six months, would you say you are: � VERY SATISFIED, � SOMEWHAT SATISFIED, � NEITHER SATISFIED NOR DISSATISFIED, � SOMEWHAT DISSATISFIED, OR � VERY DISSATISFIED? � DON’T KNOW � REFUSED
Q2a. Why are you (FILL IN WITH PREVIOUS RESPONSE)? OPEN-ENDED RESPONSE
� SPECIFY:
GO TO Q3
GO TO CLOSE
GO TO CLOSE
2
DO NOT READ LIST BELOW; USE FOR CODING PURPOSES � CAN’T SEE MY DOCTOR WITH HIP � DISSATISFACTION WITH CHOICE OF DOCTORS IN HIP � HIP DOES NOT COVER DENTAL � HIP DOES NOT COVER VISION/OPTICAL � HIP DOES NOT COVER PROCEDURE/ MEDICATION � MANY DOCTORS DO NOT ACCEPT HIP � DISSATISFIED WITH ADMINISTRATIVE ISSUE(S) OR PROCESS � DISSATISFACTION WITH A PAYMENT RELATED ISSUE � CAN’T AFFORD CO-PAY/ TOO HIGH � CO-PAYMENT / MONTHLY/ ANNUAL PAYMENT TOO HIGH � LIKE HAVING COVERAGE/ INSURANCE � LIKE DOCTORS/ HOSPITALS / HEALTH CARE PROVIDERS � LIKE PAYMENTS / PRICE � LIKE THE PLAN/ PROVIDER � LIKE SOME THINGS/ DISLIKE OTHER THINGS � SOME THINGS NOT COVERED � DON’T KNOW � REFUSED � OTHER REASON NOT LISTED ABOVE: (SPECIFY)
Q3. If you ever left HIP, would you try to reenroll if you became eligible for the program
again? � YES � NO � DON’T KNOW � REFUSED
FAST-TRACK PAYMENTS
Q4. When you applied for HIP, did you make a fast track payment?
(IF NEEDED: A fast track payment is made when you complete your application. Fast track payments allow you to get HIP coverage more quickly because you pre-pay your first payment. By making the fast track payment when you apply, it may take less time for your coverage to begin.)
� YES � NO GO TO Q4b � DON’T KNOW � REFUSED
Q4a. Why did you decide to sign-up for the fast track payment option?
� I WANTED MY COVERAGE AND/OR ELIGIBILITY TO BEGIN SOONER � I THOUGHT IT WAS A REQUIRED PART OF HIP � I THOUGHT IT WOULD BE EASIER TO PAY THEN (I.E., WOULDN’T HAVE TO MAIL/GO IN-
PERSON, ETC.) � I HAD THE FUNDS AT THE TIME I APPLIED � OTHER REASON NOT LISTED ABOVE: (SPECIFY)
_________________________________________________________________________ � DON’T KNOW � REFUSED
GO TO Q5

3
Q4b. Why did you decide NOT to sign-up for the fast track payment option? � I COULDN’T AFFORD TO MAKE THE PAYMENT � I WASN’T SURE IF I WOULD BE ELIGIBLE � I DIDN’T UNDERSTAND THE DIFFERENCE BETWEEN FAST TRACK AND THE REGULAR
PAYMENT OPTION � I DIDN’T NEED COVERAGE TO START SOONER � I WASN’T AWARE OF THE OPTION TO SIGN-UP FOR FAST TRACK AT THE TIME I
APPLIED � OTHER REASON NOT LISTED ABOVE: (SPECIFY)
____________________________________________ � DON’T KNOW � REFUSED
ACCESS
Q5. In the last 6 months, did you make any appointments for a check-up or routine care
at a doctor’s office or clinic? � YES GO TO NEXT QUESTION � NO SKIP NEXT QUESTION [Q6]
Q5a. In the last 6 months, how often did you get an appointment for a check-up or routine
care at a doctor’s office or clinic as soon as you needed? � NEVER � SOMETIMES � USUALLY � ALWAYS
Q6. Specialists are doctors like surgeons, heart doctors, allergy doctors, skin doctors,
and other doctors who specialize in one area of health care. In the last 6 months, did you make any appointments to see a specialist? � YES GO TO Q6A � NO GO TO Q7 � DON’T KNOW GO TO Q7
Q6a. In the last 6 months, how often did you get an appointment to see a specialist as
soon as you needed? � NEVER � SOMETIMES � USUALLY � ALWAYS
Q7. In the last 6 months, did you get any new prescription medicines or refill a
prescription? � YES GO TO Q7a � NO GO TO Q8
4
Q7a. In the last 6 months, how often was it easy to get your prescription medicine from your health plan? � NEVER � SOMETIMES � USUALLY � ALWAYS
Q8. In the past six months, have you missed any healthcare appointments, such as
doctor’s appointments? � YES GO TO 8a � NO � DON’T KNOW � REFUSED
Q8a. What are the reasons you missed an appointment? (ALLOW MULTIPLE RESPONSE
OPTIONS) � COST TOO MUCH � COULDN’T GET CHILDCARE � COULDN’T GET TIME OFF FROM WORK � COULDN’T GET THROUGH ON THE PHONE � COULDN’T SCHEDULE APPOINTMENT SOON ENOUGH � DIDN’T GET APPROVAL FROM PLAN � DIDN’T HAVE TIME � DIDN’T WANT TO GO � HOURS OF OPERATION WERE NOT CONVENIENT FOR ME � NO INSURANCE � PLACE DID NOT ACCEPT THE INSURANCE COVERAGE � TAKES TOO LONG TO GET THERE � TRANSPORTATION PROBLEM � TOO SICK TO GO � OTHER REASON, NOT LISTED ABOVE: (SPECIFY)
____________________________________________ Q8b. What is the most common reason you missed an appointment?
________________________________________________________ � (If respondent chooses more than one option for Q8a above.)
Q9. In the past six months, was there any time when you contacted a doctor’s office or
clinic, but couldn’t get an appointment soon enough so you went to the emergency room instead? � YES � NO � DON’T KNOW � REFUSED
GO TO Q9
5
Q10. When you need to get health care, what is the type of transportation you use most often to get to your visit? � I DRIVE MYSELF, USING MY OWN VEHICLE � SOMEONE ELSE (SUCH AS A FRIEND, NEIGHBOR, OR FAMILY) DRIVES ME, USING MY
OWN VEHICLE � SOMEONE ELSE (SUCH AS A FRIEND, NEIGHBOR, OR FAMILY) DRIVES ME, USING
THEIR VEHICLE � I TAKE A TAXI CAB/OR UBER � I TAKE THE BUS � OTHER: ______________________
AWARENESS
Q11. Have you heard of the Healthy Indiana Plan POWER account, which stands for
Personal Wellness and Responsibility Account? � YES � NO � DON’T KNOW � REFUSED
Q11a. How did you hear or learn about the POWER account? (MARK ALL THAT APPLY)
� MEMBER HANDBOOK � SOMEONE FROM THE PLAN CALLED AND EXPLAINED IT TO YOU � HIP WEBSITE � YOUR HEALTH PLAN � YOUR DOCTOR OR HEALTH CARE PROFESSIONAL � FAMILY/FRIENDS � NONE OF THESE � DON’T KNOW � REFUSED
Q12. Do you have a POWER account as part of your HIP Basic insurance?
� YES � NO � DON’T KNOW � REFUSED
Q12a. How often do you check the balance in your POWER account? Would you say … � WEEKLY � A FEW TIMES A MONTH � MONTHLY � A FEW TIMES A YEAR BUT NOT EVERY MONTH � ONCE A YEAR � NEVER � DON’T KNOW � REFUSED
GO TO Q13
GO TO Q13

6
Q13. If you were to get preventive services, such as a cancer screening, do you think the cost would be deducted from your POWER account, if you have enough money available in the account? � YES � NO � DON’T KNOW � REFUSED
Q14. Has your health plan given you a HIP POWER Account debit card? (IF NEEDED:
This is a card that can be used to spend the money in your POWER account.) � YES GO TO NEXT QUESTION � NO � DON’T KNOW � REFUSED
Q14a. How often do you present the card to a health care provider? Is it…
� EVERY TIME YOU GET CARE � SOME OF THE TIME � ONLY FOR SPECIFIC SERVICES � NEVER � DON’T KNOW � REFUSED
Q15. I’m going to read a couple of policies, please indicate whether you think the policy
is true or false. The first policy states: “If you get preventive services suggested by your plan every year and have money left in your POWER account, part of that money will be rolled over to your account for next year.” � TRUE � FALSE � DON’T KNOW � REFUSED
Q16. The second policy states: “If you get the preventive services suggested by your
plan and have money left over in your POWER account, this could result in lower payments in the next year.” � TRUE � FALSE � DON’T KNOW � REFUSED
GO TO Q15

7
COVERAGE Indiana offers two HIP programs – HIP Plus and HIP Basic. Based on the information we have, you are currently on HIP Basic. In the next set of questions, I am going to ask you about the differences between HIP Basic and HIP Plus.
Q17. HIP Plus covers services that HIP Basic does not cover, such as dental and vision. It also covers surgery for obesity and treatment of jaw disorders. Did you know that HIP Plus covers these additional services? � YES � NO � DON’T KNOW � REFUSED
Q18. How important would this additional coverage be to you?
� VERY IMPORTANT � SOMEWHAT IMPORTANT � NOT IMPORTANT � DON’T KNOW � REFUSED
COPAYMENTS
HIP Basic charges copayments or copays at the time you get most services. (IF NEEDED: Copayments are payments you make at the time you visit your doctor's office, go to the hospital or get prescription drugs.)
Q19. When you need treatment from a doctor or other health professional, do you ask how much the treatment will cost? � YES � NO � DON’T KNOW � REFUSED
Q20. In the past six months, when you needed treatment from doctors or other
healthcare professionals, did they ask you to make a copay? � ALWAYS � SOMETIMES � NEVER � HAVEN’T NEEDED TREATMENT/BEEN TO A HEALTHCARE
PROFESSIONAL � DON’T KNOW � REFUSED
GO TO Q23
8
Q21. Did you make the copay at the time of service?
� ALWAYS GO TO Q22 � SOMETIMES GO TO Q22 � NEVER GO TO Q23 � DON’T KNOW GO TO Q23 � REFUSED GO TO Q23
Q22. Were the copays affordable?
� YES � NO � DON’T KNOW � REFUSED
Q23. In the past 6 months, how often were you worried about having enough money to
pay your copay? � ALWAYS � USUALLY � SOMETIMES � RARELY � NEVER � DON’T KNOW � REFUSED
Q24. Did you know that HIP Plus does not require you to pay copays, but does require
you to pay in advance for coverage through a monthly or annual payment? � YES � NO � DON’T KNOW � REFUSED
HIP 2.0 POLICIES
Q25. Do you prefer to pay copayments at the time of service, rather than paying in
advance for your coverage through a monthly or annual payment to your POWER account? (IF NEEDED: POWER account stands for Personal Wellness and Responsibility Account) � YES � NO � DON’T KNOW � REFUSED
Q26. Why? OPEN-ENDED RESPONSE
� SPECIFY:__________________________________________________________________
GO TO Q27

9
DO NOT READ LIST BELOW; USE FOR CODING PURPOSES � COPAYMENTS ARE CHEAPER � I DON’T USE A LOT OF SERVICES, SO I DON’T WANT TO PAY IF I DON’T NEED THE
SERVICES � I DON’T HAVE THE MONEY EVERY MONTH � OTHER: (SPECIFY) _________________________________________________________ � DON’T KNOW � REFUSED
Q27. Did you know that, if you are in HIP Plus, you can use funds in your POWER
account to pay for the first $2,500 of covered services? � YES � NO � DON’T KNOW � REFUSED
Q28. Did you know that, if some of the funds in a POWER account are rolled over to the
next year, the monthly POWER account contribution will be reduced in the next year? � YES � NO � DON’T KNOW
AFFORDABILITY
Q29. Did you know that, if you do not make your monthly or annual POWER account
contribution, you will be moved from HIP Plus to HIP Basic? � YES � NO � DON’T KNOW � REFUSED
Q30. Our records show that you used to be on HIP Plus but moved to HIP Basic because
you never made your first monthly or annual POWER account contributions, or because you stopped making monthly or annual POWER account contributions. Can you explain why you never made or stopped making contributions for HIP Plus? (ALLOW MULTIPLE RESPONSES) � CAN’T AFFORD/FEES TOO HIGH � DON’T NEED ADDITIONAL SERVICES � DON’T KNOW HOW TO START PAYING ON A MONTHLY BASIS � PREFER TO PAY COPAYMENTS FOR EACH SERVICE I USE � DO NOT WANT HIP PLUS OR ADDED BENEFITS � DON’T PLAN TO BE IN THE PROGRAM VERY LONG � I ALREADY GOT MY VISION/DENTAL SERVICES, AND DON’T NEED HIP PLUS ANYMORE � NOT OFFERED THE OPTION TO PAY ON A MONTHLY BASIS � DON’T UNDERSTAND THE PROGRAM/DIFFERENCES � NOT REQUIRED TO PAY THE CONTRIBUTION � FORGOT � OTHER REASON NOT LISTED ABOVE: (SPECIFY)
10
� DON’T KNOW � REFUSED
Q30a. Which of these reasons is the most important? Q31. The state checks your eligibility for HIP once a year. The next time the state checks
your eligibility, you can move from HIP Basic to HIP Plus if you make your monthly/annual contributions to your POWER account. Did you know this? � YES � NO � DON’T KNOW � REFUSED
Q32. Would you rather remain in HIP Basic or move to HIP Plus, knowing that they are
different? � REMAIN IN HIP BASIC � MOVE TO HIP PLUS � DON’T KNOW � REFUSED
Q32a. Why? OPEN-ENDED RESPONSE
� SPECIFY:_________________________________________________________________ Q33. If HIP required you to pay $5 each month, would you continue to stay enrolled?
� YES GO TO Q34 � NO GO TO Q35 � DON’T KNOW GO TO Q35 � REFUSED GO TO Q35
Q34. What about $10? Would you continue to stay enrolled if HIP required you to pay $10
each month? � YES � NO � DON’T KNOW � REFUSED
DEMOGRAPHICS
Q35. What is the highest grade or year of school you have completed? (READ ALL
OPTIONS) � GRADES 1 TO 8 (ELEMENTARY SCHOOL) � GRADES 9 TO 11 (SOME HIGH SCHOOL) � GRADE 12 OR GED (HIGH SCHOOL GRADUATE) � COLLEGE/TECHNICAL SCHOOL 1 - 3 YEARS (SOME COLLEGE OR ADDITIONAL TRAINING) � COLLEGE 4 YEARS OR MORE (COLLEGE GRADUATE) � NO FORMAL EDUCATION � DON’T KNOW
GO TO Q31
GO TO Q33

11
Q36. As of this week, which of the following best describes your employment status? (READ ALL OPTIONS, ALLOW MULTIPLE RESPONSES) � EMPLOYED FOR WAGES � EMPLOYED FOR LESS THAN 20 HOURS A WEEK � EMPLOYED FOR 20 OR MORE HOURS A WEEK � SELF-EMPLOYED � UNEMPLOYED AND LOOKING FOR WORK � OUT OF WORK MORE THAN 1 YEAR � OUT OF WORK LESS THAN 1 YEAR � A HOMEMAKER � TAKING CARE OF AN ELDERLY PARENT OR A FAMILY MEMBER WITH A DISABILITY � A STUDENT � RETIRED � UNABLE TO WORK BECAUSE OF A PHYSICAL OR MENTAL HEALTH CONDITION � SOMETHING ELSE: (SPECIFY) ________________________________________________ � DON’T KNOW � REFUSED
CLOSE: Thank you for answering these questions. On behalf of the Healthy Indiana Plan we thank you for participating in this survey. Your answers will help improve
12
Appendix B. Current Plus Member Survey (Full)
DESCRIPTION: This survey applies to individuals currently enrolled in in HIP PLUS, identified with eligibility data.
CONFIRM ENROLLMENT IN HIP PLUS Q1. The State of Indiana runs an insurance program called the Healthy Indiana Plan (or
HIP) for Hoosiers age 19 to 64. Are you enrolled in the “Healthy Indiana Plan” or “HIP” at this time? � YES � NO � DON’T KNOW
Q1a. Are you in HIP Basic or HIP Plus?
� BASIC CONTINUE WITH THE SURVEY, GO TO Q2 � PLUS CONTINUE WITH THE SURVEY, GO TO Q2 � DON’T KNOW � REFUSED
Q1b. Based on the information we have, it looks like you are in HIP Plus and make a
monthly or annual payment to maintain your coverage. Is this correct? � YES CONTINUE WITH THE SURVEY, GO TO Q2 � NO � DON’T KNOW
SATISFACTION WITH HIP
The next set of questions will ask about your satisfaction with the Healthy Indiana Plan.
Q2. Thinking about your overall experience with the Healthy Indiana Plan in the past six months, would you say you are: � VERY SATISFIED � SOMEWHAT SATISFIED � NEITHER SATISFIED NOR DISSATISFIED � SOMEWHAT DISSATISFIED � VERY DISSATISFIED � DON’T KNOW � REFUSED
Q2a. Why are you (FILL IN WITH PREVIOUS RESPONSE)? OPEN-ENDED RESPONSE
� SPECIFY: ___________________________
GO TO CLOSE
GO TO CLOSE
GO TO Q3
13
DO NOT READ LIST BELOW; USE FOR CODING PURPOSES. (CHECK ALL THAT APPLY) � CAN’T SEE MY DOCTOR WITH HIP � DISSATISFACTION WITH CHOICE OF DOCTOR’S IN HIP � HIP DOES NOT COVER DENTAL � HIP DOES NOT COVER VISION/OPTICAL � HIP DOES NOT COVER PROCEDURE/ MEDICATION � MANY DOCTORS DO NOT ACCEPT HIP � DISSATISFIED WITH ADMINISTRATIVE ISSUE(S) OR PROCESS � DISSATISFACTION WITH A PAYMENT RELATED ISSUE � CAN’T AFFORD CO-PAY/ TOO HIGH � CO-PAYMENT / MONTHLY/ ANNUAL PAYMENT TOO HIGH � LIKE HAVING COVERAGE/ INSURANCE � LIKE DOCTORS/ HOSPITALS / HEALTH CARE PROVIDERS � LIKE PAYMENTS / PRICE � LIKE THE PLAN/ PROVIDER � LIKE SOME THINGS/ DISLIKE OTHER THINGS � SOME THINGS NOT COVERED � DON’T KNOW � REFUSED � OTHER REASON NOT LISTED ABOVE: (SPECIFY) _________________________
Q3. If you ever left HIP, would you try to reenroll if you became eligible for the program
again? � YES � NO � DON’T KNOW � REFUSED
Q4. When you applied for HIP, did you make a fast track payment?
(IF NEEDED: A fast track payment is made when you complete your application. Fast track payments allow you to get HIP coverage more quickly because you pre-pay your first payment. By making the fast track payment when you apply, it may take less time for your coverage to begin.)
� YES � NO GO TO Q4b � DON’T KNOW � REFUSED
Q4a. Why did you decide to sign-up for the fast track payment option?
� I WANTED MY COVERAGE AND/OR ELIGIBILITY TO BEGIN SOONER � I THOUGHT IT WAS A REQUIRED PART OF HIP � I THOUGHT IT WOULD BE EASIER TO PAY THEN (I.E., WOULDN’T HAVE TO MAIL/GO IN-
PERSON, ETC.) � I HAD THE FUNDS AT THE TIME I APPLIED � OTHER REASON NOT LISTED ABOVE: (Specify) ______________________________ � DON’T KNOW � REFUSED
GO TO Q5

14
Q4b. Why did you decide NOT to sign-up for the fast track payment option? � I COULDN’T AFFORD TO MAKE THE PAYMENT � I WASN’T SURE IF I WOULD BE ELIGIBLE � I DIDN’T UNDERSTAND THE DIFFERENCE BETWEEN FAST TRACK AND THE REGULAR
PAYMENT OPTION � I DIDN’T NEED COVERAGE TO START SOONER � I WASN’T AWARE OF THE OPTION TO SIGN-UP FOR FAST TRACK AT THE TIME I
APPLIED � OTHER REASON NOT LISTED ABOVE: (Specify) ______________________________ � DON’T KNOW � REFUSED
AFFORDABILITY
Q5. When you need treatment from a doctor or other health professional, do you ask
how much the treatment will cost? � YES � NO � DON’T KNOW � REFUSED
Q6. Do you make a monthly or annual payment to be in HIP?
IF NEEDED, PROBE: Do you pay something each month or once a year to be in HIP? Some call this a monthly or annual contribution and others call it a monthly bill. � MONTHLY GO TO Q7 � ANNUAL GO TO Q7 � NO I HAVE NOT MADE A MONTHLY/ANNUAL PAYMENT FOR HIP GO TO Q14 � DON’T KNOW GO TO Q14 � REFUSED GO TO Q14
Q7. How much money do you contribute each month/year (depending on answer above)
to be in HIP? $ | |, | | |.| | |
� DON’T KNOW � REFUSED
Q8. If HIP required you to pay $5 more each month, would you continue to stay
enrolled? � YES GO TO Q9 � NO GO TO Q10 � DON’T KNOW � REFUSED
Q9. What about $10 more? Would you continue to stay enrolled if HIP required you to
pay $10 each month? � YES � NO � DON’T KNOW

15
� REFUSED Q10. In the past 6 months, how often were you worried about having enough money to
pay your monthly contribution? � ALWAYS � USUSALLY � SOMETIMES � RARELY � NEVER � DON’T KNOW � REFUSED
Q11. When you received your bill for your monthly or annual HIP payment, did you get
any help with the cost from someone else such as a family member, friend, employer, healthcare provider or charity? � YES GO TO Q12 � NO � DON’T KNOW � REFUSED
Q12. Please tell me yes or no if you received help in making the payments from each of
these sources: � FAMILY MEMBER � FRIEND � CHARITY OR RELIGIOUS ORGANIZATION � A HEALTHCARE PROVIDER SUCH AS A DOCTOR’S OFFICE OR HOSPITAL � EMPLOYER � OTHER: (SPECIFY) ______________________________
Q13. Please tell me if you have used each of the following methods to make your
payment: � CASH � CHECK � CREDIT CARD � DEBIT CARD � OTHER: (SPECIFY) ______________________________ � DON’T KNOW � REFUSED
ACCESS
Q14. In the last 6 months, did you make any appointments for a check-up or routine care
at a doctor’s office or clinic? � YES GO TO NEXT QUESTION � NO SKIP NEXT QUESTION [Q15] � DON’T KNOW GO TO Q15
GO TO Q13
16
Q14a. In the last 6 months, how often did you get an appointment for a check-up or routine care at a doctor’s office or clinic as soon as you needed? � NEVER � SOMETIMES � USUALLY � ALWAYS
Q15. Specialists are doctors like surgeons, heart doctors, allergy doctors, skin doctors,
and other doctors who specialize in one area of health care. In the last 6 months, did you make any appointments to see a specialist? � YES GO TO NEXT QUESTION � NO GO TO Q16 � DON’T KNOW GO TO Q16
Q15a. In the last 6 months, how often did you get an appointment to see a specialist as
soon as you needed? � NEVER � SOMETIMES � USUALLY � ALWAYS
Q16. In the last 6 months, did you get any new prescription medicines or refill a
prescription? � YES GO TO NEXT QUESTION � NO GO TO Q17 � DON’T KNOW GO TO Q17
Q16a. In the last 6 months, how often was it easy to get your prescription medicine from
your health plan? � NEVER � SOMETIMES � USUALLY � ALWAYS
Q17. In the past six months, have you missed any healthcare appointments, such as
doctor’s appointments? � YES � NO � DON’T KNOW � REFUSED
GO TO Q18

17
Appendix C. Leaver Survey (Full)
DESCRIPTION: This survey applies to individuals who:
• Were members but left the program for any reason (e.g., moved out of state, received coverage through Medicare)
• Were members with income over 100% FPL who left the program for non-payment of the POWER account contribution
Q1. Think about the new HIP insurance program that started in February 2015. Were you enrolled in HIP insurance earlier this year, in 2015? (NOTE: CLARIFY ONLY 2015) � YES (CONTINUE) � NO � DON’T KNOW
Q2. Just to confirm . . . you are not currently enrolled in HIP at this time. Is that correct?
� YES � NO – CURRENTLY ENROLLED � DON’T KNOW
WHY ENROLLMENT ENDED Q3. What are all the reasons you are no longer enrolled with HIP?
(ACCEPT MULTIPLE RESPONSES, USE LIST FOR CODING)
� I EARNED TOO MUCH/INCREASE IN MY INCOME � I DIDN’T FINISH MY PAPERWORK IN TIME � DIDN’T KNOW HOW TO MAKE A MONTHLY PAYMENT � I COULDN’T PAY MY MONTHLY CONTRIBUTION � I HAD OTHER INSURANCE AVAILABLE TO ME � I BECAME PREGNANT WHILE ON HIP � THEY CHANGED ME TO REGULAR MEDICAID � I DON’T KNOW WHY THEY TERMINATED MY COVERAGE � PAYMENT ERROR/MISUNDERSTANDING/CHECKING ACCOUNT PROBLEM/
LOST PAYMENT � LATE OR FORGOTTEN MONTHLY PAYMENT � EMPLOYER ERROR RELATED TO PAPERWORK � GOT MEDICARE � TRIED TO RE-ENROLL BUT STAFF COULDN’T HELP ME/SYSTEM FAILED/
IT DIDN’T WORK OUT � TRIED TO RE-ENROLL BUT THEY DIDN’T GET MY PAPERWORK DONE IN TIME � MOVED / NO LONGER LIVING IN INDIANA � INCARCERATED � PROBLEMS WITH APPEALS PROCESS � HIP PAPERWORK ERROR/MEMBER NEVER RECEIVED PAPERWORK/MEMBER � SENT PAPERWORK BUT HIP NEVER RECEIVED � CHANGED MY MIND / DON’T WANT COVERAGE � OTHER (SPECIFY) ________________________________ � DON’T KNOW � REFUSED
GO TO CLOSE 1
GO TO CLOSE 1
GO TO Q3

18
Q4. Which reason for leaving HIP was the most important? ____________________ (ASK ONLY IF RESPONDENT PROVIDED MULTIPLE REASONS FOR LEAVING HIP; IF NEEDED RE-READ RESPONDENT’S SELECTIONS FROM ABOVE)
Q5. Did you make a monthly or annual payment when you were in HIP?
(ASK ONLY IF FILE SHOWS RESPONDENT USED TO BE IN HIP PLUS) � DID NOT MAKE A MONTHLY OR ANNUAL PAYMENT GO TO Q8 � MONTHLY � ANNUAL � REFUSED � DON’T KNOW
Q6. Would you say the amount you contributed each month/year was:
(ASK ONLY OF RESPONDENTS WITH DATA FILE ENTRY FOR HIP PLUS)
� WAY TOO MUCH � A LITTLE TOO MUCH � THE RIGHT AMOUNT � BELOW THE RIGHT AMOUNT � WAY BELOW THE RIGHT AMOUNT � NEVER MADE A PAYMENT � DON’T KNOW � REFUSED
Q7. When you were enrolled in HIP, how often were you worried about having enough
money to pay your monthly contribution? (ASK ONLY OF RESPONDENTS WITH DATA FILE ENTRY FOR HIP PLUS) � ALWAYS � USUALLY � SOMETIMES � RARELY � NEVER � NEVER MADE A PAYMENT � DON’T KNOW � REFUSED
Q8. Did you make copayments when you were in HIP? (ASK ONLY IF FILE SHOWS RESPONDENT USED TO BE IN HIP BASIC) � YES GO TO Q9 � NO � DON’T KNOW � REFUSED
Q9. Would you say your copayments were:
(ASK ONLY OF RESPONDENTS WITH DATA FILE ENTRY FOR HIP BASIC) � WAY TOO MUCH � A LITTLE TOO MUCH � THE RIGHT AMOUNT � BELOW THE RIGHT AMOUNT � WAY BELOW THE RIGHT AMOUNT
GO TO Q6
GO TO Q8
GO TO Q10

19
� NEVER MADE A PAYMENT � DON’T KNOW � REFUSED
Q10. Are you aware that, in HIP, if you do not make monthly or annual payments you can
be terminated from the program and not allowed to return for six months? (ASK ONLY OF RESPONDENTS WITH DATA FILE ENTRY FOR FPL ABOVE 100%) � YES � NO � DON’T KNOW � REFUSED
Q11. Do you have any health insurance coverage right now? � YES GO TO Q13 � NO � DON’T KNOW � REFUSED
Q12. So you are not insured right now, is that correct?
� YES � NO � DON’T KNOW � REFUSED
INDIVIDUALS WITH OTHER COVERAGE
Q13. What is your source of insurance coverage?
(ASK ONLY IF YES TO QUESTION 11 ABOUT CURRENTLY HAVING INSURANCE COVERAGE. ACCEPT MULTIPLE RESPONSES)
� A SPOUSE IF EMPLOYER BOX IS CHECKED, GO TO Q14 � AN EMPLOYER IF EMPLOYER BOX IS CHECKED, GO TO Q14 � MEDICARE � MEDICAID OR HOOSIER HEALTHWISE, OR HOOSIER CARE CONNECT � TRICARE � VETERAN’S ADMINISTRATION � AN INDIVIDUAL POLICY � MARKETPLACE OR TAX CREDIT � SOME OTHER SOURCE (SPECIFY) __________________ � DON’T KNOW � REFUSED
INDIVIDUALS WITH EMPLOYER COVERAGE
Q14. Do you or your spouse/partner have to pay a portion of the insurance that you get
from your employer? (ASK ONLY IF ANSWER TO QUESTION 13 IS “AN EMPLOYER”)
� YES � NO
GO TO Q12
GO TO Q18
GO TO Q18 CHANGE RESPONSE TO Q11, GO TO Q13
20
� DON’T KNOW � REFUSED
Q15. In comparison to your previous HIP payments, would you say the amount you
contribute to your employer-sponsored coverage each month is… (ASK ONLY IF ANSWER TO QUESTION 13 IS “AN EMPLOYER” AND Q11 IS “YES – HAS INSURANCE”)
� WAY TOO MUCH � A LITTLE TOO MUCH � THE RIGHT AMOUNT � BELOW THE RIGHT AMOUNT � WAY BELOW THE RIGHT AMOUNT � DON’T KNOW � REFUSED
Q16. When you make your monthly or annual payment to your employer this year, will
you get any help with the cost from someone else such as a family member, friend, healthcare provider or charity? (ASK ONLY IF ANSWER TO QUESTION 13 IS “AN EMPLOYER” AND Q11 IS “YES – HAS INSURANCE”)
� YES � NO � DON’T KNOW � REFUSED
Q17. If HIP could help you pay for your employer-sponsored insurance, would you sign
up for that type of help? (ASK ONLY IF ANSWER TO QUESTION 13 IS “AN EMPLOYER” AND Q11 IS “YES – HAS INSURANCE”)
� YES � NO � DON’T KNOW � REFUSED
ACCESS TO CARE
Q18. Since you left HIP, did you make any appointments for a check-up or routine care at
a doctor’s office or clinic? � YES GO TO NEXT QUESTION � NO GO TO Q20 � DON’T KNOW GO TO Q20 � REFUSED GO TO Q20
Q19. Since you left HIP, how often did you get an appointment for a check-up or routine
care at a doctor’s office or clinic as soon as you needed? � NEVER � SOMETIMES � USUALLY � ALWAYS

21
Q20. Specialists are doctors like surgeons, heart doctors, allergy doctors, skin doctors, and other doctors who specialize in one area of health care. Since you left HIP, did you make any appointments to see a specialist? � YES GO TO NEXT QUESTION � NO GO TO Q22 � DON’T KNOW GO TO Q22 � REFUSED GO TO Q22
Q21. Since you left HIP, how often did you get an appointment to see a specialist as soon
as you needed? � NEVER � SOMETIMES � USUALLY � ALWAYS
Q22. Since you left HIP, did you get any new prescription medicines or refill a
prescription? � YES GO TO NEXT QUESTION � NO GO TO Q24 � DON’T KNOW GO TO Q24 � REFUSED GO TO Q24
Q23. Since you left HIP, how often did you get the prescription medicine you needed?
� NEVER � SOMETIMES � USUALLY � ALWAYS
DEMOGRAPHICS
Q24. What is the highest grade or year of school you have completed? (READ ALL
OPTIONS) � GRADES 1 TO 8 (ELEMENTARY SCHOOL) � GRADES 9 TO 11 (SOME HIGH SCHOOL) � GRADE 12 OR GED (HIGH SCHOOL GRADUATE) � COLLEGE / TECHNICAL SCHOOL 1 TO 3 YEARS (SOME COLLEGE OR ADDITIONAL
TRAINING) � COLLEGE 4 YEARS OR MORE (COLLEGE GRADUATE) � NO FORMAL EDUCATION � DON’T KNOW
Q25. As of this week which of the following best describes your employment status?
(READ ALL OPTIONS, ALLOW MULTIPLE RESPONSES) � EMPLOYED FOR WAGES � EMPLOYED FOR LESS THAN 20 HOURS A WEEK � EMPLOYED FOR 20 OR MORE HOURS A WEEK � SELF-EMPLOYED � UNEMPLOYED AND LOOKING FOR WORK � OUT OF WORK MORE THAN 1 YEAR
22
� OUT OF WORK LESS THAN 1 YEAR � A HOMEMAKER � TAKING CARE OF AN ELDERLY PARENT OR A FAMILY MEMBER WITH A DISABILITY � A STUDENT � RETIRED � UNABLE TO WORK BECAUSE OF A PHYSICAL OR MENTAL HEALTH CONDITION � SOMETHING ELSE (SPECIFY) _______________________________________________ � DON’T KNOW � REFUSED
CLOSE1 Thank you for answering these questions. This survey is meant to be completed by people who are not currently enrolled in the Healthy Indiana Plan or who have left the plan within the past year. If you have any questions about the plan, please call 1-877-438-4479. Thank you and have a good (day/night).
INTERVIEWER: HANG UP. CODE CASE AS INELIGIBLE—DOES NOT MEET SURVEY CRITERIA
CLOSE: Thank you for answering these questions. On behalf of the Healthy Indiana Plan we thank you for participating in this survey. Your answers will help improve the program.
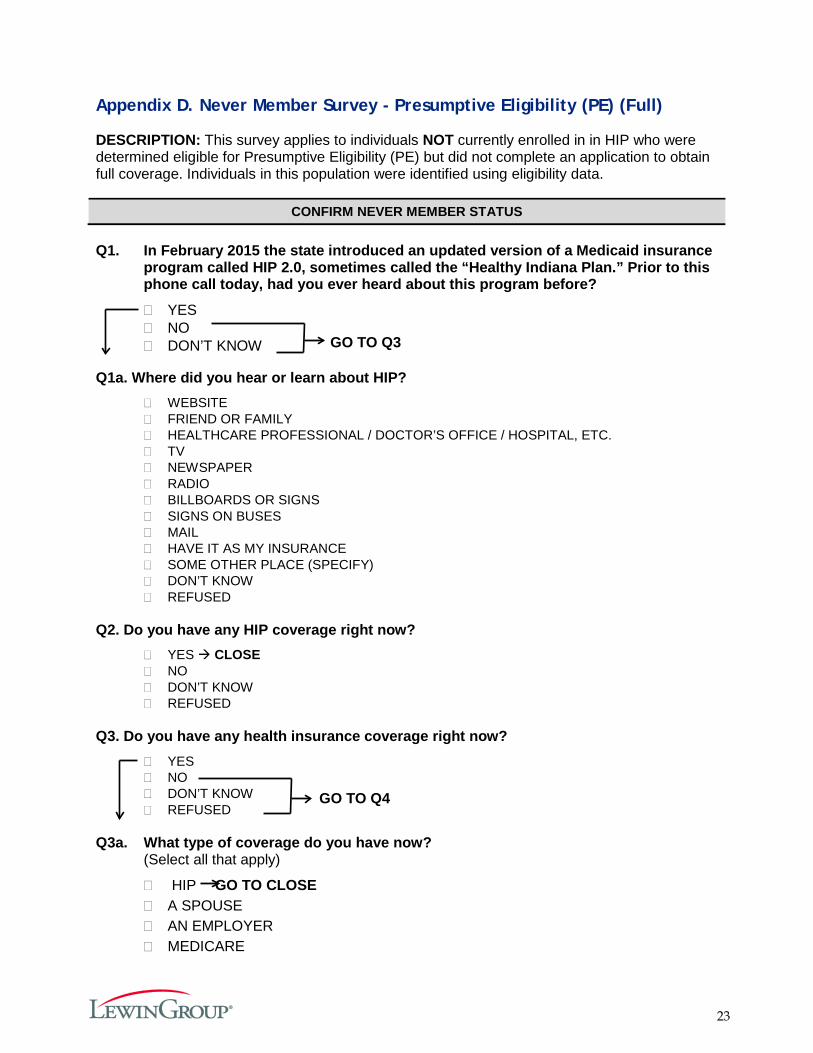
23
Appendix D. Never Member Survey - Presumptive Eligibility (PE) (Full)
DESCRIPTION: This survey applies to individuals NOT currently enrolled in in HIP who were determined eligible for Presumptive Eligibility (PE) but did not complete an application to obtain full coverage. Individuals in this population were identified using eligibility data.
CONFIRM NEVER MEMBER STATUS Q1. In February 2015 the state introduced an updated version of a Medicaid insurance
program called HIP 2.0, sometimes called the “Healthy Indiana Plan.” Prior to this phone call today, had you ever heard about this program before?
� YES � NO � DON’T KNOW
Q1a. Where did you hear or learn about HIP?
� WEBSITE � FRIEND OR FAMILY � HEALTHCARE PROFESSIONAL / DOCTOR’S OFFICE / HOSPITAL, ETC. � TV � NEWSPAPER � RADIO � BILLBOARDS OR SIGNS � SIGNS ON BUSES � MAIL � HAVE IT AS MY INSURANCE � SOME OTHER PLACE (SPECIFY) � DON’T KNOW � REFUSED
Q2. Do you have any HIP coverage right now?
� YES CLOSE � NO � DON’T KNOW � REFUSED
Q3. Do you have any health insurance coverage right now?
� YES � NO � DON’T KNOW � REFUSED
Q3a. What type of coverage do you have now?
(Select all that apply)
� HIP GO TO CLOSE � A SPOUSE � AN EMPLOYER � MEDICARE
GO TO Q3
GO TO Q4
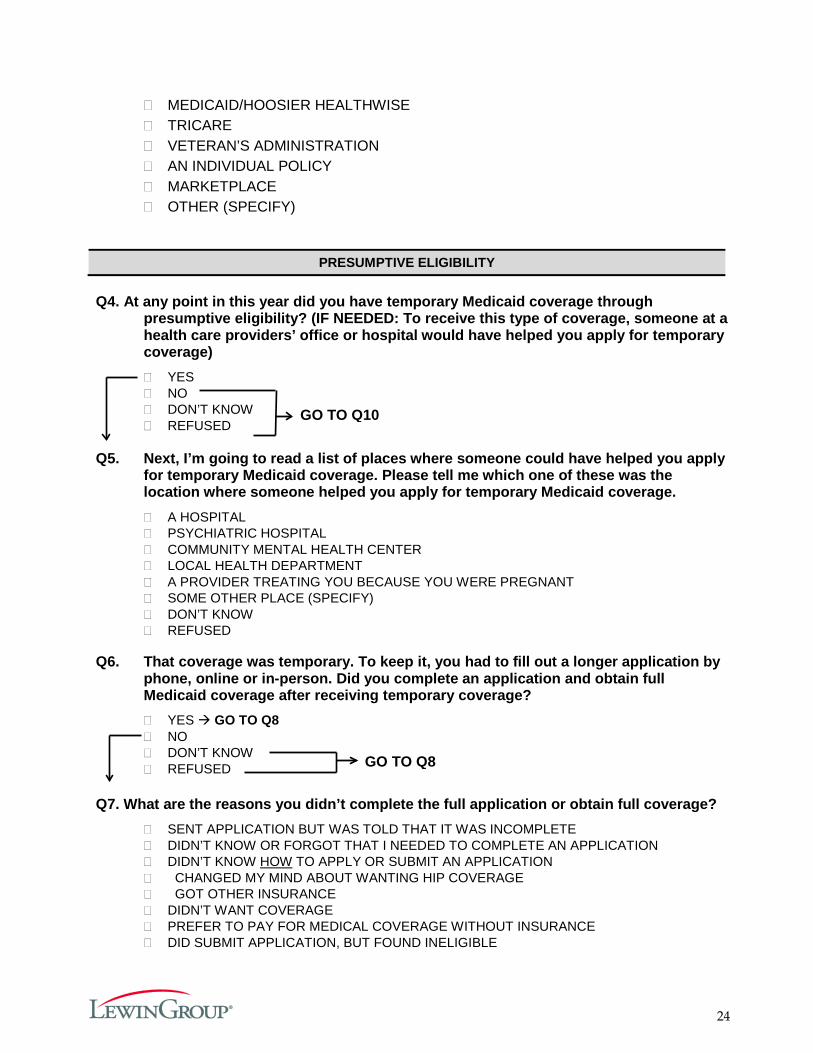
24
� MEDICAID/HOOSIER HEALTHWISE � TRICARE � VETERAN’S ADMINISTRATION � AN INDIVIDUAL POLICY � MARKETPLACE � OTHER (SPECIFY)
PRESUMPTIVE ELIGIBILITY
Q4. At any point in this year did you have temporary Medicaid coverage through
presumptive eligibility? (IF NEEDED: To receive this type of coverage, someone at a health care providers’ office or hospital would have helped you apply for temporary coverage) � YES � NO � DON’T KNOW � REFUSED
Q5. Next, I’m going to read a list of places where someone could have helped you apply
for temporary Medicaid coverage. Please tell me which one of these was the location where someone helped you apply for temporary Medicaid coverage. � A HOSPITAL � PSYCHIATRIC HOSPITAL � COMMUNITY MENTAL HEALTH CENTER � LOCAL HEALTH DEPARTMENT � A PROVIDER TREATING YOU BECAUSE YOU WERE PREGNANT � SOME OTHER PLACE (SPECIFY) � DON’T KNOW � REFUSED
Q6. That coverage was temporary. To keep it, you had to fill out a longer application by
phone, online or in-person. Did you complete an application and obtain full Medicaid coverage after receiving temporary coverage? � YES GO TO Q8 � NO � DON’T KNOW � REFUSED
Q7. What are the reasons you didn’t complete the full application or obtain full coverage?
� SENT APPLICATION BUT WAS TOLD THAT IT WAS INCOMPLETE � DIDN’T KNOW OR FORGOT THAT I NEEDED TO COMPLETE AN APPLICATION � DIDN’T KNOW HOW TO APPLY OR SUBMIT AN APPLICATION � CHANGED MY MIND ABOUT WANTING HIP COVERAGE � GOT OTHER INSURANCE � DIDN’T WANT COVERAGE � PREFER TO PAY FOR MEDICAL COVERAGE WITHOUT INSURANCE � DID SUBMIT APPLICATION, BUT FOUND INELIGIBLE
GO TO Q8
GO TO Q10

25
� OTHER (SPECIFY) � DON’T KNOW � REFUSED
Q8. Did the hospital, health center, doctor or health department that helped you sign up
for temporary coverage follow up to remind you to submit a full application? � YES � NO � DON’T KNOW � REFUSED
Q9. When Temporary Medicaid was set for you, you were enrolled in a health plan to
manage your benefits. Did the health plan that you were assigned to for temporary coverage follow up to remind you to submit a full application? (IF NEEDED: By health plan, I mean the company such as Anthem, MDwise, or MHS.) � YES � NO � DON’T KNOW � REFUSED
FUTURE HIP COVERAGE
Q10. Do you plan to apply for health coverage assistance through Medicaid or HIP in the
future? (IF NEEDED: “HIP is Healthy Indiana Plan” – a health insurance program for uninsured Hoosiers that provides coverage for Hoosiers ages 19 to 64.) � YES GO TO Q12 � NO � DON’T KNOW � REFUSED
Q11. Why do you not plan to apply for Medicaid or HIP in the future?
� DON’T KNOW WHERE TO GET APPLICATION � DON’T KNOW WHERE TO SUBMIT AN APPLICATION:
o DON’T KNOW WHAT OFFICE TO GO TO o DON’T HAVE INTERNET ACCESS o DON’T KNOW I CAN APPLY BY PHONE
� DON'T NEED IT, HEALTHY � DON'T WANT PUBLIC ASSISTANCE � DIDN’T KNOW ABOUT IT � DON’T UNDERSTAND IT � NOT SURE ABOUT ELIGIBILITY / NOT ELIGIBLE � CAN’T AFFORD PAYMENTS � HAVE ACCESS TO OTHER INSURANCE � ALREADY INSURED � PAY FOR MEDICAL COVERAGE WITHOUT INSURANCE � JUST GO TO THE EMERGENCY ROOM � JUST MOVED HERE � GOING TO MOVE AWAY � OTHER (SPECIFY)
GO TO Q12
FUTURE HIP COVERAGE

26
� DON’T KNOW � REFUSED
Q12. Some people make a monthly contribution to be in HIP. If HIP required you to pay $5
each month to be enrolled, would you enroll? � YES � NO GO TO Q14 � DON’T KNOW GO TO Q14 � REFUSED GO TO Q14
Q13. What about $10? Would you enroll if HIP required you to pay $10 each month?
� YES � NO � DON’T KNOW � REFUSED
ACCESS (CAHPS QUESTIONS)
Q14. In the last 6 months, did you make any appointments for a check-up or routine care
at a doctor’s office or clinic? � YES GO TO NEXT QUESTION � NO SKIP NEXT QUESTION [Q16]
Q15. In the last 6 months, how often did you get an appointment for a check-up or routine
care at a doctor’s office or clinic as soon as you needed? � NEVER � SOMETIMES � USUALLY � ALWAYS
Q16. Specialists are doctors like surgeons, heart doctors, allergy doctors, skin doctors,
and other doctors who specialize in one area of health care. In the last 6 months, did you make any appointments to see a specialist? � YES GO TO Q17 � NO GO TO Q18 � DON’T KNOW GO TO Q18 � REFUSED GO TO Q18
Q17. In the last 6 months, how often did you get an appointment to see a specialist as
soon as you needed? � NEVER � SOMETIMES � USUALLY � ALWAYS
Q18. In the last 6 months, did you get any new prescription medicines or refill a
prescription?

27
� YES GO TO Q19 � NO GO TO Q20
Q19. In the last 6 months, how often was it easy to get your prescription medicine from
your health plan? � NEVER � SOMETIMES � USUALLY � ALWAYS
DEMOGRAPHICS
Q20. Including yourself, how many total people (adults and children) are in your
household? � 1 � 2 � 3 � 4 � 5 � 6 � 7 � 8 � MORE THAN 8 � DON’T KNOW � REFUSED
Q21. Please stop me when I read the amount that best describes your family’s monthly
household income. Would that be . . . . � LESS THAN $1,000 � MORE THAN $1,000 UP TO $1,400 � BETWEEN $1,400 AND $1,700, � BETWEEN $1,700 AND $2,000 � BETWEEN $2,000 AND $2,300 � BETWEEN $2,300 AND $2,700 � BETWEEN $2,700 AND $3,000 � BETWEEN $3,000 AND $3,400 � MORE THAN $3,400 PER MONTH � DON’T KNOW � REFUSED
Q21. What is the highest grade or year of school you have completed? (READ ALL OPTIONS)
� GRADES 1 TO 8 (ELEMENTARY SCHOOL) � GRADES 9 TO 11 (SOME HIGH SCHOOL) � GRADE 12 OR GED (HIGH SCHOOL GRADUATE) � COLLEGE / TECHNICAL SCHOOL 1 TO 3 YEARS (SOME COLLEGE OR ADDITIONAL
TRAINING) � COLLEGE 4 YEARS OR MORE (COLLEGE GRADUATE) � NO FORMAL EDUCATION � DON’T KNOW
28
Q22. As of this week, which of the following best describes your employment status (READ ALL OPTIONS, ALLOW MULTIPLE RESPONSES)? � EMPLOYED FOR LESS THAN 20 HOURS A WEEK � EMPLOYED FOR 20 OR MORE HOURS A WEEK IN A SINGLE JOB � EMPLOYED FOR 20 OR MORE HOURS A WEEK IN MULTIPLE JOBS � SELF-EMPLOYED � UNEMPLOYED AND LOOKING FOR WORK � NOT ABLE TO WORK � FULLTIME HOMEMAKER � TAKING CARE OF ELDERLY OR DISABLED FAMILY MEMBER � RETIRED � SOMETHING ELSE (SPECIFY) � DON’T KNOW � REFUSED
CLOSE: Thank you for answering these questions. On behalf of the Healthy Indiana Plan we thank you for participating in this survey. Your answers will help improve the program.

29
Appendix E. Never Member Survey - Did Not Make PAC (Full)
DESCRIPTION: This survey applies to individuals NOT currently enrolled in HIP who applied for HIP coverage but did not make their first Power Account payment/contribution (PAC) and are over 100% of the FPL. Individuals in this population were identified using eligibility data.
CONFIRM NEVER MEMBER STATUS Q1. In February 2015 the state introduced an updated version of a Medicaid insurance
program called HIP 2.0, sometimes called the “Healthy Indiana Plan.” Prior to this phone call today, had you ever heard about this program before? � YES � NO � DON’T KNOW
Q1a. Where did you hear or learn about HIP?
� WEBSITE � FRIEND OR FAMILY � HEALTHCARE PROFESSIONAL / DOCTOR’S OFFICE / HOSPITAL, ETC. � TV � NEWSPAPER � RADIO � BILLBOARDS OR SIGNS � SIGNS ON BUSES � MAIL � HAVE IT AS MY INSURANCE � SOME OTHER PLACE (SPECIFY) � DON’T KNOW � REFUSED
Q2. Do you have any HIP coverage right now?
� YES CLOSE � NO � DON’T KNOW � REFUSED
Q3. Do you have any health insurance coverage right now?
� YES � NO � DON’T KNOW � REFUSED
Q3a. What type of coverage do you have now?
(Select all that apply) � HIP GO TO CLOSE � A SPOUSE � AN EMPLOYER � MEDICARE
GO TO Q2
GO TO Q4
30
� MEDICAID/HOOSIER HEALTHWISE � TRICARE � VETERAN’S ADMINISTRATION � AN INDIVIDUAL POLICY � MARKETPLACE � OTHER (SPECIFY)
NON-PAYMENT OF PAC
Q4. Did you ever complete an application for HIP?
� YES � NO CONTINUE TO Q7 � DON’T KNOW � REFUSED
Q5. Once you complete an application for HIP, you are required to make a payment
before your coverage starts. Were you aware of this prior to this call? � YES � NO � DON’T KNOW � REFUSED
Q6. Did you make your first HIP payment?
� YES GO TO CLOSE � NO � DON’T KNOW � REFUSED
Q6a. What is the main reason you did not make your first payment?
� CAN’T AFFORD/FEES TOO HIGH � CHANGED MY MIND ABOUT WANTING HIP COVERAGE � GOT OTHER INSURANCE � DON’T NEED ADDITIONAL SERVICES � DON’T KNOW HOW TO START PAYING ON A MONTHLY BASIS � DO NOT WANT HIP PLUS OR ADDED BENEFITS � DON’T PLAN TO BE IN THE PROGRAM VERY LONG � NOT OFFERED THE OPTION TO PAY ON A MONTHLY BASIS � DON’T UNDERSTAND THE PROGRAM/DIFFERENCES � NOT REQUIRED TO PAY THE CONTRIBUTION � FORGOT � OTHER REASON NOT LISTED ABOVE: (SPECIFY) ______________________________ � DON’T KNOW � REFUSED
31
FUTURE HIP COVERAGE Q7. Do you plan to apply for health coverage assistance through Medicaid or HIP in the
future? (IF NEEDED: “ HIP is Healthy Indiana Plan” -- a health insurance program for uninsured Hoosiers that provides coverage for Hoosiers ages 19 to 64.) � YES GO TO Q9 � NO � DON’T KNOW � REFUSED
Q8. Why do you not plan to apply for Medicaid or HIP in the future? � DON’T KNOW WHERE TO GET APPLICATION � DON’T KNOW WHERE TO SUBMIT AN APPLICATION:
o DON’T KNOW WHAT OFFICE TO GO TO o DON’T HAVE INTERNET ACCESS o DON’T KNOW I CAN APPLY BY PHONE
� DON'T NEED IT, HEALTHY � DON'T WANT PUBLIC ASSISTANCE � DIDN’T KNOW ABOUT IT � DON’T UNDERSTAND IT � NOT SURE ABOUT ELIGIBILITY / NOT ELIGIBLE � CAN’T AFFORD PAYMENTS � HAVE ACCESS TO OTHER INSURANCE � ALREADY INSURED � PAY FOR MEDICAL COVERAGE WITHOUT INSURANCE � JUST GO TO THE EMERGENCY ROOM � JUST MOVED HERE � GOING TO MOVE AWAY � OTHER (SPECIFY) � DON’T KNOW � REFUSED
Q9. Some people make a monthly contribution to be in HIP. If HIP required you to pay $5
each month to be enrolled, would you enroll? � YES � NO � DON’T KNOW � REFUSED
Q10. What about $10? Would you enroll if HIP required you to pay $10 each month?
� YES � NO � DON’T KNOW � REFUSED
GO TO Q9
GO TO Q11
32
ACCESS Q11. In the last 6 months, did you make any appointments for a check-up or routine care
at a doctor’s office or clinic? � YES GO TO NEXT QUESTION � NO SKIP NEXT QUESTION [Q13]
Q12. In the last 6 months, how often did you get an appointment for a check-up or routine
care at a doctor’s office or clinic as soon as you needed? � NEVER � SOMETIMES � USUALLY � ALWAYS
Q13. Specialists are doctors like surgeons, heart doctors, allergy doctors, skin doctors,
and other doctors who specialize in one area of health care. In the last 6 months, did you make any appointments to see a specialist? � YES GO TO Q14 � NO GO TO Q15
Q14. In the last 6 months, how often did you get an appointment to see a specialist as
soon as you needed? � NEVER � SOMETIMES � USUALLY � ALWAYS
Q15. In the last 6 months, did you get any new prescription medicines or refill a
prescription? � YES GO TO Q16 � NO GO TO Q17
Q16. In the last 6 months, how often was it easy to get your prescription medicine from
your health plan? � NEVER � SOMETIMES � USUALLY � ALWAYS

33
DEMOGRAPHICS Q17. Including yourself, how many total people (adults and children) are in your
household? � 1 � 2 � 3 � 4 � 5 � 6 � 7 � 8 � MORE THAN 8 � DON’T KNOW � REFUSED
Q18. Please stop me when I read the amount that best describes your family’s monthly
household income. Would that be . . . . � LESS THAN $1,000 � MORE THAN $1,000 UP TO $1,400 � BETWEEN $1,400 AND $1,700, � BETWEEN $1,700 AND $2,000 � BETWEEN $2,000 AND $2,300 � BETWEEN $2,300 AND $2,700 � BETWEEN $2,700 AND $3,000 � BETWEEN $3,000 AND $3,400 � MORE THAN $3,400 PER MONTH � DON’T KNOW � REFUSED
Q18. What is the highest grade or year of school you have completed? (READ ALL
OPTIONS) � GRADES 1 TO 8 (ELEMENTARY SCHOOL) � GRADES 9 TO 11 (SOME HIGH SCHOOL) � GRADE 12 OR GED (HIGH SCHOOL GRADUATE) � COLLEGE / TECHNICAL SCHOOL 1 TO 3 YEARS (SOME COLLEGE OR ADDITIONAL
TRAINING) � COLLEGE 4 YEARS OR MORE (COLLEGE GRADUATE) � NO FORMAL EDUCATION � DON’T KNOW
Q19. As of this week, which of the following best describes your employment status? (READ ALL OPTIONS, ALLOW MULTIPLE RESPONSES) � EMPLOYED FOR WAGES � EMPLOYED FOR LESS THAN 20 HOURS A WEEK � EMPLOYED FOR 20 OR MORE HOURS A WEEK � SELF-EMPLOYED � UNEMPLOYED AND LOOKING FOR WORK � OUT OF WORK MORE THAN 1 YEAR � OUT OF WORK LESS THAN 1 YEAR
34
� A HOMEMAKER � TAKING CARE OF AN ELDERLY PARENT OR A FAMILY MEMBER WITH A DISABILITY � A STUDENT � RETIRED � UNABLE TO WORK BECAUSE OF A PHYSICAL OR MENTAL HEALTH CONDITION � SOMETHING ELSE (SPECIFY) _________________________ � DON’T KNOW � REFUSED
CLOSE: Thank you for answering these questions. On behalf of the Healthy Indiana Plan we thank you for participating in this survey. Your answers will help improve the program.

35
Appendix F. Provider Survey (Full)
DESCRIPTION: This survey applies to clinicians, practice managers, or others responding on behalf of health care providers that serve HIP members.
OPENING QUESTIONS Q1. What is your role in the practice?
� OFFICE MANAGER/PRACTICE ADMINISTRATOR � CLINICIAN � OTHER (SPECIFY) _________________
Q2. As a provider, which of the following Indiana programs do you participate in?
READ LIST. (SELECT ALL THAT APPLY) � HOOSIER HEALTHWISE (HHW) � HIP � HOOSIER CARE CONNECT (HCC) � FEE-FOR-SERVICE (TRADITIONAL MEDICAID)
Q3. What is your practice setting?
(READ LIST. ALLOW MULTIPLE ANSWER CHOICES) � SOLO/INDIVIDUAL PRACTICE � SINGLE-SPECIALTY GROUP (THIS CAN BE EITHER PRIMARY CARE OR SPECIALISTS) � MULTI-SPECIALTY GROUP (THIS CAN INCLUDE BOTH PRIMARY CARE AND
SPECIALISTS) � ACUTE CARE HOSPITAL OR PHYSICIAN HOSPITAL ORGANIZATION (PHO) � FEDERALLY QUALIFIED HEALTH CENTER (FQHC) � RURAL HEALTH CENTER (RHC) � OTHER (PLEASE SPECIFY) ___________
Q4. Are your providers…? READ LIST
� A PCP (PRIMARY CARE PROVIDER – THAT IS, INTERNAL MEDICINE, FAMILY PRACTICE) � AN OB/GYN � OTHER SPECIALIST (SPECIFY :_________________) � NONE OF THE ABOVE
Q5. Did you, as a provider, participate in the original HIP program?
� YES � NO � DON’T KNOW � REFUSED �
IF NOT SELECTED, GO TO CLOSE1

36
PAYMENT QUESTIONS Q6a. How does the reimbursement for this program compare to the Medicare program?
Would you say it …? READ LIST (NOTE: Currently HIP Reimburses at Medicare rates or 130% of the Medicaid rate if a Medicare rate does not exist.) � REIMBURSES AT THE SAME RATE � REIMBURSES AT A HIGHER RATE � REIMBURSES AT A LOWER RATE � DON’T KNOW � REFUSED
Q6b. Does the reimbursement rate influence your decision to participate in the program?
� YES � NO � DON’T KNOW � REFUSED
Q7. Were you aware that the State has increased Fee-For-Service reimbursement for all
Medicaid programs, including non-HIP programs such as Hoosier Healthwise? � YES � NO � DON’T KNOW � REFUSED
Q8. ASK Q. 8 IF ONLY HIP IS CHECKED IN Q. 2. OTHERWISE, SKIP TO Q. 9a (ASK ONLY IF RESPONDENT INDICATED THAT PRACTICE ACCEPTS HIP BUT NOT ANY OF THE OTHER MEDICAID PROGRAMS IN Q. 2) You mentioned that you accept HIP, but not other Medicaid programs. What are your reasons for only accepting HIP? � THE OTHER PROGRAMS HAVE A LOWER REIMBURSEMENT RATE � I WAS NOT AWARE OF THE OPTION TO COVER OTHER PROGRAMS � ADMINISTRATIVE BURDEN � I USED TO COVER THE OTHER PROGRAMS BUT DON’T ANYMORE � OTHER (PLEASE SPECIFY):_____________________
Q9a. With HIP 2.0, some members are responsible for copayments. Do you know how to
find out if the patient is required to pay copayments? � YES � NO � DON’T KNOW � REFUSED
Q9b. How do you find out if the patient is required to pay a copayment?
(ALLOW MULTIPLE ANSWER CHOICES) � BY ASKING THE PATIENT � BY CHECKING ELIGIBILITY VERIFICATION SYSTEM (EVS) � OTHER (PLEASE SPECIFY: _________________ )
GO TO Q7
GO TO Q9b
GO TO Q9c
GO TO Q6b
37
Q9c. Are you charging copayments to HIP members? � YES � NO � DON’T KNOW � REFUSED
Q9d. When do HIP members pay copayments?
� AT POINT OF SERVICE � MEMBER IS BILLED
Q9e. Do you pursue collections on unpaid copays?
� YES � NO � SOMETIMES � DON’T KNOW � REFUSED
Q10. For those HIP members who are required to pay copayments, what percentages of
them are making their copayments to you? Would you say it is... (READ LIST) � LESS THAN 25% � 26-49% � 50-74% � 75-99% � 100% � DON’T KNOW
MISSED APPOINTMENTS
Q11. If a member misses an appointment, which of the following are some likely reasons
that the member missed it, in your opinion? READ LIST. (CHOOSE ALL THAT APPLY) � COSTS TOO MUCH � COULDN’T GET CHILDCARE � COULDN’T GET TIME OFF FROM WORK � COULDN’T GET THROUGH ON THE PHONE � DIDN’T GET APPROVAL FROM HEALTH PLAN � DIDN’T HAVE TIME � DIDN’T WANT TO GO � HOURS OF OPERATION WERE NOT CONVENIENT � TAKES TOO LONG TO GET THERE � TRANSPORTATION PROBLEM � TOO SICK TO GO � OTHER (PLEASE SPECIFY) � I DON’T KNOW
GO TO Q9d
GO TO Q11
GO TO Q10 GO TO Q9E

38
Q11a. Which of the reasons that you just mentioned, do you feel is the most common reason for a member to miss an appointment? � COSTS TOO MUCH � COULDN’T GET CHILDCARE � COULDN’T GET TIME OFF FROM WORK � COULDN’T GET THROUGH ON THE PHONE � DIDN’T GET APPROVAL FROM HEALTH PLAN � DIDN’T HAVE TIME � DIDN’T WANT TO GO � HOURS OF OPERATION WERE NOT CONVENIENT � TAKES TOO LONG TO GET THERE � TRANSPORTATION PROBLEM � TOO SICK TO GO � OTHER (PLEASE SPECIFY) � I DON’T KNOW
Q12. When members missed appointments, do you feel that it had an impact on members
receiving preventive care? � YES � NO � SOMETIMES � DON’T KNOW � REFUSED
Q13. When members missed appointments, do you feel that it had an impact on
members’ overall quality of care? � YES GO TO Q14 � NO GO TO Q15 � SOMETIMES GO TO Q14 � DON’T KNOW � REFUSED
Q14. How has it impacted members’ quality of care? [Free response]
PRESUMPTIVE ELIGIBILITY Q15. Are you a qualified Presumptive Eligibility provider?
� YES � NO � DON’T KNOW � REFUSED
Q16. Which of the following types of Presumptive Eligibility processes do you conduct?
(READ LIST, SELECT ALL THAT APPLY) � PE FOR PREGNANT WOMEN (PEPW) ONLY � HOSPITAL PE (HPE) � REGULAR PE (PE) � DON’T KNOW � REFUSED
GO TO Q20
GO TO Q16
GO TO Q15

39
Q17. Thinking about the Presumptive Eligibility (PE) process, how would you rate the overall effectiveness of the PE process at eliminating gaps in health care coverage? Would you say you rate it …? (READ LIST) � VERY EFFECTIVE � SOMEWHAT EFFECTIVE � NOT THAT EFFECTIVE � NOT EFFECTIVE AT ALL � DON’T KNOW � REFUSED
Q18. Do you track how many people who signed up for Presumptive Eligibility coverage
went on to complete an application? � YES � NO � DON’T KNOW � REFUSED
Q19. What would you say is the success rate of your PE members getting full HIP
coverage? Would you say it is … (READ LIST) � LESS THAN 25% � 25-49% � 50-74% � 75-99% � 100% � DON’T KNOW
OVERALL THOUGHTS ON HIP
Q20. How do you feel HIP will impact your overall revenues? Do you feel it will…
(READ LIST) � INCREASE OVERALL REVENUES � DECREASE OVERALL REVENUES � KEEP THEM THE SAME, HAVE NO EFFECT ON OVERALL REVENUES � DON’T KNOW � REFUSED
Q21. How do you feel HIP will affect health or health care overall in Indiana? Do you feel it will… (READ LIST) � MAKE IT BETTER
� MAKE NO DIFFERENCE
� MAKE IT WORSE
� DON’T KNOW
� REFUSED
Q22. Some Hoosier Healthwise adults moved into HIP. Have these changes had any
impact on your organization’s uncompensated care, charity care or bad debt? � YES – GO TO Q.22a
� NO – STAYED THE SAME – GO TO Q.23
� DON’T KNOW – GO TO Q.23
� REFUSED – GO TO Q.23
40
Q22a. How have these changes impacted your uncompensated care, charity care or bad debt? (Free response)
Q23. Since HIP started in February 2015, have you seen a decline in… a. The number of patients without insurance � YES – NUMBER OF PATIENTS WITHOUT INSURANCE DECLINED � NO – NUMBER OF PATIENTS WITHOUT INSURANCE INCREASED � NO – NUMBER OF PATIENTS WITHOUT INSURANCE STAYED THE SAME � DON’T KNOW b. The number of requests for charity care cases that the practice receives � YES – IT DECREASED � NO – IT INCREASED � NO – IT STAYED THE SAME � DON’T KNOW c. The instances of Bad Debt � YES – IT DECREASED � NO – IT INCREASED � NO – IT STAYED THE SAME � DON’T KNOW
> CLOSE1< Thank you for answering these questions. May I please confirm the following information? This survey is meant to be completed by clinicians or practice managers who provide services to HIP members. If you have any questions about HIP please call 1-877-438-4479. Thank you and have a good (day/night).
INTERVIEWER: HANG UP. CODE CASE AS INELIGIBLE—DOES NOT MEET SURVEY CRITERIA
CLOSE: Thank you for answering these questions. On behalf of the Healthy Indiana Plan we thank you for participating in this survey. Your answers will help improve the program.
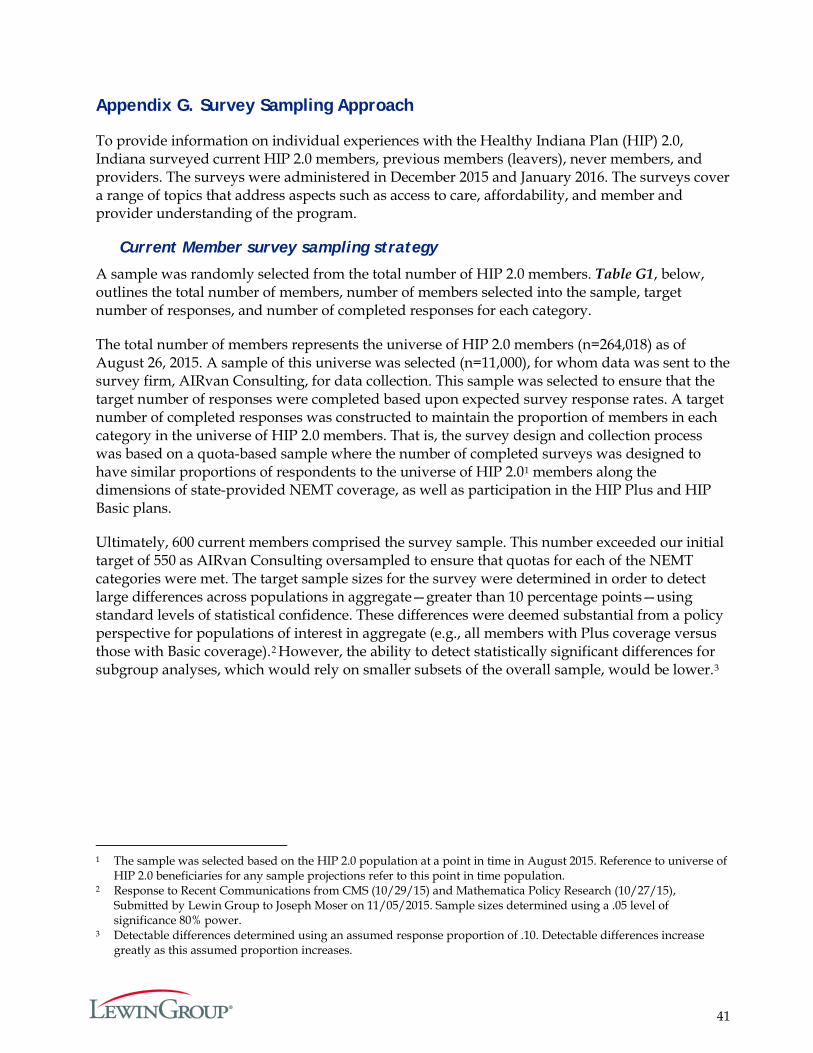
41
Appendix G. Survey Sampling Approach
To provide information on individual experiences with the Healthy Indiana Plan (HIP) 2.0, Indiana surveyed current HIP 2.0 members, previous members (leavers), never members, and providers. The surveys were administered in December 2015 and January 2016. The surveys cover a range of topics that address aspects such as access to care, affordability, and member and provider understanding of the program.
Current Member survey sampling strategy
A sample was randomly selected from the total number of HIP 2.0 members. Table G1, below, outlines the total number of members, number of members selected into the sample, target number of responses, and number of completed responses for each category.
The total number of members represents the universe of HIP 2.0 members (n=264,018) as of August 26, 2015. A sample of this universe was selected (n=11,000), for whom data was sent to the survey firm, AIRvan Consulting, for data collection. This sample was selected to ensure that the target number of responses were completed based upon expected survey response rates. A target number of completed responses was constructed to maintain the proportion of members in each category in the universe of HIP 2.0 members. That is, the survey design and collection process was based on a quota-based sample where the number of completed surveys was designed to have similar proportions of respondents to the universe of HIP 2.01 members along the dimensions of state-provided NEMT coverage, as well as participation in the HIP Plus and HIP Basic plans.
Ultimately, 600 current members comprised the survey sample. This number exceeded our initial target of 550 as AIRvan Consulting oversampled to ensure that quotas for each of the NEMT categories were met. The target sample sizes for the survey were determined in order to detect large differences across populations in aggregate—greater than 10 percentage points—using standard levels of statistical confidence. These differences were deemed substantial from a policy perspective for populations of interest in aggregate (e.g., all members with Plus coverage versus those with Basic coverage).2 However, the ability to detect statistically significant differences for subgroup analyses, which would rely on smaller subsets of the overall sample, would be lower.3
1 The sample was selected based on the HIP 2.0 population at a point in time in August 2015. Reference to universe of
HIP 2.0 beneficiaries for any sample projections refer to this point in time population. 2 Response to Recent Communications from CMS (10/29/15) and Mathematica Policy Research (10/27/15),
Submitted by Lewin Group to Joseph Moser on 11/05/2015. Sample sizes determined using a .05 level of significance 80% power.
3 Detectable differences determined using an assumed response proportion of .10. Detectable differences increase greatly as this assumed proportion increases.
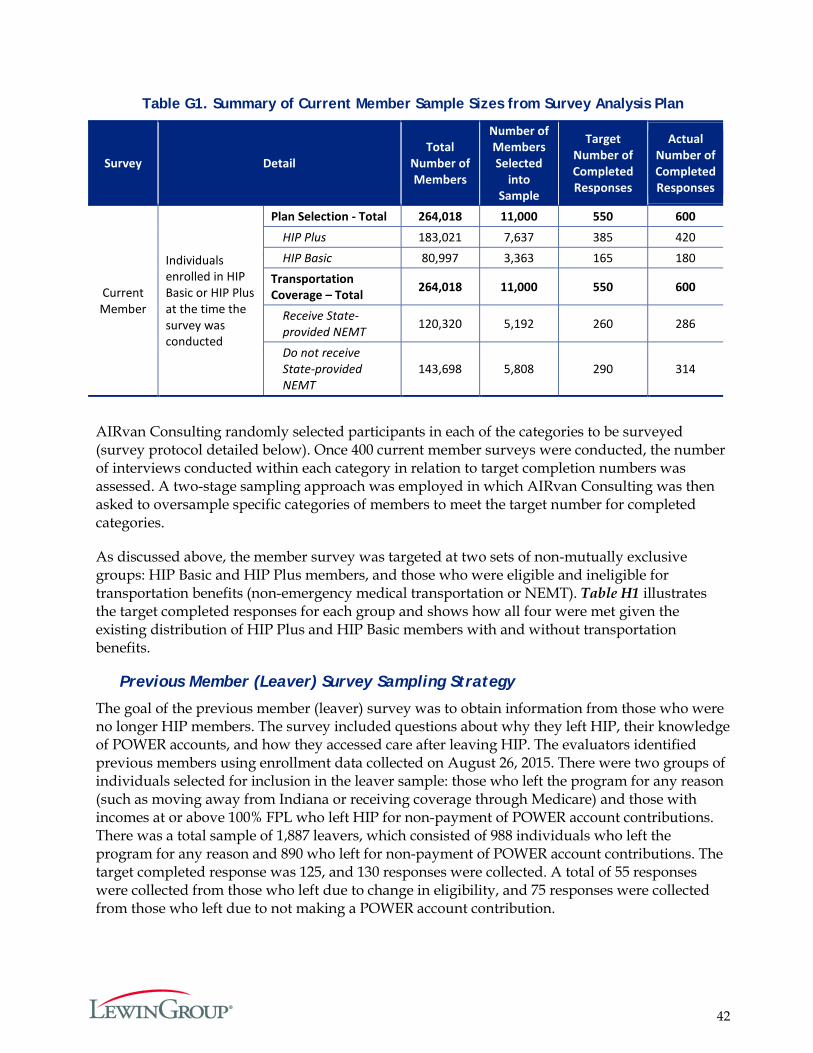
42
Table G1. Summary of Current Member Sample Sizes from Survey Analysis Plan
Survey Detail Total
Number of Members
Number of Members Selected
into Sample
Target Number of Completed Responses
Actual Number of Completed Responses
Current Member
Individuals enrolled in HIP Basic or HIP Plus at the time the survey was conducted
Plan Selection - Total 264,018 11,000 550 600 HIP Plus 183,021 7,637 385 420 HIP Basic 80,997 3,363 165 180
Transportation Coverage – Total 264,018 11,000 550 600
Receive State-provided NEMT 120,320 5,192 260 286
Do not receive State-provided NEMT
143,698 5,808 290 314
AIRvan Consulting randomly selected participants in each of the categories to be surveyed (survey protocol detailed below). Once 400 current member surveys were conducted, the number of interviews conducted within each category in relation to target completion numbers was assessed. A two-stage sampling approach was employed in which AIRvan Consulting was then asked to oversample specific categories of members to meet the target number for completed categories.
As discussed above, the member survey was targeted at two sets of non-mutually exclusive groups: HIP Basic and HIP Plus members, and those who were eligible and ineligible for transportation benefits (non-emergency medical transportation or NEMT). Table H1 illustrates the target completed responses for each group and shows how all four were met given the existing distribution of HIP Plus and HIP Basic members with and without transportation benefits.
Previous Member (Leaver) Survey Sampling Strategy
The goal of the previous member (leaver) survey was to obtain information from those who were no longer HIP members. The survey included questions about why they left HIP, their knowledge of POWER accounts, and how they accessed care after leaving HIP. The evaluators identified previous members using enrollment data collected on August 26, 2015. There were two groups of individuals selected for inclusion in the leaver sample: those who left the program for any reason (such as moving away from Indiana or receiving coverage through Medicare) and those with incomes at or above 100% FPL who left HIP for non-payment of POWER account contributions. There was a total sample of 1,887 leavers, which consisted of 988 individuals who left the program for any reason and 890 who left for non-payment of POWER account contributions. The target completed response was 125, and 130 responses were collected. A total of 55 responses were collected from those who left due to change in eligibility, and 75 responses were collected from those who left due to not making a POWER account contribution.
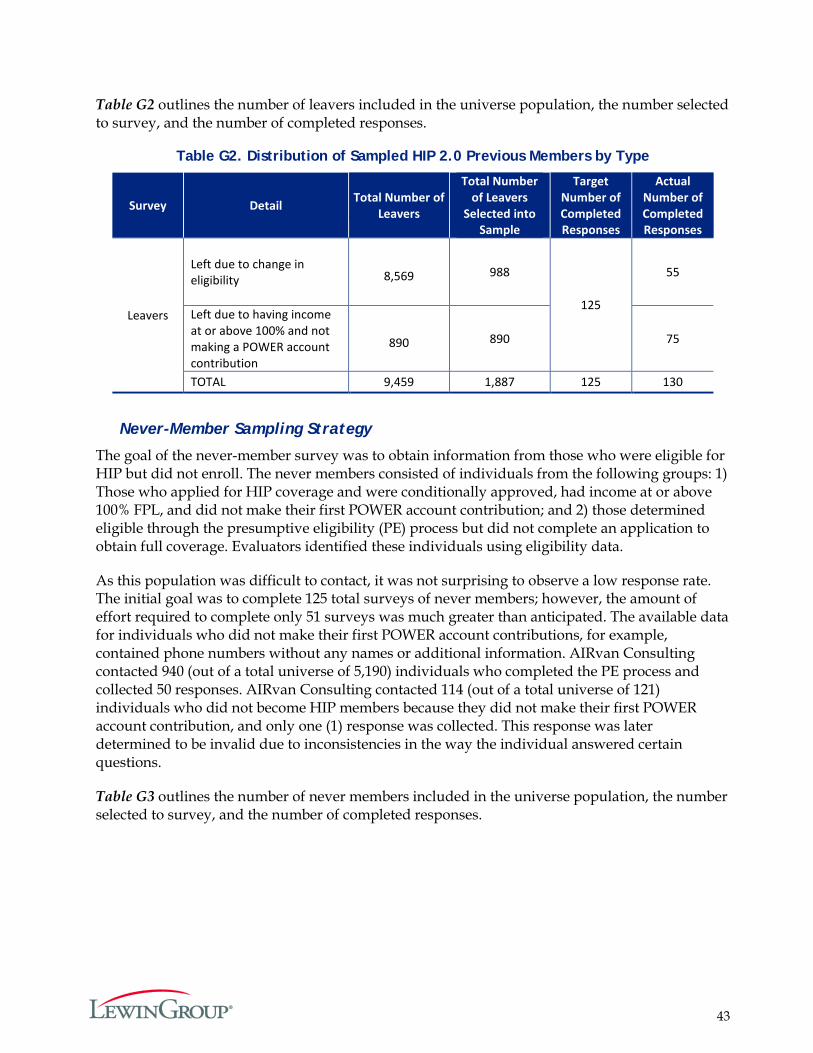
43
Table G2 outlines the number of leavers included in the universe population, the number selected to survey, and the number of completed responses.
Table G2. Distribution of Sampled HIP 2.0 Previous Members by Type
Survey Detail
Total Number of
Leavers
Total Number of Leavers
Selected into Sample
Target Number of Completed Responses
Actual Number of Completed Responses
Leavers
Left due to change in eligibility 8,569 988
125
55
Left due to having income at or above 100% and not making a POWER account contribution
890 890 75
TOTAL 9,459 1,887 125 130
Never-Member Sampling Strategy
The goal of the never-member survey was to obtain information from those who were eligible for HIP but did not enroll. The never members consisted of individuals from the following groups: 1) Those who applied for HIP coverage and were conditionally approved, had income at or above 100% FPL, and did not make their first POWER account contribution; and 2) those determined eligible through the presumptive eligibility (PE) process but did not complete an application to obtain full coverage. Evaluators identified these individuals using eligibility data.
As this population was difficult to contact, it was not surprising to observe a low response rate. The initial goal was to complete 125 total surveys of never members; however, the amount of effort required to complete only 51 surveys was much greater than anticipated. The available data for individuals who did not make their first POWER account contributions, for example, contained phone numbers without any names or additional information. AIRvan Consulting contacted 940 (out of a total universe of 5,190) individuals who completed the PE process and collected 50 responses. AIRvan Consulting contacted 114 (out of a total universe of 121) individuals who did not become HIP members because they did not make their first POWER account contribution, and only one (1) response was collected. This response was later determined to be invalid due to inconsistencies in the way the individual answered certain questions.
Table G3 outlines the number of never members included in the universe population, the number selected to survey, and the number of completed responses.

44
Table G3. Distribution of Sampled HIP 2.0 Never-members by Type
Survey Detail Total Number of Never-members
Total Number of Never- members
Selected into Sample
Target Number of Completed Responses
Actual Number of Completed Responses
Never-members
Conditionally approved but did not make POWER
account contribution in first month (income at or
above 100% FPL)
121 121
125
1
Completed Presumptive Eligibility (PE) process but
did not complete full application
5,190 5,190 50
TOTAL 5,311 5,3114 125 51
Provider survey sampling strategy
The goal of the Provider Survey was to obtain information from providers who treat HIP 2.0 members. The survey included questions about overall impressions of HIP, missed appointments, the presumptive eligibility process, and collection of copayments. The survey also gauged providers' knowledge of HIP 2.0 reimbursement rates and asked if it affected their decision to participate in HIP 2.0. Table G4 outlines the total number of providers and actual number of completed responses by provider type groupings used in the analysis.
Table G4. Distribution of Sampled HIP 2.0 Providers by Type
Survey Detail Total Number of Providers
Actual Number of Completed Responses
Provider
FQHC + RHC 42 (FQHCs) 24
Hospitals 848 45
Office-based 45,058 156
Total 45,948 225
The total number of providers represents the universe of providers (n=45,948) as of August 15, 2015, including federally qualified health centers (FQHCs), rural health centers (RHCs), hospitals, and physician practices in Indiana. Indiana sent Lewin a list of all providers in the state. A sample of the provider universe was selected (n=1,750), for whom data was sent to the provider survey firm, Bingle Research, for data collection. The sample selection criteria were restricted to providers whose addresses are in Indiana or surrounding states (i.e., Michigan, Ohio, Kentucky, 4 Although 5,311 never-members were selected into the sample, valid contact information was only available for 1,061
of these individuals.
45
and Illinois) and treated HIP 2.0 patients. We excluded the following provider types and related specialties:
Pediatrics Mental health School corporation Pharmacy DME/medical supply Transportation provider Dentist Laboratory First Step program Case management Hearing aid dealer Waiver provider Non-billing waiver case manager
Pediatric providers were excluded as HIP 2.0 covers only persons age 19 – 64. The other provider groups were excluded because they would be unlikely to be familiar with missed appointments or the availability of NEMT services. Providers eligible for inclusion into the surveyed sample included: (1) acute care hospitals, (2) psychiatric hospitals, (3) counseling and mental health centers, (4) rural health care centers (RHCs), (5) federally qualified heath centers (FQHCs), (6) local health departments, (7) solo/individual practices, (8) single-specialty practices, and (9) multi-specialty practices. Due to small numbers for some of the provider types, we did not end up sampling all of these provider types.
To increase participation and alert providers that a survey was going to be conducted, all of the providers received a letter from Joseph Moser, Medicaid Director of Indiana FSSA. A copy of the letter is in Appendix I.
Ultimately, 225 providers comprised the survey sample; 96.4 percent were located in Indiana, while a small sample (n=8) came from surrounding states. All FQHCs (n=42) were targeted to be in the sample, as the FQHC client mix favors Medicaid members, including HIP 2.0. Half of the FQHCs in Indiana were ultimately sampled. For the purpose of analysis, survey responses from FQHCs (n=21) and RHCs (n=3), are combined. The other 1,708 records were selected via simple random sample from the remaining pool of providers.
It should also be noted that Bingle Research interviewed primarily administrative5 and financial staff6 (88.0 percent), while clinicians7 and auxiliary clinical staff8 comprised approximately 5.3 percent and 6.7 percent, respectively. Survey questions were intended to be answered by those most familiar with the office environment and patient issues as a whole.
Respondents were asked in which field they practice and were classified as primary care providers if they responded “primary care,” “family practice,” or “OB/GYN.” All other providers 5 Includes office managers / practice administrators and administrative assistants 6 Includes financial and insurance staff 7 Includes physicians and nurses 8 Includes medical assistants, patient navigators, and community outreach staff

46
were classified as specialists. Bingle Research approximated a 2:1 ratio of primary care to specialty care providers.
Respondents were also asked to identify their practice setting as either: (1) solo/individual practice, (2) single-specialty group, (3) multi-specialty group, (4) hospital, (5) federally qualified health center or rural health center, or (6) other. Respondents were able to select more than one option. For analysis purposes, mutually exclusive categories of practice setting were created as follows: (1) FQHC/RHC, (2) hospital, and (3) office practice. The “hospital” category was comprised of all respondents who selected “hospital” as a response, even if they also selected another response option. Next, if a non-hospital provider said they were an FQHC, even if they also selected another response option, they were categorized as an FQHC. The remaining respondents who identified as an RHC, even if they also selected another response option, were classified as an RHC. All FQHCs and RHCs were combined into one category due to the small number of RHCs in the sample (n=3). Lastly, the “office practice” category was comprised of solo/individual practices (n=68), single-specialty groups (n=36), and multi-specialty groups (n=52).
Table G5 shows the distribution of completed survey responses by the provider settings outlined above. As noted in the sampling section, this survey was not designed to be conducted with a representative sample. Rather, the survey focused on provider groups, such as FQHCs, that disproportionately serve HIP and Medicaid members. The majority of respondents (69 percent) practiced in an office-based setting.
As mentioned above, respondents were also asked to identify if providers in their practice were: (1) primary care providers (inclusive of internal medicine and family practice), (2) OB/GYNs, (3) other specialists (specified in open responses), or (4) none of the above. Respondents were able to select more than one response because some worked at practices with more than one type of provider. Three mutually exclusive categories of providers were developed based upon responses: (1) primary care only, (2) specialty care only, and (3) primary care and specialty care. For the purpose of analysis, primary care providers and OB/GYNs were combined into one category. Please note that these designations only applied to respondents identified as office practices. Table H5 shows the distribution of type of care provided among office-based practices. The majority of respondents (56 percent) practiced in primary care.
Table G5. Provider Survey Respondents in Office-Based Practices, by Type of Care Provided
Type of Care Provided Number Proportion
Primary care 87 56%
Specialty care 48 31%
Both primary care and specialty care 21 13%
Total number of respondents 156 100% Table G6 shows the distribution of providers by region, with the majority of respondents practicing in the southern region of Indiana (26 percent). Provider regions were identified by the area code of the phone number used to contact the provider.

47
Table G6. Provider Survey Respondents, by Region
Region Number Proportion Northwest 39 17% North central 30 13% Northeast 28 12% Central 27 12% South 58 26% Indianapolis area 35 16% Neighboring states 8 4% Total number of respondents 225 100%
Member and provider survey protocol
The survey firms conducting both the member and provider surveys used computer-assisted telephone interviewing (CATI) to collect data. This telephone methodology provides for interviewer assistance with complicated skip patterns, unaided responses, and consistency in evaluation and limitations of sample bias. Additionally, it provides for expedient collection of the data, allows for better sample control, and can provide more in-depth and complete data than other types of data collection methodologies. Prior to starting the interviewing, a thorough briefing was conducted with all interview and supervisory personnel assigned to the project. During the briefing, interviewers conducted practice interviews and were monitored by supervisory staff.
CATI was used to set quotas for each category of HIP membership or provider type for the respective surveys. The survey firms then randomly identified participants in each of the categories. When the quota (i.e., total number of interviews) was reached in a category, no additional attempts to reach individuals were made in that category. The CATI system pulled a random selection from the sample for each quota group. Any phone numbers found inactive (i.e., instances where it would not be possible to call again) were flagged and were not included in additional contact attempts during the survey period. Inactive phone numbers include: disconnected numbers, wrong numbers, a response of “no such person lives here,” those who refused to start the survey, and those who started but were “qualified refusals.” Qualified refusals were those who stayed on the phone long enough to answer the qualifying questions, but refused or dropped off at some point and did not complete the survey. All “live” numbers such as those at which a busy signal or answering device was reached would be eligible to be called again until the quota for each membership category was filled.
To maximize response rate, calling took place between 9 am and 9 pm on weekdays, and 10 am to 9 pm on weekends for the member survey. Calling took place between 8 am and 5 pm on weekdays during business hours for the provider survey. Any individual who was interested in taking the survey, but who could not participate at the time he or she was initially reached, was given the option of a callback at a specific time. The CATI system would then initiate a call at the scheduled time. If the person was available, the interview would be conducted. If there was no answer, the number would be placed in the “live” category with the potential to be called back.

48
Appendix H. The Member and Leaver Survey Weighting Methodology
The Indiana HIP program evaluation sampling design is a two phase sampling design that can be treated as a stratified sample. The first phase was a sample of 11,000 members and a census of 1,956 leavers. For the members, the sample was stratified such that the number of claims in each plan and NEMT status was proportional to the universe frequencies. For the leavers, the sample was divided into those that left by disenrollment and those that left for other reasons. These combinations of plans and NEMT status define the strata for this design. In the second phase, sample was taken from each stratum. Since the sampling in the second phase was nested within each stratum, all members within each stratum had the same probability of being sampled, thus all members in each strata had the same final probability of both being selected in the first phase and second phase of the sample. As such, we can treat the sample as a one stage stratified design.
Sampling Weights
All members/leavers within a stratum were sampled with the same probability. Hence, all individuals in a given strata had the same raw sampling weights. Table H1 below shows the universe size, sample size and raw sampling weights for the seven strata (five member strata and two leaver strata).
Table H1. Raw Weights by Stratum
Description Total
Universe Members
Total Sample
Members Raw Weight
Regular Basic - NEMT 316 2 158.000 Regular Basic - No NEMT 29,220 86 339.767 Regular Plus - No NEMT 114,478 228 502.096 State Basic - NEMT 51,461 92 559.359 State Plus - NEMT 67,690 192 352.552 Leavers - Disenrolled 890 75 11.867 Leavers - Other 8,569 55 155.800
We should note that utilizing these sampling weights would be a very typical and acceptable approach for purposes of analysis. However, we recognize that the sample is quite small, which exposes the sample to a greater risk of being skewed on key characteristics that might be correlated with differing responses to topics addressed in the survey. As such, we identified three dimensions, or partitions, that the sample should be benchmarked to in order to make sure estimates are not skewed due to distribution of the raw sample. This benchmarking, commonly referred to calibration, modifies weights such that the calibrated weighted totals of a key dimension project to the known universe totals of that dimension. When calibrated weights are constructed such that these constraints are met, the sample is said to be balanced with respect to these dimensions.
Table H2 below shows the distribution of the universe as well as the distribution for the sample when using the raw sampling weights across the key dimensions of age, gender, and federal poverty level. We conducted t-tests to identify statistically significant differences between the
49
projected and universe distributions of age, gender, and FPL using the raw sampling weights. While significance appeared only a few times when using a multivariate adjusted (Bonferroni) 0.05 level of significance, the point estimates varied enough to warrant calibration to these dimensions.
Raking
The simplest, most straightforward approach to calibration would be to benchmark the sample to every level of age, gender, and FPL combination. However, given the small nature of the sample, clearly many of these calibration universe totals would have no corresponding sample to project to. A possible fix for this would be to subjectively collapse these groupings until the sample size permits for calibration, but as one can see from Table H2 and Table H3, such collapsing would likely obscure some of the sampling skew that can only be observed at the more granularly defined groupings of age and FPL. This is a common problem for calibration strategies, and the process of Raking was constructed for this very reason. Raking iteratively calibrates the sample to one dimension at a time, and continues this process until weights converge to a point where all desired dimensions project to the universe totals with a singular weight.
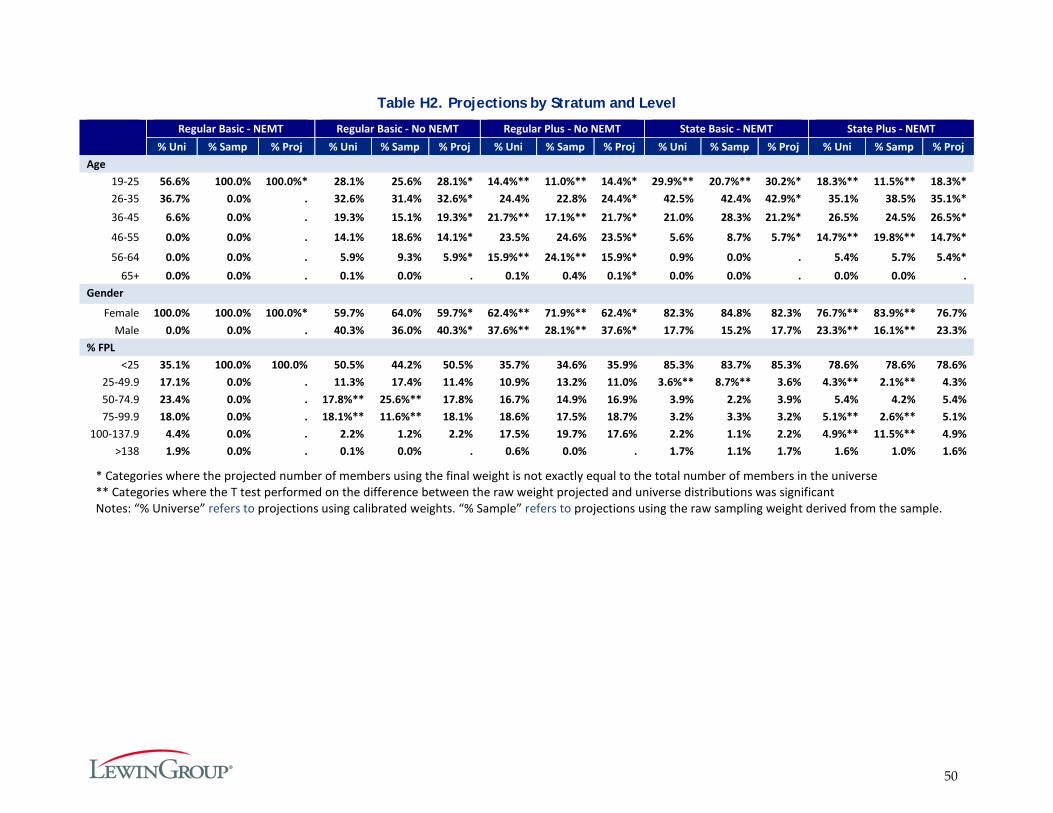
50
Table H2. Projections by Stratum and Level
Regular Basic - NEMT Regular Basic - No NEMT Regular Plus - No NEMT State Basic - NEMT State Plus - NEMT % Uni % Samp % Proj % Uni % Samp % Proj % Uni % Samp % Proj % Uni % Samp % Proj % Uni % Samp % Proj
Age 19-25 56.6% 100.0% 100.0%* 28.1% 25.6% 28.1%* 14.4%** 11.0%** 14.4%* 29.9%** 20.7%** 30.2%* 18.3%** 11.5%** 18.3%* 26-35 36.7% 0.0% . 32.6% 31.4% 32.6%* 24.4% 22.8% 24.4%* 42.5% 42.4% 42.9%* 35.1% 38.5% 35.1%* 36-45 6.6% 0.0% . 19.3% 15.1% 19.3%* 21.7%** 17.1%** 21.7%* 21.0% 28.3% 21.2%* 26.5% 24.5% 26.5%*
46-55 0.0% 0.0% . 14.1% 18.6% 14.1%* 23.5% 24.6% 23.5%* 5.6% 8.7% 5.7%* 14.7%** 19.8%** 14.7%*
56-64 0.0% 0.0% . 5.9% 9.3% 5.9%* 15.9%** 24.1%** 15.9%* 0.9% 0.0% . 5.4% 5.7% 5.4%* 65+ 0.0% 0.0% . 0.1% 0.0% . 0.1% 0.4% 0.1%* 0.0% 0.0% . 0.0% 0.0% .
Gender
Female 100.0% 100.0% 100.0%* 59.7% 64.0% 59.7%* 62.4%** 71.9%** 62.4%* 82.3% 84.8% 82.3% 76.7%** 83.9%** 76.7% Male 0.0% 0.0% . 40.3% 36.0% 40.3%* 37.6%** 28.1%** 37.6%* 17.7% 15.2% 17.7% 23.3%** 16.1%** 23.3%
% FPL <25 35.1% 100.0% 100.0% 50.5% 44.2% 50.5% 35.7% 34.6% 35.9% 85.3% 83.7% 85.3% 78.6% 78.6% 78.6%
25-49.9 17.1% 0.0% . 11.3% 17.4% 11.4% 10.9% 13.2% 11.0% 3.6%** 8.7%** 3.6% 4.3%** 2.1%** 4.3% 50-74.9 23.4% 0.0% . 17.8%** 25.6%** 17.8% 16.7% 14.9% 16.9% 3.9% 2.2% 3.9% 5.4% 4.2% 5.4% 75-99.9 18.0% 0.0% . 18.1%** 11.6%** 18.1% 18.6% 17.5% 18.7% 3.2% 3.3% 3.2% 5.1%** 2.6%** 5.1%
100-137.9 4.4% 0.0% . 2.2% 1.2% 2.2% 17.5% 19.7% 17.6% 2.2% 1.1% 2.2% 4.9%** 11.5%** 4.9% >138 1.9% 0.0% . 0.1% 0.0% . 0.6% 0.0% . 1.7% 1.1% 1.7% 1.6% 1.0% 1.6%
* Categories where the projected number of members using the final weight is not exactly equal to the total number of members in the universe ** Categories where the T test performed on the difference between the raw weight projected and universe distributions was significant Notes: “% Universe” refers to projections using calibrated weights. “% Sample” refers to projections using the raw sampling weight derived from the sample.
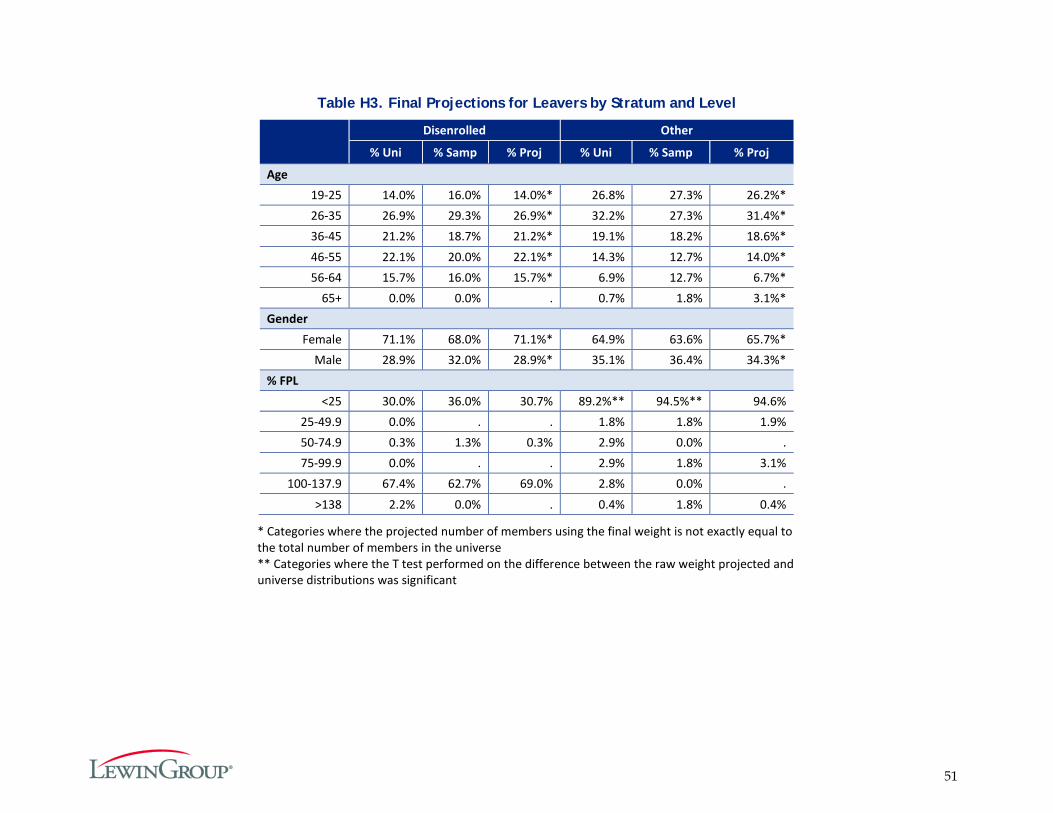
51
Table H3. Final Projections for Leavers by Stratum and Level
Disenrolled Other
% Uni % Samp % Proj % Uni % Samp % Proj
Age 19-25 14.0% 16.0% 14.0%* 26.8% 27.3% 26.2%* 26-35 26.9% 29.3% 26.9%* 32.2% 27.3% 31.4%* 36-45 21.2% 18.7% 21.2%* 19.1% 18.2% 18.6%* 46-55 22.1% 20.0% 22.1%* 14.3% 12.7% 14.0%* 56-64 15.7% 16.0% 15.7%* 6.9% 12.7% 6.7%*
65+ 0.0% 0.0% . 0.7% 1.8% 3.1%* Gender
Female 71.1% 68.0% 71.1%* 64.9% 63.6% 65.7%* Male 28.9% 32.0% 28.9%* 35.1% 36.4% 34.3%*
% FPL <25 30.0% 36.0% 30.7% 89.2%** 94.5%** 94.6%
25-49.9 0.0% . . 1.8% 1.8% 1.9% 50-74.9 0.3% 1.3% 0.3% 2.9% 0.0% . 75-99.9 0.0% . . 2.9% 1.8% 3.1%
100-137.9 67.4% 62.7% 69.0% 2.8% 0.0% . >138 2.2% 0.0% . 0.4% 1.8% 0.4%
* Categories where the projected number of members using the final weight is not exactly equal to the total number of members in the universe ** Categories where the T test performed on the difference between the raw weight projected and universe distributions was significant

52
Appendix I. Survey Notification Letters Sent to Members and Providers
Letter Sent to Members
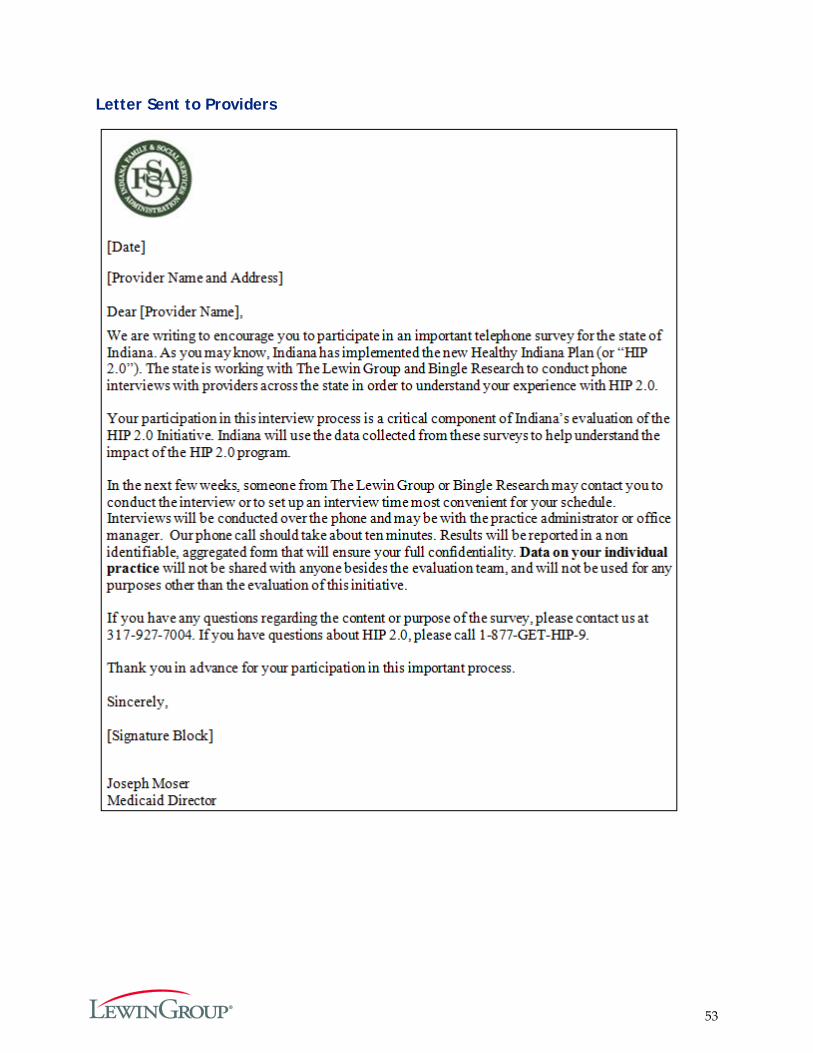
53
Letter Sent to Providers

54
Appendix J. Enrollment in State of Indiana Sponsored Healthcare Programs
Monthly enrollment data on the total number of Indiana residents enrolled in State Sponsored Healthcare Programs as of February 2016. This includes individuals enrolled in HIP, Hoosier Healthwise, Hoosier Care Connect and traditional Medicaid.
Figure K1. Enrollment in State of Indiana Healthcare Programs

55
Appendix K. Identification of Primary and Specialty Care Services
In order to effectively evaluate type of service outcomes for Indiana’s HIP benefits, Lewin had a need for consistent definitions for primary care and specialty care. For both, primary care and specialty care, a visit was identified using the combination of member and date of service. Visits were identified for both primary care and specialty care using claims that were paid and non-voided professional medical claims. Additional criteria were specific to primary care or specialty care.
For additional criteria specific to primary care, Lewin chose to use the national standard definition established by the Centers for Medicare & Medicaid Services (CMS) for Medicare claims processing for primary care claims under the Affordable Care Act as indicated in the CMS Manual System, Pub 100-04 Medicare Claims Processing, Transmittal 2161, Change Request 7060. CMS specifies a limited set of services eligible to be counted as primary care, based on evaluation and management (E&M) current procedural terminology (CPT) codes. CMS also specifies a set of providers to identify as delivering primary care; including, family practitioners, general practitioners, geriatric practitioners, internists, general internists, pediatricians, general pediatricians, pediatric nurse practitioners, family nurse practitioners, nurse practitioners (other), and physician assistants. Because of the nature of working with a Medicaid population, Lewin also included providers with specialties of obstetrics/gynecology, obstetric nurse practitioner, rural health clinic (RHC), and federally qualified health clinic (FQHC). Additionally, by definition primary care is not referral or specialty care, so claims with referring providers were excluded from consideration as primary care.
Specialty care was defined as services requiring a referral for medical services rendered by a physician in an office, clinic, or mental health setting. Allied health professionals (i.e. physical therapists, paramedics, etc.) were excluded, as were the primary care specialties indicated above. The claims had to have a referring provider or the provider had to be a psychiatrist in order to be counted as specialty care. This was consistent with the way specialty care benefits were administered to HIP recipients.
Indiana Healthy Indiana Plan 2.0: Appendices
Prepared for:
Indiana Family and Social Services Administration (FSSA)
Submitted by:
The Lewin Group, Inc.
July 6, 2016

i
Appendices Table of Contents
APPENDIX A. CURRENT BASIC MEMBER SURVEY (FULL) .......................................................... 1
APPENDIX B. CURRENT PLUS MEMBER SURVEY (FULL) ........................................................... 12
APPENDIX C. LEAVER SURVEY (FULL) ........................................................................................... 17
APPENDIX D. NEVER MEMBER SURVEY - PRESUMPTIVE ELIGIBILITY (PE) (FULL) ........... 23
APPENDIX E. NEVER MEMBER SURVEY - DID NOT MAKE PAC (FULL) ................................ 29
APPENDIX F. PROVIDER SURVEY (FULL) ....................................................................................... 35
APPENDIX G. SURVEY SAMPLING APPROACH ........................................................................... 41
APPENDIX H. THE MEMBER AND LEAVER SURVEY WEIGHTING METHODOLOGY ........ 48
APPENDIX I. SURVEY NOTIFICATION LETTERS SENT TO MEMBERS AND PROVIDERS .. 52
APPENDIX J. ENROLLMENT IN STATE OF INDIANA SPONSORED HEALTHCARE PROGRAMS ...................................................................................................................................... 54
APPENDIX K. IDENTIFICATION OF PRIMARY AND SPECIALTY CARE SERVICES ............. 55
1
Appendix A. Current Basic Member Survey (Full)
DESCRIPTION: This survey applies to individuals currently enrolled in in HIP BASIC, per eligibility data.
CONFIRM AWARENESS OF ENROLLMENT IN HIP BASIC
Q1. The State of Indiana runs an insurance program called the Healthy Indiana Plan (or
HIP) for Hoosiers age 19 to 64. Are you enrolled in the “Healthy Indiana Plan” or “HIP” at this time? � YES � NO � DON’T KNOW
Q1a. Are you in HIP Basic or HIP Plus?
� BASIC CONTINUE WITH THE SURVEY, GO TO Q2 � PLUS CONTINUE WITH THE SURVEY, GO TO Q2 � REFUSED GO TO Q1B � DON’T KNOW GO TO Q1B
Q1b. Based on the information we have, it looks like you are in HIP Basic and pay
copayments for services. Is this correct? � YES CONTINUE WITH THE SURVEY, GO TO Q2 � NO � DON’T KNOW
SATISFACTION WITH HIP
The next set of questions will ask about your satisfaction with the Healthy Indiana Plan.
Q2. Thinking about your overall experience with the Healthy Indiana Plan in the past six months, would you say you are: � VERY SATISFIED, � SOMEWHAT SATISFIED, � NEITHER SATISFIED NOR DISSATISFIED, � SOMEWHAT DISSATISFIED, OR � VERY DISSATISFIED? � DON’T KNOW � REFUSED
Q2a. Why are you (FILL IN WITH PREVIOUS RESPONSE)? OPEN-ENDED RESPONSE
� SPECIFY:
GO TO Q3
GO TO CLOSE
GO TO CLOSE
2
DO NOT READ LIST BELOW; USE FOR CODING PURPOSES � CAN’T SEE MY DOCTOR WITH HIP � DISSATISFACTION WITH CHOICE OF DOCTORS IN HIP � HIP DOES NOT COVER DENTAL � HIP DOES NOT COVER VISION/OPTICAL � HIP DOES NOT COVER PROCEDURE/ MEDICATION � MANY DOCTORS DO NOT ACCEPT HIP � DISSATISFIED WITH ADMINISTRATIVE ISSUE(S) OR PROCESS � DISSATISFACTION WITH A PAYMENT RELATED ISSUE � CAN’T AFFORD CO-PAY/ TOO HIGH � CO-PAYMENT / MONTHLY/ ANNUAL PAYMENT TOO HIGH � LIKE HAVING COVERAGE/ INSURANCE � LIKE DOCTORS/ HOSPITALS / HEALTH CARE PROVIDERS � LIKE PAYMENTS / PRICE � LIKE THE PLAN/ PROVIDER � LIKE SOME THINGS/ DISLIKE OTHER THINGS � SOME THINGS NOT COVERED � DON’T KNOW � REFUSED � OTHER REASON NOT LISTED ABOVE: (SPECIFY)
Q3. If you ever left HIP, would you try to reenroll if you became eligible for the program
again? � YES � NO � DON’T KNOW � REFUSED
FAST-TRACK PAYMENTS
Q4. When you applied for HIP, did you make a fast track payment?
(IF NEEDED: A fast track payment is made when you complete your application. Fast track payments allow you to get HIP coverage more quickly because you pre-pay your first payment. By making the fast track payment when you apply, it may take less time for your coverage to begin.)
� YES � NO GO TO Q4b � DON’T KNOW � REFUSED
Q4a. Why did you decide to sign-up for the fast track payment option?
� I WANTED MY COVERAGE AND/OR ELIGIBILITY TO BEGIN SOONER � I THOUGHT IT WAS A REQUIRED PART OF HIP � I THOUGHT IT WOULD BE EASIER TO PAY THEN (I.E., WOULDN’T HAVE TO MAIL/GO IN-
PERSON, ETC.) � I HAD THE FUNDS AT THE TIME I APPLIED � OTHER REASON NOT LISTED ABOVE: (SPECIFY)
_________________________________________________________________________ � DON’T KNOW � REFUSED
GO TO Q5
3
Q4b. Why did you decide NOT to sign-up for the fast track payment option? � I COULDN’T AFFORD TO MAKE THE PAYMENT � I WASN’T SURE IF I WOULD BE ELIGIBLE � I DIDN’T UNDERSTAND THE DIFFERENCE BETWEEN FAST TRACK AND THE REGULAR
PAYMENT OPTION � I DIDN’T NEED COVERAGE TO START SOONER � I WASN’T AWARE OF THE OPTION TO SIGN-UP FOR FAST TRACK AT THE TIME I
APPLIED � OTHER REASON NOT LISTED ABOVE: (SPECIFY)
____________________________________________ � DON’T KNOW � REFUSED
ACCESS
Q5. In the last 6 months, did you make any appointments for a check-up or routine care
at a doctor’s office or clinic? � YES GO TO NEXT QUESTION � NO SKIP NEXT QUESTION [Q6]
Q5a. In the last 6 months, how often did you get an appointment for a check-up or routine
care at a doctor’s office or clinic as soon as you needed? � NEVER � SOMETIMES � USUALLY � ALWAYS
Q6. Specialists are doctors like surgeons, heart doctors, allergy doctors, skin doctors,
and other doctors who specialize in one area of health care. In the last 6 months, did you make any appointments to see a specialist? � YES GO TO Q6A � NO GO TO Q7 � DON’T KNOW GO TO Q7
Q6a. In the last 6 months, how often did you get an appointment to see a specialist as
soon as you needed? � NEVER � SOMETIMES � USUALLY � ALWAYS
Q7. In the last 6 months, did you get any new prescription medicines or refill a
prescription? � YES GO TO Q7a � NO GO TO Q8

4
Q7a. In the last 6 months, how often was it easy to get your prescription medicine from your health plan? � NEVER � SOMETIMES � USUALLY � ALWAYS
Q8. In the past six months, have you missed any healthcare appointments, such as
doctor’s appointments? � YES GO TO 8a � NO � DON’T KNOW � REFUSED
Q8a. What are the reasons you missed an appointment? (ALLOW MULTIPLE RESPONSE
OPTIONS) � COST TOO MUCH � COULDN’T GET CHILDCARE � COULDN’T GET TIME OFF FROM WORK � COULDN’T GET THROUGH ON THE PHONE � COULDN’T SCHEDULE APPOINTMENT SOON ENOUGH � DIDN’T GET APPROVAL FROM PLAN � DIDN’T HAVE TIME � DIDN’T WANT TO GO � HOURS OF OPERATION WERE NOT CONVENIENT FOR ME � NO INSURANCE � PLACE DID NOT ACCEPT THE INSURANCE COVERAGE � TAKES TOO LONG TO GET THERE � TRANSPORTATION PROBLEM � TOO SICK TO GO � OTHER REASON, NOT LISTED ABOVE: (SPECIFY)
____________________________________________ Q8b. What is the most common reason you missed an appointment?
________________________________________________________ � (If respondent chooses more than one option for Q8a above.)
Q9. In the past six months, was there any time when you contacted a doctor’s office or
clinic, but couldn’t get an appointment soon enough so you went to the emergency room instead? � YES � NO � DON’T KNOW � REFUSED
GO TO Q9

5
Q10. When you need to get health care, what is the type of transportation you use most often to get to your visit? � I DRIVE MYSELF, USING MY OWN VEHICLE � SOMEONE ELSE (SUCH AS A FRIEND, NEIGHBOR, OR FAMILY) DRIVES ME, USING MY
OWN VEHICLE � SOMEONE ELSE (SUCH AS A FRIEND, NEIGHBOR, OR FAMILY) DRIVES ME, USING
THEIR VEHICLE � I TAKE A TAXI CAB/OR UBER � I TAKE THE BUS � OTHER: ______________________
AWARENESS
Q11. Have you heard of the Healthy Indiana Plan POWER account, which stands for
Personal Wellness and Responsibility Account? � YES � NO � DON’T KNOW � REFUSED
Q11a. How did you hear or learn about the POWER account? (MARK ALL THAT APPLY)
� MEMBER HANDBOOK � SOMEONE FROM THE PLAN CALLED AND EXPLAINED IT TO YOU � HIP WEBSITE � YOUR HEALTH PLAN � YOUR DOCTOR OR HEALTH CARE PROFESSIONAL � FAMILY/FRIENDS � NONE OF THESE � DON’T KNOW � REFUSED
Q12. Do you have a POWER account as part of your HIP Basic insurance?
� YES � NO � DON’T KNOW � REFUSED
Q12a. How often do you check the balance in your POWER account? Would you say … � WEEKLY � A FEW TIMES A MONTH � MONTHLY � A FEW TIMES A YEAR BUT NOT EVERY MONTH � ONCE A YEAR � NEVER � DON’T KNOW � REFUSED
GO TO Q13
GO TO Q13
6
Q13. If you were to get preventive services, such as a cancer screening, do you think the cost would be deducted from your POWER account, if you have enough money available in the account? � YES � NO � DON’T KNOW � REFUSED
Q14. Has your health plan given you a HIP POWER Account debit card? (IF NEEDED:
This is a card that can be used to spend the money in your POWER account.) � YES GO TO NEXT QUESTION � NO � DON’T KNOW � REFUSED
Q14a. How often do you present the card to a health care provider? Is it…
� EVERY TIME YOU GET CARE � SOME OF THE TIME � ONLY FOR SPECIFIC SERVICES � NEVER � DON’T KNOW � REFUSED
Q15. I’m going to read a couple of policies, please indicate whether you think the policy
is true or false. The first policy states: “If you get preventive services suggested by your plan every year and have money left in your POWER account, part of that money will be rolled over to your account for next year.” � TRUE � FALSE � DON’T KNOW � REFUSED
Q16. The second policy states: “If you get the preventive services suggested by your
plan and have money left over in your POWER account, this could result in lower payments in the next year.” � TRUE � FALSE � DON’T KNOW � REFUSED
GO TO Q15
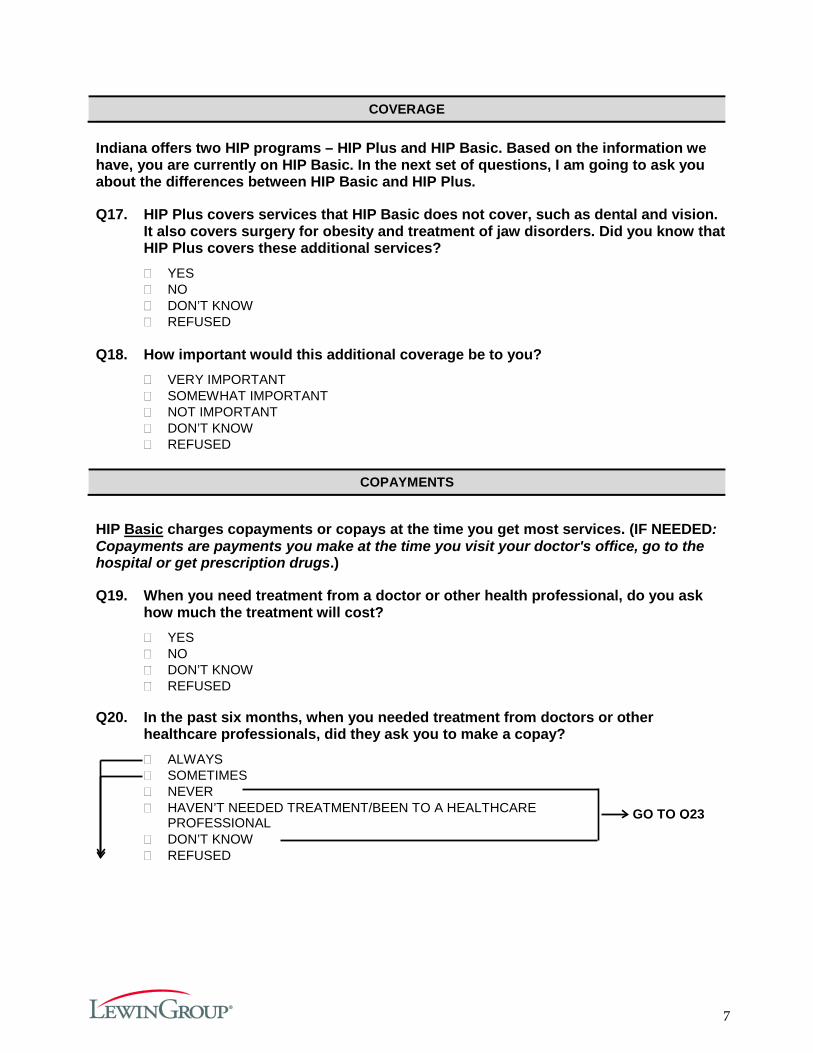
7
COVERAGE Indiana offers two HIP programs – HIP Plus and HIP Basic. Based on the information we have, you are currently on HIP Basic. In the next set of questions, I am going to ask you about the differences between HIP Basic and HIP Plus.
Q17. HIP Plus covers services that HIP Basic does not cover, such as dental and vision. It also covers surgery for obesity and treatment of jaw disorders. Did you know that HIP Plus covers these additional services? � YES � NO � DON’T KNOW � REFUSED
Q18. How important would this additional coverage be to you?
� VERY IMPORTANT � SOMEWHAT IMPORTANT � NOT IMPORTANT � DON’T KNOW � REFUSED
COPAYMENTS
HIP Basic charges copayments or copays at the time you get most services. (IF NEEDED: Copayments are payments you make at the time you visit your doctor's office, go to the hospital or get prescription drugs.)
Q19. When you need treatment from a doctor or other health professional, do you ask how much the treatment will cost? � YES � NO � DON’T KNOW � REFUSED
Q20. In the past six months, when you needed treatment from doctors or other
healthcare professionals, did they ask you to make a copay? � ALWAYS � SOMETIMES � NEVER � HAVEN’T NEEDED TREATMENT/BEEN TO A HEALTHCARE
PROFESSIONAL � DON’T KNOW � REFUSED
GO TO Q23

8
Q21. Did you make the copay at the time of service?
� ALWAYS GO TO Q22 � SOMETIMES GO TO Q22 � NEVER GO TO Q23 � DON’T KNOW GO TO Q23 � REFUSED GO TO Q23
Q22. Were the copays affordable?
� YES � NO � DON’T KNOW � REFUSED
Q23. In the past 6 months, how often were you worried about having enough money to
pay your copay? � ALWAYS � USUALLY � SOMETIMES � RARELY � NEVER � DON’T KNOW � REFUSED
Q24. Did you know that HIP Plus does not require you to pay copays, but does require
you to pay in advance for coverage through a monthly or annual payment? � YES � NO � DON’T KNOW � REFUSED
HIP 2.0 POLICIES
Q25. Do you prefer to pay copayments at the time of service, rather than paying in
advance for your coverage through a monthly or annual payment to your POWER account? (IF NEEDED: POWER account stands for Personal Wellness and Responsibility Account) � YES � NO � DON’T KNOW � REFUSED
Q26. Why? OPEN-ENDED RESPONSE
� SPECIFY:__________________________________________________________________
GO TO Q27
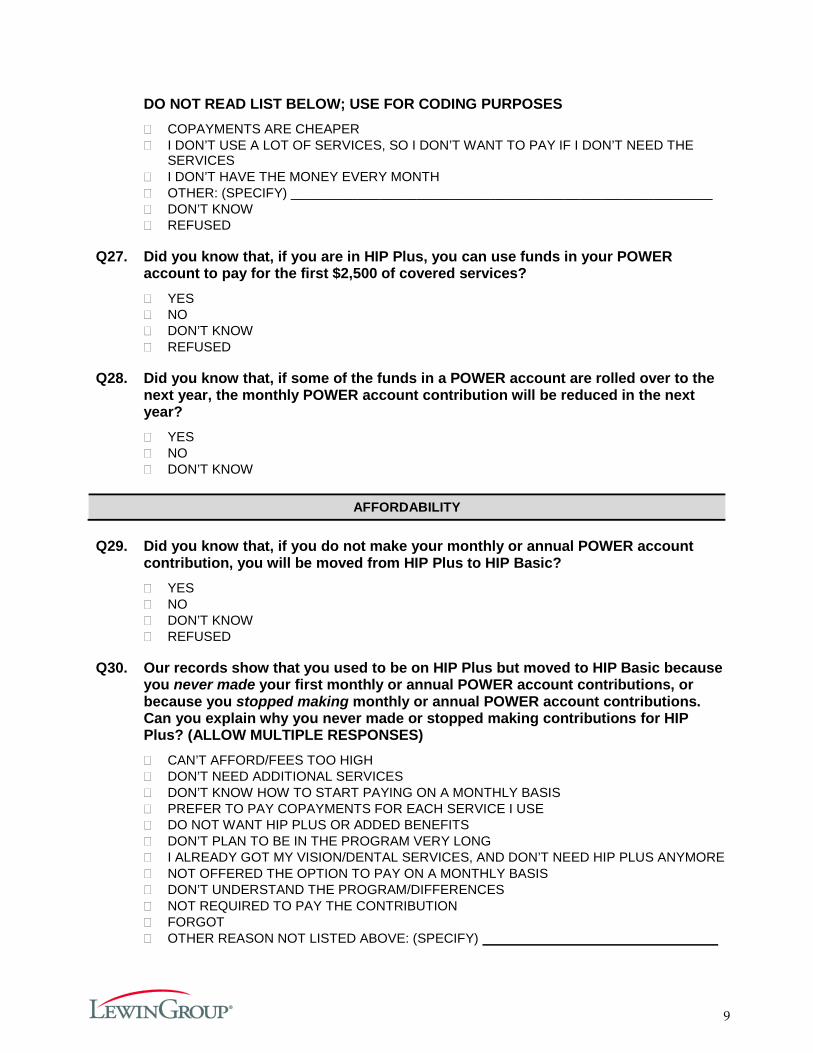
9
DO NOT READ LIST BELOW; USE FOR CODING PURPOSES � COPAYMENTS ARE CHEAPER � I DON’T USE A LOT OF SERVICES, SO I DON’T WANT TO PAY IF I DON’T NEED THE
SERVICES � I DON’T HAVE THE MONEY EVERY MONTH � OTHER: (SPECIFY) _________________________________________________________ � DON’T KNOW � REFUSED
Q27. Did you know that, if you are in HIP Plus, you can use funds in your POWER
account to pay for the first $2,500 of covered services? � YES � NO � DON’T KNOW � REFUSED
Q28. Did you know that, if some of the funds in a POWER account are rolled over to the
next year, the monthly POWER account contribution will be reduced in the next year? � YES � NO � DON’T KNOW
AFFORDABILITY
Q29. Did you know that, if you do not make your monthly or annual POWER account
contribution, you will be moved from HIP Plus to HIP Basic? � YES � NO � DON’T KNOW � REFUSED
Q30. Our records show that you used to be on HIP Plus but moved to HIP Basic because
you never made your first monthly or annual POWER account contributions, or because you stopped making monthly or annual POWER account contributions. Can you explain why you never made or stopped making contributions for HIP Plus? (ALLOW MULTIPLE RESPONSES) � CAN’T AFFORD/FEES TOO HIGH � DON’T NEED ADDITIONAL SERVICES � DON’T KNOW HOW TO START PAYING ON A MONTHLY BASIS � PREFER TO PAY COPAYMENTS FOR EACH SERVICE I USE � DO NOT WANT HIP PLUS OR ADDED BENEFITS � DON’T PLAN TO BE IN THE PROGRAM VERY LONG � I ALREADY GOT MY VISION/DENTAL SERVICES, AND DON’T NEED HIP PLUS ANYMORE � NOT OFFERED THE OPTION TO PAY ON A MONTHLY BASIS � DON’T UNDERSTAND THE PROGRAM/DIFFERENCES � NOT REQUIRED TO PAY THE CONTRIBUTION � FORGOT � OTHER REASON NOT LISTED ABOVE: (SPECIFY)

10
� DON’T KNOW � REFUSED
Q30a. Which of these reasons is the most important? Q31. The state checks your eligibility for HIP once a year. The next time the state checks
your eligibility, you can move from HIP Basic to HIP Plus if you make your monthly/annual contributions to your POWER account. Did you know this? � YES � NO � DON’T KNOW � REFUSED
Q32. Would you rather remain in HIP Basic or move to HIP Plus, knowing that they are
different? � REMAIN IN HIP BASIC � MOVE TO HIP PLUS � DON’T KNOW � REFUSED
Q32a. Why? OPEN-ENDED RESPONSE
� SPECIFY:_________________________________________________________________ Q33. If HIP required you to pay $5 each month, would you continue to stay enrolled?
� YES GO TO Q34 � NO GO TO Q35 � DON’T KNOW GO TO Q35 � REFUSED GO TO Q35
Q34. What about $10? Would you continue to stay enrolled if HIP required you to pay $10
each month? � YES � NO � DON’T KNOW � REFUSED
DEMOGRAPHICS
Q35. What is the highest grade or year of school you have completed? (READ ALL
OPTIONS) � GRADES 1 TO 8 (ELEMENTARY SCHOOL) � GRADES 9 TO 11 (SOME HIGH SCHOOL) � GRADE 12 OR GED (HIGH SCHOOL GRADUATE) � COLLEGE/TECHNICAL SCHOOL 1 - 3 YEARS (SOME COLLEGE OR ADDITIONAL TRAINING) � COLLEGE 4 YEARS OR MORE (COLLEGE GRADUATE) � NO FORMAL EDUCATION � DON’T KNOW
GO TO Q31
GO TO Q33
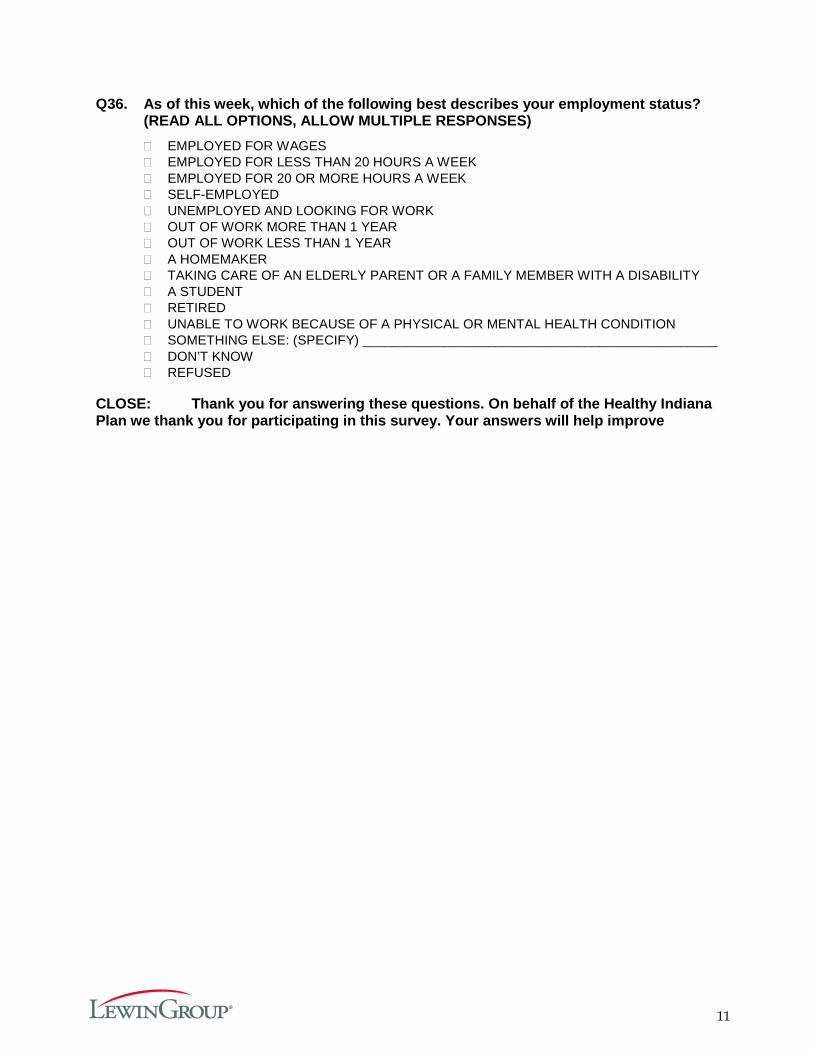
11
Q36. As of this week, which of the following best describes your employment status? (READ ALL OPTIONS, ALLOW MULTIPLE RESPONSES) � EMPLOYED FOR WAGES � EMPLOYED FOR LESS THAN 20 HOURS A WEEK � EMPLOYED FOR 20 OR MORE HOURS A WEEK � SELF-EMPLOYED � UNEMPLOYED AND LOOKING FOR WORK � OUT OF WORK MORE THAN 1 YEAR � OUT OF WORK LESS THAN 1 YEAR � A HOMEMAKER � TAKING CARE OF AN ELDERLY PARENT OR A FAMILY MEMBER WITH A DISABILITY � A STUDENT � RETIRED � UNABLE TO WORK BECAUSE OF A PHYSICAL OR MENTAL HEALTH CONDITION � SOMETHING ELSE: (SPECIFY) ________________________________________________ � DON’T KNOW � REFUSED
CLOSE: Thank you for answering these questions. On behalf of the Healthy Indiana Plan we thank you for participating in this survey. Your answers will help improve

12
Appendix B. Current Plus Member Survey (Full)
DESCRIPTION: This survey applies to individuals currently enrolled in in HIP PLUS, identified with eligibility data.
CONFIRM ENROLLMENT IN HIP PLUS Q1. The State of Indiana runs an insurance program called the Healthy Indiana Plan (or
HIP) for Hoosiers age 19 to 64. Are you enrolled in the “Healthy Indiana Plan” or “HIP” at this time? � YES � NO � DON’T KNOW
Q1a. Are you in HIP Basic or HIP Plus?
� BASIC CONTINUE WITH THE SURVEY, GO TO Q2 � PLUS CONTINUE WITH THE SURVEY, GO TO Q2 � DON’T KNOW � REFUSED
Q1b. Based on the information we have, it looks like you are in HIP Plus and make a
monthly or annual payment to maintain your coverage. Is this correct? � YES CONTINUE WITH THE SURVEY, GO TO Q2 � NO � DON’T KNOW
SATISFACTION WITH HIP
The next set of questions will ask about your satisfaction with the Healthy Indiana Plan.
Q2. Thinking about your overall experience with the Healthy Indiana Plan in the past six months, would you say you are: � VERY SATISFIED � SOMEWHAT SATISFIED � NEITHER SATISFIED NOR DISSATISFIED � SOMEWHAT DISSATISFIED � VERY DISSATISFIED � DON’T KNOW � REFUSED
Q2a. Why are you (FILL IN WITH PREVIOUS RESPONSE)? OPEN-ENDED RESPONSE
� SPECIFY: ___________________________
GO TO CLOSE
GO TO CLOSE
GO TO Q3

13
DO NOT READ LIST BELOW; USE FOR CODING PURPOSES. (CHECK ALL THAT APPLY) � CAN’T SEE MY DOCTOR WITH HIP � DISSATISFACTION WITH CHOICE OF DOCTOR’S IN HIP � HIP DOES NOT COVER DENTAL � HIP DOES NOT COVER VISION/OPTICAL � HIP DOES NOT COVER PROCEDURE/ MEDICATION � MANY DOCTORS DO NOT ACCEPT HIP � DISSATISFIED WITH ADMINISTRATIVE ISSUE(S) OR PROCESS � DISSATISFACTION WITH A PAYMENT RELATED ISSUE � CAN’T AFFORD CO-PAY/ TOO HIGH � CO-PAYMENT / MONTHLY/ ANNUAL PAYMENT TOO HIGH � LIKE HAVING COVERAGE/ INSURANCE � LIKE DOCTORS/ HOSPITALS / HEALTH CARE PROVIDERS � LIKE PAYMENTS / PRICE � LIKE THE PLAN/ PROVIDER � LIKE SOME THINGS/ DISLIKE OTHER THINGS � SOME THINGS NOT COVERED � DON’T KNOW � REFUSED � OTHER REASON NOT LISTED ABOVE: (SPECIFY) _________________________
Q3. If you ever left HIP, would you try to reenroll if you became eligible for the program
again? � YES � NO � DON’T KNOW � REFUSED
Q4. When you applied for HIP, did you make a fast track payment?
(IF NEEDED: A fast track payment is made when you complete your application. Fast track payments allow you to get HIP coverage more quickly because you pre-pay your first payment. By making the fast track payment when you apply, it may take less time for your coverage to begin.)
� YES � NO GO TO Q4b � DON’T KNOW � REFUSED
Q4a. Why did you decide to sign-up for the fast track payment option?
� I WANTED MY COVERAGE AND/OR ELIGIBILITY TO BEGIN SOONER � I THOUGHT IT WAS A REQUIRED PART OF HIP � I THOUGHT IT WOULD BE EASIER TO PAY THEN (I.E., WOULDN’T HAVE TO MAIL/GO IN-
PERSON, ETC.) � I HAD THE FUNDS AT THE TIME I APPLIED � OTHER REASON NOT LISTED ABOVE: (Specify) ______________________________ � DON’T KNOW � REFUSED
GO TO Q5
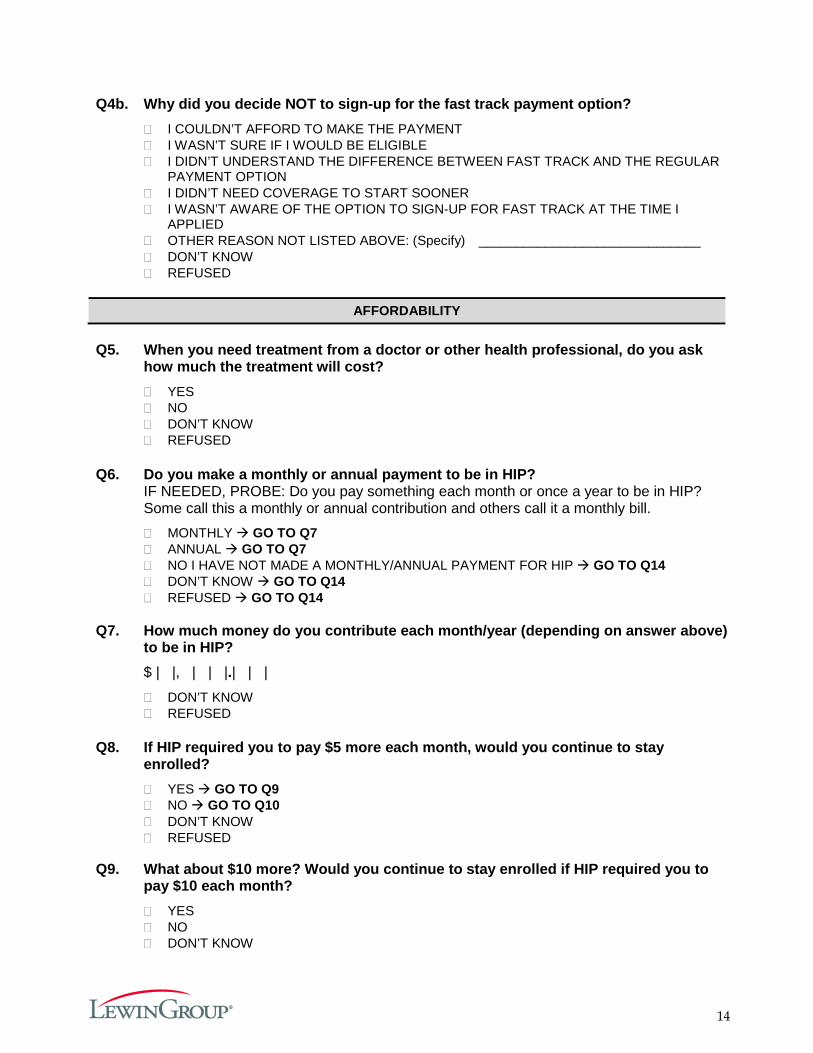
14
Q4b. Why did you decide NOT to sign-up for the fast track payment option? � I COULDN’T AFFORD TO MAKE THE PAYMENT � I WASN’T SURE IF I WOULD BE ELIGIBLE � I DIDN’T UNDERSTAND THE DIFFERENCE BETWEEN FAST TRACK AND THE REGULAR
PAYMENT OPTION � I DIDN’T NEED COVERAGE TO START SOONER � I WASN’T AWARE OF THE OPTION TO SIGN-UP FOR FAST TRACK AT THE TIME I
APPLIED � OTHER REASON NOT LISTED ABOVE: (Specify) ______________________________ � DON’T KNOW � REFUSED
AFFORDABILITY
Q5. When you need treatment from a doctor or other health professional, do you ask
how much the treatment will cost? � YES � NO � DON’T KNOW � REFUSED
Q6. Do you make a monthly or annual payment to be in HIP?
IF NEEDED, PROBE: Do you pay something each month or once a year to be in HIP? Some call this a monthly or annual contribution and others call it a monthly bill. � MONTHLY GO TO Q7 � ANNUAL GO TO Q7 � NO I HAVE NOT MADE A MONTHLY/ANNUAL PAYMENT FOR HIP GO TO Q14 � DON’T KNOW GO TO Q14 � REFUSED GO TO Q14
Q7. How much money do you contribute each month/year (depending on answer above)
to be in HIP? $ | |, | | |.| | |
� DON’T KNOW � REFUSED
Q8. If HIP required you to pay $5 more each month, would you continue to stay
enrolled? � YES GO TO Q9 � NO GO TO Q10 � DON’T KNOW � REFUSED
Q9. What about $10 more? Would you continue to stay enrolled if HIP required you to
pay $10 each month? � YES � NO � DON’T KNOW
15
� REFUSED Q10. In the past 6 months, how often were you worried about having enough money to
pay your monthly contribution? � ALWAYS � USUSALLY � SOMETIMES � RARELY � NEVER � DON’T KNOW � REFUSED
Q11. When you received your bill for your monthly or annual HIP payment, did you get
any help with the cost from someone else such as a family member, friend, employer, healthcare provider or charity? � YES GO TO Q12 � NO � DON’T KNOW � REFUSED
Q12. Please tell me yes or no if you received help in making the payments from each of
these sources: � FAMILY MEMBER � FRIEND � CHARITY OR RELIGIOUS ORGANIZATION � A HEALTHCARE PROVIDER SUCH AS A DOCTOR’S OFFICE OR HOSPITAL � EMPLOYER � OTHER: (SPECIFY) ______________________________
Q13. Please tell me if you have used each of the following methods to make your
payment: � CASH � CHECK � CREDIT CARD � DEBIT CARD � OTHER: (SPECIFY) ______________________________ � DON’T KNOW � REFUSED
ACCESS
Q14. In the last 6 months, did you make any appointments for a check-up or routine care
at a doctor’s office or clinic? � YES GO TO NEXT QUESTION � NO SKIP NEXT QUESTION [Q15] � DON’T KNOW GO TO Q15
GO TO Q13

16
Q14a. In the last 6 months, how often did you get an appointment for a check-up or routine care at a doctor’s office or clinic as soon as you needed? � NEVER � SOMETIMES � USUALLY � ALWAYS
Q15. Specialists are doctors like surgeons, heart doctors, allergy doctors, skin doctors,
and other doctors who specialize in one area of health care. In the last 6 months, did you make any appointments to see a specialist? � YES GO TO NEXT QUESTION � NO GO TO Q16 � DON’T KNOW GO TO Q16
Q15a. In the last 6 months, how often did you get an appointment to see a specialist as
soon as you needed? � NEVER � SOMETIMES � USUALLY � ALWAYS
Q16. In the last 6 months, did you get any new prescription medicines or refill a
prescription? � YES GO TO NEXT QUESTION � NO GO TO Q17 � DON’T KNOW GO TO Q17
Q16a. In the last 6 months, how often was it easy to get your prescription medicine from
your health plan? � NEVER � SOMETIMES � USUALLY � ALWAYS
Q17. In the past six months, have you missed any healthcare appointments, such as
doctor’s appointments? � YES � NO � DON’T KNOW � REFUSED
GO TO Q18
17
Appendix C. Leaver Survey (Full)
DESCRIPTION: This survey applies to individuals who:
• Were members but left the program for any reason (e.g., moved out of state, received coverage through Medicare)
• Were members with income over 100% FPL who left the program for non-payment of the POWER account contribution
Q1. Think about the new HIP insurance program that started in February 2015. Were you enrolled in HIP insurance earlier this year, in 2015? (NOTE: CLARIFY ONLY 2015) � YES (CONTINUE) � NO � DON’T KNOW
Q2. Just to confirm . . . you are not currently enrolled in HIP at this time. Is that correct?
� YES � NO – CURRENTLY ENROLLED � DON’T KNOW
WHY ENROLLMENT ENDED Q3. What are all the reasons you are no longer enrolled with HIP?
(ACCEPT MULTIPLE RESPONSES, USE LIST FOR CODING)
� I EARNED TOO MUCH/INCREASE IN MY INCOME � I DIDN’T FINISH MY PAPERWORK IN TIME � DIDN’T KNOW HOW TO MAKE A MONTHLY PAYMENT � I COULDN’T PAY MY MONTHLY CONTRIBUTION � I HAD OTHER INSURANCE AVAILABLE TO ME � I BECAME PREGNANT WHILE ON HIP � THEY CHANGED ME TO REGULAR MEDICAID � I DON’T KNOW WHY THEY TERMINATED MY COVERAGE � PAYMENT ERROR/MISUNDERSTANDING/CHECKING ACCOUNT PROBLEM/
LOST PAYMENT � LATE OR FORGOTTEN MONTHLY PAYMENT � EMPLOYER ERROR RELATED TO PAPERWORK � GOT MEDICARE � TRIED TO RE-ENROLL BUT STAFF COULDN’T HELP ME/SYSTEM FAILED/
IT DIDN’T WORK OUT � TRIED TO RE-ENROLL BUT THEY DIDN’T GET MY PAPERWORK DONE IN TIME � MOVED / NO LONGER LIVING IN INDIANA � INCARCERATED � PROBLEMS WITH APPEALS PROCESS � HIP PAPERWORK ERROR/MEMBER NEVER RECEIVED PAPERWORK/MEMBER � SENT PAPERWORK BUT HIP NEVER RECEIVED � CHANGED MY MIND / DON’T WANT COVERAGE � OTHER (SPECIFY) ________________________________ � DON’T KNOW � REFUSED
GO TO CLOSE 1
GO TO CLOSE 1
GO TO Q3
18
Q4. Which reason for leaving HIP was the most important? ____________________ (ASK ONLY IF RESPONDENT PROVIDED MULTIPLE REASONS FOR LEAVING HIP; IF NEEDED RE-READ RESPONDENT’S SELECTIONS FROM ABOVE)
Q5. Did you make a monthly or annual payment when you were in HIP?
(ASK ONLY IF FILE SHOWS RESPONDENT USED TO BE IN HIP PLUS) � DID NOT MAKE A MONTHLY OR ANNUAL PAYMENT GO TO Q8 � MONTHLY � ANNUAL � REFUSED � DON’T KNOW
Q6. Would you say the amount you contributed each month/year was:
(ASK ONLY OF RESPONDENTS WITH DATA FILE ENTRY FOR HIP PLUS)
� WAY TOO MUCH � A LITTLE TOO MUCH � THE RIGHT AMOUNT � BELOW THE RIGHT AMOUNT � WAY BELOW THE RIGHT AMOUNT � NEVER MADE A PAYMENT � DON’T KNOW � REFUSED
Q7. When you were enrolled in HIP, how often were you worried about having enough
money to pay your monthly contribution? (ASK ONLY OF RESPONDENTS WITH DATA FILE ENTRY FOR HIP PLUS) � ALWAYS � USUALLY � SOMETIMES � RARELY � NEVER � NEVER MADE A PAYMENT � DON’T KNOW � REFUSED
Q8. Did you make copayments when you were in HIP? (ASK ONLY IF FILE SHOWS RESPONDENT USED TO BE IN HIP BASIC) � YES GO TO Q9 � NO � DON’T KNOW � REFUSED
Q9. Would you say your copayments were:
(ASK ONLY OF RESPONDENTS WITH DATA FILE ENTRY FOR HIP BASIC) � WAY TOO MUCH � A LITTLE TOO MUCH � THE RIGHT AMOUNT � BELOW THE RIGHT AMOUNT � WAY BELOW THE RIGHT AMOUNT
GO TO Q6
GO TO Q8
GO TO Q10
19
� NEVER MADE A PAYMENT � DON’T KNOW � REFUSED
Q10. Are you aware that, in HIP, if you do not make monthly or annual payments you can
be terminated from the program and not allowed to return for six months? (ASK ONLY OF RESPONDENTS WITH DATA FILE ENTRY FOR FPL ABOVE 100%) � YES � NO � DON’T KNOW � REFUSED
Q11. Do you have any health insurance coverage right now? � YES GO TO Q13 � NO � DON’T KNOW � REFUSED
Q12. So you are not insured right now, is that correct?
� YES � NO � DON’T KNOW � REFUSED
INDIVIDUALS WITH OTHER COVERAGE
Q13. What is your source of insurance coverage?
(ASK ONLY IF YES TO QUESTION 11 ABOUT CURRENTLY HAVING INSURANCE COVERAGE. ACCEPT MULTIPLE RESPONSES)
� A SPOUSE IF EMPLOYER BOX IS CHECKED, GO TO Q14 � AN EMPLOYER IF EMPLOYER BOX IS CHECKED, GO TO Q14 � MEDICARE � MEDICAID OR HOOSIER HEALTHWISE, OR HOOSIER CARE CONNECT � TRICARE � VETERAN’S ADMINISTRATION � AN INDIVIDUAL POLICY � MARKETPLACE OR TAX CREDIT � SOME OTHER SOURCE (SPECIFY) __________________ � DON’T KNOW � REFUSED
INDIVIDUALS WITH EMPLOYER COVERAGE
Q14. Do you or your spouse/partner have to pay a portion of the insurance that you get
from your employer? (ASK ONLY IF ANSWER TO QUESTION 13 IS “AN EMPLOYER”)
� YES � NO
GO TO Q12
GO TO Q18
GO TO Q18 CHANGE RESPONSE TO Q11, GO TO Q13

20
� DON’T KNOW � REFUSED
Q15. In comparison to your previous HIP payments, would you say the amount you
contribute to your employer-sponsored coverage each month is… (ASK ONLY IF ANSWER TO QUESTION 13 IS “AN EMPLOYER” AND Q11 IS “YES – HAS INSURANCE”)
� WAY TOO MUCH � A LITTLE TOO MUCH � THE RIGHT AMOUNT � BELOW THE RIGHT AMOUNT � WAY BELOW THE RIGHT AMOUNT � DON’T KNOW � REFUSED
Q16. When you make your monthly or annual payment to your employer this year, will
you get any help with the cost from someone else such as a family member, friend, healthcare provider or charity? (ASK ONLY IF ANSWER TO QUESTION 13 IS “AN EMPLOYER” AND Q11 IS “YES – HAS INSURANCE”)
� YES � NO � DON’T KNOW � REFUSED
Q17. If HIP could help you pay for your employer-sponsored insurance, would you sign
up for that type of help? (ASK ONLY IF ANSWER TO QUESTION 13 IS “AN EMPLOYER” AND Q11 IS “YES – HAS INSURANCE”)
� YES � NO � DON’T KNOW � REFUSED
ACCESS TO CARE
Q18. Since you left HIP, did you make any appointments for a check-up or routine care at
a doctor’s office or clinic? � YES GO TO NEXT QUESTION � NO GO TO Q20 � DON’T KNOW GO TO Q20 � REFUSED GO TO Q20
Q19. Since you left HIP, how often did you get an appointment for a check-up or routine
care at a doctor’s office or clinic as soon as you needed? � NEVER � SOMETIMES � USUALLY � ALWAYS

21
Q20. Specialists are doctors like surgeons, heart doctors, allergy doctors, skin doctors, and other doctors who specialize in one area of health care. Since you left HIP, did you make any appointments to see a specialist? � YES GO TO NEXT QUESTION � NO GO TO Q22 � DON’T KNOW GO TO Q22 � REFUSED GO TO Q22
Q21. Since you left HIP, how often did you get an appointment to see a specialist as soon
as you needed? � NEVER � SOMETIMES � USUALLY � ALWAYS
Q22. Since you left HIP, did you get any new prescription medicines or refill a
prescription? � YES GO TO NEXT QUESTION � NO GO TO Q24 � DON’T KNOW GO TO Q24 � REFUSED GO TO Q24
Q23. Since you left HIP, how often did you get the prescription medicine you needed?
� NEVER � SOMETIMES � USUALLY � ALWAYS
DEMOGRAPHICS
Q24. What is the highest grade or year of school you have completed? (READ ALL
OPTIONS) � GRADES 1 TO 8 (ELEMENTARY SCHOOL) � GRADES 9 TO 11 (SOME HIGH SCHOOL) � GRADE 12 OR GED (HIGH SCHOOL GRADUATE) � COLLEGE / TECHNICAL SCHOOL 1 TO 3 YEARS (SOME COLLEGE OR ADDITIONAL
TRAINING) � COLLEGE 4 YEARS OR MORE (COLLEGE GRADUATE) � NO FORMAL EDUCATION � DON’T KNOW
Q25. As of this week which of the following best describes your employment status?
(READ ALL OPTIONS, ALLOW MULTIPLE RESPONSES) � EMPLOYED FOR WAGES � EMPLOYED FOR LESS THAN 20 HOURS A WEEK � EMPLOYED FOR 20 OR MORE HOURS A WEEK � SELF-EMPLOYED � UNEMPLOYED AND LOOKING FOR WORK � OUT OF WORK MORE THAN 1 YEAR

22
� OUT OF WORK LESS THAN 1 YEAR � A HOMEMAKER � TAKING CARE OF AN ELDERLY PARENT OR A FAMILY MEMBER WITH A DISABILITY � A STUDENT � RETIRED � UNABLE TO WORK BECAUSE OF A PHYSICAL OR MENTAL HEALTH CONDITION � SOMETHING ELSE (SPECIFY) _______________________________________________ � DON’T KNOW � REFUSED
CLOSE1 Thank you for answering these questions. This survey is meant to be completed by people who are not currently enrolled in the Healthy Indiana Plan or who have left the plan within the past year. If you have any questions about the plan, please call 1-877-438-4479. Thank you and have a good (day/night).
INTERVIEWER: HANG UP. CODE CASE AS INELIGIBLE—DOES NOT MEET SURVEY CRITERIA
CLOSE: Thank you for answering these questions. On behalf of the Healthy Indiana Plan we thank you for participating in this survey. Your answers will help improve the program.

23
Appendix D. Never Member Survey - Presumptive Eligibility (PE) (Full)
DESCRIPTION: This survey applies to individuals NOT currently enrolled in in HIP who were determined eligible for Presumptive Eligibility (PE) but did not complete an application to obtain full coverage. Individuals in this population were identified using eligibility data.
CONFIRM NEVER MEMBER STATUS Q1. In February 2015 the state introduced an updated version of a Medicaid insurance
program called HIP 2.0, sometimes called the “Healthy Indiana Plan.” Prior to this phone call today, had you ever heard about this program before?
� YES � NO � DON’T KNOW
Q1a. Where did you hear or learn about HIP?
� WEBSITE � FRIEND OR FAMILY � HEALTHCARE PROFESSIONAL / DOCTOR’S OFFICE / HOSPITAL, ETC. � TV � NEWSPAPER � RADIO � BILLBOARDS OR SIGNS � SIGNS ON BUSES � MAIL � HAVE IT AS MY INSURANCE � SOME OTHER PLACE (SPECIFY) � DON’T KNOW � REFUSED
Q2. Do you have any HIP coverage right now?
� YES CLOSE � NO � DON’T KNOW � REFUSED
Q3. Do you have any health insurance coverage right now?
� YES � NO � DON’T KNOW � REFUSED
Q3a. What type of coverage do you have now?
(Select all that apply)
� HIP GO TO CLOSE � A SPOUSE � AN EMPLOYER � MEDICARE
GO TO Q3
GO TO Q4

24
� MEDICAID/HOOSIER HEALTHWISE � TRICARE � VETERAN’S ADMINISTRATION � AN INDIVIDUAL POLICY � MARKETPLACE � OTHER (SPECIFY)
PRESUMPTIVE ELIGIBILITY
Q4. At any point in this year did you have temporary Medicaid coverage through
presumptive eligibility? (IF NEEDED: To receive this type of coverage, someone at a health care providers’ office or hospital would have helped you apply for temporary coverage) � YES � NO � DON’T KNOW � REFUSED
Q5. Next, I’m going to read a list of places where someone could have helped you apply
for temporary Medicaid coverage. Please tell me which one of these was the location where someone helped you apply for temporary Medicaid coverage. � A HOSPITAL � PSYCHIATRIC HOSPITAL � COMMUNITY MENTAL HEALTH CENTER � LOCAL HEALTH DEPARTMENT � A PROVIDER TREATING YOU BECAUSE YOU WERE PREGNANT � SOME OTHER PLACE (SPECIFY) � DON’T KNOW � REFUSED
Q6. That coverage was temporary. To keep it, you had to fill out a longer application by
phone, online or in-person. Did you complete an application and obtain full Medicaid coverage after receiving temporary coverage? � YES GO TO Q8 � NO � DON’T KNOW � REFUSED
Q7. What are the reasons you didn’t complete the full application or obtain full coverage?
� SENT APPLICATION BUT WAS TOLD THAT IT WAS INCOMPLETE � DIDN’T KNOW OR FORGOT THAT I NEEDED TO COMPLETE AN APPLICATION � DIDN’T KNOW HOW TO APPLY OR SUBMIT AN APPLICATION � CHANGED MY MIND ABOUT WANTING HIP COVERAGE � GOT OTHER INSURANCE � DIDN’T WANT COVERAGE � PREFER TO PAY FOR MEDICAL COVERAGE WITHOUT INSURANCE � DID SUBMIT APPLICATION, BUT FOUND INELIGIBLE
GO TO Q8
GO TO Q10
25
� OTHER (SPECIFY) � DON’T KNOW � REFUSED
Q8. Did the hospital, health center, doctor or health department that helped you sign up
for temporary coverage follow up to remind you to submit a full application? � YES � NO � DON’T KNOW � REFUSED
Q9. When Temporary Medicaid was set for you, you were enrolled in a health plan to
manage your benefits. Did the health plan that you were assigned to for temporary coverage follow up to remind you to submit a full application? (IF NEEDED: By health plan, I mean the company such as Anthem, MDwise, or MHS.) � YES � NO � DON’T KNOW � REFUSED
FUTURE HIP COVERAGE
Q10. Do you plan to apply for health coverage assistance through Medicaid or HIP in the
future? (IF NEEDED: “HIP is Healthy Indiana Plan” – a health insurance program for uninsured Hoosiers that provides coverage for Hoosiers ages 19 to 64.) � YES GO TO Q12 � NO � DON’T KNOW � REFUSED
Q11. Why do you not plan to apply for Medicaid or HIP in the future?
� DON’T KNOW WHERE TO GET APPLICATION � DON’T KNOW WHERE TO SUBMIT AN APPLICATION:
o DON’T KNOW WHAT OFFICE TO GO TO o DON’T HAVE INTERNET ACCESS o DON’T KNOW I CAN APPLY BY PHONE
� DON'T NEED IT, HEALTHY � DON'T WANT PUBLIC ASSISTANCE � DIDN’T KNOW ABOUT IT � DON’T UNDERSTAND IT � NOT SURE ABOUT ELIGIBILITY / NOT ELIGIBLE � CAN’T AFFORD PAYMENTS � HAVE ACCESS TO OTHER INSURANCE � ALREADY INSURED � PAY FOR MEDICAL COVERAGE WITHOUT INSURANCE � JUST GO TO THE EMERGENCY ROOM � JUST MOVED HERE � GOING TO MOVE AWAY � OTHER (SPECIFY)
GO TO Q12
FUTURE HIP COVERAGE
26
� DON’T KNOW � REFUSED
Q12. Some people make a monthly contribution to be in HIP. If HIP required you to pay $5
each month to be enrolled, would you enroll? � YES � NO GO TO Q14 � DON’T KNOW GO TO Q14 � REFUSED GO TO Q14
Q13. What about $10? Would you enroll if HIP required you to pay $10 each month?
� YES � NO � DON’T KNOW � REFUSED
ACCESS (CAHPS QUESTIONS)
Q14. In the last 6 months, did you make any appointments for a check-up or routine care
at a doctor’s office or clinic? � YES GO TO NEXT QUESTION � NO SKIP NEXT QUESTION [Q16]
Q15. In the last 6 months, how often did you get an appointment for a check-up or routine
care at a doctor’s office or clinic as soon as you needed? � NEVER � SOMETIMES � USUALLY � ALWAYS
Q16. Specialists are doctors like surgeons, heart doctors, allergy doctors, skin doctors,
and other doctors who specialize in one area of health care. In the last 6 months, did you make any appointments to see a specialist? � YES GO TO Q17 � NO GO TO Q18 � DON’T KNOW GO TO Q18 � REFUSED GO TO Q18
Q17. In the last 6 months, how often did you get an appointment to see a specialist as
soon as you needed? � NEVER � SOMETIMES � USUALLY � ALWAYS
Q18. In the last 6 months, did you get any new prescription medicines or refill a
prescription?
27
� YES GO TO Q19 � NO GO TO Q20
Q19. In the last 6 months, how often was it easy to get your prescription medicine from
your health plan? � NEVER � SOMETIMES � USUALLY � ALWAYS
DEMOGRAPHICS
Q20. Including yourself, how many total people (adults and children) are in your
household? � 1 � 2 � 3 � 4 � 5 � 6 � 7 � 8 � MORE THAN 8 � DON’T KNOW � REFUSED
Q21. Please stop me when I read the amount that best describes your family’s monthly
household income. Would that be . . . . � LESS THAN $1,000 � MORE THAN $1,000 UP TO $1,400 � BETWEEN $1,400 AND $1,700, � BETWEEN $1,700 AND $2,000 � BETWEEN $2,000 AND $2,300 � BETWEEN $2,300 AND $2,700 � BETWEEN $2,700 AND $3,000 � BETWEEN $3,000 AND $3,400 � MORE THAN $3,400 PER MONTH � DON’T KNOW � REFUSED
Q21. What is the highest grade or year of school you have completed? (READ ALL OPTIONS)
� GRADES 1 TO 8 (ELEMENTARY SCHOOL) � GRADES 9 TO 11 (SOME HIGH SCHOOL) � GRADE 12 OR GED (HIGH SCHOOL GRADUATE) � COLLEGE / TECHNICAL SCHOOL 1 TO 3 YEARS (SOME COLLEGE OR ADDITIONAL
TRAINING) � COLLEGE 4 YEARS OR MORE (COLLEGE GRADUATE) � NO FORMAL EDUCATION � DON’T KNOW

28
Q22. As of this week, which of the following best describes your employment status (READ ALL OPTIONS, ALLOW MULTIPLE RESPONSES)? � EMPLOYED FOR LESS THAN 20 HOURS A WEEK � EMPLOYED FOR 20 OR MORE HOURS A WEEK IN A SINGLE JOB � EMPLOYED FOR 20 OR MORE HOURS A WEEK IN MULTIPLE JOBS � SELF-EMPLOYED � UNEMPLOYED AND LOOKING FOR WORK � NOT ABLE TO WORK � FULLTIME HOMEMAKER � TAKING CARE OF ELDERLY OR DISABLED FAMILY MEMBER � RETIRED � SOMETHING ELSE (SPECIFY) � DON’T KNOW � REFUSED
CLOSE: Thank you for answering these questions. On behalf of the Healthy Indiana Plan we thank you for participating in this survey. Your answers will help improve the program.
29
Appendix E. Never Member Survey - Did Not Make PAC (Full)
DESCRIPTION: This survey applies to individuals NOT currently enrolled in HIP who applied for HIP coverage but did not make their first Power Account payment/contribution (PAC) and are over 100% of the FPL. Individuals in this population were identified using eligibility data.
CONFIRM NEVER MEMBER STATUS Q1. In February 2015 the state introduced an updated version of a Medicaid insurance
program called HIP 2.0, sometimes called the “Healthy Indiana Plan.” Prior to this phone call today, had you ever heard about this program before? � YES � NO � DON’T KNOW
Q1a. Where did you hear or learn about HIP?
� WEBSITE � FRIEND OR FAMILY � HEALTHCARE PROFESSIONAL / DOCTOR’S OFFICE / HOSPITAL, ETC. � TV � NEWSPAPER � RADIO � BILLBOARDS OR SIGNS � SIGNS ON BUSES � MAIL � HAVE IT AS MY INSURANCE � SOME OTHER PLACE (SPECIFY) � DON’T KNOW � REFUSED
Q2. Do you have any HIP coverage right now?
� YES CLOSE � NO � DON’T KNOW � REFUSED
Q3. Do you have any health insurance coverage right now?
� YES � NO � DON’T KNOW � REFUSED
Q3a. What type of coverage do you have now?
(Select all that apply) � HIP GO TO CLOSE � A SPOUSE � AN EMPLOYER � MEDICARE
GO TO Q2
GO TO Q4

30
� MEDICAID/HOOSIER HEALTHWISE � TRICARE � VETERAN’S ADMINISTRATION � AN INDIVIDUAL POLICY � MARKETPLACE � OTHER (SPECIFY)
NON-PAYMENT OF PAC
Q4. Did you ever complete an application for HIP?
� YES � NO CONTINUE TO Q7 � DON’T KNOW � REFUSED
Q5. Once you complete an application for HIP, you are required to make a payment
before your coverage starts. Were you aware of this prior to this call? � YES � NO � DON’T KNOW � REFUSED
Q6. Did you make your first HIP payment?
� YES GO TO CLOSE � NO � DON’T KNOW � REFUSED
Q6a. What is the main reason you did not make your first payment?
� CAN’T AFFORD/FEES TOO HIGH � CHANGED MY MIND ABOUT WANTING HIP COVERAGE � GOT OTHER INSURANCE � DON’T NEED ADDITIONAL SERVICES � DON’T KNOW HOW TO START PAYING ON A MONTHLY BASIS � DO NOT WANT HIP PLUS OR ADDED BENEFITS � DON’T PLAN TO BE IN THE PROGRAM VERY LONG � NOT OFFERED THE OPTION TO PAY ON A MONTHLY BASIS � DON’T UNDERSTAND THE PROGRAM/DIFFERENCES � NOT REQUIRED TO PAY THE CONTRIBUTION � FORGOT � OTHER REASON NOT LISTED ABOVE: (SPECIFY) ______________________________ � DON’T KNOW � REFUSED

31
FUTURE HIP COVERAGE Q7. Do you plan to apply for health coverage assistance through Medicaid or HIP in the
future? (IF NEEDED: “ HIP is Healthy Indiana Plan” -- a health insurance program for uninsured Hoosiers that provides coverage for Hoosiers ages 19 to 64.) � YES GO TO Q9 � NO � DON’T KNOW � REFUSED
Q8. Why do you not plan to apply for Medicaid or HIP in the future? � DON’T KNOW WHERE TO GET APPLICATION � DON’T KNOW WHERE TO SUBMIT AN APPLICATION:
o DON’T KNOW WHAT OFFICE TO GO TO o DON’T HAVE INTERNET ACCESS o DON’T KNOW I CAN APPLY BY PHONE
� DON'T NEED IT, HEALTHY � DON'T WANT PUBLIC ASSISTANCE � DIDN’T KNOW ABOUT IT � DON’T UNDERSTAND IT � NOT SURE ABOUT ELIGIBILITY / NOT ELIGIBLE � CAN’T AFFORD PAYMENTS � HAVE ACCESS TO OTHER INSURANCE � ALREADY INSURED � PAY FOR MEDICAL COVERAGE WITHOUT INSURANCE � JUST GO TO THE EMERGENCY ROOM � JUST MOVED HERE � GOING TO MOVE AWAY � OTHER (SPECIFY) � DON’T KNOW � REFUSED
Q9. Some people make a monthly contribution to be in HIP. If HIP required you to pay $5
each month to be enrolled, would you enroll? � YES � NO � DON’T KNOW � REFUSED
Q10. What about $10? Would you enroll if HIP required you to pay $10 each month?
� YES � NO � DON’T KNOW � REFUSED
GO TO Q9
GO TO Q11

32
ACCESS Q11. In the last 6 months, did you make any appointments for a check-up or routine care
at a doctor’s office or clinic? � YES GO TO NEXT QUESTION � NO SKIP NEXT QUESTION [Q13]
Q12. In the last 6 months, how often did you get an appointment for a check-up or routine
care at a doctor’s office or clinic as soon as you needed? � NEVER � SOMETIMES � USUALLY � ALWAYS
Q13. Specialists are doctors like surgeons, heart doctors, allergy doctors, skin doctors,
and other doctors who specialize in one area of health care. In the last 6 months, did you make any appointments to see a specialist? � YES GO TO Q14 � NO GO TO Q15
Q14. In the last 6 months, how often did you get an appointment to see a specialist as
soon as you needed? � NEVER � SOMETIMES � USUALLY � ALWAYS
Q15. In the last 6 months, did you get any new prescription medicines or refill a
prescription? � YES GO TO Q16 � NO GO TO Q17
Q16. In the last 6 months, how often was it easy to get your prescription medicine from
your health plan? � NEVER � SOMETIMES � USUALLY � ALWAYS
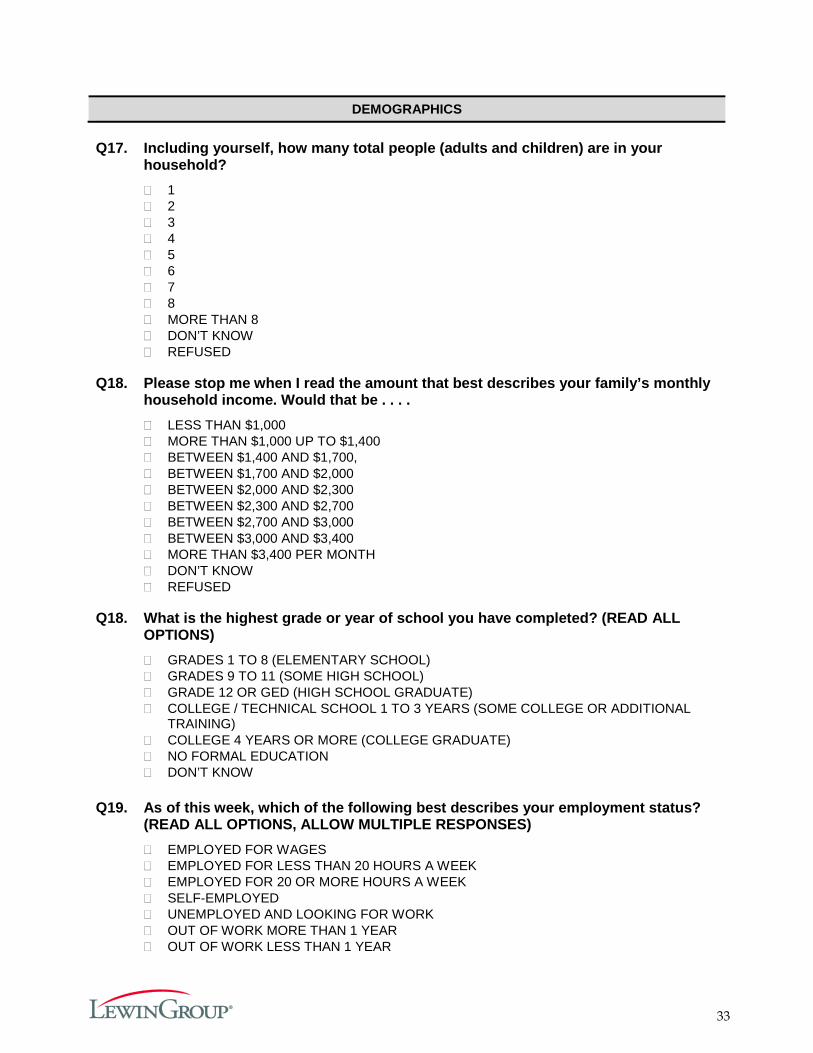
33
DEMOGRAPHICS Q17. Including yourself, how many total people (adults and children) are in your
household? � 1 � 2 � 3 � 4 � 5 � 6 � 7 � 8 � MORE THAN 8 � DON’T KNOW � REFUSED
Q18. Please stop me when I read the amount that best describes your family’s monthly
household income. Would that be . . . . � LESS THAN $1,000 � MORE THAN $1,000 UP TO $1,400 � BETWEEN $1,400 AND $1,700, � BETWEEN $1,700 AND $2,000 � BETWEEN $2,000 AND $2,300 � BETWEEN $2,300 AND $2,700 � BETWEEN $2,700 AND $3,000 � BETWEEN $3,000 AND $3,400 � MORE THAN $3,400 PER MONTH � DON’T KNOW � REFUSED
Q18. What is the highest grade or year of school you have completed? (READ ALL
OPTIONS) � GRADES 1 TO 8 (ELEMENTARY SCHOOL) � GRADES 9 TO 11 (SOME HIGH SCHOOL) � GRADE 12 OR GED (HIGH SCHOOL GRADUATE) � COLLEGE / TECHNICAL SCHOOL 1 TO 3 YEARS (SOME COLLEGE OR ADDITIONAL
TRAINING) � COLLEGE 4 YEARS OR MORE (COLLEGE GRADUATE) � NO FORMAL EDUCATION � DON’T KNOW
Q19. As of this week, which of the following best describes your employment status? (READ ALL OPTIONS, ALLOW MULTIPLE RESPONSES) � EMPLOYED FOR WAGES � EMPLOYED FOR LESS THAN 20 HOURS A WEEK � EMPLOYED FOR 20 OR MORE HOURS A WEEK � SELF-EMPLOYED � UNEMPLOYED AND LOOKING FOR WORK � OUT OF WORK MORE THAN 1 YEAR � OUT OF WORK LESS THAN 1 YEAR

34
� A HOMEMAKER � TAKING CARE OF AN ELDERLY PARENT OR A FAMILY MEMBER WITH A DISABILITY � A STUDENT � RETIRED � UNABLE TO WORK BECAUSE OF A PHYSICAL OR MENTAL HEALTH CONDITION � SOMETHING ELSE (SPECIFY) _________________________ � DON’T KNOW � REFUSED
CLOSE: Thank you for answering these questions. On behalf of the Healthy Indiana Plan we thank you for participating in this survey. Your answers will help improve the program.
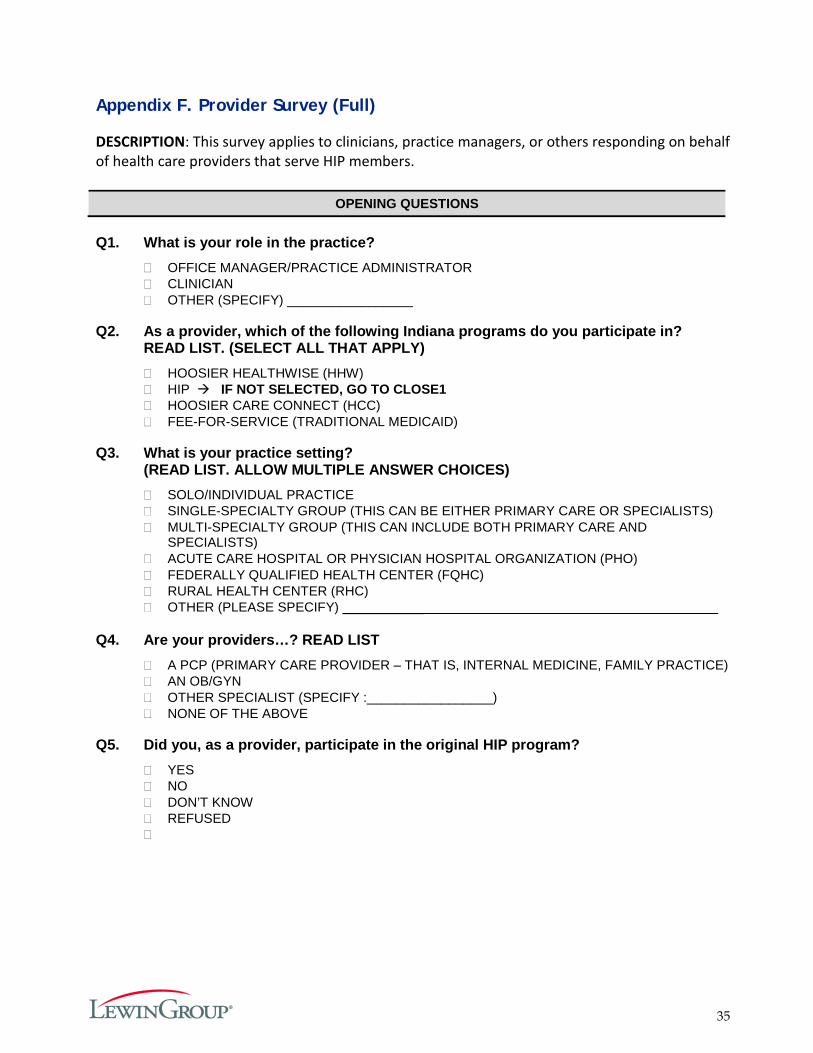
35
Appendix F. Provider Survey (Full)
DESCRIPTION: This survey applies to clinicians, practice managers, or others responding on behalf of health care providers that serve HIP members.
OPENING QUESTIONS Q1. What is your role in the practice?
� OFFICE MANAGER/PRACTICE ADMINISTRATOR � CLINICIAN � OTHER (SPECIFY) _________________
Q2. As a provider, which of the following Indiana programs do you participate in?
READ LIST. (SELECT ALL THAT APPLY) � HOOSIER HEALTHWISE (HHW) � HIP � HOOSIER CARE CONNECT (HCC) � FEE-FOR-SERVICE (TRADITIONAL MEDICAID)
Q3. What is your practice setting?
(READ LIST. ALLOW MULTIPLE ANSWER CHOICES) � SOLO/INDIVIDUAL PRACTICE � SINGLE-SPECIALTY GROUP (THIS CAN BE EITHER PRIMARY CARE OR SPECIALISTS) � MULTI-SPECIALTY GROUP (THIS CAN INCLUDE BOTH PRIMARY CARE AND
SPECIALISTS) � ACUTE CARE HOSPITAL OR PHYSICIAN HOSPITAL ORGANIZATION (PHO) � FEDERALLY QUALIFIED HEALTH CENTER (FQHC) � RURAL HEALTH CENTER (RHC) � OTHER (PLEASE SPECIFY) ___________
Q4. Are your providers…? READ LIST
� A PCP (PRIMARY CARE PROVIDER – THAT IS, INTERNAL MEDICINE, FAMILY PRACTICE) � AN OB/GYN � OTHER SPECIALIST (SPECIFY :_________________) � NONE OF THE ABOVE
Q5. Did you, as a provider, participate in the original HIP program?
� YES � NO � DON’T KNOW � REFUSED �
IF NOT SELECTED, GO TO CLOSE1
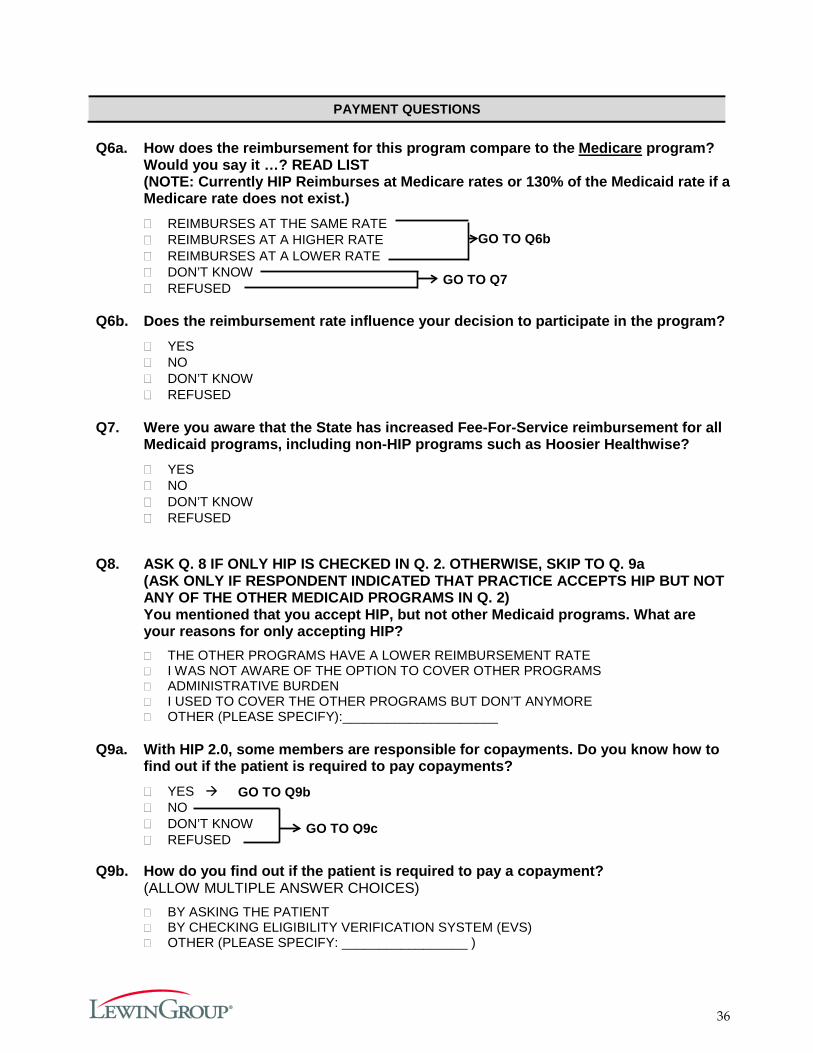
36
PAYMENT QUESTIONS Q6a. How does the reimbursement for this program compare to the Medicare program?
Would you say it …? READ LIST (NOTE: Currently HIP Reimburses at Medicare rates or 130% of the Medicaid rate if a Medicare rate does not exist.) � REIMBURSES AT THE SAME RATE � REIMBURSES AT A HIGHER RATE � REIMBURSES AT A LOWER RATE � DON’T KNOW � REFUSED
Q6b. Does the reimbursement rate influence your decision to participate in the program?
� YES � NO � DON’T KNOW � REFUSED
Q7. Were you aware that the State has increased Fee-For-Service reimbursement for all
Medicaid programs, including non-HIP programs such as Hoosier Healthwise? � YES � NO � DON’T KNOW � REFUSED
Q8. ASK Q. 8 IF ONLY HIP IS CHECKED IN Q. 2. OTHERWISE, SKIP TO Q. 9a (ASK ONLY IF RESPONDENT INDICATED THAT PRACTICE ACCEPTS HIP BUT NOT ANY OF THE OTHER MEDICAID PROGRAMS IN Q. 2) You mentioned that you accept HIP, but not other Medicaid programs. What are your reasons for only accepting HIP? � THE OTHER PROGRAMS HAVE A LOWER REIMBURSEMENT RATE � I WAS NOT AWARE OF THE OPTION TO COVER OTHER PROGRAMS � ADMINISTRATIVE BURDEN � I USED TO COVER THE OTHER PROGRAMS BUT DON’T ANYMORE � OTHER (PLEASE SPECIFY):_____________________
Q9a. With HIP 2.0, some members are responsible for copayments. Do you know how to
find out if the patient is required to pay copayments? � YES � NO � DON’T KNOW � REFUSED
Q9b. How do you find out if the patient is required to pay a copayment?
(ALLOW MULTIPLE ANSWER CHOICES) � BY ASKING THE PATIENT � BY CHECKING ELIGIBILITY VERIFICATION SYSTEM (EVS) � OTHER (PLEASE SPECIFY: _________________ )
GO TO Q7
GO TO Q9b
GO TO Q9c
GO TO Q6b

37
Q9c. Are you charging copayments to HIP members? � YES � NO � DON’T KNOW � REFUSED
Q9d. When do HIP members pay copayments?
� AT POINT OF SERVICE � MEMBER IS BILLED
Q9e. Do you pursue collections on unpaid copays?
� YES � NO � SOMETIMES � DON’T KNOW � REFUSED
Q10. For those HIP members who are required to pay copayments, what percentages of
them are making their copayments to you? Would you say it is... (READ LIST) � LESS THAN 25% � 26-49% � 50-74% � 75-99% � 100% � DON’T KNOW
MISSED APPOINTMENTS
Q11. If a member misses an appointment, which of the following are some likely reasons
that the member missed it, in your opinion? READ LIST. (CHOOSE ALL THAT APPLY) � COSTS TOO MUCH � COULDN’T GET CHILDCARE � COULDN’T GET TIME OFF FROM WORK � COULDN’T GET THROUGH ON THE PHONE � DIDN’T GET APPROVAL FROM HEALTH PLAN � DIDN’T HAVE TIME � DIDN’T WANT TO GO � HOURS OF OPERATION WERE NOT CONVENIENT � TAKES TOO LONG TO GET THERE � TRANSPORTATION PROBLEM � TOO SICK TO GO � OTHER (PLEASE SPECIFY) � I DON’T KNOW
GO TO Q9d
GO TO Q11
GO TO Q10 GO TO Q9E
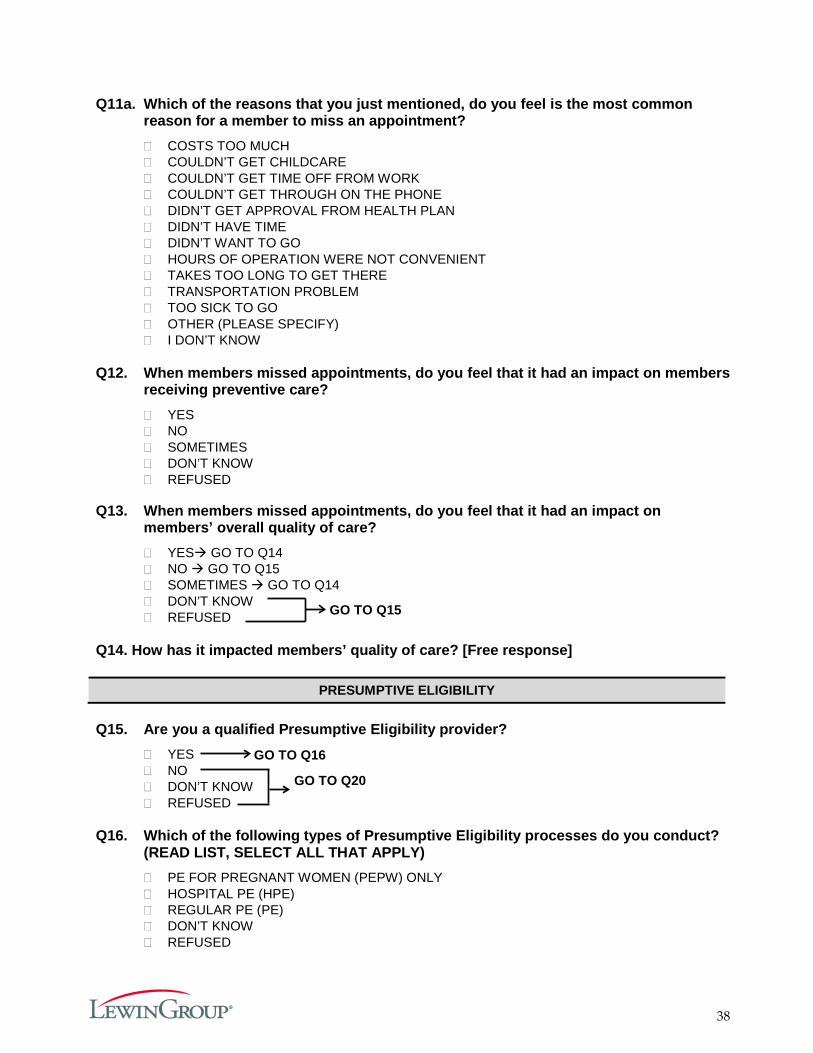
38
Q11a. Which of the reasons that you just mentioned, do you feel is the most common reason for a member to miss an appointment? � COSTS TOO MUCH � COULDN’T GET CHILDCARE � COULDN’T GET TIME OFF FROM WORK � COULDN’T GET THROUGH ON THE PHONE � DIDN’T GET APPROVAL FROM HEALTH PLAN � DIDN’T HAVE TIME � DIDN’T WANT TO GO � HOURS OF OPERATION WERE NOT CONVENIENT � TAKES TOO LONG TO GET THERE � TRANSPORTATION PROBLEM � TOO SICK TO GO � OTHER (PLEASE SPECIFY) � I DON’T KNOW
Q12. When members missed appointments, do you feel that it had an impact on members
receiving preventive care? � YES � NO � SOMETIMES � DON’T KNOW � REFUSED
Q13. When members missed appointments, do you feel that it had an impact on
members’ overall quality of care? � YES GO TO Q14 � NO GO TO Q15 � SOMETIMES GO TO Q14 � DON’T KNOW � REFUSED
Q14. How has it impacted members’ quality of care? [Free response]
PRESUMPTIVE ELIGIBILITY Q15. Are you a qualified Presumptive Eligibility provider?
� YES � NO � DON’T KNOW � REFUSED
Q16. Which of the following types of Presumptive Eligibility processes do you conduct?
(READ LIST, SELECT ALL THAT APPLY) � PE FOR PREGNANT WOMEN (PEPW) ONLY � HOSPITAL PE (HPE) � REGULAR PE (PE) � DON’T KNOW � REFUSED
GO TO Q20
GO TO Q16
GO TO Q15
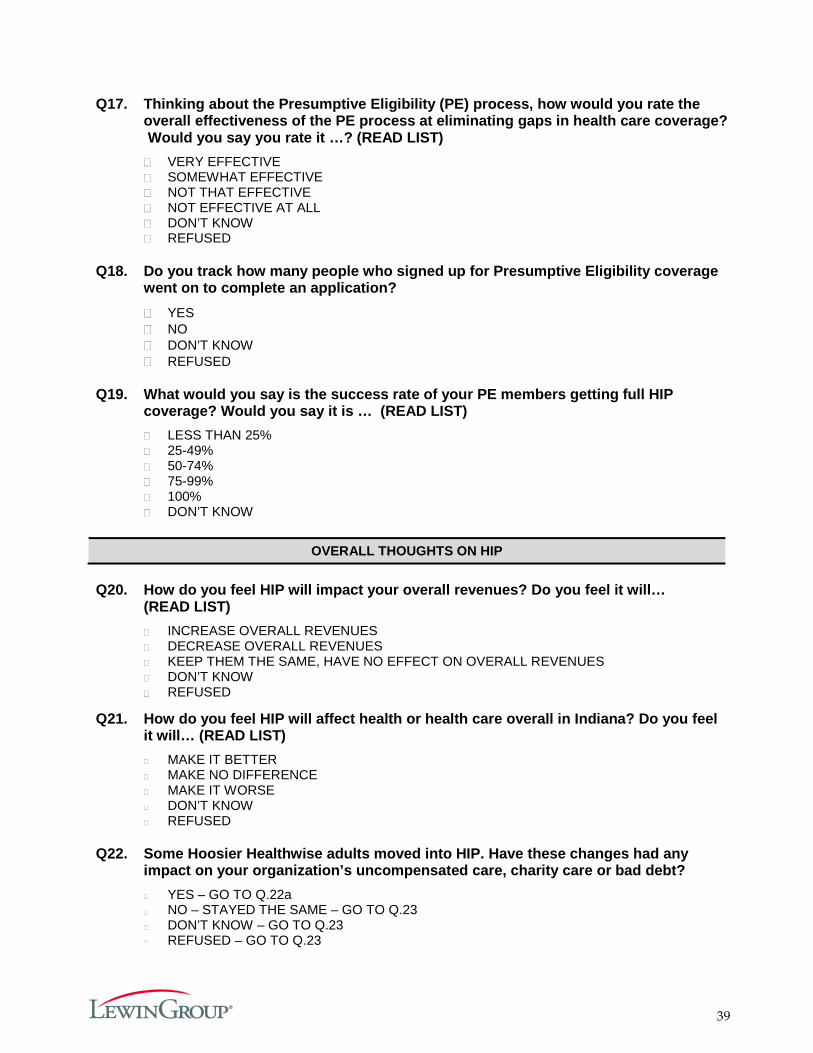
39
Q17. Thinking about the Presumptive Eligibility (PE) process, how would you rate the overall effectiveness of the PE process at eliminating gaps in health care coverage? Would you say you rate it …? (READ LIST) � VERY EFFECTIVE � SOMEWHAT EFFECTIVE � NOT THAT EFFECTIVE � NOT EFFECTIVE AT ALL � DON’T KNOW � REFUSED
Q18. Do you track how many people who signed up for Presumptive Eligibility coverage
went on to complete an application? � YES � NO � DON’T KNOW � REFUSED
Q19. What would you say is the success rate of your PE members getting full HIP
coverage? Would you say it is … (READ LIST) � LESS THAN 25% � 25-49% � 50-74% � 75-99% � 100% � DON’T KNOW
OVERALL THOUGHTS ON HIP
Q20. How do you feel HIP will impact your overall revenues? Do you feel it will…
(READ LIST) � INCREASE OVERALL REVENUES � DECREASE OVERALL REVENUES � KEEP THEM THE SAME, HAVE NO EFFECT ON OVERALL REVENUES � DON’T KNOW � REFUSED
Q21. How do you feel HIP will affect health or health care overall in Indiana? Do you feel it will… (READ LIST) � MAKE IT BETTER
� MAKE NO DIFFERENCE
� MAKE IT WORSE
� DON’T KNOW
� REFUSED
Q22. Some Hoosier Healthwise adults moved into HIP. Have these changes had any
impact on your organization’s uncompensated care, charity care or bad debt? � YES – GO TO Q.22a
� NO – STAYED THE SAME – GO TO Q.23
� DON’T KNOW – GO TO Q.23
� REFUSED – GO TO Q.23

40
Q22a. How have these changes impacted your uncompensated care, charity care or bad debt? (Free response)
Q23. Since HIP started in February 2015, have you seen a decline in… a. The number of patients without insurance � YES – NUMBER OF PATIENTS WITHOUT INSURANCE DECLINED � NO – NUMBER OF PATIENTS WITHOUT INSURANCE INCREASED � NO – NUMBER OF PATIENTS WITHOUT INSURANCE STAYED THE SAME � DON’T KNOW b. The number of requests for charity care cases that the practice receives � YES – IT DECREASED � NO – IT INCREASED � NO – IT STAYED THE SAME � DON’T KNOW c. The instances of Bad Debt � YES – IT DECREASED � NO – IT INCREASED � NO – IT STAYED THE SAME � DON’T KNOW
> CLOSE1< Thank you for answering these questions. May I please confirm the following information? This survey is meant to be completed by clinicians or practice managers who provide services to HIP members. If you have any questions about HIP please call 1-877-438-4479. Thank you and have a good (day/night).
INTERVIEWER: HANG UP. CODE CASE AS INELIGIBLE—DOES NOT MEET SURVEY CRITERIA
CLOSE: Thank you for answering these questions. On behalf of the Healthy Indiana Plan we thank you for participating in this survey. Your answers will help improve the program.

41
Appendix G. Survey Sampling Approach
To provide information on individual experiences with the Healthy Indiana Plan (HIP) 2.0, Indiana surveyed current HIP 2.0 members, previous members (leavers), never members, and providers. The surveys were administered in December 2015 and January 2016. The surveys cover a range of topics that address aspects such as access to care, affordability, and member and provider understanding of the program.
Current Member survey sampling strategy
A sample was randomly selected from the total number of HIP 2.0 members. Table G1, below, outlines the total number of members, number of members selected into the sample, target number of responses, and number of completed responses for each category.
The total number of members represents the universe of HIP 2.0 members (n=264,018) as of August 26, 2015. A sample of this universe was selected (n=11,000), for whom data was sent to the survey firm, AIRvan Consulting, for data collection. This sample was selected to ensure that the target number of responses were completed based upon expected survey response rates. A target number of completed responses was constructed to maintain the proportion of members in each category in the universe of HIP 2.0 members. That is, the survey design and collection process was based on a quota-based sample where the number of completed surveys was designed to have similar proportions of respondents to the universe of HIP 2.01 members along the dimensions of state-provided NEMT coverage, as well as participation in the HIP Plus and HIP Basic plans.
Ultimately, 600 current members comprised the survey sample. This number exceeded our initial target of 550 as AIRvan Consulting oversampled to ensure that quotas for each of the NEMT categories were met. The target sample sizes for the survey were determined in order to detect large differences across populations in aggregate—greater than 10 percentage points—using standard levels of statistical confidence. These differences were deemed substantial from a policy perspective for populations of interest in aggregate (e.g., all members with Plus coverage versus those with Basic coverage).2 However, the ability to detect statistically significant differences for subgroup analyses, which would rely on smaller subsets of the overall sample, would be lower.3
1 The sample was selected based on the HIP 2.0 population at a point in time in August 2015. Reference to universe of
HIP 2.0 beneficiaries for any sample projections refer to this point in time population. 2 Response to Recent Communications from CMS (10/29/15) and Mathematica Policy Research (10/27/15),
Submitted by Lewin Group to Joseph Moser on 11/05/2015. Sample sizes determined using a .05 level of significance 80% power.
3 Detectable differences determined using an assumed response proportion of .10. Detectable differences increase greatly as this assumed proportion increases.

42
Table G1. Summary of Current Member Sample Sizes from Survey Analysis Plan
Survey Detail Total
Number of Members
Number of Members Selected
into Sample
Target Number of Completed Responses
Actual Number of Completed Responses
Current Member
Individuals enrolled in HIP Basic or HIP Plus at the time the survey was conducted
Plan Selection - Total 264,018 11,000 550 600 HIP Plus 183,021 7,637 385 420 HIP Basic 80,997 3,363 165 180
Transportation Coverage – Total 264,018 11,000 550 600
Receive State-provided NEMT 120,320 5,192 260 286
Do not receive State-provided NEMT
143,698 5,808 290 314
AIRvan Consulting randomly selected participants in each of the categories to be surveyed (survey protocol detailed below). Once 400 current member surveys were conducted, the number of interviews conducted within each category in relation to target completion numbers was assessed. A two-stage sampling approach was employed in which AIRvan Consulting was then asked to oversample specific categories of members to meet the target number for completed categories.
As discussed above, the member survey was targeted at two sets of non-mutually exclusive groups: HIP Basic and HIP Plus members, and those who were eligible and ineligible for transportation benefits (non-emergency medical transportation or NEMT). Table H1 illustrates the target completed responses for each group and shows how all four were met given the existing distribution of HIP Plus and HIP Basic members with and without transportation benefits.
Previous Member (Leaver) Survey Sampling Strategy
The goal of the previous member (leaver) survey was to obtain information from those who were no longer HIP members. The survey included questions about why they left HIP, their knowledge of POWER accounts, and how they accessed care after leaving HIP. The evaluators identified previous members using enrollment data collected on August 26, 2015. There were two groups of individuals selected for inclusion in the leaver sample: those who left the program for any reason (such as moving away from Indiana or receiving coverage through Medicare) and those with incomes at or above 100% FPL who left HIP for non-payment of POWER account contributions. There was a total sample of 1,887 leavers, which consisted of 988 individuals who left the program for any reason and 890 who left for non-payment of POWER account contributions. The target completed response was 125, and 130 responses were collected. A total of 55 responses were collected from those who left due to change in eligibility, and 75 responses were collected from those who left due to not making a POWER account contribution.

43
Table G2 outlines the number of leavers included in the universe population, the number selected to survey, and the number of completed responses.
Table G2. Distribution of Sampled HIP 2.0 Previous Members by Type
Survey Detail
Total Number of
Leavers
Total Number of Leavers
Selected into Sample
Target Number of Completed Responses
Actual Number of Completed Responses
Leavers
Left due to change in eligibility 8,569 988
125
55
Left due to having income at or above 100% and not making a POWER account contribution
890 890 75
TOTAL 9,459 1,887 125 130
Never-Member Sampling Strategy
The goal of the never-member survey was to obtain information from those who were eligible for HIP but did not enroll. The never members consisted of individuals from the following groups: 1) Those who applied for HIP coverage and were conditionally approved, had income at or above 100% FPL, and did not make their first POWER account contribution; and 2) those determined eligible through the presumptive eligibility (PE) process but did not complete an application to obtain full coverage. Evaluators identified these individuals using eligibility data.
As this population was difficult to contact, it was not surprising to observe a low response rate. The initial goal was to complete 125 total surveys of never members; however, the amount of effort required to complete only 51 surveys was much greater than anticipated. The available data for individuals who did not make their first POWER account contributions, for example, contained phone numbers without any names or additional information. AIRvan Consulting contacted 940 (out of a total universe of 5,190) individuals who completed the PE process and collected 50 responses. AIRvan Consulting contacted 114 (out of a total universe of 121) individuals who did not become HIP members because they did not make their first POWER account contribution, and only one (1) response was collected. This response was later determined to be invalid due to inconsistencies in the way the individual answered certain questions.
Table G3 outlines the number of never members included in the universe population, the number selected to survey, and the number of completed responses.
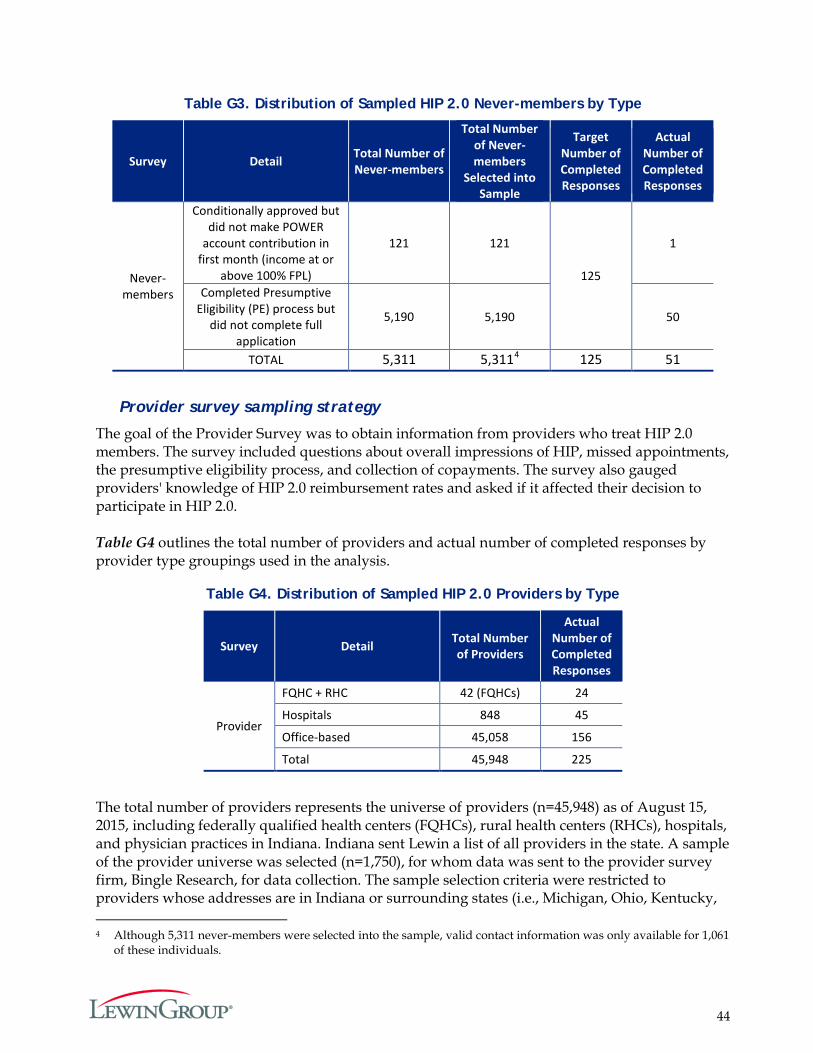
44
Table G3. Distribution of Sampled HIP 2.0 Never-members by Type
Survey Detail Total Number of Never-members
Total Number of Never- members
Selected into Sample
Target Number of Completed Responses
Actual Number of Completed Responses
Never-members
Conditionally approved but did not make POWER
account contribution in first month (income at or
above 100% FPL)
121 121
125
1
Completed Presumptive Eligibility (PE) process but
did not complete full application
5,190 5,190 50
TOTAL 5,311 5,3114 125 51
Provider survey sampling strategy
The goal of the Provider Survey was to obtain information from providers who treat HIP 2.0 members. The survey included questions about overall impressions of HIP, missed appointments, the presumptive eligibility process, and collection of copayments. The survey also gauged providers' knowledge of HIP 2.0 reimbursement rates and asked if it affected their decision to participate in HIP 2.0. Table G4 outlines the total number of providers and actual number of completed responses by provider type groupings used in the analysis.
Table G4. Distribution of Sampled HIP 2.0 Providers by Type
Survey Detail Total Number of Providers
Actual Number of Completed Responses
Provider
FQHC + RHC 42 (FQHCs) 24
Hospitals 848 45
Office-based 45,058 156
Total 45,948 225
The total number of providers represents the universe of providers (n=45,948) as of August 15, 2015, including federally qualified health centers (FQHCs), rural health centers (RHCs), hospitals, and physician practices in Indiana. Indiana sent Lewin a list of all providers in the state. A sample of the provider universe was selected (n=1,750), for whom data was sent to the provider survey firm, Bingle Research, for data collection. The sample selection criteria were restricted to providers whose addresses are in Indiana or surrounding states (i.e., Michigan, Ohio, Kentucky, 4 Although 5,311 never-members were selected into the sample, valid contact information was only available for 1,061
of these individuals.

45
and Illinois) and treated HIP 2.0 patients. We excluded the following provider types and related specialties:
Pediatrics Mental health School corporation Pharmacy DME/medical supply Transportation provider Dentist Laboratory First Step program Case management Hearing aid dealer Waiver provider Non-billing waiver case manager
Pediatric providers were excluded as HIP 2.0 covers only persons age 19 – 64. The other provider groups were excluded because they would be unlikely to be familiar with missed appointments or the availability of NEMT services. Providers eligible for inclusion into the surveyed sample included: (1) acute care hospitals, (2) psychiatric hospitals, (3) counseling and mental health centers, (4) rural health care centers (RHCs), (5) federally qualified heath centers (FQHCs), (6) local health departments, (7) solo/individual practices, (8) single-specialty practices, and (9) multi-specialty practices. Due to small numbers for some of the provider types, we did not end up sampling all of these provider types.
To increase participation and alert providers that a survey was going to be conducted, all of the providers received a letter from Joseph Moser, Medicaid Director of Indiana FSSA. A copy of the letter is in Appendix I.
Ultimately, 225 providers comprised the survey sample; 96.4 percent were located in Indiana, while a small sample (n=8) came from surrounding states. All FQHCs (n=42) were targeted to be in the sample, as the FQHC client mix favors Medicaid members, including HIP 2.0. Half of the FQHCs in Indiana were ultimately sampled. For the purpose of analysis, survey responses from FQHCs (n=21) and RHCs (n=3), are combined. The other 1,708 records were selected via simple random sample from the remaining pool of providers.
It should also be noted that Bingle Research interviewed primarily administrative5 and financial staff6 (88.0 percent), while clinicians7 and auxiliary clinical staff8 comprised approximately 5.3 percent and 6.7 percent, respectively. Survey questions were intended to be answered by those most familiar with the office environment and patient issues as a whole.
Respondents were asked in which field they practice and were classified as primary care providers if they responded “primary care,” “family practice,” or “OB/GYN.” All other providers 5 Includes office managers / practice administrators and administrative assistants 6 Includes financial and insurance staff 7 Includes physicians and nurses 8 Includes medical assistants, patient navigators, and community outreach staff
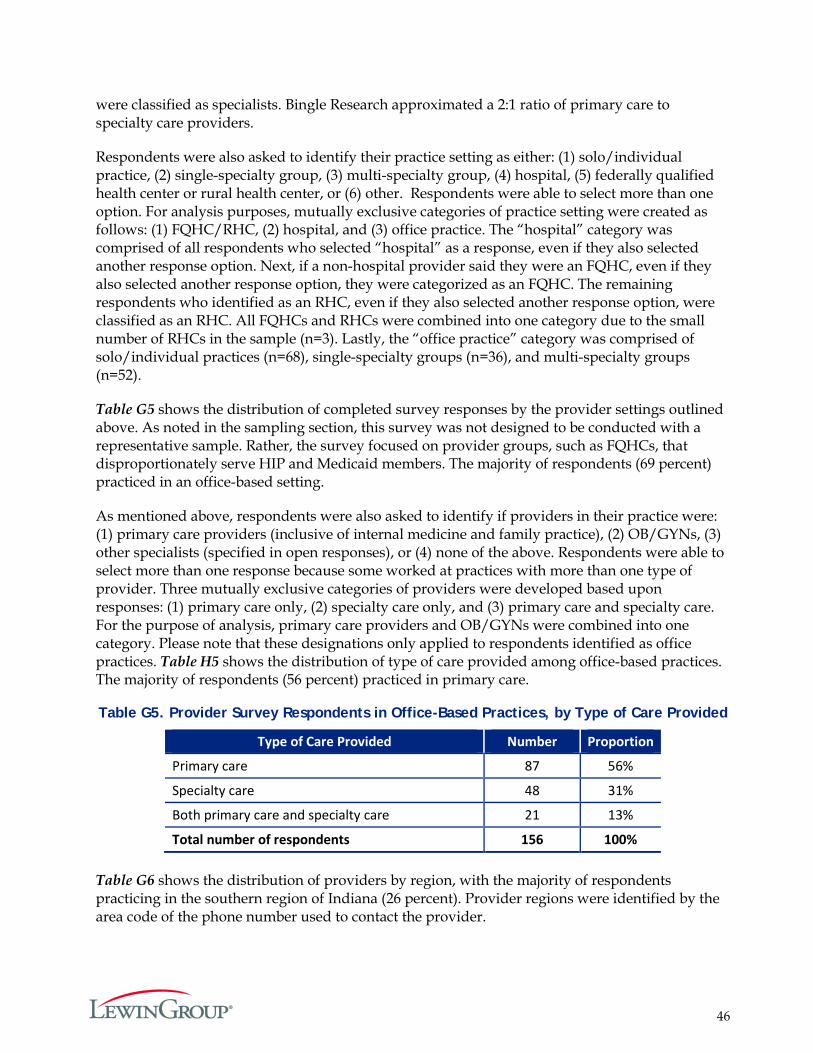
46
were classified as specialists. Bingle Research approximated a 2:1 ratio of primary care to specialty care providers.
Respondents were also asked to identify their practice setting as either: (1) solo/individual practice, (2) single-specialty group, (3) multi-specialty group, (4) hospital, (5) federally qualified health center or rural health center, or (6) other. Respondents were able to select more than one option. For analysis purposes, mutually exclusive categories of practice setting were created as follows: (1) FQHC/RHC, (2) hospital, and (3) office practice. The “hospital” category was comprised of all respondents who selected “hospital” as a response, even if they also selected another response option. Next, if a non-hospital provider said they were an FQHC, even if they also selected another response option, they were categorized as an FQHC. The remaining respondents who identified as an RHC, even if they also selected another response option, were classified as an RHC. All FQHCs and RHCs were combined into one category due to the small number of RHCs in the sample (n=3). Lastly, the “office practice” category was comprised of solo/individual practices (n=68), single-specialty groups (n=36), and multi-specialty groups (n=52).
Table G5 shows the distribution of completed survey responses by the provider settings outlined above. As noted in the sampling section, this survey was not designed to be conducted with a representative sample. Rather, the survey focused on provider groups, such as FQHCs, that disproportionately serve HIP and Medicaid members. The majority of respondents (69 percent) practiced in an office-based setting.
As mentioned above, respondents were also asked to identify if providers in their practice were: (1) primary care providers (inclusive of internal medicine and family practice), (2) OB/GYNs, (3) other specialists (specified in open responses), or (4) none of the above. Respondents were able to select more than one response because some worked at practices with more than one type of provider. Three mutually exclusive categories of providers were developed based upon responses: (1) primary care only, (2) specialty care only, and (3) primary care and specialty care. For the purpose of analysis, primary care providers and OB/GYNs were combined into one category. Please note that these designations only applied to respondents identified as office practices. Table H5 shows the distribution of type of care provided among office-based practices. The majority of respondents (56 percent) practiced in primary care.
Table G5. Provider Survey Respondents in Office-Based Practices, by Type of Care Provided
Type of Care Provided Number Proportion
Primary care 87 56%
Specialty care 48 31%
Both primary care and specialty care 21 13%
Total number of respondents 156 100% Table G6 shows the distribution of providers by region, with the majority of respondents practicing in the southern region of Indiana (26 percent). Provider regions were identified by the area code of the phone number used to contact the provider.
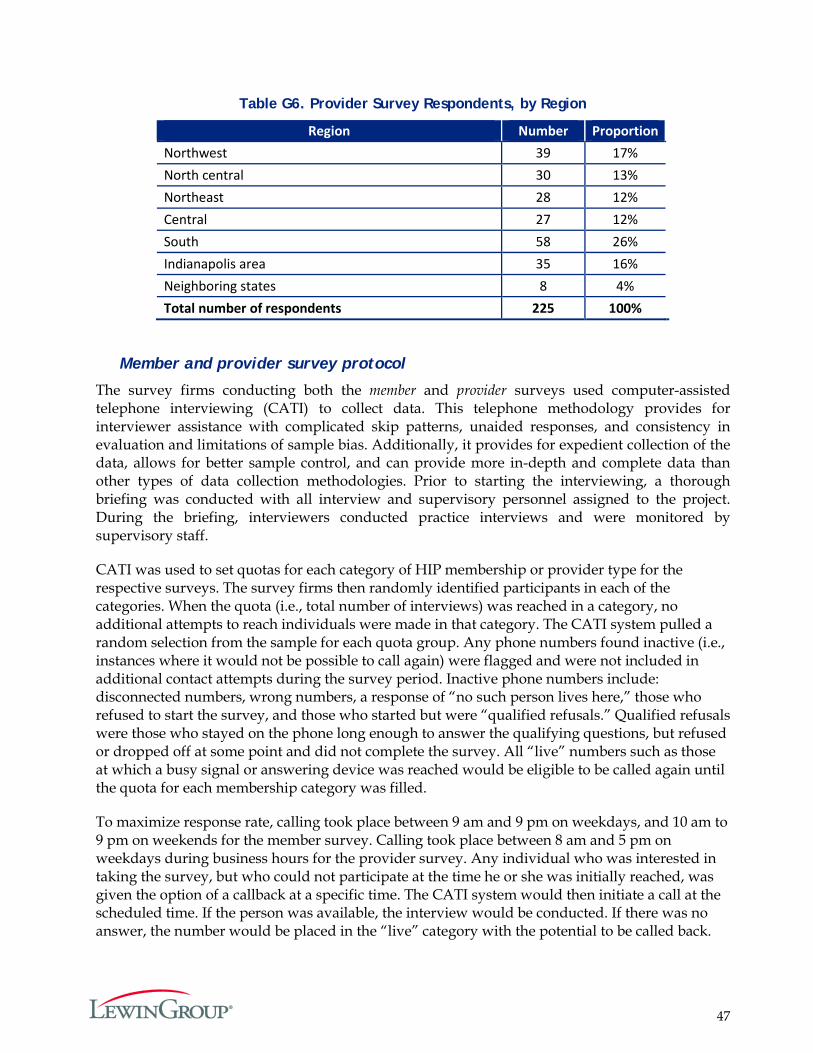
47
Table G6. Provider Survey Respondents, by Region
Region Number Proportion Northwest 39 17% North central 30 13% Northeast 28 12% Central 27 12% South 58 26% Indianapolis area 35 16% Neighboring states 8 4% Total number of respondents 225 100%
Member and provider survey protocol
The survey firms conducting both the member and provider surveys used computer-assisted telephone interviewing (CATI) to collect data. This telephone methodology provides for interviewer assistance with complicated skip patterns, unaided responses, and consistency in evaluation and limitations of sample bias. Additionally, it provides for expedient collection of the data, allows for better sample control, and can provide more in-depth and complete data than other types of data collection methodologies. Prior to starting the interviewing, a thorough briefing was conducted with all interview and supervisory personnel assigned to the project. During the briefing, interviewers conducted practice interviews and were monitored by supervisory staff.
CATI was used to set quotas for each category of HIP membership or provider type for the respective surveys. The survey firms then randomly identified participants in each of the categories. When the quota (i.e., total number of interviews) was reached in a category, no additional attempts to reach individuals were made in that category. The CATI system pulled a random selection from the sample for each quota group. Any phone numbers found inactive (i.e., instances where it would not be possible to call again) were flagged and were not included in additional contact attempts during the survey period. Inactive phone numbers include: disconnected numbers, wrong numbers, a response of “no such person lives here,” those who refused to start the survey, and those who started but were “qualified refusals.” Qualified refusals were those who stayed on the phone long enough to answer the qualifying questions, but refused or dropped off at some point and did not complete the survey. All “live” numbers such as those at which a busy signal or answering device was reached would be eligible to be called again until the quota for each membership category was filled.
To maximize response rate, calling took place between 9 am and 9 pm on weekdays, and 10 am to 9 pm on weekends for the member survey. Calling took place between 8 am and 5 pm on weekdays during business hours for the provider survey. Any individual who was interested in taking the survey, but who could not participate at the time he or she was initially reached, was given the option of a callback at a specific time. The CATI system would then initiate a call at the scheduled time. If the person was available, the interview would be conducted. If there was no answer, the number would be placed in the “live” category with the potential to be called back.
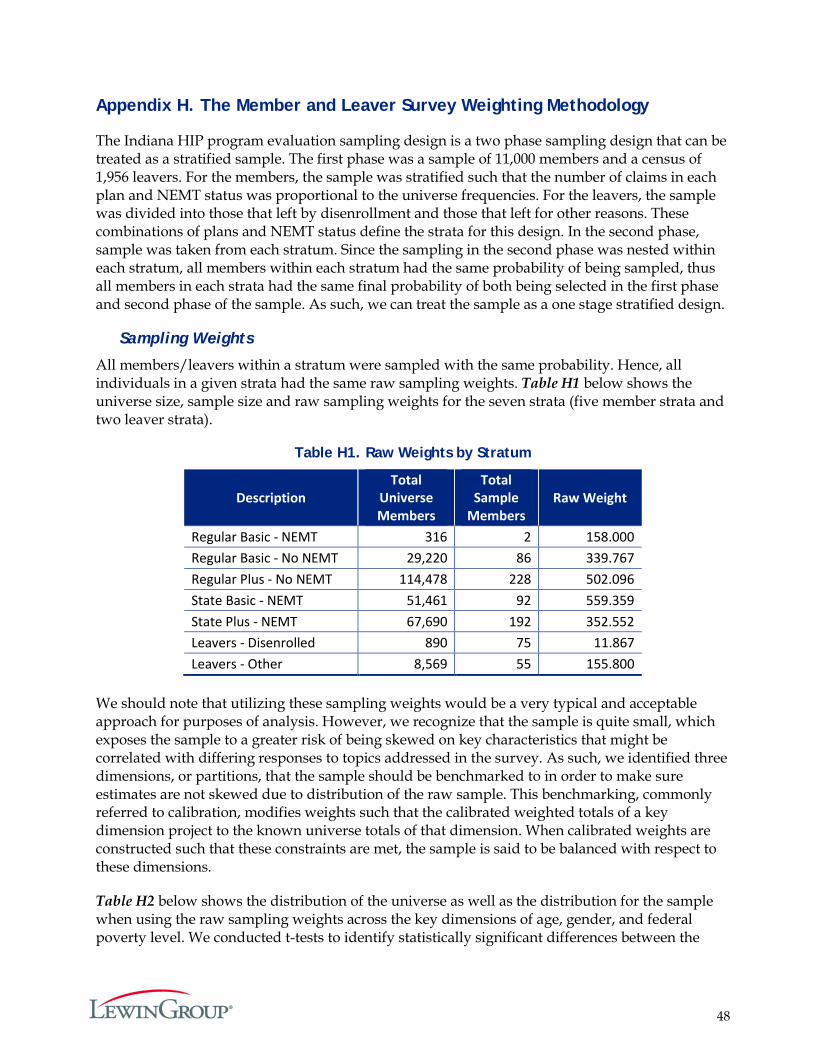
48
Appendix H. The Member and Leaver Survey Weighting Methodology
The Indiana HIP program evaluation sampling design is a two phase sampling design that can be treated as a stratified sample. The first phase was a sample of 11,000 members and a census of 1,956 leavers. For the members, the sample was stratified such that the number of claims in each plan and NEMT status was proportional to the universe frequencies. For the leavers, the sample was divided into those that left by disenrollment and those that left for other reasons. These combinations of plans and NEMT status define the strata for this design. In the second phase, sample was taken from each stratum. Since the sampling in the second phase was nested within each stratum, all members within each stratum had the same probability of being sampled, thus all members in each strata had the same final probability of both being selected in the first phase and second phase of the sample. As such, we can treat the sample as a one stage stratified design.
Sampling Weights
All members/leavers within a stratum were sampled with the same probability. Hence, all individuals in a given strata had the same raw sampling weights. Table H1 below shows the universe size, sample size and raw sampling weights for the seven strata (five member strata and two leaver strata).
Table H1. Raw Weights by Stratum
Description Total
Universe Members
Total Sample
Members Raw Weight
Regular Basic - NEMT 316 2 158.000 Regular Basic - No NEMT 29,220 86 339.767 Regular Plus - No NEMT 114,478 228 502.096 State Basic - NEMT 51,461 92 559.359 State Plus - NEMT 67,690 192 352.552 Leavers - Disenrolled 890 75 11.867 Leavers - Other 8,569 55 155.800
We should note that utilizing these sampling weights would be a very typical and acceptable approach for purposes of analysis. However, we recognize that the sample is quite small, which exposes the sample to a greater risk of being skewed on key characteristics that might be correlated with differing responses to topics addressed in the survey. As such, we identified three dimensions, or partitions, that the sample should be benchmarked to in order to make sure estimates are not skewed due to distribution of the raw sample. This benchmarking, commonly referred to calibration, modifies weights such that the calibrated weighted totals of a key dimension project to the known universe totals of that dimension. When calibrated weights are constructed such that these constraints are met, the sample is said to be balanced with respect to these dimensions.
Table H2 below shows the distribution of the universe as well as the distribution for the sample when using the raw sampling weights across the key dimensions of age, gender, and federal poverty level. We conducted t-tests to identify statistically significant differences between the

49
projected and universe distributions of age, gender, and FPL using the raw sampling weights. While significance appeared only a few times when using a multivariate adjusted (Bonferroni) 0.05 level of significance, the point estimates varied enough to warrant calibration to these dimensions.
Raking
The simplest, most straightforward approach to calibration would be to benchmark the sample to every level of age, gender, and FPL combination. However, given the small nature of the sample, clearly many of these calibration universe totals would have no corresponding sample to project to. A possible fix for this would be to subjectively collapse these groupings until the sample size permits for calibration, but as one can see from Table H2 and Table H3, such collapsing would likely obscure some of the sampling skew that can only be observed at the more granularly defined groupings of age and FPL. This is a common problem for calibration strategies, and the process of Raking was constructed for this very reason. Raking iteratively calibrates the sample to one dimension at a time, and continues this process until weights converge to a point where all desired dimensions project to the universe totals with a singular weight.

50
Table H2. Projections by Stratum and Level
Regular Basic - NEMT Regular Basic - No NEMT Regular Plus - No NEMT State Basic - NEMT State Plus - NEMT % Uni % Samp % Proj % Uni % Samp % Proj % Uni % Samp % Proj % Uni % Samp % Proj % Uni % Samp % Proj
Age 19-25 56.6% 100.0% 100.0%* 28.1% 25.6% 28.1%* 14.4%** 11.0%** 14.4%* 29.9%** 20.7%** 30.2%* 18.3%** 11.5%** 18.3%* 26-35 36.7% 0.0% . 32.6% 31.4% 32.6%* 24.4% 22.8% 24.4%* 42.5% 42.4% 42.9%* 35.1% 38.5% 35.1%* 36-45 6.6% 0.0% . 19.3% 15.1% 19.3%* 21.7%** 17.1%** 21.7%* 21.0% 28.3% 21.2%* 26.5% 24.5% 26.5%*
46-55 0.0% 0.0% . 14.1% 18.6% 14.1%* 23.5% 24.6% 23.5%* 5.6% 8.7% 5.7%* 14.7%** 19.8%** 14.7%*
56-64 0.0% 0.0% . 5.9% 9.3% 5.9%* 15.9%** 24.1%** 15.9%* 0.9% 0.0% . 5.4% 5.7% 5.4%* 65+ 0.0% 0.0% . 0.1% 0.0% . 0.1% 0.4% 0.1%* 0.0% 0.0% . 0.0% 0.0% .
Gender
Female 100.0% 100.0% 100.0%* 59.7% 64.0% 59.7%* 62.4%** 71.9%** 62.4%* 82.3% 84.8% 82.3% 76.7%** 83.9%** 76.7% Male 0.0% 0.0% . 40.3% 36.0% 40.3%* 37.6%** 28.1%** 37.6%* 17.7% 15.2% 17.7% 23.3%** 16.1%** 23.3%
% FPL <25 35.1% 100.0% 100.0% 50.5% 44.2% 50.5% 35.7% 34.6% 35.9% 85.3% 83.7% 85.3% 78.6% 78.6% 78.6%
25-49.9 17.1% 0.0% . 11.3% 17.4% 11.4% 10.9% 13.2% 11.0% 3.6%** 8.7%** 3.6% 4.3%** 2.1%** 4.3% 50-74.9 23.4% 0.0% . 17.8%** 25.6%** 17.8% 16.7% 14.9% 16.9% 3.9% 2.2% 3.9% 5.4% 4.2% 5.4% 75-99.9 18.0% 0.0% . 18.1%** 11.6%** 18.1% 18.6% 17.5% 18.7% 3.2% 3.3% 3.2% 5.1%** 2.6%** 5.1%
100-137.9 4.4% 0.0% . 2.2% 1.2% 2.2% 17.5% 19.7% 17.6% 2.2% 1.1% 2.2% 4.9%** 11.5%** 4.9% >138 1.9% 0.0% . 0.1% 0.0% . 0.6% 0.0% . 1.7% 1.1% 1.7% 1.6% 1.0% 1.6%
* Categories where the projected number of members using the final weight is not exactly equal to the total number of members in the universe ** Categories where the T test performed on the difference between the raw weight projected and universe distributions was significant Notes: “% Universe” refers to projections using calibrated weights. “% Sample” refers to projections using the raw sampling weight derived from the sample.

51
Table H3. Final Projections for Leavers by Stratum and Level
Disenrolled Other
% Uni % Samp % Proj % Uni % Samp % Proj
Age 19-25 14.0% 16.0% 14.0%* 26.8% 27.3% 26.2%* 26-35 26.9% 29.3% 26.9%* 32.2% 27.3% 31.4%* 36-45 21.2% 18.7% 21.2%* 19.1% 18.2% 18.6%* 46-55 22.1% 20.0% 22.1%* 14.3% 12.7% 14.0%* 56-64 15.7% 16.0% 15.7%* 6.9% 12.7% 6.7%*
65+ 0.0% 0.0% . 0.7% 1.8% 3.1%* Gender
Female 71.1% 68.0% 71.1%* 64.9% 63.6% 65.7%* Male 28.9% 32.0% 28.9%* 35.1% 36.4% 34.3%*
% FPL <25 30.0% 36.0% 30.7% 89.2%** 94.5%** 94.6%
25-49.9 0.0% . . 1.8% 1.8% 1.9% 50-74.9 0.3% 1.3% 0.3% 2.9% 0.0% . 75-99.9 0.0% . . 2.9% 1.8% 3.1%
100-137.9 67.4% 62.7% 69.0% 2.8% 0.0% . >138 2.2% 0.0% . 0.4% 1.8% 0.4%
* Categories where the projected number of members using the final weight is not exactly equal to the total number of members in the universe ** Categories where the T test performed on the difference between the raw weight projected and universe distributions was significant
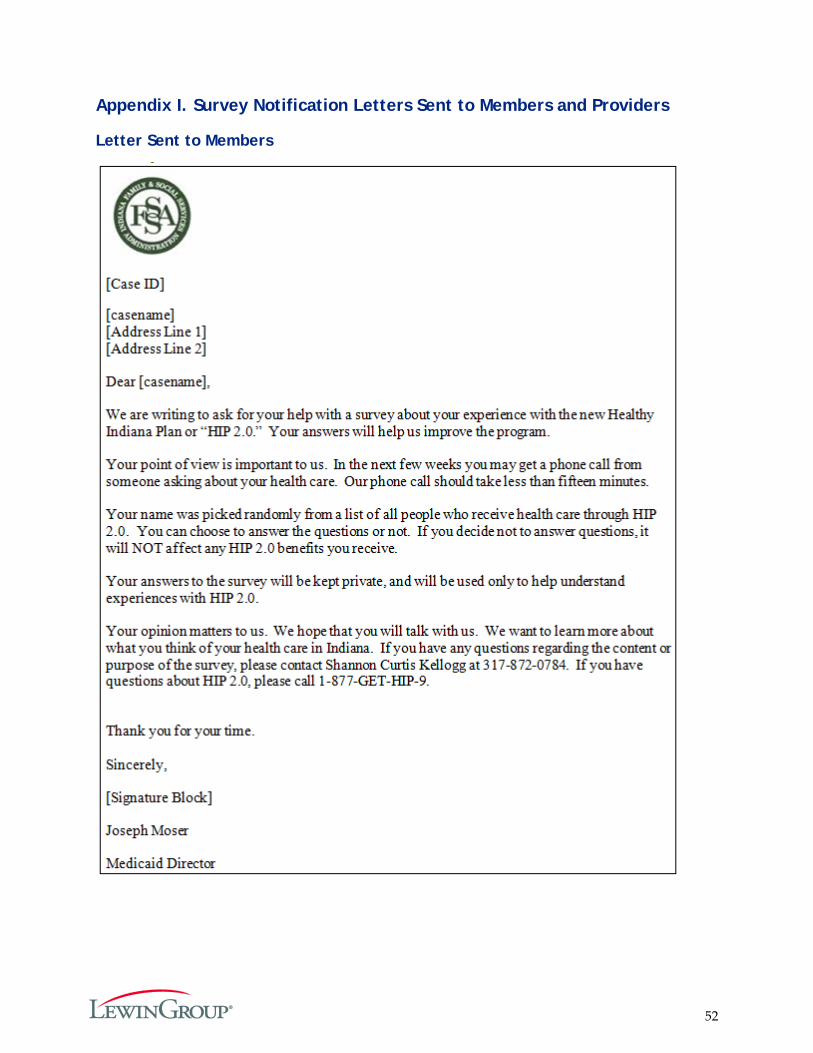
52
Appendix I. Survey Notification Letters Sent to Members and Providers
Letter Sent to Members

53
Letter Sent to Providers
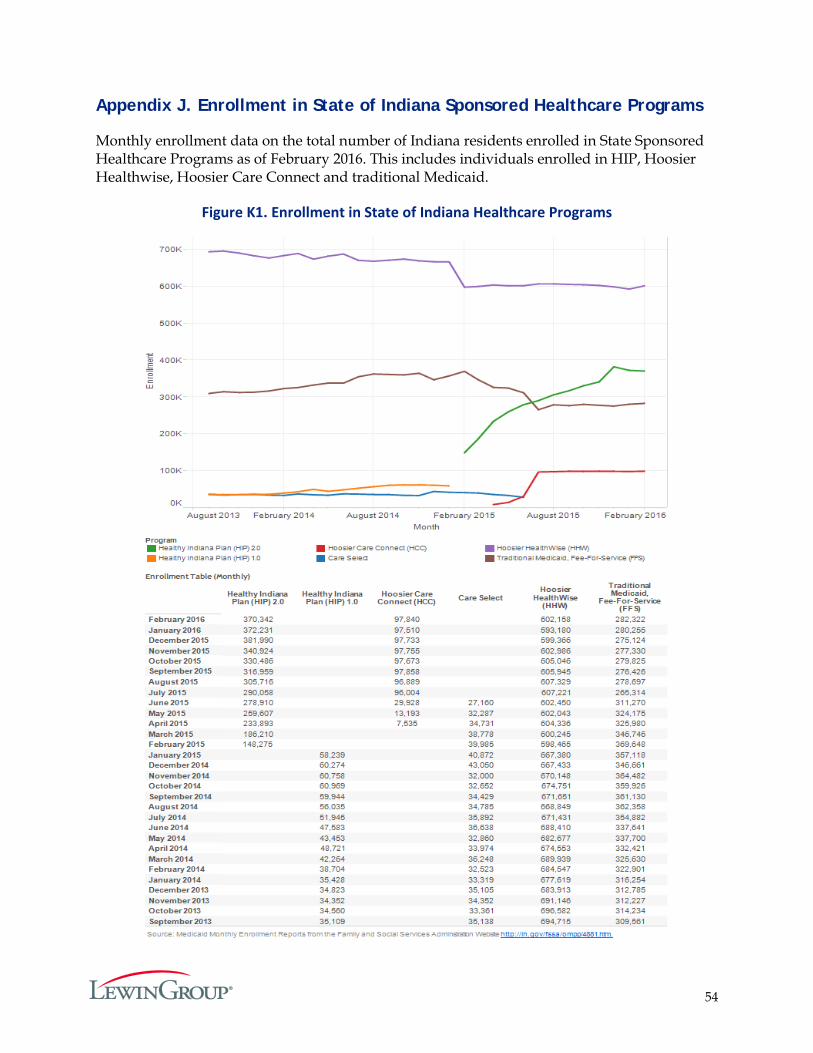
54
Appendix J. Enrollment in State of Indiana Sponsored Healthcare Programs
Monthly enrollment data on the total number of Indiana residents enrolled in State Sponsored Healthcare Programs as of February 2016. This includes individuals enrolled in HIP, Hoosier Healthwise, Hoosier Care Connect and traditional Medicaid.
Figure K1. Enrollment in State of Indiana Healthcare Programs
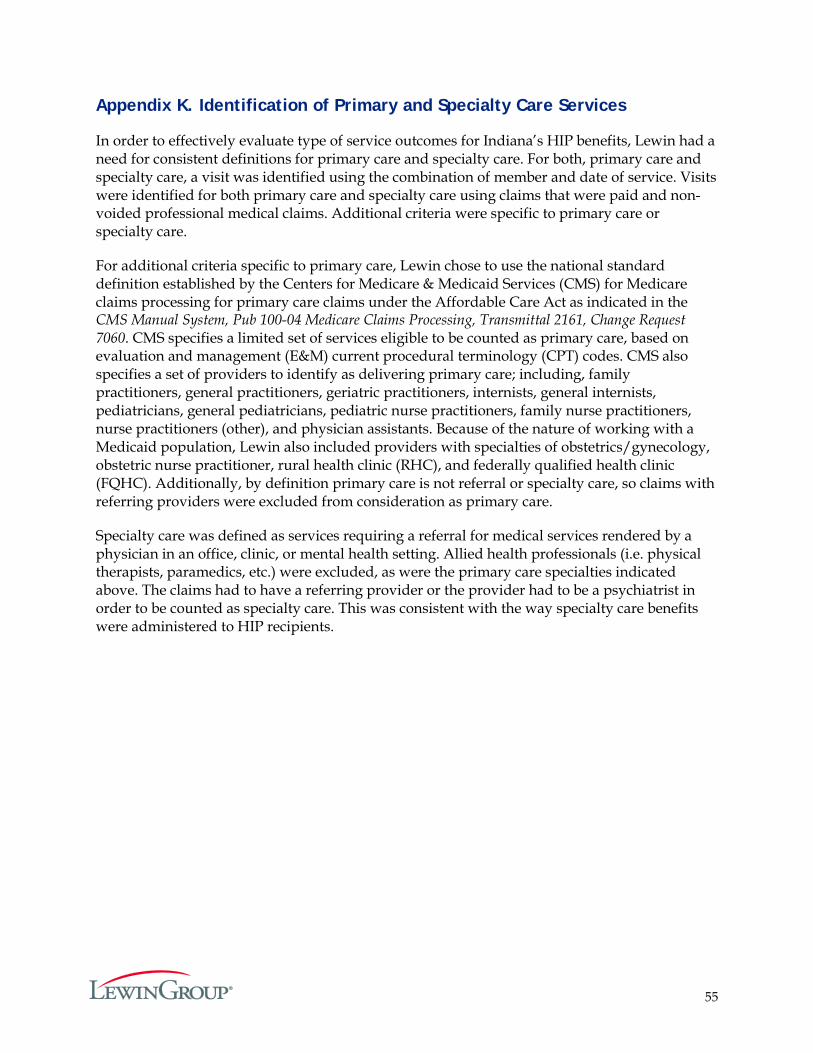
55
Appendix K. Identification of Primary and Specialty Care Services
In order to effectively evaluate type of service outcomes for Indiana’s HIP benefits, Lewin had a need for consistent definitions for primary care and specialty care. For both, primary care and specialty care, a visit was identified using the combination of member and date of service. Visits were identified for both primary care and specialty care using claims that were paid and non-voided professional medical claims. Additional criteria were specific to primary care or specialty care.
For additional criteria specific to primary care, Lewin chose to use the national standard definition established by the Centers for Medicare & Medicaid Services (CMS) for Medicare claims processing for primary care claims under the Affordable Care Act as indicated in the CMS Manual System, Pub 100-04 Medicare Claims Processing, Transmittal 2161, Change Request 7060. CMS specifies a limited set of services eligible to be counted as primary care, based on evaluation and management (E&M) current procedural terminology (CPT) codes. CMS also specifies a set of providers to identify as delivering primary care; including, family practitioners, general practitioners, geriatric practitioners, internists, general internists, pediatricians, general pediatricians, pediatric nurse practitioners, family nurse practitioners, nurse practitioners (other), and physician assistants. Because of the nature of working with a Medicaid population, Lewin also included providers with specialties of obstetrics/gynecology, obstetric nurse practitioner, rural health clinic (RHC), and federally qualified health clinic (FQHC). Additionally, by definition primary care is not referral or specialty care, so claims with referring providers were excluded from consideration as primary care.
Specialty care was defined as services requiring a referral for medical services rendered by a physician in an office, clinic, or mental health setting. Allied health professionals (i.e. physical therapists, paramedics, etc.) were excluded, as were the primary care specialties indicated above. The claims had to have a referring provider or the provider had to be a psychiatrist in order to be counted as specialty care. This was consistent with the way specialty care benefits were administered to HIP recipients.