state of california • department of transportation ...2... · state of california • department...
TRANSCRIPT
TR0003 (REV 10/98)TECHNICAL REPORT DOCUMENTATION PAGESTATE OF CALIFORNIA • DEPARTMENT OF TRANSPORTATION
Reproduction of completed page authorized.
CA14-1912
1. REPORT NUMBER 2. GOVERNMENT ASSOCIATION NUMBER 3. RECIPIENT'S CATALOG NUMBER
Cascading Failures: Earthquake Threats to Transportation and Utilities4. TITLE AND SUBTITLE
December 2014
5. REPORT DATE
6. PERFORMING ORGANIZATION CODE
Michael Germeraad -- Association of Bay Area Governments
7. AUTHOR
P14001EQK
8. PERFORMING ORGANIZATION REPORT NO.
Association of Bay Area Governments Mailing Address: P.O. Box 2050 -- Oakland, CA 94604-2050 Location: Joseph P. Bort MetroCenter -- Eighth and Oak Streets, Oakland, CA Phone: (510) 464-7900 -- Fax: (510) 464-7979 Website: http://abag.ca.gov/
9. PERFORMING ORGANIZATION NAME AND ADDRESS
3762
10. WORK UNIT NUMBER
65A0448
11. CONTRACT OR GRANT NUMBER
California Department of Transportation Division of Research, Innovation and System Information, MS-83 P.O. Box 942873 Sacramento, CA 94273-0001
12. SPONSORING AGENCY AND ADDRESSFinal Report 6/1/12 to 9/30/14
13. TYPE OF REPORT AND PERIOD COVERED
14. SPONSORING AGENCY CODE
15. SUPPLEMENTARY NOTES
The operability of airports following a major earthquake is dependent upon minimal facility damage and functioning infrastructure systems. The immediate operation of airports provide valuable air functions during disaster response, and are a necessity for quick recovery of societal and economic functions. The San Francisco Bay Area is fortunate to have 24 public airports (Oakland International and North Field are considered separate), one federal airport, and one military airport which together provide a redundant network of runways across the nine county region. This network however, will be stressed by a major hazard event. This report maps airports, roadways, passenger rail, fuel, electric, and water systems, and highlights their interaction with seismic hazards. Publicly available information is used to describe each system to gain a high-level understanding of how the system operates, and the potential consequence should the system be damaged. The report does not state specific restoration timelines nor damage estimates, but does reference restoration timelines experienced in past comparable events. Instead, the report focuses on the seismic exposure of many systems and their significant consequence for airports and other stakeholders. The key findings warrant keen attention from regional and state actors.
16. ABSTRACT
Airport, Emergency Response, Resiliency Planning17. KEY WORDS
No restrictions. This document is available to the public through the National Technical Information Service, Springfield, VA 22161
18. DISTRIBUTION STATEMENT
Unclassified.
19. SECURITY CLASSIFICATION (of this report)
54
20. NUMBER OF PAGES 21. COST OF REPORT CHARGED
ADA Notice For individuals with sensory disabilities, this document is available in alternate formats. For alternate format information, contact the Forms Management Unit at (916) 445-1233, TTY 711, or write to Records and Forms Management, 1120 N Street, MS-89, Sacramento, CA 95814.
DISCLAIMER STATEMENT
This document is disseminated in the interest of information exchange. The contents of this
report reflect the views of the authors who are responsible for the facts and accuracy of the data
presented herein. The contents do not necessarily reflect the official views or policies of the State
of California or the Federal Highway Administration. This publication does not constitute a
standard, specification or regulation. This report does not constitute an endorsement by the
Department of any product described herein.
For individuals with sensory disabilities, this document is available in alternate formats. For
information, call (916) 654-8899, TTY 711, or write to California Department of Transportation,
Division of Research, Innovation and System Information, MS-83, P.O. Box 942873,
Sacramento, CA 94273-0001.
Cascading Failures: Earthquake Threats to Transportation and Utilities
December 2014ASSOCIATION OF BAY AREA GOVERNMENTS

[this page is intentionally blank]
Cascading Failures: Earthquake Threats to Transportation and Utilities
December 2014
Association of Bay Area GovernmentsMailing Address: P.O. Box 2050 -- Oakland, CA 94604-2050
Location: Joseph P. Bort MetroCenter -- Eighth and Oak Streets, Oakland, CAPhone: (510) 464-7900 -- Fax: (510) 464-7979
Website: http://resilience.abag.ca.gov/
Publication Number: P14001EQK
ASSOCIATION OF BAY AREA GOVERNMENTS EXECUTIVE BOARD AND STAFF*Julie Pierce -- ABAG President, Councilmember, City of ClaytonDavid Rabbitt -- ABAG Vice President, Supervisor, County of SonomaEzra Rapport -- ABAG Executive DirectorMiriam Chion -- ABAG Planning & Research Program Director
*The full list of board members is available online at: http://abag.ca.gov/overview/ExecBoard.html
CREDITSPrincipal Author and Graphics
Michael Germeraad -- Resilience Planner, ABAGCo-Authors
Danielle Mieler -- Resilience Program Coordinator, ABAGDana Brechwald -- Resilience Planner, ABAG
Project ConsultantArrietta Chakos -- Principal Founder, Urban Resilience Strategies
A special thanks to participants in our workshop series, interviewees, reviewers, and Technical Advisory Committee, who provided detailed input essential to the development of this report.
The contents of this report reflect the views of the author who is responsible for the facts and accuracy of the data presented herein. The contents do not necessarily reflect the official views or policies of the State of California or the Federal Highway Administration. This publication does not constitute a standard, specification or regulation.
©2014 California Department of TransportationContract #65A0448
Joseph Aguilar, Caltrans District 4Colette Armao, Caltrans Division of AeronauticsTerry Barrie, Caltrans Division of AeronauticsMarla Blagg, Bart PoliceBob Brown, U.S. Department of TransportationBob Braga, Caltrans, District 4Robert Buxton, GNS ScienceBill Cain, East Bay Municipal Water DistrictMatt Davis, Port of OaklandDavid Decoteau, Hayward Executive AirportCurt Eikerman, Mineta San Jose International AirportDarron Evans, Port of OaklandCarol Ford, Ford Aviation ConsultantsRob Forester, San Francisco International AirportKeith Freitas, Buchanan Field AirportJonathan Frisch, Pacific Gas & ElectricWendy Goodfriend, Bay Conservation Dev. Comm.Leander Hauri, Livermore Municipal AirportDiane Heinze, Port of OaklandAnne Henny, Oakland AirportCarl Honaker, Santa Clara County AirportsRobin Hunt, Federal Aviation AdministrationJerry Jakubauskas, Port of OaklandScarlett Lam, S.F. Municipal Transportation AgencyBeth Lee, Buchanan Field AirportHerby Lissade, CaltransLindy Lowe, Bay Conservation Dev. Comm.Paul Marshall, South County Airport Pilot Assoc.Toshia Marshall, San Francisco International Airport
Shawn Matz, Federal Emer. Mgmt. Agcy., Region IXRobb Moss, Cal Poly San Luis ObispoPeter Murphy, Kinder MorganSteve Oetzell, Federal Aviation AdministrationEric Peterson, Santa Clara County Roads & AirportsRod Pharis, South County Pilots Association Joshua Polston, Port of OaklandEmery Roe, UC BerkeleyDanielle Ross, San Jose International AirportChris Salkeld, AT&TJohn Sanders, Aries ConsultantsLori Schandel, Sonoma County AirportGordon Schremp, California Energy CommissionNancy Smith, California Office of Emergency Services Doreen Stockdale, Napa County AirportJon Stout, Sonoma County AirportBob Tucknott, Alameda County Sheriff's Air SquadronNoah Tunic, Metropolitan Transportation Comm.Jim Turner, California Resiliency AllianceRaymond Trinh, Pacific Gas & ElectricSR Uma, GNS ScienceMichael Velasquez, Pacific Gas & ElectricToni Warner, Hollister AirportMatthew Weisman, Alameda Cnty. Sheriff Air SquadronMaggie Wenger, Bay Conservation Dev. Comm.Andy Wilson, California Pilots AssociationRayvon Williams, City of WatsonvilleRoy Williams, Moffett Federal AirfieldRosalyn Q. Yu, S.F. International Airport
TABLE OF CONTENTS
2 Executive Summary 4 Chapter 1: Introduction 7 Chapter 2: Earthquake Hazards & Scenarios
8 Sidebar 1: Surface Fault Rupture Over Time: Hayward Example10 Figure 1: Liquefaction Susceptibility11 Figure 2: San Andreas M7.9 Scenario12 Figure 3: Hayward M7.0 Scenario13 Figure 4: Concord M6.8 Scenario
15 Chapter 3: Airports16 Figure 5: Bay Area International & General Aviation Airports17 Sidebar 2: M6.0 South Napa Earthquake
18 Chapter 4: Transportation - Roads & Passenger Rail19 Figure 6: Passenger Rail Layout & BART Service Restoration Following
M7.0 Hayward Event20 Sidebar 3: Bay Bridge Closure Impacts on Parallel Corridors21 Table 1: Completed Retrofits for all Bay Crossings.22 Figure 7: Liquefaction Susceptibility Along Major Bay Area Highways &
Two Corridor Studies.25 Chapter 5: Fuel System
25 Table 2: Estimated Daily Fuel Consumption for Commercial Passenger Flights (2007)
26 Figure 8: California Fuel Production and Use & the Bay Area’s Fuel Profile
27 Sidebar 4: Restoration Following the Richmond, CA Refinery Fire29 Figure 9: Regional Fuel Assets Exposed in Scenario Earthquake Shaking
& Liquefaction Zones31 Chapter 6: Electric System
32 Sidebar 5: 2013 Rim Fire Impact on Electrical Generation33 Figure 10: Electrical Generation for the 9 County Bay Area Region and Its
Exposure to Seismic Hazard36 Chapter 7: Water System
36 Table 3: Current & Projected Population Served & Water Demand37 Sidebar 6: Water System Failures in Urban Earthquakes39 Figure 11: Water System Source Portfolio (11 Largest Bay Area Water
Districts) & Annual Normal Supply40 Figure 12: Water Storage Within 9 County Regional & Normal Water
Demand42 Chapter 8: Interdependencies
43 Sidebar 7: Influence of Interdependencies on Expected Utility Restoration
45 Figure 13: Interdependencies of Infrastructure Systems, Specific to San Francisco - SF Lifelines Council
47 Appendix A PG&E Commercial Business Center
2 Association of Bay Area Governments
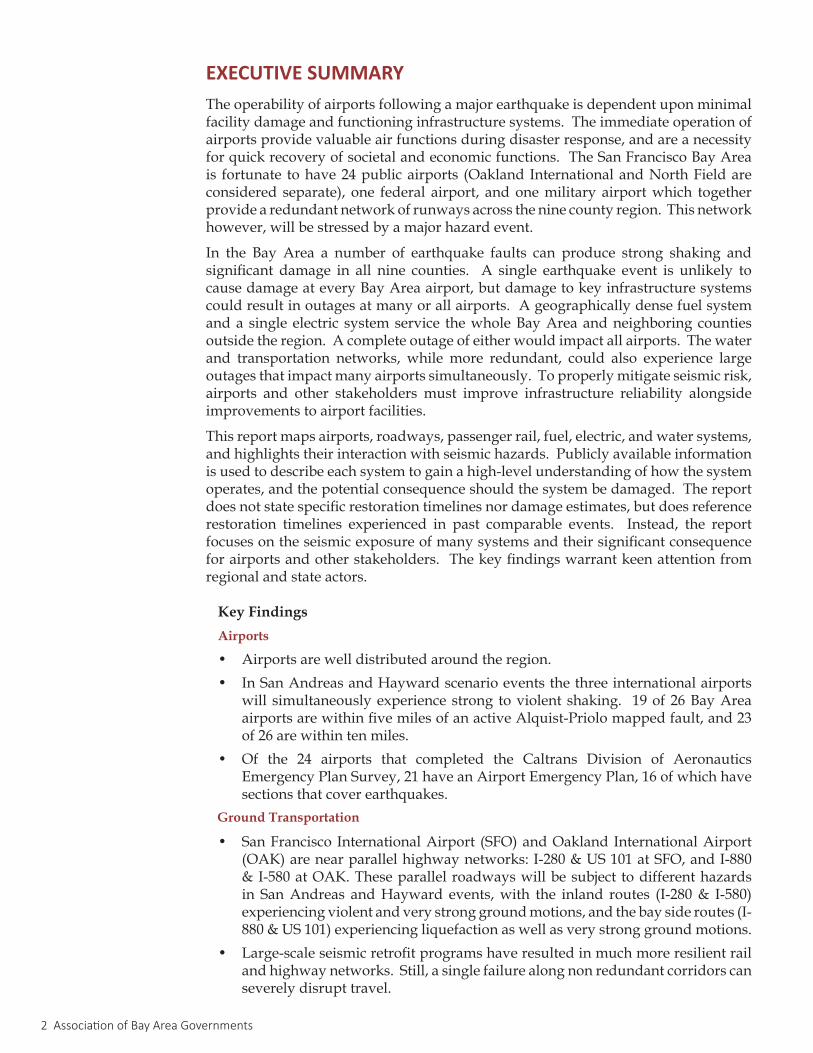
EXECUTIVE SUMMARYThe operability of airports following a major earthquake is dependent upon minimal facility damage and functioning infrastructure systems. The immediate operation of airports provide valuable air functions during disaster response, and are a necessity for quick recovery of societal and economic functions. The San Francisco Bay Area is fortunate to have 24 public airports (Oakland International and North Field are considered separate), one federal airport, and one military airport which together provide a redundant network of runways across the nine county region. This network however, will be stressed by a major hazard event.
In the Bay Area a number of earthquake faults can produce strong shaking and significant damage in all nine counties. A single earthquake event is unlikely to cause damage at every Bay Area airport, but damage to key infrastructure systems could result in outages at many or all airports. A geographically dense fuel system and a single electric system service the whole Bay Area and neighboring counties outside the region. A complete outage of either would impact all airports. The water and transportation networks, while more redundant, could also experience large outages that impact many airports simultaneously. To properly mitigate seismic risk, airports and other stakeholders must improve infrastructure reliability alongside improvements to airport facilities.
This report maps airports, roadways, passenger rail, fuel, electric, and water systems, and highlights their interaction with seismic hazards. Publicly available information is used to describe each system to gain a high-level understanding of how the system operates, and the potential consequence should the system be damaged. The report does not state specific restoration timelines nor damage estimates, but does reference restoration timelines experienced in past comparable events. Instead, the report focuses on the seismic exposure of many systems and their significant consequence for airports and other stakeholders. The key findings warrant keen attention from regional and state actors.
Key Findings
• Airports are well distributed around the region. • In San Andreas and Hayward scenario events the three international airports
will simultaneously experience strong to violent shaking. 19 of 26 Bay Area airports are within five miles of an active Alquist-Priolo mapped fault, and 23 of 26 are within ten miles.
• Of the 24 airports that completed the Caltrans Division of Aeronautics Emergency Plan Survey, 21 have an Airport Emergency Plan, 16 of which have sections that cover earthquakes.
• San Francisco International Airport (SFO) and Oakland International Airport (OAK) are near parallel highway networks: I-280 & US 101 at SFO, and I-880 & I-580 at OAK. These parallel roadways will be subject to different hazards in San Andreas and Hayward events, with the inland routes (I-280 & I-580) experiencing violent and very strong ground motions, and the bay side routes (I-880 & US 101) experiencing liquefaction as well as very strong ground motions.
• Large-scale seismic retrofit programs have resulted in much more resilient rail and highway networks. Still, a single failure along non redundant corridors can severely disrupt travel.
Airports
Ground Transportation
Infrastructure Vulnerability & Interdependency Study 3
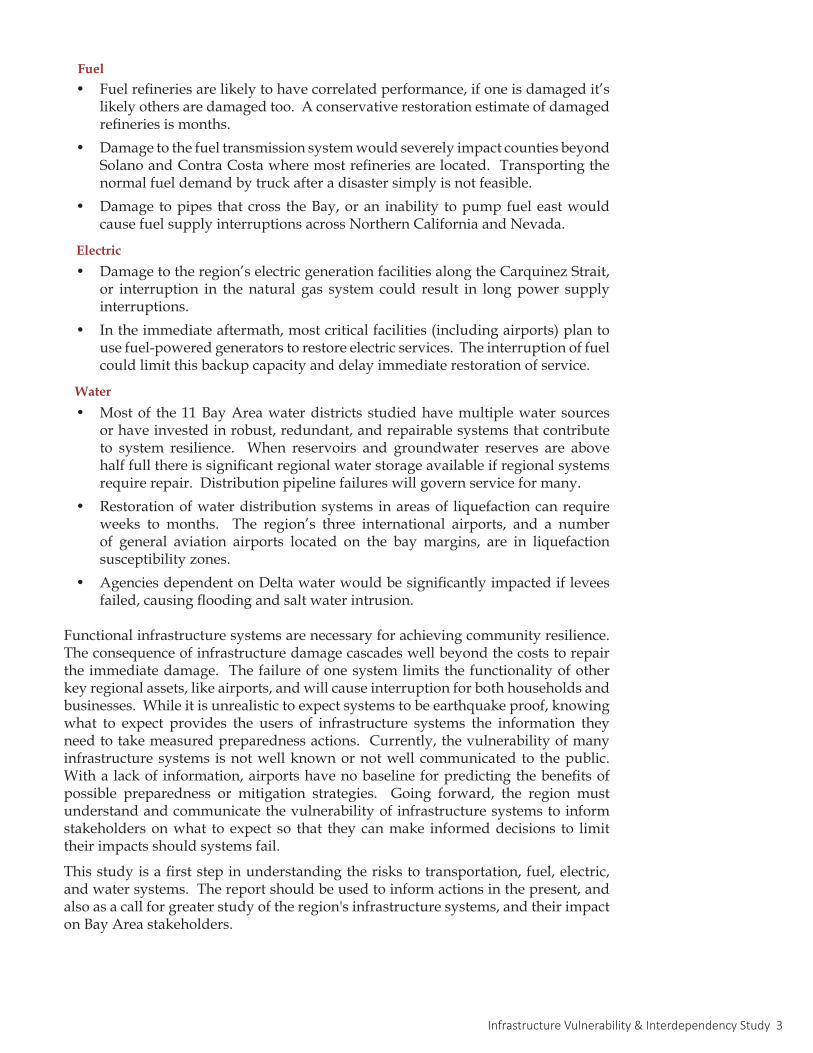
• Fuel refineries are likely to have correlated performance, if one is damaged it’s likely others are damaged too. A conservative restoration estimate of damaged refineries is months.
• Damage to the fuel transmission system would severely impact counties beyond Solano and Contra Costa where most refineries are located. Transporting the normal fuel demand by truck after a disaster simply is not feasible.
• Damage to pipes that cross the Bay, or an inability to pump fuel east would cause fuel supply interruptions across Northern California and Nevada.
• Damage to the region’s electric generation facilities along the Carquinez Strait, or interruption in the natural gas system could result in long power supply interruptions.
• In the immediate aftermath, most critical facilities (including airports) plan to use fuel-powered generators to restore electric services. The interruption of fuel could limit this backup capacity and delay immediate restoration of service.
• Most of the 11 Bay Area water districts studied have multiple water sources or have invested in robust, redundant, and repairable systems that contribute to system resilience. When reservoirs and groundwater reserves are above half full there is significant regional water storage available if regional systems require repair. Distribution pipeline failures will govern service for many.
• Restoration of water distribution systems in areas of liquefaction can require weeks to months. The region’s three international airports, and a number of general aviation airports located on the bay margins, are in liquefaction susceptibility zones.
• Agencies dependent on Delta water would be significantly impacted if levees failed, causing flooding and salt water intrusion.
Functional infrastructure systems are necessary for achieving community resilience. The consequence of infrastructure damage cascades well beyond the costs to repair the immediate damage. The failure of one system limits the functionality of other key regional assets, like airports, and will cause interruption for both households and businesses. While it is unrealistic to expect systems to be earthquake proof, knowing what to expect provides the users of infrastructure systems the information they need to take measured preparedness actions. Currently, the vulnerability of many infrastructure systems is not well known or not well communicated to the public. With a lack of information, airports have no baseline for predicting the benefits of possible preparedness or mitigation strategies. Going forward, the region must understand and communicate the vulnerability of infrastructure systems to inform stakeholders on what to expect so that they can make informed decisions to limit their impacts should systems fail.
This study is a first step in understanding the risks to transportation, fuel, electric, and water systems. The report should be used to inform actions in the present, and also as a call for greater study of the region's infrastructure systems, and their impact on Bay Area stakeholders.
Fuel
Electric
Water
4 Association of Bay Area Governments
A future large earthquake will impact the entire Bay Area region. Ground shaking near
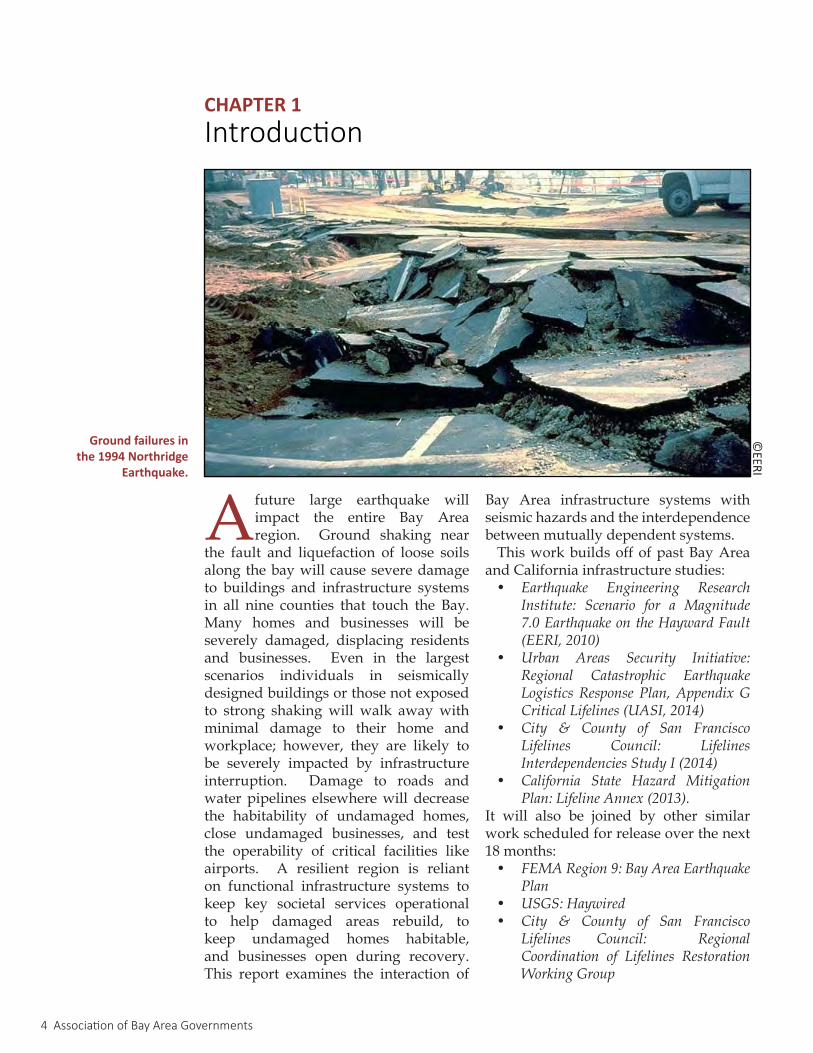
the fault and liquefaction of loose soils along the bay will cause severe damage to buildings and infrastructure systems in all nine counties that touch the Bay. Many homes and businesses will be severely damaged, displacing residents and businesses. Even in the largest scenarios individuals in seismically designed buildings or those not exposed to strong shaking will walk away with minimal damage to their home and workplace; however, they are likely to be severely impacted by infrastructure interruption. Damage to roads and water pipelines elsewhere will decrease the habitability of undamaged homes, close undamaged businesses, and test the operability of critical facilities like airports. A resilient region is reliant on functional infrastructure systems to keep key societal services operational to help damaged areas rebuild, to keep undamaged homes habitable, and businesses open during recovery. This report examines the interaction of
Bay Area infrastructure systems with seismic hazards and the interdependence between mutually dependent systems.
This work builds off of past Bay Area and California infrastructure studies:• Earthquake Engineering Research
Institute: Scenario for a Magnitude7.0EarthquakeontheHaywardFault(EERI,2010)
• Urban Areas Security Initiative:Regional Catastrophic EarthquakeLogisticsResponsePlan,AppendixGCriticalLifelines(UASI,2014)
• City & County of San FranciscoLifelines Council: LifelinesInterdependenciesStudyI(2014)
• California State Hazard MitigationPlan:LifelineAnnex(2013).
It will also be joined by other similar work scheduled for release over the next 18 months:• FEMARegion9:BayAreaEarthquake
Plan• USGS:Haywired• City & County of San Francisco
Lifelines Council: RegionalCoordination of Lifelines RestorationWorkingGroup
CHAPTER 1Introduction
Ground failures in the 1994 Northridge
Earthquake.
©EERI
Infrastructure Vulnerability & Interdependency Study 5
• City & County of San FranciscoLifelines Council: Post-Disaster FuelSuppliesWorkingGroup.
Infrastructure systems can be interrupted by any number of natural or manmade events. This study examines infrastructure systems through the lens of earthquakes. In past California earthquakes and recent global earthquakes infrastructure systems have been severely damaged, testing the resilience of regions. Earthquake hazards and three Bay Area earthquake scenarios are defined in:
• Chapter 2: Earthquake Hazards & Scenarios
While this assessment is focused on seismic events, the background research on each studied infrastructure system can be a resource to examine system performance in other hazard events.
The study draws from publically available data sets for each lifeline system, and when possible, provides a regionally complete perspective of the system. The information presented will be a useful tool for a number of Bay Area stakeholders, but Bay Area airports are the primary audience for this report. The 25 airports in the region are geographically distributed and are unlikely to all be damaged in a single event, but these regional air assets are all reliant on the same infrastructure systems which are vulnerable to interruption in a future earthquake. Airports and individuals are directly reliant on a number of publically and privately provided infrastructure services to maintain operability. The study focuses on:
• Chapter 3: Airports• Chapter 4: Transportation - Roads
& Passenger Rail• Chapter 5: Fuel System• Chapter 6: Electric System• Chapter 7: Water System.
This list is not a comprehensive review of all infrastructure systems but recognizes the limitations of a single study. Other systems deserving of future study are freight rail, natural gas, waste water, communications, and bio-fuels. In Chapters 3 through 7 individual systems
are overlaid regional earthquake scenarios identified in Chapter 2. A seismic vulnerability assessment of each system provides only an initial evaluation of system performance under earthquake loading.
Each system is dependent on other infrastructure systems which may have also been damaged. The interdependence between systems can result in cascading outages, an increased repair time, or can limit the utility of functional systems (i.e. functional roadways, but disrupted fuel system). Including study of the interdependence between lifeline systems reveals a more complete picture of system performance. These interactions are discussed in:
• Chapter 8: InterdependenciesGeographic Information System (GIS)
mapping, case studies, technical reports, planning documents, and interviews were used to develop profiles of the Bay Area’s infrastructure. GIS was used to map infrastructure systems and hazards, highlighting features of interaction. This analysis by itself provides an infrastructure exposure analysis. When fragility attributes about system components were known the analysis was expanded to consider these features. Case studies of past earthquakes and earthquake engineering research were used to highlight components of each system that were most likely to fail in various seismic hazard loadings, and to identify which system components were most likely to govern the restoration of each system. The likelihood of failure, time required to repair given failure, and consequence of failure were the attributes used to focus analysis on the most important system components. Lastly, interviews with experts who are familiar with the Bay Area’s infrastructure and hazards provided additional knowledge into the past performance of infrastructure, their dependence on other systems, and expert guidance.
6 Association of Bay Area Governments
ReferencesCity & County of San Francisco. (2014). Lifelines Interdependency Study I Report. City &
County of San Francisco, Office of the City Administrator. April 17, 2014.EERI. (2010). The Coming Bay Area Earthquake: 2010 Update of Scenario for a Magnitude 7.0
Earthquake on the Hayward Fault. Earthquake Engineering Research Institute Northern California Chapter.
Moss, R.E.S., Germeraad, M., and Topping, K. (2013). Lifelines Annex to the 2013 California State multi-Hazard Mitigation Plan. http://hazardmitigation.calema.ca.gov/plan/state_multi-hazard_mitigation_plan_shmp
UASI. (2013). Regional Catastrophic Earthquake Logistics Response Plan: Annex to the San Francisco Bay Area Regional Emergency Coordination Plan: Appendix G Critical Lifelines. Bay Area Urban Area Security Initiative. February 2014.
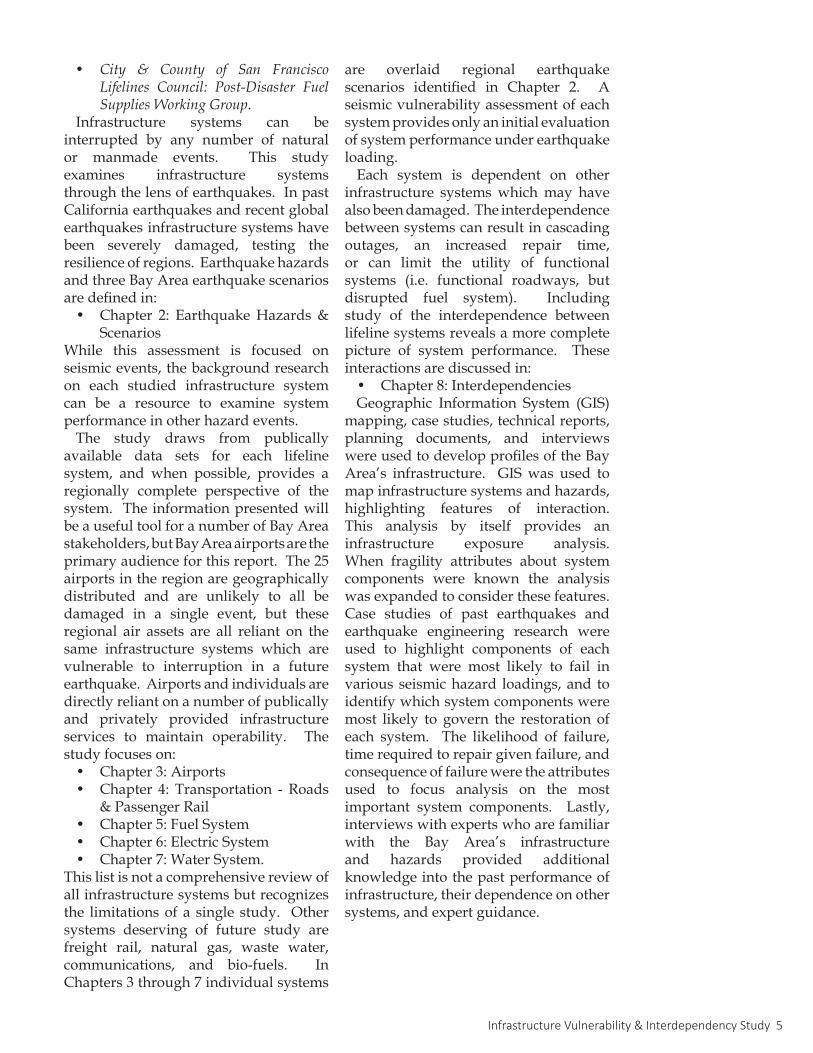
A community without water and wastewater
service following the 1994 Northridge
earthquake relied on portable water and
wastewater stations to service resident
needs.
©BAREPP, 1994
Infrastructure Vulnerability & Interdependency Study 7
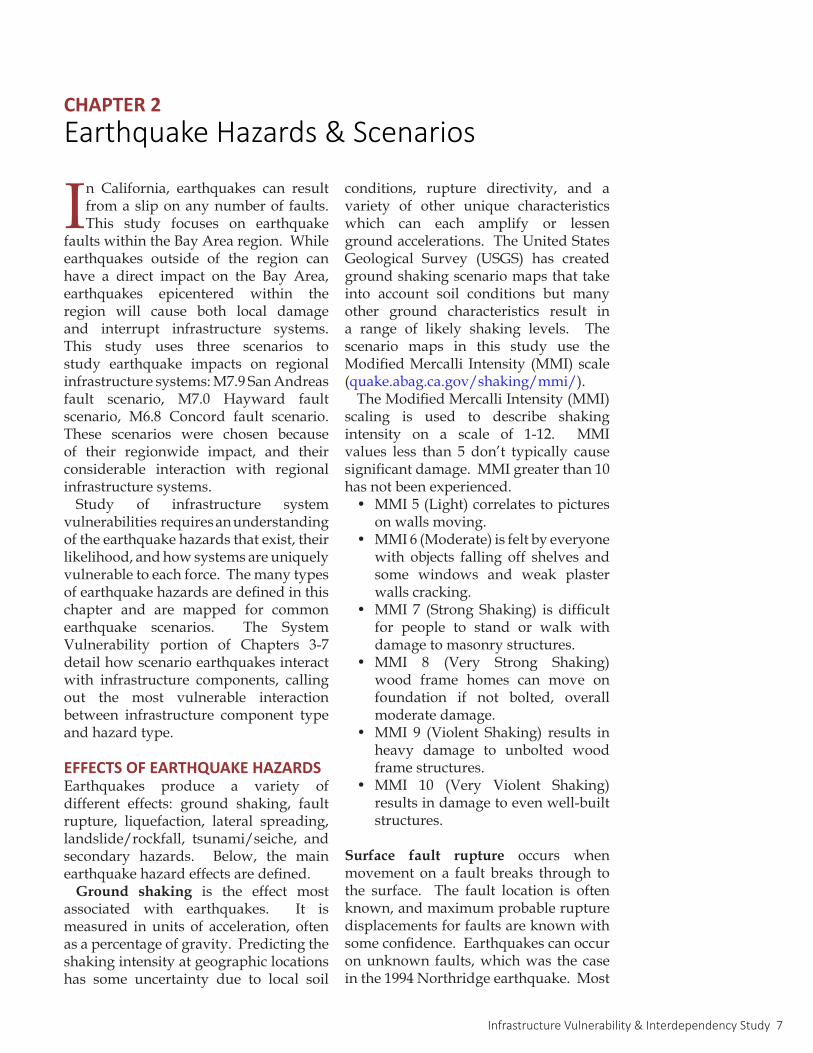
In California, earthquakes can result from a slip on any number of faults. This study focuses on earthquake
faults within the Bay Area region. While earthquakes outside of the region can have a direct impact on the Bay Area, earthquakes epicentered within the region will cause both local damage and interrupt infrastructure systems. This study uses three scenarios to study earthquake impacts on regional infrastructure systems: M7.9 San Andreas fault scenario, M7.0 Hayward fault scenario, M6.8 Concord fault scenario. These scenarios were chosen because of their regionwide impact, and their considerable interaction with regional infrastructure systems.
Study of infrastructure system vulnerabilities requires an understanding of the earthquake hazards that exist, their likelihood, and how systems are uniquely vulnerable to each force. The many types of earthquake hazards are defined in this chapter and are mapped for common earthquake scenarios. The System Vulnerability portion of Chapters 3-7 detail how scenario earthquakes interact with infrastructure components, calling out the most vulnerable interaction between infrastructure component type and hazard type.
EFFECTS OF EARTHQUAKE HAZARDSEarthquakes produce a variety of different effects: ground shaking, fault rupture, liquefaction, lateral spreading, landslide/rockfall, tsunami/seiche, and secondary hazards. Below, the main earthquake hazard effects are defined.
Ground shaking is the effect most associated with earthquakes. It is measured in units of acceleration, often as a percentage of gravity. Predicting the shaking intensity at geographic locations has some uncertainty due to local soil
conditions, rupture directivity, and a variety of other unique characteristics which can each amplify or lessen ground accelerations. The United States Geological Survey (USGS) has created ground shaking scenario maps that take into account soil conditions but many other ground characteristics result in a range of likely shaking levels. The scenario maps in this study use the Modified Mercalli Intensity (MMI) scale (quake.abag.ca.gov/shaking/mmi/).
The Modified Mercalli Intensity (MMI) scaling is used to describe shaking intensity on a scale of 1-12. MMI values less than 5 don’t typically cause significant damage. MMI greater than 10 has not been experienced.
• MMI 5 (Light) correlates to pictures on walls moving.
• MMI 6 (Moderate) is felt by everyone with objects falling off shelves and some windows and weak plaster walls cracking.
• MMI 7 (Strong Shaking) is difficult for people to stand or walk with damage to masonry structures.
• MMI 8 (Very Strong Shaking) wood frame homes can move on foundation if not bolted, overall moderate damage.
• MMI 9 (Violent Shaking) results in heavy damage to unbolted wood frame structures.
• MMI 10 (Very Violent Shaking) results in damage to even well-built structures.
Surface fault rupture occurs when movement on a fault breaks through to the surface. The fault location is often known, and maximum probable rupture displacements for faults are known with some confidence. Earthquakes can occur on unknown faults, which was the case in the 1994 Northridge earthquake. Most
CHAPTER 2Earthquake Hazards & Scenarios
8 Association of Bay Area Governments
Bay Area faults are strike slip faults which result in a horizontal shifting of the ground. Some faults, like the Mt. Diablo Fault, are thrust faults and have vertical displacements. Surface fault rupture on either fault type typically occurs in two phases: co-seismic slip, which occurs during the earthquake, and post-seismic slip which is slip that continues for upwards of a year after the earthquake. Sidebar 1 (on this page) details the probabilistic fault rupture of the Hayward Fault over time.
Structures and infrastructure components can be severely damaged by fault rupture. When considering infrastructure systems it is important to know:
(1) Fault rupture displacement. Will the displacement damage or destroy crossing infrastructure during co-seismic slip or post-seismic slip? (2) Fault rupture length. Will fault rupture damage parallel infrastructure which cross the fault miles apart from one another? For parallel infrastructure systems, does rupture break both links?
In large San Andreas events the surface fault rupture displacement can be upwards of 25 feet. In smaller events on the San Andreas, or other Bay Area faults the displacement can still be as large as 5 to 10 feet (Aagarrd, 2012; Thatcher 1997).
Ground failure, liquefaction, lateral spreading, landslide, and rockfalls, have also been mapped with varying levels of uncertainty by the USGS. Liquefaction occurs at sites that have “loose” unconsolidated sand and silt soil saturated with water, which are common near existing or historic water features. For liquefaction to occur, the site must be shaken long and hard enough by the earthquake (ABAG, 2001). Liquefaction can result in uneven ground settlement and loss of soil strength which can cause building foundations to sink.
Lateral spreading occurs when a layer of gently sloping ground at the surface is carried down the slope on an underlying layer of liquefied material (ABAG, 2001). Similarly, earthquake-induced landslides
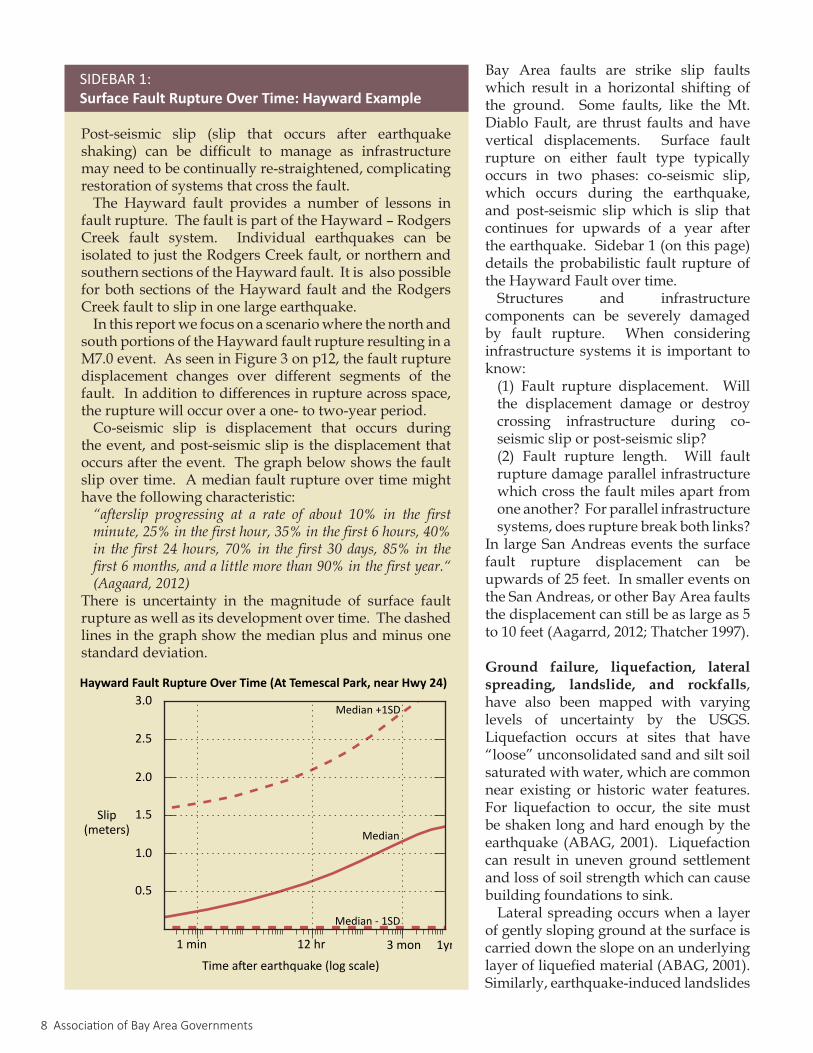
Post-seismic slip (slip that occurs after earthquake shaking) can be difficult to manage as infrastructure may need to be continually re-straightened, complicating restoration of systems that cross the fault.
The Hayward fault provides a number of lessons in fault rupture. The fault is part of the Hayward – Rodgers Creek fault system. Individual earthquakes can be isolated to just the Rodgers Creek fault, or northern and southern sections of the Hayward fault. It is also possible for both sections of the Hayward fault and the Rodgers Creek fault to slip in one large earthquake.
In this report we focus on a scenario where the north and south portions of the Hayward fault rupture resulting in a M7.0 event. As seen in Figure 3 on p12, the fault rupture displacement changes over different segments of the fault. In addition to differences in rupture across space, the rupture will occur over a one- to two-year period.
Co-seismic slip is displacement that occurs during the event, and post-seismic slip is the displacement that occurs after the event. The graph below shows the fault slip over time. A median fault rupture over time might have the following characteristic:“afterslip progressing at a rate of about 10% in the firstminute,25%inthefirsthour,35%inthefirst6hours,40%in thefirst24hours,70%in thefirst30days,85%in thefirst6months,andalittlemorethan90%inthefirstyear.“(Aagaard,2012)
There is uncertainty in the magnitude of surface fault rupture as well as its development over time. The dashed lines in the graph show the median plus and minus one standard deviation.
SIDEBAR 1: Surface Fault Rupture Over Time: Hayward Example
0.5
1.0
1.5
2.0
2.5
3.0
1 min 12 hr 3 monTime after earthquake (log scale)
Slip(meters)
Hayward Fault Rupture Over Time (At Temescal Park, near Hwy 24)
Median
Median +1SD
Median - 1SD
1yr
Infrastructure Vulnerability & Interdependency Study 9
and rockfalls occur when the stability of slopes are disturbed by ground shaking. Infrastructure that crosses ground failures both above and below ground can be broken by movements in the soil. Some below ground components (pipes, conduit boxes, tanks, etc.) may also float if the soil liquefies and they are less dense than the surrounding water-saturated soil.
Tsunamis and seiches are most likely to be caused by distant earthquakes, like the 2011 Tohoku, Japan earthquake or 1964 Alaska earthquake. They can also be caused by local earthquake faults that cause above- or under-water landslides that displace large amounts of water. Faults that pass underwater could also produce tsunamis if their rupture has a vertical component. Tsunamis are caused by the displacement of a large volume of water that then travels rapidly until it reaches a shoreline, often innundating the coastline. Seiches occur on lakes and rivers and cause water to oscillate which can result in innundation and waves.
The USGS studied the predicted impact of a M9.1 Alaska earthquake and its tsunami on California (USGS, 2013). The scenario results in damage to the Bay Area ocean coast and bay shores, but the bay shoreline is expected to have less damage than the ocean coasts of California. For this tsunami event the maximum tsunami height is 2.9 ± 0.9 ft occuring along San Francisco’s bay shoreline and along the East Bay from Oakland to Richmond. Port and marina damage are expected, but not of a catastrophic scale. Lifelines along the Bay are likely to be impacted due to both flooding and strong water velocities in channels and ports (USGS, 2013). Small tsunamis can be caused within the bay by local fault rupture with vertical characteristics, and slides displacing water.
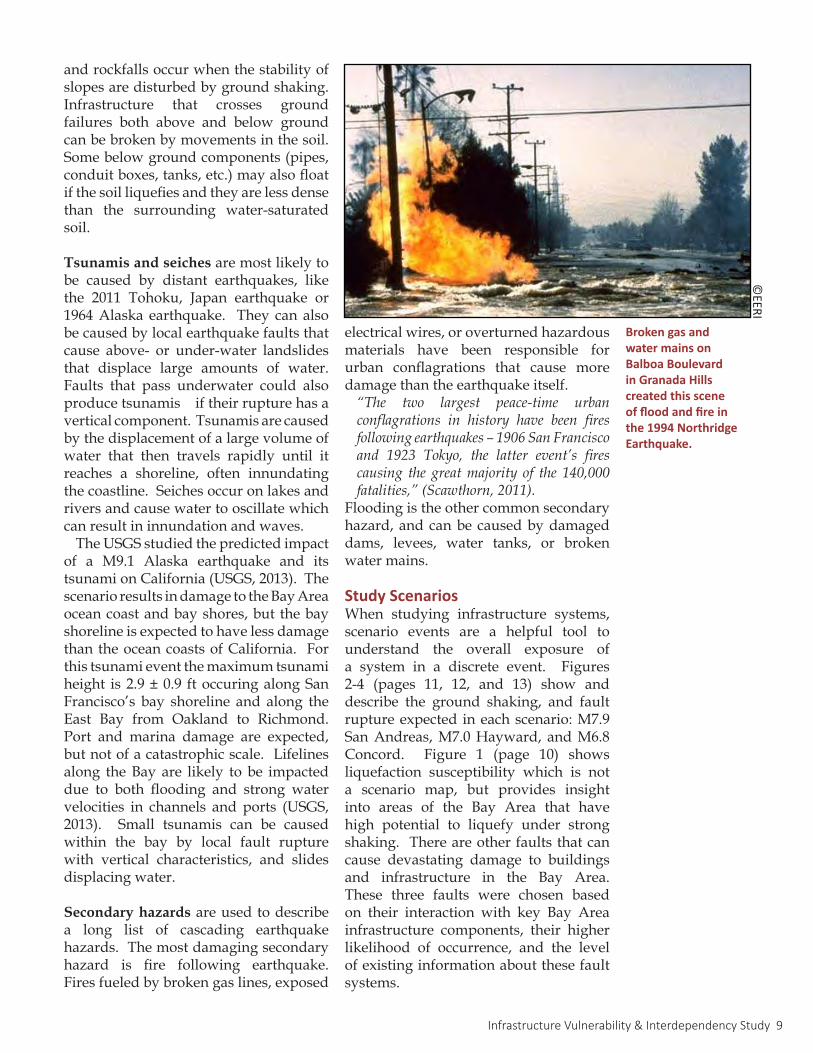
Secondary hazards are used to describe a long list of cascading earthquake hazards. The most damaging secondary hazard is fire following earthquake. Fires fueled by broken gas lines, exposed
electrical wires, or overturned hazardous materials have been responsible for urban conflagrations that cause more damage than the earthquake itself. “The two largest peace-time urbanconflagrations in history have been firesfollowingearthquakes–1906SanFranciscoand 1923 Tokyo, the latter event’s firescausing thegreatmajority of the 140,000fatalities,”(Scawthorn,2011).
Flooding is the other common secondary hazard, and can be caused by damaged dams, levees, water tanks, or broken water mains.
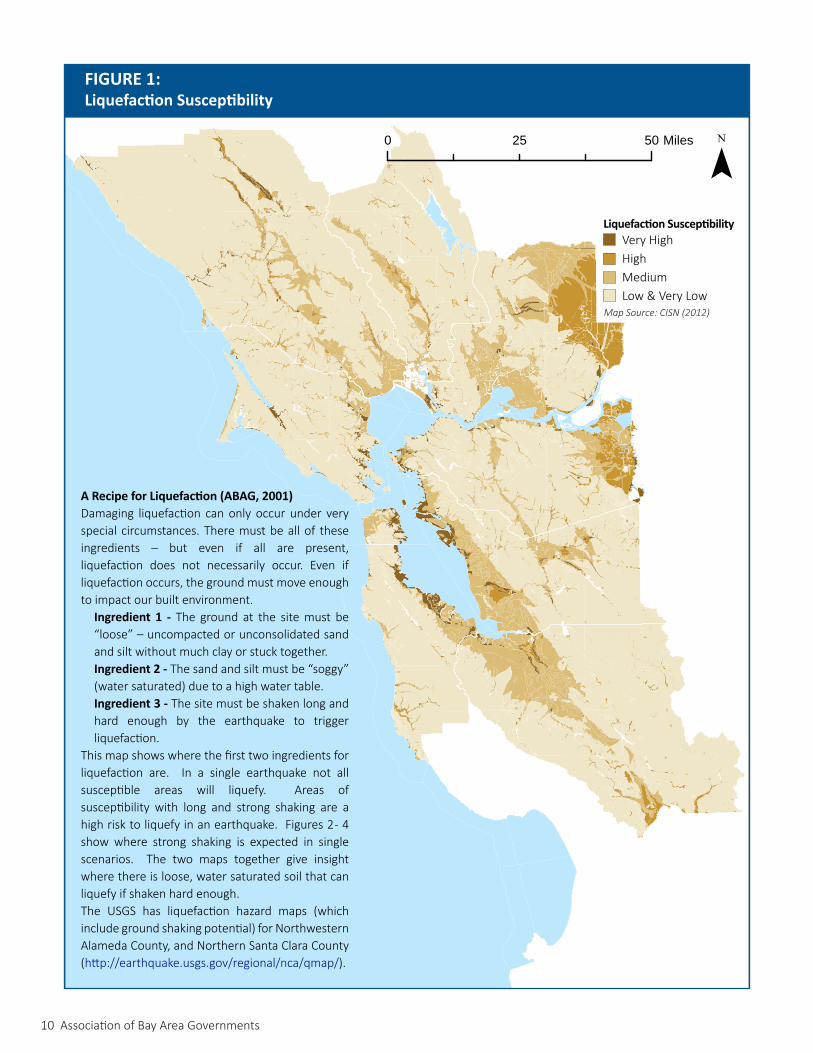
Study ScenariosWhen studying infrastructure systems, scenario events are a helpful tool to understand the overall exposure of a system in a discrete event. Figures 2-4 (pages 11, 12, and 13) show and describe the ground shaking, and fault rupture expected in each scenario: M7.9 San Andreas, M7.0 Hayward, and M6.8 Concord. Figure 1 (page 10) shows liquefaction susceptibility which is not a scenario map, but provides insight into areas of the Bay Area that have high potential to liquefy under strong shaking. There are other faults that can cause devastating damage to buildings and infrastructure in the Bay Area. These three faults were chosen based on their interaction with key Bay Area infrastructure components, their higher likelihood of occurrence, and the level of existing information about these fault systems.
©EERI
Broken gas and water mains on Balboa Boulevard in Granada Hills created this scene of flood and fire in the 1994 Northridge Earthquake.
10 Association of Bay Area Governments
0 5025 Miles
FIGURE 1:Liquefaction Susceptibility
Very HighHighMedium Low & Very Low
Liquefaction Susceptibility
A Recipe for Liquefaction (ABAG, 2001)Damaging liquefaction can only occur under very special circumstances. There must be all of these ingredients – but even if all are present, liquefaction does not necessarily occur. Even if liquefaction occurs, the ground must move enough to impact our built environment.
Ingredient 1 - The ground at the site must be “loose” – uncompacted or unconsolidated sand and silt without much clay or stuck together. Ingredient 2 - The sand and silt must be “soggy” (water saturated) due to a high water table.Ingredient 3 - The site must be shaken long and hard enough by the earthquake to trigger liquefaction.
This map shows where the first two ingredients for liquefaction are. In a single earthquake not all susceptible areas will liquefy. Areas of susceptibility with long and strong shaking are a high risk to liquefy in an earthquake. Figures 2 - 4 show where strong shaking is expected in single scenarios. The two maps together give insight where there is loose, water saturated soil that can liquefy if shaken hard enough.The USGS has liquefaction hazard maps (which include ground shaking potential) for Northwestern Alameda County, and Northern Santa Clara County (http://earthquake.usgs.gov/regional/nca/qmap/).
Map Source: CISN (2012)
Infrastructure Vulnerability & Interdependency Study 11
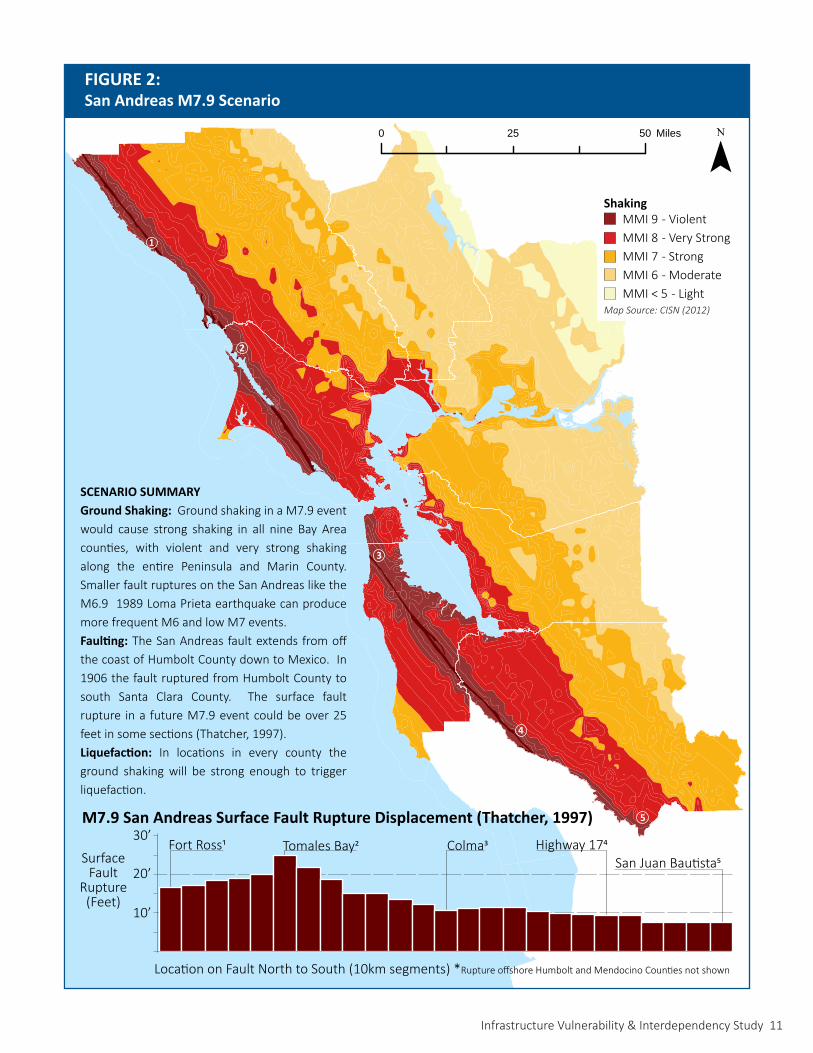
FIGURE 2:San Andreas M7.9 Scenario
MMI 9 - ViolentMMI 8 - Very StrongMMI 7 - StrongMMI 6 - ModerateMMI < 5 - Light
Shaking
SCENARIO SUMMARYGround Shaking: Ground shaking in a M7.9 event would cause strong shaking in all nine Bay Area counties, with violent and very strong shaking along the entire Peninsula and Marin County. Smaller fault ruptures on the San Andreas like the M6.9 1989 Loma Prieta earthquake can produce more frequent M6 and low M7 events.Faulting: The San Andreas fault extends from off the coast of Humbolt County down to Mexico. In 1906 the fault ruptured from Humbolt County to south Santa Clara County. The surface fault rupture in a future M7.9 event could be over 25 feet in some sections (Thatcher, 1997). Liquefaction: In locations in every county the ground shaking will be strong enough to trigger liquefaction.
Miles50250
Map Source: CISN (2012)
Surface Fault
Rupture (Feet)
Location on Fault North to South (10km segments) *Rupture offshore Humbolt and Mendocino Counties not shown
Fort Ross1 Tomales Bay2 Colma3 Highway 174San Juan Bautista5
10’
30’
20’
M7.9 San Andreas Surface Fault Rupture Displacement (Thatcher, 1997)
1
2
4
5
3
12 Association of Bay Area Governments
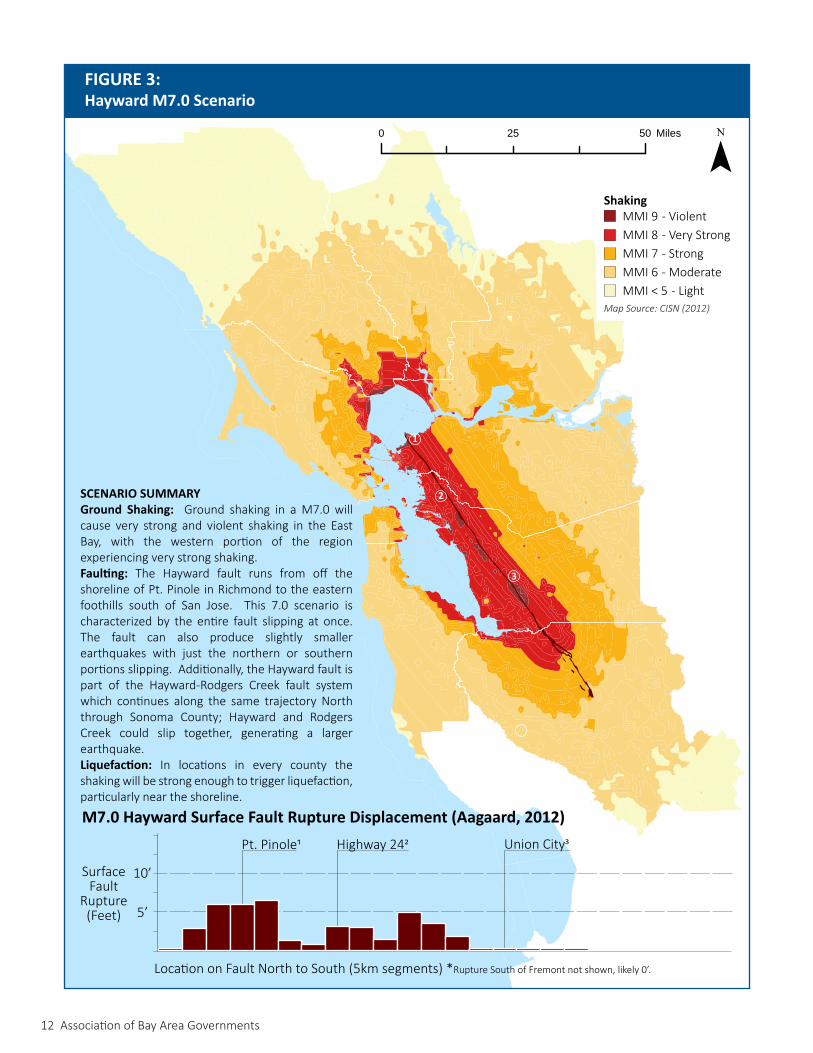
FIGURE 3:Hayward M7.0 Scenario
MMI 9 - ViolentMMI 8 - Very StrongMMI 7 - StrongMMI 6 - ModerateMMI < 5 - Light
Shaking
SCENARIO SUMMARYGround Shaking: Ground shaking in a M7.0 will cause very strong and violent shaking in the East Bay, with the western portion of the region experiencing very strong shaking. Faulting: The Hayward fault runs from off the shoreline of Pt. Pinole in Richmond to the eastern foothills south of San Jose. This 7.0 scenario is characterized by the entire fault slipping at once. The fault can also produce slightly smaller earthquakes with just the northern or southern portions slipping. Additionally, the Hayward fault is part of the Hayward-Rodgers Creek fault system which continues along the same trajectory North through Sonoma County; Hayward and Rodgers Creek could slip together, generating a larger earthquake. Liquefaction: In locations in every county the shaking will be strong enough to trigger liquefaction, particularly near the shoreline.
Miles50250
1
2
3
Surface Fault
Rupture (Feet)
Location on Fault North to South (5km segments) *Rupture South of Fremont not shown, likely 0’.
Pt. Pinole1 Highway 242 Union City3
5’
10’
M7.0 Hayward Surface Fault Rupture Displacement (Aagaard, 2012)
Map Source: CISN (2012)
Infrastructure Vulnerability & Interdependency Study 13
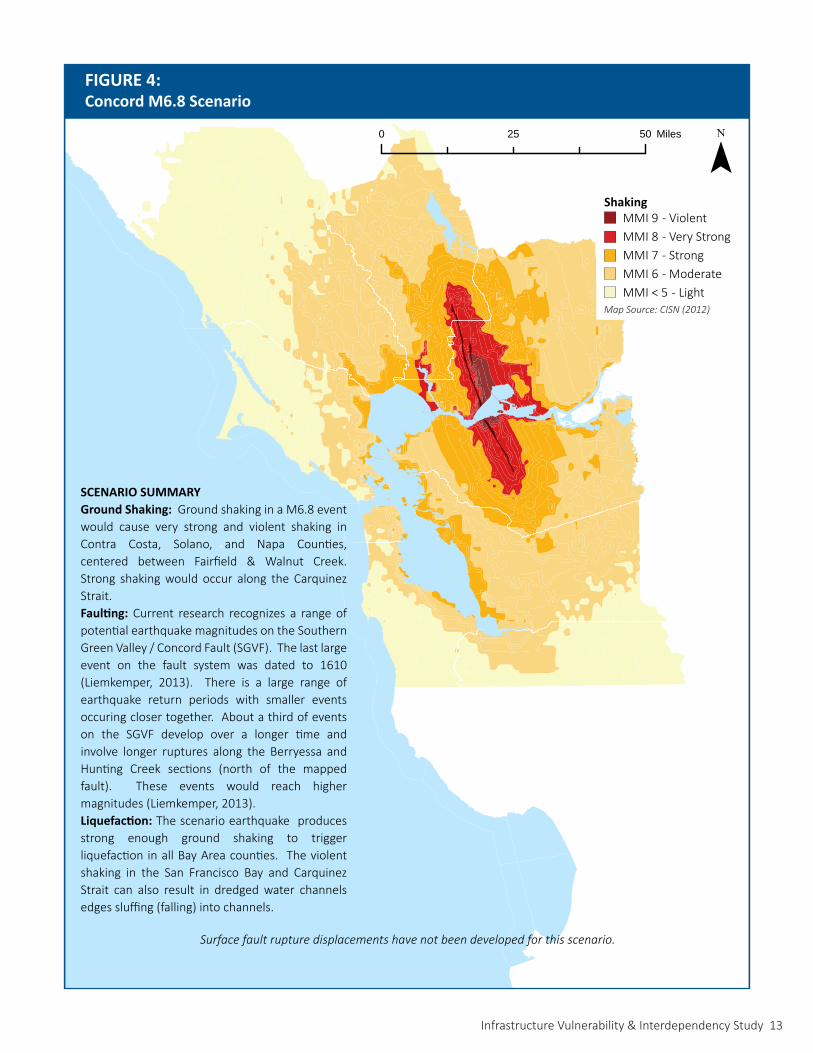
FIGURE 4:Concord M6.8 Scenario
MMI 9 - ViolentMMI 8 - Very StrongMMI 7 - StrongMMI 6 - ModerateMMI < 5 - Light
Shaking
SCENARIO SUMMARYGround Shaking: Ground shaking in a M6.8 event would cause very strong and violent shaking in Contra Costa, Solano, and Napa Counties, centered between Fairfield & Walnut Creek. Strong shaking would occur along the Carquinez Strait. Faulting: Current research recognizes a range of potential earthquake magnitudes on the Southern Green Valley / Concord Fault (SGVF). The last large event on the fault system was dated to 1610 (Liemkemper, 2013). There is a large range of earthquake return periods with smaller events occuring closer together. About a third of events on the SGVF develop over a longer time and involve longer ruptures along the Berryessa and Hunting Creek sections (north of the mapped fault). These events would reach higher magnitudes (Liemkemper, 2013). Liquefaction: The scenario earthquake produces strong enough ground shaking to trigger liquefaction in all Bay Area counties. The violent shaking in the San Francisco Bay and Carquinez Strait can also result in dredged water channels edges sluffing (falling) into channels.
Miles50250
Surface fault rupture displacements have not been developed for this scenario.
Map Source: CISN (2012)
14 Association of Bay Area Governments
ReferencesAagaard, B., Lienkaemper, J., Schwartz, D. (2012). Probabilistic Estimates of Surface Coseismic
Slip and Afterslip for Hayward Fault Earthquakes. Bulletin of the Seismological Soceity of America, Vol. 102, No.3 pp. 961-979. June 2012.
ABAG. (2001). The Real Dirt on Liquefaction. Association of Bay Area Governments. February 2001.
CISN. (2012). Earthquake Planning Scenarios. California Integrated Seismic Network. Retrieved From: http://www.cisn.org/shakemap/nc/shake/about.html#scenario
Lienkaemper, J., Baldwin, J., Turner, R., Sickler, R., Brown, J. (2013) A Record of Large Earthquakes During the Past Two Millennia on the Southern Green Valley Fault, California. Seismology Society of America, Vol. 103, No. 4 p 2386-2403. August 2013. Retrieved From: ftp://ehzftp.wr.usgs.gov/jlienk/reprints/GVF_BSSA2013.pdf
Scawthorn, C, 2011, Fire Following Earthquake Aspects of the Southern San Andreas Fault Mw 7.8 Earthquake Scenario, Earthquake Spectra Vol 27, Num 2
Thatcher W., Marshall, G., Lisowski, M., (1997) Resolution of Fault Slip Along the 470-km-long Rupture of the Great 1906 San Francisco Earthquake and its Implications. Journal of Geophysical Research. Vol. 102, No. B3, p. 5353-5367. March 10 1997.
USGS. (2013). The SAFRR (Science Application for Risk Reduction) Tsunami Scenario – Open File Report 2013-1170, California Geological Survey Special Report 229. U.S. Department of the Interior, U.S. Geological Survey.
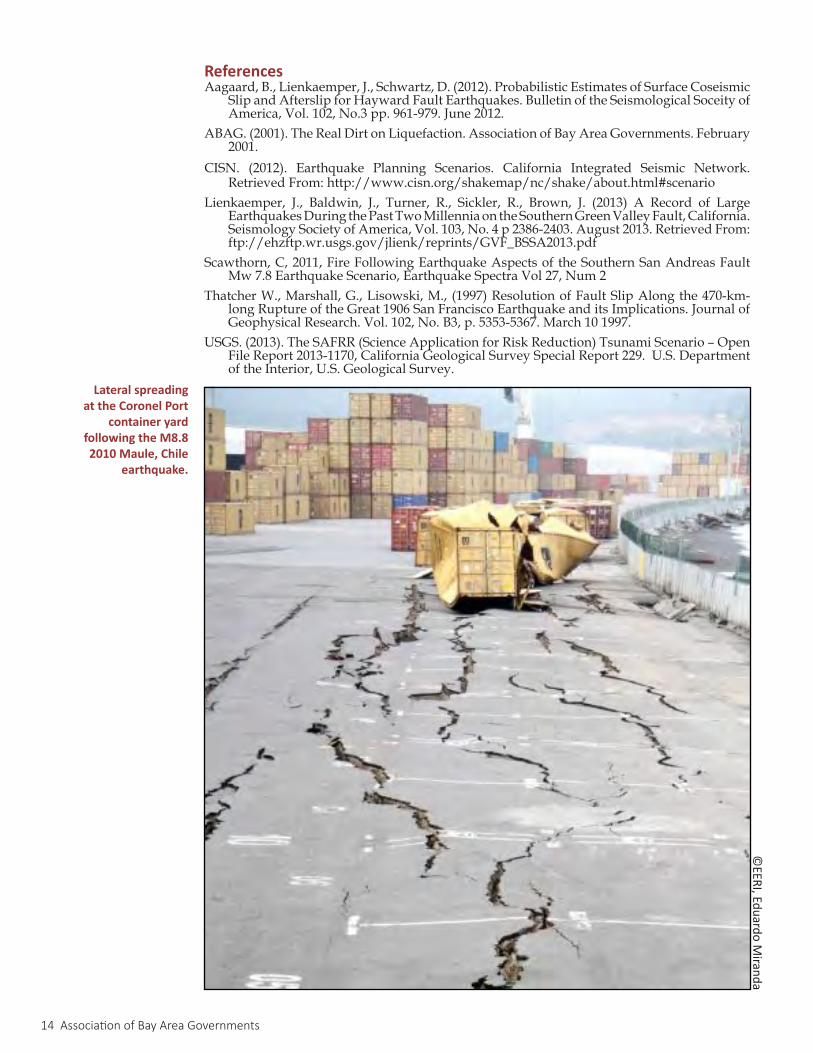
©EERI, Eduardo M
iranda
Lateral spreading at the Coronel Port
container yard following the M8.8 2010 Maule, Chile
earthquake.
Infrastructure Vulnerability & Interdependency Study 15
Bay Area airports provide residents and businesses the ability to travel and conduct business across
the globe. The airports support the regional economy by providing airport sector jobs, economic access to domestic and global markets, air cargo services, and tourism access. Among the many important every day benefits of Bay Area airports, after a major earthquake they become key nodes to support both the response and recovery of the region. The accompanying report, RolesofAirportsinRegional Disasters (2013) highlights the important resource airports provide in both short-term disaster recovery and long-term economic recovery of the Bay Area region.
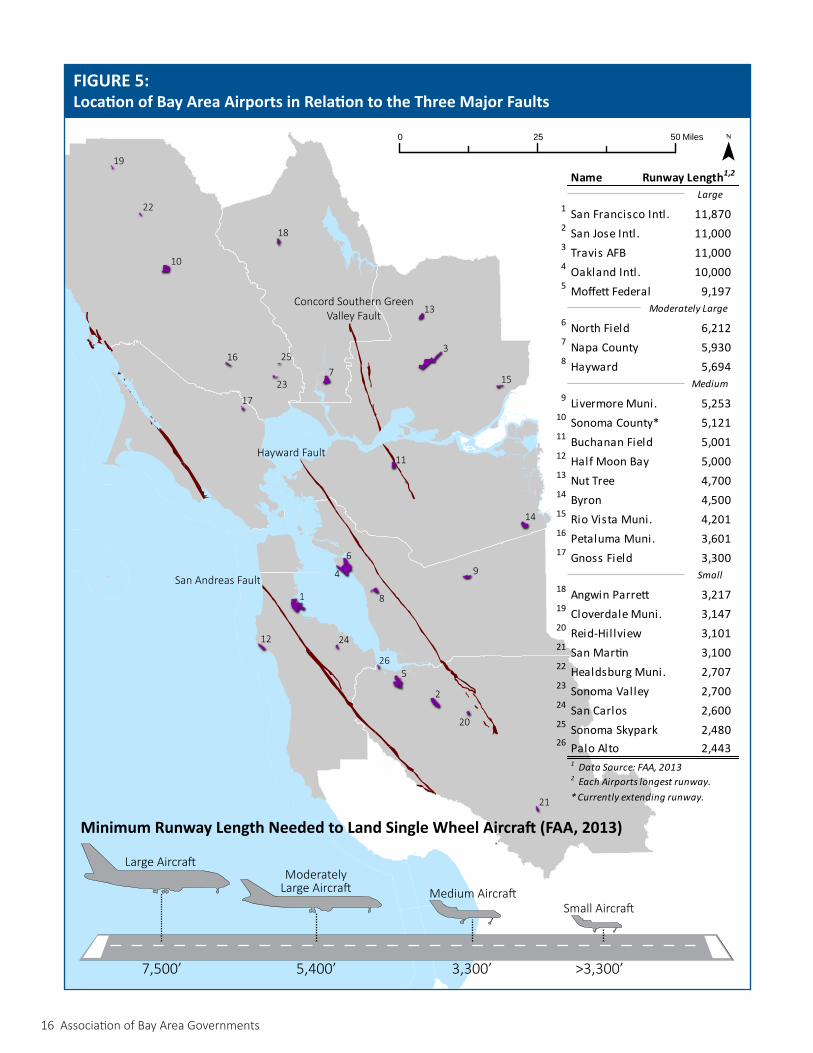
In the Bay Area there are 24 public use airports, one federal airport, and one military airport. Three of the public use airports have international service. The airports are well distributed throughout the region, with airports in all counties except San Francisco. Twelve of the airports are within 1.5 miles of Highway 101 along the 175 miles between Cloverdale and San Juan Baustista. The majority of the airports in the region are classified by the FAA as supporting only medium to small aircraft (FAA, 2013). There are a number of factors that influence necessary runway lengths: wheel type, weight, site elevation, temperature, and others, but the FAA categorizes Bay Area airports as shown in Figure 5 (on page 16).
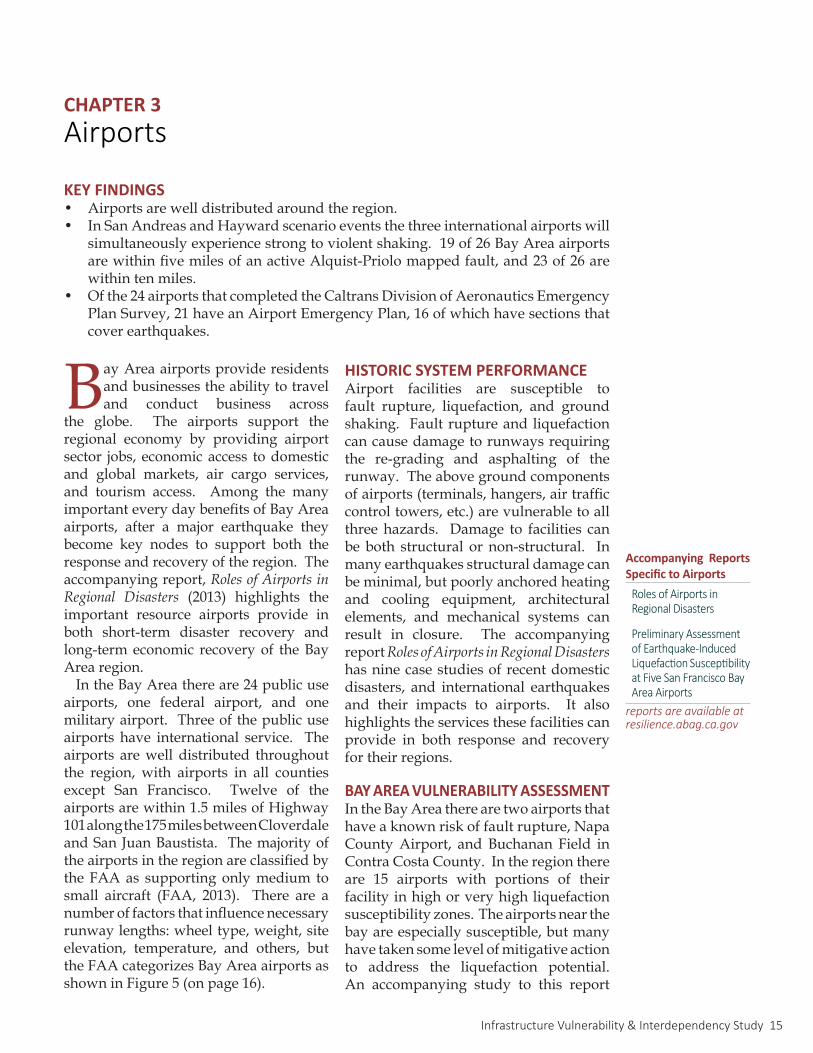
HISTORIC SYSTEM PERFORMANCEAirport facilities are susceptible to fault rupture, liquefaction, and ground shaking. Fault rupture and liquefaction can cause damage to runways requiring the re-grading and asphalting of the runway. The above ground components of airports (terminals, hangers, air traffic control towers, etc.) are vulnerable to all three hazards. Damage to facilities can be both structural or non-structural. In many earthquakes structural damage can be minimal, but poorly anchored heating and cooling equipment, architectural elements, and mechanical systems can result in closure. The accompanying report RolesofAirportsinRegionalDisasters has nine case studies of recent domestic disasters, and international earthquakes and their impacts to airports. It also highlights the services these facilities can provide in both response and recovery for their regions.
BAY AREA VULNERABILITY ASSESSMENTIn the Bay Area there are two airports that have a known risk of fault rupture, Napa County Airport, and Buchanan Field in Contra Costa County. In the region there are 15 airports with portions of their facility in high or very high liquefaction susceptibility zones. The airports near the bay are especially susceptible, but many have taken some level of mitigative action to address the liquefaction potential. An accompanying study to this report
CHAPTER 3Airports
KEY FINDINGS• Airports are well distributed around the region. • In San Andreas and Hayward scenario events the three international airports will
simultaneously experience strong to violent shaking. 19 of 26 Bay Area airports are within five miles of an active Alquist-Priolo mapped fault, and 23 of 26 are within ten miles.
• Of the 24 airports that completed the Caltrans Division of Aeronautics Emergency Plan Survey, 21 have an Airport Emergency Plan, 16 of which have sections that cover earthquakes.
Accompanying Reports Specific to Airports
Roles of Airports in Regional Disasters
Preliminary Assessment of Earthquake-Induced Liquefaction Susceptibility at Five San Francisco Bay Area Airports
reports are available at resilience.abag.ca.gov
16 Association of Bay Area Governments
Concord Southern Green Valley Fault
San Andreas Fault
Hayward Fault
FIGURE 5:Location of Bay Area Airports in Relation to the Three Major Faults
Name
1 San Francisco Intl. 11,870 2 San Jose Intl. 11,000 3 Travis AFB 11,000 4 Oakland Intl. 10,000 5 Moffett Federal 9,197
6 North Field 6,212 7 Napa County 5,930 8 Hayward 5,694
9 Livermore Muni. 5,253 10 Sonoma County* 5,121 11 Buchanan Field 5,001 12 Half Moon Bay 5,000 13 Nut Tree 4,700 14 Byron 4,500 15 Rio Vista Muni. 4,201 16 Petaluma Muni. 3,601 17 Gnoss Field 3,300 17
18 Angwin Parrett 3,217 19 Cloverdale Muni. 3,147 20 Reid-Hillview 3,101 21 San Martin 3,100 22 Healdsburg Muni. 2,707 23 Sonoma Valley 2,700 24 San Carlos 2,600 25 Sonoma Skypark 2,480 26 Palo Alto 2,443
1 Data Source: FAA, 2013 2 Each Airports longest runway. * Currently extending runway.
Runway Length1,2
Large
Medium
Small
Moderately Large
7
8
9
10
11
1
2
3
4
5
12
13
14
15
16
17
18
19
21
24
25
22
23
20
6
26
5025 Miles0
Minimum Runway Length Needed to Land Single Wheel Aircraft (FAA, 2013)
7,500’ >3,300’3,300’5,400’
Large AircraftModerately
Large Aircraft Medium AircraftSmall Aircraft
Infrastructure Vulnerability & Interdependency Study 17
Preliminary Assessment of Earthquake-Induced Liquefaction Susceptibility at FiveSan Francisco Bay Area Airports (2013) used available bore hole data to quantify the potential and degree of liquefaction to five Bay Area runways.
As the region experienced recently in the 2014 South Napa Earthquake, smaller faults in the region have the potential to cause damage to individual or a small subset of regional airports. Sidebar 2 highlights the fortunately minimal damage at the Napa County Airport in the South Napa Earthquake.
Because the airports in the region are well distributed throughout the region, there is an ability for air traffic to be rerouted in events. San Andreas and Hayward earthquake events will test the commercial travel in the region as the three international airports are between the two faults, along with Moffett Federal. Four of the region's five airports that can handle large aircraft will experience strong to violent shaking in both the San Andreas and Hayward Scenario. In the event of disruption to these four airports ,Travis Air Force Base in Solano County would be the only airport in the region with a long enough runway for large aircraft.
On August 24th, 2014 an earthquake occurred on a portion of the West Napa Fault that had previously not been mapped as an active fault zone (USGS, 2014). The known section of the West Napa Fault a few miles south of the earthquake epicenter runs directly through the Napa County Airport. This section of fault did not have significant fault rupture, but rupture displacements north of the airport were greater than 1 foot (GEER, 2014).
The Napa County Airport did sustain non-structural damage to the air traffic control tower, and to shelving units elsewhere in the terminal. The airport operated without an air traffic control communications for four days until a temporary air traffic control could be set up. The tower remained unoccupied for over a month while new windows and other non-structural damage was repaired (Stockdale, 2014).
Other than a 30 minute airport closure for inspection, the airport maintained operation. The facility was without power for 12 hours and ran on backup generators during this time. PG&E used a portion of the airport parking lot as their mobile command center, and provided additional generators to help power fixed based operator services during the short outage. Overall, the earthquake was a near miss for Napa County Airport and is a reminder of the region’s high earthquake risk.
SIDEBAR 2: M6.0 South Napa Earthquake
ReferencesCaltrans Aeronautics. (2014). Caltrans Division of Aeronautics Emergency Plan Survey.FAA. (2013). Airport Data: Airports Runway Data. Federal Aviation Administration. Retrieved
From: http://www.faa.gov/airports/airport_safety/airportdata_5010/Fugro Consultants (2013). Preliminary Assessment of Earthquake-Induced Liquefaction
Susceptibility at Five San Francisco Bay Area Airports. ABAG Report. May 31, 2013.GEER. (2014). August 24, 2014 South Napa, California Earthquake. Geotechnical Extreme
Events Reconnaissance Association. GEER Association Report No. GEER-037. September 15, 2014.
Perkins, J. (2013). Roles of Airports in Regional Disasters: Lessons on Disaster Response, Short-Term Disaster Recovery, and Long-Term Economic Recovery for the San Francisco Bay Area. ABAG Report. May 31, 2013.
Stockdale, D. (2014). Impacts of the South Napa Earthquake. Bay Area Airport Disaster Recovery Workshop. Oakland. 4 Sept. 2014. Presentation.
USGS. (2014). Magnitude 6 South Napa Earthquake of August 24, 2014. United States Geological Survey. Retrieved From: http://www.usgs.gov/newsroom/article.asp?ID=3980&from=rss_home#.VBCXt_ldX74
18 Association of Bay Area Governments
An extensive network of both road and rail infrastructure provide the Bay Area region with
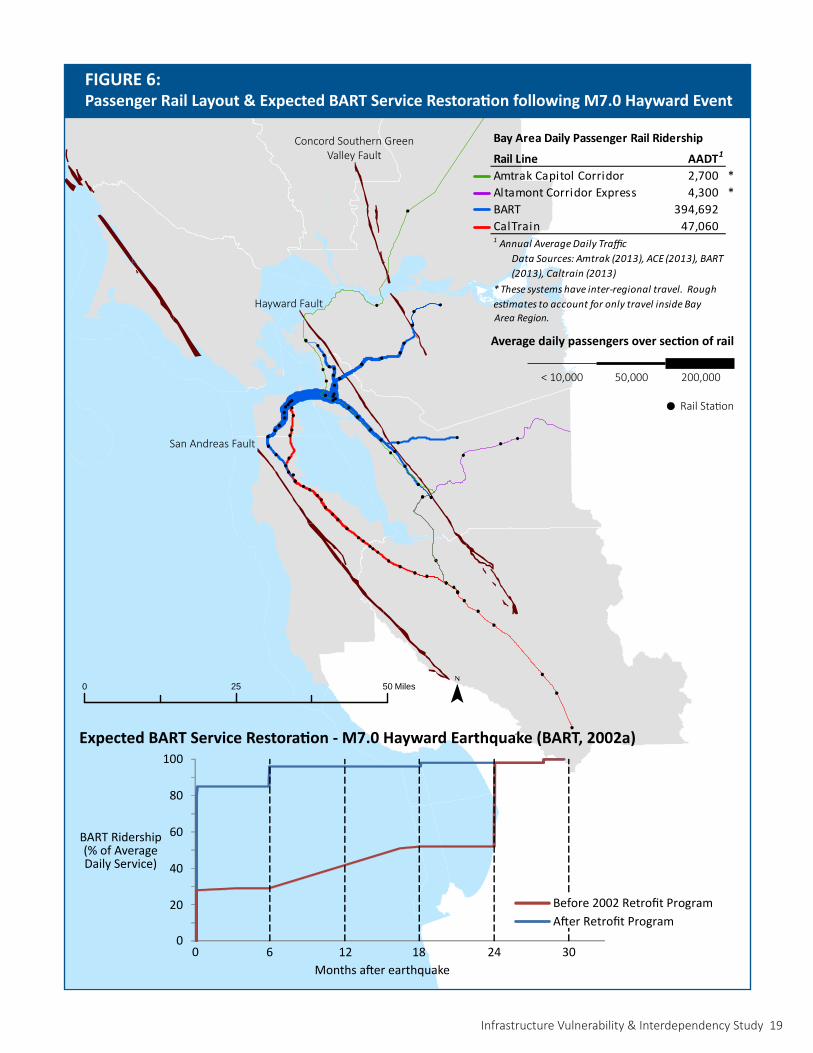
multiple modes of travel across most of the region. Two main rail lines operate intra-regionally, Bay Area Rapid Transit (BART) and Caltrain. The Altamont Corridor Express (ACE) and the Capitol Corridor (managed by Capitol Corridor Join Powers Authority) trains provide service from Santa Clara County east and north out of the region. Figure 6 shows the map of these systems and their respective ridership levels along each section of track.
In the nine county Bay Area region there are over 1,400 miles of state highways, and another 20,000 miles of local roadways (Caltrans, 2011). Twenty-four of the 26 Bay Area airports are within 1.5 miles of a state highway; Angwin-Parrett (in Napa County) and Byron (in Contra Costa) airports are further from highways. California road networks have had catastrophic failures in both the 1989 Loma Prieta and 1994 Northridge earthquakes. Since 1989, Caltrans has spent over $12 billion to seismically retrofit over 2,200 bridges.
AIRPORT RELIANCE & CAPACITYFor airports to be useful regional transportation nodes they must be connected by roads and rail lines to the populations they serve. Transportation links are necessary to get airport staff,
passengers, and cargo to and from the airport. San Francisco International Airport (SFO) and Oakland International Airport (OAK) both have BART stations at their facilities while all other airports rely on roads for bus and personal vehicle service. Even at SFO and OAK, BART trips are a fraction of overall trips, and do not provide any cargo movement. All ground vehicles require passable roadway systems and fuel for vehicles (either reformulated gasoline, diesel, electricity, or bio) to get to and from the airport.
Passenger travel is very reliant on road networks outward from airports. The average distance traveled for SFO, OAK, and SJC passengers is 25 miles. At Sonoma County Airport, Concord Buchanan Field, and Travis Air Force Base the average passenger travels 19 miles to the airport (RAPC, 2011). Under normal conditions, without accounting for any rerouting, a long section of the road network must be open for people to access the airport and they must have the fuel necessary to get to and from the airport.
SYSTEM VULNERABILITYRoadways are typically divided into two components: roads and bridges. In past earthquakes both have experienced catastrophic failures. The most evocative failures of the Loma Prieta Earthquake were the collapse of the Cyprus Street
CHAPTER 4Transportation - Roads and Passenger Rail
KEY FINDINGS• SFO and OAK airports are near parallel highway networks: I-280 & US 101 at SFO,
and I-880 & I-580 at OAK. These parallel roadways will be subject to different hazards in San Andreas and Hayward events, with the inland routes (I-280 & I-580) experiencing violent and very strong shaking, and the bay side routes (I-880 & US 101) experiencing liquefaction as well as very strong shaking.
• Large-scale seismic retrofit programs have resulted in a much more resilient transportation network. Still a single failure along non redundant corridors can severely disrupt travel.
Infrastructure Vulnerability & Interdependency Study 19
Concord Southern Green Valley Fault
San Andreas Fault
Hayward Fault
5025 Miles0
0
20
40
60
80
100
0
After Retrofit ProgramBefore 2002 Retrofit Program
6 12 18 24 30
BART Ridership (% of Average Daily Service)
Months after earthquake
Expected BART Service Restoration - M7.0 Hayward Earthquake (BART, 2002a)
FIGURE 6:Passenger Rail Layout & Expected BART Service Restoration following M7.0 Hayward Event
Bay Area Daily Passenger Rail Ridership
Rail Line AADT1
Amtrak Capitol Corridor 2,700 *Altamont Corridor Express 4,300 *BART 394,692 CalTrain 47,060 1 Annual Average Daily Traffic
* These systems have inter-regional travel. Rough estimates to account for only travel inside Bay
Data Sources: Amtrak (2013), ACE (2013), BART (2013), Caltrain (2013)
Area Region.
Rail Station
< 10,000 50,000 200,000
Average daily passengers over section of rail
20 Association of Bay Area Governments
Viaduct in Oakland and the Bay Bridge deck. Bridges can be damaged by fault rupture, liquefaction, or ground shaking. Also after the earthquake, Highway 17, the only multi-lane highway between Santa Cruz and Santa Clara counties, was out of service for a month while landslide damage was repaired. Historically speaking, bridge failures govern the restoration of the system because of the time it takes to design and construct a bridge above some other feature (river, active roadway, etc.) In the case of Highway 17, the roadways above unstable sloped ground also required significant time to reopen. Roadways are most susceptible to ground failures: fault rupture, liquefaction, and lateral spreading. Depending on the extent and location of ground failure, the roadway can be repaired quickly over flat areas. However, if ground failures require extensive re-grading, retaining wall work, or slope stability, the consequences and restoration timeline may be more similar to a bridge failure.
Rail lines are similar in their vulnerability. Rail bridges, or sections of rail interrupted by slope stability are often the governing failures. In addition to the network of rail, both the stations and operations center of the rail networks are critical nodes that may not be physically connected to the system, but could govern the system restoration if it is damaged. Transit stations, depending on their design, may be at grade structures with minimal vulnerability to shaking, or may also be above ground structures that may experience damage. Lastly, rail requires employees to operate the system, which following the Loma Prieta Earthquake was a challenge for the Caltrain system. Many Caltrain employees lived in Santa Cruz County and were unable to get to work because of the Highway 17 failure (Schiff, 1990).
The surface transportation system, both rail and roads, work together to provide regional travel. In 1989, the Bay Bridge carried 254,400 vehicles daily (Yashinsky, 1998) and was closed for a full month to repair the bridge deck damage.
When a single component within the transportation system is stressed, the parallel links within the greater system take on greater loads. The San Francisco - Oakland Bay Bridge offers three recent examples of network impacts to single failures.
In 2007, a gasoline tanker truck crashed causing a fire that collapsed a section of the I-80E to I-580E connector onto the I-80W to I-880S interchange. There was no damage to the Bay Bridge, but the crash and fire closed interchanges to the bridge, which typically carry 80,000 vehicles daily (Hoge, 2007). In the first day after the interchange closure Bay Bridge traffic was down 18%. The other modes across the bay saw a surge in the number of trips. On the first day, the Golden Gate Bridge had 7% more trips (4,180 additional vehicles), San Mateo had an increase of 8.6%, and BART increased its ridership by 7.1% (34,200 additional passengers) (Caltrans, 2007). The redundancy across the road networks and BART resulted in minimal traffic impacts across the bay during the 26 day repair.
In 2009, the system was strained again when a steel crossbeam and two steel tie rods fell onto the upper deck of the Bay Bridge. In the following days, BART continually set and reset historic ridership records with a 24% overall increase in ridership, and a 57% increase in the transbay portion of the system (BART, 2009). The San Mateo - Hayward bridge increased from a monthly average of 100,000 trips to above 140,000, and the Richmond Bridge increased from 65,000 to 83,000 trips.
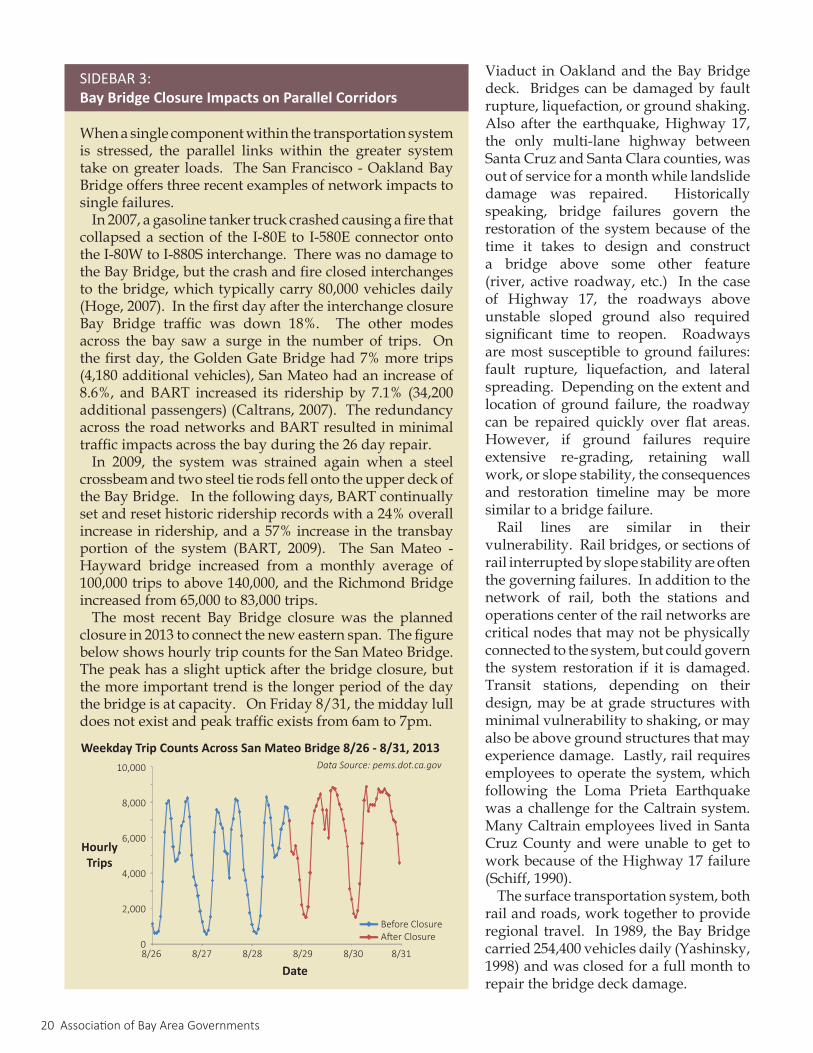
The most recent Bay Bridge closure was the planned closure in 2013 to connect the new eastern span. The figure below shows hourly trip counts for the San Mateo Bridge. The peak has a slight uptick after the bridge closure, but the more important trend is the longer period of the day the bridge is at capacity. On Friday 8/31, the midday lull does not exist and peak traffic exists from 6am to 7pm.
SIDEBAR 3: Bay Bridge Closure Impacts on Parallel Corridors
Data Source: pems.dot.ca.gov
Weekday Trip Counts Across San Mateo Bridge 8/26 - 8/31, 2013
Hourly Trips
Date
Before ClosureAfter Closure
8/26 8/27 8/28 8/29 8/30 8/31
10,000
8,000
6,000
4,000
2,000
0
Infrastructure Vulnerability & Interdependency Study 21
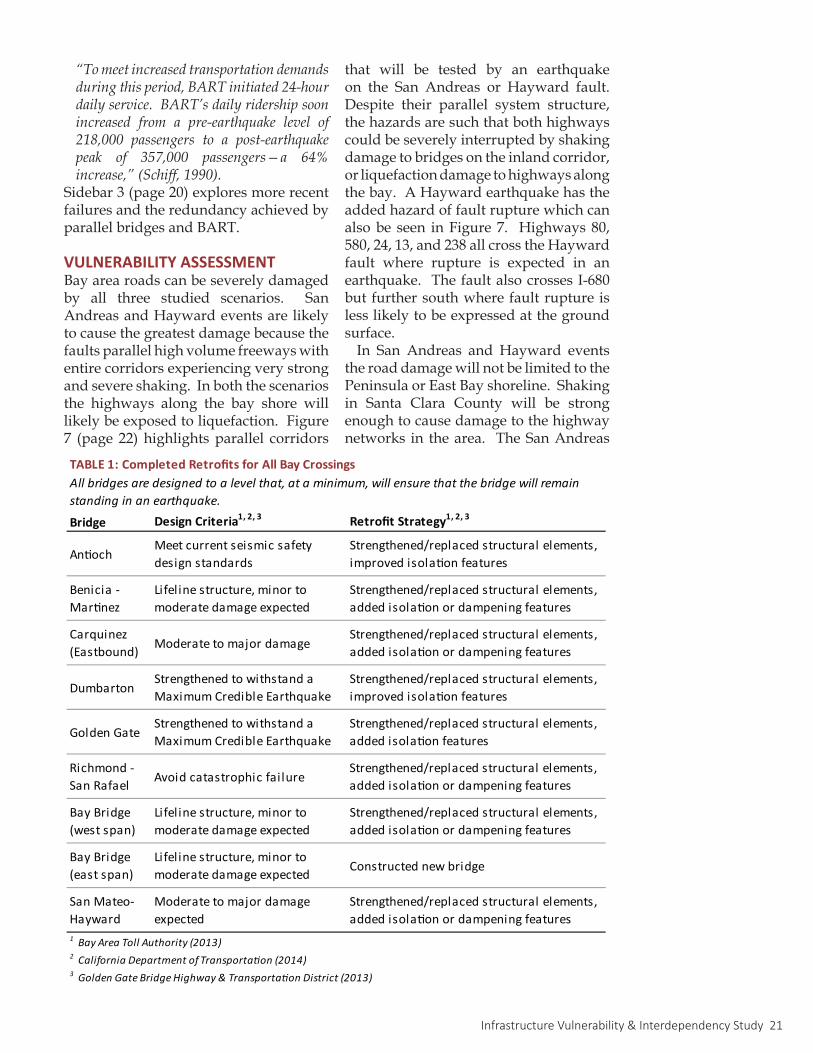
Bridge Design Criteria1, 2, 3 Retrofit Strategy1, 2, 3
AntiochMeet current seismic safety design standards
Strengthened/replaced structural elements, improved isolation features
Benicia -Martinez
Lifeline structure, minor to moderate damage expected
Strengthened/replaced structural elements, added isolation or dampening features
Carquinez (Eastbound) Moderate to major damage
Strengthened/replaced structural elements, added isolation or dampening features
DumbartonStrengthened to withstand a Maximum Credible Earthquake
Strengthened/replaced structural elements, improved isolation features
Golden GateStrengthened to withstand a Maximum Credible Earthquake
Strengthened/replaced structural elements, added isolation features
Richmond - San Rafael Avoid catastrophic failure
Strengthened/replaced structural elements, added isolation or dampening features
Bay Bridge (west span)
Lifeline structure, minor to moderate damage expected
Strengthened/replaced structural elements, added isolation or dampening features
Bay Bridge (east span)
Lifeline structure, minor to moderate damage expected Constructed new bridge
San Mateo- Hayward
Moderate to major damage expected
Strengthened/replaced structural elements, added isolation or dampening features
1 Bay Area Toll Authority (2013)2 California Department of Transportation (2014)3 Golden Gate Bridge Highway & Transportation District (2013)
All bridges are designed to a level that, at a minimum, will ensure that the bridge will remain standing in an earthquake.
TABLE 1: Completed Retrofits for All Bay Crossings
“Tomeetincreasedtransportationdemandsduringthisperiod,BARTinitiated24-hourdailyservice.BART’sdailyridershipsoonincreased from a pre-earthquake level of218,000 passengers to a post-earthquakepeak of 357,000 passengers—a 64%increase,”(Schiff,1990).
Sidebar 3 (page 20) explores more recent failures and the redundancy achieved by parallel bridges and BART.
VULNERABILITY ASSESSMENTBay area roads can be severely damaged by all three studied scenarios. San Andreas and Hayward events are likely to cause the greatest damage because the faults parallel high volume freeways with entire corridors experiencing very strong and severe shaking. In both the scenarios the highways along the bay shore will likely be exposed to liquefaction. Figure 7 (page 22) highlights parallel corridors
that will be tested by an earthquake on the San Andreas or Hayward fault. Despite their parallel system structure, the hazards are such that both highways could be severely interrupted by shaking damage to bridges on the inland corridor, or liquefaction damage to highways along the bay. A Hayward earthquake has the added hazard of fault rupture which can also be seen in Figure 7. Highways 80, 580, 24, 13, and 238 all cross the Hayward fault where rupture is expected in an earthquake. The fault also crosses I-680 but further south where fault rupture is less likely to be expressed at the ground surface.
In San Andreas and Hayward events the road damage will not be limited to the Peninsula or East Bay shoreline. Shaking in Santa Clara County will be strong enough to cause damage to the highway networks in the area. The San Andreas
22 Association of Bay Area Governments
17
4
85
5025 Miles0
MMI 9MMI 8MMI 7MMI 6MMI < 5
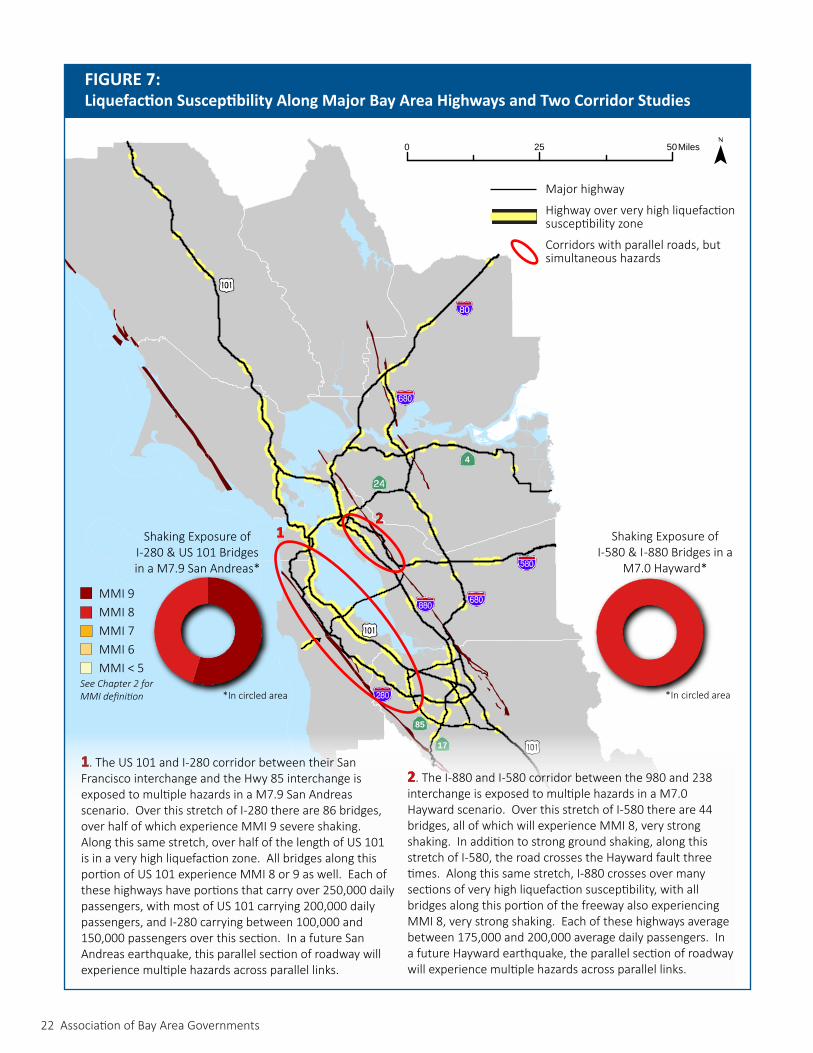
2. The I-880 and I-580 corridor between the 980 and 238 interchange is exposed to multiple hazards in a M7.0 Hayward scenario. Over this stretch of I-580 there are 44 bridges, all of which will experience MMI 8, very strong shaking. In addition to strong ground shaking, along this stretch of I-580, the road crosses the Hayward fault three times. Along this same stretch, I-880 crosses over many sections of very high liquefaction susceptibility, with all bridges along this portion of the freeway also experiencing MMI 8, very strong shaking. Each of these highways average between 175,000 and 200,000 average daily passengers. In a future Hayward earthquake, the parallel section of roadway will experience multiple hazards across parallel links.
Shaking Exposure of I-580 & I -880 Bridges in a
M7.0 Hayward*
*In circled area
Shaking Exposure of I-280 & US 101 Bridges in a M7.9 San Andreas*
*In circled area
1. The US 101 and I-280 corridor between their San Francisco interchange and the Hwy 85 interchange is exposed to multiple hazards in a M7.9 San Andreas scenario. Over this stretch of I-280 there are 86 bridges, over half of which experience MMI 9 severe shaking. Along this same stretch, over half of the length of US 101 is in a very high liquefaction zone. All bridges along this portion of US 101 experience MMI 8 or 9 as well. Each of these highways have portions that carry over 250,000 daily passengers, with most of US 101 carrying 200,000 daily passengers, and I-280 carrying between 100,000 and 150,000 passengers over this section. In a future San Andreas earthquake, this parallel section of roadway will experience multiple hazards across parallel links.
21
Major highway
Highway over very high liquefaction susceptibility zone
Corridors with parallel roads, but simultaneous hazards
See Chapter 2 for MMI definition
FIGURE 7:Liquefaction Susceptibility Along Major Bay Area Highways and Two Corridor Studies
Infrastructure Vulnerability & Interdependency Study 23
event has the added dimension of fault rupture and landslides along Hwy 17 and fault rupture across US 101 just south of the Santa Clara County border.
The North Bay will also be impacted by these two events. In a Hayward event, strong shaking is limited to the roadways that hug the north shore of the San Francisco Bay, San Pablo Bay, and Carquinez Strait. If the Hayward and Rodgers Creek faults rupture at once, severe shaking would extend north along the same path as the Hayward fault with MMI 8 shaking as far north as Santa Rosa. The Rodgers Creek fault runs parallel just east of US 101 in Sonoma County. Considering just a Hayward event, Highway 37 which runs east-west connecting I-80 and US 101 is likely to be exposed to liquefaction.
The rail systems are also vulnerable. Unlike roadways which generally have some parallel local roads that provide some trip diversion capacity, the passenger rail lines are series systems and a single failure of the track could interrupt an entire system. BART expects the majority of their system to be operational very soon after a large earthquake. Figure 6 shows their expected system restoration after a M7.0 Hayward event both before and after their mostly completed seismic
retrofit program, which began in 2002 (BART 2002a). The other rail systems are primarily at grade lines that should be quickly repairable. Altamont Commuter Express, Amtrak, and Caltrain all have at-grade platforms, and for the most part have fewer bridges than most of the highways. In a Concord event, the rail bridge that crosses parallel to the Benicia – Martinez Bridge is only two miles from the Concord fault. In a Concord event, the shaking and/or liquefaction could cause significant or complete damage to the rail bridge.
Over the past twenty-five years since Loma Prieta, the region has seismically retrofit all bridges that cross the Bay (see Table 1). The Bay Area Toll Authority (BATA) with Caltrans have had joint oversight over all bay crossings except for the Golden Gate Bridge. In 2013, BATA and Caltrans completed all planned seismic retrofits of bay crossings, including the replacement of the eastern span of the Bay Bridge.“Each retrofit is designed to a level that,ataminimum,willensurethatthebridgewill remain standing in an earthquake.The California Legislature has designatedthe San Francisco-Oakland Bay Bridgeand Benicia-Martinez Bridge as “lifelinestructures” since they are located along
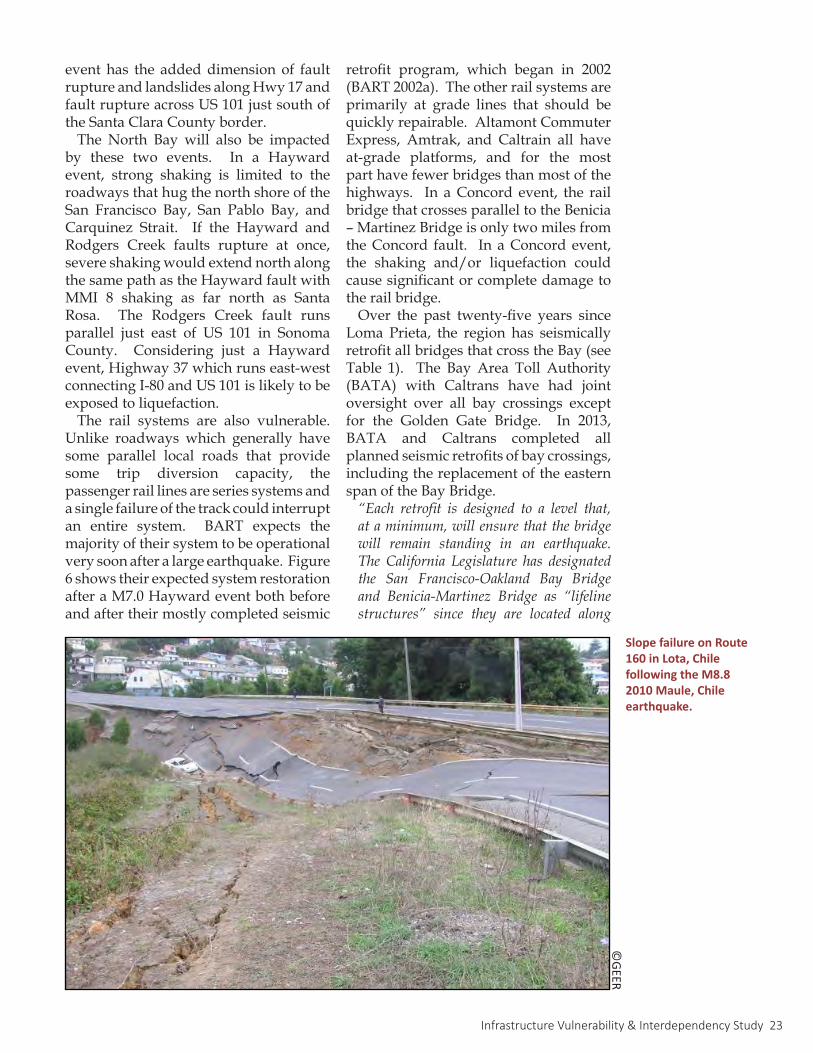
©GEER
Slope failure on Route 160 in Lota, Chile following the M8.8 2010 Maule, Chile earthquake.
24 Association of Bay Area Governments
ReferencesAltamont Corridor Express. (2013). Daily Summary. Herzog Integrated Transportation
SystemAmtrak Capitol Corridor Joint Powers Authority. (2013). Monthly Station Ridership Activity.
Capitol Corridor Train Service. BART. (2013) 2013 Monthly Ridership Reports. Bay Area Rapid Transit. Retrieved From:
http://www.bart.gov/about/reports/ridershipBART. (2009). BART customers continue to set ridership records. 11.01.2009. Bay Area Rapid
Transit Retrieved From: http://www.bart.gov/news/articles/2009/news20091030.aspx
BART. (2002a). BART Seismic Vulnerability Study. San Francisco Bay Area Rapid Transit District. Prepared By: Bechtel Infrastructure Corporation.
BART. (2002b). BART Systemwide Seismic Vulnerability Study Report: Volume I. San Francisco Bay Area Rapid Transit District. Prepared By: Bechtel Infrastructure Corporation. June 28, 2012.
BATA (2013). Bridge Projects: Toll Bridge Seismic Retrofit Program. Bay Area Toll Authority. Retrieved From: http://bata.mtc.ca.gov/projects/seismic.htm
Caltrain. (2013) February 2013 Caltrain Annual Passenger Counts Key Findings. Retrieved From: http://www.caltrain.com/Assets/Stats+and+Reports/Ridership/2013+Annual+Ridership+Counts.pdf
Caltrans. (2014). Dumbarton-Bridge: Seismic Retrofit Strategy. California Department of Transportation. Retrieved From: http://www.dot.ca.gov/dist4/dumbarton/
Caltrans. (2013). Caltrans Performance Measurement System (PeMS). California Department of Transportation. Retrieved On August 20, 2013.
Caltrans. (2011). 2010 California Public Road Data. California Department of Transportation. October 2011. Retrieved From: http://www.dot.ca.gov/hq/tsip/hpms/hpmslibrary/hpmspdf/2010PRD.pdf
Caltrans. (2007). Bay Area Rapid Response to MacArthur Maze Meltdown. California Department of Transportation. Retrieved From: http://www.dot.ca.gov/dist4/mazedamage/docs/mazefactsheet_mtc.pdf
Golden Gate Bridge Highway & Transportation District. (2013). Overview of Golden Gate Bridge Seismic Retrofit Construction Project. Retrieved From: http://goldengatebridge.org/projects/retrofit.php
Hoge, P. (2007). Bay Bridge traffic falls, BART use Spikes / Bus drivers starting to return to old commute patterns. Retrieved From: http://www.sfgate.com/bayarea/article/Bay-Bridge-traffic-falls-BART-use-spikes-But-2596943.php
RAPC. (2011). Regional Airport System Planning Analysis. Regional Airport Planning Committee. Retrieved From: http://www.mtc.ca.gov/planning/air_plan/RASPA-2011_update/Volume_1-Sept_2011_RASPA_Final_Report.pdf
Schiff, A, 1990, Lifelines, Earthquake Spectra: May 1990, Vol. 6, No. S1, pp.239-338Yashinsky, M. (1998). The Loma Prieta, California Earthquake of October 17, 1989 – Highway
Systems. U.S. Geological Survey Professional Paper 1552–B.
transportation corridors determined tobe crucial to both emergency relief andeconomic revitalization of the regionfollowing a major earthquake. Based onthis distinction, the retrofit strategies forthesetwobridgesincorporatesomedesignelements that exceed standard seismicbridgedesign,”(BATA,2013).
In addition to the major retrofits that have occurred, Caltrans has learned from the Loma Prieta event and successfully executed emergency contracts in the Northridge earthquake (Yashinsky, 1998) and the MacArthur Maze Fire, reducing the repair time of major highway bridges.

Infrastructure Vulnerability & Interdependency Study 25
There are four stages of the fuel system that could be impacted in a Bay Area earthquake: (1)
crude oil import, (2) refinement, (3) fuel transmission export, and (4) fuel distribution. Crude oil is imported by pipeline from the east, rail from the north, and marine tankers from the west. 38% of crude oil is extracted in California, mainly in Kern County, with the remainder coming from Alaska and foreign sources (WSPA, 2013). In a few years, the crude oil profile is expected to change with a significant percentage of the fuel projected to be imported via rail from Canada and North Dakota.
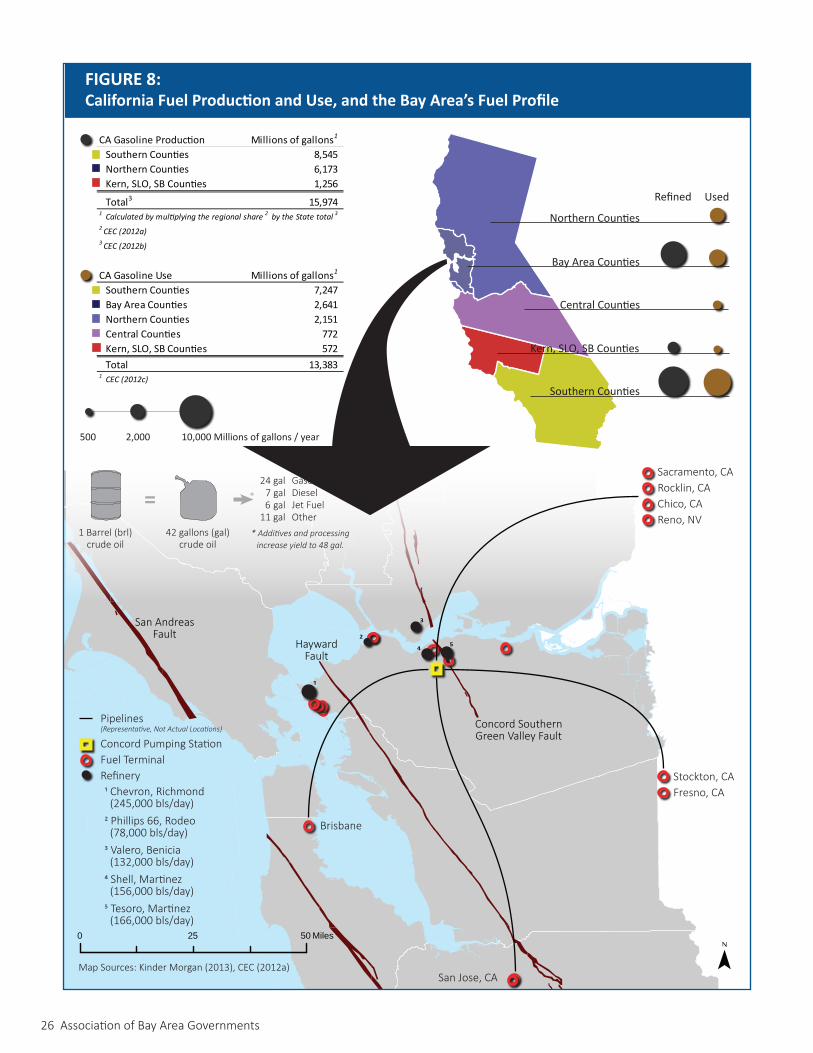
The San Francisco Bay Area has five refineries which, combined, processed 235 million barrels of crude oil in 2012, a 40% share of the states total. As a state California utilizes only 87% of its total 682 million barrel capacity, meaning refineries could produce 13% more product if their was a need. The five Bay Area refineries are located along the San Pablo Bay and the Carquinez Strait. Figure 8 (page 26) shows both the location of the five refineries and their refining capacity. Once refined, the variety of fuel products are pumped and piped across the state to terminal facilities that serve all of northern California and northern Nevada. In addition to refining all of the fuel it uses, California refines 90% of Nevada’s fuel and 50% of Arizona’s. The refineries in the Bay Area supply
100% of the region’s fuel, northern California’s fuel, northern Nevada’s fuel, and a portion of the central counties fuel (which is also supplied by Kern County refineries). Figure 8 outlines the state’s fuel production and use, and maps the large terminals to which the region directly exports fuel. Once the product reaches terminal facilities, fuel tanker trucks distribute fuel locally using the road network. Disruption to a single phase of fuel delivery could limit fuel supply in the Bay Area; and the other regions reliant on the Bay Area fuel system.
Airport RelianceAirports are reliant on a number of different refined fuel products. Fuel is used for ground operations, backup electrical generation, and for aircraft flights. The three international airports have jet fuel for aircraft piped directly
CHAPTER 5Fuel System
KEY FINDINGS• Fuel refineries are likely to have correlated performance, if one is damaged it’s
likely others are damaged too. A conservative restoration estimate of damaged refineries is months.
• Damage to the fuel transmission system would severely impact counties beyond Solano and Contra Costa where most refineries are located. Transporting the normal fuel demand by truck after a disaster simply is not feasible.
• Damage to pipes that cross the Bay, or an inability to pump fuel east would cause fuel supply interruptions across Northern California and Nevada.
AirportTotal Daily
Takeoffs% of Takeoffs
Passenger1
SFO 1,022 62% 2,100,000 OAK 924 46% 1,000,000 SJC 547 48% 650,000 1 Not including regional jets and turbo propeller passenger trips.2 Using airplane breakdown & fuel economy, and domestic destinations.
Data Sources: RAPC (2011).
Estimated Psgr. Fuel Consumption (gal)2
TABLE 2: Estimated Daily Fuel Consumption for Commercial Passenger Flights (2007)
26 Association of Bay Area Governments
FIGURE 8:California Fuel Production and Use, and the Bay Area’s Fuel Profile
Northern Counties
Bay Area Counties
Central Counties
Kern, SLO, SB Counties
Southern Counties
UsedRefined
500 2,000 10,000 Millions of gallons / year
CA Gasoline Production Millions of gallons1
Southern Counties 8,545 Northern Counties 6,173 Kern, SLO, SB Counties 1,256
Total3 15,974 1 Calculated by multiplying the regional share 2 by the State total 3
2 CEC (2012a)3 CEC (2012b)
CA Gasoline Use Millions of gallons1
Southern Counties 7,247 Bay Area Counties 2,641 Northern Counties 2,151 Central Counties 772 Kern, SLO, SB Counties 572 Total 13,383 1 CEC (2012c)
Concord Southern Green Valley Fault
San AndreasFault
HaywardFault
50250 Miles
Sacramento, CARocklin, CAChico, CAReno, NV
Stockton, CAFresno, CA
San Jose, CA
Brisbane
1
23
4 5
Map Sources: Kinder Morgan (2013), CEC (2012a)
Pipelines (Representative, Not Actual Locations)
Concord Pumping StationFuel TerminalRefinery1 Chevron, Richmond (245,000 bls/day)2 Phillips 66, Rodeo (78,000 bls/day)3 Valero, Benicia (132,000 bls/day)4 Shell, Martinez (156,000 bls/day)5 Tesoro, Martinez (166,000 bls/day)
1 Barrel (brl) crude oil
42 gallons (gal) crude oil
=24 gal
11 gal
gal gal
GasolineDieselJet FuelOther
76
*
* Additives and processing increase yield to 48 gal.
Infrastructure Vulnerability & Interdependency Study 27
to their facility, as does Travis AFB. All other airports in the region rely on tankers to truck fuel to the site. All of the facilities are reliant on tanker trucks to supply reformulated and diesel fuel for their ground operations. The five Bay Area refineries supply jet fuel for Bay Area airports as well as airports across the northern half of California and Nevada. Outside the region, Mather, Lemoore NAS, and NAS Fallon all have fuel pipelines to their facilities.
An exact volume of jet fuel consumed by each airport was not publically available. Using a proxy between the total flight takeoffs by aircraft type, the percent breakdown of domestic destination locations, and the fuel economy of common aircraft type, Table 2 (page 25) estimates the amount of jet fuel used daily for domestic passenger flights only. In the event jet fuel is unavailable at Bay Area airports dispatchers and load planners can schedule arriving aircraft to carry round-trip fuel loads precluding the necessity to fuel at the stricken airport. If round-trip fuel cannot be scheduled, the flight can make an intermediate fuel stop at airports outside the fuel supply region. The closest airports independent of the Bay Area refinery and fuel system is Southern California.
In addition to jet fuel, the ground vehicle fleets at the airports are also reliant on reformulated gasoline. It should be noted that as a result of climate action plan adoption by airports, some are transistioning their ground fleets to be powered by alternative energy sources. As this transition is made, the reliance will shift from reformulated fuel to electricity or another source. These changes should be reflected in updated airport emergency plans. Lastly, as is discussed in Chapter 4, the median passenger trip to get from home/office to a Bay Area airports is over 25 miles for each SFO, OAK, SJC, resulting in over two gallons of fuel used for each passenger round trip to the airport. For the passenger air travel to function, passengers will on average need two gallons of fuel to get to and from the airport as well as the jet fuel for their flight.
System VulnerabilityFuel networks are generally comprised of source facilities, pipelines, pumping stations, refineries, terminal facilities, and distribution facilities. The facilities are often above-ground and vulnerable to the same forces as any other structure. Shaking, ground failure, and fault rupture could all cause significant damage to an above-ground facility. These facilities often have intricate routing of pipes and equipment that must be designed and anchored properly.“Forabove-groundcomponentsofpipelinesystems, such as buildings and storagetanks,inertialforcesresultingfromgroundshaking are a major concern,” (FEMA,1992).
Pipelines are often buried underground for safety from non-earthquake hazards. In earthquakes the shaking intensity rarely damages pipelines; ground failure and fault rupture are the primary concern for underground pipelines.“For buried pipelines, inertial forces areof little concern, but faulting, landslides,and liquefaction pose major problems(Hall, 1987)…. Large permanent groundmovements caused by surface faulting,soil liquefaction, and landslides are themost troublesome sources of earthquake
On August 6th, 2012, a five foot section of pipe in the Richmond Chevron Refinery failed causing a hydrocarbon leak and fire. Investigation into the accident identified corrosive thinning as the cause of pipe failure (Chevron, 2013). The refinery processes over 240,000 barrels of crude oil a day producing 150,000 barrels of gasoline, representing 16% of the West Coast’s 963,000 barrel daily use (CBS, 2012).
For eight months following the fire the Richmond facility operated at 60% capacity. As described at the start of the chapter the state only utilizes 87% of the maximum refinement capacity. It is likely that this failure was absorbed by the additional overall capacity, limiting the impact on the region. The facility did not process crude oil during this time and instead converted its operations to blend gasoline. (CBS, 2013b)
SIDEBAR 4: Restoration Following the Richmond, CA Refinery Fire
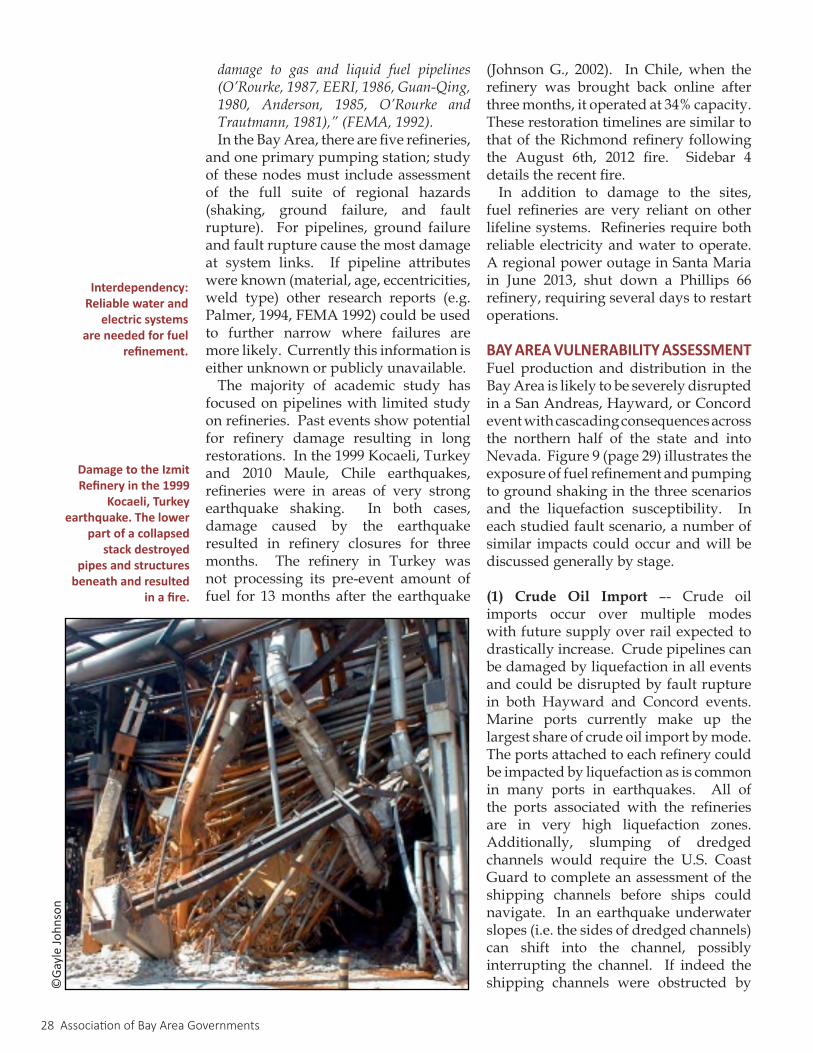
28 Association of Bay Area Governments
damage to gas and liquid fuel pipelines(O’Rourke,1987,EERI,1986,Guan-Qing,1980, Anderson, 1985, O’Rourke andTrautmann,1981),”(FEMA,1992).In the Bay Area, there are five refineries,
and one primary pumping station; study of these nodes must include assessment of the full suite of regional hazards (shaking, ground failure, and fault rupture). For pipelines, ground failure and fault rupture cause the most damage at system links. If pipeline attributes were known (material, age, eccentricities, weld type) other research reports (e.g. Palmer, 1994, FEMA 1992) could be used to further narrow where failures are more likely. Currently this information is either unknown or publicly unavailable.
The majority of academic study has focused on pipelines with limited study on refineries. Past events show potential for refinery damage resulting in long restorations. In the 1999 Kocaeli, Turkey and 2010 Maule, Chile earthquakes, refineries were in areas of very strong earthquake shaking. In both cases, damage caused by the earthquake resulted in refinery closures for three months. The refinery in Turkey was not processing its pre-event amount of fuel for 13 months after the earthquake
(Johnson G., 2002). In Chile, when the refinery was brought back online after three months, it operated at 34% capacity. These restoration timelines are similar to that of the Richmond refinery following the August 6th, 2012 fire. Sidebar 4 details the recent fire.
In addition to damage to the sites, fuel refineries are very reliant on other lifeline systems. Refineries require both reliable electricity and water to operate. A regional power outage in Santa Maria in June 2013, shut down a Phillips 66 refinery, requiring several days to restart operations.
BAY AREA VULNERABILITY ASSESSMENTFuel production and distribution in the Bay Area is likely to be severely disrupted in a San Andreas, Hayward, or Concord event with cascading consequences across the northern half of the state and into Nevada. Figure 9 (page 29) illustrates the exposure of fuel refinement and pumping to ground shaking in the three scenarios and the liquefaction susceptibility. In each studied fault scenario, a number of similar impacts could occur and will be discussed generally by stage.
(1) Crude Oil Import –- Crude oil imports occur over multiple modes with future supply over rail expected to drastically increase. Crude pipelines can be damaged by liquefaction in all events and could be disrupted by fault rupture in both Hayward and Concord events. Marine ports currently make up the largest share of crude oil import by mode. The ports attached to each refinery could be impacted by liquefaction as is common in many ports in earthquakes. All of the ports associated with the refineries are in very high liquefaction zones. Additionally, slumping of dredged channels would require the U.S. Coast Guard to complete an assessment of the shipping channels before ships could navigate. In an earthquake underwater slopes (i.e. the sides of dredged channels) can shift into the channel, possibly interrupting the channel. If indeed the shipping channels were obstructed by
Interdependency: Reliable water and
electric systems are needed for fuel
refinement.
Damage to the Izmit Refinery in the 1999
Kocaeli, Turkey earthquake. The lower
part of a collapsed stack destroyed
pipes and structures beneath and resulted
in a fire.
©Ga
yle
John
son
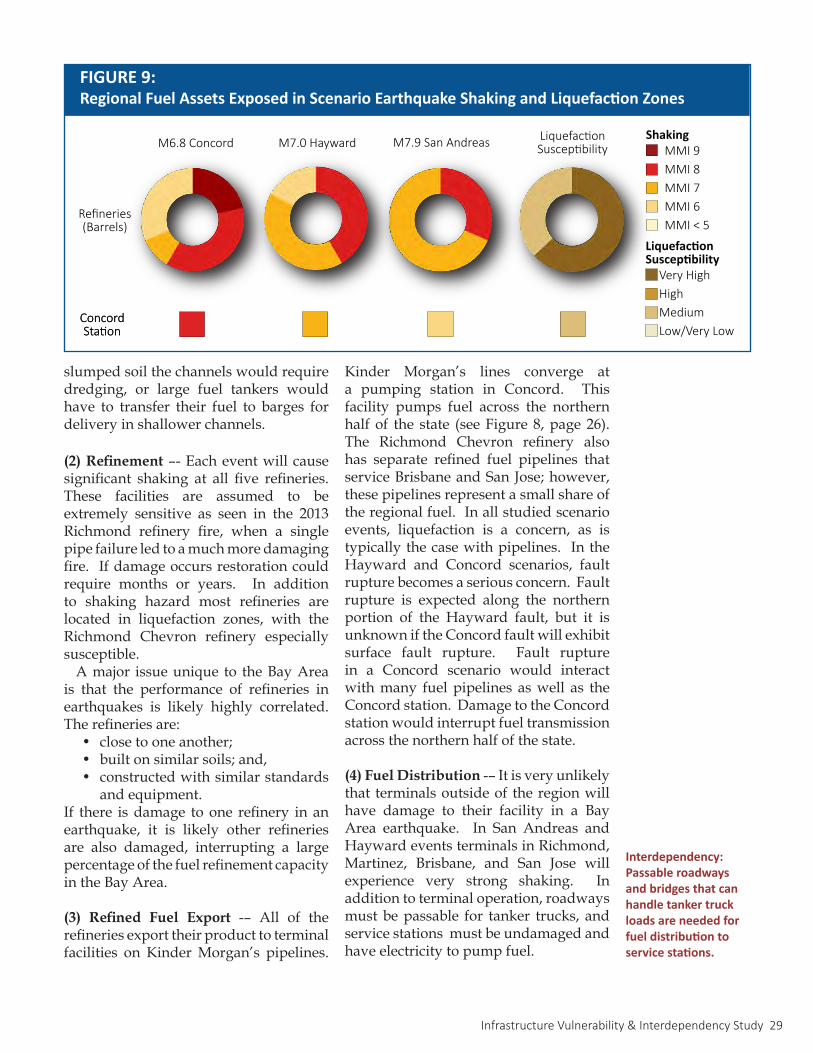
Infrastructure Vulnerability & Interdependency Study 29
FIGURE 9:Regional Fuel Assets Exposed in Scenario Earthquake Shaking and Liquefaction Zones
LiquefactionSusceptibilityM7.9 San AndreasM7.0 HaywardM6.8 Concord
Concord Station
Refineries(Barrels)
Concord Station
Very HighHighMediumLow/Very Low
MMI 9MMI 8MMI 7MMI 6MMI < 5
Shaking
Liquefaction Susceptibility
slumped soil the channels would require dredging, or large fuel tankers would have to transfer their fuel to barges for delivery in shallower channels.
(2) Refinement –- Each event will cause significant shaking at all five refineries. These facilities are assumed to be extremely sensitive as seen in the 2013 Richmond refinery fire, when a single pipe failure led to a much more damaging fire. If damage occurs restoration could require months or years. In addition to shaking hazard most refineries are located in liquefaction zones, with the Richmond Chevron refinery especially susceptible.
A major issue unique to the Bay Area is that the performance of refineries in earthquakes is likely highly correlated. The refineries are:
• close to one another;• built on similar soils; and,• constructed with similar standards
and equipment.If there is damage to one refinery in an earthquake, it is likely other refineries are also damaged, interrupting a large percentage of the fuel refinement capacity in the Bay Area.
(3) Refined Fuel Export -– All of the refineries export their product to terminal facilities on Kinder Morgan’s pipelines.
Kinder Morgan’s lines converge at a pumping station in Concord. This facility pumps fuel across the northern half of the state (see Figure 8, page 26). The Richmond Chevron refinery also has separate refined fuel pipelines that service Brisbane and San Jose; however, these pipelines represent a small share of the regional fuel. In all studied scenario events, liquefaction is a concern, as is typically the case with pipelines. In the Hayward and Concord scenarios, fault rupture becomes a serious concern. Fault rupture is expected along the northern portion of the Hayward fault, but it is unknown if the Concord fault will exhibit surface fault rupture. Fault rupture in a Concord scenario would interact with many fuel pipelines as well as the Concord station. Damage to the Concord station would interrupt fuel transmission across the northern half of the state.
(4) Fuel Distribution -– It is very unlikely that terminals outside of the region will have damage to their facility in a Bay Area earthquake. In San Andreas and Hayward events terminals in Richmond, Martinez, Brisbane, and San Jose will experience very strong shaking. In addition to terminal operation, roadways must be passable for tanker trucks, and service stations must be undamaged and have electricity to pump fuel.
Interdependency: Passable roadways and bridges that can handle tanker truck loads are needed for fuel distribution to service stations.
30 Association of Bay Area Governments
ReferencesCBS. (2013b) Richmond’s Chevron Refinery Resumes Operations In Unit Closed By Fire. April
27, 2013. Retrieved From: http://sanfrancisco.cbslocal.com/2013/04/27/richmonds-chevron-refinery-resumes-operations-in-unit-closed-by-fire/
CBS. (2012) Gas Prices May Go Up Due To Richmond Refinery Fire. August, 6th, 2012. Retrieved From: http://sanfrancisco.cbslocal.com/2012/08/06/gas-prices-may-go-up-due-to-richmond-refinery-fire/
CEC. (2012a). California’s Oil Refinery Locations and Capacities. California Energy Commission: Energy Almanac. Retrieved From: http://energyalmanac.ca.gov/petroleum/fuels_watch/
CEC. (2012b). Weekly Fuels Watch Report. California Energy Commission: Energy Almanac. Retrieved From: http://energyalmanac.ca.gov/petroleum/fuels_watch/index.php
CEC. (2012c). 2012 Retail Gasoline Sales by County. California Energy Commission: Energy Almanac. Retrieved From: http://www.energyalmanac.ca.gov/gasoline/retail_fuel_outlet_survey/retail_gasoline_sales_by_county.html
Chevron. (2013). Seventh Update to the 30-Day Report for the CWS Level 3 Event of August 6, 2012. April 12, 2013. Process Safety Management and Operational Excellence Chevron Products Company. Retrieved From: http://richmond.chevron.com/Files/richmond/Investigation_Report.pdf
EIA. (2013). Number and Capacity of Petroleum Refineries. U.S. Energy Information Administration http://www.eia.gov/dnav/pet/pet_pnp_cap1_dcu_SCA_a.htm
FEMA. 1992. Earthquake Resistant Construction of Gas and Liquid Fuel Pipeline Systems Serving, or Regulated by, the Federal Government. Federal Emergency Management Agency. FEMA 233, NISTIR 4795
Johnson, G. (2002) Refinery Damage and Emergency Response in the 1999 Izmit, Turkey Earthquake. Han-Padron Associates. California State Lands Commission Prevent First Symposium 2002. Retrieved From: http://www.slc.ca.gov/Division_pages/MFD/Prevention_First/Documents/2002/Paper%20by%20Gayle%20Johnson.pdf
Kinder Morgan. (2013). Products Pipelines - Pacific Operations SFPP: Concord Station. Retrieved On: 7/23/2013. Retrieved From: http://www.kindermorgan.com/business/products_pipelines/concord.cfm
RAPC. (2011). Regional Airport System Planning Analysis. Regional Airport Planning Committee. Retrieved From: http://www.mtc.ca.gov/planning/air_plan/RASPA-2011_update/Volume_1-Sept_2011_RASPA_Final_Report.pdf
WSPA. (2013). Crude Oil Supply. Western States Petroleum Association. Retrieved On: 8/21/2013 Retrieved From: https://www.wspa.org/issues/crude-oil-supply
(5) Fuel Quality -- In addition to the movement of fuel, the quality of the fuel requires special consideration in California. “Withregardtofuelsupplyissuesfollowingacatastrophicevent,re-supplyofgasolineanddieselfuelthatmeetsCaliforniareformulatedgasoline (CARFG) standards from outsidethe state in meaningful quantities isextremely unlikely. As such, it is prudenttoexploreotheravenuestoobtainadequatesuppliesofgasolineanddiesel fuel tomakeupforareductionfromCaliforniarefineries
and the pipeline distribution network theyfeedintheaftermathofalargeearthquake.Fuelwaiversareonemeanstoenablefuel
tobetruckedandrailedintoCaliforniaratherquickly. Since California has its own fuelregulations,waiverswouldhave to involveboth theUSEPA (for federal reformulatedgasoline regulations) and the CaliforniaAir Resources Board (CARB) for theirCalifornia-specificgasoline regulation.” (G.Schremp,personalcommunication,August,13,2013).
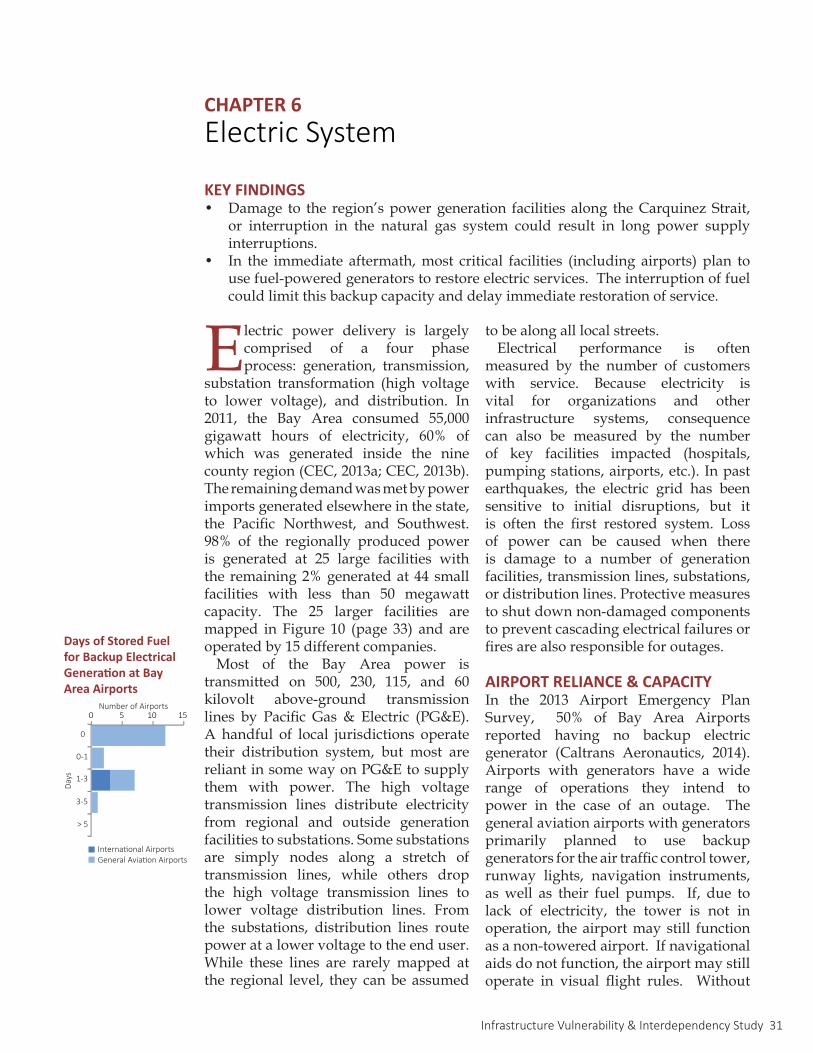
Infrastructure Vulnerability & Interdependency Study 31
Electric power delivery is largely comprised of a four phase process: generation, transmission,
substation transformation (high voltage to lower voltage), and distribution. In 2011, the Bay Area consumed 55,000 gigawatt hours of electricity, 60% of which was generated inside the nine county region (CEC, 2013a; CEC, 2013b). The remaining demand was met by power imports generated elsewhere in the state, the Pacific Northwest, and Southwest. 98% of the regionally produced power is generated at 25 large facilities with the remaining 2% generated at 44 small facilities with less than 50 megawatt capacity. The 25 larger facilities are mapped in Figure 10 (page 33) and are operated by 15 different companies.
Most of the Bay Area power is transmitted on 500, 230, 115, and 60 kilovolt above-ground transmission lines by Pacific Gas & Electric (PG&E). A handful of local jurisdictions operate their distribution system, but most are reliant in some way on PG&E to supply them with power. The high voltage transmission lines distribute electricity from regional and outside generation facilities to substations. Some substations are simply nodes along a stretch of transmission lines, while others drop the high voltage transmission lines to lower voltage distribution lines. From the substations, distribution lines route power at a lower voltage to the end user. While these lines are rarely mapped at the regional level, they can be assumed
to be along all local streets.Electrical performance is often
measured by the number of customers with service. Because electricity is vital for organizations and other infrastructure systems, consequence can also be measured by the number of key facilities impacted (hospitals, pumping stations, airports, etc.). In past earthquakes, the electric grid has been sensitive to initial disruptions, but it is often the first restored system. Loss of power can be caused when there is damage to a number of generation facilities, transmission lines, substations, or distribution lines. Protective measures to shut down non-damaged components to prevent cascading electrical failures or fires are also responsible for outages.
AIRPORT RELIANCE & CAPACITYIn the 2013 Airport Emergency Plan Survey, 50% of Bay Area Airports reported having no backup electric generator (Caltrans Aeronautics, 2014). Airports with generators have a wide range of operations they intend to power in the case of an outage. The general aviation airports with generators primarily planned to use backup generators for the air traffic control tower, runway lights, navigation instruments, as well as their fuel pumps. If, due to lack of electricity, the tower is not in operation, the airport may still function as a non-towered airport. If navigational aids do not function, the airport may still operate in visual flight rules. Without
CHAPTER 6Electric System
0
0-1
1-3
3-5
> 5
International AirportsGeneral Aviation Airports
Number of Airports
Days
0 5 10 15
International Airports
General Aviation Airports
Days of Stored Fuel for Backup Electrical Generation at Bay Area Airports
KEY FINDINGS• Damage to the region’s power generation facilities along the Carquinez Strait,
or interruption in the natural gas system could result in long power supply interruptions.
• In the immediate aftermath, most critical facilities (including airports) plan to use fuel-powered generators to restore electric services. The interruption of fuel could limit this backup capacity and delay immediate restoration of service.
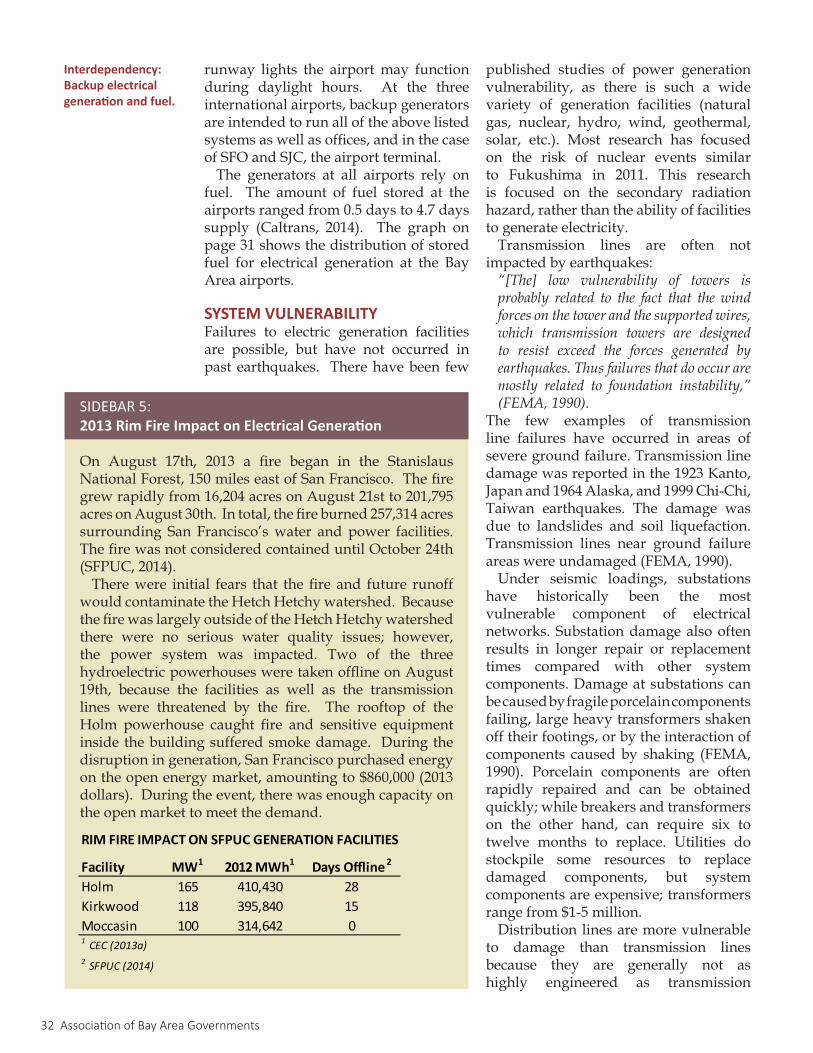
32 Association of Bay Area Governments
runway lights the airport may function during daylight hours. At the three international airports, backup generators are intended to run all of the above listed systems as well as offices, and in the case of SFO and SJC, the airport terminal.
The generators at all airports rely on fuel. The amount of fuel stored at the airports ranged from 0.5 days to 4.7 days supply (Caltrans, 2014). The graph on page 31 shows the distribution of stored fuel for electrical generation at the Bay Area airports.
SYSTEM VULNERABILITYFailures to electric generation facilities are possible, but have not occurred in past earthquakes. There have been few
published studies of power generation vulnerability, as there is such a wide variety of generation facilities (natural gas, nuclear, hydro, wind, geothermal, solar, etc.). Most research has focused on the risk of nuclear events similar to Fukushima in 2011. This research is focused on the secondary radiation hazard, rather than the ability of facilities to generate electricity.
Transmission lines are often not impacted by earthquakes: “[The] low vulnerability of towers isprobably related to the fact that thewindforcesonthetowerandthesupportedwires,which transmission towers are designedto resist exceed the forces generated byearthquakes.Thusfailuresthatdooccuraremostly related to foundation instability,”(FEMA,1990).
The few examples of transmission line failures have occurred in areas of severe ground failure. Transmission line damage was reported in the 1923 Kanto, Japan and 1964 Alaska, and 1999 Chi-Chi, Taiwan earthquakes. The damage was due to landslides and soil liquefaction. Transmission lines near ground failure areas were undamaged (FEMA, 1990).
Under seismic loadings, substations have historically been the most vulnerable component of electrical networks. Substation damage also often results in longer repair or replacement times compared with other system components. Damage at substations can be caused by fragile porcelain components failing, large heavy transformers shaken off their footings, or by the interaction of components caused by shaking (FEMA, 1990). Porcelain components are often rapidly repaired and can be obtained quickly; while breakers and transformers on the other hand, can require six to twelve months to replace. Utilities do stockpile some resources to replace damaged components, but system components are expensive; transformers range from $1-5 million.
Distribution lines are more vulnerable to damage than transmission lines because they are generally not as highly engineered as transmission
On August 17th, 2013 a fire began in the Stanislaus National Forest, 150 miles east of San Francisco. The fire grew rapidly from 16,204 acres on August 21st to 201,795 acres on August 30th. In total, the fire burned 257,314 acres surrounding San Francisco’s water and power facilities. The fire was not considered contained until October 24th (SFPUC, 2014).
There were initial fears that the fire and future runoff would contaminate the Hetch Hetchy watershed. Because the fire was largely outside of the Hetch Hetchy watershed there were no serious water quality issues; however, the power system was impacted. Two of the three hydroelectric powerhouses were taken offline on August 19th, because the facilities as well as the transmission lines were threatened by the fire. The rooftop of the Holm powerhouse caught fire and sensitive equipment inside the building suffered smoke damage. During the disruption in generation, San Francisco purchased energy on the open energy market, amounting to $860,000 (2013 dollars). During the event, there was enough capacity on the open market to meet the demand.
SIDEBAR 5: 2013 Rim Fire Impact on Electrical Generation
Facility MW1 2012 MWh1 Days Offline 2
Holm 165 410,430 28Kirkwood 118 395,840 15Moccasin 100 314,642 01 CEC (2013a)2 SFPUC (2014)
RIM FIRE IMPACT ON SFPUC GENERATION FACILITIES
Interdependency: Backup electrical generation and fuel.
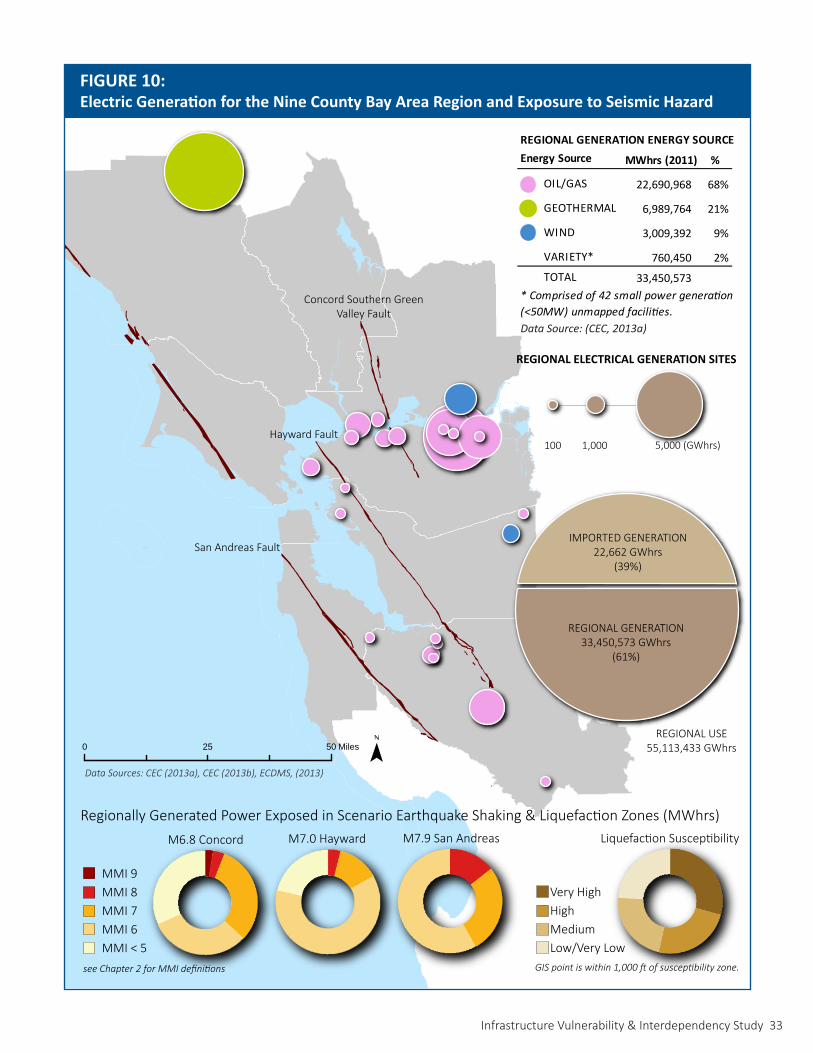
Infrastructure Vulnerability & Interdependency Study 33
FIGURE 10:Electric Generation for the Nine County Bay Area Region and Exposure to Seismic Hazard
REGIONAL ELECTRICAL GENERATION SITES
100 1,000 5,000 (GWhrs)
Regionally Generated Power Exposed in Scenario Earthquake Shaking & Liquefaction Zones (MWhrs)Liquefaction Susceptibility
Very HighHighMediumLow/Very Low
M7.9 San AndreasM7.0 HaywardM6.8 Concord
MMI 9MMI 8MMI 7MMI 6MMI < 5
REGIONAL GENERATION33,450,573 GWhrs
(61%)
IMPORTED GENERATION22,662 GWhrs
(39%)
REGIONAL USE55,113,433 GWhrs
MWhrs (2011) %
OIL/GAS 22,690,968 68%
GEOTHERMAL 6,989,764 21%
WIND 3,009,392 9%
VARIETY* 760,450 2%
TOTAL 33,450,573
Energy Source
* Comprised of 42 small power generation (<50MW) unmapped facilities.
REGIONAL GENERATION ENERGY SOURCE
Concord Southern Green Valley Fault
San Andreas Fault
Hayward Fault
see Chapter 2 for MMI definitions GIS point is within 1,000 ft of susceptibility zone.
Data Sources: CEC (2013a), CEC (2013b), ECDMS, (2013)
0 5025 Miles
Data Source: (CEC, 2013a)
34 Association of Bay Area Governments
systems. In addition to failures caused by ground failures, such as liquefaction or landslides, lines can be damaged by collapsed or partially collapsed nearby structures landing on the lines (FEMA, 1990). There are likely to be extensive failures to distribution networks, but components of these systems are readily available, and individual failures impact smaller subsets of a community.
BAY AREA VULNERABILITY ASSESSMENTBased on past earthquake damage and technical report documentation, only the energy generation and substations are likely to cause disruptions for a significant amount of time. Two areas of concern are underground transmission lines in San Francisco and Oakland that cross over very high liquefaction susceptibility zones. Unlike above ground transmission towers, below-ground lines are likely to require longer restoration times. Plans are in place to restore these lines with temporary above ground lines while underground lines are repaired.
Distribution line damage is likely due to ground failure as well as collocation with damaged/collapsed structures, and cascading damage caused by fire, gas leaks, and water leaks. Distribution line failures may require longer times to repair due to the number of potential failures, but will impact smaller portions of the population and will be most prevalent in areas with other barriers to recovery (building damage, major damage to other lifeline systems). Power generation and substations are explored in greater detail below.
Generation -- Damage to a percentage of electrical generation facilities could limit the quantity of power available to the region. This analysis examines the facilities within the region that produce 60% of the region’s energy use. While disruption in the other 40% would be significant, the sources of those facilities
are very geographically dispersed and are independent from most Bay Area earthquake events. Events similar to the 2013 Rim Fire (Sidebar 5, page 32) can impact external generation sources but are outside the scope of this study.
Of the regionally-generated power, two-thirds is produced by natural gas facilities, which are mostly located along the Carquinez Strait (see Figure 10, page 33), an area that is bisected by the Concord fault. Geothermal and wind generation represent the remaining third. The geothermal facilities are clustered in northern Sonoma County and cross into Lake County. Wind generation sites are located in southeastern Solano County and the Altamont Pass between Contra Costa and Alameda Counties.
Power plants are fairly well distributed around the region. The cluster of power plants in the Pittsburgh and Antioch area have the largest single contribution of any one area in the Bay Area. In the event natural gas lines are damaged, these facilities will be unable to generate electricity. Interim solutions could be adopted to provide power on an intermittent level if the lost generation cannot be made up by outside or peak generation facilities.
Substations -- There are over 425 substations in the Bay Area with varying degrees of age. Within the bounds of this study and given that only publicly available information was used, no analysis was completed on Bay Area substations. Past events highlight substations as the most vulnerable component of the electrical system. Priority customers, which include airports, can contact PG&E directly to inquire about system reliability. Airports and other key institutional facilities can use the protocol outlined in Appendix A to contact PG&E’s priority customer department.
Interdependency: Electrical generation and natural gas.
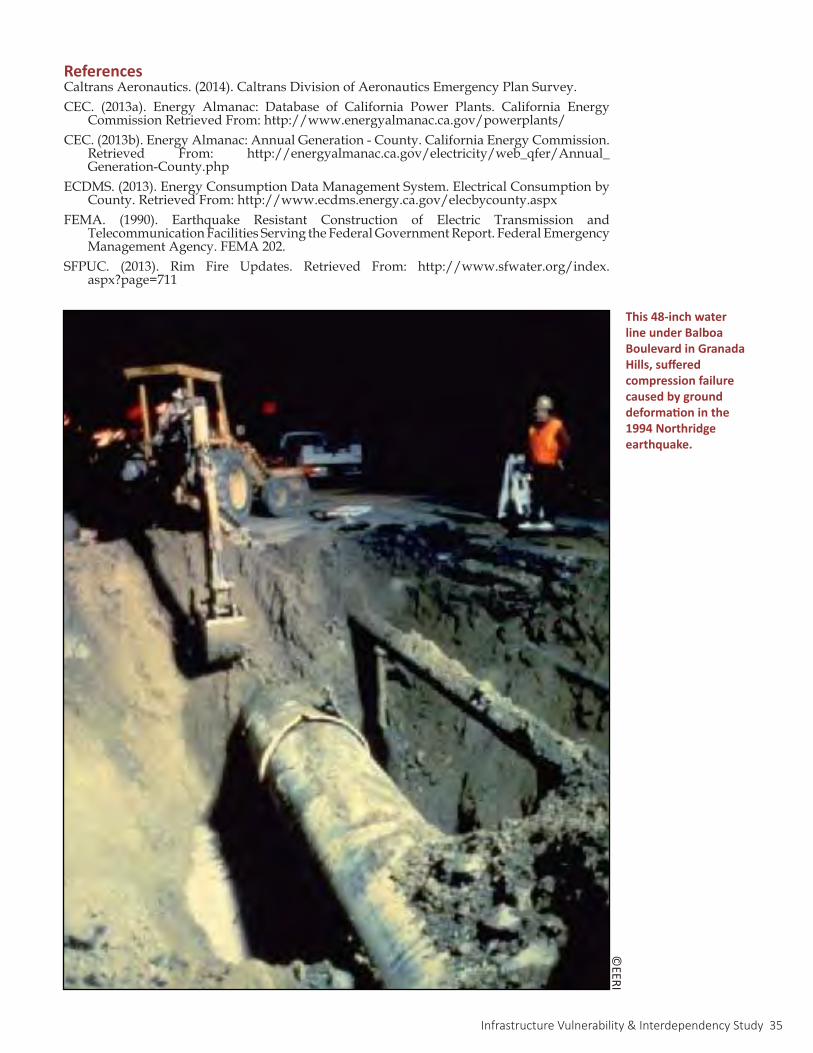
Infrastructure Vulnerability & Interdependency Study 35
ReferencesCaltrans Aeronautics. (2014). Caltrans Division of Aeronautics Emergency Plan Survey. CEC. (2013a). Energy Almanac: Database of California Power Plants. California Energy
Commission Retrieved From: http://www.energyalmanac.ca.gov/powerplants/CEC. (2013b). Energy Almanac: Annual Generation - County. California Energy Commission.
Retrieved From: http://energyalmanac.ca.gov/electricity/web_qfer/Annual_Generation-County.php
ECDMS. (2013). Energy Consumption Data Management System. Electrical Consumption by County. Retrieved From: http://www.ecdms.energy.ca.gov/elecbycounty.aspx
FEMA. (1990). Earthquake Resistant Construction of Electric Transmission and Telecommunication Facilities Serving the Federal Government Report. Federal Emergency Management Agency. FEMA 202.
SFPUC. (2013). Rim Fire Updates. Retrieved From: http://www.sfwater.org/index.aspx?page=711
©EERI
This 48-inch water line under Balboa Boulevard in Granada Hills, suffered compression failure caused by ground deformation in the 1994 Northridge earthquake.
36 Association of Bay Area Governments
The Bay Area’s water supply is distributed by 89 different water providers (districts, agencies,
and cities). Eleven providers distribute water to 93.7% of the Bay Area’s population; Table 3 breaks down the served population and water demand for the 11 studied districts (Note: Bay Area Water Supply & Conversation Agency (BAWSCA) represents 24 water districts that purchase water from SFPUC). These 11 districts distribute water locally, while
some also operate or coordinate intra-regional or inter-regional transmission water supply systems.
Airport RelianceAs an operational facility supporting staff and customers, airports require water for hydration and sanitation services. The take off and landings of airplanes is not impacted by water interruption.
System VulnerabilityAs with most other buried infrastructure, liquefaction is the hazard that causes the greatest percentage of pipeline failures. Water systems consist of a range of pipe diameters and materials, all of which are vulnerable to damage due to liquefaction and subsequent ground displacements. The systems are also reliant on a number of above ground components: water treatment facilities, pumping stations, and water storage (tanks and reservoirs). These components of a water system can be damaged by shaking and liquefaction and may take many weeks to restore. Sidebar 6 (page 37) explores the restoration of water systems following earthquakes that resulted in thousands of pipeline failures and the near failure of an above ground intake pumping facility.
All of the major water districts rely on reservoirs to collect local watershed runoff and store imported water. A
CHAPTER 7Water System
Water Agency Population PopulationMMWD 191,000 53 207,000 55 Sonoma CWA1 411,000 143 528,000 224 City of Napa 87,000 37 94,000 40 Solano CWA 280,000 535 350,000 614 2 .CCWD 495,000 445 635,000 611 EBMUD 1,340,000 663 1,750,000 703 Zone 7 220,000 181 291,000 209 2 .ACWD 340,000 130 411,000 159 SCVWD 1,782,000 912 2,431,000 1,159 BAWSCA 1,719,000 307 2,097,000 439 SFPUC 856,000 219 955,000 226 Total 7,721,000 3,626 9,749,000 4,438 BAWSCA Overlap 842,400 Total 11 Agencies 6,879,500 Total (Bay Area) 7,342,000 1 Wholesale agency. Populations based on cities that purchase from Sonoma CWA.2 Estimate based on 2030 projection Data Source (IRWMP, 2013) (2010 Urban Water Management Plans)
. 2010ac-ft/day ac-ft/day
TABLE 3: Current & Projected Population Served & Water Demand. 2035
KEY FINDINGS• Most of the 11 Bay Area water districts studied have multiple water sources
or have invested in robust, redundant, and repairable systems that contribute to system resilience. When reservoirs and groundwater reserves are above half full there is significant regional water storage to tap if regional systems require repair.
• Restoration of distribution systems in areas of liquefaction can require weeks to months. The regions three international airports, and a number of general aviation airports located on the bay margins, are in liquefaction susceptibility zones.
• Agencies dependent on Delta water would be significantly impacted if levees failed, causing flooding and salt water intrusion.
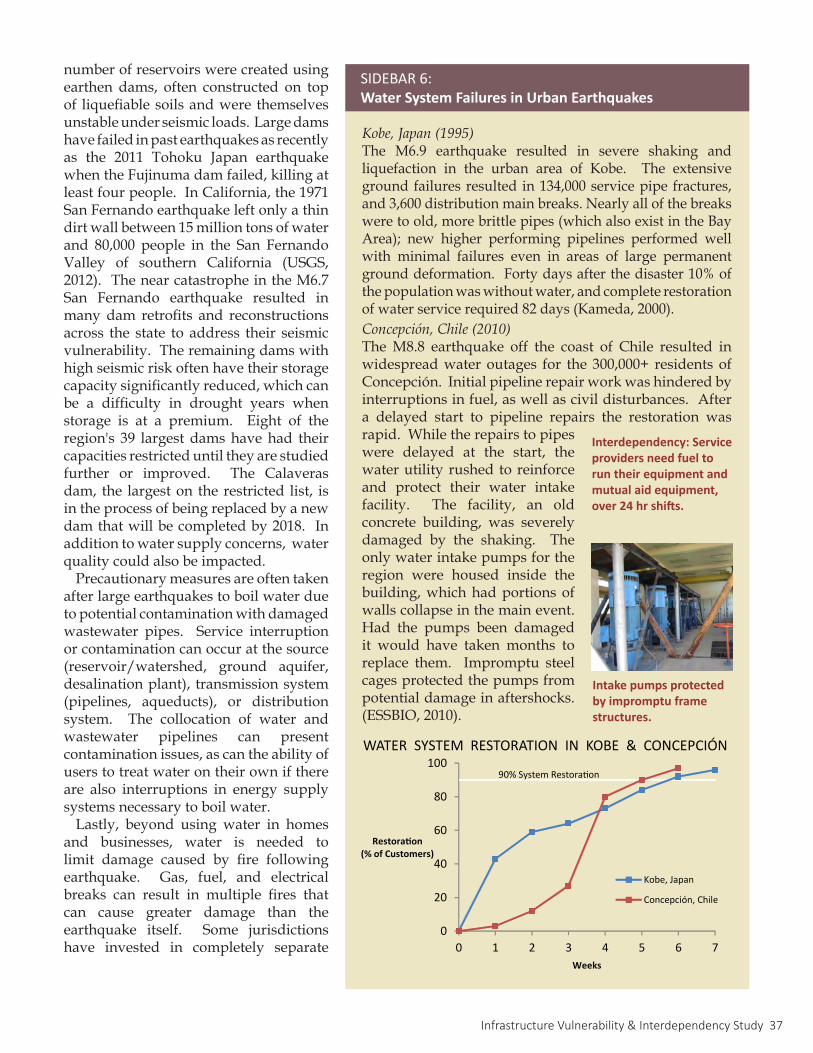
Infrastructure Vulnerability & Interdependency Study 37
number of reservoirs were created using earthen dams, often constructed on top of liquefiable soils and were themselves unstable under seismic loads. Large dams have failed in past earthquakes as recently as the 2011 Tohoku Japan earthquake when the Fujinuma dam failed, killing at least four people. In California, the 1971 San Fernando earthquake left only a thin dirt wall between 15 million tons of water and 80,000 people in the San Fernando Valley of southern California (USGS, 2012). The near catastrophe in the M6.7 San Fernando earthquake resulted in many dam retrofits and reconstructions across the state to address their seismic vulnerability. The remaining dams with high seismic risk often have their storage capacity significantly reduced, which can be a difficulty in drought years when storage is at a premium. Eight of the region's 39 largest dams have had their capacities restricted until they are studied further or improved. The Calaveras dam, the largest on the restricted list, is in the process of being replaced by a new dam that will be completed by 2018. In addition to water supply concerns, water quality could also be impacted.
Precautionary measures are often taken after large earthquakes to boil water due to potential contamination with damaged wastewater pipes. Service interruption or contamination can occur at the source (reservoir/watershed, ground aquifer, desalination plant), transmission system (pipelines, aqueducts), or distribution system. The collocation of water and wastewater pipelines can present contamination issues, as can the ability of users to treat water on their own if there are also interruptions in energy supply systems necessary to boil water.
Lastly, beyond using water in homes and businesses, water is needed to limit damage caused by fire following earthquake. Gas, fuel, and electrical breaks can result in multiple fires that can cause greater damage than the earthquake itself. Some jurisdictions have invested in completely separate
Kobe,Japan(1995)The M6.9 earthquake resulted in severe shaking and liquefaction in the urban area of Kobe. The extensive ground failures resulted in 134,000 service pipe fractures, and 3,600 distribution main breaks. Nearly all of the breaks were to old, more brittle pipes (which also exist in the Bay Area); new higher performing pipelines performed well with minimal failures even in areas of large permanent ground deformation. Forty days after the disaster 10% of the population was without water, and complete restoration of water service required 82 days (Kameda, 2000). Concepción,Chile(2010)The M8.8 earthquake off the coast of Chile resulted in widespread water outages for the 300,000+ residents of Concepción. Initial pipeline repair work was hindered by interruptions in fuel, as well as civil disturbances. After a delayed start to pipeline repairs the restoration was rapid. While the repairs to pipes were delayed at the start, the water utility rushed to reinforce and protect their water intake facility. The facility, an old concrete building, was severely damaged by the shaking. The only water intake pumps for the region were housed inside the building, which had portions of walls collapse in the main event. Had the pumps been damaged it would have taken months to replace them. Impromptu steel cages protected the pumps from potential damage in aftershocks. (ESSBIO, 2010).
SIDEBAR 6: Water System Failures in Urban Earthquakes
0
20
40
60
80
100
0 1 2 3 4 5 6 7
Restoration(% of Customers)
Weeks
WATER SYSTEM RESTORATION IN KOBE & CONCEPCIÓN
Kobe, Japan
Concepción, Chile
90% System Restoration
Intake pumps protected by impromptu frame structures.
Interdependency: Service providers need fuel to run their equipment and mutual aid equipment, over 24 hr shifts.
38 Association of Bay Area Governments
water systems to supply water to fight fires after an earthquake.
• City & County of San Francisco -- Auxilary Water Supply System
• City of Berkeley -- Berkeley Aboveground Water Supply System
Ensuring water to combat fires is critical to prevent even more damage propagation caused by fires following earthquake shaking.
BAY AREA VULNERABILITY ASSESSMENTThis study focuses on the reliability of the region’s water transmission systems and the capability of the local water storage to meet water needs if sources are interrupted. One way to think about the system is to treat the reservoirs as a fuse between the regional system and distribution system. Should a failure occur on the regional system the reservoir has storage to supply the distribution system, islanding the risk between the regional transmission systems and distribution systems.
The Bay Area’s water supply comes from a portfolio of sources. Figure 11 (page 39) illustrates the source of water for 11 of the largest districts. The Mokelumne and Hetch Hetchy systems supply the Bay Area exclusively, while both the Central Valley Project and State Water Project supply water to regions across California. Local supply is primarily surface water and ground water but also includes small shares of recycled water and desalination. Interruption to any of these five primary water supply systems could have severe impacts to certain water districts. CCWD, EBMUD, Zone 7, BAWSCA, and SFPUC all rely heavily on a single source of imported water. SCVWD, on the other hand, has four main sources of water increasing the odds that at least a portion of their supply will remain intact in a single event. For all districts reliant on imported water supplies if interruption of their source(s)were to occur, local sources and storage would be relied on until repairs were made to restore the transmission supply.
Over 200 reservoirs store water in the Bay Area all with varying owners and
operation goals. The 11 main water districts rely on 39 larger local reservoirs with a maximum storage capacity of 3 million acre-feet. More than half of the region’s reservoir capacity is behind Monticello Dam in Lake Berryessa. In addition to surface storage; SCVWD, ACWD, and Zone 7 rely on local ground water for a large percentage of their storage and emergency supply. Some agencies have years of supply stored behind reservoirs even when reservoirs are only half full, while others have only a few weeks of normal demand stored. Those with only a few weeks of reservoir storage do also have groundwater aquifers which should increase the length of time they can supply water in an emergency. Figure 12 (page 40) shows the relationship between a district’s average weekly water use and how much water is available when reservoirs are at 50% their total storage capacity. It also includes the addition of local groundwater reserves for the four districts with large aquifers.
To increase redundancy, many agencies have constructed interties, or links, between systems. An interties table in Figure 12 lists the known interties between systems and each interties sharing capacity. In the event that one system has lost its sources while others are unaffected, the interties can be used to share water during the interruption. The capacity of these interties supplies a fraction of the providers normal demand, but could be used effectively to provide emergency water, or redistribute water among intertied agencies.
Water from the Delta and Sierra are gravity fed and pumped through pipes and aqueducts from large reservoirs outside the region. Some systems have a single pipeline or aqueduct while others have multiple pipes and multiple routes through the region. SFPUC’s and EBMUD’s supply systems have been assessed through internal seismic studies resulting in impressive mitigative actions to their regional water supply systems. Both systems have improved their systems to be more robust, redundant, and repairable in high hazard areas.
Interdependency: Potable water contamination by collocation with wastewater and reliance on energy source to boil drinking water.
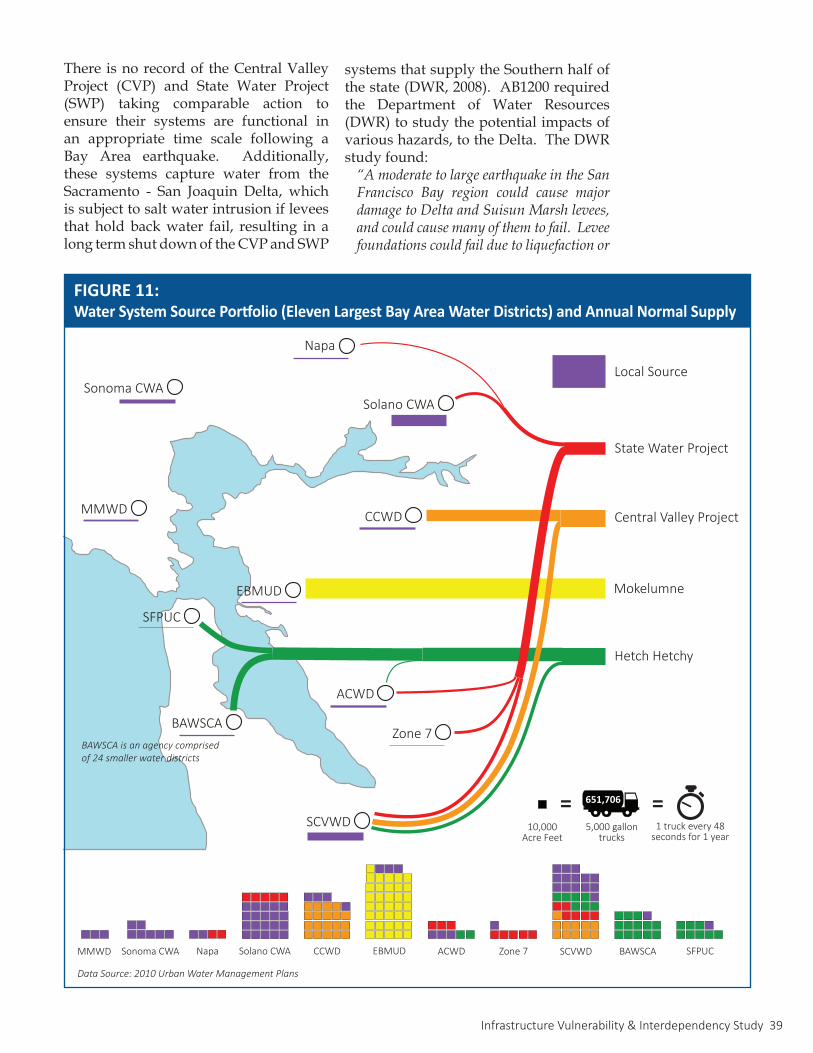
Infrastructure Vulnerability & Interdependency Study 39
There is no record of the Central Valley Project (CVP) and State Water Project (SWP) taking comparable action to ensure their systems are functional in an appropriate time scale following a Bay Area earthquake. Additionally, these systems capture water from the Sacramento - San Joaquin Delta, which is subject to salt water intrusion if levees that hold back water fail, resulting in a long term shut down of the CVP and SWP
systems that supply the Southern half of the state (DWR, 2008). AB1200 required the Department of Water Resources (DWR) to study the potential impacts of various hazards, to the Delta. The DWR study found:“AmoderatetolargeearthquakeintheSanFrancisco Bay region could cause majordamagetoDeltaandSuisunMarshlevees,andcouldcausemanyofthemtofail.Leveefoundationscouldfailduetoliquefactionor
FIGURE 11:Water System Source Portfolio (Eleven Largest Bay Area Water Districts) and Annual Normal Supply
Sonoma CWASolano CWA
MMWD CCWD
SFPUC
ACWD
BAWSCA
SCVWD
EBMUD
Zone 7
State Water Project
Hetch Hetchy
Mokelumne
Central Valley Project
Napa
Local Source
Sonoma CWA Solano CWAMMWD CCWD SFPUCACWD BAWSCASCVWDNapa EBMUD Zone 7
5,000 gallon trucks
10,000 Acre Feet
1 truck every 48 seconds for 1 year
== 651,706
Data Source: 2010 Urban Water Management Plans
BAWSCA is an agency comprised of 24 smaller water districts
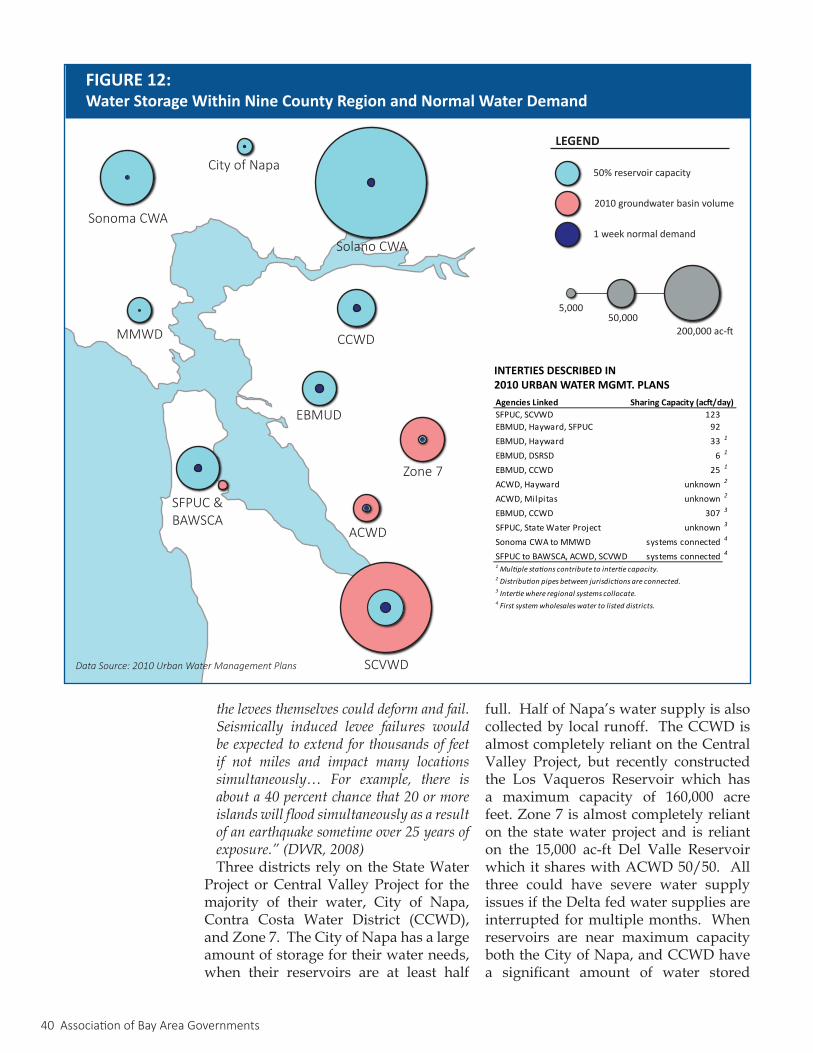
40 Association of Bay Area Governments
theleveesthemselvescoulddeformandfail.Seismically induced levee failures wouldbeexpectedtoextendforthousandsoffeetif not miles and impact many locationssimultaneously… For example, there isabouta40percentchancethat20ormoreislandswillfloodsimultaneouslyasaresultofanearthquakesometimeover25yearsofexposure.”(DWR,2008)Three districts rely on the State Water
Project or Central Valley Project for the majority of their water, City of Napa, Contra Costa Water District (CCWD), and Zone 7. The City of Napa has a large amount of storage for their water needs, when their reservoirs are at least half
full. Half of Napa’s water supply is also collected by local runoff. The CCWD is almost completely reliant on the Central Valley Project, but recently constructed the Los Vaqueros Reservoir which has a maximum capacity of 160,000 acre feet. Zone 7 is almost completely reliant on the state water project and is reliant on the 15,000 ac-ft Del Valle Reservoir which it shares with ACWD 50/50. All three could have severe water supply issues if the Delta fed water supplies are interrupted for multiple months. When reservoirs are near maximum capacity both the City of Napa, and CCWD have a significant amount of water stored
MMWD
SCVWD
Zone 7
ACWD
EBMUD
CCWD
Solano CWA
City of Napa
Sonoma CWA
SFPUC & BAWSCA
FIGURE 12:Water Storage Within Nine County Region and Normal Water Demand
LEGEND
2010 groundwater basin volume
50% reservoir capacity
1 week normal demand
50,0005,000
INTERTIES DESCRIBED IN 2010 URBAN WATER MGMT. PLANS
SFPUC, SCVWD 123EBMUD, Hayward, SFPUC 92EBMUD, Hayward 33 1
EBMUD, DSRSD 6 1
EBMUD, CCWD 25 1
ACWD, Hayward unknown 2
ACWD, Milpitas unknown 2
EBMUD, CCWD 307 3
SFPUC, State Water Project unknown 3
Sonoma CWA to MMWD systems connected 4
systems connected 4
1 Multiple stations contribute to intertie capacity.2 Distribution pipes between jurisdictions are connected.3 Intertie where regional systems collocate.4 First system wholesales water to listed districts.
Agencies Linked Sharing Capacity (acft/day)
SFPUC to BAWSCA, ACWD, SCVWD
200,000 ac-ft
Data Source: 2010 Urban Water Management Plans
Infrastructure Vulnerability & Interdependency Study 41
within the region, while Zone 7 relies on groundwater storage to meet emergency needs.
Because of the overall distributed portfolio of sources regional water supply should be fairly reliable post-earthquake, assuming that reservoirs are at least half full, groundwater reserves are high, and damaged regional water components can be repaired in months following an earthquake. An earthquake occuring during extended drought conditions would test the systems more severely. When there is stored water within the region, there is capacity for
the water system to operate in isolation from water sources outside the region. This is important if multiple months are needed to repair severe damage to one of the regional systems. In a drought, it is possible that these reserves will be less sufficient to supply water while regional systems are repaired.
This study only examines the vulnerability of the regional portions of water systems. As seen in Sidebar 6 (page 37), an earthquake can cause severe damage to aged distribution pipes, requiring weeks if not months, to restore water to all customers.
ReferencesIRWMP. (2013) San Francisco Bay Area Integrated Regional Water Management Plan.
Integrated Regional Water Management Plan. August 2013.ACWD. (2011) Urban Water Management Plan 2010-2015. Alameda County Water District.CCWD. (2011) Urban Water Management Plan. Contra Costa Water District. June 2011.City of Napa. (2011) Urban Water Management Plan 2010 Update. City of Napa Public Works
Division. June 2011.DWR. (2008) Risks and Options to Reduce Risks to Fishery and Water Supply Uses of the
Sacramento/San Joaquin Delta. Department of Water Resources, Department of Fish and Game. January 2008. Retrieved From: http://www.water.ca.gov/floodsafe/fessro/levees/drms/docs/AB1200_Report_to_Legislature.pdf
EBMUD. (2011) Urban Water Management Plan 2010. East Bay Municipal Utility District. June 2011.
ESSBIO. (2010). Reconstruyendo Nuestro Servicio. Presentation. Concepcion, Chile. August 29, 2010.
Kameda, H. (2000). Engineering Management of Lifeline Systems Under Earthquake Risk, 12th World Conference on Earthquake Engineering
MMWD. (2011) 2010 Urban Water Management Plan. Marin Municipal Water District. June 2011.
SCVWD. (2012) Groundwater Management Plan. Santa Clara Valley Water District.SCVWD. (2011) Urban Water Management Plan 2010. Santa Clara Valley Water District.SFPUC. (2011) 2010 Urban Water Management Plan. San Francisco Public Utilities Commission.
June 2011.Solano CWA. (2011) 2010 Urban Water Management Plan. Solano County Water Agency.Sonoma CWA. (2011) 2010 Urban Water Management Plan. Sonoma County Water Agency.
June 2011.USGS. Page R., Boore M., Yerkes, R. (2012). The Los Angeles Dam Story. U.S. Geological
Survey. July 24, 2012. Retrieved From: http://earthquake.usgs.gov/learn/publications/la-damstory/
Zone 7. (2010) 2010 Urban Water Management Plan. Zone 7 Water Agency. December 2010.
42 Association of Bay Area Governments
Infrastructure system failures in an earthquake can be caused by both earthquake damage and
interdependencies. Chapters 2 through 7 highlight the interaction between earthquake hazards and individual systems. In this chapter, interactions between infrastructure systems are organized and implicitly explored.
In many urban earthquakes, systems can have negative cascading effects where the failure of one system causes the failure of another (Kameda, 2000). The inclusion of interdependencies in the study of systems and their performance is critical in properly understanding the overall impact an earthquake may have on individual systems. Sidebar 7 (page 43) highlights how power restoration timelines for Southern California Edison were drastically increased after the inclusions of interdependencies.
TYPES OF INTERDEPENDENCIESInfrastructure interdependence is the interaction of one system on another and is used to describe a number of different interactions. In this section, four common types of interdependencies are defined with a case example.
(1) Cascading outages –- the failure of one system causes another to shut down until the system is restored. Example: A cell tower without batteries loses electricity and shuts down until electricity is brought back online.
(2) Cascading failure –- a failure results in physical damage to another system. This can be caused by collocation of systems, or by an inability of systems to safely shut down in an outage. Example: A water main break causes damage to nearby sewer and gas lines as well as the roadway above, or an electrical outage
causes a sump pump to fail, flooding a roadway.
(3) Influence on recovery –- a system outage slows the repair of other systems. Example: Impassable roadways prevent telecommunications repair crews from reaching damaged sites.
(4) Multi-system processes -– a process requires two functional systems, and one of the systems does not function. Example: vehicle transportation requires both a drivable road network and fuel. If roads are not damaged, but fuel is interrupted, transportation does not work.
Interdependencies can hinder function, hinder repair, or physically damage systems. The interactions can occur both within a system and across systems and is used to describe the snowball effect of one failure on all systems. In the Bay Area, these interdependencies were evident in the Loma Prieta earthquake and the 2010 San Bruno pipeline failure.
In Santa Cruz after the Loma Prieta earthquake, a 35-hour power outage at a wastewater pumping station resulted in an 800,000 gallon raw sewage release (Schiff, 1990). The wastewater facility was not damaged by the earthquake, but the dependence on electricity resulted in the sewage release. This same interdependence was also experienced in Southern California when a cascading power grid failure caused by maintenance work at a substation outside Yuma, Arizona sparked a rapid-fire 11-minute sequence of system failures where portions of California, Arizona, and Mexico lost power in 2011 (Lee, 2012). In San Diego, the electrical outage caused huge transportation delays and was responsible for more than two million gallons of sewage discharge (CBS, 2011).
CHAPTER 8Interdependencies
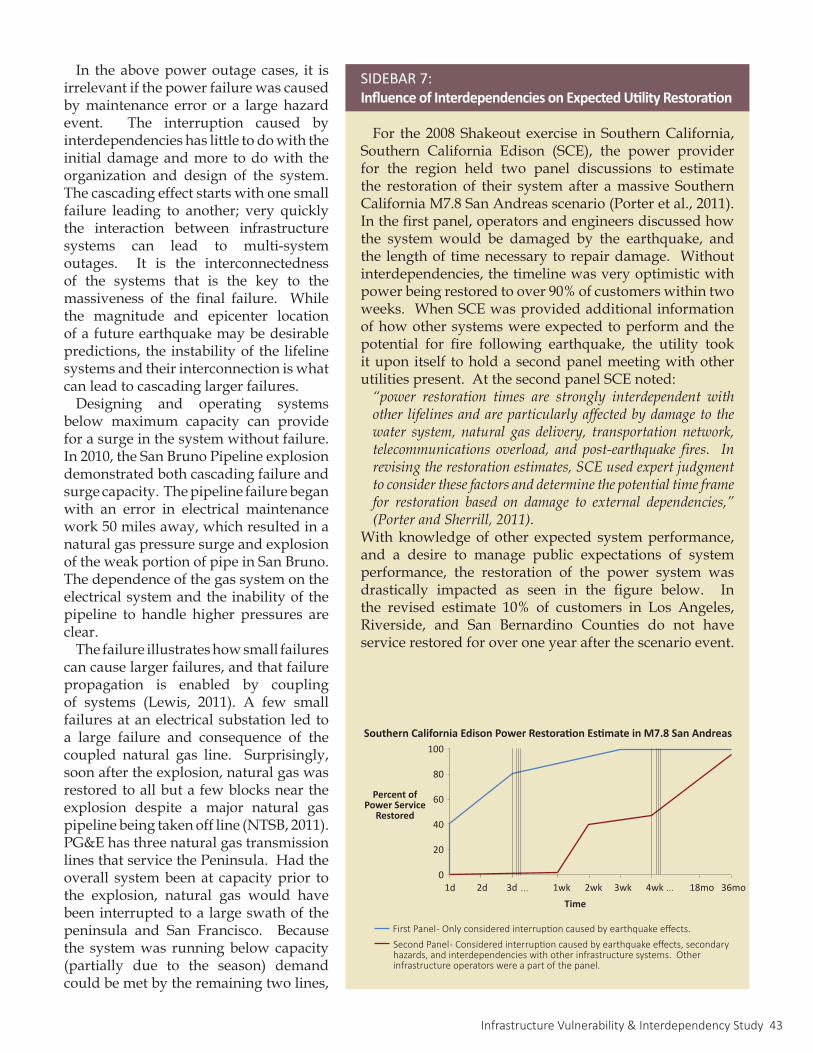
Infrastructure Vulnerability & Interdependency Study 43
For the 2008 Shakeout exercise in Southern California, Southern California Edison (SCE), the power provider for the region held two panel discussions to estimate the restoration of their system after a massive Southern California M7.8 San Andreas scenario (Porter et al., 2011). In the first panel, operators and engineers discussed how the system would be damaged by the earthquake, and the length of time necessary to repair damage. Without interdependencies, the timeline was very optimistic with power being restored to over 90% of customers within two weeks. When SCE was provided additional information of how other systems were expected to perform and the potential for fire following earthquake, the utility took it upon itself to hold a second panel meeting with other utilities present. At the second panel SCE noted: “power restoration times are strongly interdependent withotherlifelinesandareparticularlyaffectedbydamagetothewater system,natural gasdelivery, transportationnetwork,telecommunications overload, and post-earthquake fires. Inrevisingtherestorationestimates,SCEusedexpertjudgmenttoconsiderthesefactorsanddeterminethepotentialtimeframefor restoration based on damage to external dependencies,”(PorterandSherrill,2011).
With knowledge of other expected system performance, and a desire to manage public expectations of system performance, the restoration of the power system was drastically impacted as seen in the figure below. In the revised estimate 10% of customers in Los Angeles, Riverside, and San Bernardino Counties do not have service restored for over one year after the scenario event.
SIDEBAR 7: Influence of Interdependencies on Expected Utility Restoration
In the above power outage cases, it is irrelevant if the power failure was caused by maintenance error or a large hazard event. The interruption caused by interdependencies has little to do with the initial damage and more to do with the organization and design of the system. The cascading effect starts with one small failure leading to another; very quickly the interaction between infrastructure systems can lead to multi-system outages. It is the interconnectedness of the systems that is the key to the massiveness of the final failure. While the magnitude and epicenter location of a future earthquake may be desirable predictions, the instability of the lifeline systems and their interconnection is what can lead to cascading larger failures.
Designing and operating systems below maximum capacity can provide for a surge in the system without failure. In 2010, the San Bruno Pipeline explosion demonstrated both cascading failure and surge capacity. The pipeline failure began with an error in electrical maintenance work 50 miles away, which resulted in a natural gas pressure surge and explosion of the weak portion of pipe in San Bruno. The dependence of the gas system on the electrical system and the inability of the pipeline to handle higher pressures are clear.
The failure illustrates how small failures can cause larger failures, and that failure propagation is enabled by coupling of systems (Lewis, 2011). A few small failures at an electrical substation led to a large failure and consequence of the coupled natural gas line. Surprisingly, soon after the explosion, natural gas was restored to all but a few blocks near the explosion despite a major natural gas pipeline being taken off line (NTSB, 2011). PG&E has three natural gas transmission lines that service the Peninsula. Had the overall system been at capacity prior to the explosion, natural gas would have been interrupted to a large swath of the peninsula and San Francisco. Because the system was running below capacity (partially due to the season) demand could be met by the remaining two lines,
1d 2d 3d 1wk 2wk 3wk 4wk 18mo 36mo
100
80
60
40
20
0
Time
Percent of Power Service
Restored
First Panel - Only considered interruption caused by earthquake effects. Second Panel - Considered interruption caused by earthquake effects, secondary hazards, and interdependencies with other infrastructure systems. Other infrastructure operators were a part of the panel.
... ...
Southern California Edison Power Restoration Estimate in M7.8 San Andreas
44 Association of Bay Area Governments
so no natural gas outage occurred. The San Bruno and electrical outage
impacts on waste water systems all highlight the independence of space – the original failure began miles away from subsequent larger failures. Interdependence can also be caused by the collocation of systems, or more simply put their close proximity. Systems are often collocated due to the environment’s physical constraints. Many corridors through mountain passes bunch lifelines together; in urban environments public right of ways bunch systems together. When infrastructure systems are collocated a single failure can damage other systems unaffected by the hazard. In the San Bruno case, had the PG&E pipeline ruptured along another section where it runs adjacent to one of the other natural gas transmission pipelines, the collocation of the pipes would have resulted in failure of both pipes, and a natural gas outage for the San Francisco Peninsula. In addition to collocation causing damage across systems, it can slow restoration. Repair crews can be delayed by safety concerns, or by multiple crews working in the same area. Gas and wastewater leaks can slow the restoration of other systems. In Loma Prieta, crews were slowed when repairing damaged lifelines adjacent to buildings at risk of collapse (Schiff, 1990).
Lastly, it is important for airports and other stakeholders to consider which infrastructure systems are needed to accomplish a process. When assessing all systems within a region, studying the differences in system performance may reveal imbalances that limit the utility of resilient systems. Consider the sample process of commuting to work and the interaction between roadways
and the fuel sector. For commuters that rely on personal vehicles to get from home to work, or in the case of airports, their ability to get passengers and cargo from the airport to their final destination requires both roads and fuel. The process cannot be completed unless both systems are operating. Airports and other stakeholders must understand which systems are needed to complete necessary tasks.
SF LIFELINES INTERDEPENDENCIES STUDYIn 2014, the City and County of San
Francisco’s Lifeline Council published its first Lifelines Interdependence Study. The report was generated under the umbrella of the Lifelines Council, a pioneering council made up of utility operators that service the City. For the study, past research and utility interviews were used to roughly quantify the interdependence between systems. Figure 13 (page 45) shows the matrix of interdependence between twelve important systems for the City and County of San Francisco. This information was then taken and displayed with lines. It is clear from both graphics that fuel is the system most relied on by all other systems. All other systems had a significant interaction with the fuel sector. Roads, electricity, telecom, and water were also main systems relied on by others.
The San Francisco study was completed for the City. The relationship for other cities may be different, but the overall interactions are likely to be fairly similar for the Bay Area region as a whole. The study is a testament to the work that a Lifelines Council can achieve, and should be used as a model to approach issues of infrastructure vulnerability and interdependence for the Bay Area region.
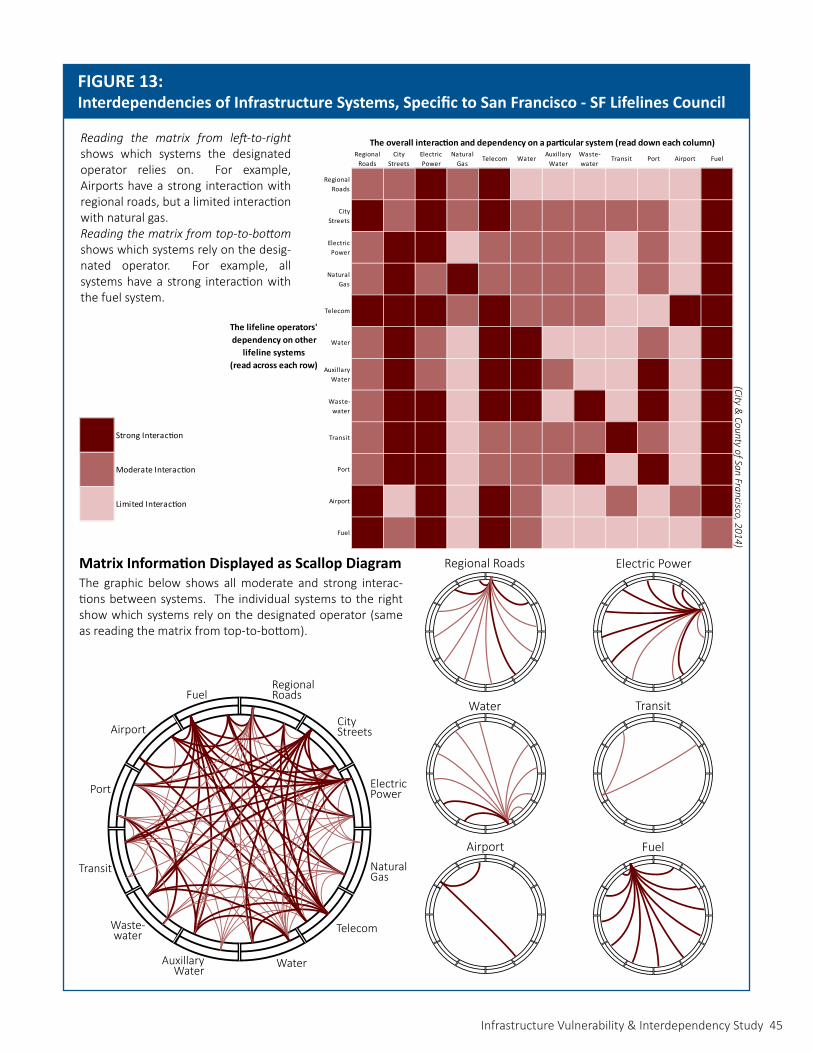
Infrastructure Vulnerability & Interdependency Study 45
FIGURE 13:Interdependencies of Infrastructure Systems, Specific to San Francisco - SF Lifelines Council
Matrix Information Displayed as Scallop Diagram
Reading the matrix from left-to-right shows which systems the designated operator relies on. For example, Airports have a strong interaction with regional roads, but a limited interaction with natural gas. Reading the matrix from top-to-bottom shows which systems rely on the desig-nated operator. For example, all systems have a strong interaction with the fuel system.
The graphic below shows all moderate and strong interac-tions between systems. The individual systems to the right show which systems rely on the designated operator (same as reading the matrix from top-to-bottom).
(City & County of San Francisco, 2014)
FuelRegionalRoads
CityStreets
ElectricPower
NaturalGas
Telecom
WaterAuxillaryWater
Waste-water
Transit
Port
Airport
Transit
Regional Roads
Water
Airport
Electric Power
Fuel
3Strong Interaction
2Moderate Interaction
1Limited Interaction
RegionalRoads
CityStreets
ElectricPower
NaturalGas
Telecom WaterAuxillary
WaterWaste-water
Transit Port Airport Fuel
RegionalRoads 2 2 3 2 3 1 1 1 1 1 1 3
CityStreets 3 2 3 2 3 2 2 2 2 2 1 3
ElectricPower 2 3 3 1 2 2 2 2 1 2 1 3
NaturalGas 2 3 2 3 2 2 2 2 1 2 1 3
Telecom3 3 3 2 3 2 2 2 1 1 3 3
Water2 3 2 1 3 3 1 1 1 2 1 3
AuxillaryWater 2 3 2 1 3 3 2 1 1 3 1 3
Waste-water 2 3 3 1 3 3 1 3 1 3 1 3
Transit2 3 3 1 2 2 2 2 3 2 1 3
Port2 3 3 1 2 2 2 3 1 3 1 3
Airport3 1 3 1 3 2 1 1 2 1 2 3
Fuel3 2 3 1 3 2 1 1 1 1 1 2
The overall interaction and dependency on a particular system (read down each column)
The lifeline operators' dependency on other
lifeline systems(read across each row)
46 Association of Bay Area Governments
ReferencesCity & County of San Francisco. (2014). Lifelines Interdependency Study I Report. City &
County of San Francisco, Office of the City Administrator. April 17, 2014. Lewis, T., Mackin, T., Darken, R. (2011). Critical Infrastructure as complex Emergent Systems,
International Journal of Cyber Warfare & Terrorism.NTSB. (2011). Pacific Gas and Electric Company Natural Gas Transmission Pipeline Rupture
and Fire San Bruno, California September 9, 2010. National Transportation Safety Board. Accident Report NTSB/PAR-11/01 PB2011-916501. Retrieved From: http://www.ntsb.gov/doclib/reports/2011/PAR1101.pdf
Porter, K., Jones, L., Cox, D., Goltz, J., Hudnut, K., Mileti, D., Perry, S., Ponti, D., Reichle, M., Rose, A., Scawthorn, C., Seligson, H., Shoaf, K., Treiman, J., Wein, A. (2011). The ShakeOut Scenario: A Hypothetical Mw7.8 Earthquake on the Southern San Andreas Fault. Earthquake Spectra. Vol 27, No. 2. May 20110.
Porter, K., Sherrill, R. (2011) Utility Performance Panels in the ShakeOut Scenario. Earthquake Spectra. Vol 27, No. 2. May 20110.
Infrastructure Vulnerability & Interdependency Study 47
APPENDIX APG&E Commercial Buisness CenterThe PG&E Energy Solutions and Service Department is responsible for maintaining a close working relationship with all of our large commercial customers for all of their energy needs. There is a local PG&E Major Account Manager assigned to each of the large Bay Area Airports. Below is an excerpt describing the PG&E program:
One of the most critical priorities of our large commercial customers is to obtain detailed and timely outage communications throughout an outage and restoration process. As a result, each PG&E Major Account Manager has already established an ongoing open line of communication with the local airport Director of Engineering/Facilities regarding local G&E service and reliability. This includes detailed discussions on exchanging key current 24/7 outage and emergency contact information for each airport and the local PG&E First Responder Teams. We have also established how our customers should report reliability issues, outages, emergencies, etcetera; when they occur. Additionally PG&E outage information systems will often automatically notify the assigned account manager, On Call Reps, and our local restoration leads etcetera, when an outage/service reliability issue occurs. We will then proactively initiate outage restoration and major customer outage communication services until the problem is resolved.
To enquire about this relationship PG&E’s Commercial Business Center can be contacted at: 1(800) 468-4743.

Metro CenterEighth & Oak StreetsOakland, CA(510) 464-7900
Mailing Address:P.O. Box 2050Oakland, CA 94604-2050