state diagram and water sorption isotherm of …
TRANSCRIPT

1
STATE DIAGRAM AND WATER ADSORPTION ISOTHERM OF RASPBERRY 1
(Rubus idaeus) 2
3
4
5
Roopesh M. Syamaladevi1, Shyam S. Sablani1*, Juming Tang1, 6
Joseph Powers2 and Barry G. Swanson2 7
8
1Biological Systems Engineering Department, Washington State University, P.O Box 9
646120, Pullman WA 99164-6120, USA 10
11
2Department of Food Science and Human Nutrition, Washington State University, 12
P.O Box 6463760, Pullman WA 99164-6376, USA 13
14
15
16
17
18
19
20
21
*Corresponding author 22
(Email: [email protected]; Tel: +509 335 7745; Fax: +509 335 2722) 23

2
ABSTRACT 24
Thermal transitions of freeze-dried raspberry powder (Rubus idaeus) were analyzed by 25
using differential scanning calorimetry. Freeze-dried raspberry powders containing 26
unfreezable and freezable water were examined to develop a state diagram of raspberry. 27
The state diagram of freeze-dried raspberry powders included the glass line; glass 28
transition temperature versus solids content, freezing curve; initial freezing point versus 29
solids content; end point of freezing Tm’, corresponding solids content Xs’, characteristic 30
glass transition Tg’ and corresponding solids contents Xs” of maximally-freeze-31
concentrated raspberry. The conditions of the maximal-freeze-concentrate obtained from 32
freezing curve corresponded to Tm’ = -38oC and Xs’ =0.78 kg solids/kg raspberry and Tg’ 33
= -47oC and Xs”= 0.82 kg solids/kg raspberry. The Tg’ was determined by extending the 34
freezing curve to glass line. The quantities of unfreezable water identified from enthalpy 35
data and the freezing curve were comparable. Adsorption isotherms of freeze-dried 36
raspberries were determined at room temperature by the isopiestic method and the data 37
was modeled with BET and GAB equations. The BET and GAB monolayer moisture 38
contents were observed as 0.045 and 0.074 kg water/kg dry raspberry solids, respectively. 39
The state diagram and water sorption properties of raspberries are useful in optimizing 40
the retention of anthocyanins, phenolics concentrations and antioxidant activities in 41
freeze-dried and frozen raspberries during storage. 42
43
44
Keywords: Differential scanning calorimeter, glass transition, Gordon-Taylor equation, 45
maximal-freeze-concentration, state transition, water activity, GAB model 46

3
INTRODUCTION 47
A state diagram of food presents different physical states of food as a function of 48
solids content and temperature. The role of the state diagram of food materials in 49
determining processing and storage stability is highlighted in a number of studies 50
(Rahman 2006; Sablani et al., 2004; Champion et al., 2000; Goff and Sahagian, 1996; Sa 51
and Sereno, 1994; Roos and Karel, 1991; Slade and Levine, 1991). The state diagram 52
consists of a freezing curve of initial freezing point versus solids content, a solubility 53
curve of solids fraction in a saturated aqueous solution at a given temperature, the 54
eutectic point, a glass line of glass transition temperature versus solids content, and 55
conditions of maximal-freeze-concentration (Rahman, 2006). The concept of glass 56
transition was investigated extensively in polymer, material, pharmaceutical and food 57
sciences to relate physical, chemical and structural changes in the physical state of 58
material. Glass transition is a nature of second order time-temperature dependent 59
transition of physical state of a material. During glass transition temperature change, 60
material transforms from a relatively stable glassy state to a metastable rubbery state or 61
vice versa. As a result of the industrial relevance and scientific interest of glass transition 62
research, researchers continue to discuss the application of glass transition as a tool for 63
predicting the microbiological, physical and chemical changes that occur during 64
processing and storage (Sablani et al., 2007a-c; Kasapis et al., 2007; Rahman, 2006; 65
Khalloufi and Ratti, 2003; Champion et al., 2000; Karel et al., 1994; Kerr et al., 1993; 66
Roos and Karel, 1991; Slade and Levine, 1991). 67
Raspberries (Rubus idaeus) are commercial fruits used industrially for formulating 68
jam, jelly, sauce, puree, topping, syrup or juice concentrates. Raspberry fruit is well 69

4
recognized for health promoting constituents. Raspberries are rich in potential antioxidant 70
phenolic compounds including anthocyanins. Studies evaluate the potential role of 71
raspberries in preventing chronic stress, cancer and heart diseases (Zhang et al., 2005; 72
Wang et al., 2000). Anthocyanins and phenolic compounds are susceptible to 73
deterioration during processing and storage conditions (Sadilova et al., 2006). Stability of 74
bioactive compounds during processing and storage is important to the food industry. 75
Glass transition temperature data are reported for several fruits (tomato, dates, pine- 76
apple and grapes) but a complete state diagram using glass lines and freezing curves are 77
reported only for selected fruits (apples, strawberries, grapes and dates) (Bai et al., 2001; 78
Kasapis et al., 2000; Rahman, 2004; Sa and Sereno, 1994; Sa et al., 1999). Khalloufi et 79
al. (2000) examined glass transition temperatures of raspberries, blueberries, strawberries 80
and blackberries as a function of water contents. The glass transition temperatures of the 81
berries decrease as water contents increase. Since soluble solids of berries are mostly 82
sugars, the glass transition temperature of the freeze-dried powder is associated with the 83
glass transition temperatures of glucose and fructose. However the studies related to 84
freezing curve and conditions of maximally freeze-concentration for berries including 85
raspberries are not reported in the literature. This information on maximal freeze 86
concentration of berries is important to develop a complete state diagram useful in 87
studying stability of anthocyanins and other bioactive compounds in frozen and dried 88
raspberries. 89
The objectives of the current study is to develop a state diagram for freeze-dried 90
raspberries by determining glass line (Tg versus total solids content), freezing curve 91
(initial freezing temperature versus total solids content) and maximal-freeze-92

5
concentration conditions (Tm’, Tg’, Xs’). In addition, a water adsorption isotherm is 93
determined to evaluate and compare a stability criterion with the concept of glass 94
transition. 95
96
MATERIALS AND METHODS 97
Red raspberry fruits (Rubus idaeus) grown in Vancouver, WA were collected and 98
frozen immediately at -37oC for 48 h. The frozen raspberries were layered in the metal 99
trays of freeze dryer (Virtis freeze mobile 24 with Unitop 600L, VirTis SP Industries Co., 100
New York) to decrease the water content. The shelf temperature was set at -20oC with a 101
vacuum of 20 Pa. The temperature of the condenser was adjusted to -60oC. After 48 h of 102
freeze drying, the raspberries were removed and ground immediately to a fine powder 103
with a mortar and pestle. The moisture content of the raspberry powder was 0.042 kg 104
H2O/kg dry raspberry solids. The raspberry powder was placed in open weighing bottles 105
and equilibrated for three to four weeks with saturated salt solutions of constant water 106
activities in airtight containers (volume: 2.5×10⁻³ m3) at room temperature (23oC). The 107
salts used were: LiCl, CH3COOK, MgCl2, K2CO3, MgNO3, NaNo2, NaCl and KCl 108
(Fisher Scientific, Houston, TX) with equilibrium relative humidities of 11.3, 22.5, 32.8, 109
43.2, 52.9, 65.8, 75 and 86%, respectively. Relative humidity values for the saturated salt 110
solutions were obtained from Greenspan (1977). A small amount of thymol was placed 111
inside the airtight containers to avoid microbial growth in raspberry powders. 112
After equilibration triplicate of 1 g raspberry powder samples were used to determine 113
the water content in a vacuum oven. For this, raspberry powders in aluminum weighing 114
dishes were placed inside a vacuum oven at 80oC for 10 h. The pressure inside the 115

6
chamber was 10 kPa. The dried raspberry powders obtained after vacuum oven drying 116
were stored under dark and dry conditions for thermal transition experiments. Triplicate 117
samples of high moisture raspberry powders (0.30, 0.40, 0.50, 0.60, 0.70 and 0.80 kg 118
H2O/kg raspberry) were prepared by adding precalculated amount of distilled water to 119
the dried raspberry powders obtained after the freeze drying. The raspberry powders were 120
mixed with water in a small beaker and sealed with aluminum foil to avoid moisture loss. 121
The prepared raspberries were equilibrated at 4oC for 24 h before experimentation. 122
123
Determination of thermal transitions 124
The thermal transition experiments in freeze-dried raspberry powder were conducted 125
with a differential scanning calorimeter (DSC, Q2000, TA Instruments, New Castle, DE). 126
The calorimeter was calibrated by checking standard temperatures and enthalpies of 127
fusion for indium and sapphire. The raspberry powders were cooled by a mechanical 128
refrigerated cooling system. An empty sealed aluminum pan was used as a reference in 129
each test. Following equilibration, 10-20 mg raspberry powders were sealed in aluminum 130
pans (volume 30μL) and cooled from room temperature to -90oC at 5oC/min and 131
equilibrated for 10 min. Raspberry powders were scanned from -90oC to 70oC at a rate of 132
5oC/min. Initially selected sample with moisture content of 0.034 kg H2O/kg raspberry 133
powder was scanned at 1, 2, 5, 10 and 20oC/min and scan rate of 5oC/min was selected 134
for subsequent analysis. The scan rate of 5oC/min is commonly used for determination of 135
glass transition temperature. DSC produces heat flow (W/g) versus temperature 136
thermograms. The glass transition temperature (Tg) is identified as a (vertical) shift in the 137
heat flow curve of thermogram. TA Instruments Universal analysis software was used to 138

7
analyze the onset, mid and end points of the glass transition. Three replicates were used 139
for the determination of glass transition temperatures at each water content/water activity. 140
In addition, freeze-dried raspberry powders with moisture of 0.042 kg H2O/kg raspberry 141
were further dried in a vacuum oven to obtained raspberry powder with no moisture for 142
thermal analysis. For high moisture raspberry powders, thermograms provide melting 143
endotherms along with glass transition temperatures. The area of the melting endotherm 144
peaks provides the enthalpy of melting (∆Hm) determined by drawing a linear base line to 145
the endotherm. The intersection point of the baseline with the left side of the endotherm 146
was taken as the end point of freezing (Tm’) of the raspberries. High moisture raspberry 147
powders (0.3–0.8 kg H2O/kg raspberry) were subjected to annealing at a temperature 148
(Tm’-1) for 30 min during a DSC scan. Initially annealing was performed on raspberries 149
with moisture content of 0.4 kg H2O/kg raspberry at a temperature (Tm’-1) for 0, 30 and 150
60 min and an annealing time of 30 min was chosen for further analysis. After annealing, 151
freeze-dried raspberry powders were scanned from (Tm’-1) to -90oC at the rate of 152
5oC/min. From -90 oC to 70oC, raspberries were scanned at a rate of 5oC/min. A tangent 153
to the left side of the endotherm curve was drawn to identify the freezing point (TF) of 154
the high moisture raspberries (Rahman, 2004; Bai et al., 2001). 155
156
Water sorption and thermal transitions modeling 157
Several theoretical (BET, GAB model etc) and empirical equations (Oswin, 158
Henderson model etc.) are available for modelling of sorption isotherms data. In the 159
present study water adsorption data of freeze dried raspberry powder was modeled using 160
most commonly used Brunauer-Emmett-Teller (BET) and Guggenheim-Andersen-de 161

8
Boer (GAB) equations (Rahman, 1995). Both of these models have sound theoretical 162
background and their parameters provide physical meaning related to the sorption process 163
compared to the empirical models (Labuza and Altunakar, 2007). These two models are 164
based on the monolayer moisture concept and provide the value of the monolayer 165
moisture content of the material, considered the safe moisture for dried foods during 166
preservation, but most other models lack this parameter. The BET equation is: 167
])1(1)[1( ww
wbw aBa
aBMM
−+−= (1) 168
Where Mw is the water content (kg water/kg dry solids), Mb is the BET monolayer water 169
content (kg water/kg dry solids) and B is a constant related to the net heat of sorption. 170
The value of B is normally less than 2 for type III isotherms and varies between 2 and 50 171
for type II isotherm. The BET isotherm is applicable between water activities of 0.05 and 172
0.45, an adequate range for the calculation of parameters Mb and B (Rahman, 1995). The 173
GAB equation is: 174
)]1)(1[( www
wgw CKaKaKa
CKaMM
+−−= (2) 175
where Mg is the GAB monolayer water content (dry basis). C is a constant related to the 176
monolayer heat of sorption and the value of C varies from 1 to 20. K is a factor related to 177
the heat of sorption of the multilayer and the value of K varies from 0.7 to 1. BET and 178
GAB models are the most commonly used models to fit sorption data of food materials. 179
The GAB isotherm equation is an extension of the BET model taking into account the 180
modified properties of the sorbate in the multilayer region and the bulk liquid water 181
properties through the introduction of a third constant K. Estimation of three parameters 182
in GAB using water content and water activity variables leads to non-linear optimization. 183

9
The BET monolayer value is more acceptable than GAB monolayer value, although the 184
GAB model provides accurate prediction for water activities range less than 0.90 185
(Rahman, 1995). 186
The glass transition temperature of amorphous foods is influenced by water content. 187
The influence of water content on glass transition temperature is commonly modeled by 188
the Gordon and Taylor (1952) equation: 189
ws
gwwgssgm kXX
TkXTXT
+
+= (3) 190
where Tgm, Tgs and Tgw are the glass transition temperatures of the mixture, solids and 191
water, respectively; Xw and Xs are the mass fraction of water and total solids (wet basis), 192
and k the Gordon-Taylor parameter. From the thermodynamic standpoint the k parameter 193
is equivalent to the ratio of the change in specific heats of the components of the mixture 194
at their Tg. The model parameters (k and Tgs) of Equation (3) were estimated using non-195
linear regression analysis while considering Tgw = -135oC. 196
The Clausius-Clapeyron equation was used to model the freezing line of dried 197
raspberry powder with change in water content. The Clausius-Clapeyron equation is 198
expressed as (Rahman, 1995; Sablani et al., 2004): 199
+−
−−=
ss
s
w EXXX
11ln
λβδ (4) 200
In equation (4), δ is the freezing point depression (Tw - TF) relative to increasing total 201
solid contents, TF is the freezing point of the food material (°C), Tw is the freezing point 202
of water (°C), β is the molar freezing point constant of water (1860 kgK/kg mol), λw is 203
the molecular mass of water, Xs is the solids mass fraction and E is the molecular mass 204
ratio of water to solids (λw/λ s). 205

10
Use of Clausius-Clapeyron equation is limited to ideal and dilute solutions. The Chen 206
model is an extension of Clausius-Clapeyron equation by the introduction of a new 207
parameter B, which is the ratio of unfreezable water to the total solids content. The 208
equation (4) is expressed as (Chen, 1986): 209
+−−
−−−=
sss
ss
w EXBXXBXX
11ln
λβδ (5) 210
The parameters E and B were estimated using non-linear optimization analysis by 211
EXCEL© solver. In the present study, the Chen model was selected to fit the freezing 212
point data to the experimental data. 213
214
RESULTS AND DISCUSSION 215
Adsorption isotherm of freeze-dried raspberries 216
The water adsorption isotherm of freeze-dried raspberry powders at 23oC followed a 217
typical type II behavior as presented in Figure 1. The adsorption isotherm of freeze-dried 218
raspberry powders exhibits a sigmoid shape with three distinct regions aw = 0.0 to 0.25, 219
0.25 to 0.6 and 0.6 to 0.8 typical to type II isotherm. The sigmoid shape of sorption 220
isotherm is common for many food and biological materials (Rahman, 1995; Rahman and 221
Labuza, 1999). 222
The sorption isotherm data was modeled using BET and GAB models. The model 223
constants in BET model were Mb = 0.059 kg H2O/kg dry raspberry solids, B = 9.08 and 224
R2 = 0.968; whereas in GAB model the constants were Mg = 0.074 kg H2O/kg dry 225
raspberry solids, C = 5.53 and K = 0.904. The model constants in the BET and GAB are 226
temperature dependent (Rahman, 1995; Lim et al., 1995). However in the present study 227

11
water sorption experiments were performed at room temperature (~23oC). The C values 228
vary from 1 and 20 and the K values vary from 0.7 to 1 for many food materials 229
(Rahman, 1995). However in some instances the K values are reported greater than 1, 230
such as for freeze-dried raspberries (=1.02) (Khalloufi et al., 2000). K values > 1 are 231
mainly due to the nonlinear optimization procedure used to determine three parameters in 232
the GAB model using only water content and water activity as inputs. The GAB 233
monolayer moisture content value of the freeze-dried raspberry powders obtained in the 234
current study is smaller than the GAB monolayer moisture content reported by Khalloufi 235
et al. (2000) (Table 1). This difference might be due to the difference in cultivars of 236
raspberries and the chemical composition which may result in deviation in the values of 237
GAB constants. Khalloufi et al. (2000) used five equilibrium relative humidities to obtain 238
equilibrium moisture content, while eight different relative humidities were used in the 239
present study to estimate equilibrium moisture contents which may have caused some 240
difference in GAB constants. 241
242
Thermal transitions of freeze-dried raspberries containing unfreezable water 243
The thermograms of freeze-dried raspberry powders obtained in a single scan 244
corresponding to water activities in the range of 0.11 to 0.86 are presented in Figure 2. 245
This figure presents only portion of thermograms around the glass transition temperature 246
for raspberry powders of different water activities. Within water activities range of 0.11 247
to 0.86, thermograms exhibited only one transition and no formation of ice and no ice 248
melting endotherm. This nature of the thermograms was similar to thermograms in the 249
literature for selected fruits (Khalloufi et al., 2000; Roos, 1987; Telis and Sobral, 2001 250

12
and 2002; Sa and Sereno, 1994). The glass transition temperatures of foods depend 251
mainly on the quantity of water, constituents and molecular weight of solutes present in 252
the food. The glass transitions temperatures in foods are not sharp but occur over a range 253
of temperature (Rahman, 2006). The initial (Tgi), mid (Tgm), and end-points (Tge) of the 254
glass transitions were determined from thermograms (Table 2). The DSC scan rates 255
during experiment to influence glass transition temperatures. Higher scan rates introduce 256
thermal lag between heating element and the sample resulting in non uniform temperature 257
distribution in the sample (Tang et al., 1991). The glass transitions occurred at lower 258
temperature with decreasing rates of cooling (scan rates) (Figure 3). The scan rates of 259
5oC/min were considered as optimal rates of scanning since at lower scan rates change in 260
transition temperatures was minimal. In the literature, scan rates of 5oC/min are most 261
commonly used for thermal transition experiments to pinpoint glass transition 262
temperatures of foods (Rahman, 2004). The glass transition temperatures of freeze-dried 263
raspberry powders are influenced by water content. The Tgi decreased from 17.5oC to -264
65.5oC as water content of the freeze-dried raspberries increased from 0.034 to 0.242 kg 265
water/kg raspberry powder. The depression in glass transition temperatures with 266
increasing water content is due to the plasticization effect of water on the amorphous 267
constituents of the matrix. Fresh raspberries contain 84.5% water, 13.4% carbohydrate, 268
1.30% protein, 0.3 % fat and 0.5% ash (Khalloufi et al., 2000). Glucose and fructose are 269
the major sugars present in raspberries. The glass transition temperatures in raspberries 270
are related to the Tg of glucose and fructose. The glass transition temperatures and 271
thermograms of freeze-dried raspberries are similar to the glass transition temperatures 272

13
and thermograms of glucose and fructose (Ablett et al., 1993; Simperler et al., 2006; 273
Roos, 1993). 274
275
Thermal transitions of raspberries containing freezable water 276
For raspberries containing freezable water (0.30 to 0.70 kg water/kg raspberry), glass 277
transition temperatures were less noticeable before ice melting. The raspberry powders 278
were first scanned without annealing to identify the end point of freezing or start of 279
melting of ice crystals Tm’. The freeze-dried raspberry powders were rescanned with 280
annealing for 0 to 60 min at Tm’-1. The optimal annealing conditions are obtained when 281
the raspberry powder is held for a considerable period of time, allowing the formation of 282
maximum amount of ice and leading to a maximally freeze-concentrated solid matrix. 283
However, for raspberry powders with large water content (aw>0.90) a shorter period of 284
annealing is sufficient for maximal ice formation due to the large amount of freezable 285
water (Sa and Sereno, 1994; Bai et al., 2001). The effect of annealing time was analyzed 286
for raspberries containing freezable water (0.4 kg water/kg raspberry) (Table 3). As 287
expected, glass transition temperature decreased and clear discontinuities in thermograms 288
were observed as annealing time increased from 0 to 60 min. The decrease in glass 289
transition temperatures is related to molecular relaxation occurring inside the materials 290
analyzed during annealing (Rahman, 2004). An annealing time of 30 min was taken as 291
optimal for further analysis. 292
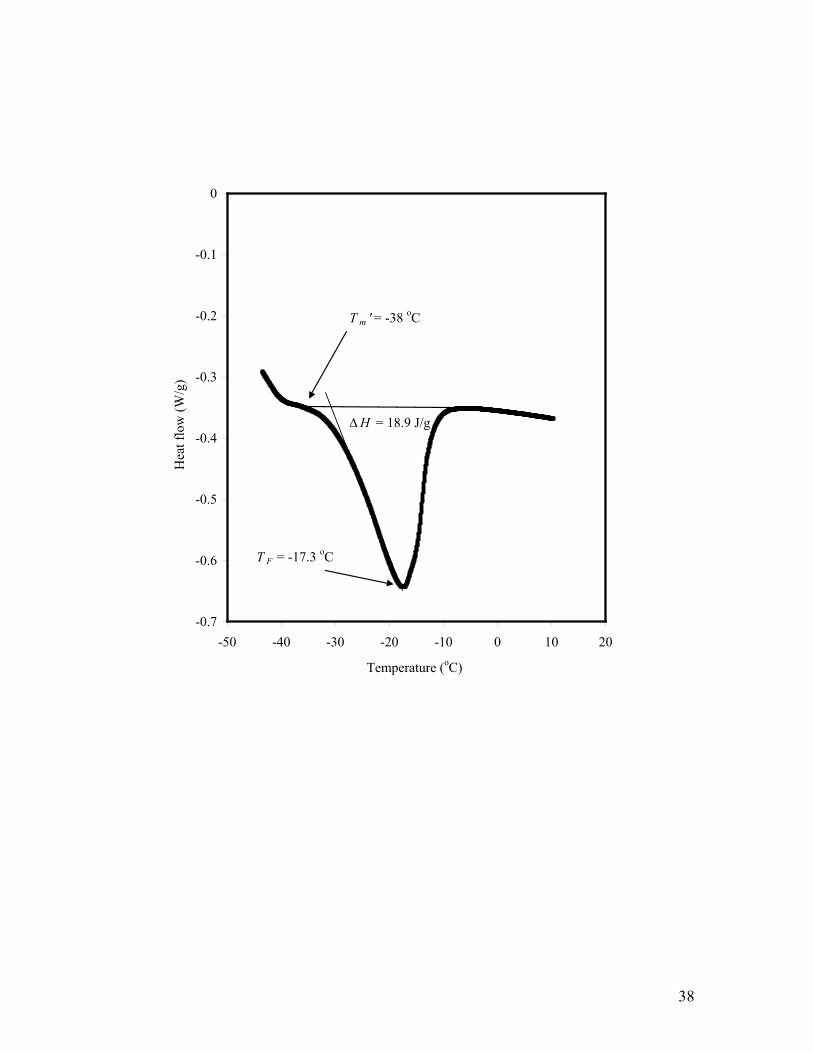
The initial freezing points (TF), end point of freezing (Tm’), and enthalpy of ice 293
melting (ΔHm) of freeze-dried raspberries were determined from thermograms obtained 294
for high water content raspberries (Figure 4). The TF decreased from -2.45 to -17.4oC as 295

14
total solids content (Xs) increased from 0.3 to 0.7 kg solids/kg raspberry (Table 4). The 296
magnitude of freezing point temperature depression due to increasing total solids depends 297
on the molecular weight of the solids. The area of the melting peak provided enthalpy of 298
ice melting in the raspberries, which decreased as solids content increased from 0.3 to 0.7 299
kg solid/kg sample. The enthalpy of ice melting was plotted against water content to 300
determine the quantity of unfreezable water. A linear relationship was obtained between 301
enthalpy and water content data for freeze-dried raspberries. The amount of unfrozen 302
water was 0.16 kg water/kg raspberry by extending the line to ∆Hm equal to zero (Figure 303
5). The quantity of unfreezable water observed for grapes, strawberries, garlic, date flesh, 304
and pineapple were 0.197, 0.184, 0.20, 0.32, and 0.30 kg water/kg sample respectively 305
(Sa and Sereno., 1994; Rahman et al., 2005; Rahman., 2004; Telis and Sobral., 2001). 306
Bound water is the water with great affinity attached to solute molecules in foods. Bound 307
water may be unavailable for chemical reactions and may not be freezable at low 308
temperatures. While all unfreezable water may not be bound to the solute molecules 309
(Franks, 1986). Bound water may be considered as a fraction of unfreezable water. The 310
amount of bound and unfreezable water depends on the molecular weight of solutes 311
present in foods. 312
Similar to equilibrium freezing point, the Tm' is also influenced by the molecular 313
weight of total solids present in foods. However the determination of Tm' becomes 314
complex and in some cases varies with total solids content, which may be a result of the 315
kinetics of the system (Rahman et al., 2005). The Tm' decreased with increasing solids 316
content; however, at solids content greater than 40% the change in value of Tm' is small 317
(Sopade et al., 2002; Rahman, 2004; Rahman et al., 2005). The Tm' of raspberry was -318

15
38.0°C at a total solids content between 0.50 and 0.70 kg solids/kg raspberry. The Tm' of 319
raspberry is in the range of sugars i.e. Tm’ of glucose and fructose (Tm' = -30oC to -48oC) 320
(Roos, 1992). 321
322
State diagram 323
The stability and shelf-life of low moisture and frozen foods can be evaluated using 324
state diagrams (Roos and Karel, 1991; Rahman, 2006). The state diagram defines the 325
parameters of physical state as well as state transitions of biomaterials. Experimentally 326
determined glass transition temperatures, equilibrium freezing points and the conditions 327
of maximal-freeze-concentration were used to construct the state diagram of raspberries 328
(Figure 6). The freezing curve AM (equilibrium freezing point versus solids content) was 329
modeled using Chen’s equation (5). The parameters in the Chen equation E and B were 330
estimated using nonlinear optimization technique as 0.064 and 0.141, respectively. The E 331
values reported for apples, dates and garlic are 0.238, 0.129 and 0.080 respectively (Bai 332
et al., 2001; Rahman 2004; Rahman et al., 2005). The B value is the unfrozen water per 333
unit dry solids (kg water/kg dry solids) and a B value of 0.141 (dry basis) corresponds to 334
unfreezable water of 0.124 kg water/kg raspberry (wet basis). The value of unfreezable 335
water from Chen model is comparable to the unfreezable water from enthalpy data. The 336
value of Xs’ (total solids content corresponding to Tm’) was determined by extending the 337
freezing curve to -38oC (point M) and corresponding total solids was estimated by trial 338
and error using equation (5). The values of Xs’ and unfreezable water content 339
corresponding to Tm’ were 0.78 kg solids/kg raspberry and 0.22 kg H2O/kg raspberry, 340
respectively. 341

16
Water acts as a plasticizer in a multicomponent system containing solutes. The effect 342
of water concentration on glass transition is predicted by the Gordon-Taylor equation 343
(Gordon and Taylor, 1952) based on ideal volume mixing. The glass line (DE) is depicted 344
by fitting the Gordon-Taylor (GT) equation with the experimental Tgi versus solids 345
content. The GT constants Tgs and k were determined as 42.6oC and 4.73, respectively by 346
a non-linear optimization technique. The GT constants obtained for freeze-dried 347
raspberries were in the range reported for other berries and the prominent sugars (glucose 348
and fructose) present in raspberries (Table 1). The experimental values of Tgi, Tgm and 349
Tge obtained for anhydrous raspberry powder were 37.3, 40.2 and 42.0oC, respectively. 350
The experimental Tgi value of 37.3oC of dry raspberry powder was lower than the value 351
of 42.6oC predicted by the GT equation. To identify the glass transition temperature 352
corresponding to the maximally freeze concentrated raspberry solution (Tg’), the freezing 353
curve AM was extended to the glass line and designated the intersection point G by 354
retaining the equivalent curvature described by Chen model (Kasapis et al., 2000; 355
Rahman et al., 2005). The Tg’ was estimated as -47oC and Xs’’ was 0.82 kg solids/kg 356
raspberry. Food constituents are in mechanical solid state at the condition of the 357
maximum-freeze-concentration state (Lim & Reid, 1991; Slade & Levine, 1995). The 358
rates of diffusion controlled reactions in frozen foods may decrease considerably at 359
temperatures less than Tg’. At temperatures greater than Tg’, the unfrozen matrix 360
becomes less viscous, promoting increased rates of diffusion (Slade & Levine, 1995). 361
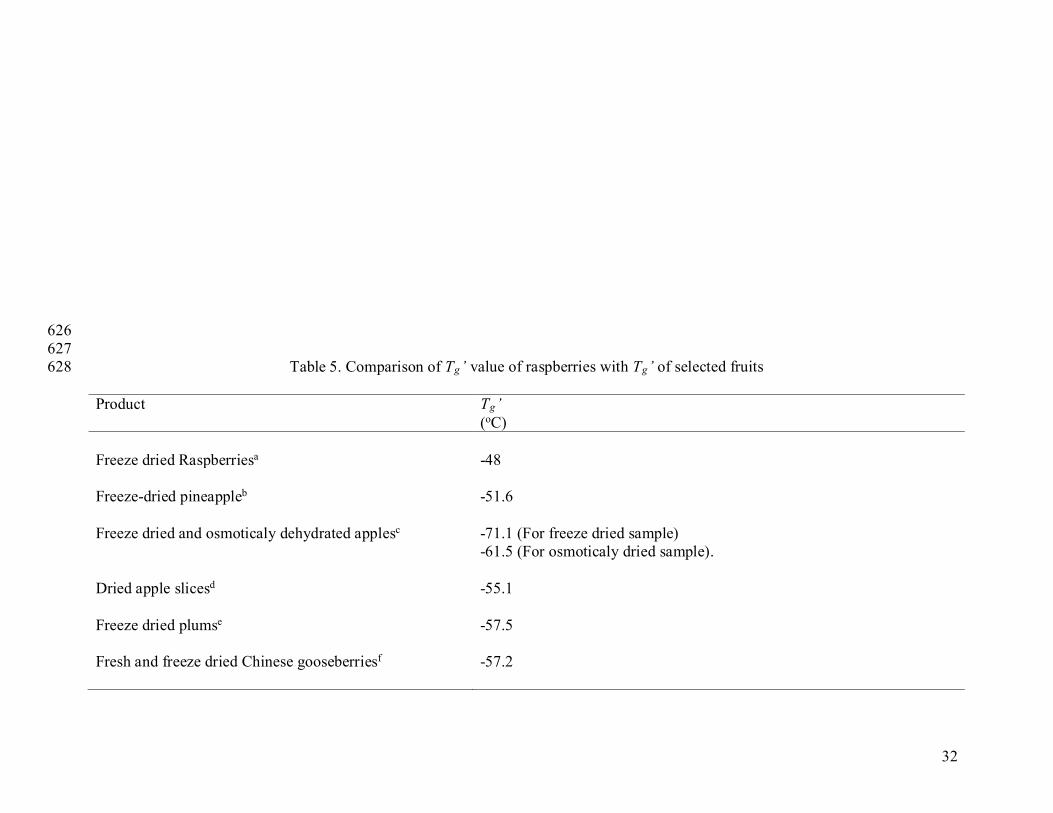
The Tg’ of raspberries is similar to the Tg’ of other fruits (Table 5). The solids in 362
raspberries consist primarily of fructose and glucose and exhibit low Tg’. Ablett et al. 363
(1993) examined the glass transition temperature occurring in fructose solutions and 364

17
estimated Tg’ as -48oC. Van den Dries et al. (2000) also studied the relationship between 365
transition in molecular mobility and collapse phenomena in glucose-water systems and 366
reported the Tg’ of glucose as -53oC. 367
368
Evaluating water activity and glass transition concepts for stability 369
The concept of water activity is an important tool in predicting microbial growth, 370
enzymatic, non-enzymatic activities, and other deteriorative reactions in foods (Rahman 371
and Labuza, 1999). In recent years, the glass transition concept was evaluated to explain 372
selected reaction kinetics in food materials during production and storage (Rahman, 373
2006). According to the water activity concept, foods are most stable at their monolayer 374
moisture content (Rockland and Nishi, 1980). The glass transition concept suggests that 375
formulations are stable at or below the corresponding glass transition temperature. Water 376
activity relates to the equilibrium condition that establishes a thermodynamic limit to a 377
mechanism, whereas glass formation is a kinetic equilibrium process at temperature 378
below Tg. Scientists related the water activity and glass transition concepts to establish 379
unified stability criteria for foods (Roos, 1993, Bell and Hageman, 1994; Schaller-380
Povolny et al., 2000; Sablani et al., 2004; 2007b, 2007c). The glass transition 381
temperatures and the water adsorption isotherm were combined to evaluate conditions of 382
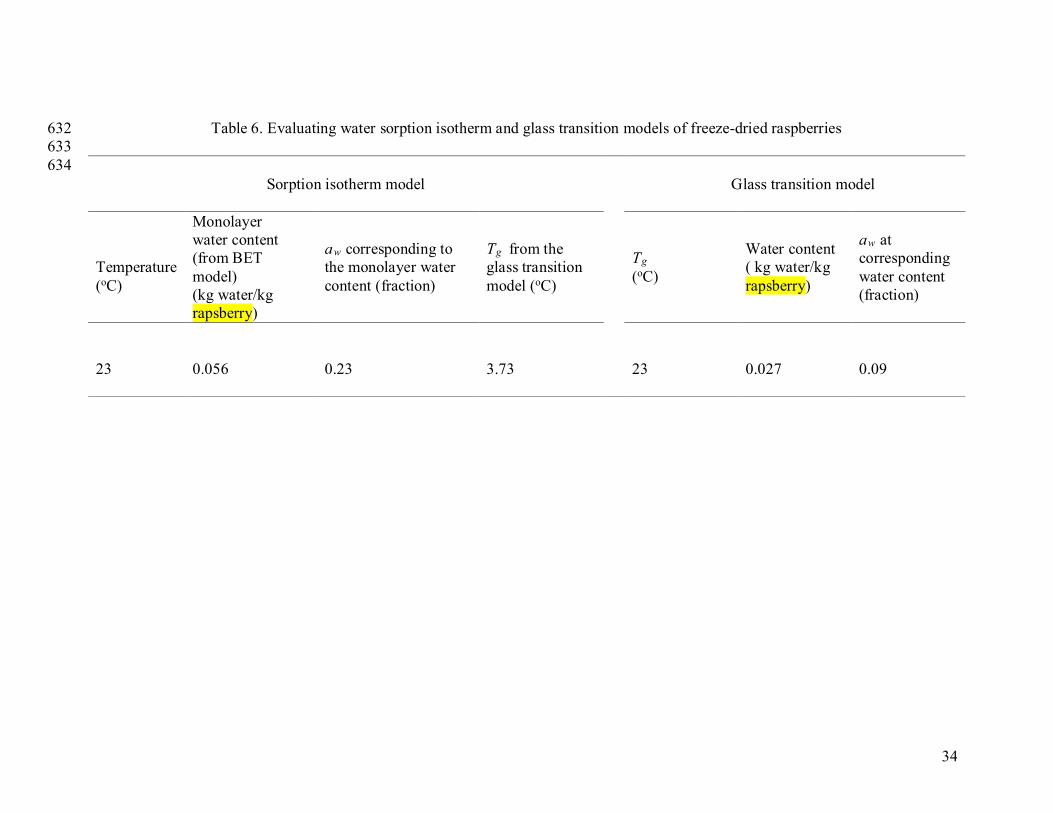
storage stability of freeze-dried raspberries (Figure 7 and Table 6). Based on the sorption 383
isotherms, the predictions of the glass transition model underestimate the stable 384
temperature range. For instance, the sorption isotherm at 23°C predicts that freeze-dried 385
raspberries are stable at a BET monolayer water content of 0.056 kg H2O/kg raspberry or 386
0.944 kg solids/kg raspberry (Point B in Figure 7). However, at an equivalent solids 387

18
concentration, the Tg value from the glass line was 3.73oC (point C in Figure 7). 388
Interpretation of the glass transition and water activity data in Table 6 concludes 389
raspberries of 0.973 kg solids/kg raspberry are stable at 23oC or below. Sorption 390
isotherms predicts a water activity of 0.09 at 23oC which, according to this criterion, is 391
lower than monolayer water activity (<0.23) for stable condition of a freeze-dried 392
raspberries. Similar observations were reported by Roos (1993) and Sablani et al., 393
(2007b). The glass transition concept often underestimates the stability temperature for 394
dried fruits containing large concentration of sugars and it overestimates stability 395
temperatures for high molecular weight materials (Sablani et al., 2007b). Detailed studies 396
on physicochemical changes such as anthocyanins, total phenolics concentrations, and 397
antioxidant activities in frozen and dried raspberries stored at a range of water 398
contents/activities may unveil the suitability of water activity or glass transition 399
temperature concepts to predict stability and this research is progressing. 400
401
Frozen storage is a common long term storage method adopted for many fresh fruits 402
and vegetables containing freezable water. Storage stability of frozen and dried 403
raspberries may be analyzed by using state diagram, Tg’ and Tm’ estimated as -47 and -404
38oC, respectively. The deterioration kinetics of anthocyanins, polyphenolics, vitamins, 405
and other bioactive compounds in raspberries during long term frozen storage can be 406
obtained by storing them at selected temperatures close to their Tg’ and Tm’. Fresh 407
raspberries stored below Tg’ (< -47oC) may be suitable for long term storage due to 408
minimal chemical and biochemical changes. 409

19
Stability of anthocyanin, phenolics and antioxidants in dried raspberries can be 410
determined below, around and above its glass transition temperatures to predict its shelf 411
life. The degradation kinetics of bioactive compounds in raspberries can be related to 412
their corresponding water activities and glass transition temperatures. A relationship 413
between the glass transition temperature and chemical degradation reactions occurring in 414
dried raspberry powder during storage can be established, and may be important in the 415
selection of the suitable storage conditions of dried raspberries. 416
417
CONCLUSIONS 418
The state diagram of raspberries was developed by determining glass line, freezing 419
curve and the conditions of maximally-freeze-concentration. The initial glass transition 420
temperatures of freeze-dried raspberries decreased linearly from 17.5oC to -65.5oC as the 421
total solids content decreased from 0.966 to 0.758 kg dry solids/kg sample. The initial 422
freezing point of freeze-dried raspberries decreased from -2.45oC to -17.4oC as total 423
solids content increased from 0.30 to 0.70 kg dry solids/kg sample. The magnitude of 424
freezing point temperature depression due to increasing total solids was largely due to the 425
presence of glucose and fructose. The state diagram provides an estimate of the 426
characteristics glass transition Tg’ and corresponding total solids content Xs” of -47oC 427
and 0.82 kg solids/kg raspberry, respectively. The quantity of unfreezable water obtained 428
from enthalpy of ice melting and state diagram was comparable. The water adsorption 429
isotherm of freeze-dried raspberries was also constructed. The water sorption data 430
provided the monolayer moisture content values of 0.059 and 0.074 kg H2O/kg dry 431
raspberry solids in the BET and GAB models, respectively. The state diagram and water 432

20
adsorption data may be used to predict the stability of anthocyanins, phenolics 433
concentrations and antioxidant activities in low moisture (i.e. dried or with unfreezable 434
water) and high moisture (i.e. containing freezable water) raspberries. 435
436 Acknowledgements 437
This activity was funded, in part, with an Emerging Research Issues Internal 438
Competitive Grant from the Washington State University, College of Agricultural, 439
Human, and Natural Resource Sciences and Agricultural Research Center. 440
REFERENCES 441
442
Ablett, S., Izzard, M. J., Lillford, P. J., Arvannitoyannis, I., and Blanshard, J. M. V. 443
(1993). Calorimetric study of the glass transition occurring in fructose solutions. 444
Carbohydrate Research, 242, 13–22. 445
Bai, Y., Rahman, M. S., and Perera, C. O., Smith, B., and Melton, L. D. (2001). State 446
diagram of apple slices: glass transition and freezing curves. Food Research 447
International, 34, 89–95. 448
Bell, L. N. and Hageman, M. J. (1994). Differentiating between the effects of water 449
activity and glass transition dependent mobility on a solid state reaction: 450
aspartame degradation. Journal of Agricultural and Food Chemistry 42, 2398-451
2401 452
Champion, D., Le Meste, M., and Simatos, D. (2000). Towards an improved 453
understanding of glass transition and relaxations in foods: molecular mobility in 454
the glass transition range. Trends in Food Science & Technology, 11, 41–55. 455

21
Chen, C. S. (1986). Effective molecular weight of aqueous solutions and liquid foods 456
calculated from the freezing point depression. Journal of Food Science, 51, 1537–53. 457
Franks, F. (1986). Metastable water at subzero temperatures. Journal of Microscopy, 458
141(3), 243-249. 459
Goff, H. D., and Sahagian, M. E. (1996). Glass transitions in aqueous carbohydrate 460
solutions and their relevance to frozen food stability. Thermochimica Acta, 461
280/281, 449–464. 462
Gordon M., and Taylor J. S. (1952). Ideal copolymers and the second order transitions of 463
synthetic rubbers. I. Non-crystalline copolymers. Journal of Applied Chemistry, 2, 464
493–500. 465
Greenspan, L. (1977). Humidity fixed points of binary saturated aqueous solutions. 466
Journal of Research and National Bureau of Standards [A]: Physics and Chemistry, 467
81A (1), 89–96. 468
Janna, O. A., Khairul, A. K., and Maziah, M. (2007). Anthocyanin stability studies in 469
Tibouchina semidecandra L. Food Chemistry, 101, 1640–1646. 470
Karel, M., Anglea, S., Buera, P., Karmas, R., Levi, G., and Roos, Y. H. (1994). Stability 471
related transitions in amorphous foods. Thermochimica Acta, 246, 249–269. 472
Kasapis, S., Sablani, S. S., Rahman, M. S., Al-Marhubi I. M. and Al-Amri, I. S. (2007). 473
Porosity and the effect of structural changes on the network glass transition 474
temperature. Journal of Agricultural and Food Chemistry, 55, 2459–2466. 475
Kasapis, S., Rahman, M.S., Guizani, N., and Al-Aamri, M. (2000). State diagrams of 476
temperature vs. date solids obtained from the mature fruit. Journal of Agricultural 477
and Food Chemistry, 48, 3779–3784. 478

22
Kerr, W. L., Lim, M. H., Reid, D. S., and Chen, H. (1993). Chemical reaction kinetics in 479
relation to glass transition temperatures in frozen food polymer solutions. Journal 480
of the Science of Food and Agriculture, 61, 51–56. 481
Khalloufi, S., El-Maslouhi, Y., and Ratti, C. (2000). Mathematical model for prediction 482
of glass transition temperature of fruit powders. Journal of Food Science, 65(5), 483
842–848. 484
Khalloufi, S., and Ratti, C. (2003). Quality deterioration of freeze-dried foods as 485
explained by their glass transition temperature and internal structure. Journal of 486
Food Science, 68(3), 892–903. 487
Labuza, T. P., and Altunakar, B. (2007). Water activity prediction and moisture sorption 488
isotherms. In G. V. Barbosa-Cànovas, A. Fontana, S. Schmidt, T. Labuza (Eds.), 489
Water activity in Foods: Fundamentals and Applications (pp 109–154). Blackwell 490
Publishing Ltd. 491
Lim, L. T., Tang, J. M., and He, J. S. (1995). Moisture sorption characteristics of freeze 492
dried blueberries. Journal of Food Science, 60, 810–814 493
Lim, M. H., and Reid, D.S. (1991). Studies of reaction kinetics in relation to the Tg’ of 494
polymers in frozen model systems. In H. Levine, L. Slade (Eds.), Water 495
Relationship in Foods (pp. 103–122). Plenum Press, New York. 496
Rahman M. S. (1995). Food properties handbook. Boca Raton, CRC Press FL. 497
Rahman, M. S. (2006). State diagram of foods: Its potential use in food processing and 498
product stability. Trends in Food Science and Technology, 17, 129–141. 499
Rahman, M. S. (2004). State diagram of date flesh using differential scanning calorimetry 500
(DSC). International Journal of Food Properties, 7(3), 407–428. 501

23
Rahman, M. S., Sablani, S. S., Al-Habsi, N., Al-Maskri, S., and Al-Belushi, R. (2005). 502
State diagram of freeze-dried garlic powder by differential scanning calorimetry 503
and cooling curve methods. Journal of Food Science, 70(2), 135–141. 504
Rahman, M. S., and Labuza, T. P. (1999). Water activity and food preservation. In M. S. 505
Rahman (Ed.), Handbook of Food Preservation (pp. 339–382), Marcel Dekker, 506
New York. 507
Rockland, L. B., and Nishi, S. K. (1980). Influence of water activity on food product 508
quality and stability. Food Technology, 34, 42–51. 509
Roos, Y. H. (1997). Frozen state transitions in relation to freeze drying. Journal of 510
Thermal Analysis, 48, 535–544 511
Roos, Y. H. (1992). Phase transitions and transformations in food systems. In R. 512
Heldman, D. B. Lund (Eds.), Handbook of Food Engineering (pp. 287–353), 513
Mercel Dekker Inc, New York. 514
Roos, Y. H., and Karel, M. (1991). Applying state diagrams to food processing and 515
development, Food Technology, 45(12), 66–71 and107. 516
Roos, Y. H. (1993). Water activity and physical state effects on amorphous food stability. 517
Journal of Food Processing and Preservation, 16, 433–447. 518
Roos, Y. H. (1987). Effect of moisture on the thermal behavior of strawberries studied 519
using differential scanning calorimetry. Journal of Food Science, 52(1), 146–149. 520
Sa, M. M., Figueirdo, A. M., and Sereno A. M. (1999). Glass transitions and state 521
diagrams for fresh and processed apple. Thermochimica Acta, 329, 31–38. 522
Sa, M. M., and Sereno, A. M. (1994). Glass transitions and state diagrams for typical 523
natural fruits and vegetables. Thermochimica Acta, 246, 285–297. 524

24
Sablani, S. S., Rahman, M.S., Al-Busaidi, S., Guizani, N., Al-Habsi, N., Al-Belushi, R., 525
and Soussi, B. (2007a). Thermal transitions of king fish whole muscle, fat and 526
fat-free muscle by differential scanning calorimetry. Thermochimica Acta, 462, 527
56–63. 528
Sablani, S. S., Kasapis, S., and Rahman, M. S. (2007b). Evaluating water activity and 529
glass transition concepts for food stability. Journal of Food Engineering, 78(1), 530
266–271. 531
Sablani, S. S., Al-Belushi, K., Al-Marhubi, I. and Al-Belushi, R. 2007c. Evaluating 532
stability of vitamin C in fortified formula powder using water activity and glass 533
transition International Journal of Food Properties, 10: 61-71 534
Sablani, S. S., Kasapis, S., Rahman, M. S., Al-Jabri, A., and Al-Habsi, N. (2004). 535
Sorption isotherms and state diagram for evaluating stability criteria of abalone. 536
Food Research International, 37, 915–924. 537
Sadilova, E., Stintzing, F.C., and Carle, R. (2006). Thermal degradation of acylated and 538
nonacylated anthocyanins. Journal of Food Science, 71(8), 504–512. 539
Schaller-Povolny, L. A., Smith, D. E., and Labuza, T. P. (2000). Effect of water content 540
and molecular weight on the moisture isotherms and glass transition properties of 541
inulin. International Journal of Food Properties, 3(2), 173–192. 542
Silva, M. A., Sobral, P. J. A., and Kieckbusch, T. G. (2006). State diagrams of freeze-543
dried camu-camu (Myrciaria dubia (HBK) Mc Vaugh) pulp with and without 544
maltodextrin addition. Journal of Food Engineering, 77, 426–432. 545
Simperler, A., Kornherr, A., Chopra, R., Bonnet, P.A., Williams, J., Motherwell, W. D. 546
S., and Zifferer, G. (2006). Glass transition temperature of glucose, sucrose and 547

25
trehalose: an experimental and in silico study. Journal of Physical Chemistry, 548
110, 19678–19684. 549
Slade, L., and Levine, H. (1991). Beyond water activity - Recent advances based on an 550
alternative approach to the assessment of food quality and safety. Critical Reviews 551
in Food Science and Nutrition, 30 (2–3), 115–360 552
Sopade, P. A., Bhandari, B. R., D’Arcy, B., Halley, P., and Caffin, N. (2002). A study of 553
vitrification of Australian honeys at different moisture contents. In H. Levine (Ed.), 554
Amorphous Food and Pharmaceutical Systems (pp. 169–183), The Royal Society of 555
Chemistry, Cambridge. 556
Tang, J., Sokhansanj, S., Yannacopoulos, S., and Kasap, S. O. (1991). Specific heat 557
capacity of lentil seeds by differential scanning calorimetry. Transaction of the 558
American Society of Agricultural Engineering, 34, 517–522 559
Telis, V. R. N., and Sobral, P. J. A. (2001). Glass transitions and state diagram for freeze 560
dried pineapple. Lebensmittel-Wissenschaft und-Technologie-Food Science and 561
Technology, 34, 199–205. 562
Telis, V. R. N., and Sobral, P. J. A. (2002). Glass transitions for freeze dried and air 563
dried tomato. Food Research International, 35, 435–443. 564
Telis, V. R. N., Sobral, P. J. D., and Telis-Romero, J. (2006). Sorption isotherm, glass 565
transitions and state diagram for freeze-dried plum skin and pulp. Food Science 566
and Technology International, 12(3), 181–187. 567
Van den Dries, I. J., Besseling, N. A. M., Dusschoten, D. V., Hemminga, M. A., and 568
Linden, E. V. D. (2000). Relation between a transition in molecular mobility and 569

26
collapse phenomena in glucose-water systems. Journal of Physical Chemistry, 570
104, 9260-9266 571
Wang, S. Y., and Lin, H. S. (2000). Antioxidant activity in fruits and leaves of 572
blackberry, raspberry, and strawberry varies with cultivar and developmental 573
stage. Journal of Agricultural and Food Chemistry, 48, 140–146. 574
Wang, H., Zhang, S., and Cuen, G. (2008). Glass transition and state diagram for fresh 575
and freeze-dried Chinese gooseberry. Journal of Food Engineering, 84, 307–312. 576
Zhang, Y., Vareed, S. K., and Nair, M. G. (2005). Human tumor cell growth inhibition by 577
nontoxic anthocyanidins, the pigments in fruits and vegetables. Life Sciences, 76, 578
1465–1472. 579
580 581
582
583
584
585
586
587

27
LEGENDS TO FIGURES 588
589
Figure 1 Water adsorption isotherm of freeze dried raspberry powders at 23oC. 590
591
Figure 2 Glass transition temperatures of freeze-dried raspberry powders 592
equilibrated over selected water activities (scan rate 5oC/min) 593
Figure 3 Effect of DSC scanning rate on glass transition temperatures (water 594
content of rapsberry = 0.034 kg water/kg raspberry). 595
Figure 4 Typical thermogram of raspberry powder containing freezable water (0.30 596
kg water/kg raspberry) (scan rate 5oC/min) 597
Figure 5 Change in enthalpy of ice melting as a function of water content in 598
raspberries 599
Figure 6 State diagram of raspberries (AM: freezing point curve modeled using 600
Chen equation; DE glass line modeled using Gordon-Taylor equation; M’: 601
end point of freezing; G: glass transition of maximal-freeze-602
concentration). 603
Figure 7 Variation of glass transition temperature, water activity with water content 604
of freeze-dried raspberries. 605

28
Table 1. Model parameters of water adsorption isotherms of freeze-dried raspberries, strawberries, blueberries, glucose and fructose 606 607
Models Constants
Raspberrya
(23oC)
Raspberryb
(25oC)
Strawberryb
(30oC)
Blueberryb (25oC)
Blueberryc (4 to 45oC)
Glucosed
Fructosed
GAB Mg C K R2
0.074 5.53 0.904 0.996
0.109 7.57 1.02 NA
0.107 1.95 0.98 0.858
0.113 1.76 0.96 NA
0.174 0.005 1.12 NA
NA NA NA NA
NA NA NA NA
GT k Tgs
R2
4.73 42.62 0.930
2.85 47.8 NA
4.29 34.2 NA
4.02 22 NA
NA NA NA
4.52 36 NA
3.76 10 NA
aCurrent Study; bKhalloufi et.al (2000); cLim et al. (1995); dRoos (1993); NA = Not available 608
609 610 611 612 613 614 615 616 617 618

29
Table 2. Glass transition temperatures (initial, Tgi, mid, Tgm and end-points, Tge) of raspberries 619 influenced by water content (above unfrozen water content i.e. no ice formation, scan rate 620 5oC/min). 621
aStandard deviation of 3 replicates.
Xs
( kg solids/kg raspberry)
Xw
( kg water/kg raspberry)
Tgi
(oC)
Tgm (oC)
Tge (oC)
0.966 0.954 0.931 0.914 0.887 0.866 0.825 0.758
0.034 0.046 0.069 0.086 0.112 0.134 0.175 0.242
17.5 (0.9)a
7.31 (0.8) -5.03 (1.8) -12.0 (4.6) -19.4 (6.3) -29.7 (6.4) -57.0 (0.5) -65.5 (4.5)
19.2 (1.0) 9.54 (0.7) -4.2 (2.2) -11.2 (5.5) -16.3 (6.1) -28.7 (6.4) -53.9 (1.6) -62.1 (4.4)
22.4 (0.5) 12.7 (0.1) 1.12 (4.8) -4.23 (6.0) -9.85 (5.8) -24.4 (10.0) -51.8 (1.6) -59.4 (4.3)

30
Table 3. Influence of annealing time on the glass transition temperature 622 (Raspberries with water content of 0.4 kg H2O/kg raspberry). 623
Annealing time (oC/min)
Tgi
(oC)
Tgm (oC)
Tge (oC)
0
-61.2
-56.0
-55.4
30 -62.3 -59.4 -55.9 60 -62.8 -58.2 -55.6

31
Table 4. Solid contents (Xs), initial freezing point (TF) and enthalpy (ΔHm) 624
of ice melting determined with DSC 625
aStandard deviation of 3 replicates, n.d. = not detectable
Xs ( kg solids/kg
raspberry)
TF (oC)
Tg’ (oC)
Tm’ (oC)
ΔHm (kJ/kg)
0.3 0.4 0.5 0.6 0.7
-2.45 (0.2)a -7.62 (1.6) -8.02 (0.9) -12.5 (1.9) -17.4 (4.9)
-57.4 (2.6) -55.8 (1.0)
n.d. n.d. n.d.
-19.4 (1.0) -25.2 (3.7) -36.5 (5.6) -40.7 (5.2) -36.5 (3.1)
94.1 (7.7) 79.7 (21.5) 70.8 (6.1) 32.4 (19.5) 19.6 (5.3)
32
626 627
Table 5. Comparison of Tg’ value of raspberries with Tg’ of selected fruits 628 Product
Tg’ (oC)
Freeze dried Raspberriesa
-48
Freeze-dried pineappleb
-51.6
Freeze dried and osmoticaly dehydrated applesc -71.1 (For freeze dried sample) -61.5 (For osmoticaly dried sample).
Dried apple slicesd -55.1 Freeze dried plumse
-57.5
Fresh and freeze dried Chinese gooseberriesf
-57.2

33
Date fleshg -46.4 Freeze dried Camu Camuh
-58.8 for natural pulp and -40.1 for camu camu with 30% maltodextrin DE 20 addition.
Onions, Grapes and Strawberriesi
For Onion, -58.3 For grape, -50.3 For strawberry, -50.1
aCurrent study; bTelis and Sobral, (2001); c Sa et.al, (1999); dBai et.al, (2001); eTelis et.al, (2006); fWang et.al, (2008); gRahman, 629 (2004); hSilva et.al, (2006); iSa and Sereno, (1994). 630
631
34
Table 6. Evaluating water sorption isotherm and glass transition models of freeze-dried raspberries 632 633
634 Sorption isotherm model
Glass transition model
Temperature (oC)
Monolayer water content (from BET model) (kg water/kg rapsberry)
aw corresponding to the monolayer water content (fraction)
Tg from the glass transition model (oC)
Tg (oC)
Water content ( kg water/kg rapsberry)
aw at corresponding water content (fraction)
23
0.056
0.23
3.73
23
0.027
0.09


36
-0.6
-0.5
-0.4
-0.3
-0.2
-0.1
0
-100 -50 0 50 100
Temperature (oC)
Hea
t flo
w (W
/g) a w = 0.113
a w = 0.225
a w = 0.328a w = 0.750
a w = 0.860
a w = 0.529
a w = 0.658 a w = 0.432

38
-0.7
-0.6
-0.5
-0.4
-0.3
-0.2
-0.1
0
-50 -40 -30 -20 -10 0 10 20
Temperature (oC)
Hea
t flo
w (W
/g)
T F = -17.3 oC
T m ' = -38 oC
∆H = 18.9 J/g


41
-140
-120
-100
-80
-60
-40
-20
0
20
40
60
0 0.05 0.1 0.15 0.2 0.25 0.3
Water content, X w (kg H2O/kg raspberry)
Gla
ss tr
ansi
tion
tem
pera
ture
, Tgi
( o C
)
0
0.1
0.2
0.3
0.4
0.5
0.6
0.7
0.8
0.9
1
Wat
er a
ctiv
ity, a
w (F
ract
ion)
Glass transition Temperature Vs Water contentG-T modelWater activity Vs Water contentGAB ModelBET equation
a w = 0.09
T gi = 3.73 oC
X w = 0.056
a w = 0.23
B
C
D